Embed Size (px)
Citation preview
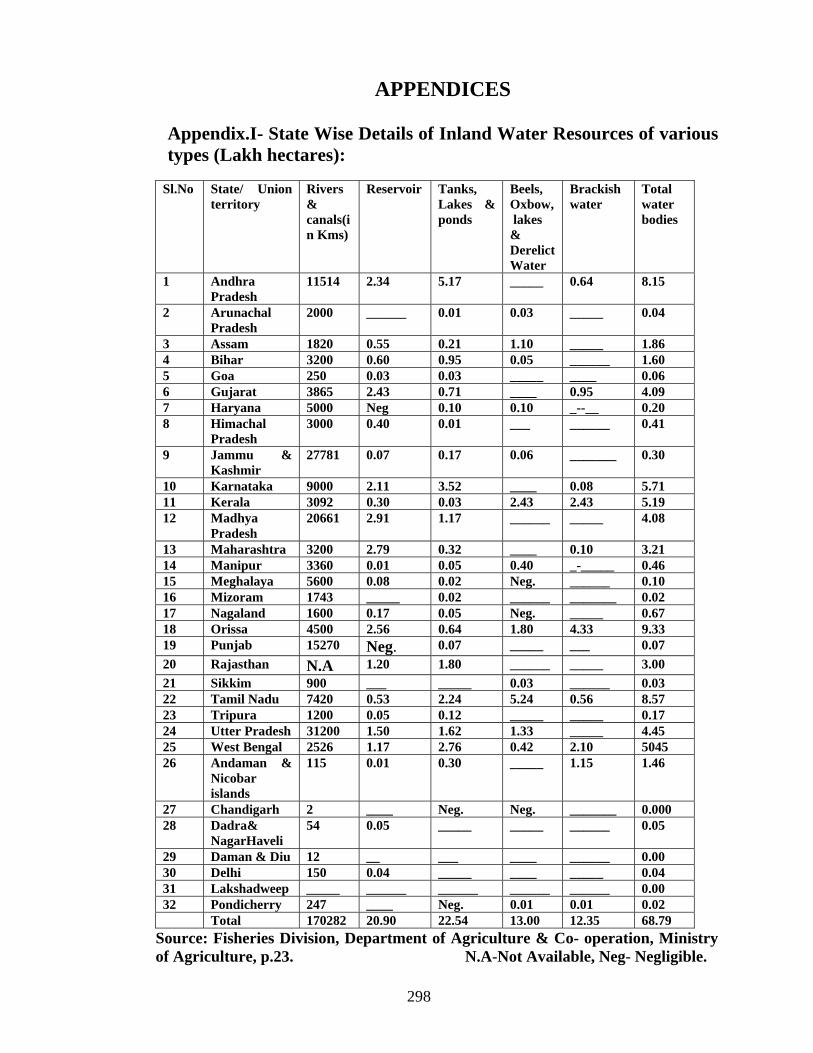
APPENDICES
Appendix.I- State Wise Details of Inland Water Resources of various types (Lakh hectares):
Sl.No State/ Union
territory Rivers & canals(in Kms)
Reservoir Tanks, Lakes & ponds
Beels, Oxbow, lakes & Derelict Water
Brackish water
Total water bodies
1 Andhra Pradesh
11514 2.34 5.17 _____ 0.64 8.15
2 Arunachal Pradesh
2000 ______ 0.01 0.03 _____ 0.04
3 Assam 1820 0.55 0.21 1.10 _____ 1.86 4 Bihar 3200 0.60 0.95 0.05 ______ 1.60 5 Goa 250 0.03 0.03 _____ ____ 0.06 6 Gujarat 3865 2.43 0.71 ____ 0.95 4.09 7 Haryana 5000 Neg 0.10 0.10 _--__ 0.20 8 Himachal
Pradesh 3000 0.40 0.01 ___ ______ 0.41
9 Jammu & Kashmir
27781 0.07 0.17 0.06 _______ 0.30
10 Karnataka 9000 2.11 3.52 ____ 0.08 5.71 11 Kerala 3092 0.30 0.03 2.43 2.43 5.19 12 Madhya
Pradesh 20661 2.91 1.17 ______ _____ 4.08
13 Maharashtra 3200 2.79 0.32 ____ 0.10 3.21 14 Manipur 3360 0.01 0.05 0.40 _-_____ 0.46 15 Meghalaya 5600 0.08 0.02 Neg. ______ 0.10 16 Mizoram 1743 _____ 0.02 ______ _______ 0.02 17 Nagaland 1600 0.17 0.05 Neg. _____ 0.67 18 Orissa 4500 2.56 0.64 1.80 4.33 9.33 19 Punjab 15270 Neg. 0.07 _____ ___ 0.07 20 Rajasthan N.A 1.20 1.80 ______ _____ 3.00 21 Sikkim 900 ___ _____ 0.03 ______ 0.03 22 Tamil Nadu 7420 0.53 2.24 5.24 0.56 8.57 23 Tripura 1200 0.05 0.12 _____ _____ 0.17 24 Utter Pradesh 31200 1.50 1.62 1.33 _____ 4.45 25 West Bengal 2526 1.17 2.76 0.42 2.10 5045 26 Andaman &
Nicobar islands
115 0.01 0.30 _____ 1.15 1.46
27 Chandigarh 2 ____ Neg. Neg. _______ 0.000 28 Dadra&
NagarHaveli 54 0.05 _____ _____ ______ 0.05
29 Daman & Diu 12 __ ___ ____ ______ 0.00 30 Delhi 150 0.04 _____ ____ _____ 0.04 31 Lakshadweep _____ ______ ______ ______ ______ 0.00 32 Pondicherry 247 ____ Neg. 0.01 0.01 0.02 Total 170282 20.90 22.54 13.00 12.35 68.79
Source: Fisheries Division, Department of Agriculture & Co- operation, Ministry of Agriculture, p.23. N.A-Not Available, Neg- Negligible.
298
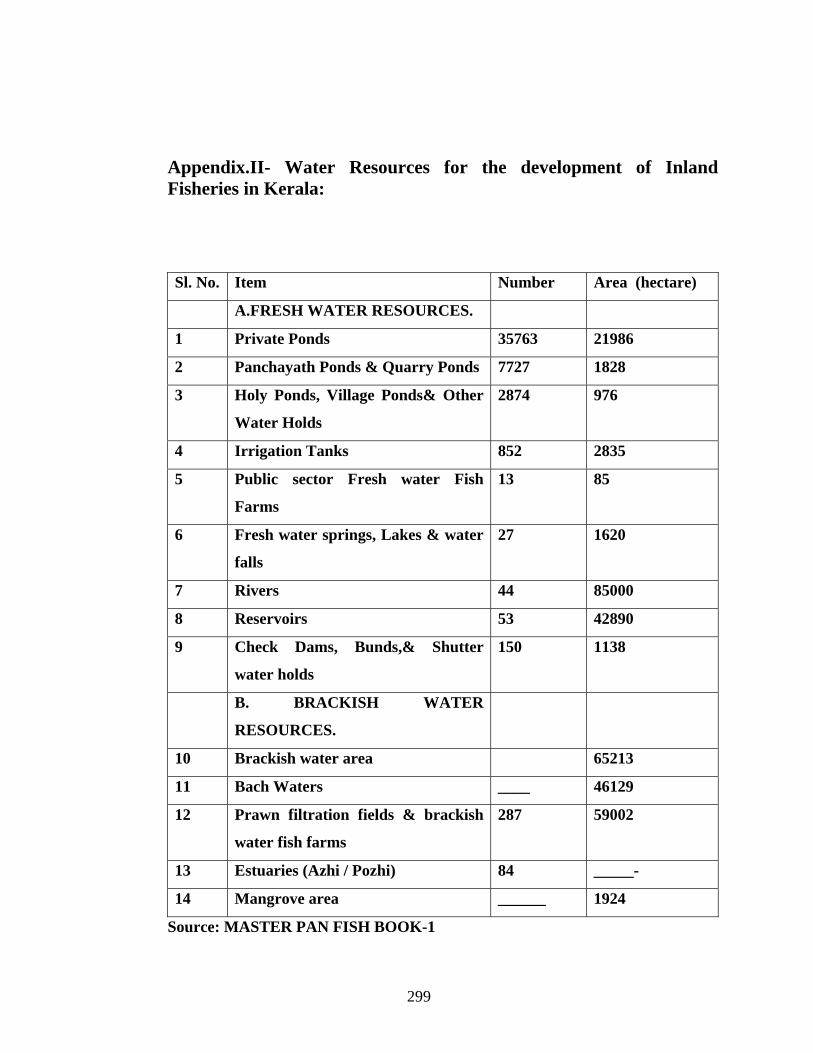
Appendix.II- Water Resources for the development of Inland Fisheries in Kerala:
Sl. No. Item Number Area (hectare)
A.FRESH WATER RESOURCES.
1 Private Ponds 35763 21986
2 Panchayath Ponds & Quarry Ponds 7727 1828
3 Holy Ponds, Village Ponds& Other
Water Holds
2874 976
4 Irrigation Tanks 852 2835
5 Public sector Fresh water Fish
Farms
13 85
6 Fresh water springs, Lakes & water
falls
27 1620
7 Rivers 44 85000
8 Reservoirs 53 42890
9 Check Dams, Bunds,& Shutter
water holds
150 1138
B. BRACKISH WATER
RESOURCES.
10 Brackish water area 65213
11 Bach Waters ____ 46129
12 Prawn filtration fields & brackish
water fish farms
287 59002
13 Estuaries (Azhi / Pozhi) 84 _____-
14 Mangrove area ______ 1924
Source: MASTER PAN FISH BOOK-1
299
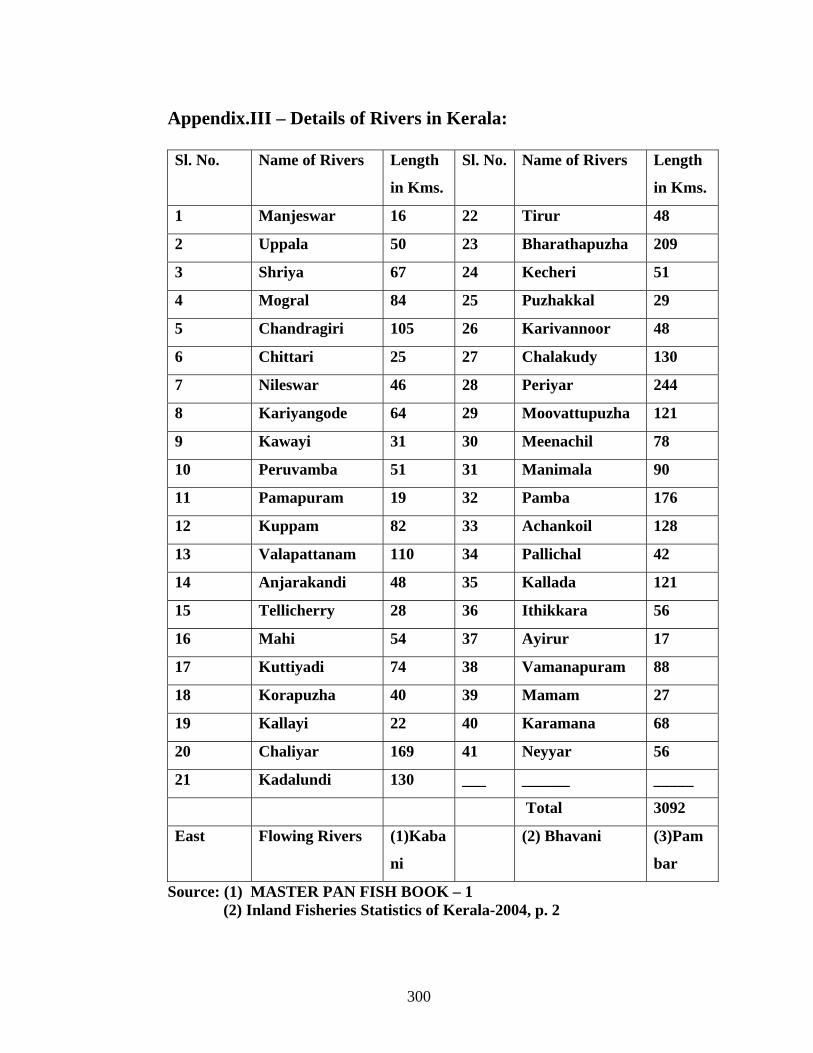
Appendix.III – Details of Rivers in Kerala:
Sl. No. Name of Rivers Length
in Kms.
Sl. No. Name of Rivers Length
in Kms.
1 Manjeswar 16 22 Tirur 48
2 Uppala 50 23 Bharathapuzha 209
3 Shriya 67 24 Kecheri 51
4 Mogral 84 25 Puzhakkal 29
5 Chandragiri 105 26 Karivannoor 48
6 Chittari 25 27 Chalakudy 130
7 Nileswar 46 28 Periyar 244
8 Kariyangode 64 29 Moovattupuzha 121
9 Kawayi 31 30 Meenachil 78
10 Peruvamba 51 31 Manimala 90
11 Pamapuram 19 32 Pamba 176
12 Kuppam 82 33 Achankoil 128
13 Valapattanam 110 34 Pallichal 42
14 Anjarakandi 48 35 Kallada 121
15 Tellicherry 28 36 Ithikkara 56
16 Mahi 54 37 Ayirur 17
17 Kuttiyadi 74 38 Vamanapuram 88
18 Korapuzha 40 39 Mamam 27
19 Kallayi 22 40 Karamana 68
20 Chaliyar 169 41 Neyyar 56
21 Kadalundi 130 ___ ______ _____
Total 3092
East Flowing Rivers (1)Kaba
ni
(2) Bhavani (3)Pam
bar
Source: (1) MASTER PAN FISH BOOK – 1 (2) Inland Fisheries Statistics of Kerala-2004, p. 2
300
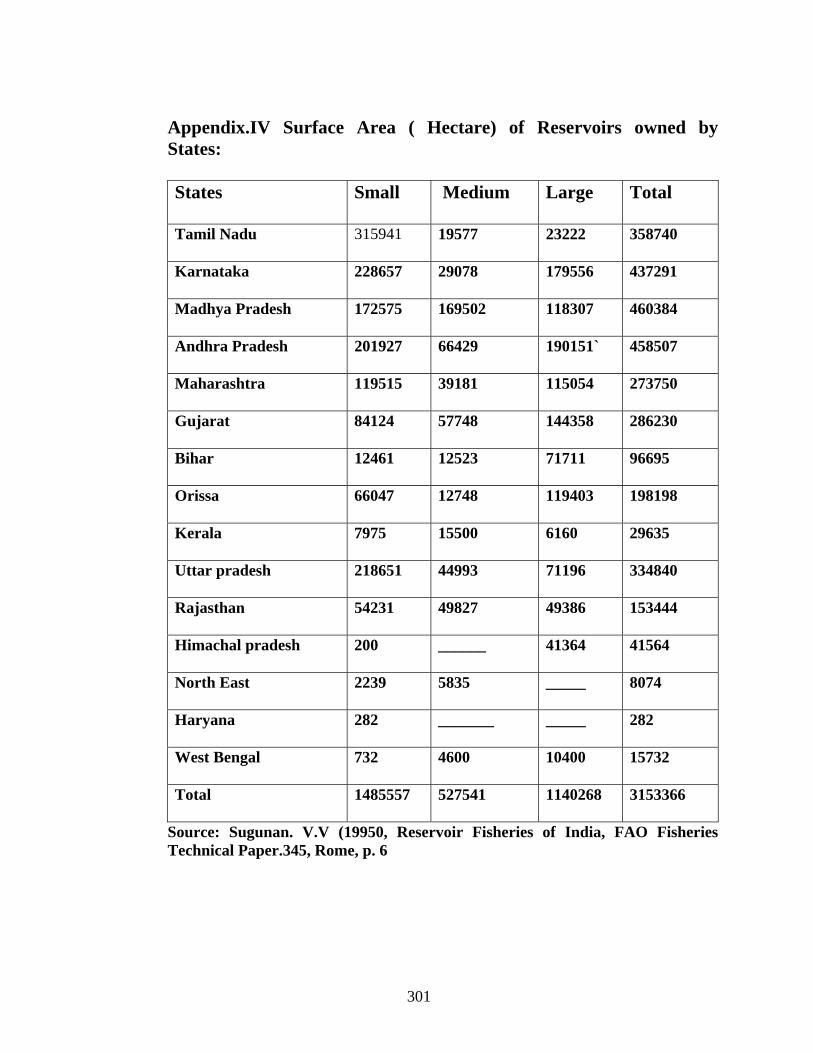
Appendix.IV Surface Area ( Hectare) of Reservoirs owned by States:
States Small Medium Large Total
Tamil Nadu 315941 19577 23222 358740
Karnataka 228657 29078 179556 437291
Madhya Pradesh 172575 169502 118307 460384
Andhra Pradesh 201927 66429 190151` 458507
Maharashtra 119515 39181 115054 273750
Gujarat 84124 57748 144358 286230
Bihar 12461 12523 71711 96695
Orissa 66047 12748 119403 198198
Kerala 7975 15500 6160 29635
Uttar pradesh 218651 44993 71196 334840
Rajasthan 54231 49827 49386 153444
Himachal pradesh 200 ______ 41364 41564
North East 2239 5835 _____ 8074
Haryana 282 _______ _____ 282
West Bengal 732 4600 10400 15732
Total 1485557 527541 1140268 3153366
Source: Sugunan. V.V (19950, Reservoir Fisheries of India, FAO Fisheries Technical Paper.345, Rome, p. 6
301
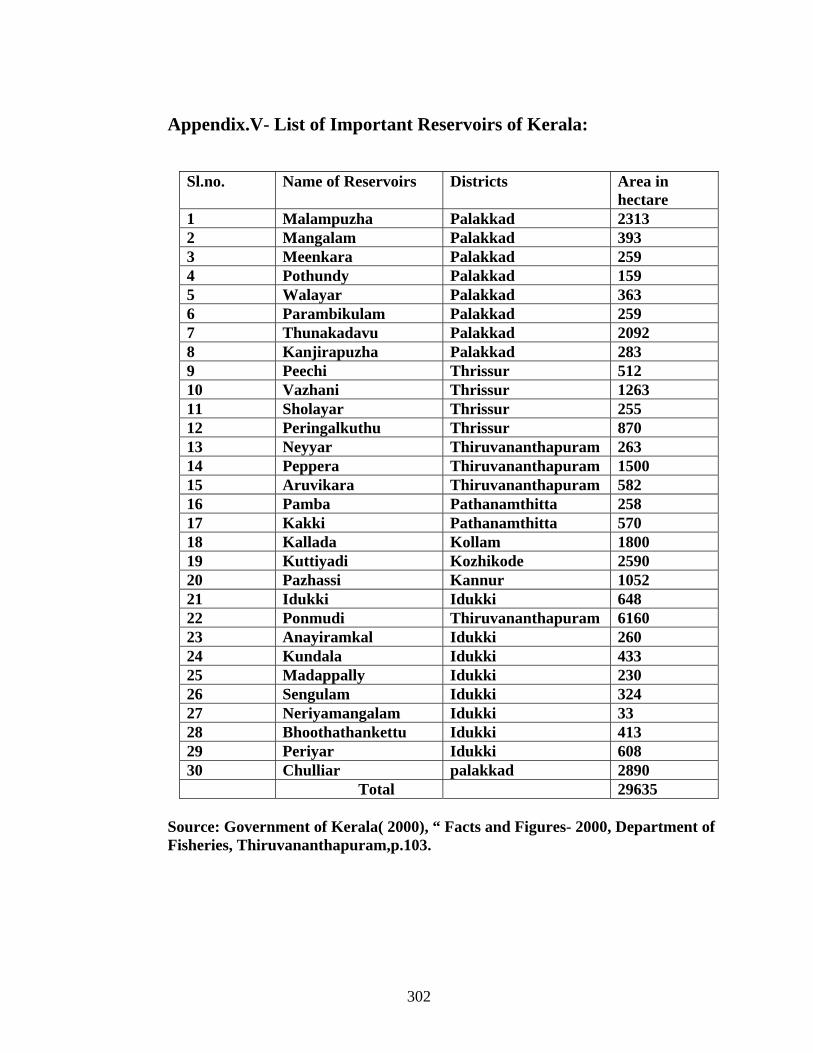
Appendix.V- List of Important Reservoirs of Kerala:
Sl.no. Name of Reservoirs Districts Area in hectare
1 Malampuzha Palakkad 2313 2 Mangalam Palakkad 393 3 Meenkara Palakkad 259 4 Pothundy Palakkad 159 5 Walayar Palakkad 363 6 Parambikulam Palakkad 259 7 Thunakadavu Palakkad 2092 8 Kanjirapuzha Palakkad 283 9 Peechi Thrissur 512 10 Vazhani Thrissur 1263 11 Sholayar Thrissur 255 12 Peringalkuthu Thrissur 870 13 Neyyar Thiruvananthapuram 263 14 Peppera Thiruvananthapuram 1500 15 Aruvikara Thiruvananthapuram 582 16 Pamba Pathanamthitta 258 17 Kakki Pathanamthitta 570 18 Kallada Kollam 1800 19 Kuttiyadi Kozhikode 2590 20 Pazhassi Kannur 1052 21 Idukki Idukki 648 22 Ponmudi Thiruvananthapuram 6160 23 Anayiramkal Idukki 260 24 Kundala Idukki 433 25 Madappally Idukki 230 26 Sengulam Idukki 324 27 Neriyamangalam Idukki 33 28 Bhoothathankettu Idukki 413 29 Periyar Idukki 608 30 Chulliar palakkad 2890 Total 29635
Source: Government of Kerala( 2000), “ Facts and Figures- 2000, Department of Fisheries, Thiruvananthapuram,p.103.
302
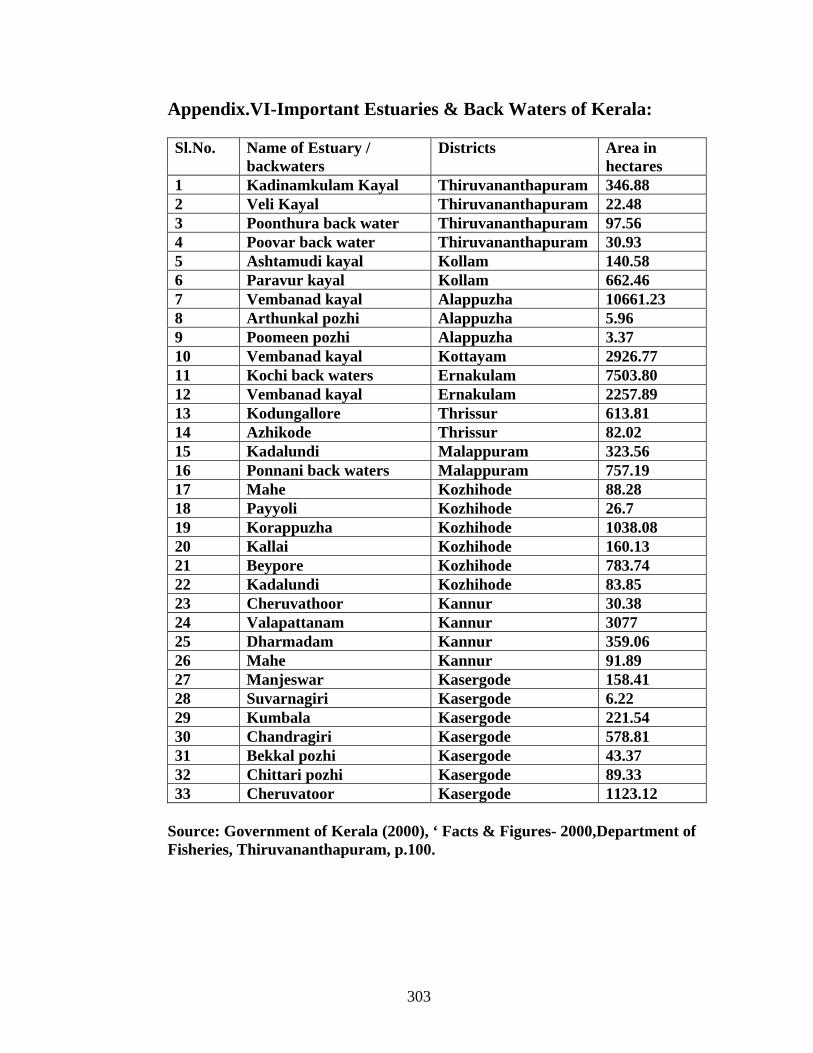
Appendix.VI-Important Estuaries & Back Waters of Kerala:
Sl.No. Name of Estuary /
backwaters Districts Area in
hectares 1 Kadinamkulam Kayal Thiruvananthapuram 346.88 2 Veli Kayal Thiruvananthapuram 22.48 3 Poonthura back water Thiruvananthapuram 97.56 4 Poovar back water Thiruvananthapuram 30.93 5 Ashtamudi kayal Kollam 140.58 6 Paravur kayal Kollam 662.46 7 Vembanad kayal Alappuzha 10661.23 8 Arthunkal pozhi Alappuzha 5.96 9 Poomeen pozhi Alappuzha 3.37 10 Vembanad kayal Kottayam 2926.77 11 Kochi back waters Ernakulam 7503.80 12 Vembanad kayal Ernakulam 2257.89 13 Kodungallore Thrissur 613.81 14 Azhikode Thrissur 82.02 15 Kadalundi Malappuram 323.56 16 Ponnani back waters Malappuram 757.19 17 Mahe Kozhihode 88.28 18 Payyoli Kozhihode 26.7 19 Korappuzha Kozhihode 1038.08 20 Kallai Kozhihode 160.13 21 Beypore Kozhihode 783.74 22 Kadalundi Kozhihode 83.85 23 Cheruvathoor Kannur 30.38 24 Valapattanam Kannur 3077 25 Dharmadam Kannur 359.06 26 Mahe Kannur 91.89 27 Manjeswar Kasergode 158.41 28 Suvarnagiri Kasergode 6.22 29 Kumbala Kasergode 221.54 30 Chandragiri Kasergode 578.81 31 Bekkal pozhi Kasergode 43.37 32 Chittari pozhi Kasergode 89.33 33 Cheruvatoor Kasergode 1123.12
Source: Government of Kerala (2000), ‘ Facts & Figures- 2000,Department of Fisheries, Thiruvananthapuram, p.100.
303
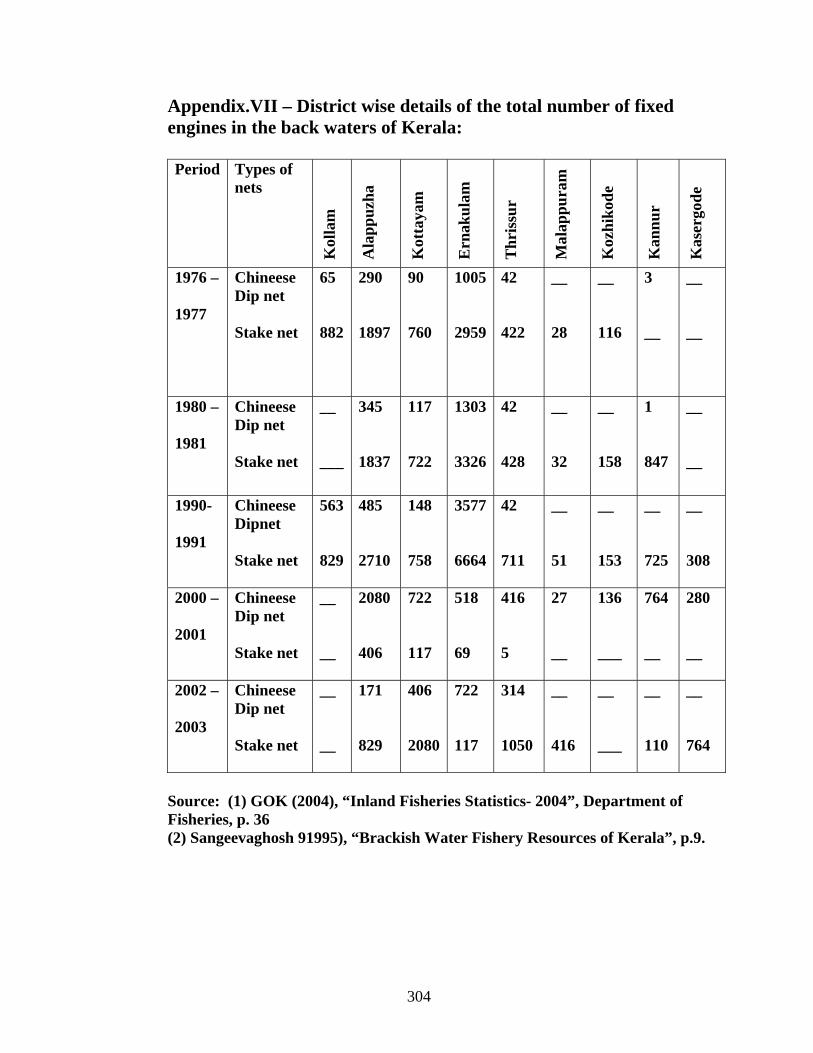
Appendix.VII – District wise details of the total number of fixed engines in the back waters of Kerala:
Period Types of
nets
Kol
lam
Ala
ppuz
ha
Kot
taya
m
Ern
akul
am
Thr
issu
r
Mal
appu
ram
Koz
hiko
de
Kan
nur
Kas
ergo
de
1976 – 1977
Chineese Dip net Stake net
65 882
290 1897
90 760
1005 2959
42 422
__ 28
__ 116
3 __
__ __
1980 – 1981
Chineese Dip net Stake net
__ ___
345 1837
117 722
1303 3326
42 428
__ 32
__ 158
1 847
__ __
1990- 1991
Chineese Dipnet Stake net
563 829
485 2710
148 758
3577 6664
42 711
__ 51
__ 153
__ 725
__ 308
2000 – 2001
Chineese Dip net Stake net
__ __
2080 406
722 117
518 69
416 5
27 __
136 ___
764 __
280 __
2002 – 2003
Chineese Dip net Stake net
__ __
171 829
406 2080
722 117
314 1050
__ 416
__ ___
__ 110
__ 764
Source: (1) GOK (2004), “Inland Fisheries Statistics- 2004”, Department of Fisheries, p. 36 (2) Sangeevaghosh 91995), “Brackish Water Fishery Resources of Kerala”, p.9.
304
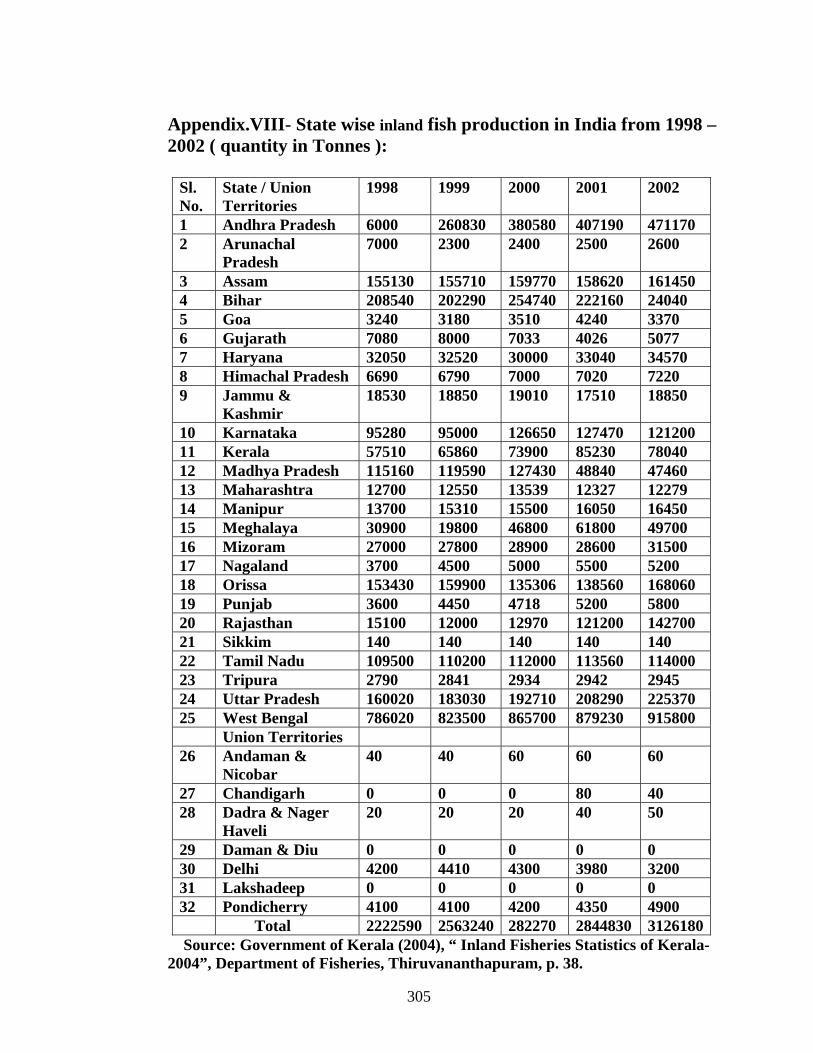
Appendix.VIII- State wise inland fish production in India from 1998 – 2002 ( quantity in Tonnes ):
Sl. No.
State / Union Territories
1998 1999 2000 2001 2002
1 Andhra Pradesh 6000 260830 380580 407190 471170 2 Arunachal
Pradesh 7000 2300 2400 2500 2600
3 Assam 155130 155710 159770 158620 161450 4 Bihar 208540 202290 254740 222160 24040 5 Goa 3240 3180 3510 4240 3370 6 Gujarath 7080 8000 7033 4026 5077 7 Haryana 32050 32520 30000 33040 34570 8 Himachal Pradesh 6690 6790 7000 7020 7220 9 Jammu &
Kashmir 18530 18850 19010 17510 18850
10 Karnataka 95280 95000 126650 127470 121200 11 Kerala 57510 65860 73900 85230 78040 12 Madhya Pradesh 115160 119590 127430 48840 47460 13 Maharashtra 12700 12550 13539 12327 12279 14 Manipur 13700 15310 15500 16050 16450 15 Meghalaya 30900 19800 46800 61800 49700 16 Mizoram 27000 27800 28900 28600 31500 17 Nagaland 3700 4500 5000 5500 5200 18 Orissa 153430 159900 135306 138560 168060 19 Punjab 3600 4450 4718 5200 5800 20 Rajasthan 15100 12000 12970 121200 142700 21 Sikkim 140 140 140 140 140 22 Tamil Nadu 109500 110200 112000 113560 114000 23 Tripura 2790 2841 2934 2942 2945 24 Uttar Pradesh 160020 183030 192710 208290 225370 25 West Bengal 786020 823500 865700 879230 915800 Union Territories 26 Andaman &
Nicobar 40 40 60 60 60
27 Chandigarh 0 0 0 80 40 28 Dadra & Nager
Haveli 20 20 20 40 50
29 Daman & Diu 0 0 0 0 0 30 Delhi 4200 4410 4300 3980 3200 31 Lakshadeep 0 0 0 0 0 32 Pondicherry 4100 4100 4200 4350 4900 Total 2222590 2563240 282270 2844830 3126180
Source: Government of Kerala (2004), “ Inland Fisheries Statistics of Kerala- 2004”, Department of Fisheries, Thiruvananthapuram, p. 38.
305
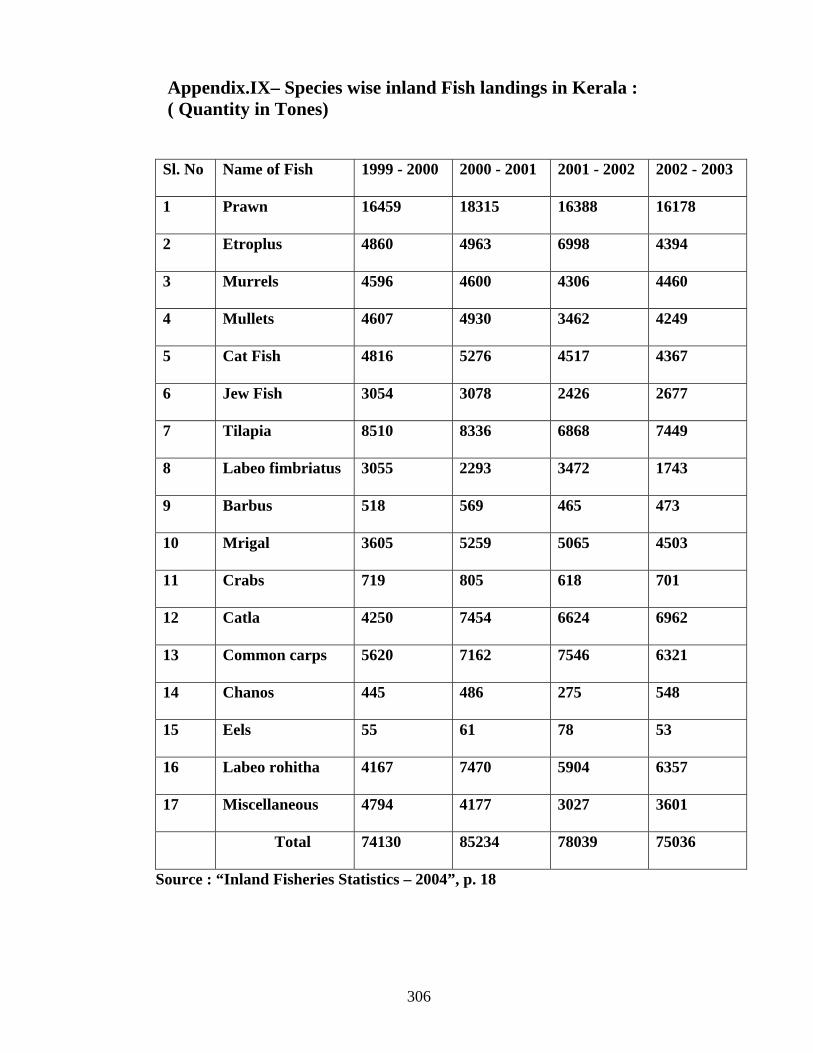
Appendix.IX– Species wise inland Fish landings in Kerala : ( Quantity in Tones)
Sl. No Name of Fish 1999 - 2000 2000 - 2001 2001 - 2002 2002 - 2003
1 Prawn 16459 18315 16388 16178
2 Etroplus 4860 4963 6998 4394
3 Murrels 4596 4600 4306 4460
4 Mullets 4607 4930 3462 4249
5 Cat Fish 4816 5276 4517 4367
6 Jew Fish 3054 3078 2426 2677
7 Tilapia 8510 8336 6868 7449
8 Labeo fimbriatus 3055 2293 3472 1743
9 Barbus 518 569 465 473
10 Mrigal 3605 5259 5065 4503
11 Crabs 719 805 618 701
12 Catla 4250 7454 6624 6962
13 Common carps 5620 7162 7546 6321
14 Chanos 445 486 275 548
15 Eels 55 61 78 53
16 Labeo rohitha 4167 7470 5904 6357
17 Miscellaneous 4794 4177 3027 3601
Total 74130 85234 78039 75036
Source : “Inland Fisheries Statistics – 2004”, p. 18
306
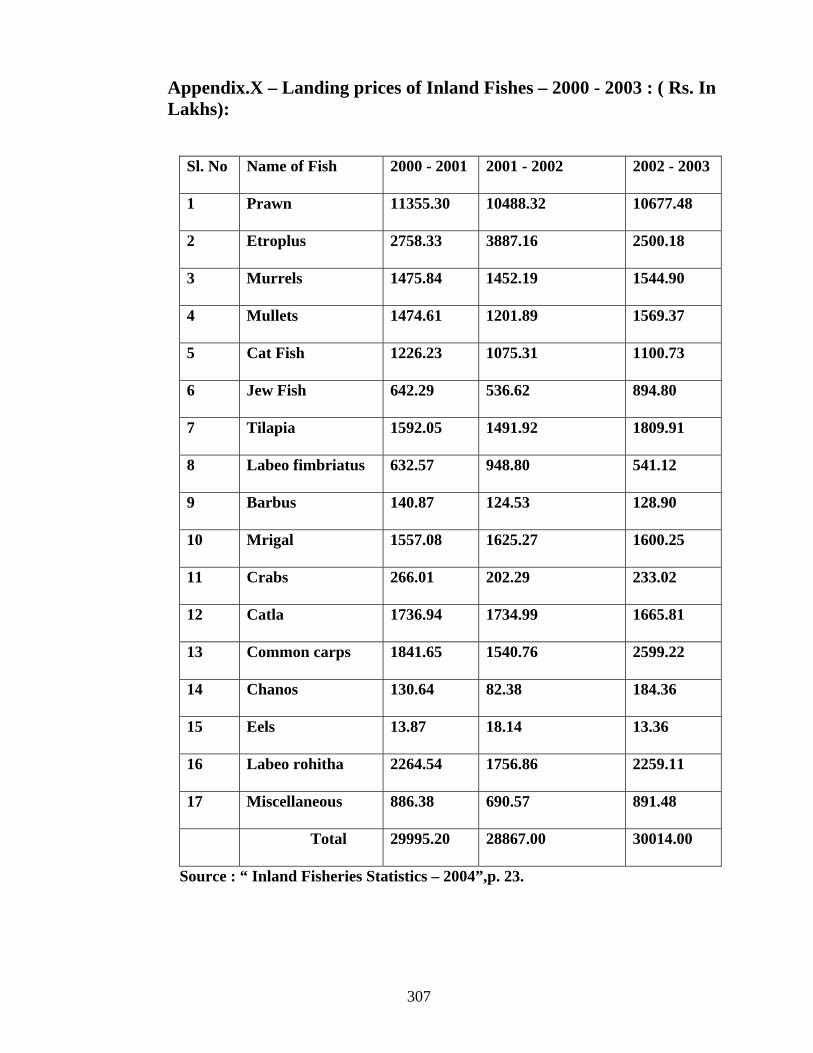
Appendix.X – Landing prices of Inland Fishes – 2000 - 2003 : ( Rs. In Lakhs):
Sl. No Name of Fish 2000 - 2001 2001 - 2002 2002 - 2003
1 Prawn 11355.30 10488.32 10677.48
2 Etroplus 2758.33 3887.16 2500.18
3 Murrels 1475.84 1452.19 1544.90
4 Mullets 1474.61 1201.89 1569.37
5 Cat Fish 1226.23 1075.31 1100.73
6 Jew Fish 642.29 536.62 894.80
7 Tilapia 1592.05 1491.92 1809.91
8 Labeo fimbriatus 632.57 948.80 541.12
9 Barbus 140.87 124.53 128.90
10 Mrigal 1557.08 1625.27 1600.25
11 Crabs 266.01 202.29 233.02
12 Catla 1736.94 1734.99 1665.81
13 Common carps 1841.65 1540.76 2599.22
14 Chanos 130.64 82.38 184.36
15 Eels 13.87 18.14 13.36
16 Labeo rohitha 2264.54 1756.86 2259.11
17 Miscellaneous 886.38 690.57 891.48
Total 29995.20 28867.00 30014.00
Source : “ Inland Fisheries Statistics – 2004”,p. 23.
307
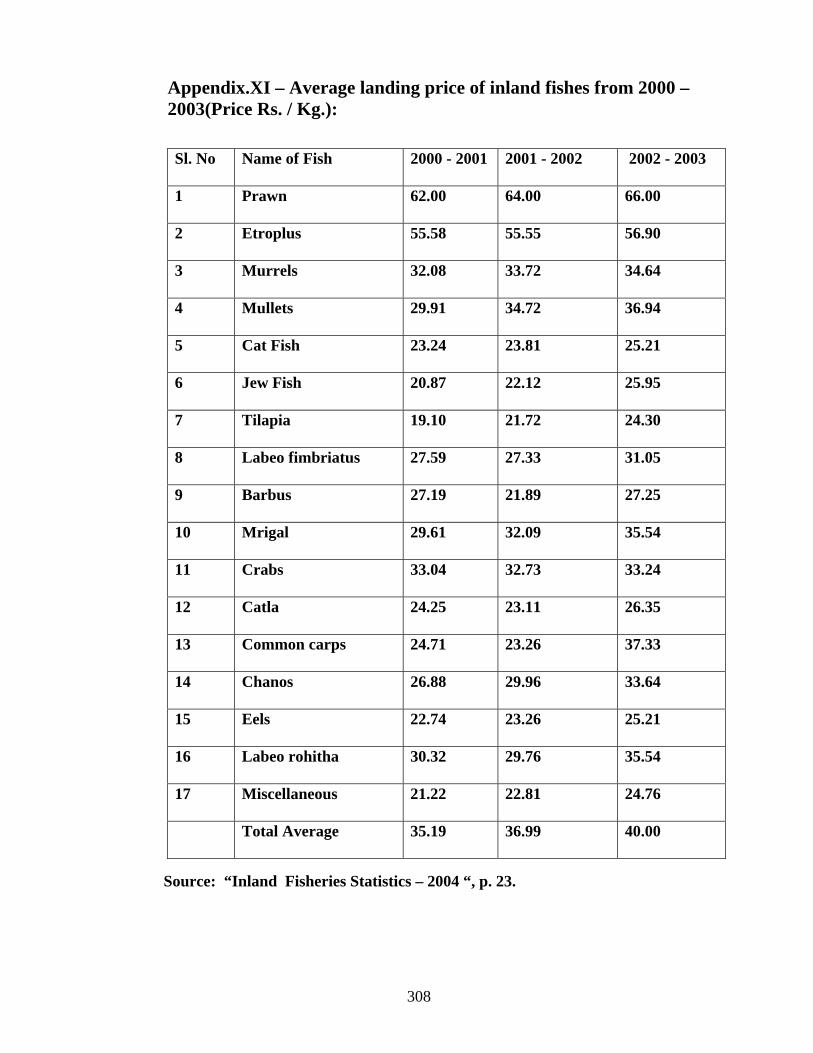
Appendix.XI – Average landing price of inland fishes from 2000 – 2003(Price Rs. / Kg.):
Sl. No Name of Fish 2000 - 2001 2001 - 2002 2002 - 2003
1 Prawn 62.00 64.00 66.00
2 Etroplus 55.58 55.55 56.90
3 Murrels 32.08 33.72 34.64
4 Mullets 29.91 34.72 36.94
5 Cat Fish 23.24 23.81 25.21
6 Jew Fish 20.87 22.12 25.95
7 Tilapia 19.10 21.72 24.30
8 Labeo fimbriatus 27.59 27.33 31.05
9 Barbus 27.19 21.89 27.25
10 Mrigal 29.61 32.09 35.54
11 Crabs 33.04 32.73 33.24
12 Catla 24.25 23.11 26.35
13 Common carps 24.71 23.26 37.33
14 Chanos 26.88 29.96 33.64
15 Eels 22.74 23.26 25.21
16 Labeo rohitha 30.32 29.76 35.54
17 Miscellaneous 21.22 22.81 24.76
Total Average 35.19 36.99 40.00
Source: “Inland Fisheries Statistics – 2004 “, p. 23.
308
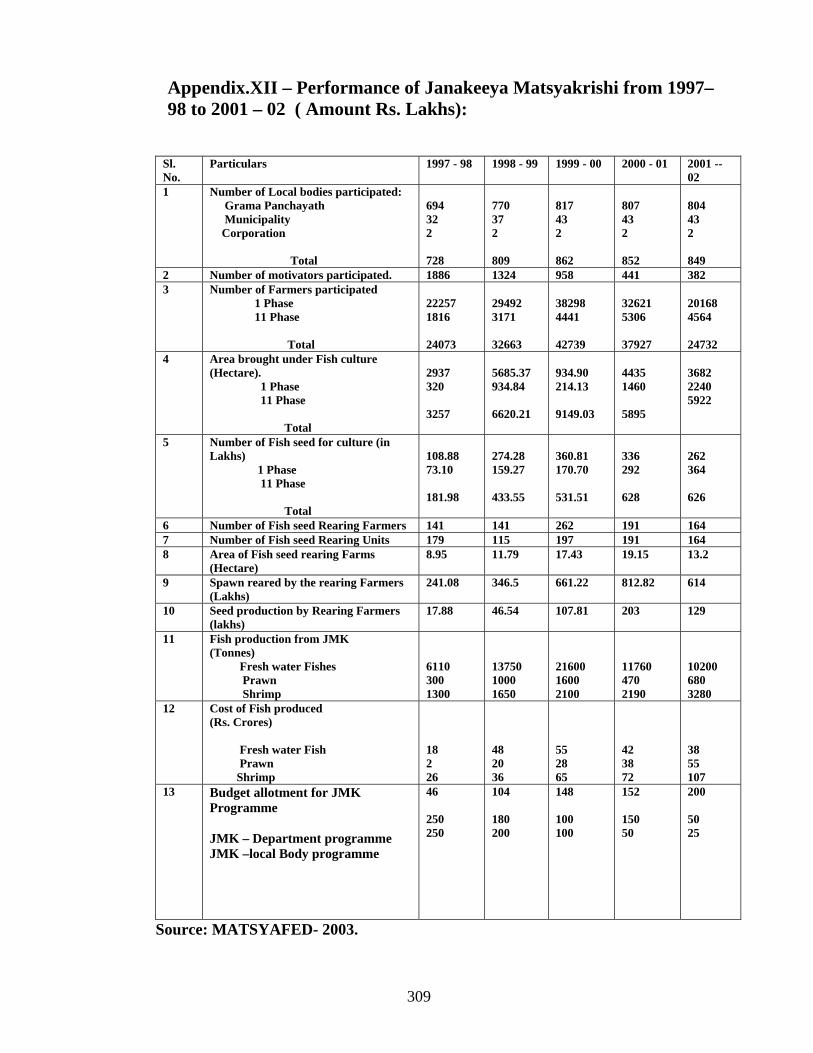
Appendix.XII – Performance of Janakeeya Matsyakrishi from 1997– 98 to 2001 – 02 ( Amount Rs. Lakhs):
Sl. No.
Particulars 1997 - 98 1998 - 99 1999 - 00 2000 - 01 2001 --02
1 Number of Local bodies participated: Grama Panchayath Municipality Corporation Total
694 32 2 728
770 37 2 809
817 43 2 862
807 43 2 852
804 43 2 849
2 Number of motivators participated. 1886 1324 958 441 382 3 Number of Farmers participated
1 Phase 11 Phase Total
22257 1816 24073
29492 3171 32663
38298 4441 42739
32621 5306 37927
20168 4564 24732
4 Area brought under Fish culture (Hectare). 1 Phase 11 Phase Total
2937 320 3257
5685.37 934.84 6620.21
934.90 214.13 9149.03
4435 1460 5895
3682 2240 5922
5 Number of Fish seed for culture (in Lakhs) 1 Phase 11 Phase Total
108.88 73.10 181.98
274.28 159.27 433.55
360.81 170.70 531.51
336 292 628
262 364 626
6 Number of Fish seed Rearing Farmers 141 141 262 191 164 7 Number of Fish seed Rearing Units 179 115 197 191 164 8 Area of Fish seed rearing Farms
(Hectare) 8.95 11.79 17.43 19.15 13.2
9 Spawn reared by the rearing Farmers (Lakhs)
241.08 346.5 661.22 812.82 614
10 Seed production by Rearing Farmers (lakhs)
17.88 46.54 107.81 203 129
11 Fish production from JMK (Tonnes) Fresh water Fishes Prawn Shrimp
6110 300 1300
13750 1000 1650
21600 1600 2100
11760 470 2190
10200 680 3280
12 Cost of Fish produced (Rs. Crores) Fresh water Fish Prawn Shrimp
18 2 26
48 20 36
55 28 65
42 38 72
38 55 107
13 Budget allotment for JMK Programme JMK – Department programme JMK –local Body programme
46 250 250
104 180 200
148 100 100
152 150 50
200 50 25
Source: MATSYAFED- 2003.
309
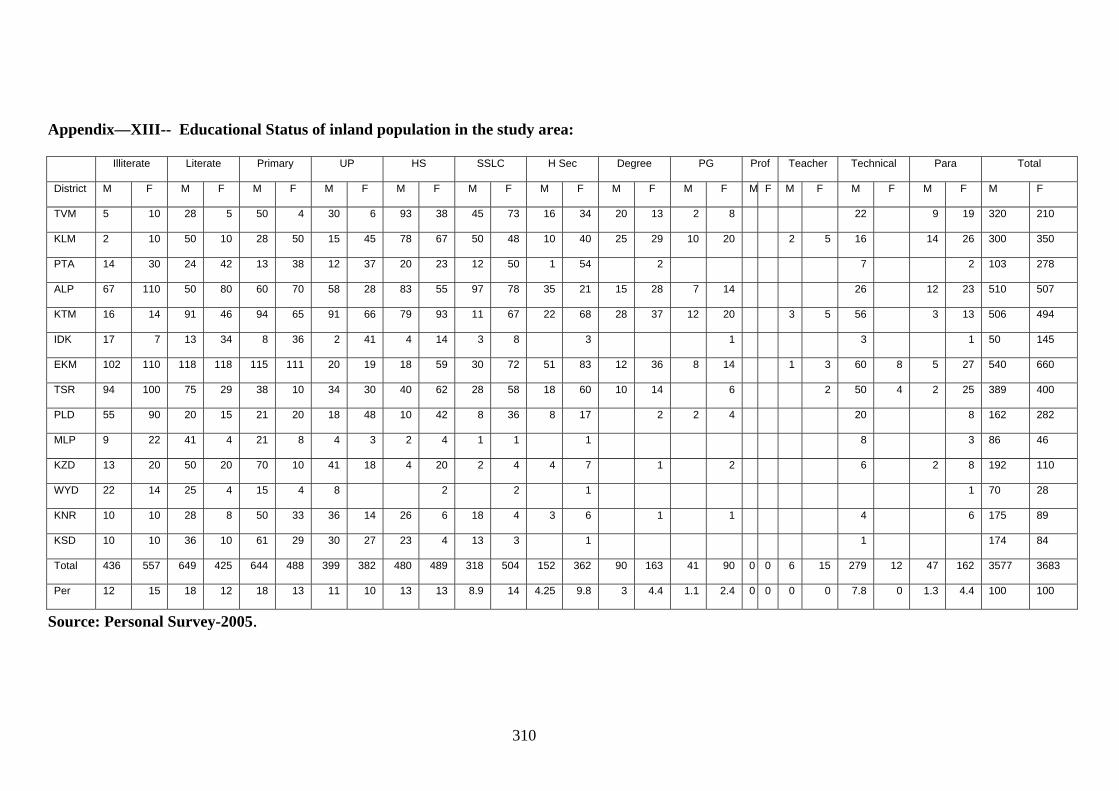
Appendix—XIII-- Educational Status of inland population in the study area:
Illiterate Literate Primary UP HS SSLC H Sec Degree PG Prof Teacher Technical Para Total
District M F M F M F M F M F M F M F M F M F M F M F M F M F M F
TVM 5 10 28 5 50 4 30 6 93 38 45 73 16 34 20 13 2 8 22 9 19 320 210
KLM 2 10 50 10 28 50 15 45 78 67 50 48 10 40 25 29 10 20 2 5 16 14 26 300 350
PTA 14 30 24 42 13 38 12 37 20 23 12 50 1 54 2 7 2 103 278
ALP 67 110 50 80 60 70 58 28 83 55 97 78 35 21 15 28 7 14 26 12 23 510 507
KTM 16 14 91 46 94 65 91 66 79 93 11 67 22 68 28 37 12 20 3 5 56 3 13 506 494
IDK 17 7 13 34 8 36 2 41 4 14 3 8 3 1 3 1 50 145
EKM 102 110 118 118 115 111 20 19 18 59 30 72 51 83 12 36 8 14 1 3 60 8 5 27 540 660
TSR 94 100 75 29 38 10 34 30 40 62 28 58 18 60 10 14 6 2 50 4 2 25 389 400
PLD 55 90 20 15 21 20 18 48 10 42 8 36 8 17 2 2 4 20 8 162 282
MLP 9 22 41 4 21 8 4 3 2 4 1 1 1 8 3 86 46
KZD 13 20 50 20 70 10 41 18 4 20 2 4 4 7 1 2 6 2 8 192 110
WYD 22 14 25 4 15 4 8 2 2 1 1 70 28
KNR 10 10 28 8 50 33 36 14 26 6 18 4 3 6 1 1 4 6 175 89
KSD 10 10 36 10 61 29 30 27 23 4 13 3 1 1 174 84
Total 436 557 649 425 644 488 399 382 480 489 318 504 152 362 90 163 41 90 0 0 6 15 279 12 47 162 3577 3683
Per 12 15 18 12 18 13 11 10 13 13 8.9 14 4.25 9.8 3 4.4 1.1 2.4 0 0 0 0 7.8 0 1.3 4.4 100 100
Source: Personal Survey-2005.
310
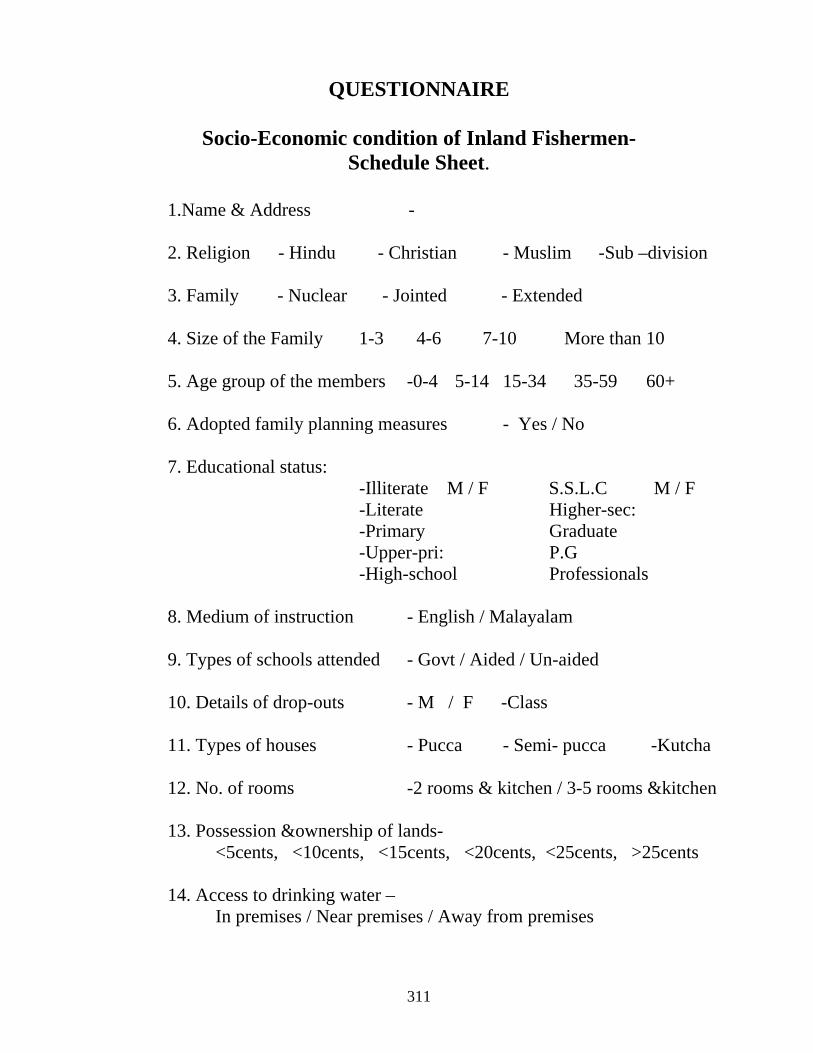
QUESTIONNAIRE
Socio-Economic condition of Inland Fishermen- Schedule Sheet.
1.Name & Address - 2. Religion - Hindu - Christian - Muslim -Sub –division 3. Family - Nuclear - Jointed - Extended 4. Size of the Family 1-3 4-6 7-10 More than 10 5. Age group of the members -0-4 5-14 15-34 35-59 60+ 6. Adopted family planning measures - Yes / No 7. Educational status:
-Illiterate M / F S.S.L.C M / F -Literate Higher-sec: -Primary Graduate -Upper-pri: P.G -High-school Professionals
8. Medium of instruction - English / Malayalam 9. Types of schools attended - Govt / Aided / Un-aided 10. Details of drop-outs - M / F -Class 11. Types of houses - Pucca - Semi- pucca -Kutcha 12. No. of rooms -2 rooms & kitchen / 3-5 rooms &kitchen 13. Possession &ownership of lands-
<5cents, <10cents, <15cents, <20cents, <25cents, >25cents 14. Access to drinking water –
In premises / Near premises / Away from premises
311
15. Source of drinking water - Own –tap / Public tap / Own well / Community well
16. Latrine facility -
Owned modern latrine / Pits / Common latrine / Without latrine 17. Diseases of the households if any - 18. Source of Lighting - Electricity / Kerosene 19. Household amenities
Name Chair Table Cots Almirah Clock Fan Radio T.V Mixie Tape recorder
Fridge
Nos. 20. Attitude towards cultural activities -
Reading& listening to Newspapers& Magazines Listening to Radio WatchingT.V Cultural programmes Cinema
21. Participation in organization
Political parties Trade Unions Co-operative society 22. Occupation of female households
Housewife / Fish vendors / processing workers / Self –employed 23. Status of food security
Able to cover food needs / Not able to cover 24.Food availability to families
Staple food+ fish+ vegetables+ milk now and then Staple food +milk+ meat +fish+ fruits +vegetables Staple food +fish+ meat+ milk+ vegetables. 25.Inland fish for own consumption
Every day 3-4 times per week 1-2 times per week almost never.
26.Daily food consumption
Cereals / pulses / leafy vegetables / other vegetables /Roots and tubers / milk.
312
27.Consumption habits of fishermen Beedi / Cigrette / Liquor / Pan
28.Can anybody go for fishing?
Yes / No 29. Is there any conflicts / competition among inland fishermen
Yes / No 30.What about women’s role in inland fishing:
Active / Passive 31.What are the main celebrations of fisher folk?
Festivals related to religion / of their own celebrations 32. Do you get any assistance from church and related social activists?
Yes / No 33. Standard of living
Above poverty line / Below poverty line 34.What is the age of entry in to fishing occupation?
1) 10-15 2) 12-15 3) 12-17 4) 12-20 35. What is the age group of people involved in active fishing?
1. <15 Yrs 2. 15-34 3. 35-59 4. 60+ 36. Details of activity status of inland fishermen
1. Fishing –M / F 2. Fish related activities -M / F 3. Fish vending -M / F 4. Non-fishing -M / F 5. Students –M / F 6. House wife -M / F 7. Too old / Too young -M / F
37. Details of employment in non-fishing sector
1.Gulf Countries –M / F 2.Govt: Sector -M / F 3.Private Sector - M / F 4.Self-employment - M / F ( Tailoring ,Toddy tapping, Mason ,Housemaids ,Agricultural wage workers.)
313
38.a) How many members of the family are earning? 1. 1-2 2. 3-4 3 . 5-6 4. 7-10
b) How much does your family depend on your income?
Totally / Partially / Not at all 39.Is there any seasonal variation in fish catch ? Give details?
Yes / No 40.How many days a fisherman is involved in fishing in a year?
1. Less than 100 days 2. 100-150 days 3. 151-200 days 4. 201-250 days 5. 251- 300 days 6. Above 300 days
41 Give the monthly income details of an active fisherman?
1. Less than Rs 1000/- 2. 1000-3000/- 3. 3001-5000/- 4. 5001-7000/- 5. 7001-9000/- 6. Above Rs 10000/-
42.What is the per trip expenditure for a fishermen? 43. How much amount is spent for different items per day?
1.Transport 2.Rent for the crafts 3.Food 4.Fuel for lighting the lamp 5.Tapiocca 6. Pan/| Beedi/ Cigarette
44. Is any permission required from government for fishing?
Yes / No 45. What is the capital investment for fishing ?
Credit / Own investment
46. Which are the commonly used gears in inland fishing? 314
47. What is the cost of net used? 48.What are the accessories used in fishing? 49.What is the annual fee for fishing gears? 50.Is there any time schedule for fishing trip? Yes / No 51 .How much time is spent on fishing everyday?
1) 3-5 hrs 2) 5-8 hrs 3) 8-12 hrs 4) 10-15 hrs 5) 10-17hrs
52. How much distance in kilometers is covered for a fishing trip?
1) 1-3 2) 5-7 3) 8-15 4) 12-18 5) 12- 23
53.Which is the method adopted for fishing?
Day fishing / Night fishing 54.What is the number of crew members on a fishing trip?
1) Alone 2) 1-2 3) 2-3 4) 2-5 55. What is the nature of ownership of craft?
Own a boat / Hire a boat. 56. Is there any site reservation for fishing?
Yes / No 57. Can we fore cast the availability of fish ? Yes / No 58.What is the per trip catch of fish during different seasons? 1. Peak Season 2. Moderate Season 3. Lean Seasons 59. Is a specific training essential for catching fish? Yes / No 60. Why did you choose fishing as an occupation?
1. Hereditary 2. Lack of alternate employment and Capital. 3.Due to interest 4.Profitable.
315
61. What are the sources of annual income of the members? 1. Fishing and allied activities 2. Non –fishing
62. Details of distribution of fishermen households on annual income? 1. < 10000 2. 10000 -15000 3. 15000- 20000
4. 20000-25000 5. 25000-30000 6. 30000-60000 7. 45000-50000 8. >50000
63. What is the share of monthly consumption expenditure on different items?
1.Food 2.Fuel 3.Clothing 4.Miscellaneous (Education, health, entertainment travel etc)
64. Do you borrow money? Yes / No 65.Which are the sources of borrowing?
1.Commercial Banks 2.Co-operative societies 3. Private Banks 4.Money-lenders 5.Merchants 6. Friends & relatives
66.How much is your household debts ?
1) Below 3000/- 2) 3001-6000/- 3) 6001-9000/- 4) 9001-12000/- 5) 12001 –15000 6) >15000
67.What is the nature of debt?
Long-term / Short -term 68.Who are the main parties in a fish marketing system? 69.Do you have any credit bondage with a middleman?
Yes / No 70.How will you repay the loan amount?
Bulk / Instalments 71.What is the role of middleman?
Money Lenders / traders / Contractors 72.What is the preservation techniques used? 1.Icing 2.Salting 3. Transport in containers alive
316
73.Does the new entry of post harvest workers cause competition ? Yes / No 74.What are the different modes of fish vending?
Head loading Cycle vending M-80 vending 75.Are the fish vendors organized ? Yes / No 76.Who is getting more profit in fishing?
Fishermen / Money lenders /Wholesalers Retailers / Don’t know
77.Do the fish vendors have the minimum wage formula? Yes / No 78.What are the problems faced by women fish vendors? 79. What is the age composition of women working in processing industry?
1. Below 15 2. 16-25 3. 30-40 4. Above 40.
80. Who helps the girls to get a job in the processing industry? Agents / By self 81.What are the jobs to be done in the factory?
Washing Peeling Gutting Packing Freezing Loading 82. Do you have to work over time? Yes / No 83. Do co-operative societies help you in crisis? Yes / No. 84. Is its functioning beneficial for you? Yes / No 85. Are you a member of the PCS? Yes / No
317
86. Does the co-operative societies help to get good prices for your catch? Yes / No 87. Does the price of fish (gone up or down) after the formation of Co-operative societies? Yes / No 88. What about the political parties intervention in the functioning of Co-operative societies? 1. Over- Politicization 2 Not at all 3 Moderate 89. What are the factors affecting internal efficiency of fishermen’s Co-operative Societies? 1.Participation of fishermen low 2.No interest in the activity of co-ops 3.Over politicization 4. Fishermen’s obligation to moneylenders. 5.Restriction imposed by Government. 6. Failure in marketing 7.Selection of eligible beneficiaries 8. Rate of interest for loans 9.Repayment of loans 10. Lack of funds & trained manpower 11.Lack of insurance coverage to the equipments supplied. 90.Are you a member of Kudumbashree ? Yes / No 91. Is the functioning of Kudumbashree beneficial for you? Yes / No 92 . Does the development of tourism in the backwaters affect fisheries?
Yes / No 93.What are the aquaculture possibilities in your area ?
Prospects / Profits / your opinion
318