Embed Size (px)
Citation preview
IV Journeys in Multiphase Flows (JEM2017)March 27-31, 2017 - São Paulo, Brazil
Copyright c© 2017 by ABCMPaperID: JEM-2017-0005
APPARATUS DESIGN FOR AN INDEPENDENTMULTIPHASE FLOW RATE METER
Sergio de Paula PellegriniAlan Junji YamaguchiFlávio Celso TrigoRaul Gonzalez LimaJorge Luis BaliñoDepartamento de Engenharia Mecânica, Escola Politécnica, Universidade de São Paulo, Av. Prof. Mello Moraes, 2231, CEP 05508-900, Cidade Universitária, São Paulo, SP, [email protected], [email protected], [email protected], [email protected], [email protected] Rodrigues Vieira CamposPetrobras, Centro de Pesquisas e Desenvolvimento Leopoldo Américo Miguez de Mello, CEP 21941-598, Ilha do Fundão, CidadeUniversitária, Rio de Janeiro, RJ, [email protected]
Abstract. This work proposes the design of the sensors for an independent multiphase flow rate meter which shall becomposed of two parts: (a) a differential pressure meter and (b) an electrical impedance tomograph test section, consistingof 32 electrodes. The first sub-system shall measure pressure difference and its fluctuations around a restriction in theduct. The second sub-system is the interface with the flow for an electrical impedance tomography device. This meter willbe tested with an air-water 2 inch diameter facility at the Multiphase Laboratory at the University of São Paulo. The dataobtained from the set of sensors shall be sufficient for the determination of the flow pattern and the estimation of the flowcomposition and the multiphase flow rate, in a future contribution.
Keywords: multiphase flow, air-water flow, flow measurement, electrical impedance tomography, differential pressure
1. INTRODUCTION
The design of real-time independent multiphase flow rate meters is an open and challenging topic. In the petroleumindustry, such a meter would be especially useful for production monitoring – avoiding interruptions in the operation – andfiscal purposes. A typical petroleum multiphase flow is composed of gas, oil, water and other substances at an unknownfraction, requiring the knowledge of flow concentration.
An independent multiphase flow rate meter would require combining information of flow concentration and of pressuredifference around a restriction, such as an orifice plate, nozzle or Venturi. All of these systems have calibration curveswell established for single phase flows.
The present work presents the conceptual design of an air-water flow rate meter and an experimental setup for testingit. This meter shall be composed of two parts: (a) a differential pressure device and (b) an electrical impedance tomograph,measuring the flow composition. For validation purposes, this system is provided with flow rate meters for each singlephase flow, before the mixing, and with a camera for comparison of flow structure observation.
2. LITERATURE
Experimental studies of differential pressure multiphase flow rate meters were carried through in the 1990s (Silva et al.,1991; Fischer, 1994). In these works, Venturi tubes were used to analyze the air-oil-water flows in order to obtain variablesthat characterize the flow composition, such as the void fraction. Fischer’s work concluded that the flow meter couldprovide reliable results only when the different phases were distributed homogeneously. Thorn et al. (1999) reviewedthree-phase flow meters from the literature, all with an uncertainty larger than 5%, and argued that tomographic techniquescould be used to narrow the uncertainty and to provide for a stand alone multiphase flow meter.
Without relying on composition meters, two-phase flow meter calibration models were critically reviewed in Bertaniet al. (2010). These models introduce a correction for the flow rate, as a single phase calibration curve would over estimateit. Meng et al. (2010) compared different two-phase correlations for Venturi tubes, with a large variation of mean errorsdepending on the flow regime. Oliveira et al. (2009) compared the accuracy of different correlations for a Venturi tubeand an orifice plate, also showing varying mean errors. Paz (2011) developed a virtual metering system for oil and gasfield monitoring by using a differential pressure transducer around an orifice plate. The fluid variables are obtained by theoperation condition and using a black oil model. Campos et al. (2014) performed multi-rate tests at the Petrobras Urucuoilfield, located at the Amazon florest, using a virtual metering system based on continuous measurements on orifice
S. P. Pellegrini, A. J. Yamaguchi, F. C. Trigo, R. G. Lima, S.R.V. Campos, J. L. BaliñoDesign of an Independent Multiphase Flow Rate Meter
plates and batch measurements of fluid composition in separator tests, showing an excellent agreement with oilfield data.Numerical studies were also implemented since the start of the 2000s. Paladino and Maliska (1999) used CFX 4.4 to
study a two-phase flow in a two dimensional model of a Venturi tube and predicted a higher concentration of bubbles nearthe walls, including the positions of pressure measurement. This result is a recommendation for caution, as the reliabilityof the measurements is compromised whenever a compressible phase enters the pressure metering system. Indeed, Liet al. (2013) use a swirl inducer flow-conditioning device at the Venturi inlet, to induce a more annular-like flow. Wörner(2003) performed an extensive bibliographic study about the various models for multiphase flow applied to numericalsimulation. Imada (2014) carried out a numerical study using the software Fluent with multiphase flows in differentialpressure flow meters. The study focused on wet gas flows and concluded that the void fraction is a viable alternative tocharacterize the flow composition and estimate the multiphase flow rate.
Current industrial multiphase flow meters for oil applications commonly rely on a combination of a Venturi tube and anauxiliary technique, which might be radiation based techniques (Schlumberger Ltd, 2016), ultrasound (Rosen, 2016) or onintegral electrical impedance methods (Pietro Fiorentini S.P.A., 2016; Emerson Electric CO., 2016). For other industrialapplications, EIT systems for flow composition monitoring are also in the market (Industrial Tomography Systems, 2016;Rocsole LTD, 2016).
Different techniques to measure the void fraction are presented and briefly discussed in Table 1. Two of these arehighlighted: the wire mesh and the electrical impedance tomography. The comparative advantage of the wire mesh, of abetter space resolution, is a direct consequence of its disadvantage, of intrusiveness. If the device selection was driven bythe concern of flow disturbance, wire mesh is a more appropriate technique as the flow is anyway going to be disturbedat the differential pressure meter. However, for situations in which solid particles are carried along with the multiphaseflow – typical case within the petroleum industry –, non intrusiveness is desired, for a higher lifetime of the sensor.Thus, Electrical Impedance Tomography (EIT) is selected as the technique for void fraction measurement, in spite of thedisadvantage of low spatial resolution, which imposes challenges.
Table 1: Comparative analysis of different methods for void fraction measurement. Based on Silva (2008).Advantages Disadvantages
Computed tomography(X or γ rays) • High spatial resolution • Ionizing radiation imposes safety procedures
• Complex and expensive hardwareMagnetic resonanceimaging
• High spatial resolution• Can provide velocity fields
• Low sampling rate• Complex and expensive hardware
Optical systems (frominfrared to ultraviolet)
• High sampling rate• High space resolution• Unexpensive hardware
• Fails in systems with high void fractions• Requires (semi-)transparency of duct wall and fluids
Ultrasound• High sampling rate• High spatial resolution • Fails in systems with high void fractions
Integral electricalimpedance methods
• High sampling rate• Unexpensive hardware • Calibration is flow pattern dependent
Electrical ImpedanceTomography
• High sampling rate• Unexpensive hardware • Low spatial resolution
Wire mesh• Very high sampling rate• Good space resolution• Unexpensive hardware
• Intrusive sensor
EIT provides estimates for the spatial distribution of the phases via a characterization of the electrical properties inthe duct, using only measures in electrodes at the duct wall. This configures an inverse, ill-posed and nonlinear problemand the choice of the algorithm used to solve the problem affects considerably the time resolution and the accuracy ofthe estimates for the phase distribution (Holder, 2005). There seems to be a trade-off between processing speed andprecision, depending on the algorithm – issues out of the scope of the present work. Nevertheless, Rocsole LTD (2016)obtains real-time estimates of good space resolution using EIT. An academic work of a partner university of Rocsolereports that 20 Hz is a low frame rate for three-dimensional analysis with 64 electrodes (Seppänen et al., 2007).
In industrial applications, EIT is traditionally divided in two branches: Electrical Resistance Tomography (ERT) andElectrical Capacitance Tomography (ECT). The main differences are the excitation strategy – ERT imposes electric cur-rent and ECT imposes electric potential, both measuring the system’s electric potential as a response – and the electricalproperty reconstructed – with ERT estimating conductivity/resistivity and ECT estimating permittivity. Due to the prop-erties of the fluids, an ERT system would be typically used to analyze an air-water flow and an ECT system for an air-oilflow (Silva, 2008). The development of dual modality (ERT/ECT) systems is a recent goal in the field.
An important aspect of a successful implementation of EIT is to cope with the intrinsic challenge of ill-posedness –
IV Journeys in Multiphase Flows (JEM2017)March 27-31, 2017 - São Paulo, Brazil
i.e., the low spatial resolution. One method to address this challenge is to include, in the estimation problem, informationknown a priori about the multiphase flow under consideration (Kaipio and Somersalo, 2004). However, this prior infor-mation on the phase distribution is pattern flow specific (Pellegrini et al., 2016). Thus, it is first necessary to know whichflow pattern is present.
Polansky and Wang (2016) used EIT data to identify flow characteristics of annular horizontal and vertical air-waterflow using direct proper order decomposition, a method that identifies typical flow structures and instabilities and couldpotentially be used for flow pattern recognition (Polansky et al., 2015). Using Boolean logic and frequency analysis of theERT data with 16 electrodes for a air-water flow in a 2 inch diameter duct, Karki et al. (2016) were able to differentiateamong bubble, plug, slug, stratified and annular flows with minimum accuracy of 59 %. Dupré et al. (2016) suggest theuse of raw ECT data to differentiate the flow regime, with a Fast Fourier Transform to identify intermittent flow and theanalysis of the eigen-problem associated with a cross-capacitance matrix, defined among the potential of all electrodes, todifferentiate the other flow patterns.
Static pressure can easily be measured in different points and the differential pressure between two measurement pointscan be analyzed by probability density functions (PDFs) showing different characteristic behaviors for each flow pattern.Most of the investigations reported in the literature were performed in vertical flows, as there is a higher variation ofpressure and using sensors capable of measuring higher frequencies (over 50 Hz). Matsui (1984) identified four differenttypes of flow patterns (bubble flow, slug-like flow, annular flow and mist flow) using this method in a vertical sectionusing nitrogen gas-water. The works of this area also extend to developing other identification methods, always usingdifferential pressure signals, such as using the wavelet transform (Elperin and Klochko, 2002), elastic maps (Shaban andTavoularis, 2014a) and machine learning techniques, which may also estimate flow rates (Shaban and Tavoularis, 2014b).
As for the integration of the different measuring techniques, Meng et al. (2010) presented a combined Venturi-ERTsystem in which the differential pressure information of the first sub-system was complemented with the informations offlow pattern, void fraction and vapor quality, all extracted from the ERT sub-system. On the other extreme, Weatherford(2016) combines information of absolute pressure, temperature, differential pressure over a Venturi tube, velocity obtainedwith a sonar system, density obtained with a gamma densitometer and water cut obtained with a (near-)infrared sub-system.
3. METHODOLOGY
To accomplish the objective of designing an independent air-water flow rate meter, the methods proposed will bepresented in three parts. First, the physical systems that measure the flow will be shown. Next, the strategy for integrationof the different measurements will be discussed. Finally, a method for validation is introduced.
3.1 Hardware specifics
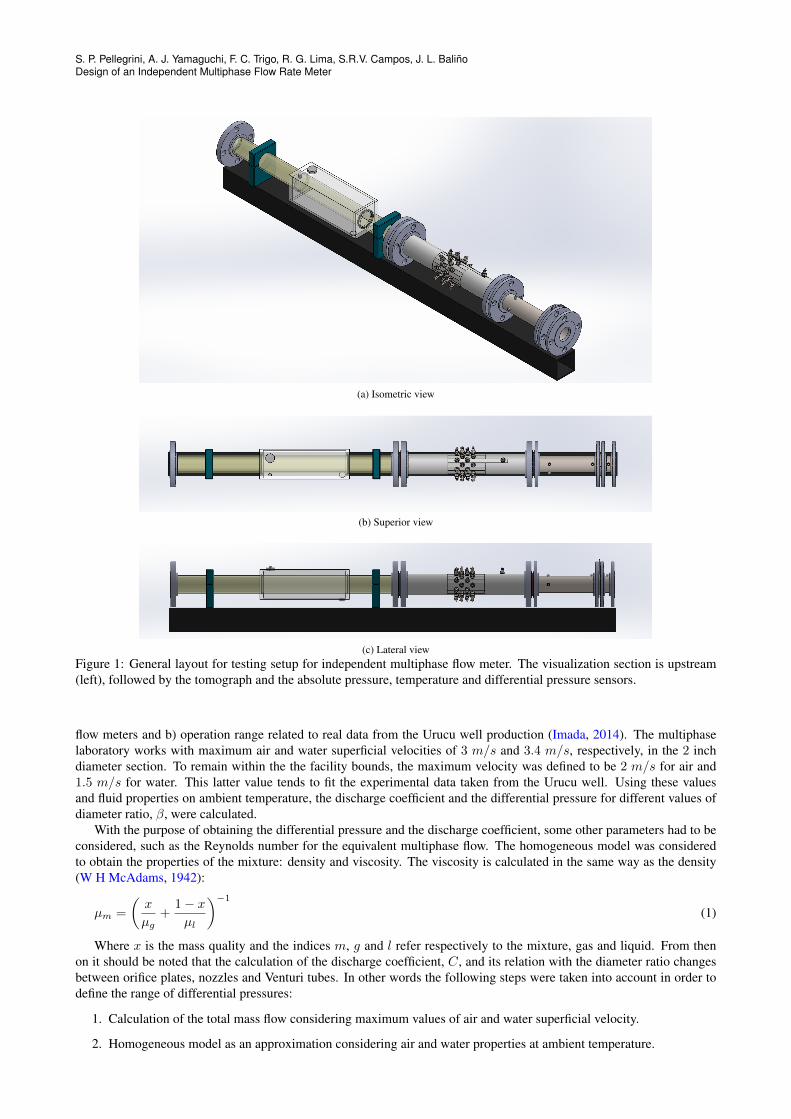
The different parts of the measurement system shall be positioned such that the sub-systems which impose the greaterdisturbance for the flow are more downstream. Care must be taken so that large enough pipe length is allowed to accountfor entry effects. A scheme of the general layout of the system is shown in Figure 1.
As seen in Figure 1, the meter will be composed of two main sub-systems. On the most downstream part is a differ-ential pressure meter over a restriction. Following on the upstream direction, a piezoresistive pressure and a temperaturetransducers are positioned. Next, the EIT system is placed. Finally, on the most upstream end, there is a camera.
3.1.1 Differential pressure meter
The first sub-system will consist of a piezoresistive differential pressure sensor over a restriction in the duct, togetherwith absolute pressure and temperature transducers, upstream. The restrictions to be used in the differential meter are theones defined by the Standard ISO 5167 (ISO, 2003): orifice plates, nozzles and Venturi tubes. The last ones are usuallypreferred for the low influence on the flow regimes – as orifice plates are more likely to cause the blockage of the fluidphase – and for the lowest pressure loss (Bertani et al., 2010). On the other hand, Venturi tubes impose a larger initialcost (which may be compensated by the lower maintenance costs, as this device is more immune to erosion and internalscaling). Nozzles seem to provide a fair compromise in all factors. The choice of different types of restrictions was madein order to do a comparative study about their effects, in terms of pressure loss and measurement accuracy. Differentrestriction diameter ratios shall be analyzed, allowing to study varying operation conditions, related to the differentialpressure and air and water flow rates.
The operation conditions for the measuring system were determined in accordance with the operation range of themultiphase laboratory. This calculation varies with each type of restriction and its relation with the maximum valuesof flow rate. In a first approximation, the multiphase flow was considered to be a pseudo-fluid, using the homogeneousmodel, in such a way that the expansion factor, ε, related to compressibility could be neglected.
The range of superficial velocities considered was based upon two conditions: a) the measurement range of the existent
S. P. Pellegrini, A. J. Yamaguchi, F. C. Trigo, R. G. Lima, S.R.V. Campos, J. L. BaliñoDesign of an Independent Multiphase Flow Rate Meter
(a) Isometric view
(b) Superior view
(c) Lateral viewFigure 1: General layout for testing setup for independent multiphase flow meter. The visualization section is upstream(left), followed by the tomograph and the absolute pressure, temperature and differential pressure sensors.
flow meters and b) operation range related to real data from the Urucu well production (Imada, 2014). The multiphaselaboratory works with maximum air and water superficial velocities of 3 m/s and 3.4 m/s, respectively, in the 2 inchdiameter section. To remain within the the facility bounds, the maximum velocity was defined to be 2 m/s for air and1.5 m/s for water. This latter value tends to fit the experimental data taken from the Urucu well. Using these valuesand fluid properties on ambient temperature, the discharge coefficient and the differential pressure for different values ofdiameter ratio, β, were calculated.
With the purpose of obtaining the differential pressure and the discharge coefficient, some other parameters had to beconsidered, such as the Reynolds number for the equivalent multiphase flow. The homogeneous model was consideredto obtain the properties of the mixture: density and viscosity. The viscosity is calculated in the same way as the density(W H McAdams, 1942):
µm =
(x
µg+
1 − x
µl
)−1(1)
Where x is the mass quality and the indices m, g and l refer respectively to the mixture, gas and liquid. From thenon it should be noted that the calculation of the discharge coefficient, C, and its relation with the diameter ratio changesbetween orifice plates, nozzles and Venturi tubes. In other words the following steps were taken into account in order todefine the range of differential pressures:
1. Calculation of the total mass flow considering maximum values of air and water superficial velocity.
2. Homogeneous model as an approximation considering air and water properties at ambient temperature.
IV Journeys in Multiphase Flows (JEM2017)March 27-31, 2017 - São Paulo, Brazil
3. Determination of the equivalent Reynolds number ReD.
4. Definition of a range of diameter ratios.
5. Calculation of discharge coefficients for different types of restrictions.
6. Determination of differential pressure values.
The following equation was used to determinate the pressure drop as a function of the other parameters according tothe standard ISO5167:2003:
∆P =8(1 − β4)
ρm
(W
Cπd2
)2
(2)
Where W is the total mass flow and ρm is the density of the mixture. The diameter ratio β was varied from 0.5 to0.75. The orifice plate considered was with flange tappings. For the nozzles the ISA 1932, long radius and Venturi tubeswere considered.
The Reader-Harris/Gallagher (Reader-Harris and Sattary, 1996) equation was used to calculate the coefficient dis-charge for orifice plates:
C = 0.5961 + 0.0261β2 − 0.2168β8 + 0.000521(
106βReD
)0.7+ (0.0188 + 0.0063A)β3.5
(106
ReD
)0.3+
(0.043 + 0.08e−10L1 − 0.123e−7L1)(1 − 0.11A) β1−β4 −
0.031(M ′2 − 0.8M ′1.12 )β1.3 + 0.011(0.75 − β)(2.8 − D
25.4
)(3)
Where L1 and M ′2 are quotients related to the upstream and downstream tappings. The discharge coefficient for ISA1932 and long radius nozzles are calculated as:
C = 0.99 − 0.2262β4.1 −(0.00175β2 − 0.0033β4.15
)( 106
ReD
)(4)
C = 0.9965 − 0.00653
(106β
ReD
)0.5
(5)
For last the Venturi tubes was considered. The equation used was:
C = 0.9858 − 0.196β4.5 (6)
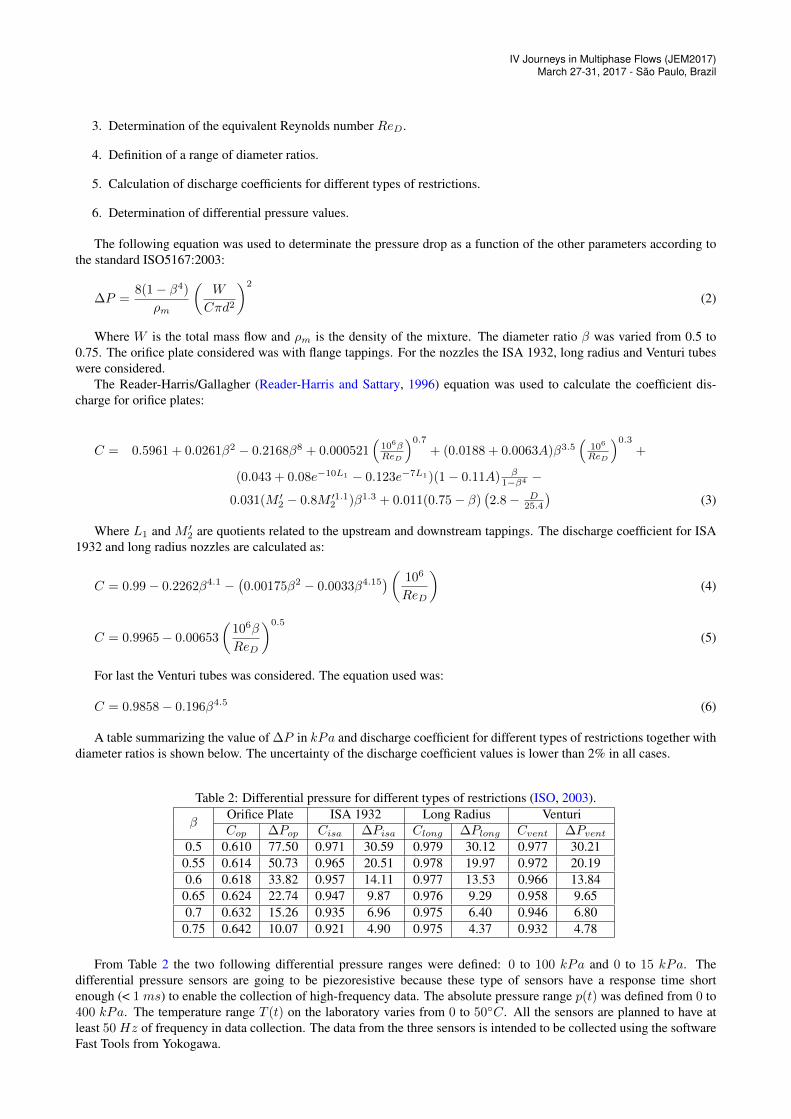
A table summarizing the value of ∆P in kPa and discharge coefficient for different types of restrictions together withdiameter ratios is shown below. The uncertainty of the discharge coefficient values is lower than 2% in all cases.
Table 2: Differential pressure for different types of restrictions (ISO, 2003).
βOrifice Plate ISA 1932 Long Radius VenturiCop ∆Pop Cisa ∆Pisa Clong ∆Plong Cvent ∆Pvent
0.5 0.610 77.50 0.971 30.59 0.979 30.12 0.977 30.210.55 0.614 50.73 0.965 20.51 0.978 19.97 0.972 20.190.6 0.618 33.82 0.957 14.11 0.977 13.53 0.966 13.84
0.65 0.624 22.74 0.947 9.87 0.976 9.29 0.958 9.650.7 0.632 15.26 0.935 6.96 0.975 6.40 0.946 6.80
0.75 0.642 10.07 0.921 4.90 0.975 4.37 0.932 4.78
From Table 2 the two following differential pressure ranges were defined: 0 to 100 kPa and 0 to 15 kPa. Thedifferential pressure sensors are going to be piezoresistive because these type of sensors have a response time shortenough (< 1 ms) to enable the collection of high-frequency data. The absolute pressure range p(t) was defined from 0 to400 kPa. The temperature range T (t) on the laboratory varies from 0 to 50◦C. All the sensors are planned to have atleast 50 Hz of frequency in data collection. The data from the three sensors is intended to be collected using the softwareFast Tools from Yokogawa.
S. P. Pellegrini, A. J. Yamaguchi, F. C. Trigo, R. G. Lima, S.R.V. Campos, J. L. BaliñoDesign of an Independent Multiphase Flow Rate Meter
3.1.2 Electrical Impedance Tomography
The tomograph excitation strategy is the imposition of electric current, configuring an ERT system. This is justifiedas the main interest in this study is on air-water flow. The interface with the flow is composed of a set of 32 electrodes,arranged in four cross sections comprised within around 1.5D. An additional electrode is included, to act as a physicalground. The geometrical disposition of the electrodes and the current injection patterns are an important combined issue,addressed for instance by Graham and Adler (2007); Kaipio et al. (2007); Silva et al. (2017). Stainless steel is selected asthe material for the electrodes. This is a critical property, as it defines how the system shall age and what are the contactimpedances. The duct wall will be made of nylon, for high electrical resistivity and good machinability, besides it beingan adequate cheap material for pressure vessels (Ashby, 2011). A final concern for the mechanical design is the sealingof the electrodes. The maximum manometric pressure for the flow in the laboratory is of 300 kPa. O-rings were chosenfor being the off-the-shelf solution which allows for a simpler manufacturing process for the electrode. The tomographydata will be collected with an independent system (Lima et al., 2016).
3.1.3 Flow visualization
An auxiliary measuring system, with a camera, is included in the system for validation purposes. To mitigate dis-tortions related to the curvature of the pipe, a rectangular prism made of acrylic is assembled onto the pipe. This prismshould be filled with a fluid of refractive index similar to the acrylic’s one. Backlight should also be included. The mainconstrains for this sub-system are an adequate frame rate and a fair image resolution.
3.2 Integration of sensors
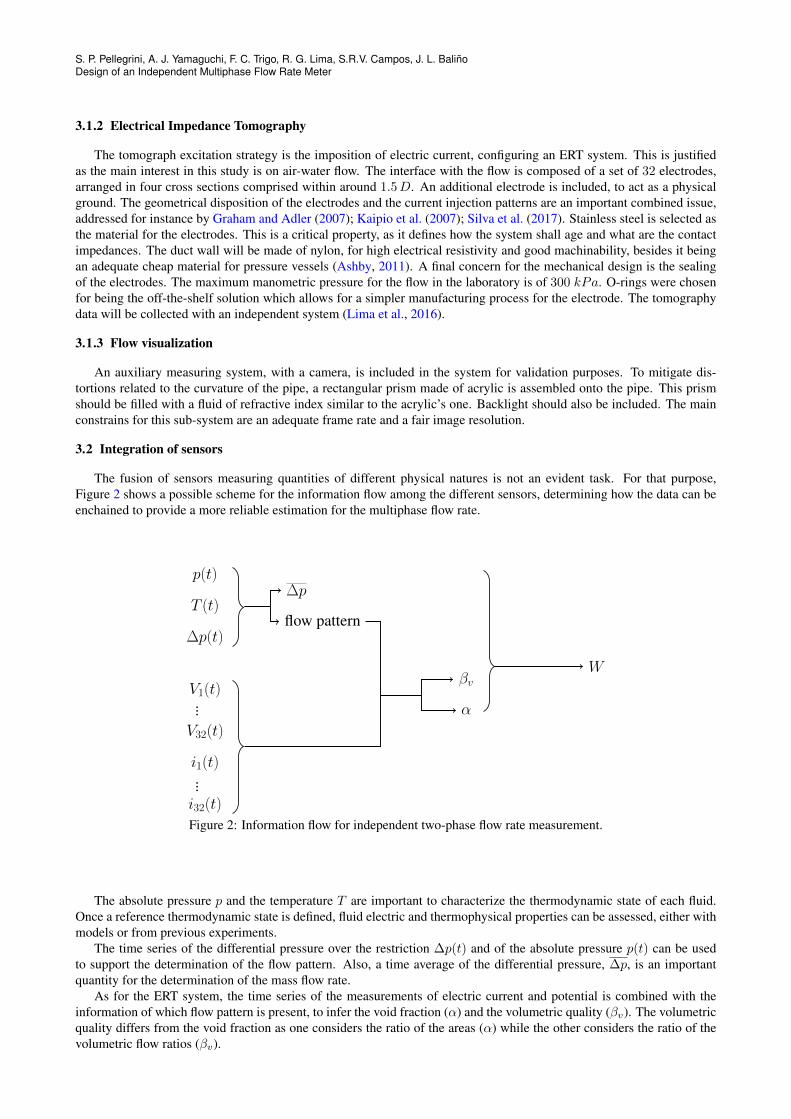
The fusion of sensors measuring quantities of different physical natures is not an evident task. For that purpose,Figure 2 shows a possible scheme for the information flow among the different sensors, determining how the data can beenchained to provide a more reliable estimation for the multiphase flow rate.
p(t)
T (t)
∆p(t)
V1(t)...V32(t)
i1(t)...i32(t)
∆p
flow pattern
βv
α
W
Figure 2: Information flow for independent two-phase flow rate measurement.
The absolute pressure p and the temperature T are important to characterize the thermodynamic state of each fluid.Once a reference thermodynamic state is defined, fluid electric and thermophysical properties can be assessed, either withmodels or from previous experiments.
The time series of the differential pressure over the restriction ∆p(t) and of the absolute pressure p(t) can be usedto support the determination of the flow pattern. Also, a time average of the differential pressure, ∆p, is an importantquantity for the determination of the mass flow rate.
As for the ERT system, the time series of the measurements of electric current and potential is combined with theinformation of which flow pattern is present, to infer the void fraction (α) and the volumetric quality (βv). The volumetricquality differs from the void fraction as one considers the ratio of the areas (α) while the other considers the ratio of thevolumetric flow ratios (βv).
IV Journeys in Multiphase Flows (JEM2017)March 27-31, 2017 - São Paulo, Brazil
Finally, the combined set of data is then used to predict a multiphase mass flow rate, according to Paz (2011):
W = CDA2
2 ∆p(x+ 1−x
S
) (xρg
+ 1−xρlS)
(1 − β4)
12
(7)
The previous equation relates the total mass flow rate W to the differential pressure ∆p, the cross-sectional area at therestriction A2, the vapor quality x, the slip ratio S, the specific masses of the air ρg and water ρl and the diameter ratio β.
The slip ratio can be calculated using the Chisholm correlation (Collier and Thome, 1994):
S =
[1 − x
(1 − ρl
ρg
)] 12
(8)
The vapor quality can be determined from the average void fraction α, according to Eq. 9 (Imada, 2014).
x =Sρgα
Sρgα+ ρl (1 − α)(9)
Imada (2014) defines the average void fraction α as a space average of different cross sections, as his study wasnumerical. For the current analysis, a time average for the ratio of area occupied by the gas at a given section can becalculated from the image estimated with the ERT system.
Synchronization between the data input of both systems is an important property. It is intended to create a sharedinterface to combine all the data obtained.
3.3 Validation
The meter shall be tested at the Multiphase Laboratory located at the Mechanical Engineering Department of thePolytechnic School of the University of São Paulo (Yamaguchi and Baliño, 2015). The facility consists of a pipeline-risersystem of 2 inch diameter pipes, in which air and water can flow. It is intended to test the system initially at the horizontalpart of the facility.
The facility pipes have transparent walls, allowing for the visualization of the flow. The camera shall support thevalidation of the two-phase flow structures identified with the ERT system, at least in a qualitative sense.
Before the mixing of the fluids, the mass flow rate of each phase is measured with single phase meters. Thus, theseintegral steady state values can be used as a reference for validation of the multiphase flow rate inferred by the independenttwo-phase flow rate meter.
The expected flow patterns were inferred from the flow pattern map of Taitel and Dukler (1976). The operation rangeshould cover three flow patterns: stratified flow, bubble flow and slug flow.
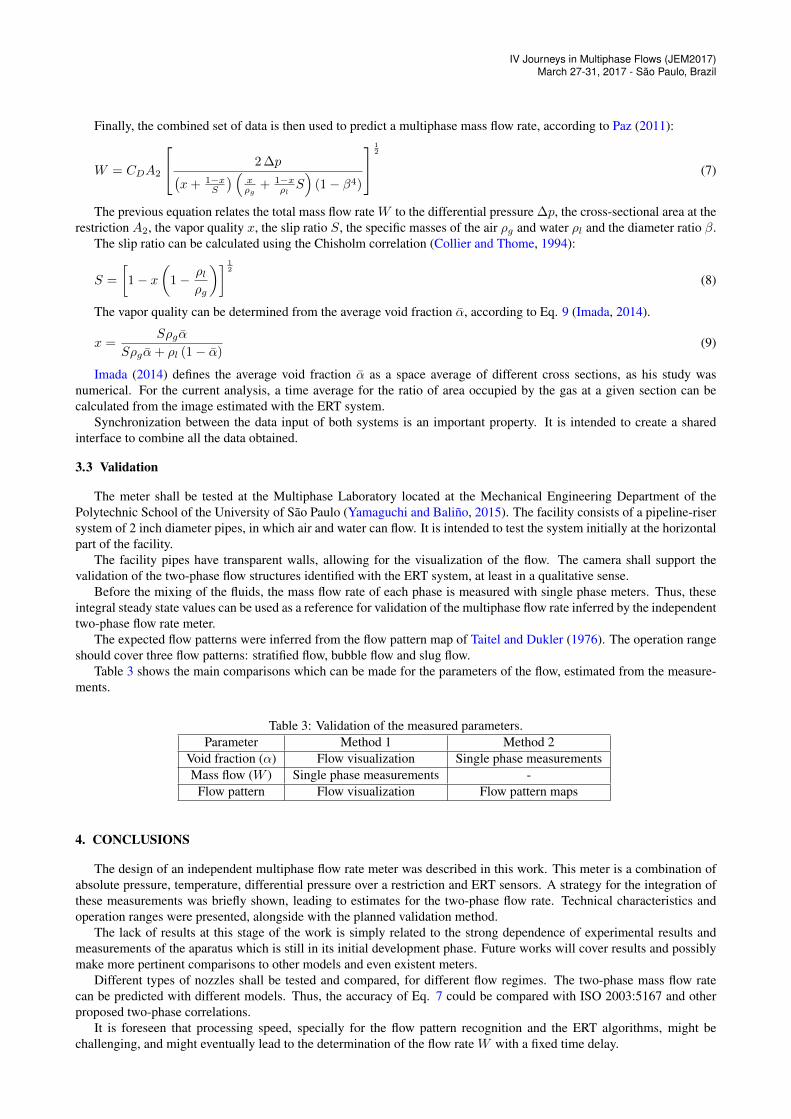
Table 3 shows the main comparisons which can be made for the parameters of the flow, estimated from the measure-ments.
Table 3: Validation of the measured parameters.Parameter Method 1 Method 2
Void fraction (α) Flow visualization Single phase measurementsMass flow (W ) Single phase measurements -
Flow pattern Flow visualization Flow pattern maps
4. CONCLUSIONS
The design of an independent multiphase flow rate meter was described in this work. This meter is a combination ofabsolute pressure, temperature, differential pressure over a restriction and ERT sensors. A strategy for the integration ofthese measurements was briefly shown, leading to estimates for the two-phase flow rate. Technical characteristics andoperation ranges were presented, alongside with the planned validation method.
The lack of results at this stage of the work is simply related to the strong dependence of experimental results andmeasurements of the aparatus which is still in its initial development phase. Future works will cover results and possiblymake more pertinent comparisons to other models and even existent meters.
Different types of nozzles shall be tested and compared, for different flow regimes. The two-phase mass flow ratecan be predicted with different models. Thus, the accuracy of Eq. 7 could be compared with ISO 2003:5167 and otherproposed two-phase correlations.
It is foreseen that processing speed, specially for the flow pattern recognition and the ERT algorithms, might bechallenging, and might eventually lead to the determination of the flow rate W with a fixed time delay.
S. P. Pellegrini, A. J. Yamaguchi, F. C. Trigo, R. G. Lima, S.R.V. Campos, J. L. BaliñoDesign of an Independent Multiphase Flow Rate Meter
5. ACKNOWLEDGEMENTS
The authors are thankful for the support of Petrobras, of Agência Nacional do Petróleo, Gás Natural e Biocombustíveis(ANP, Brazil) and of Conselho Nacional de Desenvolvimento Científico e Tecnológico (CNPq, Brazil).
6. REFERENCES
Ashby, M. F. (2011). Materials selection in mechanical design (4th ed.). Butterworth-Heinemann.Bertani, C., M. D. Salve, M. Malandrone, G. Monni, and B. Panella (2010, Sept). State-of-art and selection of techniques
in multiphase flow measurement. Technical report, ENEA.Campos, S. R. V., J. L. Baliño, I. Slobodcicov, D. F. Filho, and E. F. Paz (2014). Orifice plate meter field performance:
Formulation and validation in multiphase flow conditions. Experimental Thermal and Fluid Science 58, 93–104.Collier, J. G. and J. R. Thome (1994). Convective Boiling and Condensation (3rd ed.). Oxford: Oxford University Press.Dupré, A., G. Ricciardi, S. Bourennane, and S. Mylvaganam (2016, Sept). Identification of flow regimes using raw eit
measurements. In 8th World Congress in Industrial Process Tomography, Foz do Iguaçú. International Society forIndustrial Process Tomography.
Elperin, T. and M. Klochko (2002). Flow regime identification in a two-phase flow using wavelet transform. Experimentsin Fluids 32, 674–682.
Emerson Electric CO. (Checked in jun/2016). Roxar mpfm 2600. http://www2.emersonprocess.com/en-US/brands/roxar/FlowMetering/meteringsystems/Pages/RoxarMultiphasemeter2600.aspx.
Fischer, C. (1994). Development of a metering system for total mass flow and compositional measurements of multi-phase/multicomponent flows such as oil/water/air mixtures. Flow Measurement and Instrumentation 5(1), 31 – 42.
Graham, B. M. and A. Adler (2007). Electrode placement configurations for 3d eit. Physiological Measurement 28(7),S29.
Holder, D. S. (Ed.) (2005). Electrical Impedance Tomography: methods, history and applications. London: Institute ofPhysics.
Imada, F. H. J. (2014). Estudo da estrutura multidimensional de escoamentos multifásicos em dispostivos de medição depressão diferencial. Master’s thesis, Universidade de São Paulo, Brazil.
Industrial Tomography Systems (Checked in jun/2016). http://www.itoms.com.ISO (2003). ISO Standard 5167 - Measurement of fluid flow by means of pressure differential devices inserted in circular
cross-section conduits running full.Kaipio, J. and E. Somersalo (2004). Statistical and Computational Inverse Problems, Volume 160 of Applied Mathemat-
ical Sciences. Springer-Verlag New York.Kaipio, J. P., A. Seppänen, A. Voutilainen, and H. Haario (2007). Optimal current patterns in dynamical electrical
impedance tomography imaging. Inverse Problems 23(3), 1201.Karki, B., Y. Faraj, and M. Wang (2016, Sept). Electrical conductivity based flow regime recognition of two-phase flows
in horizontal pipeline. In 8th World Congress in Industrial Process Tomography, Foz do Iguaçú. International Societyfor Industrial Process Tomography.
Li, Y., W. Yang, C. gang Xie, S. Huang, Z. Wu, D. Tsamakis, and C. Lenn (2013). Gas/oil/water flow measurement byelectrical capacitance tomography. Measurement Science and Technology 24(7), 074001.
Lima, R. G., A. Luis dos Santos, E. D. L. B. de Camargo, F. Silva de Moura, and T. B. R. Santos (2016). Signal ProcessingArchitecture for Electrical Tomography Impedance, pp. 64–67. Singapore: Springer Singapore.
Matsui, G. (1984). Identification of flow regimes in vertical gas-liquid two-phase flow using differential pressure fluctua-tions. International Journal of Multiphase Flow 10, 711–720.
Meng, C., Z. Huang, B. Wang, H. Ji, H. Li, and Y. Yan (2010). Air-water two phase flow measurement using a venturimeter and an electrical resistance tomography sensor. Flow Measurement and Instrumentation 21, 268–276.
Oliveira, J. L. G., J. C. Passos, R. Verschaeren, and C. van der Geld (2009). Mass flow rate measurements in gas-liquidflows by means of a venturi or orifice plate coupled to a void fraction sensor. Experimental Thermal and FluidScience 33(2), 253 – 260.
Paladino, E. E. and C. R. Maliska (1999). The effect of the slip velocity on the differential pressure in multiphase venturiflow meters. In Proceedings of IPC’02, 2002 ASME International Pipeline Conference.
Paz, E. F. (2011). Sistema baseado em medidor de pressão diferencial para determinação em linha de vazões de produçãoem poços e petróleo. Master’s thesis, Universidade de São Paulo, Brazil.
Pellegrini, S. P., J. L. Baliño, and F. C. Trigo (2016, Sept). Design of a sample-based prior using a phenomenologicalmodel for annular flow. In 8th World Congress in Industrial Process Tomography, Foz do Iguaçú. International Societyfor Industrial Process Tomography.
Pietro Fiorentini S.P.A. (Checked in jun/2016). Flowatch 3i. http://www.fiorentini.com/ww/en/product/components/mpfm_eng/flowatch3i.
Polansky, J. and M. Wang (2016, Sept). Annular flow pattern recognition using statistical data analyses of electrical
IV Journeys in Multiphase Flows (JEM2017)March 27-31, 2017 - São Paulo, Brazil
impedance tomography. In 8th World Congress in Industrial Process Tomography, Foz do Iguaçú. International Soci-ety for Industrial Process Tomography.
Polansky, J., M. Wang, and Y. Faraj (2015, Sept). Proper orthogonal decomposition as a technique for identifying multi-phase flow regime based on electrical impedance tomography. In 7th International Symposium on Process Tomogra-phy, Dresden. ISPT.
Reader-Harris, M. J. and J. A. Sattary (1996). The orifice plate discharge coefficient equation - the equation for iso 5167-1.Proceedings of 14th North Sea Flow Measurement Workshop.
Rocsole LTD (Checked in jun/2016). http://www.rocsole.com/en/technology/.Rosen (Checked in Nov/2016).Schlumberger Ltd (Checked in nov/2016). Vx spectra surface multiphase flowmeter.
http://www.slb.com/services/characterization/testing/multiphase/spectra.aspx.Seppänen, A., A. Peltola, L. Heikkinen, J. Kourunen, and J. P. Kaipio (2007). State estimation in process tomography –
experimental study in 3d multi-phase flow case. In 5th World Congress on Industrial Process Tomography.Shaban, H. and S. Tavoularis (2014a). Identification of flow regime in vertical upward air-water pipe flow using differential
pressure signals and elastic maps. International Journal of Multiphase Flow 61, 62–72.Shaban, H. and S. Tavoularis (2014b). Measurement of gas and liquid flow rates in two-phae pipe flows by the application
of machine learning techniques to differential pressure signals. International Journal of Multiphase Flow 67, 106–117.Silva, M. J. d. (2008). Impedance Sensors for Fast Multiphase Flow Measurement and Imaging. Ph. D. thesis, Technische
Universität Dresden.Silva, O. L., R. G. Lima, T. C. Martins, F. S. de Moura, R. S. Tavares, and M. S. G. Tsuzuki (2017). Influence of
current injection pattern and electric potential measurement strategies in electrical impedance tomography. ControlEngineering Practice 58, 276 – 286.
Silva, S. S., P. Andreussi, and P. D. Marco (1991). Total mass flowrate measurement in multiphase flow by means of aventuri meter. Multiphase Production, 145–155.
Taitel, Y. and A. E. Dukler (1976). A model for predicting flow regime transitions in horizontal and near horizontalgás-liquid flow. American Institute of Chemical Engineers Journal 22(1), 47–55.
Thorn, R., G. A. Johansen, and E. A. Hammer (1999). Three-phase flow measurements in the offshore oil industry: isthere a place for process tomography? In 1st World Congress on Industrial Process Tomography, Buxton, England.
W H McAdams, W K Woods, L. C. H. (1942). Vaporization inside horizontal tubes ii-benzene-oil mixtures. Trans.ASME 64, 193–200.
Weatherford (Checked in nov/2016). Alpha vsrd multiphase flowmeter. http://www.weatherford.com/en/products-services/production/flow-measurement/multiphase-flow-measurement.
Wörner, M. (2003). A compact introduction to the numerical modeling of multiphase flows. Forschungszentrum Karlsruhe.Yamaguchi, A. J. and J. L. Baliño (2015). Experimental study of severe slugging in an air-water pipeline-riser system. In
Proceedings of IV Journeys in Multiphase Flows (JEM2015), 10 p.
7. RESPONSIBILITY NOTICE
The authors are the only responsible for the printed material included in this paper.