Embed Size (px)
Citation preview

Prizes are generously provided by
Apparatus descriptions also available at:http://www.aapt.org/Programs/contests/apparatus.cfm
Sponsored by the
AAPT Committee on Apparatus
2015 Summer Meeting of theAmerican Association of Physics Teachers
Apparatus Competition
20
15 SUMMER MEETING
JULY 25-29 COLLEGE PARK, MD


Table of Contents
Physics of the Respiratory System: Lung-Alveoli ApparatusNancy Donaldson and Charles Gosselin ........................................................... 4-20
Projectile Motion SprinklerPaul Fratiello ......................................................................................................... 21-24
Wave MachineThomas B. Greenslade, Jr. .................................................................................... 25
3-D Vectors on the TabletopRoger Key and David Bezinque .......................................................................... 26-27
No-Touch Counter Modification for Counting RotationsRoger Key .............................................................................................................. 28-29
LED Arrows to Show Direction of Electric Current FlowRoger Key .............................................................................................................. 30-34
An Experiment to Illustrate the Differences in Electrical Resistance wrt Temperature of Conductors and SemiconductorsRoger Key .............................................................................................................. 35-36
Inexpensive Dramatic Pneumatic LiftRobert A. Morse ................................................................................................... 37-38
A marble roller coaster with jumping-off points: A demonstration on “impetusRalph McGrew ...................................................................................................... 39-58
Shoebox SpectrographTimothy Grove ...................................................................................................... 59-81

4 AAPT
Name: Nancy Donaldson and Charles GosselinRockhurst UnversityPhysics Dept1100 Rockhurst Rd., Kansas City, MO 64110816-506-0765, [email protected]
Abstract (50-75 words):
The Lung and Alveoli apparatuses correlate with a hands-on, active learning respiratory physics module covering the mechanics of breathing and the pressure differences in the body that guide air flow in the respiratory system in health and disease. The module activities address the pre-health competencies on fluid mechanics in the human body and are directed toward an application of physics to medicine.
Use of Apparatus:
The educational use of the Lung-Alveoli apparatus is provided in the accompanying “Pressure in the Human Body: Investigating the Respiratory System” Sample Guide. This guide is a subset of a full 6-section, hands-on active learning curriculum on pressure and fluid flow in the human body. This active-learning Respiratory Module addresses fluid dynamics principles and their relationship to the human body in the following areas: the pressure-volume study of the intrathoracic cavity and the operation of the lungs, airflow through the bronchial cavities, and the Young-LaPlace Equation in the expansion/contraction of the alveoli. All material is presented through an application of physics to medicine, and respiratory diseases are investigated through a context of physics principles.Pedagogical techniques for the Respiratory Module include elicitation, prediction/questioning, hands-on class activities, laboratory work, outside reading and writing within the curriculum, and quantitative problem solving. The included guide includes sample sections from two activities from the module: Investigating a Pneumothorax (lung apparatus) and Respiratory Distress Syndrome (alveoli apparatus.) The apparatuses may be used as standalone teaching tools or both can be used for more in-depth coverage of the physics of the respiratory system. Sample curriculum is provided for each and sample data is included to illustrate the use of the apparatus with a computer and Pasco sensors. Full curriculum is available upon instructor request to the author.
Construction of Lung Apparatus:
Lung Apparatus: The lung apparatus consists of a “lung” model constructed from a modified water gun and plastic storage container with four holes tapped,

5Apparatus Competition
drilled and sealed to create a model of a single lung open to the atmosphere and enveloped by a chest cavity (parts list attached). Unlike similar commercial lung models, this model illustrates the necessity of having a single sealed chest cavity to provide the intrathoracic pressure differences necessary to create fluid flow in and out of each lung. In conjunction with Pasco spirometer and pressure sensors (note – module can be modified to work with Vernier as well), the holes serve several pedagogical physics/anatomical purposes that are utilized in the respiratory module: 1) one hole on the top of the lung model symbolizes a “trachea” open to the atmosphere (this hole also fits the Pasco spirometer so as to measure volume flow rate of air in and out of the lung); 2) another hole at the top attaches to a modified water gun to create pressure differences in the chest cavity; 3) a third hole at the top provides a means to attach a pressure sensor to the plastic container cavity to measure the “intrathoracic” pressure changes in the chest cavity during breathing; and 4) a hole covered by tape on the side of the plastic container allows a rapid flow of air to the chest cavity to represent a pneumothorax. Following a study of the mechanics of breathing, students apply their understanding to how physics principles guide what happens in a pneumothorax (see Sample Activity #1) and asthmatic breathing (see sample data.)
Sample Data of “normal breathing” from Pasco Spirometer and Pressure Sensor
Pasco Spirometer Single Lung Model (4 holes) Pasco Pressure Sensor

6 AAPT
Sample Data of normal breathing, followed by a pneumothorax and a reestablishment of breathing by plugging hole at start of the inhalation cycle.
Sample Data: Asthmatic Breathing – a stopper with a narrow tube is inserted in the lung model “trachea” to symbolize the increased resistance caused by asthmatic narrowed trachea and bronchial tubes. Students record the increased pressure differences necessary to maintain lung expansion and feel the increased work necessary to create a pressure difference for breathing.

7Apparatus Competition
PARTS LIST: Lung Apparatus
Item Cost 1.1L (4.7 cup) Snapware Rectangular Container $5.00 1 $5.003/4” ID x 3/4” MIP Nylon Hose Barb (Watts PL-638) $2.00 1 $2.001/4” x 3/8” MIP Nylon Hose Adapter (Watts PL-217) $2.00 1 $2.00Pasco 640-078 CPLG FEM to 1/8 MNPT Adapter $10.00 1 $10.005/16” ID Rubber Gromet $1.00 1 $1.003/4” x 5/8” x 1” Rubber Stopper $1.00 2 $2.003/32” OD x 1/16 “ ID Brass Tubing (5 cm Long) $2.00 1 $2.003/8” OD x 1/4” ID Soft Plastic Tubing (18” long) $1.00 1 $1.00Tube of Clear Silicone Waterproof Sealant $10.00 1 $10.0016” Round Qualatex Balloons (71444 43904) Qty 50 $23.00 1 $23.00Water Blaster $9.00 1 $9.00 TOTAL: $67.00
Construction of Alveoli Apparatus
Alveoli (LaPlace) Apparatus: The alveoli apparatus is a model of interconnected alveoli constructed from a PVC pipe with an open/close valve, two air valves attached for air flow into and out of the “alveoli” balloons, and two Pasco pressure ports to measure pressure differences as the alveoli inflate and deflate during breathing. This apparatus is used to teach the pressure differences necessary to inflate a balloon (alveolus), the application of the Young- LaPlace Equation in the expansion/contraction of the alveolus and in the direction of fluid flow in interconnected alveoli, and the relationship of the pressure differences, tension and radius on diseased alveoli (See Sample Activity #2 on Infant Respiratory Distress Syndrome).

8 AAPT
Alveoli Apparatus: Each balloon represents an alveolus. Students study the expansion/contraction of a single balloon (alveolus) and then interconnect the balloons to simulate interconnected alveoli in the human body.
Sample Data of Initial Expansion of single spherical balloon (“alveolus”)
Sample Data of Initial Expansion/Contraction of single spherical balloon.
Choice: use a simple air compressor or a bicycle pump to add air to the apparatus

9Apparatus Competition
Sample Data of Interconnected balloons of different sizes (“alveoli”) coming to equilibrium (smaller balloon expels into larger balloon per the Young-LaPlace Equation – relates to Respiratory Distress Syndrome.)
PARTS LIST: Alveoli Apparatus
Item Item Cost 1 Unit 3/4 “ PVC Globe Valve $4.50 1 $4.50
Pasco ME-2224 Press Tap $20.00 2 $40.00 1/8”NFP Air Valve $2.30 2 $4.60 3/4” X 1/2” PVC Bushing $0.50 2 $1.00 Colder Products Co PN SMC 02 $3.50 2 $7.00 1/2” PVC pipe Sch 40 (3” long) $0.25 2 $0.50 3/4” PVC pipe Sch 40 (3” long) $0.30 4 $1.20 PVC All Purpose Cement (1 can) $3.00 1 $3.00 PVC Primer/Cleaner $3.00 1 $3.00 Teflon Thread Sealing Tape $3.00 1 $3.00 TOTAL $67.80
Small Balloon
Large Balloon Pressure Equilibrium
Ambient Pressure

10 AAPT
1. Sample Activity using the Lung Apparatus (instructor notes in red): Investigating an Injury related to the Mechanics of Breathing
Objective: Apply physics principles related to pressure and volume in the thoracic cavity and lungs to a medical situation.
A.Patient Scenario #1: 50 year old male with chest stab wound
History: A healthy male with normal breathing was stabbed in the chest. The knife pierced the thoracic cavity, interrupting the patient’s breathing. Patient arrives at the ER gasping for breath. X-rays are taken and provide the images below.

11Apparatus Competition
Penetrating Chest Trauma: Lateral radiograph of the chest on left shows a knife entering the anterior thorax. It is difficult to further ascertain the position with only the lateral view. A second radiograph (on the right) gives a frontal view (on right) of the chest showing that the knife entered the left thoracic cavity. The left hemidiaphragm is elevated. It is determined that the patient has a hemopneumothorax.
Notes: A Hemopneumothorax is a medical term describing the combination of two conditions: a pneumothorax, or air in the chest cavity, and a hemothorax , or blood in the chest cavity; it can occur if the chest wall is punctured. A collapsed lung can result.
Prediction:Can our patient live with this wound? Why or why not? Describe your answer based on pressure and fluid flow principles related to breathing.Activity 1: Investigating a Pneumothorax:To investigate the physics principles underlying the collapse of the lungs, we will now use your lung apparatus to investigate a pneumothorax (air in the lungs.). The physical principles of the hemothorax (blood in the lungs) are similar.
Materials:• Lung simulation apparatus • Pasco Absolute Pressure Sensors (need two sensors; one for lung cavity and
one for ambient pressure• Data Studio
Instructor Notes: The Pasco Absolute Quad Pressure Sensor was chosen due to its high resolution and the ability to get multiple pressure readings on one sensor. This module could also be performed with a Vernier Pressure Sensor with moderate adaptations.

12 AAPT
Instructor Notes: as in previous sections, point out an analogy of lung model to anatomy of thoracic cavity, diaphragm, lungs, intercostal muscles that pull on diaphragm. Point out that in this apparatus, unlike a real lung/chest cavity system, the intrapleural cavity is much larger than the lung balloon and doesn’t “stick” to the side of the chest cavity. Also, point out that we are dealing with only one lung in our model to illustrate that the lungs are held in separate cavities – a necessary factor to creating appropriate pressure differences for breathing.
• Establish a regular pattern of breathing for approximately 30 seconds to represent the breathing of the healthy man prior to the stab wound. (Note: as we did in previous sections, ignore the positive pressure bumps. These may occur due to air trapped in the pump and do not happen in the human body.)
• You will notice a piece of tape under the pressure sensor tube leading to the computer. This tape covers a small hole located in the thoracic cavity. This hole in the cavity will simulate the stab wound. Notice there is a side that is folded for easy removal.
• While you are in an active pattern of breathing, create a “pneumothorax” by rapidly pulling the tape back to expose a small hole in thoracic cavity. (Note: do not pull the tape completely off the outside of the cavity; just pull it back enough to uncover the hole.)
• With the hole in the thoracic cavity exposed, continue your regular breathing pattern for at least 30 seconds. Maintain data collection. Then tape over the hole and continue breathing for ~ 30 seconds.
• When the tape was removed, how does the pressure curve change?
• When the tape was removed, what did the lung balloon do?• Use your knowledge of the mechanics of breathing to explain
the behavior. Relate your answer to intrapleural and atmospheric pressure.
• You may have seen a police or doctor show where the pneumothorax is “fixed” by putting an object in the thoracic

13Apparatus Competition
cavity to plug the hole. When you taped over the hole in the lung model, were you able to re-establish a regular breathing pattern?
• Investigate the timing of when to plug the hole. • In the respiratory cycle, when is the best time to plug the hole to return
to regular breathing – should you do it during inhalation, expiration or somewhere in between?
• When you get a good graph of regular breathing, pneumothorax, regular breathing, save and print it.
• Mark key points on your graph: the start of inhalation, the start of exhalation, the location of creating the pneumothorax and the location of the plug reestablishing a regular breathing pattern.
Instructor Data – Pneumothorax student example:
Questions:1. Study your graph and explain your choice of when to plug the hole in our
lung apparatus to recreate regular breathing in terms of pressure differences that guide the mechanics of breathing.
2. Using our lung apparatus model, would our patient live if his pneumothorax was not fixed? Why or why not?
3. Compare your answer above to the initial patient scenario in which our patient was stabbed in the left thoracic cavity – he was still breathing, although with great difficulty, when he entered the emergency room. Why was he still able to get any air?
4. Relate the results of the lung model to the real lung when a hemopneumothorax is created. Include a discussion on pressure differences, the pleura and forces from the rib cage. Discuss with your instructor.
Relate the results of the lung model to the real lung when a hemopneumothorax is created. Include a discussion on pressure differences, the pleura and forces from the rib cage. Discuss with your instructor.

14 AAPT
If the chest wall, and thus the pleural space, is punctured, blood, air or both can enter the pleural space. Air/blood rushes into the space in order to equalize the pressure with that of the atmosphere. As a result the fluid is disrupted and the two membranes no longer adhere to each other. When the rib cage moves out, it no longer pulls the lungs with it. Thus the lungs cannot expand, the pressure in the lungs never drops and no air is pulled into the bronchi. Respiration is not possible. The affected lung, which has a great deal of elastic tissue, shrivels in what is referred to as a collapsed lung.
Note: Additional lung apparatus module sections deal with restrictions in the trachea such as asthma and bronchitis – these are accomplished by inserting a tube with a narrowed opening in the trachea hole and then comparing the pressure differences and work necessary to achieve the same volume fluid flow rate as in a healthy lung. Students relate to Pressure-Volume curves.
2. Sample Activity using the Alveoli Apparatus: Investigating the Physics of the Alveoli Objective: Investigate how surface tension, radius and pressure differences affect the expansion/contraction of the alveoli; LaPlace’s Law applied to the alveoli
We will now follow the path of air in our body to the alveoli. After passing through the trachea, bronchus into the terminal bronchioles, air travels through the respiratory bronchioles ending in the alveoli.

15Apparatus Competition
To investigate the physics principles underlying the expansion/contraction of the alveoli, we will first experiment with the expansion/contraction of a spherical balloon. The balloon gives us a concrete method to examine the relationship between the pressure difference across the wall of the balloon and the radius of the balloon as it initially expands and then contracts. We will then extend this thinking to the expansion/contraction of the alveoli.
Activity 1: Investigate Pressure - Time Variations during Expansion and Contraction of one balloon.
We will investigate the pressure difference between the inside and outside of a spherical balloon as the radius of the balloon changes over time.
Materials:• Alveoli apparatus (directions to build attached)• Pasco absolute pressure sensors (need three sensors; one for each alveoli
and one for ambient pressure. It is possible to only use two sensors.)• Three 12” balloons. • Air compressor or bicycle pump (the air compressor works much better.)• Data Studio • 12” ruler
Pressure inside of sphere pushes out
Tension/length or energy/area
Pressure of surrounding fluid outside of sphere pushes in

16 AAPT
Instructor Notes: The Pasco Absolute Quad Pressure Sensor was chosen due to its high resolution and the ability to get multiple pressure readings on one sensor. This module could also be performed with a Vernier Pressure Sensor with moderate adaptations.
Initial Expansion of one spherical balloon (alveolus):
Setup• Secure one spherical balloon to the end of the alveoli apparatus.• Use two pressure sensors: Attach Sensor 1 to the balloon and leave Sensor
2 open to the atmosphere for the ambient pressure (outside pressure on the alveoli). The difference between the two pressures will represent P. Do not attach Sensor 3 now.
• Attach the air compressor to the valve near the balloon. To start, make sure all of the air is out of the balloon and then close the valve.
• Set up a pressure-time graph with two sensor readings on the vertical axis.
In the next step you will graph the pressure while the balloon starts to expand. Before doing so, predict what the graph will look like: (Share your prediction with your group and instructor.)
Start recording and turn on the compressor. Graph the P-t curve for expansion of the CLEAR balloon. Use the air compressor to expand your balloon (alveolus) to about a 6” diameter - do not expand too large (stop once the P-t graph starts to level out.) Once it gets to this size, turn off the compressor and stop recording. Hit Autosize to automatically change the scales of the axes. Repeat the process, if necessary, by rotating the valve to remove the air.
Sample Data of Initial Expansion of single spherical balloon
t
P

17Apparatus Competition
Save, print and title your graph: “ Initial Expansion of single spherical balloon”
• Qualitatively, what happens to the pressure as the balloon initially expands? Describe in terms of the radius of the balloon. Is this what you predicted above?
• Approximately what are the values of ∆P? • Release the air and repeat – this time expand and then slowly contract the
balloon. Record your results. As alveoli are actually interconnected in the human lung, we will compare these graphs to interconnected balloons representing diseased alveoli in Respiratory Distress Syndrome.
Sample Data: Initial Expansion/Contraction of single spherical balloon
Investigating Pressure Differences in Interconnected Alveoli
We will begin with a disease that occurs when the alveoli do not expand/contract properly.
Patient Scenario #4 - Infant Respiratory Distress Syndrome (IRDS) Case Study: In August 1963, First Lady Jacqueline Bouvier Kennedy was hospitalized in her 34th week of pregnancy at the Otis Air Force Base Hospital. Her fetus was in distress, but labor did not progress. On August 7, she underwent a cesarean section to deliver Patrick Bouvier Kennedy, who weighed 4 pounds, 10.5 ounces (2,112 grams). After delivery, the baby developed difficulty in breathing, which did not improve despite oxygen therapy. The baby was then rushed to Children’s Hospital Boston, a leading center in respiratory distress syndrome (RDS). Unfortunately, despite the best medical efforts, the baby died two days later.
Patrick Bouvier Kennedy suffered from Infant respiratory distress syndrome (IRDS), also called neonatal respiratory distress syndrome, respiratory distress syndrome of newborns, or increasingly referred to as surfactant deficiency disorder (SDD). IRDS is a breathing disorder that affects premature infants born about six weeks or more before their due date. This breathing disorder in premature infants occurs due to a development insufficiency of surfactant

18 AAPT
production and structural immaturity in the lungs. Surfactant is a liquid that coats the inside of the lungs helping them to remain open upon exhalation. Without enough surfactant, the lungs will collapse and the infant has to work very hard to breathe to support the body’s organs. A lack of oxygen can damage the baby’s brain and other organs if proper treatment isn’t given. Unlike the Kennedy baby, due to improved treatments and medical advances, most infants who have RDS survive. However, these babies may need extra medical care after being discharged. http://en.wikipedia.org/wiki/Infant_respiratory_distress_syndrome; http://www.nhlbi.nih.gov/health/health-topics/topics/rds/printall-index.html
Our previous balloon-alveoli activities were designed to allow you to investigate LaPlace’s relationship in the expansion/contraction of a single spherical surface. To enhance our analogy, we need to extend our study to investigate alveoli not as independent balloons, but rather as interconnected spheres that allow air to pass from one alveolus to another when there are pressure differences. The diagrams below give you a more detailed view of the interconnectedness of alveoli. The diagram on the right is a very thinly sliced and stained bit of lung tissue.
Activity: Interconnected alveoli with two spherical balloons
To investigate the effect of air flow in interconnected alveoli, we will turn back to the use of our balloons – this time using two balloons with a valve that we can open and close to interconnect the balloons.
Instructor note: use two different colors to be sure students can distinguish between the two - we used CLEAR and RED balloons)
Setup• The CLEAR balloon should be on one end of the alveoli branch. Make sure
all the air is out of it.• Place a RED balloon emptied of air on the other end of the alveoli branch.
Hook up three pressure sensors: one for the CLEAR balloon, one for the RED balloon, and one for ambient pressure.
• Close the valve connecting the two balloon alveoli tightly. Inflate the clear balloon to a medium size (~7”) and the RED balloon to a small size (~4”).
• Balloons cannot be inflated too large. The effect won’t be seen.

19Apparatus Competition
Prediction #1: How do you think the pressures in the balloons compare with each other? With the ambient pressure? Rank the pressures from greatest to lowest. Explain your reasoning.
Prediction #2: Predict what will happen if you open the valve between the two balloons. Will air flow when the valve is opened? If so, which way? Explain your prediction.
Now try it. Begin collecting data. You should see three curves: one for ambient pressure, one for the CLEAR balloon and one for the RED balloon. Which color corresponds with which balloon? How can you tell?
Keep recording. Open the valve so that the alveoli are interconnected.
• Which way does the air flow? From what to what? • What happens to the pressure readings of each alveolus as the air
flows? What happens to the pressure readings in the two alveoli once air stops flowing?
• How do the alveoli sizes compare in size once the air stops flowing? • Do the results of this activity match your Predictions #1 and #2? If
not, what differences do you find? • Save, print and title your graph: “ Interconnected Alveoli with two
spherical balloons”• Explain/summarize your answers. If real alveoli behaved in the
manner shown by the balloon apparatus, what would be the problem in the human body? Discuss these results with your instructor.
Instructor Notes: If this behavior occurred with real alveoli, the small alveoli would all collapse, and the large alveoli would get even larger. The lung would not be effective for oxygen and carbon dioxide exchange. So something else must be happening in the lung
Sample data and notes:
Small Balloon
Large Balloon Pressure Equilibrium
Ambient Pressure

20 AAPT
Instructor Guiding Questions: What issue(s) do you see with the data results from these activities as related to the function of the human alveoli? If these activities truly represent our alveoli function, what effects would they have on the expansion/contraction of our alveoli as they facilitate gas exchange in the lungs? How would this issue contribute to IRDS? Use all data obtained and LaPlace’s Principle to explain.
Class Discussion: In a healthy lung, a surfactant coats the alveoli. The presence of surfactant decreases the surface tension of the alveoli. Furthermore, this surface tension is a function of the radius. Use this fact and the diagram below to revise your model on the behavior of healthy alveoli.

21Apparatus Competition
Apparatus Title: Projectile Motion SprinklerName: Paul FratielloEckerd College4200 54th Ave. S. St. Petersburg, FL 33711941-704-8267, [email protected]
Demonstrating the trajectories of projectiles having the same initial velocity but varying launch angles can be difficult. Showing that a projectile launched at a 70° angle will land at the same spot as one launched at 20° is even harder. Attempts at creating composite photographs of various garden hose streams have been made, but lack the angular accuracy and impact of a live demonstration. There-fore, I introduce 2 versions of the Projectile Motion Sprinkler.
Construction of Apparatus: The PVC Projectile Motion Sprinkler is constructed of pipe and fittings that can be obtained at any hardware store for under $25, but to be built accurately requires some machine shop equipment.
Item Qty Description Price/Unit Total Cost1 3 ¾” PVC Pipe $0.29/ft $0.872 4 ¾” PVC Elbow $0.53/ea $2.123 1 ¾” PVC Tee $0.98/ea $0.984 1 ¾” PVC Male Adapter $0.50/ea $0.505 1 Clothes Washer Hose $8.68/ea $8.686 1 PVC Pipe Cement $8.39/ea $8.39
The critical part to the Sprinkler is the piece of PVC with the holes drilled in it. In order to get the desired results, the angles of these holes must be accurate. To do this, a horizontal indexer and a milling machine were used. The holes were drilled in one end of the piece of PVC pipe and it was cut to length (approximate-ly 8”) afterward to allow stock for clamping in the indexer. It was also necessary to support the free end of the pipe to prevent flexing of the pipe and walking of the drill.

22 AAPT
Before making any of the angled holes, use the drill to make an indentation 1” from the free end and another 7” from the free end to mark the 90° (vertical) position of the pipe (needed for assembly purposes). With the indexer, rotate the pipe to 70°. Using a 5/32” bit, drill a hole through the pipe wall 1” from the first indentation. Repeat this operation until additional holes are made at 60°, 45°, 30°, and 20°. The finished piece should look like this:
Once this piece is completed, carefully glue an elbow to each end using inden-
tations and elbow parting line to assure bend is perpendicular to the vertical. The rest of the construction is simply cutting and gluing additional PVC pieces as shown trying to keep everything as planar as possible. Make the side pipes at least 6” long just in case you have to cut and re-glue parts together. Don’t worry too much about small leaks as this is an outside demonstration.Attach the washer hose to the Sprinkler and it is ready for operation.
For those that do not have access to a machine shop, another option is also a 3-D printable design. If you have access to a 3-D printer, the construction is as simple as printing the part and attaching a ¾” male adapter to it using a silicone sealant. To obtain an .stl file for this design, send an e-mail request to [email protected].

23Apparatus Competition
Use of Apparatus:
The inspiration for the Projectile Motion Sprinkler was this composite pho-tograph made by Rhett Allain. It was created by superimposing pictures of a garden hose spraying water at four different angles.
The Projectile Motion Sprinkler allows one to simultaneously shoot five streams of water at a consistent velocity and accurate angles. As long as the cross-sec-tional area of the five outlet holes is small enough to allow a constant pressure to build within the body of the tube, Pascal’s Principle should insure the initial velocity of all streams will be equal.
To operate the Sprinkler, simply attach the free end of the washer hose to an out-side hose bib or garden hose and slowly turn on the water until you reach a flow rate that gives you the best stream.

24 AAPT
Once the oohing and aahing stops, your students will clearly see that the stream projected at 45° (middle stream) with travel the farthest. More importantly, they will see that the 70° and 20° streams hit the ground at the same spot, as do the 60° and 30° streams. This could lead to a discussion about things like the two different ways to get an artillery shell to its target. Also, knowing the angle and measuring either the distance or height of the stream would allow you to calcu-late the initial velocity of the water stream.
For a short video of the Projectile Motion Sprinkler in action go to: https://plus.google.com/114538966003588187094/posts/SfwW7JMgY9d
25Apparatus Competition
Wave MachineName: Thomas B. Greenslade, Jr.Kenyon CollegeGambier, Ohio 43022749 427-2989; [email protected]
Abstract In this transverse wave machine design, sliders that rest on a rotating helical rail move up and down in approximate simple harmonic motion. When the helix is at rest, the tops of the sliders form a sine wave. The key to the design is the wire helix, which can be made with the aid of a simple jig.
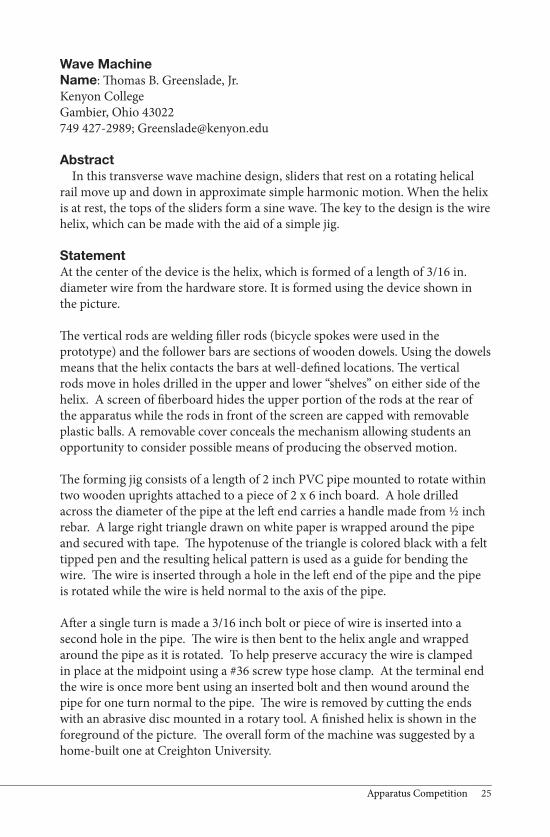
StatementAt the center of the device is the helix, which is formed of a length of 3/16 in. diameter wire from the hardware store. It is formed using the device shown in the picture.
The vertical rods are welding filler rods (bicycle spokes were used in the prototype) and the follower bars are sections of wooden dowels. Using the dowels means that the helix contacts the bars at well-defined locations. The vertical rods move in holes drilled in the upper and lower “shelves” on either side of the helix. A screen of fiberboard hides the upper portion of the rods at the rear of the apparatus while the rods in front of the screen are capped with removable plastic balls. A removable cover conceals the mechanism allowing students an opportunity to consider possible means of producing the observed motion.
The forming jig consists of a length of 2 inch PVC pipe mounted to rotate within two wooden uprights attached to a piece of 2 x 6 inch board. A hole drilled across the diameter of the pipe at the left end carries a handle made from ½ inch rebar. A large right triangle drawn on white paper is wrapped around the pipe and secured with tape. The hypotenuse of the triangle is colored black with a felt tipped pen and the resulting helical pattern is used as a guide for bending the wire. The wire is inserted through a hole in the left end of the pipe and the pipe is rotated while the wire is held normal to the axis of the pipe.
After a single turn is made a 3/16 inch bolt or piece of wire is inserted into a second hole in the pipe. The wire is then bent to the helix angle and wrapped around the pipe as it is rotated. To help preserve accuracy the wire is clamped in place at the midpoint using a #36 screw type hose clamp. At the terminal end the wire is once more bent using an inserted bolt and then wound around the pipe for one turn normal to the pipe. The wire is removed by cutting the ends with an abrasive disc mounted in a rotary tool. A finished helix is shown in the foreground of the picture. The overall form of the machine was suggested by a home-built one at Creighton University.

26 AAPT
Apparatus Title: 3-D Vectors on the TabletopName: Roger Key and David BezinqueFresno State Physics Dept.2345 E San Ramon Ave, MS-MH37, Fresno CA, 93740559-278-2728, [email protected]
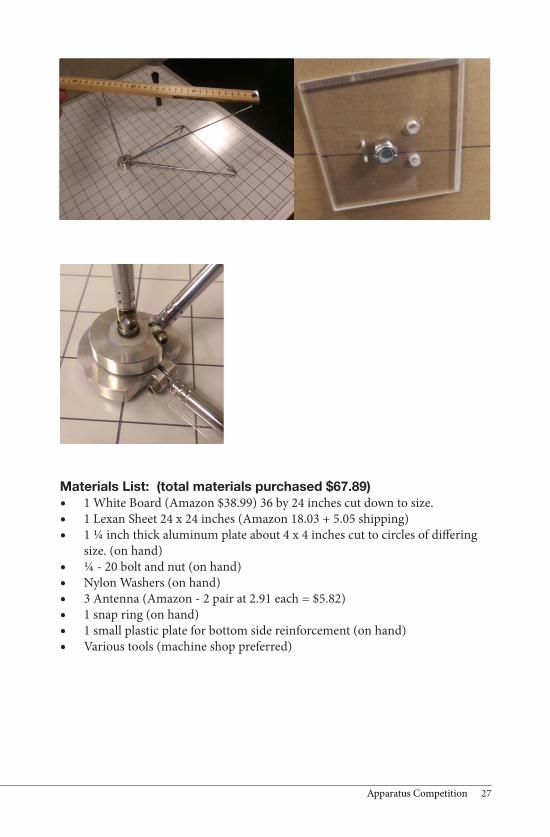
Abstract: An apparatus for teaching three dimensional vectors. A position (+ or -) on the x-y plane can be drawn (and erased) with whiteboard markers then pointed to with a continuously variable length pointer. The z-component (+ only) is another pointer, and the resultant is a third pointer. The innovative part of this demonstration is all three pointers rotate independently and share the same origin.
Construction of Apparatus:The x-y plane is constructed from a cut-down whiteboard and a 1-inch grid was drawn on it with a permanent marker. It was then covered with a plastic sheet so it can be used with whiteboard markers. The pivot is made from a ¼ - 20 bolt that was machined to have a groove for the snap ring and a slot at the end for the top pointer. The head was cut off the bolt, and a die grinder with a cutoff wheel was used to cut the slot. Holes were drilled for the screw that holds the pointer (antenna) in place, with one side threaded to accept the screw that came with the antenna. The normally threaded part of the bold was used to fasten it to the whiteboard with a nylock nut.
The attachment rings were made from 2” round aluminum stock, and turned on the lathe to the needed size. A mill was used to mill a flat with the wings for holding the additional antennas. A slot was also cut in the wings with die grinder and cutoff wheel to accept the antennas. Again, these are drilled, with one side tapped, to accept the screws that came with the antennas.Thin nylon washers are placed between all the rotating components and the nut was adjusted to provide gentle pressure to give some small amount of friction between the rotating parts to hold them in position. A scrap piece of plastic provides the pressure on the bottom of the board.
27Apparatus Competition
Materials List: (total materials purchased $67.89)• 1 White Board (Amazon $38.99) 36 by 24 inches cut down to size.• 1 Lexan Sheet 24 x 24 inches (Amazon 18.03 + 5.05 shipping)• 1 ¼ inch thick aluminum plate about 4 x 4 inches cut to circles of differing
size. (on hand)• ¼ - 20 bolt and nut (on hand)• Nylon Washers (on hand)• 3 Antenna (Amazon - 2 pair at 2.91 each = $5.82)• 1 snap ring (on hand)• 1 small plastic plate for bottom side reinforcement (on hand)• Various tools (machine shop preferred)

28 AAPT
Apparatus Title:No-Touch Counter Modification for Counting RotationsName: Roger KeyFresno State Physics Dept.2345 E San Ramon Ave, MS-MH37, Fresno CA, 93740559-278-2728, [email protected]
Abstract: An economical pedometer is modified to count rotations.
Construction of Apparatus:A pedometer is easily modified with a magnetic reed switch to count events as a magnet passes by. This can be used to count rotations of almost any apparatus. We have used this to count rotations of the crank handle on the Pasco Mechanical Equivalent of Heat Apparatus, TD-8551A. Pedometers were purchased on eBay for less than $1 each and shipped from China. They were easy to disassemble by removal of some small screws on the back.
The metal bar and wire/spring were removed – in normal operation, walking would cause the large/massive metal bar to rotate down and contact the wire seen near the battery.
We replace this with a reed switch soldered across the contacts, and conceal the switch inside the case on the left side – reassemble the pedometer and leave off the belt clip. Use some “quake hold” or something similar to stick the counter to a convenient surface, and more quake hold fastens a magnet to the aluminum handle of the crank.

29Apparatus Competition
Materials List: (total materials purchased – less than $20 for one, add about $1 for each additional)• 1 Pedometer ($0.99 with free shipping from China – eBay)• 1 Reed Switch, Normally Open (pack of 10 for $3.98, free shipping - eBay)• Plasti-Tac / Quake Hold putty / Uhu Tac or similar (as low as $1.99 as an
add-on item from Amazon)• 1 Magnet (Ceramic pack of 20 for about $10 on Amazon)

30 AAPT
Apparatus Title: LED Arrows to Show Direction of Electric Current FlowName: Roger KeyFresno State Physics Dept.2345 E San Ramon Ave, MS-MH37, Fresno CA, 93740559-278-2728, [email protected]
Abstract: A small box with arrows fashioned from an array of multicolor LED’s show the direction of electric current flow. Switching between conventional current and electron current is possible with a pushbutton switch.
Construction of Apparatus:Three-color LED’s are arranged and wired with a Hall-Effect sensor and an Arduino nano in such a way to light up different color arrows indicating a direction of electric current flow. A simplified version could be used as a quick test for N or S poles of a magnet.
Three-color RGB LED’s are used to show multiple colors from the same LED’s. A “double arrow” arrangement is drilled in a small project box and the LED’s are soldered such that one color lights up as an arrow in one direction, and another
color lights up as an arrow in the other direction. (Fig. 1) The ACS712 Hall Effect current sensor passes a current through from J1 to J2 without coming into direct electrical contact with the rest of the circuit, while sensing the strength and direction of the current up to 30 amps. The arrow LED’s are broken into three LED’s representing three groups of LED’s in the arrow for the schematic.

31Apparatus Competition
As seen in fig. 1, the left and right arrowheads include 4 LEDs each, and the center stem includes 5 LEDs. Balance the current through whatever number of LEDs you use with the current limiting resistor, R1. The Arrows are turned on and off by the outputs of the Arduino Nano based on the value returned by the current sensor.
Pressing the pushbutton switch will reverse the direction of the arrows. This is provided for switching between displaying the direction of electron current or conventional current.
The schematic depicts a 9V battery as the power source, but with a little creativity one could substitute many alternatives here.
By mounting the sensor near the surface of the enclosure, it can also sense external magnetic fields, and light up the indicator LEDs when either the N or S pole of a magnet are brought near.
This project was conceived because we desired a way to visualize the current flow through parallel and anti-parallel wires. This project accomplishes this goal, and more.
The proto-board shown below is not actually used in the project. Each component is on it’s own breakout board and wires connect them in the enclosure.

32 AAPT
Materials List: (total materials less than $30 for 2 or more)• Arduino Nano ($2.73 on eBay from China)• Enclosure (5 for $4.92 eBay from China)• ACS712 current sensor ($1.73 each eBay from China)• Momentary Pushbutton switch (10 for $2.66 + 1.98 shipping eBay from
China)• Normally Open Momentary Pushbutton switch (about $1 ea on eBay)• LED’s – RGB 3 color $3.79 for 50 eBay from China• 2 x Banana sockets (10 for $1.88 eBay from China)• Various wire
Arduino Code:// Initialize Pinsint sensePin=4;int VplusPin=7;int BUTTON = 5;float direction1 = 1;float direction2 = 0;
void setup(){ pinMode(4,INPUT); pinMode(6,OUTPUT);

33Apparatus Competition
pinMode(7,INPUT); pinMode(2,OUTPUT); pinMode(3,OUTPUT); analogReference(DEFAULT); Serial.begin(9600);}
// Determine the center value for the sensor from the battery voltage
void loop(){ float centerval = (analogRead(VplusPin)/2);
// output to serial for troubleshooting – can be discarded later Serial.print(“VplusPin = “); Serial.print(analogRead(VplusPin)); Serial.print(“ sensePin = “); Serial.print(analogRead(sensePin)); Serial.print(“ D1 = “); Serial.print(direction1); Serial.print(“ D2 = “); Serial.print(direction2); Serial.print(“ CenterVal = “); Serial.println(centerval);
// Swap the output colors if button is pressed if(digitalRead(BUTTON) == HIGH) { if(direction1 == 0){ direction1 = 1; direction2 = 0;} else{ direction1 = 0; direction2 = 1;} // flash both arrows for 1 second to indicate direction change
digitalWrite(6,HIGH); delay(1000); digitalWrite(6,LOW); } // Sense and display current on arrows
if(direction1 == 1){ if(analogRead(sensePin) > centerval+10) {

34 AAPT
digitalWrite(3,direction1); } else { digitalWrite(3,direction2); }
if(analogRead(sensePin) < centerval-10) { digitalWrite(2,direction1); } else { digitalWrite(2,direction2); } } else{ if(analogRead(sensePin) > centerval+10) { digitalWrite(2,direction2); } else { digitalWrite(2,direction1); }
if(analogRead(sensePin) < centerval-10) { digitalWrite(3,direction2); } else { digitalWrite(3,direction1); } }}

35Apparatus Competition
Apparatus Title:An Experiment to Illustrate the Differences in Electrical Resistance wrt Temperature of Conductors and SemiconductorsName: Roger KeyFresno State Physics Dept.2345 E San Ramon Ave, MS-MH37, Fresno CA, 93740559-278-2728, [email protected]
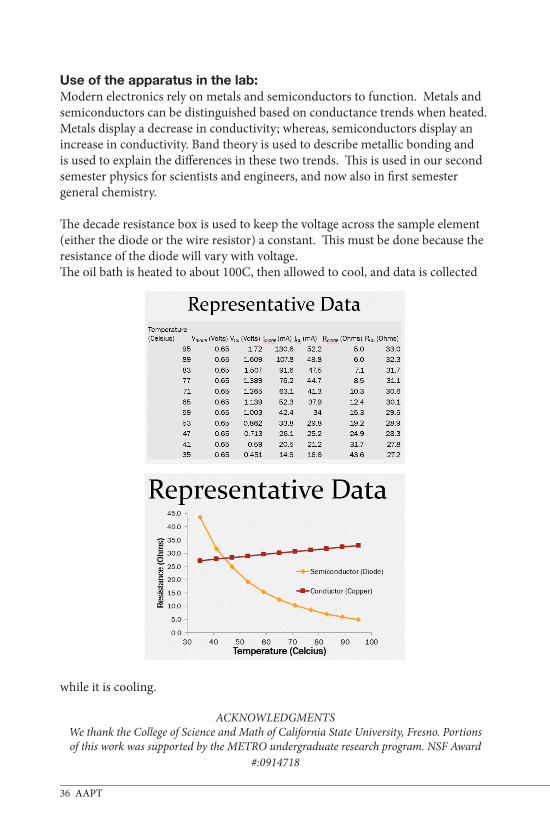
Abstract: By sending electrical current through a copper coil and a diode at various temperatures and measuring the change in resistance of these materials as the temperature changes, students are introduced to some of the key differences between conductors and semi-conductors and their applications. The conductivity of semiconductors increases as they are heated, while metals become more resistive as they are heated. This laboratory experiment was designed to help students understand band gap theory, specifically the difference between conductors and semiconductors.
Construction of Apparatus:A copper wire and a diode are suspended in an oil bath on a hot plate to achieve temperature control (dotted line). A simple circuit is then build around the resistor/diode combination to determine the resistance of each element by way of Ohm’s Law. Since the resistance of the diode depends on both the voltage across it AND the temperature, we use a variable resistor (decade resistance box) to keep the voltage constant on the diode across all temperatures. A dry cell or a power supply may be used as the voltage source. Our experience is that data collection is easier and less prone to errors when the temperature of the bath is initially elevated, then data is collected while it is allowed to cool slowly to room temperature
36 AAPT
Use of the apparatus in the lab:Modern electronics rely on metals and semiconductors to function. Metals and semiconductors can be distinguished based on conductance trends when heated. Metals display a decrease in conductivity; whereas, semiconductors display an increase in conductivity. Band theory is used to describe metallic bonding and is used to explain the differences in these two trends. This is used in our second semester physics for scientists and engineers, and now also in first semester general chemistry.
The decade resistance box is used to keep the voltage across the sample element (either the diode or the wire resistor) a constant. This must be done because the resistance of the diode will vary with voltage. The oil bath is heated to about 100C, then allowed to cool, and data is collected
while it is cooling.
ACKNOWLEDGMENTSWe thank the College of Science and Math of California State University, Fresno. Portions of this work was supported by the METRO undergraduate research program. NSF Award
#:0914718
37Apparatus Competition
Apparatus Title: Inexpensive Dramatic Pneumatic LiftName: Robert A. Morse
Address: ! 5530 Nevada Ave, NW! ! Washington, DC 20015Phone: ! 202-537-0759e-mail:! [email protected]
Abstract (50-‐75 words): An empty 2 liter soda bo2le and a disk cut from foam insula7on board can be used to make an inexpensive pneuma7c li:. The li: can be used to raise a 10 N or so weight by blowing into a plas7c tube. This is a drama7c demonstra7on of Pascal’s principle using air. The apparatus could be modified by adding a pressure gauge or sensor to allow quan7ta7ve calcula7ons.
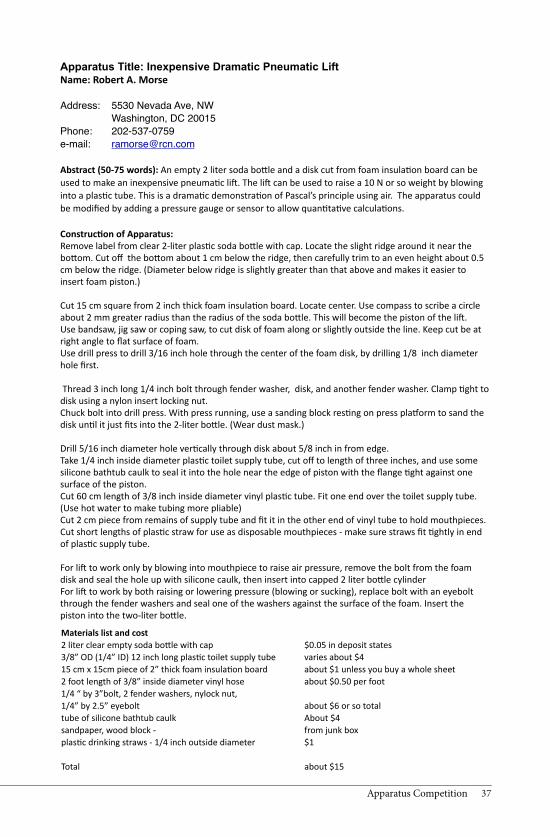
Construc<on of Apparatus:Remove label from clear 2-‐liter plas7c soda bo2le with cap. Locate the slight ridge around it near the bo2om. Cut off the bo2om about 1 cm below the ridge, then carefully trim to an even height about 0.5 cm below the ridge. (Diameter below ridge is slightly greater than that above and makes it easier to insert foam piston.)
Cut 15 cm square from 2 inch thick foam insula7on board. Locate center. Use compass to scribe a circle about 2 mm greater radius than the radius of the soda bo2le. This will become the piston of the li:.Use bandsaw, jig saw or coping saw, to cut disk of foam along or slightly outside the line. Keep cut be at right angle to flat surface of foam. Use drill press to drill 3/16 inch hole through the center of the foam disk, by drilling 1/8 inch diameter hole first.
Thread 3 inch long 1/4 inch bolt through fender washer, disk, and another fender washer. Clamp 7ght to disk using a nylon insert locking nut. Chuck bolt into drill press. With press running, use a sanding block res7ng on press pla[orm to sand the disk un7l it just fits into the 2-‐liter bo2le. (Wear dust mask.)
Drill 5/16 inch diameter hole ver7cally through disk about 5/8 inch in from edge. Take 1/4 inch inside diameter plas7c toilet supply tube, cut off to length of three inches, and use some silicone bathtub caulk to seal it into the hole near the edge of piston with the flange 7ght against one surface of the piston.Cut 60 cm length of 3/8 inch inside diameter vinyl plas7c tube. Fit one end over the toilet supply tube. (Use hot water to make tubing more pliable) Cut 2 cm piece from remains of supply tube and fit it in the other end of vinyl tube to hold mouthpieces. Cut short lengths of plas7c straw for use as disposable mouthpieces -‐ make sure straws fit 7ghtly in end of plas7c supply tube.
For li: to work only by blowing into mouthpiece to raise air pressure, remove the bolt from the foam disk and seal the hole up with silicone caulk, then insert into capped 2 liter bo2le cylinderFor li: to work by both raising or lowering pressure (blowing or sucking), replace bolt with an eyebolt through the fender washers and seal one of the washers against the surface of the foam. Insert the piston into the two-‐liter bo2le.
Materials list and cost2 liter clear empty soda bo2le with cap $0.05 in deposit states3/8” OD (1/4” ID) 12 inch long plas7c toilet supply tube varies about $415 cm x 15cm piece of 2” thick foam insula7on board about $1 unless you buy a whole sheet2 foot length of 3/8” inside diameter vinyl hose about $0.50 per foot1/4 “ by 3”bolt, 2 fender washers, nylock nut, 1/4” by 2.5” eyebolt about $6 or so totaltube of silicone bathtub caulk About $4sandpaper, wood block -‐ from junk boxplas7c drinking straws -‐ 1/4 inch outside diameter $1
Total about $15
Use of Apparatus:
Hold bo2le in one hand and blow or suck through the tube to raise or lower piston. Place weight on piston – you can easily raise it by blowing through tube. If several people are to use it, use short length of plas7c drinking straw fit into the short piece of toilet supply tube as disposable mouthpiece.
The second version of apparatus allows you to hang a weight from the eye hook and raise it by suc7on.Passing device around a class gives a drama7c feeling for the effect of surface area on total force when pressure is everywhere the same.
Extension: Connect pressure sensor or gauge to tube using t-‐fifng. Measure the pressure above atmospheric and area of disk to determine force applied. Compare with weight. You can calculate the force that is being exerted by your breath at the entry of the tube from area of tube and pressure.
Plastic toilet supply tube cut into pieces

38 AAPT
Materials list and cost2 liter clear empty soda bo2le with cap $0.05 in deposit states3/8” OD (1/4” ID) 12 inch long plas7c toilet supply tube varies about $415 cm x 15cm piece of 2” thick foam insula7on board about $1 unless you buy a whole sheet2 foot length of 3/8” inside diameter vinyl hose about $0.50 per foot1/4 “ by 3”bolt, 2 fender washers, nylock nut, 1/4” by 2.5” eyebolt about $6 or so totaltube of silicone bathtub caulk About $4sandpaper, wood block -‐ from junk boxplas7c drinking straws -‐ 1/4 inch outside diameter $1
Total about $15
Use of Apparatus:
Hold bo2le in one hand and blow or suck through the tube to raise or lower piston. Place weight on piston – you can easily raise it by blowing through tube. If several people are to use it, use short length of plas7c drinking straw fit into the short piece of toilet supply tube as disposable mouthpiece.
The second version of apparatus allows you to hang a weight from the eye hook and raise it by suc7on.Passing device around a class gives a drama7c feeling for the effect of surface area on total force when pressure is everywhere the same.
Extension: Connect pressure sensor or gauge to tube using t-‐fifng. Measure the pressure above atmospheric and area of disk to determine force applied. Compare with weight. You can calculate the force that is being exerted by your breath at the entry of the tube from area of tube and pressure.
Plastic toilet supply tube cut into pieces
Two pistons. Left - positive pressure only ! ! Assembled apparatus - Right - positive or negative pressure! ! ! positive pressure version
Apparatus in use - lifting water Þlled bottle

39Apparatus Competition
1
Apparatus Competition 2015 AAPT Summer Meeting
College Park, MD
Apparatus Title: A marble roller coaster with jumping-off points: A demonstration on “impetus” Name: Ralph McGrew
[SUNY Broome Community College emeritus]
Address: 9 Hickory Road, Binghamton, NY 13905 1347
Phone: 607 722 0467
E-mail: [email protected]
Abstract Pieces of “Hot Wheels” track can be assembled in eight configurations on a vertical panel. A marble rolling on the track is shown to move along a straight line after being projected vertically. In contrast, it deviates from a straight line after horizontal projection, contradicting the historic “impetus” theory. Observations allow reviewing Newton’s laws, circular motion, projectile motion, and the work-energy theorem. Symbolic and numerical problems are based on the apparatus.
[Note: The following directions for construction and suggestions for use are very complete. If a briefer view is desired, please read under “Use of Apparatus” the introductory section (pages 12-14) and configurations A, B, D, and E (pages 15-17 and 18-23).]
Construction of Apparatus
Materials list Source Unit price Price
“Hot Wheels Workshop: Loop” toy Toys Я Us $ 4.99 $ 4.99
3 pieces extra “Hot Wheels” straight track with connectors Toys Я Us 3 1.19 3.57 Plastic ball, 1 inch diameter Toys Я Us 0.50 0.50 2 pieces plywood, 2 ft 4 ft 0.52 cm Lowe’s Home 2 5.03 10.06 3 pine strips, nominal 1 inch 2 inch 4 ft Improvement 3 2.48 7.44 Pine board, nominal 1 inch 6 inch 4 ft Warehouse 7.92 7.92 Wood strip, actual 3.0 cm 3.4 cm 22 cm Lowe’s 0.45 0.45 2 aluminum strips, 1/16 in 1 in 3 ft Lowe’s 2 5.38 10.76
20 (1 ¼ in) flat head wood screws Lowe’s 20 0.155 3.10
2
12 (1 ¼ in) pan head wood or sheet metal screws Lowe’s 12 0.155 1.86
4 (¾ in) pan head wood or sheet metal screws Lowe’s 4 0.0755 0.31
2 (¼ in) pan head wood or sheet metal screws Lowe’s 2 0.0517 0.10
2 (½ in) washers Lowe’s 2 0.16 0.32
3 (½ in) flat head wood screws Lowe’s 3 0.062 0.19
3 (2 in) carriage bolts, ¼ in, 20 threads/in Lowe’s 3 0.14 0.42
(3 ½ in) carriage bolt, ¼ in, 20 threads/in Lowe’s 0.22 0.22
4 wing nuts, ¼ in diameter, 20 threads/in Lowe’s 4 0.62 2.48
Cardboard box, maximum dimension 24 in Staples 3.49 3.49
Varnish negligible
3 Post-it notes negligible
Kleenex tissue negligible ______
Total $ 58.18
Steps of construction
One of the sheets of plywood you will use full size for a vertical panel or backboard. From the other sheet, cut the apparatus base as a piece 4 ft = 121.9 cm by 28.5 cm. (The remainder of this sheet you can use for another project.) Cut one of the nominal 1 inch by 2 inch strips to an actual length of 117.7 cm—this will be the front lip of the base. Cut both of the nominal 1 inch by 2 inch strips to an actual length of 114.3 cm—they will fit on the base behind the vertical panel. The nominal 1 inch by 6 inch board should have actual dimensions 2.0 cm by 14.0 cm by 121.9 cm. From it cut two sections 40.0 cm long, with cuts accurately perpendicular to the edges of the board. Then cut each section into two trapezoids like this:
3.4 cm 36.6 cm 3.4 cm 36.6 cm
14.0 cm
36.6 cm 3.4 cm 36.6 cm 3.4 cm
The four identical trapezoids will form braces at the ends of the apparatus to support the vertical panel. File edges and sand the pieces of wood as desired.

40 AAPT
2
12 (1 ¼ in) pan head wood or sheet metal screws Lowe’s 12 0.155 1.86
4 (¾ in) pan head wood or sheet metal screws Lowe’s 4 0.0755 0.31
2 (¼ in) pan head wood or sheet metal screws Lowe’s 2 0.0517 0.10
2 (½ in) washers Lowe’s 2 0.16 0.32
3 (½ in) flat head wood screws Lowe’s 3 0.062 0.19
3 (2 in) carriage bolts, ¼ in, 20 threads/in Lowe’s 3 0.14 0.42
(3 ½ in) carriage bolt, ¼ in, 20 threads/in Lowe’s 0.22 0.22
4 wing nuts, ¼ in diameter, 20 threads/in Lowe’s 4 0.62 2.48
Cardboard box, maximum dimension 24 in Staples 3.49 3.49
Varnish negligible
3 Post-it notes negligible
Kleenex tissue negligible ______
Total $ 58.18
Steps of construction
One of the sheets of plywood you will use full size for a vertical panel or backboard. From the other sheet, cut the apparatus base as a piece 4 ft = 121.9 cm by 28.5 cm. (The remainder of this sheet you can use for another project.) Cut one of the nominal 1 inch by 2 inch strips to an actual length of 117.7 cm—this will be the front lip of the base. Cut both of the nominal 1 inch by 2 inch strips to an actual length of 114.3 cm—they will fit on the base behind the vertical panel. The nominal 1 inch by 6 inch board should have actual dimensions 2.0 cm by 14.0 cm by 121.9 cm. From it cut two sections 40.0 cm long, with cuts accurately perpendicular to the edges of the board. Then cut each section into two trapezoids like this:
3.4 cm 36.6 cm 3.4 cm 36.6 cm
14.0 cm
36.6 cm 3.4 cm 36.6 cm 3.4 cm
The four identical trapezoids will form braces at the ends of the apparatus to support the vertical panel. File edges and sand the pieces of wood as desired.
3
Refer to this overall view from the front:
Figure 1.
This overall view from the rear:
Figure 2.
4
This end view:
Figure 3.
This detail of an end brace on the front side:
Figure 4.

41Apparatus Competition
5
This detail of an end brace on the back side:
Figure 5.
And this view of the base from below:
Figure 6.
Guided by Figures 1 through 6, assemble the nine wooden pieces with twenty 1 ¼ inch flat head screws through the base and twelve 1 ¼ inch pan head screws through the vertical panel into the end braces. Countersink the flat head screws so that they will not scratch the table under the apparatus. The horizontal strip immediately behind the vertical panel is fastened to this panel by four ¾ inch screws and is fastened to the base by four of the 1 ¼ inch flat head mentioned first.
Use two ¼ screws and two washers to install the base of the Hot Wheels loop in the location shown in Figure 1 and as shown in this detail:
6
Figure 7.
As in the overall view from the front (Figure 1), we define an origin of coordinates at the bottom left corner of the vertical panel, outside the end braces. On the vertical panel mark the eight locations with these coordinates: (11.2 cm horizontal, 50.9 cm vertical), (19.0 cm, 57.0 cm), (31.3 cm, 36.9 cm), (49.3 cm, 24.4 cm), (72.3 cm, 25.5 cm), (80.1 cm, 18.6 cm), (114.9 cm, 51.2 cm), and (117.5 cm, 56.1 cm). Holes of diameter ¼ inch will be drilled near each of these points to support the attachment tracks in various configurations. I recommend building the attachment tracks and then “transfer drilling,” to get the holes in the right places to make track sections vertical or horizontal or without kinks between them, as shown in the “Use of Apparatus” directions below. But now use a drill and a jigsaw to cut a hole of suitable size below the top edge as a carrying handle.
Cut the 3.0 cm by 3.4 cm wood strip into sections of length 9.5 cm, 7.5 cm, and 4.7 cm, for use in attachment parts 1, 8, and 9, respectively. File and sand as desired. Cut one aluminum strip into sections of length 45.8 cm, 42.7 cm, and about 2.7 cm, for use in these same attachment parts. The first two of these aluminum strips will slide permanently into the undersides of straight Hot Wheels tracks—observe that they will fit snugly. Before sliding the aluminum strips into their plastic channels, you must install a wooden block onto each aluminum strip. For attachment 1, use Figure 8 through 10 to guide preparation of the block.

42 AAPT
6
Figure 7.
As in the overall view from the front (Figure 1), we define an origin of coordinates at the bottom left corner of the vertical panel, outside the end braces. On the vertical panel mark the eight locations with these coordinates: (11.2 cm horizontal, 50.9 cm vertical), (19.0 cm, 57.0 cm), (31.3 cm, 36.9 cm), (49.3 cm, 24.4 cm), (72.3 cm, 25.5 cm), (80.1 cm, 18.6 cm), (114.9 cm, 51.2 cm), and (117.5 cm, 56.1 cm). Holes of diameter ¼ inch will be drilled near each of these points to support the attachment tracks in various configurations. I recommend building the attachment tracks and then “transfer drilling,” to get the holes in the right places to make track sections vertical or horizontal or without kinks between them, as shown in the “Use of Apparatus” directions below. But now use a drill and a jigsaw to cut a hole of suitable size below the top edge as a carrying handle.
Cut the 3.0 cm by 3.4 cm wood strip into sections of length 9.5 cm, 7.5 cm, and 4.7 cm, for use in attachment parts 1, 8, and 9, respectively. File and sand as desired. Cut one aluminum strip into sections of length 45.8 cm, 42.7 cm, and about 2.7 cm, for use in these same attachment parts. The first two of these aluminum strips will slide permanently into the undersides of straight Hot Wheels tracks—observe that they will fit snugly. Before sliding the aluminum strips into their plastic channels, you must install a wooden block onto each aluminum strip. For attachment 1, use Figure 8 through 10 to guide preparation of the block.
7
Figure 8 Figure 9
Figure 10
Cut the groove shown in Figure 9 so that the wood will not touch the plastic directly to distort it. Drill two ¼ inch holes through the block and put 2-inch carriage bolts through them, secured with wing nuts. In the aluminum drill a hole to accommodate the shank of a ½ inch flat head screw. Use a hammer and a punch to dimple the aluminum so that the screw will be in effect countersunk. Then firmly screw the aluminum strip onto the wooden block. Next, carefully slide the aluminum strip all the way into the channel on the underside of the plastic track. The attachment screw should not make a significant bump in the plastic track. Mark this part as 1.
Attachment parts 2 and 4 are coupling tabs from the Hot Wheels set. Attachment part 3 is a straight track section without modification. Part 5 is a flexible track section without

43Apparatus Competition8
modification. Label them. The base of the loop, screwed into the wooden base, is not assigned a number. Attachment part 6 is a flexible track section without modification and attachment part 7 is a coupling tab. Label them.
Figure 11.
Guided by Figures 12, 13, and 14, construct attachment part 8 from a straight track section, an
Figure 12. Figure 13.
Figure 14.
7
Figure 8 Figure 9
Figure 10
Cut the groove shown in Figure 9 so that the wood will not touch the plastic directly to distort it. Drill two ¼ inch holes through the block and put 2-inch carriage bolts through them, secured with wing nuts. In the aluminum drill a hole to accommodate the shank of a ½ inch flat head screw. Use a hammer and a punch to dimple the aluminum so that the screw will be in effect countersunk. Then firmly screw the aluminum strip onto the wooden block. Next, carefully slide the aluminum strip all the way into the channel on the underside of the plastic track. The attachment screw should not make a significant bump in the plastic track. Mark this part as 1.
Attachment parts 2 and 4 are coupling tabs from the Hot Wheels set. Attachment part 3 is a straight track section without modification. Part 5 is a flexible track section without

44 AAPT
9
aluminum strip 42.7 cm long, a wooden block with an edge removed and a groove cut to avoid direct contact with plastic, a ½ inch screw, and a long carriage bolt with wing nut. The aluminum must be drilled and dimpled as for attachment part 1, so that the plastic track does not have a significant bump in it at the location of the screw.
Guided by these pictures, construct attachment part 9 from a piece of aluminum track 2.7 cm
Figure 15 Figure 16 Figure 17
long, a trimmed block, a ½ inch flat head screw, and a 2 inch carriage bolt with wing nut. This part will temporarily slide onto one end of a flexible track to hold it in position in demonstration configurations C, E, F, and G.
Attachment part 10 is a curved joiner supplied with the Hot Wheels loop kit. Attachment part 11 is a flexible track without modification. Attachment part 12 is a flexible tab supplied with the Hot Wheels loop kit. (You will have two more of these left over.) Label these parts.
Attachment part 13 is formed from two flexible track sections, together 62.5 cm long, threaded onto a strip of aluminum cut to be 55.8 cm long. The compound track is then bent into the approximate shape of clothoids sloping upward and downward. (A clothoid is a spiral with its radius of curvature varying linearly with distance along its arc.)
Figure 18 Figure 19
10
Figure 20.
The diagram in Figure 20 can be printed and enlarged so that the maximum elevation of the loop above its base line is equal to the maximum elevation above its base of the nearly circular loop set up in demonstration configuration D. Then by hand bend the plastic-aluminum track to match the shape, and label it.
Use a sturdy cardboard mailing box to cut, fold, and glue a rectangular box with dimensions 9 cm by 19 cm by 61 cm. It will fit on the rear base of the apparatus and serve as a storage place
Figure 21 Figure 22
for all of the attachment parts. From one of the pieces of cardboard left over, cut out a circle matching the radius of curvature at the top of the clothoid loop. Label it as part 14.
The ball, say about 3 cm in diameter, can be of any solid material much denser than air. It is not given a number. You may want to have another ball of significantly different mass in reserve.

45Apparatus Competition
10
Figure 20.
The diagram in Figure 20 can be printed and enlarged so that the maximum elevation of the loop above its base line is equal to the maximum elevation above its base of the nearly circular loop set up in demonstration configuration D. Then by hand bend the plastic-aluminum track to match the shape, and label it.
Use a sturdy cardboard mailing box to cut, fold, and glue a rectangular box with dimensions 9 cm by 19 cm by 61 cm. It will fit on the rear base of the apparatus and serve as a storage place
Figure 21 Figure 22
for all of the attachment parts. From one of the pieces of cardboard left over, cut out a circle matching the radius of curvature at the top of the clothoid loop. Label it as part 14.
The ball, say about 3 cm in diameter, can be of any solid material much denser than air. It is not given a number. You may want to have another ball of significantly different mass in reserve.
11
As expendable supplies you will need post-it notes, about three for a demonstration, and a Kleenex tissue.
Proceed to assembling the attachment parts into each one of the configurations A through H described and pictured in the “Use of Apparatus” section. Determine where to drill the eight holes in the vertical panel so that:
In configuration A tracks 1, 3, and 5 join smoothly, without sharp changes in slope at their joints.
In configuration B track 8 is vertical.
In configuration C the end of track 6 is vertical and at the same location as in configuration B.
In configuration E track 8 is horizontal and at the same height as the top of the loop in configuration D.
In configuration F the end of track 6 is horizontal and at the same location as the top of the loop in configuration D.
In configuration G track 8 is horizontal and lower in height by very nearly the diameter of the ball.
Then drill the eight holes. The wooden portions of the apparatus can be varnished.
For convenient display at the 2015 AAPT Apparatus Competition, I have added a transparent shield in front of the track to reduce the chance of losing the ball.

46 AAPT
12
Use of Apparatus
Introduction As a physics teacher, you can use this equipment for a demonstration reviewing, most fundamentally, how force affects motion. The review involves projectile motion and circular motion, so it can fit after treatment of Newton’s second law. Alternatively, the demonstration can be done later in the course and can include review of translational kinetic energy or even of both translational and rotational kinetic energy.
In his History of Physics, Florian Cajori wrote in 1917, “The teacher will observe that those parts of mechanics which a beginner usually finds ‘hard to learn’ are the parts which, in the development of the science, were hard to overcome.” These points involve misconceptions that the human mind easily falls into and escapes from only with difficulty. Stated in different words, students can experience confusion when physics theory differs from “common sense.” This demonstration refutes the impetus theory of motion, proposed by Jean Buridan in the 1300’s. It holds that a cannonball, say, is given an impetus in the particular direction it is fired—it is given a motion that is “violent,” meaning contrary to its “natural” tendency to be at rest or to fall straight down. The ball carries its impetus with it in rectilinear motion until, rather suddenly, it switches to falling vertically downward. The theory describes the familiar motion of the cartoon character Wile E. Coyote when he runs off a cliff, as in Figure 23.
Figure 23.
His horizontal and vertical motions are both linear and occur at separate times, with the vertical motion beginning after the horizontal motion ends. We now of course model the horizontal and vertical motions as simultaneous but following different rules according to their different acceleration components. You can show Figure 23 to students at Configuration E or Configuration F in the demonstration. They may also be interested in Figures 24 through 29, which are antique diagrams illustrating the impetus theory.
13
Figure 24. A representation of the motion of a projectile from a gunnery manual of the 1500s.
Figure 25. The trajectory is
divided into “The violent Motion,” “The mixt or Crooked Motion,” and “The naturall Motion.”
Figure 26. From Tartaglia's 1551 treatise on gunnery.

47Apparatus Competition
13
Figure 24. A representation of the motion of a projectile from a gunnery manual of the 1500s.
Figure 25. The trajectory is
divided into “The violent Motion,” “The mixt or Crooked Motion,” and “The naturall Motion.”
Figure 26. From Tartaglia's 1551 treatise on gunnery.
14
Figure 27. Diego Ufano’s 1628 illustration of Tartaglia’s demonstration that maximum range occurs for elevation angle 45 degrees.
Figure 28. From Galileo's 1638 treatise Discourse and Mathematical Demonstrations concerning Two New Sciences, illustrating the modern theory of a freely moving projectile. Note the parabolic trajectories.
Figure 29. Computed motion of a projectile fired through a resistive medium. The numerical calculation shows that a thrown object feeling a strong drag force can follow a trajectory similar in shape to those theorized centuries ago, but with steeply decreasing speed.

48 AAPT
14
Figure 27. Diego Ufano’s 1628 illustration of Tartaglia’s demonstration that maximum range occurs for elevation angle 45 degrees.
Figure 28. From Galileo's 1638 treatise Discourse and Mathematical Demonstrations concerning Two New Sciences, illustrating the modern theory of a freely moving projectile. Note the parabolic trajectories.
Figure 29. Computed motion of a projectile fired through a resistive medium. The numerical calculation shows that a thrown object feeling a strong drag force can follow a trajectory similar in shape to those theorized centuries ago, but with steeply decreasing speed.
15
Step-by-step suggestions. Observe that the attachment parts are numbered 1 through 14.
Configuration A. On the right side of the orange base that is screwed onto the frame, assemble these attachment parts: Straight track 1, which incorporates a wooden block fixed to the vertical panel or backboard by two bolts; coupling tab 2; straight track 3; coupling tab 4; and flexible track 5. These parts will remain fixed throughout. On the left-hand side of the base assemble, as in Figure 30: Flexible track 6, coupling tab 7, and straight track 8 with its wooden block and bolt. Turn track 8 so that it fits close to the backboard.
Figure 30.
Male and also female students will recognize the parts as from a “Hot Wheels” toy. If the pace of the demonstration is reasonably fast, they may anticipate and experience enjoyment, recalling their play as young children. Either the instructor or students can release the ball. Mention to the students that, for simplicity, we use only one ball and always release it from rest. It will always start moving from the right toward the left. For release low, at medium height, and high on the right-hand side, let the students make predictions about the subsequent motion of the ball, and then observe it. They should become familiar with how the height of the release point controls the maximum speed. The turning point on the left-hand side is somewhat lower than the starting point. Trials that appear identical at the start can proceed somewhat differently. Variations happen because, as the ball rolls along the track, it also rolls back and forth across the width of the track. It therefore occasionally hits a lip at a joint between sections and can lose a lot of speed or jump the track entirely.
If at any point students suggest that the mass of the ball would make a difference, you can do an immediate comparison with a different ball you keep in reserve. Show that, so long as the ball

49Apparatus Competition
16
density is much larger than the density of air, the mass or radius makes no significant difference, and then keep using your original ball throughout.
Configuration B. Move the block and bolt for track 8 as in Figure 31, to make vertical the end of track 6 and all of track 8.
Figure 31.
Let the students predict the motions following release of the ball low, at medium height, and high on the right-hand side. It is convenient to mark the medium and high release points with post-it notes. Then observe the motions, case by case. The students should agree that low release causes oscillation as in Configuration A. (It is not necessary to use our letter names for the different configurations in talking with students.) With medium-height release, the ball moves vertically next to the lower portion of the vertical section of track. Now if, compared to the medium height, the ball is released from a height greater by, say, 10 cm, where will the turning point of the motion be? Will it be higher by 10 cm? The motion up and down is purely vertical—the ball “flies off on a tangent” to the end of the curved section of track. Does the ball make any sound as it moves along the vertical track? Given that the track is never exactly straight or exactly vertical, it is satisfactory if the students say that there is some sound. Especially for the highest release point, some students may think that the ball will continue circular motion rather than moving vertically. Suggest this possibility yourself if no student speaks up. Let the students give some reason that it does not happen. They might refer to Newton’s first law, or they might say that the ball has no memory of its previous motion along the curve, but only ‘remembers’ the direction of its motion at the end of the curve. To emphasize
17
that the motion is vertical and to prepare for observing a contrasting motion in Configuration E, take a small strip of tissue paper, like a 2-mm by 40-mm strip cut from a single-ply layer of Kleenex. Dampen both ends of the strip and make it adhere across the vertical section of track about 10 cm above the bottom end, running between the side walls of the track here. After student prediction, show that the ball breaks or moves the paper.
Configuration C. Remove track 8 and tab 7. Use small wooden block 9, with its own bolt, to hold the end of track 6 vertical, in the same location as in the previous trial and as in Figure 32.
Figure 32.
Have the students predict and then observe the motions of the ball after its release from the same tagged starting points. For the fastest motion, some students may predict that the ball will move to the left after leaving the track, as it has been pushing to the left on the curved section of track at the previous points. They may call this a centrifugal effect, often pronouncing it as ‘centrifical.’ You can ask how they would feel if they were riding in a roller-coaster car on a track with this shape—they would feel pushed away from the center of curvature as the car moves upward on the curving section of track. Should motion to the left then be expected after the ball leaves the track? After observation, invite acknowledgement that the motions are the same as in Configuration B, and ask for some way or ways to make sense of this observation. Students may say that the ball moves like a skateboarder or skier in a halfpipe.

50 AAPT
17
that the motion is vertical and to prepare for observing a contrasting motion in Configuration E, take a small strip of tissue paper, like a 2-mm by 40-mm strip cut from a single-ply layer of Kleenex. Dampen both ends of the strip and make it adhere across the vertical section of track about 10 cm above the bottom end, running between the side walls of the track here. After student prediction, show that the ball breaks or moves the paper.
Configuration C. Remove track 8 and tab 7. Use small wooden block 9, with its own bolt, to hold the end of track 6 vertical, in the same location as in the previous trial and as in Figure 32.
Figure 32.
Have the students predict and then observe the motions of the ball after its release from the same tagged starting points. For the fastest motion, some students may predict that the ball will move to the left after leaving the track, as it has been pushing to the left on the curved section of track at the previous points. They may call this a centrifugal effect, often pronouncing it as ‘centrifical.’ You can ask how they would feel if they were riding in a roller-coaster car on a track with this shape—they would feel pushed away from the center of curvature as the car moves upward on the curving section of track. Should motion to the left then be expected after the ball leaves the track? After observation, invite acknowledgement that the motions are the same as in Configuration B, and ask for some way or ways to make sense of this observation. Students may say that the ball moves like a skateboarder or skier in a halfpipe.
18
Configuration D. Remove block 9. Install joiner 10 and flexible track 11 to form a loop as in Figure 33.
Figure 33.
Have the students predict and then observe the motions from low, medium, and high release points. Guide the students to observe that for release below a certain threshold the ball leaves the track on the upward slope to follow a path like this:
It never happens that the ball stops on the loop and drops off by falling straight down. At threshold, the ball can be described as following the loop, or it can be described as leaving the track at a single point, which is the top of the loop. For any release above threshold the ball moves faster overall and goes around the loop, everywhere in contact with it. Involve the students in repeated trials to home in as precisely as possible (within a couple of millimeters) on the threshold release point for the ball’s going around the whole loop. Move one of the post-it notes on the track to permanently tag the threshold release point. Also, place a tag on the backboard at the level of the top of the loop, for reference in the remaining configurations. It is clear that the threshold release point is vertically higher than the top of the loop. The physics course may already include a problem about motion in a vertical circle, either for a bob on the

51Apparatus Competition
18
Configuration D. Remove block 9. Install joiner 10 and flexible track 11 to form a loop as in Figure 33.
Figure 33.
Have the students predict and then observe the motions from low, medium, and high release points. Guide the students to observe that for release below a certain threshold the ball leaves the track on the upward slope to follow a path like this:
It never happens that the ball stops on the loop and drops off by falling straight down. At threshold, the ball can be described as following the loop, or it can be described as leaving the track at a single point, which is the top of the loop. For any release above threshold the ball moves faster overall and goes around the loop, everywhere in contact with it. Involve the students in repeated trials to home in as precisely as possible (within a couple of millimeters) on the threshold release point for the ball’s going around the whole loop. Move one of the post-it notes on the track to permanently tag the threshold release point. Also, place a tag on the backboard at the level of the top of the loop, for reference in the remaining configurations. It is clear that the threshold release point is vertically higher than the top of the loop. The physics course may already include a problem about motion in a vertical circle, either for a bob on the
19
end of a string or for a car on a track. You may wish to include such a problem here in a form like one of these:
A small ice cube starts from rest and slides without friction on a track that slopes down and then makes a circular loop of radius R.
(a) What minimum speed must the ice have at the top of the loop to keep from falling off the track? (b) From what minimum height above the bottom of the loop must the ice start in order to stay on the track all the way around the loop? Answers: (a) (gR)1/2 (b) 2.5R
Students in an algebra-based class will find the problem easier if the radius is given as 6.00 cm instead of R. Answers: (a) 0.767 m/s (b) 0.150 m
A more advanced problem is this:
A uniform ball starts from rest and rolls without slipping on a track in a vertical plane, sloping down and then making a circular loop of radius R, much larger than the radius of the ball. From what minimum height above the bottom of the loop must the ball start in order to stay on the track all the way around the loop? Answer: 2.7R.
Configuration E. Remove joiner 10 and flexible track 11. As in Figure 34, install tabs 7 and 12 on straight track 8. Remove the bolt from the wooden block on this track and pass the bolt through the same hole in the opposite direction. Install track 8, now with a gap between it and the backboard so that it crosses in front of track 3.

52 AAPT
20
Figure 34.
The height of track 8 should be the same as the tag marking the top of the loop in the previous step. Add flexible track 11 to the far end of track 8, so that the circular loop in Configuration D has been replaced with an oval. Block 9 can be added to the bottom end of track 11, without being clamped to the vertical board, to hold this end in position. For a low release point, let the students predict and confirm that the ball rolls up the rising track by less than a quarter-circle, and then rolls back down. What happens when the ball is released at the threshold point determined in Configuration D? Let the students predict and then confirm that the ball stays on the track to the top of the half-circle and then falls away from the track to become a projectile.
It can be instructive to find the ball’s horizontal range in this case, as follows: At the top of the semicircle the normal force exerted by the track on the ball has fallen to zero, so we have F = ma implying –mg = –mv2/R and v = (gR)1/2. The original velocity for the projectile-motion phase has components (gR)1/2 horizontally and 0 vertically. The ball must fall through the vertical distance 2R to reach the base, so for its time of flight we have –2R = 0 – ½ gt2 and t = (4R/g)1/2. Then the horizontal component of displacement from the top of the half-circle to impact on the base is given by x = vxt = (gR)1/2(4R/g)1/2 = 2R. The downward-sloping track 5 may be in the way and interrupt the flight of the ball before it reaches the base level, but qualitative determination of the range of the ball in free flight following its release from the threshold point can show fairly convincingly that it agrees with the diameter of the circle.
Now for the question we have been building up to: If the ball is released from rest at a location say 20 cm higher than the threshold point, how will it move? (Figure 35)

53Apparatus Competition
21
Figure 35. The ball starts high on the track.
Will the ball “fly off on a tangent” as in Configuration B? Will it move along the horizontal section of track? And by 20 cm? (Figure 36.)
Figure 36.
If we release the ball at the very top of track 1, can it go all the way around the oval loop in contact with the track? Some students may agree that the ball’s behavior in Configuration B suggests that it will stay on the horizontal track here. Showing Figures 23 through 29 to all the
22
students may encourage discussion. If some students think that the ball will not move in contact with the horizontal track, what can be the reason for the difference from Configuration B?
Observe the motion of the ball as it starts from locations somewhat above or far above the threshold release point. Does the ball make any sound as it moves past the horizontal track section? If the students disagree about whether the actual motion includes a horizontal section of nonzero length, you can place a small strip of tissue paper running across the track to intercept the motion of the ball perhaps 10 cm to the right of the end where the horizontal track begins. Does the ball break the tissue? (Figure 37.)
Figure 37.
Guide the students to realize that the ball does not move straight along a horizontal line for any nonzero distance. It begins immediately to fall below the tangent line, whatever its horizontal velocity component is, and however nearly flat its overall trajectory is. An important question is then: Why does the ball move just along a vertical line when it leaves a quarter-circle track in Configurations B and C, but fail to keep moving along a horizontal line when it leaves the half-circle track in Configuration E? Students may think of the cause as the unavoidable vertical action of gravity: when it is along the same line as the original velocity, the whole effect of the gravitational acceleration is to change the speed of the ball and to reverse its direction of motion when the speed is zero. When gravity is perpendicular to the original velocity, the gravitational acceleration necessarily changes the direction of the velocity, making the ball’s trajectory curve. Encourage students who may use different words to account for the contrasting motions. I find that pictures of the motions are particularly clear:

54 AAPT
22
students may encourage discussion. If some students think that the ball will not move in contact with the horizontal track, what can be the reason for the difference from Configuration B?
Observe the motion of the ball as it starts from locations somewhat above or far above the threshold release point. Does the ball make any sound as it moves past the horizontal track section? If the students disagree about whether the actual motion includes a horizontal section of nonzero length, you can place a small strip of tissue paper running across the track to intercept the motion of the ball perhaps 10 cm to the right of the end where the horizontal track begins. Does the ball break the tissue? (Figure 37.)
Figure 37.
Guide the students to realize that the ball does not move straight along a horizontal line for any nonzero distance. It begins immediately to fall below the tangent line, whatever its horizontal velocity component is, and however nearly flat its overall trajectory is. An important question is then: Why does the ball move just along a vertical line when it leaves a quarter-circle track in Configurations B and C, but fail to keep moving along a horizontal line when it leaves the half-circle track in Configuration E? Students may think of the cause as the unavoidable vertical action of gravity: when it is along the same line as the original velocity, the whole effect of the gravitational acceleration is to change the speed of the ball and to reverse its direction of motion when the speed is zero. When gravity is perpendicular to the original velocity, the gravitational acceleration necessarily changes the direction of the velocity, making the ball’s trajectory curve. Encourage students who may use different words to account for the contrasting motions. I find that pictures of the motions are particularly clear:
23
For vertical firing For horizontal firing
motion free body diagram motion free body diagram
Using a free body diagram in reasoning to answer a question is a very good idea. A free body diagram is not just a step in solving a mathematical problem.
Note: On a fundamental level, one can say that people can adhere to an impetus theory because they confuse motion with change in motion. If the motion is horizontal, they cannot see how the change in motion can be quite different, namely vertical. The same confusion appears in some students’ idea that the acceleration must be zero at the top of the flight of an object thrown vertically upward, because the velocity is zero there. This confusion between a quantity and its rate of change does not appear just in physics, and in some everyday-life situations the mix-up does not lead to serious difficulties. For example, some people would think of a clean kitchen as a room in which the absolute quantity of dirt is small. Others would call the room clean only if it has been cleaned in the recent past, so that it is now cleaner than it was, say, a few days ago. Again, some people call a person wealthy if he or she has a high net worth, without regard for their income. Others would say a person is wealthy if his or her disposable income is high and dependable, without regard for their net worth. Either criterion is reasonable, as both account for the person’s being able to spend money at a high rate for a long time.
Configuration F. If some students were surprised or intrigued by the results of Configuration C, by all means include this part of the demonstration; but otherwise it is not logically necessary. Remove block 9, curved track 11, straight track 8, and coupling tabs 7 and 12. Install block 9 to hold the end of flexible track 6 upside down, horizontal, and in the same location is in the last two configurations, as in Figure 38.
mg mg

55Apparatus Competition
24
Figure 38.
Let the students predict the motions of the ball following its release from the same points as in the last configuration: below threshold, at threshold, above threshold, and far above threshold. Ask the students to arrive at statements that are consistent with each other about the motions in Configurations E and F, with and without the horizontal straight track tangent to the semicircle at its highest point. Then observe the motions and note that they appear identical between Configurations E and F. Guide the students to realize that the ball does not move upward after leaving the semicircle and does not exert an upward force on a horizontal track here, however hard it was pushing up on the curved track just before it reached the end.
Configuration G. This configuration is optional. As further evidence that the horizontally-fired ball does not move more than an infinitesimal distance in pure horizontal motion, ask if we could constrain the ball to move horizontally after it leaves the semicircular track. Would that constraint cause a significant change in its motion? Answer: we can place the straight track section horizontal and below the top of the loop. Install track 8 here, as in Figure 39.
23
For vertical firing For horizontal firing
motion free body diagram motion free body diagram
Using a free body diagram in reasoning to answer a question is a very good idea. A free body diagram is not just a step in solving a mathematical problem.
Note: On a fundamental level, one can say that people can adhere to an impetus theory because they confuse motion with change in motion. If the motion is horizontal, they cannot see how the change in motion can be quite different, namely vertical. The same confusion appears in some students’ idea that the acceleration must be zero at the top of the flight of an object thrown vertically upward, because the velocity is zero there. This confusion between a quantity and its rate of change does not appear just in physics, and in some everyday-life situations the mix-up does not lead to serious difficulties. For example, some people would think of a clean kitchen as a room in which the absolute quantity of dirt is small. Others would call the room clean only if it has been cleaned in the recent past, so that it is now cleaner than it was, say, a few days ago. Again, some people call a person wealthy if he or she has a high net worth, without regard for their income. Others would say a person is wealthy if his or her disposable income is high and dependable, without regard for their net worth. Either criterion is reasonable, as both account for the person’s being able to spend money at a high rate for a long time.
Configuration F. If some students were surprised or intrigued by the results of Configuration C, by all means include this part of the demonstration; but otherwise it is not logically necessary. Remove block 9, curved track 11, straight track 8, and coupling tabs 7 and 12. Install block 9 to hold the end of flexible track 6 upside down, horizontal, and in the same location is in the last two configurations, as in Figure 38.
mg mg

56 AAPT
25
Figure 39.
Let the students predict the motions for the ball released at threshold, somewhat above threshold, and far above threshold. Observe the motions. They are quite different from those in Configurations E and F. The ball comes to roll surprisingly slowly along the horizontal track. It moves so slowly because it is rotating counterclockwise as it rolls off the end of the curved section of track. Sliding friction must bring this rotation to a stop and replace it with clockwise rotation, as the ball comes to roll along the straight track.
Configuration H. This configuration is also optional. Loop-the-loop roller coasters are so popular that it is good to have a more realistic model of one. A public roller coaster never has a circular loop in a vertical plane. The students can learn why from the problem below: At the bottom of a vertical circular loop a cart that moves with constant mechanical energy exerts a normal force on each passenger that is larger than the normal force at the top by six times the passenger’s weight. Forces on the passenger’s internal organs are correspondingly large. Such strong forces would be dangerous and intensely uncomfortable. To make a model of a more practical clothoid loop, remove flexible tracks 6 and 11, straight track 8, coupling tabs 7 and 12, and block 9. Install curved track 13 as in Figure 40. Point out that the top of the new loop is at the same height as the top of the previous circular loop.
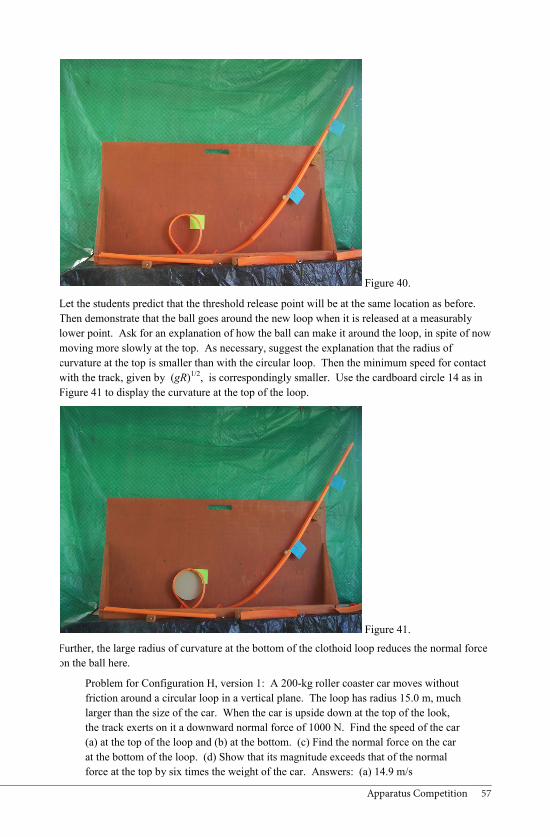
57Apparatus Competition
26
Figure 40.
Let the students predict that the threshold release point will be at the same location as before. Then demonstrate that the ball goes around the new loop when it is released at a measurably lower point. Ask for an explanation of how the ball can make it around the loop, in spite of now moving more slowly at the top. As necessary, suggest the explanation that the radius of curvature at the top is smaller than with the circular loop. Then the minimum speed for contact with the track, given by (gR)1/2, is correspondingly smaller. Use the cardboard circle 14 as in Figure 41 to display the curvature at the top of the loop.
Figure 41.
27
Further, the large radius of curvature at the bottom of the clothoid loop reduces the normal force on the ball here.
Problem for Configuration H, version 1: A 200-kg roller coaster car moves without friction around a circular loop in a vertical plane. The loop has radius 15.0 m, much larger than the size of the car. When the car is upside down at the top of the look, the track exerts on it a downward normal force of 1000 N. Find the speed of the car (a) at the top of the loop and (b) at the bottom. (c) Find the normal force on the car at the bottom of the loop. (d) Show that its magnitude exceeds that of the normal force at the top by six times the weight of the car. Answers: (a) 14.9 m/s (b) 28.5 m/s (c) 12.8 kN up (d) 12.8 kN – 1.00 kN = 6 1.96 kN
Problem for Configuration H, version 2: A person rides in a single roller coaster car that glides without friction around a circular loop in a vertical plane. The car is small compared to the radius of the loop and moves sufficiently fast that it does not fall from the track when it is upside down. Show that the normal force on the person at the bottom of the loop exceeds the normal force at the top by six times the weight of the person.
Additional problems. These problems can be used for homework or on examinations after the demonstration. The first three are variations on the same theme, and the fourth is more advanced.
1. (a) A projectile is fired vertically upward from the origin. What minimum firing speed must it have in order to reach the point with coordinates (0, 15.0 cm), straight above the origin? (b) A projectile is fired horizontally from the origin. What minimum firing speed must it have in order to reach the point with coordinates (15.0 cm, 0), along the same horizontal line as the origin? Answer: (a) 1.71 m/s (b) Such motion is impossible.
2. A projectile is fired horizontally from the point with coordinates (0, 6.00 m). It moves without air resistance. (a) What firing speed would make it pass through the point with coordinates (2.00 m, 5.50 m) ? (b) What firing speed would make it move straight horizontally, to pass through the point with coordinates (2.00 m, 6.00 m) ? Answer: (a) 6.26 m/s (b) No speed would be great enough.
3. A projectile is thrown upward to move without friction. It is released at the origin with its velocity directed at 30.0° above the horizontal. (a) What could its original speed be in order for it to undergo displacement 40.0 cm at 25.0°, so that one point on its trajectory has coordinates (36.3 cm, 16.9 cm) ? (b) What could its original speed be in order for it to undergo displacement 40.0 cm at 30.0°, along its original line of motion? Answer: (a) 4.61 m/s (b) No speed would be great enough.

58 AAPT
27
Further, the large radius of curvature at the bottom of the clothoid loop reduces the normal force on the ball here.
Problem for Configuration H, version 1: A 200-kg roller coaster car moves without friction around a circular loop in a vertical plane. The loop has radius 15.0 m, much larger than the size of the car. When the car is upside down at the top of the look, the track exerts on it a downward normal force of 1000 N. Find the speed of the car (a) at the top of the loop and (b) at the bottom. (c) Find the normal force on the car at the bottom of the loop. (d) Show that its magnitude exceeds that of the normal force at the top by six times the weight of the car. Answers: (a) 14.9 m/s (b) 28.5 m/s (c) 12.8 kN up (d) 12.8 kN – 1.00 kN = 6 1.96 kN
Problem for Configuration H, version 2: A person rides in a single roller coaster car that glides without friction around a circular loop in a vertical plane. The car is small compared to the radius of the loop and moves sufficiently fast that it does not fall from the track when it is upside down. Show that the normal force on the person at the bottom of the loop exceeds the normal force at the top by six times the weight of the person.
Additional problems. These problems can be used for homework or on examinations after the demonstration. The first three are variations on the same theme, and the fourth is more advanced.
1. (a) A projectile is fired vertically upward from the origin. What minimum firing speed must it have in order to reach the point with coordinates (0, 15.0 cm), straight above the origin? (b) A projectile is fired horizontally from the origin. What minimum firing speed must it have in order to reach the point with coordinates (15.0 cm, 0), along the same horizontal line as the origin? Answer: (a) 1.71 m/s (b) Such motion is impossible.
2. A projectile is fired horizontally from the point with coordinates (0, 6.00 m). It moves without air resistance. (a) What firing speed would make it pass through the point with coordinates (2.00 m, 5.50 m) ? (b) What firing speed would make it move straight horizontally, to pass through the point with coordinates (2.00 m, 6.00 m) ? Answer: (a) 6.26 m/s (b) No speed would be great enough.
3. A projectile is thrown upward to move without friction. It is released at the origin with its velocity directed at 30.0° above the horizontal. (a) What could its original speed be in order for it to undergo displacement 40.0 cm at 25.0°, so that one point on its trajectory has coordinates (36.3 cm, 16.9 cm) ? (b) What could its original speed be in order for it to undergo displacement 40.0 cm at 30.0°, along its original line of motion? Answer: (a) 4.61 m/s (b) No speed would be great enough.
28
4. A uniform sphere of mass 8.00 g rolls without slipping up a track in the shape of a half-circle in a vertical plane, shaped like the letter C. The radius of curvature of the track is 80.0 cm, much larger than the radius of the sphere. The speed of the center of the sphere at the top of the semicircle is 3.00 m/s. (a) Find the translational kinetic energy of the sphere here. (b) Find its total kinetic energy at the top of the track. (c) Find the speed it must have started with at the bottom of the semicircle. (d) The track originally carrying the sphere comes to an end at the top of the semicircle. There the sphere, moving horizontally to the right and spinning counterclockwise, jumps a negligible distance from the tract above it to a straight horizontal track just below it. A force of kinetic friction exerted by this track stops the counterclockwise rotation of the sphere and gives it clockwise rotation instead, making the sphere finally roll without slipping toward the right on the horizontal track. Find the final speed of the sphere. (e) Find the internal energy produced in this process. Answer: (a) 36.0 mJ (b) 50.4 mJ (c) 4.49 m/s (d) 1.29 m/s (e) 41.1 mJ

59Apparatus Competition
3
Part 1. Build your own spectrograph from flat cardboard
Tools and materials:
Necessary items Scrap cardboard (You will need a 46cm by 44cm piece, a 12cm by 5cm, and a 5cm by 5cm piece) Box cutter or utility knife Duct tape School glue Meter stick Shears Marking pen DVD or piece of a DVD (blank read/write disks are fine) Useful additions Heating gun (steam from a pot of boiling water can replace this item)
4
T-square (to ensure right angles, but careful measurements can be used instead) Cutting board (to eliminate gauging your work table) Rubber stopper hole cutter- 0.6cm diameter (to get a more neat round view port hole) Glass cutter (used to scribe lines for folding, but carefully cutting with a box cutter through one layer will
work)
Step 1: Cut out the following shape using flat cardboard. The solid lines indicate cut slots. The dotted lines indicate scribed indentures for easier folding. This should be ONE PIECE of cardboard.
Step 2: Fold the cardboard into a box shape and use duct tape and school glue to hold the cardboard in place. The duct tape simply holds the box in shape while the glue dries. See the following assembly photos.
46cm
44cm
7cm 7cm 7cm 12.5cm 12.5cm
7cm
7cm
30cm
3cm
3cm
bottom top
side
side side
side
top side
top side
top side Support flap
Support flap
Support flap
Support flap
Apparatus Title: Shoebox SpectrographName:Timothy GroveIPFW Physics Dept.2101 E. Coliseum Blvd Fort Wayne, IN 46805260-481-6157

60 AAPT
4
T-square (to ensure right angles, but careful measurements can be used instead) Cutting board (to eliminate gauging your work table) Rubber stopper hole cutter- 0.6cm diameter (to get a more neat round view port hole) Glass cutter (used to scribe lines for folding, but carefully cutting with a box cutter through one layer will
work)
Step 1: Cut out the following shape using flat cardboard. The solid lines indicate cut slots. The dotted lines indicate scribed indentures for easier folding. This should be ONE PIECE of cardboard.
Step 2: Fold the cardboard into a box shape and use duct tape and school glue to hold the cardboard in place. The duct tape simply holds the box in shape while the glue dries. See the following assembly photos.
46cm
44cm
7cm 7cm 7cm 12.5cm 12.5cm
7cm
7cm
30cm
3cm
3cm
bottom top
side
side side
side
top side
top side
top side Support flap
Support flap
Support flap
Support flap
5
Pictures during assembly

61Apparatus Competition
5
Pictures during assembly
6
Step 3: Cut off a portion of the side flap. Otherwise when you try to make a slit, you would have to cut through 3 layers of cardboard. Then cut a light entrance slit. The slit should be approximately 4cm long and 0.2cm wide and be approximately 2.5cm from the side of the box (see the following photos).
Step 4: Cut the view port into the side of the box (about 4cm from the box’s edge). The easiest way to get a round view port is to use the same tools that make holes in rubber stoppers.
Entrance slit
View port

62 AAPT
7
Step 5: Prepare the grating holder. You will need a 12cm by 5cm piece of flat cardboard and an approximate 5cm by 5cm piece of flat cardboard. Scribe the 12cm by 5cm piece as shown below.
Step 6: Fold the 12cm by 5cm cardboard piece into a triangle and secure the shape with tape. Then attach the triangle to the 5cm by 5cm piece (see below) using tape.
Step 7: Now you need to make your grating from a DVD. Be aware that if you try to cut a room temperature DVD, it will crack, flake, and/or fracture. To avoid this problem, you must first heat the DVD. Heating it for about a minute with a heat gun will work or boiling it in water. You want the disk to be a little hotter than you could hold, but not so hot the plastic deforms.
Step 8: Cut the DVD with shears or strong scissors to get your grating. Trying to cut it with a knife or saw (even when heated) can cause flaking, cracking, and/or fractures. Each DVD can provide up to 4 usable gratings (see the sketch shown below).
5 cm
5 cm 4 cm 4 cm 4 cm
12 cm
Grating 1 Grating 2
Grating 3 Grating 4
8
Step 9: Attach your grating to your grating holder using tape. Make sure that most of the grating is not covered by tape.
Step 10: Open your spectrometer box and place the grating assembly inside. The center of the grating should be aligned with the slit (see sketch).
Slit
View port
Rounded side of grating

63Apparatus Competition
8
Step 9: Attach your grating to your grating holder using tape. Make sure that most of the grating is not covered by tape.
Step 10: Open your spectrometer box and place the grating assembly inside. The center of the grating should be aligned with the slit (see sketch).
Slit
View port
Rounded side of grating
9
Step 11: Hold the slit upwards toward a light source like fluorescent lights. Carefully rotate the grating assembly until the diffraction pattern (bands of different colors of light in the same order as a rainbow) is seen through the view port. You may find it necessary to cut off pieces of the grating holder base for optimal viewing. Make sure the light you are using is coming through the slit (putting your finger over the slit should make the diffraction pattern go away). Once you have the grating assembly in the correct position, hold it in place until you can secure the position with tape and glue.
Step 12: Close the box and view different light sources. Keep in mind that you can also use light that is reflected off non-luminous object.

64 AAPT
10
Part 1 alternate: Build your own spectrograph from a pre-existing cardboard box (an alternate way of creating a spectrograph) Tools and materials:
Necessary items A box (ideally 30cm by 12.5cm by 7cm, but there is a lot of leeway in these dimensions) Scrap cardboard (You will need a 12cm by 5cm and 5cm by 5cm piece) Box cutter or utility knife Duct tape School glue Meter stick Shears Marking pen DVD or piece of a DVD (blank read/write disks are fine) Useful additions Heating gun (a pot of boiling water can replace this item) Cutting board (to eliminate gauging your work table) Rubber stopper hole cutter- 0.6cm diameter (to get a more neat round view port hole)

65Apparatus Competition
11
Step 1: Cut a light entrance slit into a side of the box. The slit should be approximately 4cm long and 0.2cm wide and be approximately 2.5cm from the side of the box (see the following photo).
Step 2: Cut the view port into the side of the box (about 4cm from the box’s edge). The easiest way to get a round view port is to use the same tools that make holes in rubber stoppers.
Step 3: Prepare the grating holder. You will need a 12cm by 5cm piece of flat cardboard and an approximate 5cm by 5cm piece of flat cardboard. Scribe the 12cm by 5cm piece as shown below.
Entrance Slit
Entrance Slit
View port
5 cm
5 cm 4 cm 4 cm 4 cm
12 cm

66 AAPT
12
Step 4: Fold the 12cm by 5cm cardboard piece into a triangle and secure the shape with tape. Then attach the triangle to the 5cm by 5cm piece (see below) using tape.
Step 5: Now you need to make your grating from a DVD. Be aware that if you try to cut a room temperature DVD, it will crack and fracture. To avoid this problem, you must first heat the DVD. Heating it for a about a minute with a heat gun will work.
Step 6: Cut the DVD to get your grating. Each DVD can provide up to 4 usable gratings (see the sketch shown below).
Step 7: Attach your grating to your grating holder using tape. Make sure that most of the grating is not covered by tape.
Grating 1 Grating 2
Grating 3 Grating 4

67Apparatus Competition
13
Step 8: Open your spectrometer box and place the grating assembly inside. The center of the grating should be aligned with the slit (see sketch).
Step 9: Hold the slit upwards toward a light source like fluorescent lights. Carefully rotate the grating assembly until the diffraction pattern (bands of different colors of light in the same order as a rainbow) is seen through the view port. Make sure the light you are using is coming through the slit (putting your finger over the slit should make the diffraction pattern go away). Once you have the grating assembly in the correct position, hold it in place until you can secure the position with tape and glue.
Step 10: Close the box and view different light sources. Keep in mind that you can also use light that is reflected off non-luminous object.
Slit
View port
Rounded side of grating
68 AAPT
14
Part 2. Webcam placement and Calibration Objectives: In this section, you will first attach a webcam (or some other photo taking device to your spectrograph). Next you will be introduced to an open source program called imageJ to analyze pictures taken with your spectrograph. Then after a calibration process, you will be able to perform a variety of later investigations. Step 1: Aim your spectrograph towards a light source. This light source could be the overhead fluorescent lights or gas discharge tube (like a helium source). Ideally, this light source should have discrete lines. Then try to lightly attach your spectrograph to a table top or desk (masking tape can help) so that you can see the spectra through the viewing port WITHOUT MOVING THE SPECTROGRAPH. Step 2: Now bring the webcam (or photo taking device) to the spectrograph’s viewport. The webcam should be attached to a computer so that you can see how the spectral lines are oriented. Try to orient the webcam such that the discrete lines are VERTICAL and one can see red through violet lines simultaneously on the screen. Once you have this orientation, secure the webcam to the spectrograph with tape (you can carefully use glue if you are trying to make a more permanent spectrograph). Getting help from a second person can greatly aid this process so don’t be shy in asking for help. IT IS VITAL THAT THE WEBCAM IS SECURELY ATTACHED AND WELL ALIGNED. IF THE WEBCAM MOVES YOU WILL LOSE A GREAT DEAL OF ACCURACY. Use lots of tape and/or glue. Step 3: Now that the webcam is securely attached to the spectrograph, we will use a helium gas discharge tube to calibrate the spectrograph. Turn on the lamp and orient the spectrograph to get the brightest spectral lines possible. Take a picture of these lines.
Where the lines appear in the photograph is irrelevant. All you need is bright, vertical lines going from red to violet (or violet to red). Step 4: If you haven’t already done so, download imageJ to your computer (go to imagej.nih.gov/ij/). Open imageJ and you should see the following menu:

69Apparatus Competition
15
Use the mouse and go to File Open… This should open a browsing window. You now need to locate (and then open) the photograph you took in step 3.
Once the photograph is opened (you should see a window that contains your photograph) use the rectangle tool to define a region of interest. First click on the rectangle tool.
Rectangle tool
Then move the mouse to the window with your photograph. Left click and drag the mouse to select a region of interest. THIS REGION OF INTEREST SHOULD EXTEND FROM THE FAR LEFT SIDE OF YOUR PHOTOGRAPH TO THE FAR RIGHT SIDE. If you didn’t draw the region of interest to your exact liking, there are small squares on the yellow box that allow you to modify it after it was drawn.
Now go to Analyze Plot Profile. This should open another window that displays an intensity vs. distance graph.

70 AAPT
16
Step 5: Now open a spreadsheet program like Excel. On the window that shows the intensity vs. distance graph there is a button called “Copy…” Press the button by left clicking it with the mouse. Then go to the spreadsheet program and paste in the values.
Step 6: One must now determine the pixel locations for peak intensities. For the example shown above, we find peak intensities at pixel locations …
1238 1267 1291 1426 1456 1524 1545 1622 1656 1668 1975 2286 2442
Step 7: Now we need to look up the known wavelengths of helium. The National Institute of Standards and Technology (NIST) maintains this information on line. The easiest way of finding any element is to do a google search of “strong lines of element name”. By googling “strong lines of helium” we can find the appropriate table for helium. These tables are over-complete for our purposes and one can ignore any wavelength that is less than 3500 angstroms and any wavelength greater than 7500 angstroms (these are beyond the range of human vision as well as beyond the range of most photographic devices).
Step 8: We now need to match the peak intensity pixel locations with known wavelengths. If we do this correctly, there should be a linear relationship between our pixel locations and the known wavelengths. This sounds easy but there are multiple distractors. For example, there are “strong lines” that are rarely seen such as those listed as He II. These are lines associated with He-He molecules and they produce far weaker lines than atomic helium (He I). It is also not uncommon to see peak intensity locations that do not match listed wavelengths. This happens for two reasons: NIST may not have called that emission a strong line or there may be a contaminating substance in the tube. Finally, it is not uncommon to see listed wavelengths as strong lines with no corresponding peak intensity in the photograph. This occurs because some gas discharge tubes do not populate the energy levels that correspond to those lines or that these lines are too weak to be seen with our apparatus.
In the example shown above, we found the following correlations between pixel location and wavelength:

71Apparatus Competition
17
Pixel Wavelength
(ang.) 1238 3888.6489 1267 3964.729 1291 4026.191 1426 4387.929 1456 4471.479 1524 1545 4713.146 1622 4921.931 1656 5015.678 1668 5047.74 1975 5875.6148 2286 6678.1517 2442 7065.1771
Which when plotted form a linear relationship:
This would indicate that the calibration is:
Wavelength = 2.6536 𝑎𝑎𝑎𝑎𝑎𝑎𝑝𝑝𝑝𝑝𝑝𝑝𝑝𝑝𝑝𝑝 Distance + 610.31 ang
By using Excel to create a wavelength column we can produce helium tube intensity vs. wavelength graph.
y = 2.6536x + 610.31R² = 0.9998
0
1000
2000
3000
4000
5000
6000
7000
8000
0 500 1000 1500 2000 2500 3000
Wav
elen
gth
(ang
.)
Distance (pixels)

72 AAPT
18
0
50
100
150
200
250
3500 4000 4500 5000 5500 6000 6500 7000 7500
Inte
nsity
(arb
)
Wavelength (ang)
Helium Spectra
19
Part 3. Measurement of “unknown” spectra Objectives: The purpose of these measurements is to determine the relative accuracy of your particular spectrograph as well as demonstrate how one can use spectrographs to determine substances that emit light. You have been given four different gas discharge tubes. One of which is labeled as Helium. The other three have masking tape covering their labels and could be Hydrogen, Neon, or Mercury gas tubes. DO NOT REMOVE THE MASKING TAPE OR YOU WILL LOSE ALL CREDIT FOR THIS SECTION.
Place each tube in the power supply and observe the color light they produce (as seen with the human eye). Write a short description of the color for each tube based on human eyesight and color vision. (This does NOT involve your spectrograph).
Now use your spectrograph. First take a picture of helium spectra. Ensure yourself that the peak locations are the same as before. If they have all consistently moved by similar numbers of pixels, your webcam might have moved. Make a list of the pixel locations for the peak intensities and compare them to your previous values.
20
Do you need to recalibrate the spectrograph based on your results? Make an argument for/against based upon your data. If you do need to recalibrate, write down your new calibration equation.
Now select one of your unknown tubes. Use the spectrograph to determine multiple strong line wavelengths. From these measurements, can you determine the gas in the tube? (Don’t forget that you can go on line to look up the strong lines for each of the given gases)
Now select a different unknown tube. Use the spectrograph to determine multiple strong line wavelengths. From these measurements, can you determine the gas in the tube?
21
Now select the final unknown tube. Use the spectrograph to determine multiple strong line wavelengths. From these measurements, can you determine the gas in the tube?
Based upon what you have seen so far, how accurate is your particular spectrograph? That is, how close does your spectrograph’s measurements correspond to the measurements given by NIST? Make actual numerical comparisons in the space below.

73Apparatus Competition
21
Now select the final unknown tube. Use the spectrograph to determine multiple strong line wavelengths. From these measurements, can you determine the gas in the tube?
Based upon what you have seen so far, how accurate is your particular spectrograph? That is, how close does your spectrograph’s measurements correspond to the measurements given by NIST? Make actual numerical comparisons in the space below.
22
To test how well you understand your spectrograph, try the following. Aim your spectrograph upwards at the fluorescent lights and take a spectral picture. Use imageJ to analyze the results and determine the strong line wavelengths. (NOTE: because of the cardboard design and different angle of operation, the spectra could slightly shift, but the separation in wavelength between features should remain consistent).
Is there any evidence that there is Helium, Hydrogen, Mercury, or Neon in the fluorescent lights based upon your data? Fully explain your reasoning as to whether you believe each gas is present or absent in fluorescent light tubes.
23
Part 4. Human color vision and spectral colors
Objective: How is human color vision related (if at all) to spectral colors? This investigation examines the relationship between spectral color and human color vision.
To begin with we will weakly define human color vision as the colors one would use to describe crayons. Spectral colors are the colors we see in rainbows and on our spectrograph pictures.
Are all human vision colors located at some point in the visible spectra (colors in the rainbow)? What is your initial guess without doing this investigation?
How does the color white (as seen by humans) relate to spectral colors (the colors in the rainbow)? What is your best guess?
Consider the color brown (as seen by humans). Is there a location in the rainbow spectrum that can be described as being brown? If not, what is your best guess to how the color brown is related to the spectral colors?
MAKE SURE THAT YOUR ANSWERS ON THIS PAGE ARE CONSISTENT WITH EACH OTHER!!!
24
We will begin by examining white light in three different forms (incandescent bulb, fluorescent light, and white from a computer screen). This will be somewhat complicated by the fact that the DVD fragment in the spectrograph does NOT equally reflect all colors of visible light.
To ensure consistent pictures go into the settings (advanced settings) and turn off automatic white balance, right light, and any other automatic light correction controls.
NOTE: It is now assumed that you have calibrated your spectrograph and that this calibration is still valid.
Using your spectrograph, take a picture of light from an incandescent bulb. How would you describe the spectral features of this light using words and values from you analyzed spectral photograph?
Using your spectrograph, take a picture of light from a fluorescent light tube. How would you describe the spectral features of this light using words and values from you analyzed spectral photograph?

74 AAPT
24
We will begin by examining white light in three different forms (incandescent bulb, fluorescent light, and white from a computer screen). This will be somewhat complicated by the fact that the DVD fragment in the spectrograph does NOT equally reflect all colors of visible light.
To ensure consistent pictures go into the settings (advanced settings) and turn off automatic white balance, right light, and any other automatic light correction controls.
NOTE: It is now assumed that you have calibrated your spectrograph and that this calibration is still valid.
Using your spectrograph, take a picture of light from an incandescent bulb. How would you describe the spectral features of this light using words and values from you analyzed spectral photograph?
Using your spectrograph, take a picture of light from a fluorescent light tube. How would you describe the spectral features of this light using words and values from you analyzed spectral photograph?
25
To examine white light produced by a computer monitor open the program PowerPoint. Do not allow the PowerPoint window to occupy the full screen (you will need to have the webcam program also available on the screen). On PowerPoint, draw a large white rectangle. Place the spectrograph entry slit on top of the white rectangle that you drew and take a photograph. Analyze this photograph using imageJ. How would you describe the spectral features of this light using words and values from you analyzed spectral photograph?
Previously, you were asked, “How does the color white relate to spectral colors (the colors in the rainbow)? “ Now that you collected data, does your previous answer agree with your experimental results? If not, how would you change your response to that question given what you know now?
Do you need all spectral colors to give humans the sensation of white light? If not, what colors do you need to make people see white?
26
Go back to the PowerPoint window. Change the color of the rectangle you drew to blue. Before you take any measurements with your spectrograph, predict how your spectra colors will change (compared to the white light picture taken before)?
Now take a picture of the blue rectangle using your spectrograph and analyze it using imageJ. Give a description of the spectral light intensities as seen through the spectrograph. Make sure that your answer is detailed enough to differentiate it from previous answers.
Resolve any differences between your last two answers. NOTE: Resolve does not mean just noting differences. You are expected to attempt to figure out what is going on.
27
Change the color of the rectangle you drew to green. Before you take any measurements with your spectrograph, predict how your spectra colors will change (compared to the white light picture taken before)?
Now take a picture of the green rectangle using your spectrograph and analyze it using imageJ. Give a description of the spectral light intensities as seen through the spectrograph. Make sure that your answer is detailed enough to differentiate it from previous answers.
Resolve any differences between your last two answers. NOTE: Resolve does not mean just noting differences. You are expected to attempt to figure out what is going on.
Change the color of the rectangle you drew to yellow. Before you take any measurements with your spectrograph, predict how your spectra colors will change (compared to the white light picture taken before)?

75Apparatus Competition
28
Now take a picture of the yellow rectangle using your spectrograph and analyze it using imageJ. Give a description of the spectral light intensities as seen through the spectrograph. Make sure that your answer is detailed enough to differentiate it from previous answers.
Resolve any differences between your last two answers. NOTE: Resolve does not mean just noting differences. You are expected to attempt to figure out what is going on.
Now try to summarize your results of the white, blue, green, and yellow rectangles. How do the spectral colors produced by the monitor change as we go from white to blue to green to yellow?
29
Reconsider the much earlier question about the color brown. How (if at all) would your answer to that question change given what you have seen so far?
Change the color of the rectangle you drew to brown. Before you take any measurements with your spectrograph, predict how your spectra colors will change (compared to the white light picture taken before)?
Now take a picture of the brown rectangle using your spectrograph and analyze it using imageJ. Give a description of the spectral light intensities as seen through the spectrograph. Make sure that your answer is detailed enough to differentiate it from previous answers.
30
Resolve any differences between your last two answers. NOTE: Resolve does not mean just noting differences. You are expected to attempt to figure out what is going on.
Your instructor is going to give you a color for your PowerPoint rectangle. Write down this color and predict what the monitor will do to produce that color.
Show your answer to the instructor.
Now take a picture of this new rectangle using your spectrograph and analyze it using imageJ. How does your result compare to your prediction?
31
Part 5. Absorption of light Objective: Consider the action of adding food coloring to water in an aquarium. Is the food coloring adding color to the light that passes through the water or is it doing something different? This investigation will reveal the results. Describe white light from an incandescent light bulb. Hint: You really should have a spectral picture of it from your last investigation. Now consider the following investigation (you aren’t doing it yet). White light from an incandescent light bulb is direct through a small container (cuvette) containing a mixture of green food coloring dye and water. How would the light spectra change (if at all) from your previous answer? Explain your reasoning!
Desk lamp
Plastic cuvette filled with water and food coloring
Spectrograph with webcam attached
27
Change the color of the rectangle you drew to green. Before you take any measurements with your spectrograph, predict how your spectra colors will change (compared to the white light picture taken before)?
Now take a picture of the green rectangle using your spectrograph and analyze it using imageJ. Give a description of the spectral light intensities as seen through the spectrograph. Make sure that your answer is detailed enough to differentiate it from previous answers.
Resolve any differences between your last two answers. NOTE: Resolve does not mean just noting differences. You are expected to attempt to figure out what is going on.
Change the color of the rectangle you drew to yellow. Before you take any measurements with your spectrograph, predict how your spectra colors will change (compared to the white light picture taken before)?
28
Now take a picture of the yellow rectangle using your spectrograph and analyze it using imageJ. Give a description of the spectral light intensities as seen through the spectrograph. Make sure that your answer is detailed enough to differentiate it from previous answers.
Resolve any differences between your last two answers. NOTE: Resolve does not mean just noting differences. You are expected to attempt to figure out what is going on.
Now try to summarize your results of the white, blue, green, and yellow rectangles. How do the spectral colors produced by the monitor change as we go from white to blue to green to yellow?

76 AAPT
31
Part 5. Absorption of light Objective: Consider the action of adding food coloring to water in an aquarium. Is the food coloring adding color to the light that passes through the water or is it doing something different? This investigation will reveal the results. Describe white light from an incandescent light bulb. Hint: You really should have a spectral picture of it from your last investigation. Now consider the following investigation (you aren’t doing it yet). White light from an incandescent light bulb is direct through a small container (cuvette) containing a mixture of green food coloring dye and water. How would the light spectra change (if at all) from your previous answer? Explain your reasoning!
Desk lamp
Plastic cuvette filled with water and food coloring
Spectrograph with webcam attached
32
To ensure consistent pictures go into the settings (advanced settings) and turn off automatic white balance, right light, and any other automatic light correction controls.
NOTE: It is now assumed that you have calibrated your spectrograph and that this calibration is still valid.
Measure 100mL of water in a beaker. Pour some of this water into a cuvette. Set up the experiment as shown on the previous page and take a picture. Now pour the water back into the beaker and add ONE drop of green food coloring. Mix it until the color is consistent and pour some of the water back into the cuvette. Place the cuvette in front of the spectrograph’s entrance slit and take another picture. Now pour the water back into the beaker and add TWO drops of green food coloring. This mixture now has a total of THREE drops of food coloring. Mix it until the color is consistent and pour some of the water back into the cuvette. Place the cuvette in front of the spectrograph’s entrance slit and take another picture. Now pour the water back into the beaker and add THREE drops of green food coloring. This mixture now has a total of SIX drops of food coloring. Mix it until the color is consistent and pour some of the water back into the cuvette. Place the cuvette in front of the spectrograph’s entrance slit and take another picture. Now pour the water back into the beaker and add FOUR drops of green food coloring. This mixture now has a total of TEN drops of food coloring. Mix it until the color is consistent and pour some of the water back into the cuvette. Place the cuvette in front of the spectrograph’s entrance slit and take another picture. Now examine each dye mixture picture using imageJ and get the intensity vs. wavelength graph for each picture. Transmittance is defined as the intensity of the light after passing through a substance divided by the intensity of light before it entered the substance. In this case, the substance is the food coloring. The intensity of the light (before the food coloring) is represented by water only picture. Use the imageJ data to produce a four trace graph (one drop, three drops, six drops, and 10 drops) of transmittance vs. wavelength for a range of 450nm to 600nm. Attach this graph to this report. Based upon this graph, is the green dye adding color to the light that transmits through the water? Explain your reasoning.
77Apparatus Competition
32
To ensure consistent pictures go into the settings (advanced settings) and turn off automatic white balance, right light, and any other automatic light correction controls.
NOTE: It is now assumed that you have calibrated your spectrograph and that this calibration is still valid.
Measure 100mL of water in a beaker. Pour some of this water into a cuvette. Set up the experiment as shown on the previous page and take a picture. Now pour the water back into the beaker and add ONE drop of green food coloring. Mix it until the color is consistent and pour some of the water back into the cuvette. Place the cuvette in front of the spectrograph’s entrance slit and take another picture. Now pour the water back into the beaker and add TWO drops of green food coloring. This mixture now has a total of THREE drops of food coloring. Mix it until the color is consistent and pour some of the water back into the cuvette. Place the cuvette in front of the spectrograph’s entrance slit and take another picture. Now pour the water back into the beaker and add THREE drops of green food coloring. This mixture now has a total of SIX drops of food coloring. Mix it until the color is consistent and pour some of the water back into the cuvette. Place the cuvette in front of the spectrograph’s entrance slit and take another picture. Now pour the water back into the beaker and add FOUR drops of green food coloring. This mixture now has a total of TEN drops of food coloring. Mix it until the color is consistent and pour some of the water back into the cuvette. Place the cuvette in front of the spectrograph’s entrance slit and take another picture. Now examine each dye mixture picture using imageJ and get the intensity vs. wavelength graph for each picture. Transmittance is defined as the intensity of the light after passing through a substance divided by the intensity of light before it entered the substance. In this case, the substance is the food coloring. The intensity of the light (before the food coloring) is represented by water only picture. Use the imageJ data to produce a four trace graph (one drop, three drops, six drops, and 10 drops) of transmittance vs. wavelength for a range of 450nm to 600nm. Attach this graph to this report. Based upon this graph, is the green dye adding color to the light that transmits through the water? Explain your reasoning.
33
Recall your prediction. How well did your prediction correspond to the experimental results? Make sure you use experimental values in your WELL EXPLAINED response. Now consider the following investigation (you aren’t doing it yet). White light from an incandescent light bulb is direct through a small container (cuvette) containing a mixture of yellow food coloring dye and water. How would the light spectra change (if at all) from your previous answer? Explain your reasoning! You are now going to repeat the process with yellow food coloring using a fresh cuvette. That is you are going to produce transmittance graph traces for one drop, three drops, six drops, and 10 drops of yellow food coloring. Attach this graph to this report. Finally, to test your knowledge, you should now be able to predict the transmittance if we have a mixture of 100mL + 10 drops of green + 10 drops of yellow. Your prediction should be in the form of a graph and you need to supply a written explanation as to how you came up with your prediction. SHOW YOUR ANSWER TO YOUR INSTRUCTOR BEFORE PROCEEDING.
34
Make a mixture of 100mL water + 10 drops of green + 10 drops of yellow. Mix well and fill a fresh cuvette. Measure the transmittance of this mixture vs. wavelength and attach a graph of it to this report. How accurate was your prediction compared to the results? Be specific and make direct numerical comparisons. If you could re-do the green-yellow prediction or experiment, what would you do differently?
35
Part 6. Reflection of light Objective: What causes some objects to look red and other objects yellow? How does reflected spectral colors differ between two differently colored objects? This investigation explores these relationships among others. Based upon what you think you know, consider the following question. If an object is only illuminated by red light (620nm to 750nm), is it possible for the object to reflect green light (495nm to 570nm)? Explain your reasoning.
Consider the experiment shown to the right (don’t set it up yet). A red laser is reflected off an object and the reflected light is directed into the spectrograph. A laser produces a very narrow range of wavelengths. Would the wavelengths of the reflected light that enter the spectrograph depend on the color of the reflecting object? Explain your reasoning.
Now try the experiment (shown on this page) using at least 5 different colors of construction paper as your reflecting object. Collect photographs and analyze them using imageJ and your calibration equation. Attach this information to your paper.
Red Laser
Spectrograph with webcam attached
Reflecting object

78 AAPT
35
Part 6. Reflection of light Objective: What causes some objects to look red and other objects yellow? How does reflected spectral colors differ between two differently colored objects? This investigation explores these relationships among others. Based upon what you think you know, consider the following question. If an object is only illuminated by red light (620nm to 750nm), is it possible for the object to reflect green light (495nm to 570nm)? Explain your reasoning.
Consider the experiment shown to the right (don’t set it up yet). A red laser is reflected off an object and the reflected light is directed into the spectrograph. A laser produces a very narrow range of wavelengths. Would the wavelengths of the reflected light that enter the spectrograph depend on the color of the reflecting object? Explain your reasoning.
Now try the experiment (shown on this page) using at least 5 different colors of construction paper as your reflecting object. Collect photographs and analyze them using imageJ and your calibration equation. Attach this information to your paper.
Red Laser
Spectrograph with webcam attached
Reflecting object
36
Based upon your collected evidence with the construction paper, what changes (if any) did you see from color of construction paper to the next? Explain your reasoning using collected numerical values.
How (if at all) would you change your answers to the questions that were asked before the experiment? Does the experiment support what you said earlier or should you revise your thinking? EXPLAIN.
37
Based upon what you think you know, consider an object that looks white under an incandescent light bulb. If the white object is only illuminated by red light (620nm to 750nm), what color would we see this object (human sight vision)? Explain your reasoning.
Based upon what you think you know, consider an object that looks dark blue under an incandescent light bulb. If the dark blue object is only illuminated by red light (620nm to 750nm), what color would we see this object (human sight vision)? Explain your reasoning.
Consider the experiment shown to the right (don’t set it up yet). A light from an incandescent bulb is reflected off an object and the reflected light is directed into the spectrograph. Would the wavelengths of the reflected light that enter the spectrograph depend on the color of the reflecting object? Explain your reasoning.
Desk lamp
Spectrograph with webcam attached
Reflecting object

79Apparatus Competition
37
Based upon what you think you know, consider an object that looks white under an incandescent light bulb. If the white object is only illuminated by red light (620nm to 750nm), what color would we see this object (human sight vision)? Explain your reasoning.
Based upon what you think you know, consider an object that looks dark blue under an incandescent light bulb. If the dark blue object is only illuminated by red light (620nm to 750nm), what color would we see this object (human sight vision)? Explain your reasoning.
Consider the experiment shown to the right (don’t set it up yet). A light from an incandescent bulb is reflected off an object and the reflected light is directed into the spectrograph. Would the wavelengths of the reflected light that enter the spectrograph depend on the color of the reflecting object? Explain your reasoning.
Desk lamp
Spectrograph with webcam attached
Reflecting object
38
Now try the experiment (shown on this page) using at least 5 different colors of construction paper as your reflecting object (they can be the same ones you used before). Collect photographs and analyze them using imageJ and your calibration equation. Attach this information to your paper.
Based upon your collected evidence with the construction paper, what changes (if any) did you see from color of construction paper to the next? Explain your reasoning using collected numerical values.
For the final experiment in this investigation, you will need to go outside and collect a small piece of some brightly colored object (for example, a dandelion flower). If this object was used as your reflecting object (illuminated with an incandescent bulb), PREDICT the spectra you would expect to see. Explain your reasoning.
Show your object and prediction to your instructor.
39
Now try the experiment with your sample. Collect a photograph and analyze it using imageJ and your calibration equation. Attach this information to your paper.
Recall your prediction. How well did your prediction correspond to the experimental results? Make sure you use experimental values in your WELL EXPLAINED response. Now that you have run the experiment, how if at all would you change your prediction and/or the experiment?

80 AAPT
40
Part 7. Laser induced PlayDoh Fluorescence Objective: What is the difference between fluorescence and reflection? Given the spectra for input light, could we look at light coming off an object and deduce whether that light is due to reflection or fluorescence? Based upon what you think you know, consider the following question. If an object is only illuminated by blue laser light (405nm), is it possible for the object to emit red light (620nm to 750nm)? Explain your reasoning.
Consider the experiment shown to the right (don’t set it up yet). A blue laser beam is incident upon a lump of PlayDoh. Would the wavelengths of the light that enter the spectrograph match those of the laser beam? Explain your reasoning.
Blue Laser
Spectrograph with webcam attached
PlayDoh Lump
41
Now try the experiment using red, yellow, green, and blue lumps of PlayDoh with a blue laser (405nm). Collect photographs (one for each color of PlayDoh) and analyze them using imageJ and your calibration equation. Attach this information to your paper. Fluorescence differs from reflection in that the wavelength emitted from an illuminated object does not match the wavelength of the incident light. Have you seen any evidence of fluorescence? Repeat the experiment using a green laser (532nm) instead of a blue laser. Collect photographs (one for each color of PlayDoh) and analyze them using imageJ and your calibration equation. Attach this information to your paper. Green light is approximately in the middle of the visible spectrum. Is there any evidence that green light can produce fluorescence with a higher wavelength (greater than 532nm)? Explain using numerical values from your data.

81Apparatus Competition
41
Now try the experiment using red, yellow, green, and blue lumps of PlayDoh with a blue laser (405nm). Collect photographs (one for each color of PlayDoh) and analyze them using imageJ and your calibration equation. Attach this information to your paper. Fluorescence differs from reflection in that the wavelength emitted from an illuminated object does not match the wavelength of the incident light. Have you seen any evidence of fluorescence? Repeat the experiment using a green laser (532nm) instead of a blue laser. Collect photographs (one for each color of PlayDoh) and analyze them using imageJ and your calibration equation. Attach this information to your paper. Green light is approximately in the middle of the visible spectrum. Is there any evidence that green light can produce fluorescence with a higher wavelength (greater than 532nm)? Explain using numerical values from your data.
42
Is there any evidence that green light can produce fluorescence with a lower wavelength (less than 532nm)? Explain using numerical values from your data. Reconsider the fluorescence from blue laser light. Is there any evidence that blue light can produce fluorescence with a lower wavelength (less than 405nm)? Explain using numerical values from your data. Repeat the experiment using a red laser (650nm) instead of a blue laser. Collect photographs (one for each color of PlayDoh) and analyze them using imageJ and your calibration equation. Attach this information to your paper. Is there any evidence that the red light is producing fluorescence in any color of PlayDoh? Explain using numerical values from your data.
43
Based upon your entire set of data, which color of laser light seemed to most effectively produce fluorescence? Explain your reasoning. Do you have any fluorescence experiment that resulted in a lower wavelength being emitted than the laser beam? Explain your reasoning and use numerical data when possible. Photons are the smallest whole part of light. A single photon’s energy is given by ℎ𝑐𝑐𝜆𝜆 where h is Planck’s constant, c is the speed of light in vacuum, and is wavelength. Which color laser had the most energetic photons? Based upon your limited data, is there any indication that fluorescence may depend on photon energy?


American Association of Physics TeachersOne Physics Ellipse • College Park, MD 20740-3845 • www.aapt.org


![Modelandexperimentalvisualizationsoftheinteractionofabubbl ...Physics of Fluids 13(1), 45–57.] and Moraga, Drew, Larreteguy, Lahey [2005. ... The apparatus is a rectangular water](https://img.pdfslide.us/doc/110x75/5e37ebabca47dc11483bff8d/modelandexperimentalvisualizationsoftheinteractionofabubbl-physics-of-fluids.jpg)


![Studies on the Neutrality of Antihydrogen(Antihydrogen Laser Physics Apparatus) collaboration [4], whose experimental apparatus is located at the Antiproton Decelerator facility at](https://img.pdfslide.us/doc/110x75/5e767e58642ee34efa04342c/studies-on-the-neutrality-of-antihydrogen-antihydrogen-laser-physics-apparatus.jpg)


![Theoretical High Energy Physics in the LHC Era - Talk to ...physics.ucsc.edu/~joel/13Phys205/Jan7-Dine-LHC Physics.pdfThe ATLAS detector [7] is a multipurpose particle physics apparatus](https://img.pdfslide.us/doc/110x75/60c750a1e6b01938425a62d7/theoretical-high-energy-physics-in-the-lhc-era-talk-to-joel13phys205jan7-dine-lhc.jpg)