Embed Size (px)
Citation preview

APOPTOSIS OF CANCER CELLS
Dr. Subhash BasuDepartment of Chemistry and Biochemistry
University of Notre DameNotre Dame, IN USA
Indian Statistical Institute Kolkata, India
February 18th 2008

What are the Characteristic Events of Apoptosis?Membrane BlebbingPhosphatidylserine FloppingApoptotic BodiesCytoplasmic Membrane DamageDNA FragmentationRegulation of GLTs
Apoptosis vs. Necrosis


Normal and Cancer Cell Growth Regulation
24hrs
24hrs
Normal Cells
Undifferentiated Dividing Cells
Differentiated Cells
APOPTOTIC (Programmed) CELL DEATH
24hrs
24hrs 24hrs
Cancer Cells
n+1 2n
1) Apoptotic Program is Ready and Remains Inhibited2)Apoptosis is Inducible
Drug Treatment
APOPTOTIC (Programmed) CELL DEATH

5
QuickTime™ and a decompressor
are needed to see this picture.

Human Breast Carcinoma CellsSK-BR-3, MCF-7, and MDA-468
Derived from pleural effusion of breast carcinoma
Cells HER2 Status
ER PgR p53
SK-BR-3 High - - Mutant
MCF-7 Normal + + Normal
MDA-468 Normal - - Mutant
•HER2 (c-erbB-2/neu) protein
HER2 comes from a proto-oncogene encoding a transmembrane glycoprotein of 185 kDa (p185(HER2)) with intrinsic tyrosine kinase activity. HER2 gives the cells different responsiveness to anti-cancer drugs versus HER2 negative breast cancers cells
•Estrogen receptor (ER) and progesterone receptor (PgR)

L-/D-PPMP
Tamoxifen
cis-Platin
Melphalan
Structures of Anti-Cancer Apoptotic Agents
Betulinic Acid

Morphological Changes of Apoptotic Breast Cancer Cells Treated with L-PPMP
Control MCF-7 MCF-7 (8μM L-PPMP) 48hrs
SKBR-3 (8μM L-PPMP) 48hrs
MDA-468 (8μM L-PPMP) 48hrs
MCF-7 with (16μM) L-PPMP 48h
SKBR-3 (Control)
MDA-468 (Control)
SKBR-3 (16μM L-PPMP) 48hrs
MDA-468 (16μM L-PPMP) 48hrs

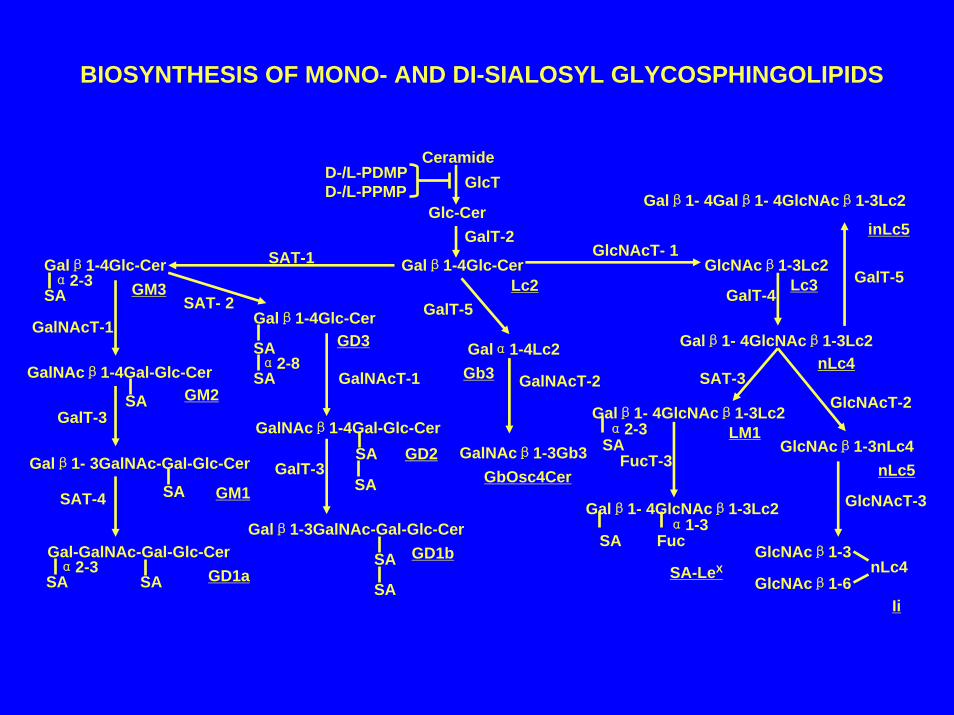
Galβ1-4Glc-Cerα2-3
SA
Galβ1-4Glc-Cer GlcNAcβ1-3Lc2SAT-1 GlcNAcT- 1
Glc-CerGalT-2
CeramideGlcTD-/L-PDMP
D-/L-PPMP
GalNAcβ1-4Gal-Glc-Cer
SA
GM3
GalNAcT-1
Galβ1- 3GalNAc-Gal-Glc-Cer
SA
GM2
GM1
GalT-3
Gal-GalNAc-Gal-Glc-Cer
SAα2-3
SA
SAT-4
GD1a
Lc3
Galβ1- 4GlcNAcβ1-3Lc2
GalT-4
nLc4SAT-3
Galβ1- 4GlcNAcβ1-3Lc2α2-3
SALM1
FucT-3
Galβ1-4Glc-CerGD3SA
α2-8SA
SAT- 2
GalNAcβ1-4Gal-Glc-CerSA GD2
SA
GalNAcT-1
Galβ1-3GalNAc-Gal-Glc-CerGD1b
SA
SA
GalT-3
Biosynthesis of Mono- and Di-Sialosyl Glycosphingolipids
GlcNAcT-2
GlcNAcβ1-3nLc4inLc5
GlcNAcT-3
nLc4
Ii
GlcNAcβ1-3
GlcNAcβ1-6
Galβ1- 4GlcNAcβ1-3Lc2
SA
SA-LeX
α1-3Fuc
Galα1-4Lc2
Lc2GalT-5’
GalNAcT-2Gb3
GalNAcβ1-3Gb3GbOsc4Cer
GalT-5
Galα1- 3Galβ1- 4GlcNAcβ1-3Lc2
nLc5
i
I
Hypothesis
Mitochondrion
Fas/TNF
FADD
Pro-Caspase-8
Active -Casp-8
Pro-Caspase-3
Casp-3 (p19/12)
Active Casp-3(p17/12)
Caspase-3Activation
DFF/ICAD/PARP etc.
?
DNA Cleavage
?
PI-3 Kinase
Phospho Akt
pBad
Cyto-c
PTP
Pro-Caspase-9 Active-Casp-9
Apaf-1
Glc-GalSASA
(GD3)
CERAMIDE
CGase
Sphingosine
Sph-1-P
PKC
?
GSL (GD3/GD1b)
?
P-Choline (Sphingomyelin)
Sphase
GSL
L-/D-PDMPL-/D-PPMP
P4

Molecular Apoptotic Changes1. Transport of Phosphatidyl-Serine from inside to
outside of Plasma membranes.
2. DNA fragmentation with DNA Laddering assay.
3. Stimulation of Ceramide generation in the cells.
4. Identification of caspase activations by Western blot.
5. Inactivation of DNA Pol-α and Helicase−ΙΙΙ of the Replication Complexes.
6. Regulation of GSL:GLTs of the SA-LeX Biosynthetic Pathway (studied by DNA-microarray).

PC GSLPSPC
APOPTOTIC REAGENTS
i) L/D-PPMPii) GD3/GM1b/GT1b/GD1biii) cis-Platiniv) Betulinic Acidv) Tamoxifen
1) Blue Fluorescence (Live Cells) – PSS-3802) Red Fluorescence (Permeable Dead Cells)
– Propidium Iodide
GSL GSLPC PC
PS
PSPSPE PE
Mitochondrion
Nucleus
NON-APOPTOTICCARCINOMA CELL
PS
PSPE
APOPTOTICCARCINOMA CELL
Nucleus
GD3
Mitochondrion
GD3GD3
Cytochrome C
Nucleus
APOPTOTIC/DEAD CELL
APOPTOTICREAGENTS
GD3GSL
Mitochondrion
GD3
GD3PS
PSPC
PE
PE
PCPSS
2-48hrs1) PSS-380 Dye2) Propidium Iodide
Me
GD3
PC
PS
PE
= DG-O-P-O-CH2-CH
IO-
=O NH3+
COO-
= DG-O-P-O-CH2-CH2- NH3+
= DG-O-P-O-CH2-CH2- N+ - MeMe
=CER Glc Gal-SA-SA
PSSSmith, B. et.al. (Patent Pending)
IO-
=OIO
-=O
PCPC
PCPSS-
PSS
2 Detection of Phosphatidylserine with PSS-380

PSS-380
Propidium Iodide
Remove Culture Medium
Wash with TES buffer(5mM, pH 7.2, 150mM NaCl)
Stain with TES buffer containing 25 μMPSS-380, 250μg/ml PI for 15 min at 37oC
Remove staining buffer, wash with TES buffer
Observe under fluorescence microscopy following excitation with 350 nm.
Staining Protocol

80 μM GD3 6 h
Control
80 μM GD3 24 h
Staining of Apoptotic Cancer Cells with Fluorescent Dyes
Basu S, Ma R, et al., Glycoconj J. 2004;20(9):563-77. PMID: 15454695Ma R, Basu S, et al., Glycoconj J. 2004;20(5):319-30. PMID: 15229396

NNH
O
HN
NH HN
O
NO O
O-
O-
N2+N
Detection of Innercellular Membranewith Squaraine Rotaxane (AKS-0)
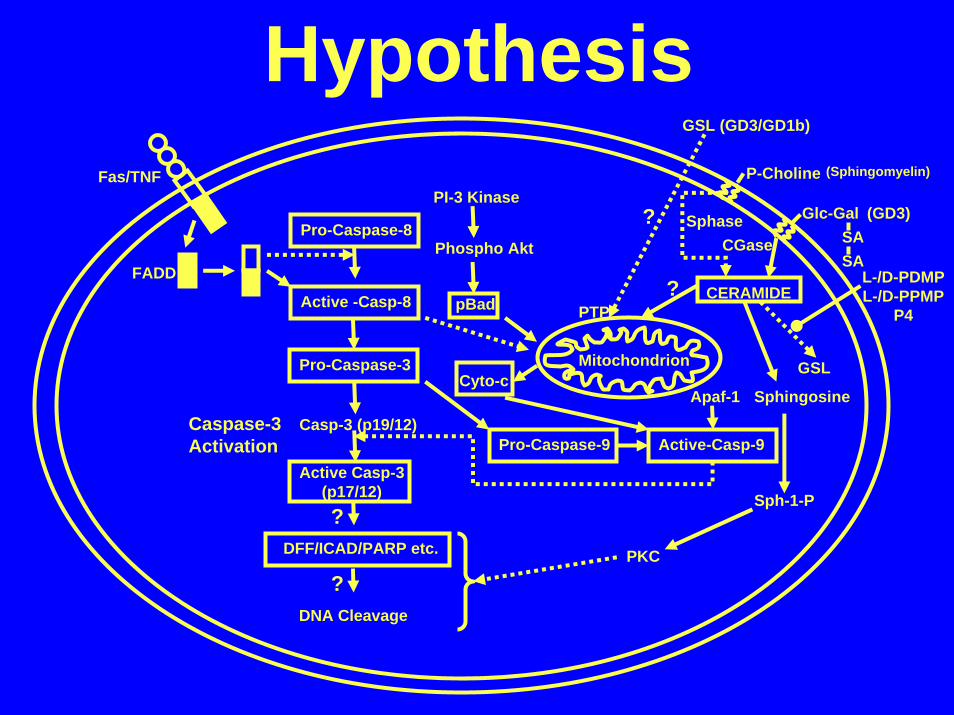
SKBR-3 with 10µM L-PPMP 6 hours/PSS-380 and AKS-0
Control - Phase Contract Control – PSS-380 Control – Rotaxane (AKS-0)
L-PPMP - Phase Contract L-PPMP – PSS-380 L-PPMP – Rotaxane (AKS-0)

SKBR-3 with 10µM L-PPMP 24 hours/PSS-380 and AKS-0
Control - Phase Contract Control – PSS-380 Control – Rotaxane (AKS-0)
L-PPMP - Phase Contract L-PPMP – PSS-380 L-PPMP – Rotaxane (AKS-0)

SKBR-3 with 10µM L-PPMP 6 hours/PSS-380 and AKS-0
Control - Phase Contract Control – PSS-380 Control – Rotaxane (AKS-0)
L-PPMP - Phase Contract L-PPMP – PSS-380 L-PPMP – Rotaxane (AKS-0)
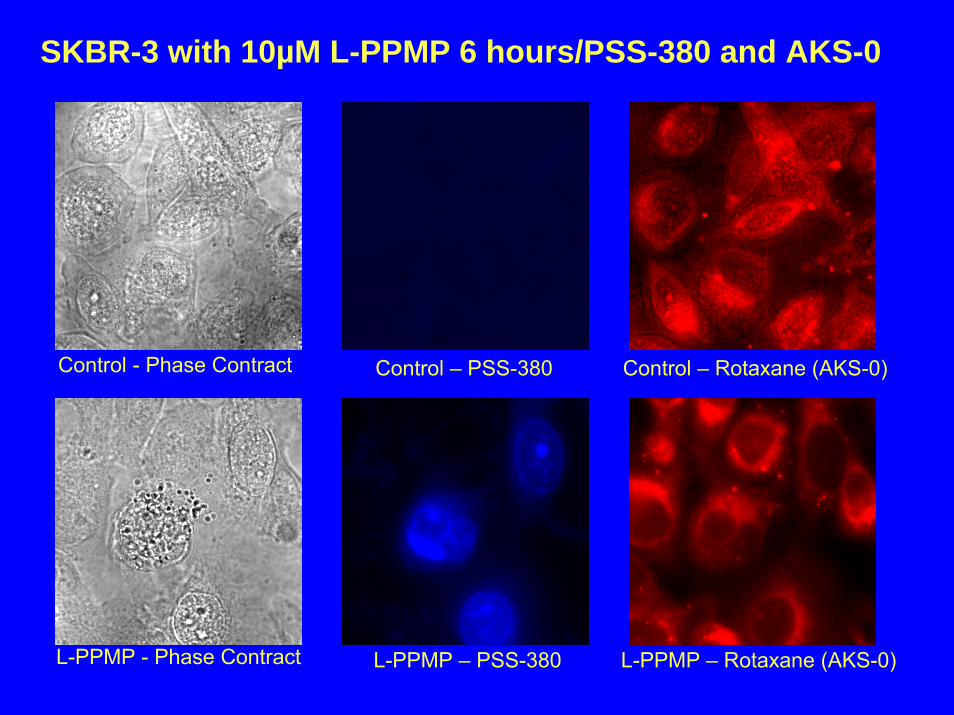
Inhibitors of GlcT
P4D-threo-1-phenyl-2-palmitoylamino-3-pyrrolidino-1-propanol
Causing apoptosis by elevating endogenous ceramideconcentration in different cancer cells lines, especially in multidrug-resistant cell lines.
Nicholson KM, et al., Br J Cancer. 1999 Oct;81(3):423-30. PMID: 10507766 Basu S, Ma R, et al., Glycoconj J. 2004;20(9):563-77. PMID: 15454695Basu S, Ma R, et al., Glycoconj J. 2004;20(3):157-68. PMID: 15090729
Galβ1-4Glc-Cerα2-3
SA
Galβ1-4Glc-Cer GlcNAcβ1-3Lc2SAT-1 GlcNAcT- 1
Glc-CerGalT-2
CeramideGlcTD-/L-PDMP
D-/L-PPMP
GalNAcβ1-4Gal-Glc-Cer
SA
GM3
GalNAcT-1
Galβ1- 3GalNAc-Gal-Glc-Cer
SA
GM2
GM1
GalT-3
Gal-GalNAc-Gal-Glc-Cer
SAα2-3
SA
SAT-4
GD1a
Lc3
Galβ1- 4GlcNAcβ1-3Lc2
GalT-4
nLc4SAT-3
Galβ1- 4GlcNAcβ1-3Lc2α2-3
SALM1
FucT-3
Galβ1-4Glc-CerGD3SA
α2-8SA
SAT- 2
GalNAcβ1-4Gal-Glc-CerSA GD2
SA
GalNAcT-1
Galβ1-3GalNAc-Gal-Glc-CerGD1b
SA
SA
GalT-3
BIOSYNTHESIS OF MONO- AND DI-SIALOSYL GLYCOSPHINGOLIPIDS
GlcNAcT-2
GlcNAcβ1-3nLc4nLc5
GlcNAcT-3
nLc4
Ii
GlcNAcβ1-3
GlcNAcβ1-6
Galβ1- 4GlcNAcβ1-3Lc2
SA
SA-LeX
α1-3Fuc
Galα1-4Lc2
Lc2GalT-5
GalNAcT-2Gb3
GalNAcβ1-3Gb3GbOsc4Cer
GalT-5
Galβ1- 4Galβ1- 4GlcNAcβ1-3Lc2
inLc5
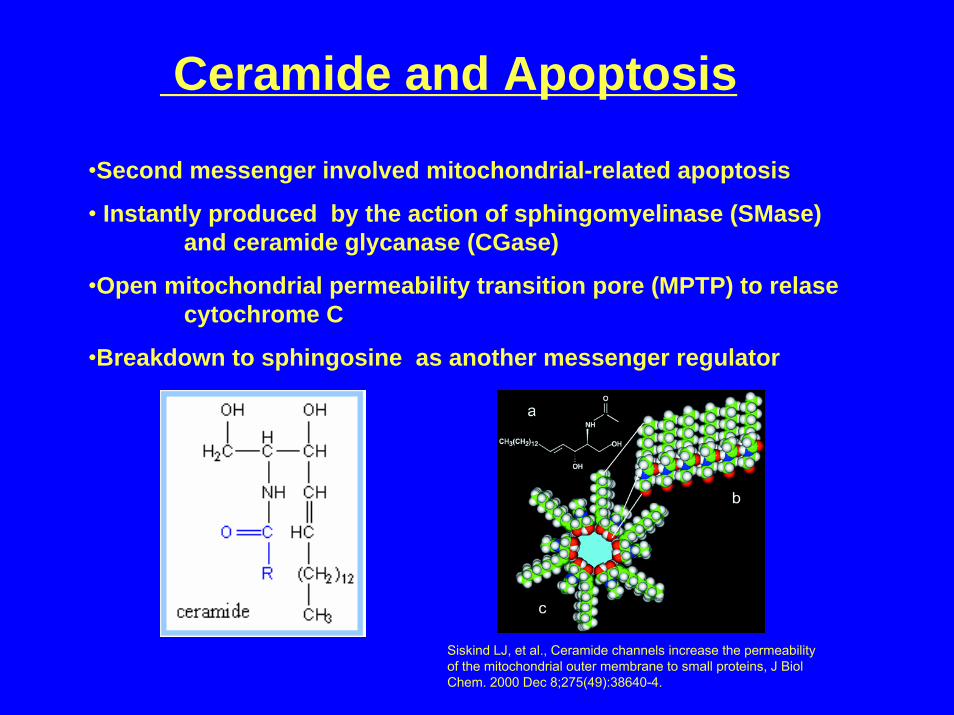
Ceramide and Apoptosis
•Second messenger involved mitochondrial-related apoptosis
• Instantly produced by the action of sphingomyelinase (SMase) and ceramide glycanase (CGase)
•Open mitochondrial permeability transition pore (MPTP) to relasecytochrome C
•Breakdown to sphingosine as another messenger regulator
Siskind LJ, et al., Ceramide channels increase the permeability of the mitochondrial outer membrane to small proteins, J BiolChem. 2000 Dec 8;275(49):38640-4.

Hypothesis
Mitochondrion
Fas/TNF
FADD
Pro-Caspase-8
Active -Casp-8
Pro-Caspase-3
Casp-3 (p19/12)
Active Casp-3(p17/12)
Caspase-3Activation
DFF/ICAD/PARP etc.
?
DNA Cleavage
?
PI-3 Kinase
Phospho Akt
pBad
Cyto-c
PTP
Pro-Caspase-9 Active-Casp-9
Apaf-1
Glc-GalSASA
(GD3)
CERAMIDE
CGase
Sphingosine
Sph-1-P
PKC
?
GSL (GD3/GD1b)
?
P-Choline (Sphingomyelin)
Sphase
GSL
L-/D-PDMPL-/D-PPMP
P4


Identification of Caspase-3 activations by Western blot (SKBR-3)
Basu S, Ma R, et al., Glycoconj J. 2004;20(9):563-77. PMID: 15454695
Ma R, Basu S, et al., Glycoconj J. 2004;20(5):319-30. PMID: 15229396
Basu S, Ma R, et al., Glycoconj J. 2004;20(3):157-68. PMID: 15090729

Identification of Caspase-8 activations by Western blot SKBR-3/cis-Platin

Extrinsic pathway can activate the intrinsic pathway; Extrinsic (Death Receptor)Intrinsic (Mitochrondrial)Extrinsic pathway: Caspase-8and Caspase-3Intrinsic pathway: activation of Caspase-9 and Caspase-3
Apoptosis Signal Transduction Pathway
Rossi et al. Messengers of cell death: apoptotic signaling in health and disease. Haematologica 2003; 88:212-218.
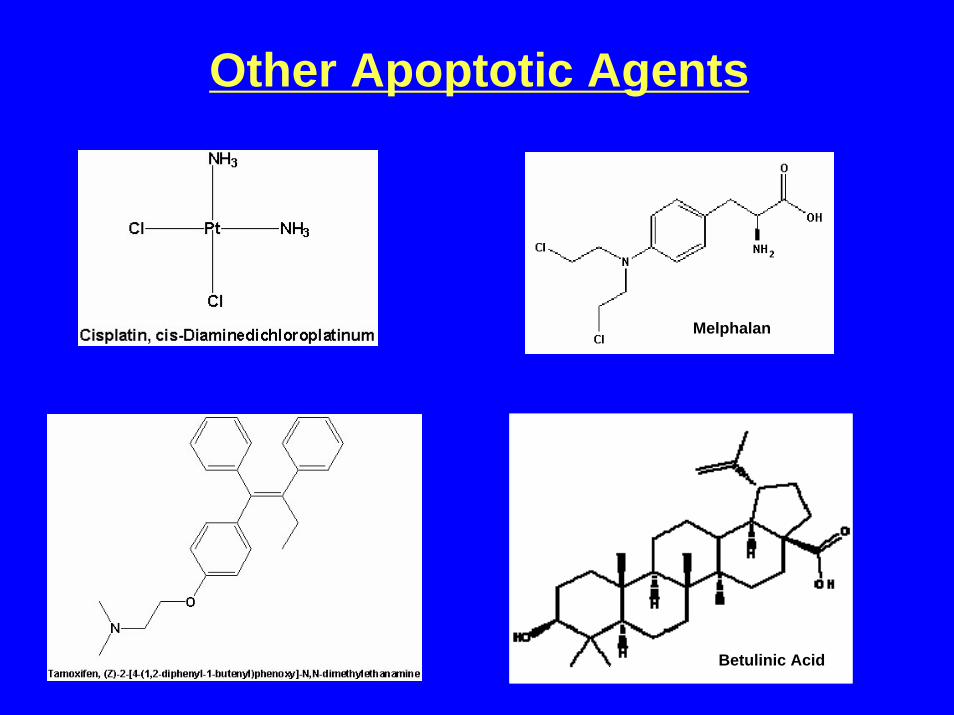
Other Apoptotic Agents
Betulinic Acid
Melphalan

1. 2.0 μM L-PPMP2. Control3. 0.5 μM L-PPMP4. 2.0 μM L-PDMP5. Control6. 0.5 μM L-PDMP
Basu S, Ma R, et al., Apoptosis of human carcinoma cells in the presence of inhibitors of glycosphingolipid biosynthesis: I. Treatment of Colo-205 and SKBR3 cells with isomers of PDMP and PPMP. Glycoconj J. 2004;20(3):157-68. PMID: 15090729
Basu S, Ma R, et al., Apoptosis of human carcinoma cells in the presence of potential anti-cancer drugs: III. Treatment of Colo-205 and SKBR3 cells with: cis-platin, Tamoxifen, Melphalan, Betulinic acid, L-PDMP, L-PPMP, and GD3 ganglioside.Glycoconj J. 2004;20(9):563-77. PMID: 15454695
2 DNA fragmentation with DNA Laddering assay

[Kelly, T., Moghaggas, S., Bose, R., and Basu, S.(1993)Cancer Biochem. And Biophys., 13, 135-146.]

MODEL FOR CISPLATIN INHIBITION OF POL-α

C C
M
C C
HUMAN- LTDEEKYRDCERFKCPCPTCGTEN IYDNVFDGSGTDMEPSLYRCSN IDCKASPLTFYEAST- I TDVERFKDTVT LELS CPSCDKRFPFGGIVSS NYYRVSYNGLQCKHCEQLFT PLQL
HUMAN- TVQLSNKLIMDIRRFIKKYYDGWL ICEEPT CRNRTRHL PLQFSRTGPL CPACMKATLYEAST- TSQI EH- - - -S IRAHISLYYAGWLQCDDSTCGI V TRQVSVFGKRCLNDGCT- - - -GVM
HUMAN- QPEYSDKSLYTQYEAST- RYKYSDKQLYNQ
COMPARISON OF HUMAN DNA-POLYMERASE-α & YEASTPol-I ZINC BINDING DOMAIN SEQUENCES
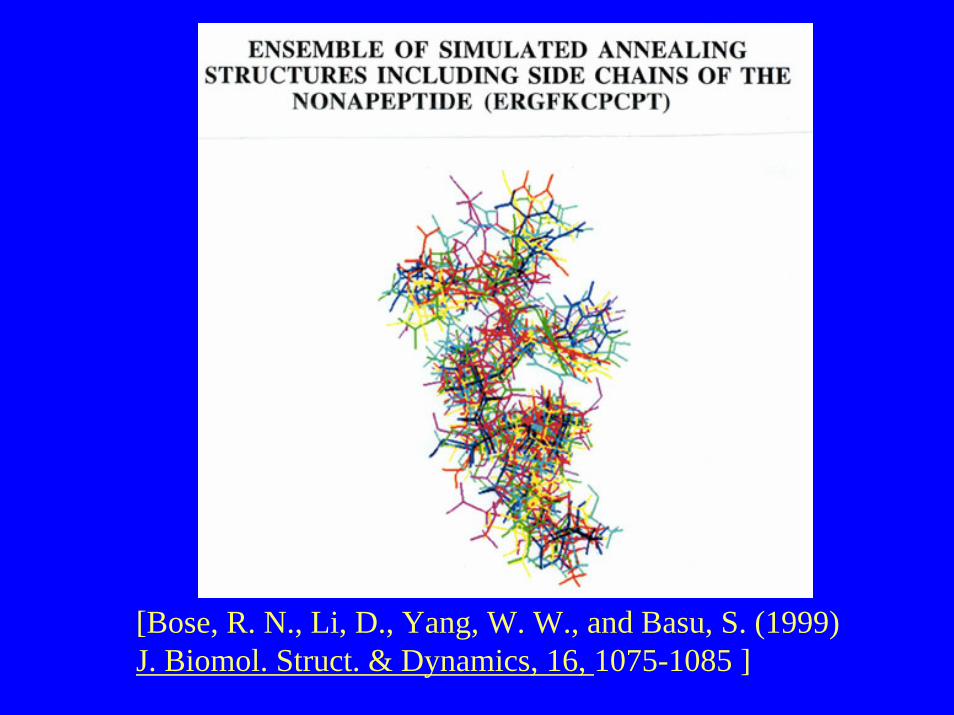
[Bose, R. N., Li, D., Yang, W. W., and Basu, S. (1999) J. Biomol. Struct. & Dynamics, 16, 1075-1085 ]

RP-A
PCNA
Pol-α / Primase
DNA Helicase
Pol-δ
MODEL FOR A FUNCTIONAL REPLICATION COMPLEX

30% 10%
Pol-α
Hel-III
DETECTION OF DNA POL-α &HELICASE-III PROTEINS BY SPECIFIC ANTIBODIES
(SKBR3 Human Breast Carcinoma Cells)[Pol-α / SJK 237-70 Mab / Helicase-III Pab]
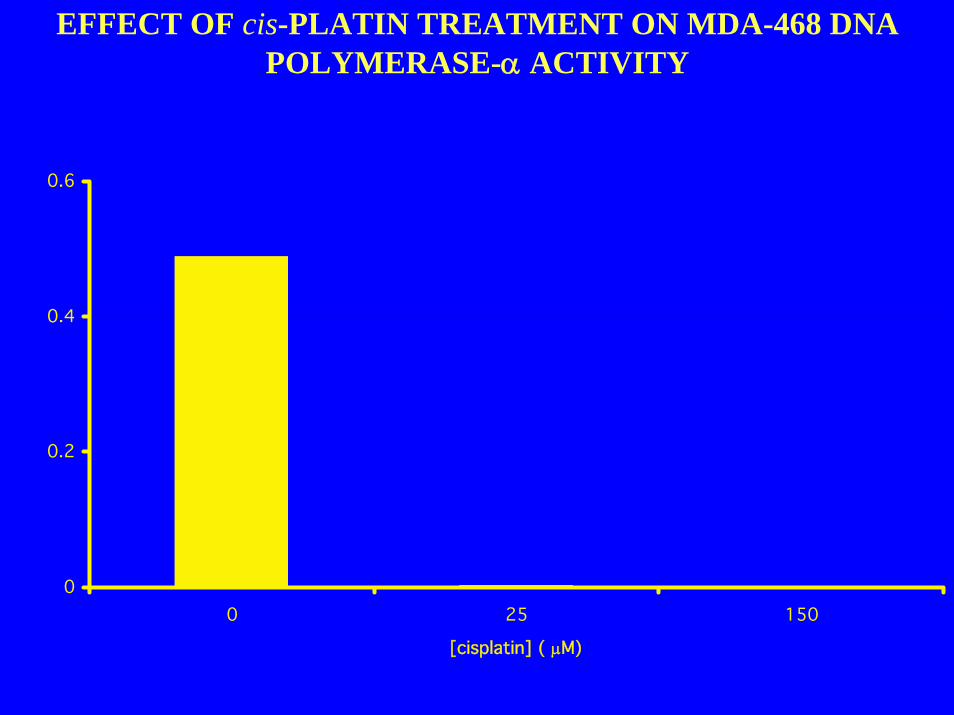
0
0.2
0.4
0.6
0 25 150
[cisplatin] ( μM)
EFFECT OF cis-PLATIN TREATMENT ON MDA-468 DNA POLYMERASE-α ACTIVITY

0
0.3
0.6
0.9
1.2
1.5
0 25 150
[cisplatin] ( μM)
EFFECT OF cis-PLATIN TREATMENT ON SKBR3 DNA POLYMERASE-α ACTIVITY
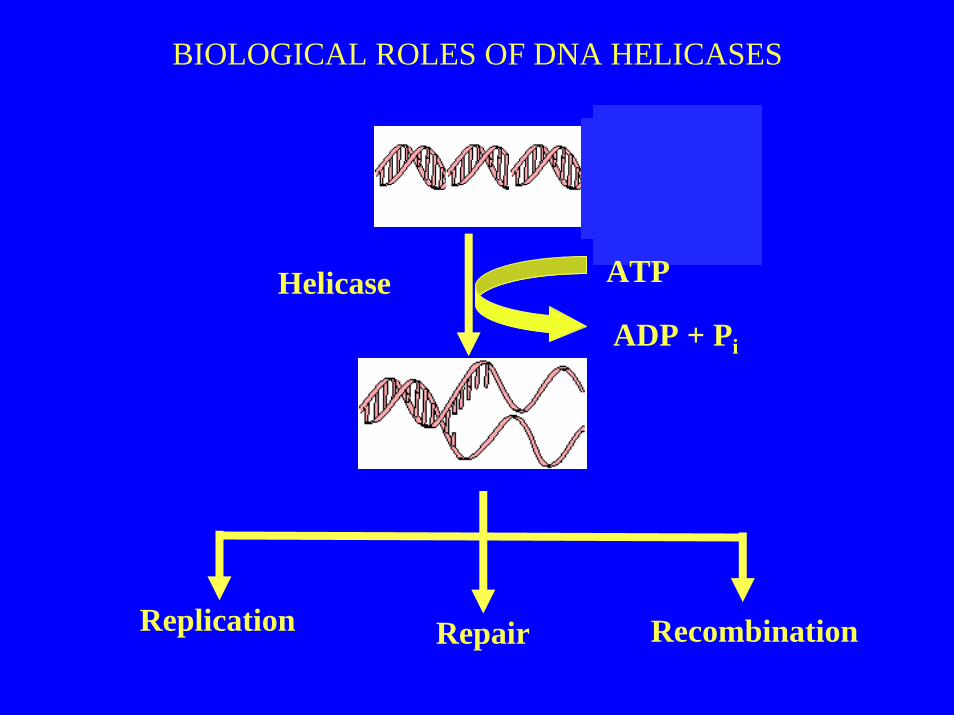
ATP
ADP + Pi
Replication Repair Recombination
Helicase
BIOLOGICAL ROLES OF DNA HELICASES
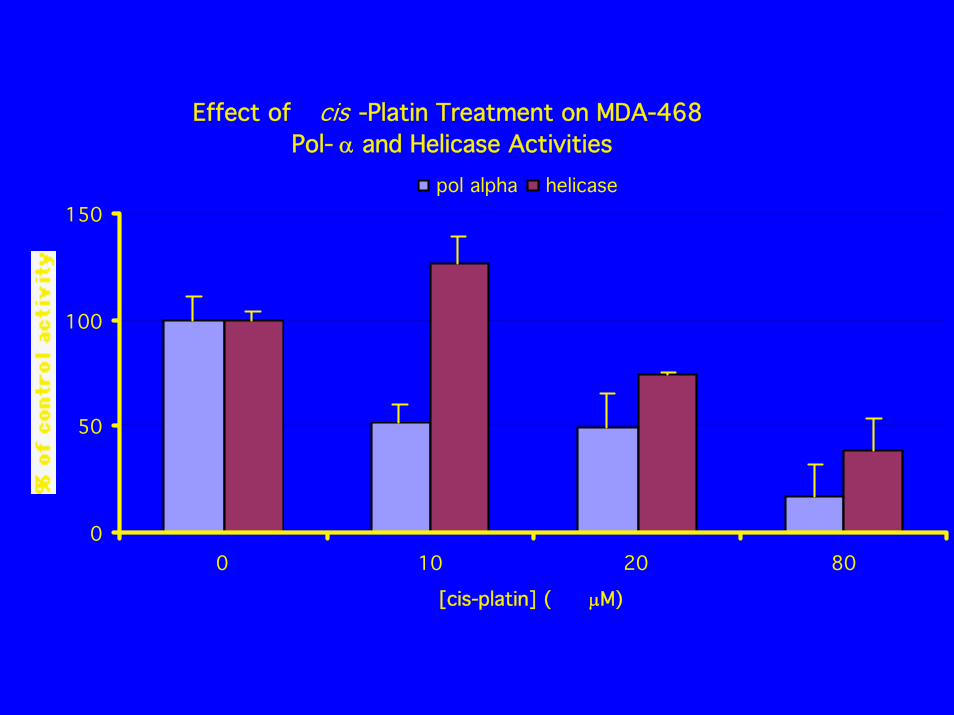
Effect of cis -Platin Treatment on MDA-468 Pol- α and Helicase Activities
0
50
100
150
0 10 20 80
[cis-platin] ( μM)
pol alpha helicase

ROME Assay of Helicase Activities(ROME = Radioactive Oligonucleotide in Membrane filtration Effluent)
5'
5'3'3'
* * *
* * * * * *
* * *
100 mM Tris-HCl pH 8.5 / 8 mM DTT / 1mM MgCl2 / 1 mM ATP / 30 mM KCl / sucrose / 400 μg/ml BSA / enzyme
Filtered through Centricon-30
Descending chromatography with 100ml 0.1 M K-PO4 pH 6.8, 60 g (NH4)2SO4, 2ml n-propanol
Origin (oligonucleotides) counted in toluene based liquid scintillation counting system
Incubated for 2hrs. at 37°C
Filtrate spotted on Whatman-1MM Paper
= [3H] ACT-DNA and [3H] oligonucleotides
= [3H] oligonucleotides [3H]
oligonuc.
[3H] mononuc.
Boyle, P.J., et al . (2003) FASEB J. 17(4), A600

ConclusionDNA Degradation & Deregulation of DNA Biosynthesis in
Apoptotic Cancer cells
1. The Novel ROME assay proved to be an effective measure of DNA helicase activity.
2. Helicase-III complexes with DNA Pol-α in breast and colon carcinoma cells.
3. In apoptotic cells, the activities of both DNA Pol-α and Helicase-III are modified (decreased).


Thank You
Acknowledgement
Prof. Jin-ichi Inokuchi(Hokkaido University)Prof Sipra Banerjee(Cleveland Clinic)Dr.M. BasuRui MaPatrick BoyleHui Liang


Morphological Changes of Apoptotic Breast Cancer Cells Treated with L-PPMP
Control MCF-7 MCF-7 (8μM L-PPMP) 48hrs
SKBR-3 (8μM L-PPMP) 48hrs
MDA-468 (8μM L-PPMP) 48hrs
MCF-7 with (16μM) L-PPMP 48h
SKBR-3 (Control)
MDA-468 (Control)
SKBR-3 (16μM L-PPMP) 48hrs
MDA-468 (16μM L-PPMP) 48hrs

Attachments of Neutrophils and Leukocytes to Endothelial CellsDuring Inflammation

NNH
O
HN
NH HN
O
NO O
O-
O-
N2+N
Detection of Innercellular Membranewith Squaraine Rotaxane (AKS-0)

• Symptoms of endothelial damage immune vasculitis+ Hepatic inflammation
spontaneous phenotype
• Neutrophils in endothelial inflammation (copper cuff) and CLPinduced phenotype
/ p-carboxypept.HKa
gC1qR
ACTIVATION OF PROTEASES DURING INFLAMMATION

Serine protease (trypsin family)released duringinflammation
ElastaseCathepsinTryptaseTrypsinKallikreinThrombin PlasminFactors VII & X
Neutrophils, Monocytes,Eosinophils Natural killer cells Macrophages Mast cells
Cellular responseto inflammation
Innate immune cell responseto inflammation
Epithelial cell, Endothelial cell,Smooth muscleFibroblastPlateletsNeoplastic
BikuninH2
H1
Inter-α-Inhibitor
ActivationBikunin
Uristatin
Uristatin 2Uristatin 1
Inhibition
Additional fragmentation
Bik anti inflammatory system.

H
Increasedproteinexpression
Replication and transcription
Nuclear receptors
Transcriptioninitiation complex
Cell cycle apparatus
Increasedhormoneproduction
Cell proliferation and differentiation
PAR mediated cell proliferation during inflammation.
Nucleus
Extra cellular
Plasmin
uPARActivation
uPA
MembraneSynthesis
PAR Activation
DNA pol-αHelicase
uPAR
MAPK/ERK
PKC
PLA2PLCAC
RAS
PKA
TrypsinThrombin
Cytoplasm
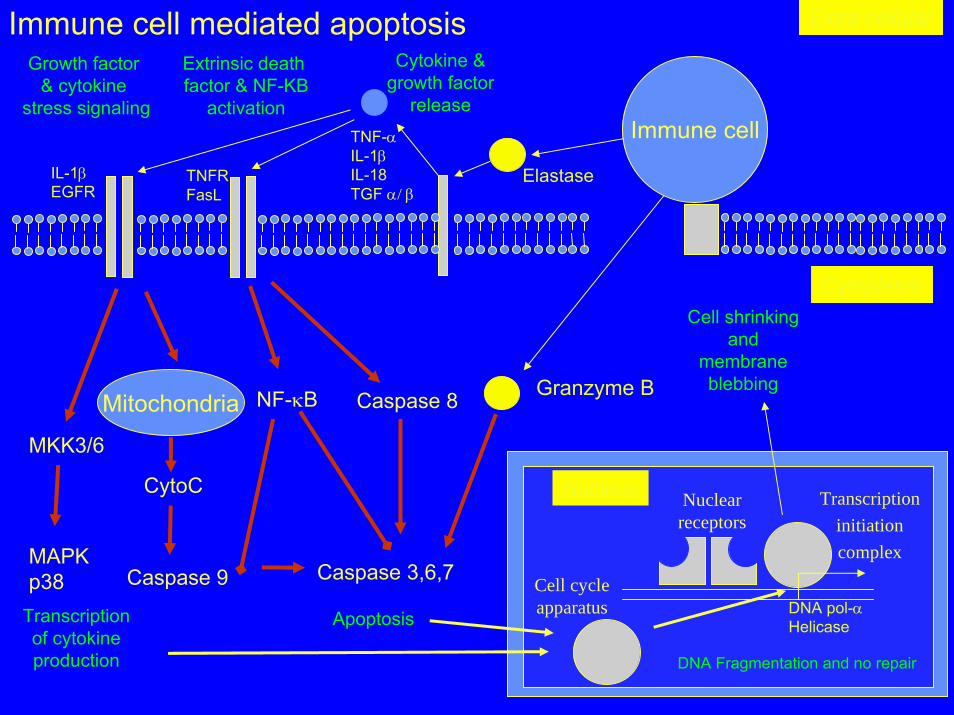
Cytokine &growth factor
release
Extrinsic death factor & NF-KB
activation
Cell shrinking and
membrane blebbing
Growth factor & cytokine
stress signalingImmune cell
Elastase
Extra cellular
TNF-αIL-1βIL-18TGF α/ β
IL-1βEGFR
TNFRFasL
Transcriptionof cytokineproduction
Caspase 9
NF-κB
CytoC
MAPK p38 Caspase 3,6,7
Mitochondria Caspase 8 Granzyme B
Apoptosis
DNA Fragmentation and no repair
Nuclear receptors
Transcriptioninitiation complex
Cell cycle apparatus
Nucleus
Cytoplasm
DNA pol-αHelicase
MKK3/6
Immune cell mediated apoptosis
Ca+
Extra cellular
DNA Fragmentation and no repair
Nuclear receptors
Transcriptioninitiation complex
Cell cycle apparatus
Nucleus
DNA pol-αHelicase
Caspase 9No Activation
observed
NF-κB
Caspase 3
Caspase 8No Activation
observed
No apoptosisobserved
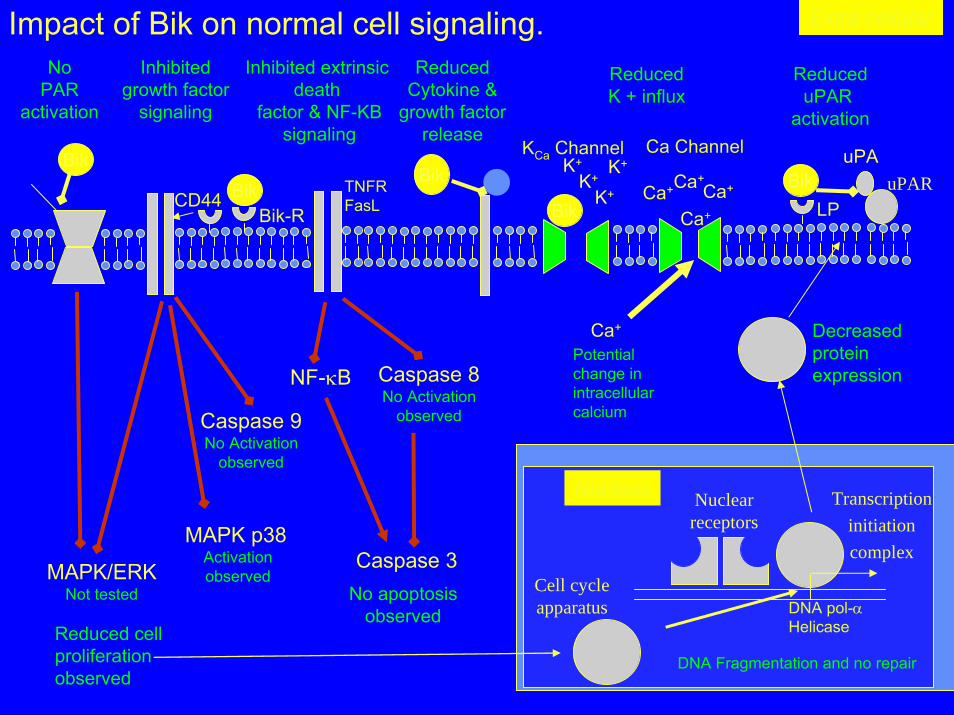
NoPAR
activation
MAPK/ERKNot tested
MAPK p38Activationobserved
ReducedCytokine &
growth factor release
Inhibitedgrowth factor
signaling
Bik-RCD44 Bik
Potential change inintracellularcalcium
Reduced cell proliferationobserved
ReduceduPAR
activation
uPARLP
BikuPA
Impact of Bik on normal cell signaling.
Bik Ca+
KCa ChannelK+
K+
K+
K+
Ca+
Ca+
Ca+
Ca Channel
Bik
Bik
ReducedK + influx
Decreasedproteinexpression
Inhibited extrinsic death
factor & NF-KB signaling
TNFRFasL

Inflammation markers Cut-off Specificity Sensitivity P
Uri (mg/L) >=7.8 mg/L 96% 20% P<0.05
uTi strip(mg/L) >=7.8 mg/L 91% 25% P<0.05
Bik(mg/L) >=2.5 mg/L 100% 19% NS
I-α-I (mg/L) <=36 mg/L 100% 8% NS
CRP(mg/L) >=2 mg/L 97% 10% P<0.05
WBC total count (cell/nL)2 >=10cell/ nL 95% 29% P<0.01
Granulocyte (cell/nL) >=7cell/ nL 100% 27% P<0.05
Lymphocyte (cell/nL) >=3cell/ nL 100% 19% P<0.05
Bik or Uri same as above 92% 36% P<0.01
Bik or Uri or I-α-I same as above 89% 42% P<0.01
Predictive value of inflammation markers for vascular stenosis.
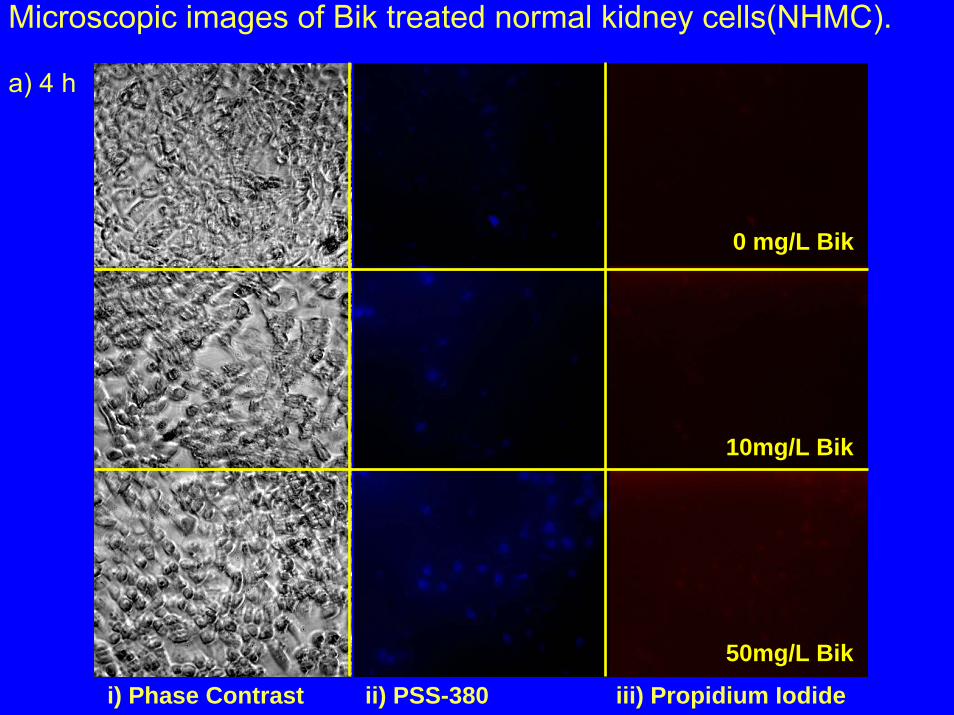
i) Phase Contrast ii) PSS-380 iii) Propidium Iodide
10mg/L Bik
50mg/L Bik
0 mg/L Bik
a) 4 h
Microscopic images of Bik treated normal kidney cells(NHMC).

10mg/L Bik
50mg/L Bik
0 mg/L Bik
i) Phase Contrast ii) PSS-380 iii) Propidium Iodide
b) 24 h

ACKNOWLEDGEMENTSAt Notre Dame Outside Collaboration
Dr. Manju Basu
Patrick J. Boyle 1.Dr. Jin-ichi Inokuchi (Hokkaido University)Rui Ma 2.Dr. Sipra Banerjee (Cleveland Clinic)
3. Dr. Rathin N. Bose (Kent State Univ.)4. Dr. Narendra Tuteja (ICGEB,New Delhi,INDIA)
Chris MoultonBrett CampbellBrian MikkulaMatthew BradleyJames VranishKim St. Jean
NIH/NCI and Bayer Corporation
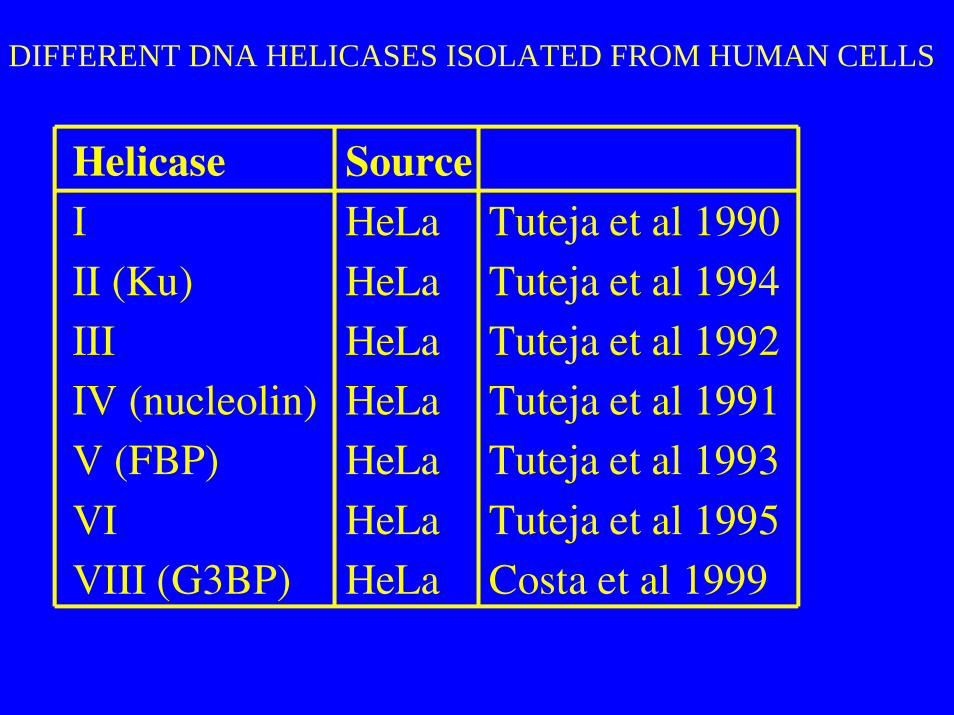
Human DNA Helicases
Helicase SourceI HeLa Tuteja et al 1990II (Ku) HeLa Tuteja et al 1994III HeLa Tuteja et al 1992IV (nucleolin) HeLa Tuteja et al 1991V (FBP) HeLa Tuteja et al 1993
VI HeLa Tuteja et al 1995VIII (G3BP) HeLa Costa et al 1999
DIFFERENT DNA HELICASES ISOLATED FROM HUMAN CELLS

Hypothesis
Mitochondrion
Fas/TNF
FADD
Pro-Caspase-8
Active -Casp-8
Pro-Caspase-3
Casp-3 (p19/12)
Active Casp-3(p17/12)
Caspase-3Activation
DFF/ICAD/PARP etc.
?
DNA Cleavage
?
PI-3 Kinase
Phospho Akt
pBad
Cyto-c
PTP
Pro-Caspase-9 Active-Casp-9
Apaf-1
Glc-GalSASA
(GD3)
CERAMIDE
CGase
Sphingosine
Sph-1-P
PKC
?
GSL (GD3/GD1b)
?
P-Choline (Sphingomyelin)
Sphase
GSL
L-/D-PDMPL-/D-PPMP
P4

- ORC
- Cdt1
- Cdc6
- MCM10
- MCM
- DDK
- Cdc45
- Dpb11
- Pol-α / Primase
- Pol-ε
- RP-ATakisawa, H, Mimura, S., and Kubota, Y. Eukaryotic DNA Replication: from pre-replication complex to initiation complex. Curr. Opin. Cell Biol., 200, 12:690-696.
PROPOSED MODEL FOR FOMATION OF A REPLICATION INITIATION COMPLEX

1. Inhibition of chromosomal DNA replication.( cis-platin in Colo-205)
2. Ceramide-generated from inhibition of the first committed step in the biosynthesis of glycosphingolipids(L/D-PPMP; L/D-PDMP in Colo-205/SKBr3)
3. Ceramide-generated from breakdown of glycosphingolipids.(GD3 & GD1b Gangliosides in SKBr3)
4. Ceramide-generated from breakdown of sphingomyelin.
5. Deregulation of the transcription factors.
WHAT PROVOKES APOPTOSIS ?

H
Increasedproteinexpression
Replication and transcription
Nuclear receptors
Transcriptioninitiation complex
Cell cycle apparatus
Increasedhormoneproduction
Cell proliferation and differentiation
Fig 1a. PAR mediated cell proliferation during inflammation.
Nucleus
Extra cellular
Plasmin
uPARActivation
uPA
MembraneSynthesis
PAR Activation
DNA pol-αHelicase
uPAR
MAPK/ERK
PKC
PLA2PLCAC
RAS
PKA
TrypsinThrombin
Cytoplasm

Cytokine &growth factor
release
Extrinsic death factor & NF-KB
activation
Cell shrinking and
membrane blebbing
Growth factor & cytokine
stress signaling Immune cell
Elastase
Extra cellular
TNF-αIL-1βIL-18TGF α/ β
IL-1βEGFR
TNFRFasL
Transcriptionof cytokineproduction
Caspase 9
NF-κB
CytoC
MAPK p38 Caspase 3,6,7
Mitochondria Caspase 8 Granzyme B
Apoptosis
DNA Fragmentation and no repair
Nuclear receptors
Transcriptioninitiation complex
Cell cycle apparatus
Nucleus
Cytoplasm
DNA pol-αHelicase
MKK3/6
Fig 1b. Immune cell mediated apoptosis

Normal Cells
24h
24hn+1
G2
S
G1
M
24h
Cancer Cells
24h
24h2n
24h
Cell cycle
a) b) c)
Figure 2. Normal and Cancer Cell Growth Regulation.

50 KDa
25 KDa
150 KDa
75 KDa
100 KDa
NormalKidney
Cell(VERO)
Cancer cellLine
(MCF-7)
Cancer cellLine
(MDA-468)
NormalKidney
Cell(VERO)
Cancer cellLine
(MCF-7)
Cancer cellLine
(MDA-468)
50 KDa
25 KDa
150 KDa
75 KDa
100 KDa
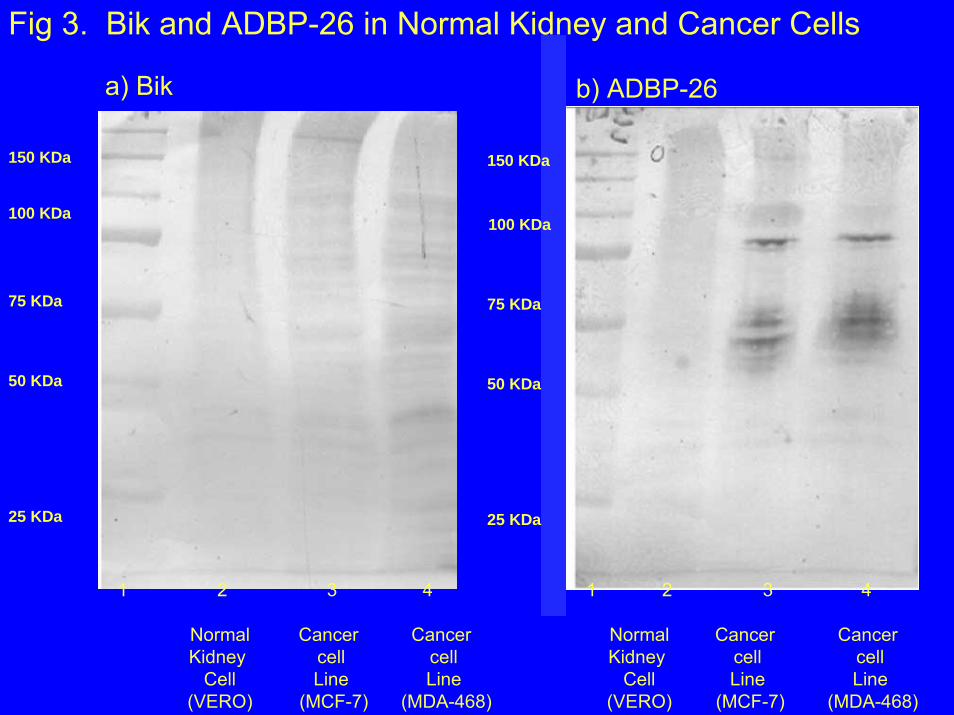
Fig 3. Bik and ADBP-26 in Normal Kidney and Cancer Cells
a) Bik b) ADBP-26
1 2 3 4 1 2 3 4
0
50
100
150
200
250
300
0 5 10 15 20
Hours
Avg
Cel
l N
um
ber
(10^
4)
050
100150200250300350400
0 5 10 15 20Hours
Avg
CPM
/10^
4 c
ells
a)
d)c)
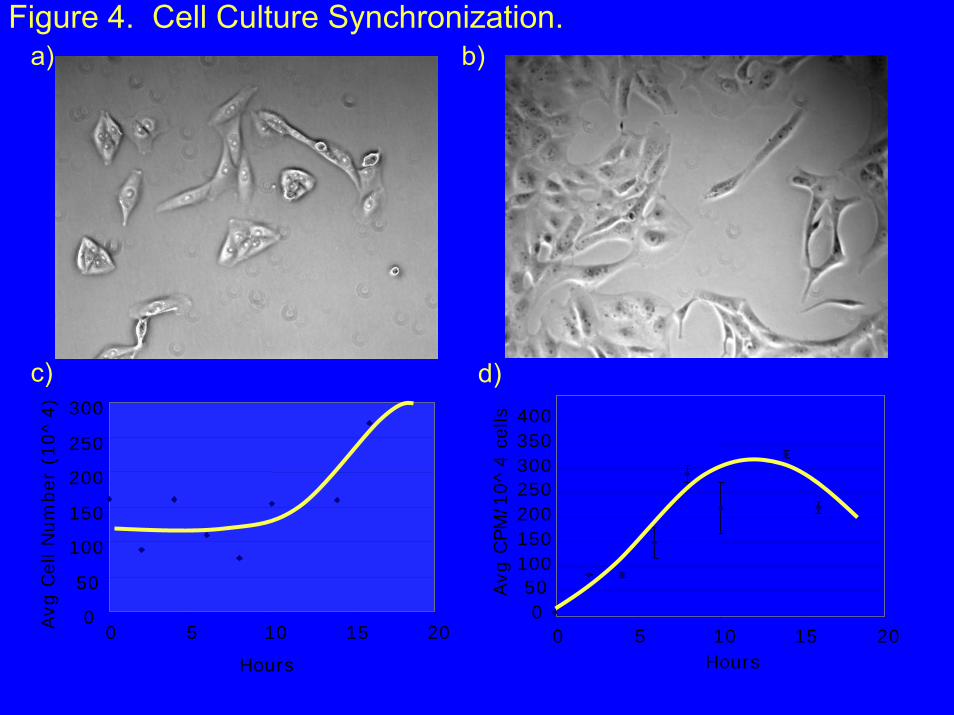
b)Figure 4. Cell Culture Synchronization.
50 KDa
25 KDa
150 KDa
75 KDa
100 KDa
NormalKidney
Cell(VERO)
Cancer cellLine
(MCF-7)
Cancer cellLine
(MDA-468)
NormalKidney
Cell(VERO)
Cancer cellLine
(MCF-7)
Cancer cellLine
(MDA-468)
50 KDa
25 KDa
150 KDa
75 KDa
100 KDa
Fig 3. Bik and ADBP-26 in Normal Kidney and Cancer Cells
a) Bik b) ADBP-26
1 2 3 4 1 2 3 4

Ca+
Extra cellular
DNA Fragmentation and no repair
Nuclear receptors
Transcriptioninitiation complex
Cell cycle apparatus
Nucleus
DNA pol-αHelicase
Caspase 9No Activation
observed
NF-κB
Caspase 3
Caspase 8No Activation
observed
No apoptosisobserved
NoPAR
activation
MAPK/ERKNot tested
MAPK p38Activationobserved
Reducedcytokine &
growth factor release
Inhibitedgrowth factor
signaling
Bik-RCD44 Bik
Potential change inintracellularcalcium
Reduced cell proliferationobserved
ReduceduPAR
activation
uPARLP
BikuPA
Fig 7. Impact of Bik on normal cell signaling.
Bik Ca+
KCa ChannelK+
K+
K+
K+
Ca+
Ca+
Ca+
Ca Channel
Bik
Bik
ReducedK + influx
Decreasedproteinexpression
Inhibited extrinsic death
factor & NF-KB signaling
TNFRFasL

0
2.5
5
7.5
10
12.5
15
17.5
20
22.5
Kid
ney
cell
x106
/mL
0 10 20 30Bik (mg/L)
40 50 60
0
50
100
150
200
250
300
350
400
450
AD
BP-
26 (n
g/m
L)
Figure 6. Kidney cell loss and ADBP-26 release uponexposure to Bik.