Embed Size (px)
Citation preview

February 24, 2011
Industry: Auto and Auto Components Industry View: Overweight Initiating Coverage
“Weathering headwinds”
BuyApollo Tyres
Disclaimer:The information in this document has been printed on the basis of publicly available information, internal dataand other reliable sources believed to be true and is for general guidance only. While every effort is made toensure the accuracy and completeness of information contained, the company makes no guarantee andassumes no liability for any errors or omissions of the information. No one can use the information as the basisfor any claim, demand or cause of action. LKP Securities Ltd., and affiliates, including the analyst who haveissued this report, may, on the date of this report, and from time to time, have long or short positions in, andbuy or sell the securities of the companies mentioned herein or engage in any other transaction involving suchsecurities and earn brokerage or compensation or act as advisor or have other potential conflict of interestwith respect to company/ies mentioned herein or inconsistent with any recommendation and related informa-tion and opinions. LKP Securities Ltd., and affiliates may seek to provide or have engaged in providingcorporate finance, investment banking or other advisory services in a merger or specific transaction to thecompanies referred to in this report, as on the date of this report or in the past.
LKPSince 1948
Key DataMarket Cap (`.bn ) 29
52-Week Range(`) 89 / 44
Avg. Daily Trading Value (`mn) 42
Promoters (%) 40
FII Holding (%) 25
DII Holding (%) 11
Public & Others Holding (%) 24
One Year Indexed( % ) 1 Month 3 Months 12 Months
Absolute 2 (7) 0.3
BSE Relative 6 2 (12.4)
Relative price performance
Y/E March FY 09 FY 10 FY 11E FY 12E
Revenues (` mn) 49,841 81,207 83,719 106,385
EBITDA (%) 8.2 14.4 10.4 9.9
PAT (%) 2.8 7.0 4.0 4.0
EPS (`) 2.8 11.2 6.7 8.5
EPS growth (%) -50.0 306.8 -40.6 27.3
P/E (x) 20.3 5.0 8.4 6.6
P/B(x) 2.1 1.4 1.2 1.0
EV/EBITDA (x) 8.2 3.6 5.7 4.5
ROCE(%) 24.1 48.8 25.9 26.1
ROE(%) 10.3 33.2 14.2 15.4
Dividend yield (%) 1.0 0.9 0.6 0.8
Stock DataCurrent Market Price (`) 56
12 Month Target Price (`) 72
Potential upside (%) 29
Reuters APLO.BO
Bloomberg APTY IN
Apollo Tyres(Apollo) promoted by the Gurgaon based Kanwar family is India’sleading automotive tyre manufacturing company with a capacity tomanufacture 950MT of tyres per day. Apollo is in an expansion mode and isincreasing capacity by more than 50% through a Greenfield plant at Chennai.Apollo derives 65% of its revenues from the replacement markets, 24% fromOEMs and the rest from exports. It has a 27% market share in the CV segmentand 21% share in the PV segment. Internationally, Apollo has operations inEurope through its recent acquisition of Vredestein Banden BV and in SouthAfrica through the Dunlop assets bought out in 2006.
Given its market leadership in CV tyres and strong foothold in PV tyres, the rapidrecovery in the OEM and replacement CV demand post the blip observed followingemission norms gives us confidence that the CV cycle is still intact and on theup-move which should benefit Apollo. With its domestic capacities operating at100% utilization rates the company has gained back the lost market share postthe two month lockout at its Perambra plant. This is expected to offer Apollopricing power in both OEM as well as replacement markets.Increasingdependence on radial tyres through the Chennai plant expansion will supportmargin performance. Despite surging natural rubber prices, we believe Apollowould have enough pricing power and operating leverage through its volumeexpansion led by capacity growth. Even after factoring an average FY 12E NaturalRubber price of `235, we derive a 27% consolidated earnings growth in FY 12Eover FY 11E. Apollo’s International operations would also in our view provide therequired support as both the European and South African auto industries aregrowing and the company is increasing its capacity in Europe and capacityutilization rate in South Africa.
ValuationWith Apollo gaining back its lost market share and attempting to arrest margindecline due to rising input costs through better pricing and capacity expansionwe believe that the stock price factors most of the negatives and initiate coveragewith a BUY rating. We rate Apollo as a BUY with a target price of `72 based on8.5xFY 12E EPS of `8.5 (8.5x being the 5 year average trailing multiple) whichtranslates into an upside of 29%.
50
70
90
110
130
150
170
Feb-10 May-10 Aug-10 Nov-10 Feb-11
Apollo Tyresr) BSE Sensex
Risks and concernsThe key risk faced by Apollo and the entire tyre industry is surging rubber prices.
Slower than expected ramp up at its Chennai plant.
Labour issues keeping in view the recent lockouts at Kerala and South Africa
Weakening auto OEM and replacement demand.
Ashwin [email protected]+91 22 6635 1271
Apollo Tyres
2LKP Research
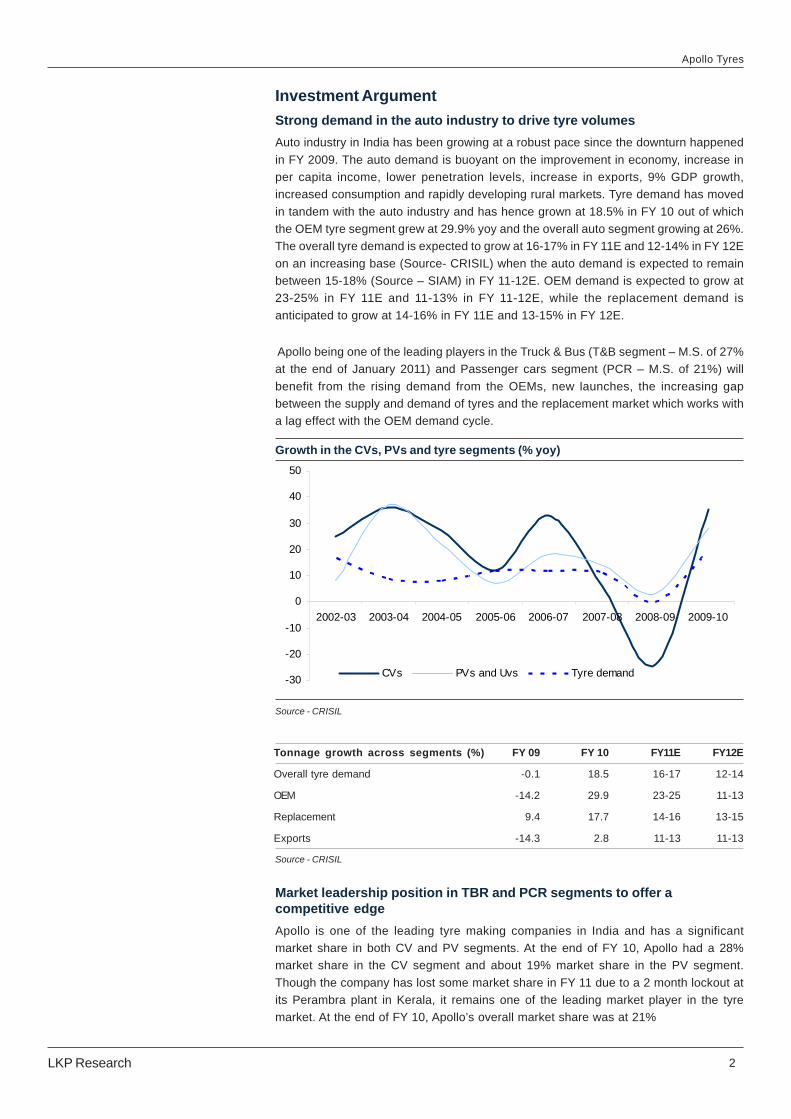
Investment ArgumentStrong demand in the auto industry to drive tyre volumesAuto industry in India has been growing at a robust pace since the downturn happenedin FY 2009. The auto demand is buoyant on the improvement in economy, increase inper capita income, lower penetration levels, increase in exports, 9% GDP growth,increased consumption and rapidly developing rural markets. Tyre demand has movedin tandem with the auto industry and has hence grown at 18.5% in FY 10 out of whichthe OEM tyre segment grew at 29.9% yoy and the overall auto segment growing at 26%.The overall tyre demand is expected to grow at 16-17% in FY 11E and 12-14% in FY 12Eon an increasing base (Source- CRISIL) when the auto demand is expected to remainbetween 15-18% (Source – SIAM) in FY 11-12E. OEM demand is expected to grow at23-25% in FY 11E and 11-13% in FY 11-12E, while the replacement demand isanticipated to grow at 14-16% in FY 11E and 13-15% in FY 12E.
Apollo being one of the leading players in the Truck & Bus (T&B segment – M.S. of 27%at the end of January 2011) and Passenger cars segment (PCR – M.S. of 21%) willbenefit from the rising demand from the OEMs, new launches, the increasing gapbetween the supply and demand of tyres and the replacement market which works witha lag effect with the OEM demand cycle.
Source - CRISIL
Growth in the CVs, PVs and tyre segments (% yoy)
-30
-20
-10
0
10
20
30
40
50
2002-03 2003-04 2004-05 2005-06 2006-07 2007-08 2008-09 2009-10
CVs PVs and Uvs Tyre demand
Tonnage growth across segments (%) FY 09 FY 10 FY11E FY12E
Overall tyre demand -0.1 18.5 16-17 12-14
OEM -14.2 29.9 23-25 11-13
Replacement 9.4 17.7 14-16 13-15
Exports -14.3 2.8 11-13 11-13
Source - CRISIL
Market leadership position in TBR and PCR segments to offer acompetitive edgeApollo is one of the leading tyre making companies in India and has a significantmarket share in both CV and PV segments. At the end of FY 10, Apollo had a 28%market share in the CV segment and about 19% market share in the PV segment.Though the company has lost some market share in FY 11 due to a 2 month lockout atits Perambra plant in Kerala, it remains one of the leading market player in the tyremarket. At the end of FY 10, Apollo’s overall market share was at 21%

Apollo Tyres
3LKP Research
Birla Tyres19%
Ceat13%
JK Tyres18%
MRF19%
Others3%
Apollo28%
Apollo’s market share has fallen by 6% to 15.7% at the end of August and within the CVsegment the market shares have dropped from 28% to about 23% in the first ninemonths of FY 11. In January, the market share in the CV segment was back to 27%while the PV market share has gone up to 21%. Now that the capacity at Perambra isfunctioning in full swing and new capacity buildup is happening at Chennai, we expectthe company to win back its lost market share particularly in the CV segment as theChennai capacity will be mainly catering to the TBR segment in tonnage terms.
Overall Market shares - FY10
Source - CRISIL
Apollo Tyres21%
Others19%
Falcon Tyres3%
TVS Srichakra3%
MRF21%
JK Tyre and Industries
16%
Ceat Tyres11%
Goodyear 6%
Goodyear13%
Ceat3%
JK Tyres19%
MRF19%
Bridgestone23%
Others4% Apollo
19%
PV market share - FY10 CV segment - FY10
Source - CRISIL

Apollo Tyres
4LKP Research
Overall market share in April - August 2010
Companies % Market share
Apollo Tyres Ltd. 15.7
Birla Tyres 12.0
Bridgestone India Pvt. Ltd. 2.5
Ceat Ltd. 10.3
Falcon Tyres Ltd. 2.6
Goodyear India Ltd. 5.4
JK Industries 17.2
MRF Ltd. 23.4
TVS Srichakra Ltd. 3.3
Others 7.7
Source - CRISIL
Apollo’s segmental market share in April-August 2010 (%)
18.820.6
23.3
11.7
0.0
5.0
10.0
15.0
20.0
25.0
Truck and Bus Cars and Uvs LCV Tractors
Replacement market to offer strong potentialPost the emission norms establishment in October, the CV sales, mainly thereplacement market demand softened during the months of November and December.However, January witnessed firming up of replacement demand thus indicating thecontinued strength of the demand in this market. Since most of the vehicle launches inthe PCR segment (Volkswagen Polo, GM Beat, Ford Figo, Honda Jazz, Maruti Swift, FiatGrande Punto, Hyundai i20. Mahindra Xylo) and Truck and Bus segment (Mahindra Gioand Maximo, Prima Trucks from Tata Motors) happened in the last 1-1.5 years, thereplacement sales for these models will start commissioning within a year or so as thereplacement cycle of a tyre is of 2-2.5 years. Also, with slightly reduced governmentspending on the country’s infrastructure, mainly roads, the replacement cycle of tyreswill get reduced thus leading to an added demand for tyres within our investmenthorizon. Replacement sales enjoy higher margins than OEM due to better pricing powerand with Apollo deriving about 65% of its revenues from replacement markets, willwitness an improvement in margin performance.

Apollo Tyres
5LKP Research
Source - CRISIL, LKP Research
Replacement demand trend and % yoy growth
Chennai plant expansion to improve operating leverage and cater to theexpanding demandCapacity constraints by the tyre manufacturers and increasing supply-demand gap inthe tyre industry has led companies across the tyre industry to set up huge expansionplans and thus largely contribute to the auto juggernaut. In an attempt to do so, Apollohas set up a Greenfield plant at Chennai which will be completely functional by FY 13.The plant is producing 150 Tonnes Per Day (TPD) currently, which is expected to moveup to 200 TPD by March 2011 end and 500 TPD by the beginning of FY 13E. For thisproject, the company is investing `23bn over a period of three years till completion ofthe plant. The Chennai plant at its full capacity will produce ~5mn PCR tyres and ~2mnTBR tyres annually. This expansion will not only cater to the topline and to the risingauto demand but will also help Apollo to improve its margin performance due to tworeasons –1). Increase in the volumes of radialized tyres as the entire capacity willproduce the high margin radial tyres and 2). Achieve economies of scale as the completecapacity will be utilized as and when it will be built and add volumes to the top-linesignificantly.
Source: Company , LKP Research
Chennai capacity breakup by FY 13E in terms of tonnage per day
TBR76%
PCR24%
0
200
400
600
800
1000
1200
1400
1600
2001-02 2003-04 2005-06 2007-08 2009-10 2011-12E0.00%2.00%4.00%6.00%8.00%10.00%12.00%14.00%16.00%18.00%20.00%
(mn tonnes) % yoy

Apollo Tyres
6LKP Research
Source: Company , LKP Research
Chennai capacity breakup by FY 13E in terms of tyres per day
PCR73%
TBR27%
Apollo Tyres capacity expansion estimates
Production(TPD) FY 10 FY11E FY 12E FY 13E
Limda, Baroda, Gujarat 450 450 450 450
Bias 330 330 330 330
Radial 120 120 120 120
Perumbra, Cochin, Kerala (Bias) 290 300 330 330
Kalamassarey, Cochin, Kerala (Bias) 100 100 100 100
Chennai, Tamil Nadu (Radial) 0 100 250 450
India Total 840 950 1130 1330
Expansion plan at Maruti Suzuki to boost domestic business toplineMaruti Suzuki, the leading car maker in India is set to expand its capacity by ~45%within the next one year. It will add 5 lakh units to its existing capacity of 1.2 mn. Apollohas a ~21% market share in the PCR segment and has been continuously expandingit. With the PCR tyre industry being divided into five main players – MRF, Apollo,Bridgestone, JK and Goodyear in the descending order of their market shares, webelieve the expansion at Maruti will offer Apollo with demand for at least 21% of theincremental capacity to be added by Maruti which translates into ~1 lakh units or ~5.25lakh tyres, which will be about 5-6% of Apollo’s expected PCR capacity of ~9.6mn tyresby beginning FY 13E. With Chennai plant expanding, Apollo can easily cater to theincreasing demand from Maruti thus lifting its topline. This will be a very big opportunityfor Apollo to improve its volumes and profitability. The impact of this order will be seenfrom H2 FY 12 and FY 13 will witness an even stronger impact from this avenue.
Price hike to negate the impact of raw material cost increaseIn view of the spiraling domestic and international rubber prices due to several climaticadversities for natural rubber growing and tapping across the world, the entire tyreindustry has faced severe margin pressures denting their profitabilities in the past 2quarters. Natural rubber (NR) which contributed 56% of the total raw material costs ofApollo in FY10, has grown at 72% in the period between April to January 2011 on a yoybasis. In order to negate the impact of this on margins, the company has taken 14%price increase in FY 11, which shows that the company has pricing power. However, offlate they have found it difficult to increase prices due to slight softening in thereplacement markets in the last two months of CY 10, CV sales softening onestablishment of new emission norms and the lockout at its Perambra plant in Q2
Source: Company , LKP Research
Apollo Tyres
7LKP Research
FY11 leading to 6% loss in CV market share. In January, the company has managed togain its lost market share and is back to 27% increased their prices by 1-1.5%. As thereplacement demand is seen firming up again, Apollo has got leeway to increaseprices in this high margin business (margins higher by 10-15% than the OEMs) in thecoming future. Also in the OEM business, with auto demand expected to remain buoyant,we believe the company can take price hikes but at a lesser extent than the replacementtyre market.
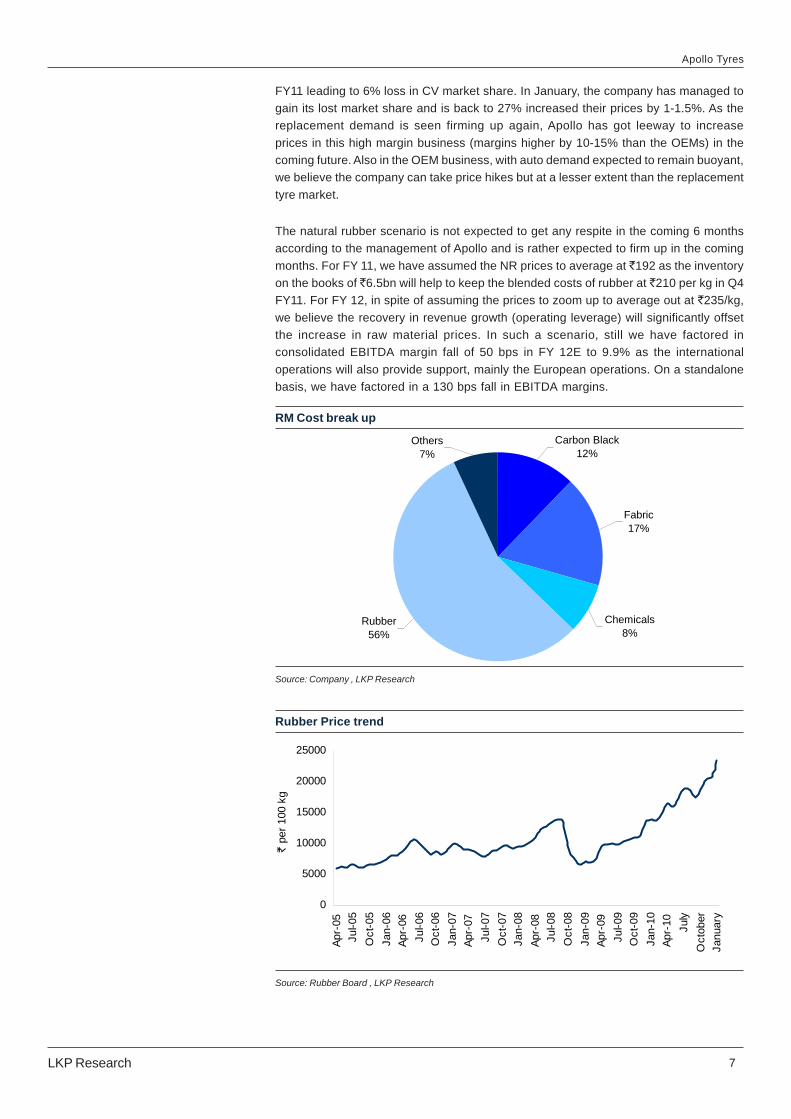
The natural rubber scenario is not expected to get any respite in the coming 6 monthsaccording to the management of Apollo and is rather expected to firm up in the comingmonths. For FY 11, we have assumed the NR prices to average at `192 as the inventoryon the books of `6.5bn will help to keep the blended costs of rubber at `210 per kg in Q4FY11. For FY 12, in spite of assuming the prices to zoom up to average out at `235/kg,we believe the recovery in revenue growth (operating leverage) will significantly offsetthe increase in raw material prices. In such a scenario, still we have factored inconsolidated EBITDA margin fall of 50 bps in FY 12E to 9.9% as the internationaloperations will also provide support, mainly the European operations. On a standalonebasis, we have factored in a 130 bps fall in EBITDA margins.
Source: Company , LKP Research
RM Cost break up
Source: Rubber Board , LKP Research
Rubber Price trend
Chemicals8%
Rubber56%
Fabric17%
Carbon Black12%
Others7%
0
5000
10000
15000
20000
25000
Apr-
05Ju
l-05
Oct
-05
Jan-
06Ap
r-06
Jul-0
6O
ct-0
6Ja
n-07
Apr-
07Ju
l-07
Oct
-07
Jan-
08Ap
r-08
Jul-0
8O
ct-0
8Ja
n-09
Apr-
09Ju
l-09
Oct
-09
Jan-
10Ap
r-10 July
Oct
ober
Janu
ary
` pe
r 100
kg

Apollo Tyres
8LKP Research
Source: Company , LKP Research
Quarterly Standalone RM to sales (%) v/s EBITDA margins(%)
Higher content of radial tyres to protect marginsRadial tyres have longer life cycle, superior quality and hence command a premium tobias tyres (20% better pricing) and have better margins to the tune of 200-300 bpshigher than bias tyres. Currently, in India, the proportion of radial tyres in the MHCVsegment is as low as 8-9%. With improving infrastructure and expected highergovernment spending on roads, we expect a rapid shift towards radial tyres. In FY 10,Apollo had a radial capacity of 120 TPD (14% of total TPD) which has moved to 220TPD(23% of total TPD) currently and is expected to move to 370 TPD (32.5% of total TPD) inFY 12E and 570 TPD (42.5% of total TPD) by the end of FY 13E with the Chennai plantcapacity (450 TPD of radial capacity) operating at full utilization. Due to this, we wouldwitness improvement in margins in FY 13E from a small decline in FY 12E.
Source: Company , LKP Research
YearlyStandalone RM to sales (%) v/s EBITDA margins(%)
60.0%62.0%
64.0%66.0%
68.0%70.0%
72.0%74.0%
76.0%
FY 06 FY 07 FY 08 FY 09 FY 10 FY 11E FY 12E0.0%2.0%4.0%6.0%8.0%10.0%12.0%14.0%16.0%18.0%
RM costs as % of sales EBITDA margins(%)
60.1%
64.7%
67.8% 68.2%67.1%
69.3%
58.8%
10.4%
10.3%10.4%
15.5%16.4%16.5%
14.1%
52.0%54.0%56.0%58.0%60.0%62.0%64.0%66.0%68.0%70.0%72.0%
Q1 FY10 Q2 FY10 Q3 FY10 Q4 FY10 Q1 FY11 Q2 FY11 Q3 FY110.0%2.0%4.0%6.0%8.0%10.0%12.0%14.0%16.0%18.0%
RM costs as a % of sales EBITDA margins (%)
Source: Company , LKP Research
Radialization composition
220
120
570
370
42.9%
32.7%
23.2%14.3%
0
100
200
300
400
500
600
FY 2010 FY 2011E FY 2012E FY 2013E0.0%5.0%10.0%15.0%20.0%25.0%30.0%35.0%40.0%45.0%
Radial TPD Radial as a proportion of total TPD

Apollo Tyres
9LKP Research
Source: Company , LKP Research
Composition of a bias tyre
Nylon fabric9%
Rubber chemicals7%
Bead wires4%
Others 7%
Synthetic rubber 6%
Carbon Black24%
Natural rubber43%
Source: Company , LKP Research
Composition of a radial tyre
Synthetic rubber 28%
Nylon fabric1% Carbon Black
36%
Steel chords12%
Others 9%
Bead wires5%
Rubber chemicals9%
European operations to gain traction on increasing demandApollo acquired Vredestein Branden B.V. (VBBV) a Netherlands based tyre company 1-1.5 years back. Apollo earned about 25% of its FY 10 revenues and 23% of its PAT fromEuropean business. Europe is a sophisticated auto market and the tyre industry overthere contributes 30% of the world tyre market. Apollo has been recording strongnumbers from this market, as in FY 10, the company earned `20 bn from this businessand reported EBITDA margins of 17.5%. October –December and the January to Marchquarters are the best quarters due to increased demand for winter tyres (32% of volumes)thus reflecting seasonality. Apollo has a capacity of 150 TPD in Europe, which is expectedto move up to 170 TPD by the end of FY 11 for a capex of Rs7bn. The capacities arefunctioning at a utilization rate close to 100%. With the European auto industry comingout of woods, we expect Apollo to win higher market share with increasing capacitiesand a better distribution network. We expect these operations to report 14.5% revenueCAGR growth in between FY 10-12E. Due to cost pressures from higher internationalNR prices, we expect margins to fall close to 14% in FY 11 and remain at a similar levelin FY 12E.

Apollo Tyres
10LKP Research
Revenue composition of European business
Source: Company , LKP Research
Replacement91%
OEM9%
Other PC tyres24%
Others16% Passenger car -
Winter tyres32%
Passenger car - Summer tyres
28%
South African business is back in the black and is expected to improvehereonApollo has been struggling in this geography (13% of consolidated revenues and 12%of consolidated PAT in FY 10) since it acquired the South African business of Dunlop in2005-06. Issues like competition, labor unrest and low demand offtake took their toll onApollo’s profitability over there; these operations have been constantly oscillating inloss to minimum profit zone. In FY 2009, the company reported profits of `316mn whichgrew handsomely by 260% in FY 10 to `1451mn. However, in FY 11, the entire SouthAfrican tyre industry faced labor unrest as a result of which Apollo’s plants in SouthAfrica (Durban and Ladysmith) were locked out for 33 days. This led to loss in marketshare in Q2 FY11 and a negative margin of 3% at the operating level.
Now operations are running at full swing with a reported 3% operating margin in Q3FY11 with a 3.4% yoy increase in revenues. In South Africa, Apollo has capacity of 180TPD which is operating at 80% utilization rate. Apollo expects to increase it to 100% inthe coming year, thus catering to the growing SA auto market. With improved operatingleverage, we expect a 4% margin in FY11E and a 6% margin FY 12E from this businesswith revenues expected to grow at CAGR of 12.6% in the period between FY 09-FY 12E.
Source: Company , LKP Research
Revenue composition of South African business
Domestic 80%
Exports20%

Apollo Tyres
11LKP Research
Source: Company , LKP Research
Segmental markets share of Apollo in South Africa
Sensitivity Analysis
Sensitivity analysis(FY 12E)Base case % impact
NR prices(`) 235 0
Conso EBITDA margins 9.9% 0
Conso EPS(`) 8.48 0
Target price(`) 72 0
Bull case
NR prices (`) 223.25 -5
Conso EBITDA margins 11.40% 150 bps
Conso EPS (`) 10.87 28
Target price (`) 92 28
Bear case
NR prices (`) 246.5 5
Conso EBITDA margins 8.40% (150bps)
Conso EPS (`) 6.1 -28
Target price (`) 52 -28
22%
16%18.50%
0%
5%
10%
15%
20%
25%
Passenger cars LCV Trucks and Buses

Apollo Tyres
12LKP Research
Industry backgroundIndian tyre industry is an oligopolistic market with 36 players, though the top 10 contributemore than 90% of the market. The leading tyre companies are MRF (21.8% marketshare), Apollo Tyres (21.7%), JK Tyres (15.7%) and Ceat (10.9%).
Overall mkt share trend 2003-04 2004-05 2005-06 2006-07 2007-08 2008-09 2009-10
Apollo Tyres 21.7 21.9 21.7 21.8 23.5 21.1 21.7
MRF 21 22.4 22 21.9 22.4 23.2 21.8
JK Tyre and Industries 17.1 16.5 18.5 17.6 16.4 16.3 15.7
Ceat Tyres 14.2 13.9 12.4 11.9 11.4 11 10.9
Goodyear 6.8 6.4 6 6.3 6.2 5.3 5.5
TVS Srichakra 2.5 2.4 2.8 3.4 3.5 3.4 3.3
Falcon Tyres 1.9 2 1.9 2.1 2.5 2.4 2.6
Others 14.8 14.6 14.5 15 14.1 17.3 18.5
Segmental Market shares in April-August 2010
(in % terms) Truck and Bus Cars and Uvs LCV Tractors 2/3 wheelers
Apollo tyres Ltd. 18.8 20.6 23.3 11.7 -
Birla tyres 18.3 1.2 7.4 7.3 5.3
Bridgestone India Pvt. Ltd. - 18.4 - - -
Ceat Ltd. 13.1 4.1 9.0 7.7 8.0
Falcon Tyres Ltd. - 0.3 0.1 1.2 17.7
Goodyear India Ltd. 0.3 12.1 0.2 27.6 -
JK tyres 23.2 14.5 20.6 7.2 -
MRF Ltd. 21.3 24.6 25.5 21.8 27.7
TVS Srichakra Ltd. - - - 0.1 22.5
Others 4.9 4.2 13.8 15.4 18.8
In value terms, tyre companies mainly cater to the CV segment (69%) followed by PVs(13%), while the two wheelers, three wheelers, exports and other segments such asOTR, tractors, construction equipments etc collectively comprise 18% of total volumes.
Source - CRISIL
Industry dynamics (Value terms)
MHCV62%LCV
7%
Cars and UVS13%
Others18%
Source - CRISIL
Source - CRISIL

Apollo Tyres
13LKP Research
In tonnage terms, MHCV contributes 55% of total market, while cars and UVs contribute11.5%.
Source - CRISIL
Industry dynamics (Tonnage terms)
LCV7%
Cars and UVS11%
MHCV56%
Others26%
The domestic tyre industry is expected to grow at a CAGR of 14-16% in tonnage termsin the period between 2009-10 to 2011-12 and is expected to cross `400 bn in valueterms mainly driven by OEM demand which is expected to grow at 17-18% andreplacement and exports are expected to grow at 14-15% in the same period. In thelong term (FY 2009-10 to 2014E-2015E), the overall tyre industry is expected to grow at10-11%(Source CRISIL).
Source - CRISIL
Industry Composition
Replacement71%
Exports8%
OEM21%

Apollo Tyres
14LKP Research
Source - CRISIL
Industry Growth (% CAGR)
10.4
13.1
10.69.8
10.9 10.4
0
2
4
6
8
10
12
14
OEM Replecament Total
2004-05 to 2009-10 2009-10 to 2014-15E
The domestic tyre off-take has increased at a CAGR of 10.5% in the period betweenFY2001-02 to FY 2009-10 in line with the buoyant growth in the automobile industry.OEM demand was strong, along with replacement demand which generally functionswith a lag effect to the OEM demand.
Source - CRISIL
Domestic tyre offtake trend (000’s units) Vs % YoY Growth
0
10000
20000
30000
40000
50000
60000
70000
80000
90000
2001-02 2002-03 2003-04 2004-05 2005-06 2006-07 2007-08 2008-09 2009-100%
5%
10%
15%
20%
25%
M&HCV has been the leading driver in the higher tyre offtake as the content per tyre inMHCV is significantly higher than any other tyre, also an MHCV requires 7 tyres per truck(2 front, 4 rear and 1 spare).
Segment wise demand break-up(tyres) 2008-09 2009-10 2010-11E 2011-12E
Million tonnes ` bn Million tonnes ` bn Million tonnes ` bn Million tonnes ` bn
MHCV 743.72 148.3 871.6 180.3 983 219.6 1107.8 261.2
LCV 109.29 17.5 110.5 20.1 149.9 27.7 174 34
Cars and Uvs 150.58 27.9 181 36.7 217 48 251.1 57
Others 325.95 39.41 405 53.3 492.8 67.3 542.8 77.1
Total 1329.54 233.11 1568.1 290.4 1842.7 362.6 2075.7 429.3
Growth % yoy 17.9% 24.6% 17.5% 24.9% 12.6% 18.4%
Source - CRISIL

Apollo Tyres
15LKP Research
Source - CRISIL
Monthly PV Tyres Production (000’s units)
0
500
1000
1500
2000
2500
3000
April
May
June
July
Augu
st
Sept
embe
r
Oct
ober
Nov
embe
r
Dec
embe
r
Janu
ary
Febr
uary
Mar
ch
2009-10 2010-11
In the year FY 11, the production of tyres was robust mainly in the PV segment aspurchasing power of the consumers became stronger on modification in tax slabs,new launches, better consumer sentiments etc. On account of this, the growth inproduction has shown strength every month as PV tyre production has grown 20-30%in the recent month.
However, CV production showed some contraction in the last two months of CY 10 onnew emission norms, keeping customers away for some time from buying the higherpriced vehicles. However, the resilience showed by freight rates and economicimprovement along with upbeat OEM industry and recovery in replacement demandresulted in improvement in January CV sales thus reflecting higher CV tyre production(January CV tyre production figure not known, only direction is known).
Source - CRISIL
Monthly CV Tyres Production (000’s units)
0
500
1000
1500
2000
2500
April
May
June
July
Augu
st
Sept
embe
r
Oct
ober
Nov
embe
r
Dec
embe
r
Janu
ary
Febr
uary
Mar
ch
2009-10 2010-11
Within the tyre segment, radial tyres are recording a strong demand uptick though it willtake some time to make a foothold in the CV segment. Expected added emphasis onroad infrastructure by the government would lead to a stronger demand for radial tyresconsidering its better quality and higher price. In India, radlalization has been seenonly in PV segment (98%), while MHCV has 8.6% of their tyres radialized. Globally,radialization in M&HCV tyres averages at 60%, while in geographies like North America,Europe etc, it is as high as 95%.

Apollo Tyres
16LKP Research
Source - CRISIL
Redialization (%)
100 96 95
7157
48
208.6
65
0
20
40
60
80
100
120
Wes
tern
Euro
pe
Nor
thAm
eric
a
Cen
tral
Euro
pe
Afric
a/M
iddl
eEa
st A
sia
Sout
hAm
eric
a
Asia
East
ern
Euro
pe
Indi
a
Wor
ld
Radialization attracts higher capex and margins. Level of radialization in M&HCV isexpected to move rapidly upto 22-23% by FY 2014-15E (source – CRISIL) on most ofthe tyre players expanding their radial capacities going forward.
With the surge in auto demand, most of the leading tyre companies are taking significantcapacity increases, mainly in the TBR segments, which will improve the proportion ofTBR within the total tyre market.
Along with these domestic companies, global players like Bridgestone and Michelinhave also plans to expand their capacities for an investment of `66bn collectively toleverage India’s automotive growth story. Capacity utilization trend suggests that all thetyre players are functioning at >90% capacity utilization rates thus signifying the strongdemand for automobiles. Most of these expansions are happening in the TBR segmentthus indicating a latent increase in the industry profitability and also the per tonnecapex which is almost double in case of radial tyres as compared to bias tyres. Chinahas been a threat to the Indian tyre industry (imports of 6-7%), however with hugedomestic capacities in the offing this threat will no longer exist.
Company name Current capacity Capacity Timeline Capex
(mn tyres p.a.) expansion (%) (` bn)
Ceat 4.7 ~40 FY 10-12 ~7
Apollo(TBR) 13.1 ~33 FY11-13 ~23
JK Tyres(TBR) 9.1 ~30 FY12 ~15
MRF(TBR) 28.4 ~22 FY11-13 ~30
Segment wise radialization ( %) in India
Segment 2006-07 2007-08 2008-09 2009-10 2014-15E
MHCV 3.6 5.3 8.6 9.8 22-23
LCV 12 15 18 20 25-26
Passenger cars and Uvs 95 97 98 98 98-100
Tyre Industry Capex layout
Source - CRISIL
Source: Company , LKP Research

Apollo Tyres
17LKP Research
Source - CRISIL
Capacity utilization trend in tyre industry
A major threat for the tyre sector has been higher raw material prices mainly emanatingfrom higher rubber prices. Basically Thailand, Indonesia, Malaysia and India accountfor 83.5% of world’s rubber production.
89
96.4
94.895.598
84
86
88
90
92
94
96
98
100
2006-07 2007-08 2008-09 2009-10 2010-11E
Source - CRISIL
Global Production Break-up
Thailand34%
Indonesia29%
Others1%
China7%
Vietnam9%
India10%
Malaysia10%
Globally, supply of natural rubber is expected to be low on the shortage of NR from themajor rubber producing nations like Thailand, Malaysia and India (collectively 55% ofglobal production) due to unfavorable weather conditions. Owing to this the prices ofrubber are unusually firming up. On the other hand, the demand is very strong acrossthe globe for auto industry which is further putting an upward pressure on the rubberprices in the short to medium term.
(000 tonnes) 2007 2008 2009 2010 2011E
Consumption 10152 10200 9425 10500-11000 11000-12000
Growth (%) 0.5% -7.6% 11-13 7-9
Production 9833 10042 9662 10200-10700 10500-11500
Growth(%) 2.1% -3.8% 4-6 3-5
Surplus/deficit (319.00) (158.00) 237 (300-350) (650-750)
Global Production v/s Consumption of natural rubber

Apollo Tyres
18LKP Research
However, the significant area which was brought under cultivation in India and China inCY 2005 will start yielding rubber by CY 2012 as it takes 6-7 years for plantation tomature, thus resulting in a sizeable increase in tapped area. Also improving yield inIndia is adding to the positive expectations about reducing the gap between supply anddemand and calming down of rubber prices.
Global tyre industrySince Apollo has international operations, it is important to track the international tyremarkets where Goodyear, Michelin, Continental and Bridgestone are the main playersderiving major revenues from the PCR and LCVs segment.
Global Tyre market shares Global Tyre Industry composition
Source - CRISIL
Sumitomo3%
Pirelli4% Continental
6%
Goodyear16%
Michelin17%
Yokohoma3%
Others34%
Bridgestone17%
Passenger cars and LCVs
60%
Trucks and buses27%
Earth movers6%
2 wheelers4%
Agricultural2% Aircraft
1%
Apollo Tyres
19LKP Research
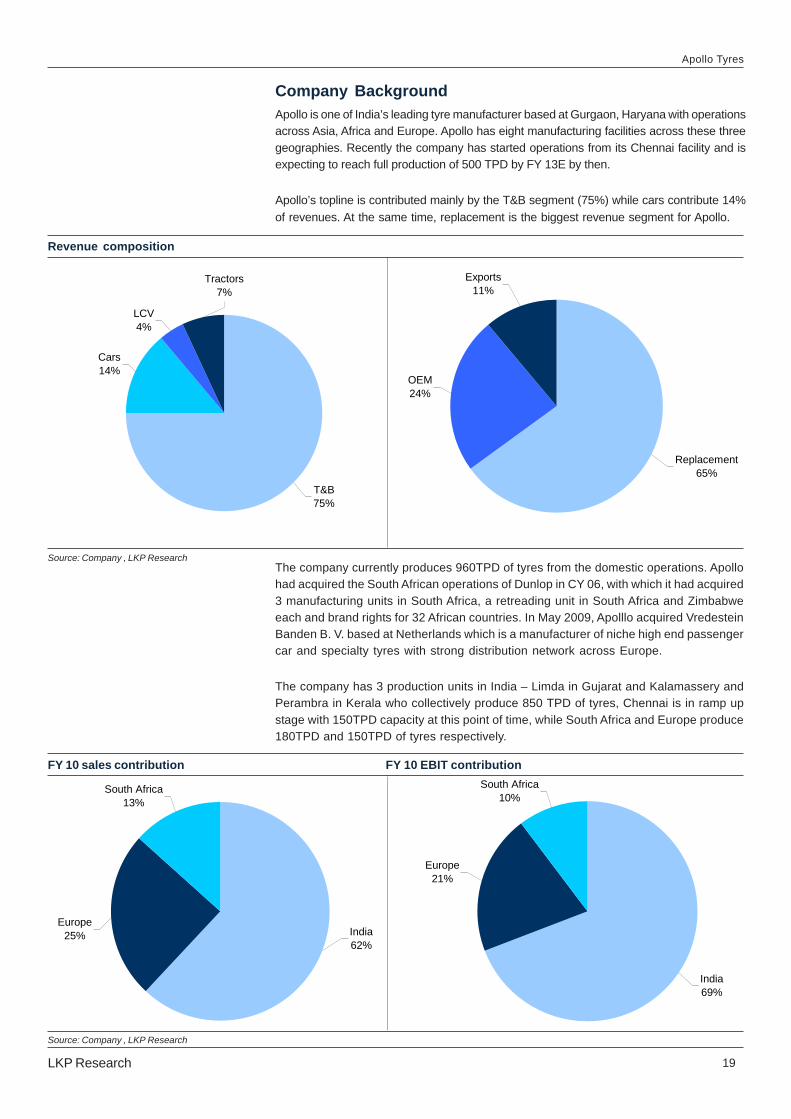
Company BackgroundApollo is one of India’s leading tyre manufacturer based at Gurgaon, Haryana with operationsacross Asia, Africa and Europe. Apollo has eight manufacturing facilities across these threegeographies. Recently the company has started operations from its Chennai facility and isexpecting to reach full production of 500 TPD by FY 13E by then.
Apollo’s topline is contributed mainly by the T&B segment (75%) while cars contribute 14%of revenues. At the same time, replacement is the biggest revenue segment for Apollo.
The company currently produces 960TPD of tyres from the domestic operations. Apollohad acquired the South African operations of Dunlop in CY 06, with which it had acquired3 manufacturing units in South Africa, a retreading unit in South Africa and Zimbabweeach and brand rights for 32 African countries. In May 2009, Apolllo acquired VredesteinBanden B. V. based at Netherlands which is a manufacturer of niche high end passengercar and specialty tyres with strong distribution network across Europe.
The company has 3 production units in India – Limda in Gujarat and Kalamassery andPerambra in Kerala who collectively produce 850 TPD of tyres, Chennai is in ramp upstage with 150TPD capacity at this point of time, while South Africa and Europe produce180TPD and 150TPD of tyres respectively.
Revenue composition
Source: Company , LKP Research
LCV4%
Tractors7%
T&B75%
Cars14%
Replacement65%
OEM24%
Exports11%
FY 10 sales contribution FY 10 EBIT contribution
Source: Company , LKP Research
Europe25% India
62%
South Africa13%
South Africa10%
India69%
Europe21%
Apollo Tyres
20LKP Research
Outlook and ValuationApollo has faced the heat of rising commodity prices, softening replacement demandand labor unrest in the recent past. In the coming future, in the domestic markets, webelieve the replacement market has firmed up again after a temporary blip followingthe establishment of emission norms. OEM demand is strong and will continue to bestronger and demand from the OEM CV segment will be driven by the improvement inthe economy and increasing freight rates which will offset the increase in interestrates. In the PCR segment, the company will leverage its dominant position throughgaining important orders like the one associated with the expansion of Maruti’scapacities. The capacity expansion at Apollo’s Chennai plant is on schedule and willsignificantly increase the radial capacity of the company thus leading to a significantmargin improvement in the latter half of FY 12E thus negating the impact of raw materialcost hike upto a great extent and also contributing to a strong revenue growth. Thecompany had lost its pricing power in the second quarter of FY 11 due to lockouts at itsvarious plants, however, with the tyre demand remaining strong and Apollo once againgaining its lost market share in the CV business back to 27% has gained its marketleadership position, thus winning the pricing power.
Even after factoring average FY 12E NR price at `235 and a 50 bps fall in EBITDAmargins, we derive a 27% consolidated earnings growth in FY 12E over FY 11E. One ofthe main contributors to this growth is the European business which is expected toreport stronger growth on recovery in European auto industry and the company’s nicheposition in the winter tyres segment considering the stronger winters in Q3 and Q4 inEurope. Expansion of capacities in Europe will also accommodate the rising autodemand over there. In South Africa, we expect a stable growth in revenues andimprovement in margins going forward on expected increase in utilization rates (currently~80%). Thus we believe that despite raw material prices zooming up, Apollo has thepricing power and scale of operations with expanding capacities to protect its marginsand at the same time increasing its market share. International operations will providethe required support as compared to other tyre companies which are purely dependenton the vulnerable domestic operations.
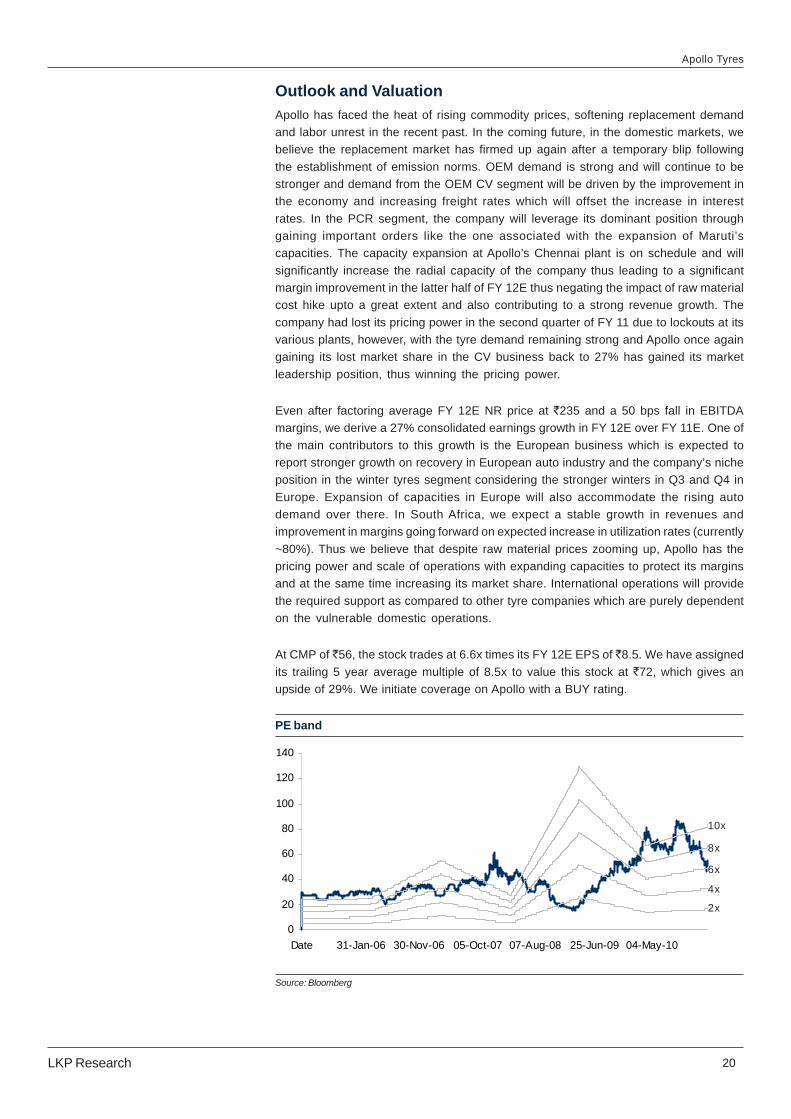
At CMP of `56, the stock trades at 6.6x times its FY 12E EPS of `8.5. We have assignedits trailing 5 year average multiple of 8.5x to value this stock at `72, which gives anupside of 29%. We initiate coverage on Apollo with a BUY rating.
Source: Bloomberg
PE band
0
20
40
60
80
100
120
140
Date 31-Jan-06 30-Nov-06 05-Oct-07 07-Aug-08 25-Jun-09 04-May-10
10x
8x
6x
4x
2x

Apollo Tyres
21LKP Research
Risks and concernsThe major risk which we see for the company and the entire tyre industry is thehigher than expected hike in the RM prices. Among the RM, natural rubber prices arethe biggest risk. If production constraints do not get resolved globally in the nearfuture, we may see immense pressure on the margins. Synthetic rubber prices mayalso increase on increasing in crude prices
Slower than expected ramp up at the Chennai plant may not provide the necessaryjump in volumes
Labour issues remain a concern keeping in view the recent lockouts at Kerala andSouth Africa
Weakening of auto OEM and replacement demand due to rising interest rates andlower freight rates
Reduction in pricing power on account of production constraints and competitionmay hamper margins

Apollo Tyres
22LKP Research
Financial Summary (Consolidated)Income statement Balance sheetYE Mar (`̀̀̀̀mn) FY 09 FY 10 FY 11E FY 12E
Total Revenues 49,841 81,207 83,719 106,385
Raw Material Cost 34,003 45,808 47,420 62,923
Employee Cost 4,015 10,481 12,798 15,119
Other Exp 6,691 11,547 12,809 15,474
EBITDA 4,090 11,685 8,676 10,485
EBITDA Margin(%) 8.2% 14.4% 10.4% 9.9%
Other income 446 467 500 600
Depreciation 1,285 2,542 3,048 3,834
Interest 1118 1343 1454 1464
PBT 2,134 8,266 4,675 5,787
PBT Margin(%) 4.3% 10.2% 5.6% 5.4%
Tax 742 2,607 1,315 1,511
Adj PAT 1,391 5,660 3,359 4,276
Adj PAT Margins (%) 2.8% 7.0% 4.0% 4.0%
Exceptional items 0.0 873.7 0.0 0.0
PAT 1392 6534 3359 4276
PAT Margin (%) 2.8% 8.0% 4.0% 4.0%
YE Mar (`̀̀̀̀mn) FY 09 FY 10 FY 11E FY 12E
SOURCES OF FUNDS
Equity Share Capital 504 504 504 504
Reserves & Surplus 12,992 19,174 23,166 27,225
Total Networth 13,496 19,678 23,671 27,729
Total debt 8,907 17,072 26,072 25,072
Net Deferred Tax Liability 0 0 0 0
Total Liabilities 22,404 36,750 49,742 52,801
APPLICATION OF FUNDS
Net block 14,254 25,600 34,552 37,718
Capital WIP 2,814 5,360 5,860 6,360
Investments 48 59 59 59
Current Assets
Cash and Bank 3,621 3,490 4,811 6,184
Inventories 6,302 9,929 10,523 13,791
Sundry Debtors 2,247 7,869 9,175 10,201
Loan, Advances & others 5,895 8,275 9,175 9,618
Current Liab & Prov
Current liabilities 5,860 13,122 13,584 16,894
Provisions 4,982 8,239 8,315 11,723
Net Current Assets 7,228 8,245 11,785 11,178
Def. tax assets(liab.) -1,942 -2,514 -2,514 -2,514
Total Assets 22,404 36,750 49,742 52,801
Key RatiosYE Mar FY 09 FY 10 FY 11E FY 12E
Per Share Data (`)
Adj. EPS 2.8 11.2 6.7 8.5
CEPS 7.2 6.9 9.5 12.3
BVPS 26.8 39.0 47.0 55.0
DPS 0.6 0.5 0.3 0.4
Growth Ratios(%)
Total revenues 6.2 62.9 3.1 27.1
EBITDA -29.7 185.7 -25.7 20.8
PAT -48.4 306.8 -40.6 27.3
EPS Growth -50.0 306.8 -40.6 27.3
Valuation Ratios (x)
PE 20.3 5.0 8.4 6.6
P/CEPS 7.8 8.1 5.9 4.6
P/BV 2.1 1.4 1.2 1.0
EV/Sales 0.7 0.5 0.6 0.4
EV/EBITDA 8.2 3.6 5.7 4.5
Operating Ratios (Days)
Inventory 67.6 79.1 81.0 80.0
Recievable 62.9 104.6 98.0 95.0
Payables 53.5 65.7 64.0 68.0
Net Debt/Equity (x) 0.39 0.69 0.90 0.68
Profitability Ratios (%)
ROCE 24.1 48.8 25.9 26.1
ROE 10.3 33.2 14.2 15.4
Dividend payout 20.8 4.7 5.0 5.0
Dividend yield 1.0 0.9 0.6 0.8
Cash FlowYE Mar (`̀̀̀̀mn) FY 09 FY 10 FY 11E FY 12E
PBT 2,134 9,140 4,675 5,787
Depreciation 1,285 2,542 3,048 3,834
Interest 1,098 1,157 1,454 1,464
Chng in working capital 467 1,992 (2,263) 1,980
Tax paid (680) (1,764) (1,315) (1,511)
Other operating activities (54) 57 947 (3)
CF from operations (a) 4,250 13,125 6,545 11,551
Capital expenditure (5,019) (10,444) (12,500) (7,500)
Chng in investments 23 (2,441) 0 0
Other investing activities (225) 744 0 0
CF from investing (b) (5,221) (12,142) (12,500) (7,500)
Free cash flow (a+b) (971) 983 (5,955) 4,051
Inc/dec in borrowings 1,665 735 9,000 (1,000)
Dividend paid (incl. tax) (290) (264) (168) (214)
Other financing activities (704) (1,272) (1,454) (1,464)
CF from financing (c) 671 (801) 7,378 (2,678)
Net chng in cash (a+b+c) (300) 182 1,423 1,373
Foreign excg fluctutions 551 44 0 0
Closing cash & cash equivts 2,941 3,388 4,811 6,184
Bank deposits with 3 mts tenr.680 102 0 0
Adj. Closing cash & cash eqvts 3,621 3,490 4,811 6,184
Source: Company , LKP Research

L K PL K PL K PL K PL K P
LKP Securites Ltd,10th floor, Nariman Bhavan, Nariman Point, Mumbai-400 021. Tel -91-22 - 66351234 Fax- 91-22-66351249. www.lkpsec.com
LKPLKPLKPLKPLKP
Research TeamS. Ranganathan Head of Research Pharmaceuticals , Agriculture 6635 1270 [email protected]
Ashwin Patil Research Analyst Automobiles & Telecom 6635 1271 [email protected]
Chaitra Bhat Research Analyst Banking & Financial Services 6635 1211 [email protected]
Ami Shah Research Analyst Cement & Sugar 6635 1247 [email protected]
Deepak Darisi Research Analyst Energy 6635 1220 [email protected]
Dwaipayan Poddar Technical Analyst 6635 1272 [email protected]
Institutional EquitiesPratik Doshi Director 98210 47676 - [email protected]
Hardik Mehta Sales 98190 66569 6635 1246 [email protected]
Varsha Jhaveri Sales 93241 47566 6635 1296 [email protected]
Hitesh Doshi Sales 93222 45130 6635 1281 [email protected]
Kalpesh Vakharia Dealing 98193 08082 6635 1267 [email protected]
Gurdarshan Singh Dealing 93228 61461 6635 1246 [email protected]