Embed Size (px)
Citation preview


Foreword
I am delighted to introduce the 2011 edition of the APO Productivity Databook, especially since the release of this volume coincides with the APO’s 50th an-niversary. The APO’s half-century of commitment to contributing to the socio-
economic development of its member economies through productivity gains has translated into tangible achievements for all. Over the past five decades, the size of the combined GDP of APO member economies has grown by almost five-fold. The APO economies as a whole have also rebounded quickly from the recent global financial crisis and are on track to continue their sterling performance.
The size of the combined APO economies has also been catching up rapidly with that of developed economies such as the USA and EU members. I believe that continued productivity growth will be a powerful driver of economic growth for our members in coming decades. To chart effective economic policy directions, careful analysis of the potential sources of economic growth is critical. I sincerely hope that the readers of this APO Productivity Databook will find its detailed com-parative productivity analyses practical and useful for both public and private decision making.
This edition includes some notable improvements, such as expansion of total fac-tor productivity (TFP) analysis to an additional five member countries, Malaysia, Mongolia, Hong Kong, Vietnam, and Singapore. In total, TFP has been com-puted for 12 APO member countries. There is also wider, more precise coverage of the economic indicators, which allows better cross-country comparisons. This publication is the fruit of the APO Productivity Databook Project, initiated by the Research and Planning Department of the APO Secretariat, in collaboration with Keio Economic Observatory, Keio University, Tokyo.
I would like to thank all 17 national experts for this project for providing the national data in line with the APO methodology. My profound gratitude goes to the team of productivity specialists-cum-authors of this publication at the Keio Economic Observatory: Professor Koji Nomura, Ms. Eunice Y. M. Lau, Ms. Kyoko Ishikawa, Ms. Shinyoung Oh, Mr. Fumio Momose, Ms. Keiko Inoue, and Mr. Hiroshi Shirane, who worked hard to upgrade the quality of data and methodol- ogy for the APO Productivity Databook Project. The solid data analyses for extend-ed international comparisons of productivity performance would not have been possible without their commitment and partnership with the APO.
Ryuichiro Yamazaki
Secretary-GeneralAsian Productivity OrganizationTokyo, April 2011
ix
Contents
iii
1 Introduction ...............................................................................................................................................................................................................................................................................................................................................
1.1 APO Productivity Databook 2011 ..............................................................................................................................................................................................................................................................
1.2 List of Contributors ......................................................................................................................................................................................................................................................................................................................
2 Overview ...............................................................................................................................................................................................................................................................................................................................................................
3 Development of Asian Economy .....................................................................................................................................................................................................................
3.1 Economic Scale .....................................................................................................................................................................................................................................................................................................................................
3.2 Economic Growth ............................................................................................................................................................................................................................................................................................................................
3.3 Catching Up in Per Capita GDP ......................................................................................................................................................................................................................................................................
3.4 Labor Utilization .................................................................................................................................................................................................................................................................................................................................
4 Output Growth: The Demand-side Story ..................................................................................................................................................................
4.1 Composition of Final Demand ............................................................................................................................................................................................................................................................................
4.2 Demand-side Growth Decomposition ...............................................................................................................................................................................................................................................
5 Productivity: The Supply-side Story ......................................................................................................................................................................................................
5.1 Per Worker Measure of Labor Productivity ...............................................................................................................................................................................................................................
5.2 Per Hour Measure of Labor Productivity ........................................................................................................................................................................................................................................
5.3 Total Factor Productivity .....................................................................................................................................................................................................................................................................................................
5.4 Enhancement of Labor Productivity .........................................................................................................................................................................................................................................................
6 Industry Perspective ................................................................................................................................................................................................................................................................................................
6.1 Output and Employment .................................................................................................................................................................................................................................................................................................
6.2 Industry Origins of Economic Growth ................................................................................................................................................................................................................................................
6.3 Industry Origins of Labor Productivity Growth ................................................................................................................................................................................................................
7 Real Income and Terms of Trade ...............................................................................................................................................................................................................
References ..................................................................................................................................................................................................................................................................................................................................................................
Appendix ..........................................................................................................................................................................................................................................................................................................................................................................
A.1 Data List ...............................................................................................................................................................................................................................................................................................................................................................
A.2 Data Sources .............................................................................................................................................................................................................................................................................................................................................
A.3 Industry Classification ............................................................................................................................................................................................................................................................................................................
1
1
1
5
11
11
16
20
27
31
31
39
47
47
51
55
65
71
71
77
84
91
99
101
102
138
139
Contents
iv
Compilation of National Accounts in Asian Countries ...................................................................................................................................................................................
Adjustments in GDP .......................................................................................................................................................................................................................................................................................................................
Limitations of GDP as a Welfare Measure ..................................................................................................................................................................................................................................
Populations of Asian Countries ............................................................................................................................................................................................................................................................................
Quarterly Growth in Asia ..................................................................................................................................................................................................................................................................................................
Being Resource Rich – A Blessing or a Curse? ..................................................................................................................................................................................................................
Measuring Hours Worked .................................................................................................................................................................................................................................................................................................
Capital Stock and Quality Change ..............................................................................................................................................................................................................................................................
Capital Services and Endogenous Rate of Return ......................................................................................................................................................................................................
Sensitivity of TFP Estimates .............................................................................................................................................................................................................................................................................................
Cross-country Comparisons of GDP Using Market Exchange Rate, 1970, 1990, 2000,
2007, and 2008 .....................................................................................................................................................................................................................................................................................................................................
Cross-country Comparisons of GDP Using PPP, 1970, 1990, 2000, 2007, and 2008 .........................................................
Cross-country Comparisons of GDP Growth, 1990–1995, 1995–2000, 2000–2005, and
2005–2008 ........................................................................................................................................................................................................................................................................................................................................................
Cross-country Comparisons of Per Capita GDP, 1970, 1990, 2000, 2007, and 2008 .......................................................
Country Groups Based on the Initial Economic Level and the Pace of Catching Up with the US ................
Comparisons of Final Demand Shares in GDP, 1970, 1980, 1990, 2000, and 2008 ..........................................................
Cross-country Comparisons of Per-worker Labor Productivity Levels, 1970, 1980, 1990,
2000, 2007, and 2008 ...........................................................................................................................................................................................................................................................................................................
Cross-country Comparisons of Labor Productivity Growth, 1990–1995, 1995–2000,
2000–2005, and 2005–2008 ..................................................................................................................................................................................................................................................................................
Cross-country Comparisons of Per-hour Labor Productivity Levels, 1970, 1980, 1990,
2000, 2007, and 2008 ...........................................................................................................................................................................................................................................................................................................
Cross-country Comparisons of Labor Productivity Growth, 1990–1995, 1995–2000,
2000–2005, and 2005–2008 ..................................................................................................................................................................................................................................................................................
Output Growth and Contributions of Labor, Capital, and TFP ....................................................................................................................................................
Role of TFP and Capital Deepening in Labor Productivity Growth, 1970–2008 ..................................................................................
Country Groups Based on the Current Economic Level and the Pace of Catching Up with the US .......
Output Growth by Industry, 2000–2008 ........................................................................................................................................................................................................................................
Cross-country Comparisons of Labor Productivity Growth by Industry, 2000–2008 .................................................................
Cross-country Comparisons of Growth Rates of Real Income, Real GDP, and Terms of
Trade, 1970–2008, 1995–2000, 2000–2005, and 2005–2008 ..............................................................................................................................................
Parameters in Hyperbolic Function .............................................................................................................................................................................................................................................................
Box 1:
Box 2:
Box 3:
Box 4:
Box 5:
Box 6:
Box 7:
Box 8:
Box 9:
Box 10:
Table 1:
Table 2:
Table 3:
Table 4:
Table 5:
Table 6:
Table 7:
Table 8:
Table 9:
Table 10:
Table 11:
Table 12:
Table 13:
Table 14:
Table 15:
Table 16:
Table B8:
14
17
21
29
37
45
54
57
64
70
12
15
18
22
24
31
49
50
52
56
63
69
71
81
87
92
57
Box
Table
v
Figure 1:
Figure 2:
Figure 3:
Figure 4:
Figure 5:
Figure 6:
Figure 7:
Figure 8:
Figure 9:
Figure 10:
Figure 11:
Figure 12:
Figure 13:
Figure 14:
Figure 15:
Figure 16:
Figure 17:
Figure 18:
Figure 19:
Figure 20:
Figure 21:
Figure 22:
Figure 23:
Figure 24:
Figure 25:
Figure 26:
Figure 27:
Figure 28:
Figure 29:
Figure 30:
Figure 31:
Figure 32:
Figure 33:
Figure 34:
Figure 35:
Figure 36:
Figure 37:
Figure 38:
Figure 39:
Figure 40:
Figure 41:
Figure 42:
Figure 43:
Share of Asia in World GDP in 2008 and Projection for 2015 ....................................................................................................................................................
Relative Prices of GDP, 2005 .......................................................................................................................................................................................................................................................................................
GDP Relative to the US, 1970–2008 .......................................................................................................................................................................................................................................................
Country Origins of Regional Economic Growth Relative to the US, 1970–1990 and 1990–2008 ............
Country Contributions to Asian Economic Growth, 1970–1980, 1980–1990, 1990–2000,
and 2000–2008 ......................................................................................................................................................................................................................................................................................................................................
Share of Asian Population in the World in 2008 .........................................................................................................................................................................................................
Per Capita GDP, 1970, 1990, 2000, and 2008 ..............................................................................................................................................................................................................
Per Capita GDP Relative to the US, 1970–2008 ..........................................................................................................................................................................................................
Labor Productivity and Employment Rate Gap Relative to the US, 1995 and 2008 ...................................................................
Sources of Per Capita GDP Growth, 1995–2000 and 2000–2008 ...................................................................................................................................
Employment Rates, 2008 ...................................................................................................................................................................................................................................................................................................
Employment Rates Relative to the US, 1970–2008 ................................................................................................................................................................................................
Final Demand Shares in GDP, 1995 and 2008 ...............................................................................................................................................................................................................
Ratio of Dependent Population and Consumption Share in Nominal GDP, 2008 ..........................................................................
Export and Import Shares in GDP, 1995 and 2008 ................................................................................................................................................................................................
Long-term Trend of Household Consumption Share in GDP, 1970–2008 ........................................................................................................
Ratio of Dependent Population, 2008 .................................................................................................................................................................................................................................................
Decomposition of Household Consumption, 2008 ...............................................................................................................................................................................................
Long-term Trend of Investment Share in GDP, 1970–2008 .................................................................................................................................................................
Asset Composition of Investment, 1970 and 2008 ...............................................................................................................................................................................................
Long-term Trend of Net Export Share in GDP, 1970–2008 ..................................................................................................................................................................
Final Demand Contributions to Economic Growth, 1995–2000 and 2000–2008 .........................................................................
Final Demand Decomposition of Real GDP Growth, 1970–2008 .......................................................................................................................................
Labor Productivity Level by Per-worker GDP, 2008 .................................................................................................................................................................................................
Labor Productivity Level Relative to the US, 1970–2008 ...........................................................................................................................................................................
Labor Productivity Gap by Per-worker and Per-hour GDP Relative to the US, 2008 .................................................................
Labor Productivity Trends in Japan and the Four Asian Tigers, 1970–2008 ................................................................................................
Labor Productivity Growth, 1970–2008, 1970–1990, and 1990–2008 ................................................................................................................
Labor Input Growth, 1970–2008, 1970–1990, and 1990–2008 .........................................................................................................................................
TFP Growth, 1970–2008, 1970–1990, and 1990–2008 ..........................................................................................................................................................................
Sources of Economic Growth, 1970–2008 ................................................................................................................................................................................................................................
Contribution Shares of Economic Growth, 1970–2008 ..............................................................................................................................................................................
Sources of Economic Growth, 1970–1985, 1985–1995, and 1995–2008 .....................................................................................................
Contribution Shares of Economic Growth, 1970–1985, 1985–1995, and 1995–2008 ....................................................
Individual Countries’ Growth Accounting Decomposition, 1970–2008 .................................................................................................................
IT Capital Contribution to Capital Input Growth, 1970–2008 .....................................................................................................................................................
Capital Deepening, 1970–2008, 1970–1990, and 1990–2008 ............................................................................................................................................
Capital Productivity Growth, 1970–2008, 1970–1990, and 1990–2008 ..........................................................................................................
Sources of Labor Productivity Growth, 1970–2008 ...............................................................................................................................................................................................
Contribution Shares of Labor Productivity Growth, 1970–2008 ..............................................................................................................................................
Sources of Labor Productivity Growth, 1970–1985, 1985–1995, and 1995–2008 ....................................................................
Contribution Shares of Labor Productivity Growth, 1970–1985, 1985–1995, and 1995–2008 ...................
Decomposition of Labor Productivity Growth, 1970–2008 ..................................................................................................................................................................
11
13
16
16
19
20
20
23
25
26
27
28
32
33
34
35
35
36
39
39
40
41
42
48
51
52
53
53
55
56
58
58
59
60
61
62
65
65
66
66
67
67
68
Figure
vi
Figure 44:
Figure 45:
Figure 46:
Figure 47:
Figure 48:
Figure 49:
Figure 50:
Figure 51:
Figure 52:
Figure 53:
Figure 54:
Figure 55:
Figure 56:
Figure 57:
Figure 58:
Figure 59:
Figure 60:
Figure 61:
Figure 62:
Figure 63:
Figure 64:
Figure 65:
Figure 66:
Figure 67:
Figure 68:
Figure 69:
Figure 70:
Figure 71:
Figure 72:
Figure 73:
Figure B1:
Figure B2:
Figure B4.1:
Figure B4.2:
Figure B4.3:
Figure B5.1:
Figure B5.2:
Figure B6:
Figure B7:
Figure B8:
Figure B9:
Figure B10.1:
Figure B10.2:
Industry Shares of Value Added, 2008 ...............................................................................................................................................................................................................................................
Industry Shares of Value Added in Manufacturing, 2008 .......................................................................................................................................................................
Industry Shares of Value Added and Employment by Country Group, 1980, 1990, 2000, and 2008 ...
Long-term Trends of Value Added Share in the Agriculture Sector, 1970–2008 ...............................................................................
Industry Shares of Employment, 2008 ................................................................................................................................................................................................................................................
Long-term Trends of Employment Share in the Agricultural Sector, 1970–2008 ..............................................................................
Job Creation in Manufacturing, 1970–2008 ........................................................................................................................................................................................................................
Industry Origins of Economic Growth, 1985–1990, 1990–1995, 1995–2000, and 2000–2008 ................
Contribution of Manufacturing to Economic Growth, 1995–2000 ....................................................................................................................................
Contribution of Manufacturing to Economic Growth, 2000–2008 ....................................................................................................................................
Contribution of Service Sector to Economic Growth, 1995–2000 .......................................................................................................................................
Contribution of Service Sector to Economic Growth, 2000–2008 .......................................................................................................................................
Contribution of Wholesale and Retail to Economic Growth, 1995–2000 ..........................................................................................................
Contribution of Wholesale and Retail to Economic Growth, 2000–2008 ..........................................................................................................
Industry Origins of Output Growth in Manufacturing, 1995–2000 and 2000–2008 .............................................................
Industry Origins of Regional Economic Growth, 1995–2000 and 2000–2008 .....................................................................................
Industry Origins of Asian Economic Growth, 2000–2008 ......................................................................................................................................................................
Industry Origins of Economic Growth, 1970–2008 ...............................................................................................................................................................................................
Industry Origins of Labor Productivity Growth, 1985–1990, 1990–1995, 1995–2000,
and 2000–2008 ......................................................................................................................................................................................................................................................................................................................................
Contribution of Manufacturing to Labor Productivity Growth, 1995–2000 ....................................................................................................
Contribution of Manufacturing to Labor Productivity Growth, 2000–2008 ....................................................................................................
Contribution of Service Sector to Labor Productivity Growth, 1995–2000 ......................................................................................................
Contribution of Service Sector to Labor Productivity Growth, 2000–2008 ...........................................................................................................
Contribution of Wholesale and Retail Sector to Labor Productivity Growth, 1995–2000 ..............................................
Contribution of Wholesale and Retail Sector to Labor Productivity Growth, 2000–2008 ..............................................
Real Income and Real GDP Growths, 1970–2008 ..................................................................................................................................................................................................
Trading Gain Effect, 2005–2008 ......................................................................................................................................................................................................................................................................
Decomposition of Real Income Growth, 1970–2008 and 2000–2008 ....................................................................................................................
Decomposition of Real Income Growth, 1973–1979 and 1996–1998 ....................................................................................................................
Sources of Real Income Growth, 1970–2008 .....................................................................................................................................................................................................................
Implementation of the 1968 and 1993 SNA and Plan for the 2008 SNA ........................................................................................................
Software Investment Ratio and GFCF Ratio to GDP, 2005 .....................................................................................................................................................................
Distribution of the World’s Population in Different Regions, 1950–2050 ..........................................................................................................
Asian Countries’ Population Size and Projection, 1970, 2010, and 2050 .......................................................................................................
Population Proportion of the Dependent Population, 2008 ...............................................................................................................................................................
Views of Quarterly Economic Growth in Asian Countries by the AQGM ............................................................................................................
Quarterly Economic Growth in Asian Countries, 2008Q3–2010Q3 ............................................................................................................................
Terms-of-trade Effect and Productivity Growth, 1970–2008 ............................................................................................................................................................
Average Annual Hours Worked Per Worker Relative to the US, 2000–2008 ..............................................................................................
Capital-Output Ratio, 1980 and 2008 ..............................................................................................................................................................................................................................................
Ex Post Real Rate of Return in Asia, 1970–2008 ...........................................................................................................................................................................................................
Labor Income Share for Employees, 2008 ................................................................................................................................................................................................................................
Sensitivity of TFP Estimates by the Change of Income Share, 1970–2008 ......................................................................................................
72
72
73
74
75
76
76
77
78
78
79
79
80
80
82
83
86
84
88
89
89
89
89
90
90
91
93
94
94
96
14
17
29
29
30
37
38
45
54
57
64
70
70
Contents
vii
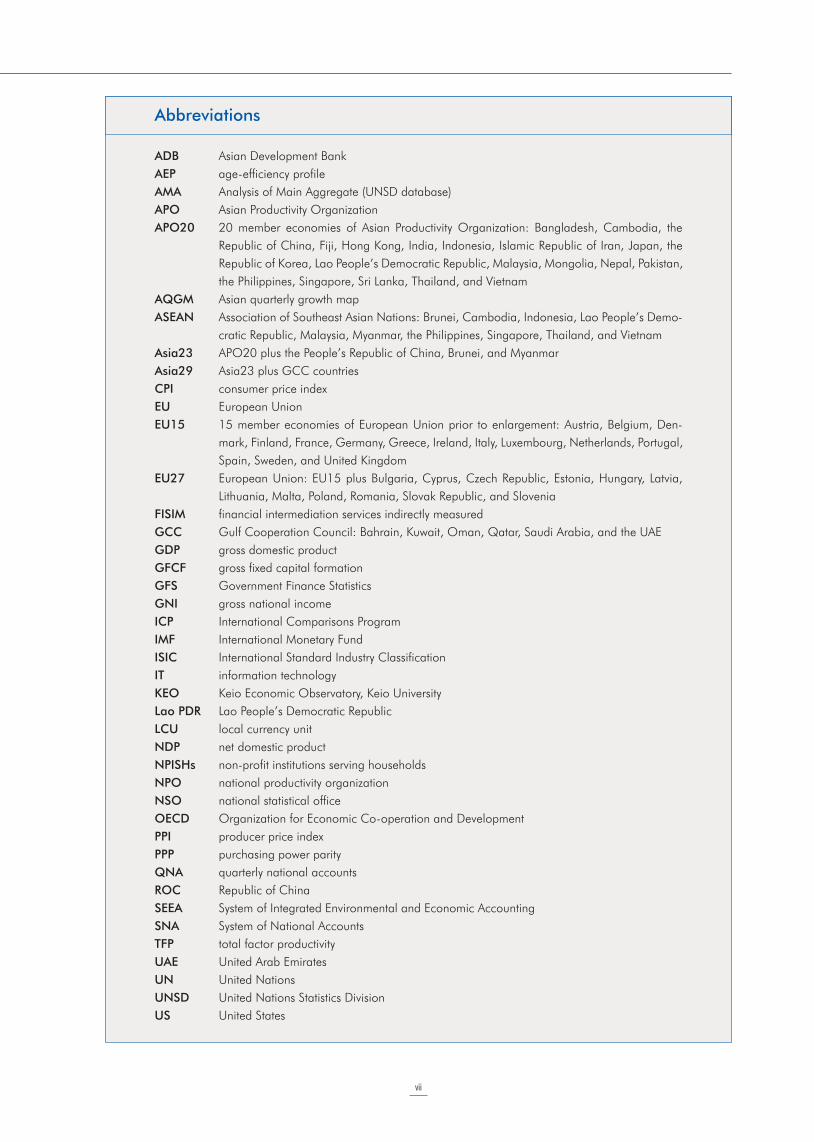
ADB
AEP
AMA
APO
APO20
AQGM
ASEAN
Asia23
Asia29
CPI
EU
EU15
EU27
FISIM
GCC
GDP
GFCF
GFS
GNI
ICP
IMF
ISIC
IT
KEO
Lao PDR
LCU
NDP
NPISHs
NPO
NSO
OECD
PPI
PPP
QNA
ROC
SEEA
SNA
TFP
UAE
UN
UNSD
US
Asian Development Bank
age-efficiency profile
Analysis of Main Aggregate (UNSD database)
Asian Productivity Organization
20 member economies of Asian Productivity Organization: Bangladesh, Cambodia, the
Republic of China, Fiji, Hong Kong, India, Indonesia, Islamic Republic of Iran, Japan, the
Republic of Korea, Lao People’s Democratic Republic, Malaysia, Mongolia, Nepal, Pakistan,
the Philippines, Singapore, Sri Lanka, Thailand, and Vietnam
Asian quarterly growth map
Association of Southeast Asian Nations: Brunei, Cambodia, Indonesia, Lao People’s Demo-
cratic Republic, Malaysia, Myanmar, the Philippines, Singapore, Thailand, and Vietnam
APO20 plus the People’s Republic of China, Brunei, and Myanmar
Asia23 plus GCC countries
consumer price index
European Union
15 member economies of European Union prior to enlargement: Austria, Belgium, Den-
mark, Finland, France, Germany, Greece, Ireland, Italy, Luxembourg, Netherlands, Portugal,
Spain, Sweden, and United Kingdom
European Union: EU15 plus Bulgaria, Cyprus, Czech Republic, Estonia, Hungary, Latvia,
Lithuania, Malta, Poland, Romania, Slovak Republic, and Slovenia
financial intermediation services indirectly measured
Gulf Cooperation Council: Bahrain, Kuwait, Oman, Qatar, Saudi Arabia, and the UAE
gross domestic product
gross fixed capital formation
Government Finance Statistics
gross national income
International Comparisons Program
International Monetary Fund
International Standard Industry Classification
information technology
Keio Economic Observatory, Keio University
Lao People’s Democratic Republic
local currency unit
net domestic product
non-profit institutions serving households
national productivity organization
national statistical office
Organization for Economic Co-operation and Development
producer price index
purchasing power parity
quarterly national accounts
Republic of China
System of Integrated Environmental and Economic Accounting
System of National Accounts
total factor productivity
United Arab Emirates
United Nations
United Nations Statistics Division
United States
Abbreviations
1.2 List of Contributors
1
The Asian Productivity Organization (APO) is a re-gional intergovernmental organization, established in May 1961 as part of a productivity initiative to
drive greater economic development in the Asia and Pacific region. The current APO membership comprises Bangladesh, Cambodia, the Republic of China (here after the ROC), Fiji, Hong Kong, India, Indonesia, Islamic Republic of Iran (hereafter Iran), Japan, the Re-public of Korea (hereafter Korea), Lao People’s Demo-cratic Republic (hereafter Lao PDR), Malaysia, Mongolia, Nepal, Pakistan, the Philippines, Singapore, Sri Lanka, Thailand, and Vietnam. It works through a network of national productivity organizations (NPOs) that are des-ignated as official liaison bodies to implement APO projects and propel national productivity movements in their own countries. Serving as a think-tank and region-al adviser for its 20 member economies, the APO, through its secretariat based in Tokyo, conducts research and surveys to identify common needs for developing appropriate action plans that support its members’ efforts in economic development via produc-tivity enhancement. Another key function of the APO, among others, is to disseminate information and knowl-edge on productivity tools and methodologies across the region through seminars, conferences, workshops, and study meetings.
1.1 APO Productivity Databook 2011
This is the fourth publication in the APO Productivity Databook series. The publication aims to provide a cross-country comparison of economic growth and productivity levels of Asian countries in relation to global and regional economies. The productivity measures in this report are based on the estimates developed in the APO Productivity Database project conducted since September 2007 as a joint research effort of the APO and Keio Economic Observatory (KEO), Keio University, under consultancy of Professors Dale W. Jorgenson (Harvard University) and W. Erwin Diewert (University of British Columbia).
Baseline indicators are calculated for 29 Asian economies, representing the 20 APO member economies (referred to as the APO20) and nine non-member countries in Asia – the People’s Republic of China (hereafter China), Brunei, Myanmar, and the Gulf Cooperation Council (hereafter GCC) that consists of Bahrain, Kuwait, Oman, Qatar, Saudi Arabia, and the United Arab Emirates (hereafter UAE), and two reference economies, the United States (US) and European Union (EU). The GCC countries are included in the APO Productivity Database for the first time in this publication to cover the Western Asian countries. The sources of economic growth are decomposed to factor inputs of labor and capital services and total
factor productivity (TFP) during 1970–2008 for 13 Asian economies (China, the ROC, Fiji, Hong Kong, Indonesia, Japan, Korea, Malaysia, Mongolia, the Philippines, Singapore, Thailand, and Vietnam) and the US as reference economies.
This project is managed by Koji Nomura (Keio University), with coordination by Yasuko Asano (Research and Planning Department, APO). The questionnaire was designed at KEO and sent to national experts in APO member countries. This report would not have been possible without the contributions from the national experts, who supply the data and deal with our follow-up queries. These experts are listed in Section 1.2. The submitted data were examined and processed by the research team at KEO, led by Koji Nomura, who in conjunction with Eunice Lau, Kyoko Ishikawa, Shinyoung Oh, Hiroshi Shirane, Fumio Momose, and Keiko Inoue prepared the text, tables and figures presented in this report.
1.2 List of Contributors
Authors of This Report
Dr. Koji NomuraAPO Productivity Database Project ManagerAssociate Professor, KEO, Keio University, 2-15-45 Mita, Minato-ku, Tokyo, Japan 108-8345
Ms. Eunice Ya Ming LauResearcher, Keio Economic Observatory,Keio University, TokyoFormer Head of Productivity Economics Branch, Office for National Statistics, UK
Members of Research Team at KEO, Keio University
Ms. Kyoko Ishikawa
Ms. Shinyoung Oh
Mr. Hiroshi Shirane
Mr. Fumio Momose
Ms. Keiko Inoue
Keio Economic Observatory, Keio University,2-15-45 Mita, Minato-ku, Tokyo, Japan 108-8345
APO Officer
Ms. Yasuko AsanoProgram Officer, Research and PlanningDepartment, Asian Productivity Organization,1-2-10 Hirakawa-cho, Chiyoda-ku, Tokyo,Japan 102-0093
1 Introduction
1 Introduction
2
National Experts
BangladeshMs. Lutfon Nahar
Deputy Director, National Accounting Wing,Bangladesh Bureau of Statistics, 55/A,Azimpur Government Colony, Dhaka 1205
CambodiaMr. Chettra Keo
Deputy Director, General Statistics Department,National Institute of Statistics, Ministry of Planning,#84, St. 130, Don Penh, Phnom Penh
Republic of ChinaMs. Jia-yuan Mei
Chief, National Accounts Section,Bureau of Statistics, Directorate-General of Budget,Accounting, and Statistics, Executive Yuan 6F, No. 2,Guangjhou Street, Taipei 10065
FijiMs. Nilima Usharani Lal
Divisional Manager, Economic Statistics Division,Fiji Islands Bureau of Statistics, P.O. Box 2221,Government Buildings, Suva
IndiaMr. A. C. Sharma
Deputy Director General, National AccountsDivision, Central Statistical Organisation,Ministry of Statistics & ProgrammeImplementation, Sardar Patel Bhavan,Sansad Marg, New Delhi 110001
IndonesiaMrs. Wachyu Winarsih
Leader of Social Analysis, Directorate of Statistical Analysis and Development,Badan Pusat Statistik Republik Indonesia(BPS-Statistics Indonesia of the Republic of Indonesia), Jl. Dr. Sutomo No. 6–8,Jakarta 10710
Islamic Republic of IranMr. Hamid Azarmand
Economic Researcher, Economic AccountsDepartment, Central Bank of IslamicRepublic of Iran, Mirdamad Blvd., No. 144, Tehran
JapanMr. Shigeru Hirota
Director, National Expenditure Division,National Accounts Department,Economic and Social Research Institute,Cabinet Office, Government of Japan,3-1-1 Kasumigaseki, Chiyoda-ku, Tokyo,100-8970
Republic of KoreaDr. Geonwoo Lee
Research Fellow, Korea Institute for IndustrialEconomics and Trade (KIET),206-9 Cheongryangri-dong, Dongdaemun-ku,Seoul 130-742
MalaysiaMr. Razaman Bin Ridzuan
Statistician, National Accounts Statistics Division,Department of Statistics Malaysia, Level 3,Unit 01-05, Wisma Minlon, 12th Miles,Sungei Besi Highway, 43300 Seri Kembangan,Selangor Darul Ehsan
MongoliaMs. Bayarmaa Baatarsuren
Statistician, Macroeconomic Statistics Department,National Statistical Office of Mongolia,Government Building III, Bagatoiruu 44,Ulaanbaatar 11
NepalMr. Rajesh Dhital
Statistical Officer, Central Bureau of Statistics,Ramshapath, Thapathali, Kathmandu
PakistanMr. Shahid Mahmood Butt
Director, National Accounts, Statistics Division, Federal Bureau of Statistics, SLIC Building No. 5,14th Floor, F-6/4, Blue Area, Islamabad
PhilippinesMs. Estela T. De Guzman
Director, Industry and Trade Statistics Department,National Statistics Office, Solicarel Bldg. 2,R. Magsaysay Blvd., Sta. Mesa, Manila
Sri LankaMr. Weerasinghe W. M. A. S. Premakumara
Director Statistics, Department of Census andStatistics, P.O. Box 563, Colombo 07
1.2 List of Contributors
3
Thailand
Ms. Wannapa KhlaisuanPolicy and Plan Analyst, Professional,National Accounts Office,National Economic and Social DevelopmentBoard, 962 Krung Kasem Road, Pomprab,Bangkok, 10100
Vietnam
Ms. Thi Viet Hong NguyenHead of Statistics and Informatics Section,Institute of Statistical Science, General StatisticsOffice, 54 Nguyen Chi Thanh Street, Hanoi
5
The global financial storm of 2008–2009 might have passed, but the world economy is still licking its wounds from pungent impacts which were both
sharp and extensive in their scope. World output growth plunged from a recent peak of 5.3 per cent in 2007 to 2.8 per cent in 2008 and !0.58 per cent in 2009. This recession was worldwide: all G7 economies experi-enced the deepest output retrenchment since the 1930s, while growth in emerging and developing economies was slashed from 8.7 per cent before the crisis to 2.5 per cent in 2009. As governments around the world responded promptly to the crisis with rescue and fiscal packages on a historically unprecedented scale, output has been growing, albeit more sluggishly in some econ-omies than others. According to International Monetary Fund (IMF) estimates (Leigh et al., 2010), world output will grow at 4.8 per cent and growth in the emerging and developing economies will accelerate to 7.1 per cent in 2010. Developing Asia will be the fastest-growing region in 2010, at 9.4 per cent. By these figures, it would appear that we were out of the woods. But in reality the groaning had only just started, and it is feared that the period of convalescence will be prolonged as the rich economies deal with their colossal debt.
Before the crisis, a shift in the global economic balance of power had already been discerned; but the crisis looks set to hasten its pace. This dramatic shift reflects not only the rapid catching up with their rich counterparts by virtually all developing countries but also the lack of growth in major economies like the US, Western Europe, and Japan. The global financial crisis and ensuing recession have left the developed world laden with ballooning public debt at a level unprece-dented outside world wars, and exposed the limitations of its debt-financed model which had been, in hind- sight, both fueled and kept under control by the exu- berance of the 1980s and 1990s. In 2009 rich countries’ budget deficits averaged about 9 per cent of GDP (gross domestic product), up from only 1 per cent in 2007; and their ratio of public debt to GDP is expected to hit 100 per cent by the end of 2010 (The Economist, 2010a). The level of public debt has significantly raised the risk of sovereign default in some peripheral EU countries, heightened the tension within the currency union, and pushed the euro toward its breaking point. A reversal of fiscal positions has occurred, with the developed world now being more indebted on average than the developing world, and the medium-term out- look for the rich countries is further exacerbated by the economic and financial implications of their graying populations. Options to deal with a debt overhang are never palatable, as the rich countries will testify, but the aftermath of the global financial crisis can be an opportunity as much as a challenge. A dire situation can work to strengthen the political resolve to confront long-term debt problems and, hopefully, will bring forth
the much-needed productivity-enhancing structural reforms. The question is whether the rich world is going to squander such an opportunity.
By conventional wisdom, debts in the major econo- mies have already breached the limit where debt turns sour and ceases to be a boon. The growth-boosting potential of these debts seems to have petered out since early 2007 (The Economist, 2010b). One estimate even goes further, to suggest that these debts will knock half a percentage point off the collective growth rate of the G20’s rich members (Caner, Grennes, and Koehler-Geib, 2010). Fiscal consoli-dation is therefore not an option that the rich economies can choose to dodge, and the task ahead is formidable. By IMF calculations, to cut their debt-to-GDP ratios back to 60 per cent by 2030 will require a swing in the budgets of 9 per cent or more of GDP in the US, Britain, Greece, Ireland, Japan, and Spain. This is the back- drop to the current wave of substantial fiscal squeeze we observe. Virtually all advanced economies have planned some sort of fiscal consolidation in 2011 following the expiry of their stimulus packages. According to the IMF, collectively these measures would amount to a tightening of some 1.25 per cent of GDP, the biggest simultaneous fiscal squeeze since modern records began.
Although fiscal austerity is not an option, the timing and the details of the deficit reduction plans are, to a degree, at governments’ discretion. Some have argued that the proposed fiscal measures may be too tight too soon, risking a double-dip recession, whereas others believe that cutting the deficit will itself boost growth. How the economies will fare is uncertain. In the short term, fiscal retrenchment will dampen demand, and there is little room to compensate that effect with monetary stimulus as interest rates are already at a record low. But bolstering short-term demand with debt is not a long-term solution either. The Economist (2010c) says that rising government debt is a Ponzi scheme that requires an ever-growing population to assume the burden – unless some deus ex machina, such as a technological breakthrough, can boost growth. The advanced economies, with an unfavorable demography, are expected to grow more slowly, not only because they have a shrinking workforce, but also because they save and invest less. This makes rising debt unsustainable unless they achieve a productivity miracle, which is not promising. Recently US and EU15 productivity growth has taken a setback due to the global financial crisis. But even their performance before the crisis was no match with Asia’s vigorous improvement (Tables 8 and 13). Even at their best, outgrowing their debt will still be a tall order, not to say their productivity performance has been sluggish.
In judging the merits of the deficit reduction plans, therefore, we ask if the measures damage or enhance
2 Overview
2 Overview
6
an economy’s productivity capability – if the inflicted short-term pain will lead to improved future prospects. By this, some countries fare better than others. This is all the more important if the depth and nature of the 2009 recession are believed to have permanently damaged the growth potential of these economies. The rich countries could easily miss this opportunity to alter their grim growth prospects if their policy debate centers largely on demand and lacks any microeconomic ambition.
With the world economy more integrated, the impact of domestic economic and monetary policies is not ring-fenced by national boundaries. With the tight squeeze coming into play, it is not surprising that the IMF estimates growth in the advanced economies will slow from 2.5 per cent in 2010 to 2.0 per cent in 2011. But growth in other country groups is also projected to slow: from 7.1 per cent to 6.4 per cent in emerging and developing economies, from 9.4 per cent to 8.4 per cent in developing Asia, and from 7.8 per cent to 4.5 per cent in newly industrialized countries. As demand from rich economies weakens, developing countries will probably have to develop more domestic demand to fill the gap. The long-standing system of vendor financing, whereby the developing world is lending to the developed world to buy its goods, cannot carry on endlessly, especially when it may have encouraged the rich world to concentrate on con- sumption rather than investment. It also strains trade relations, particularly between the US and China. Some are outraged by this direction of capital flow, as the poor countries are lending cheaply to the rich ones, mainly the US, when they could have put the resources to much better use for their own development.
Foreign exchange reserves increased from US$1.3 trillion (5 per cent of world GDP) in 1995 to US$8.4 trillion (14 per cent) today, two-thirds of which is held by the emerging economies, mostly accumulated in the past ten years (The Economist, 2010d). This is the size of the accumulated global imbalance measured in monetary terms. It creates a tension between emerg- ing economies’ demand for reserves and their fear that the main reserve currency, namely the US dollar, will devalue. This is why when the Federal Reserve announced its second round of quantitative easing, it sparked fiery international exchanges on the theme of a currency war.
But away from the limelight, changes may have already started. Labor unrest in China is catching the headlines. This may mark a turning point in China’s development. The workshop of the world is aging, with the number of Chinese aged 15–29 falling quite sharply after 2011. Migrant workers are becoming scarcer and pay would have to rise to attract workers. Until recently, productivity has been rising faster than labor costs, leading to falling unit labor costs and
enhancing China’s competitiveness. This is also re- flected in the falling labor share of national income in the past two decades, contributing to China’s low rate of consumption – its share of GDP at 35.1 per cent in 2008 was the lowest of all the countries compared (see Table 6). But between the summers of 2006 and 2008, the prices Americans paid for imports from China rose by 6 per cent (The Economist, 2010e). This may have reflected rising unit labor costs. By The Economist’s rough estimate, they have risen by 25 per cent since the first quarter of 2005, compared with 4 per cent in American manufacturing. By this calcula- tion, China’s real exchange rate with America has strengthened by almost 50 per cent since 2005, even if its nominal rate stays the same (The Economist, 2010f). As labor share of GDP increases at the expense of profit, China is rebalancing its economy by giving households more spending power. Higher prices and a higher saving rate will mean that China’s trade surplus will shrink as its domestic market grows and fulfills its potential. As the workshop of the world retreats, this may even give opportunities to smaller Asian devel-oping economies to rise; Vietnam is already hailed as the next China.
India has been a tiger trailing behind China, which has an economy four times bigger and a per capita GDP twice that of India. But it has maintained its recent vibrant growth and is expected to expand by 8.4 per cent in 2010. It is speculated that India may grow faster than any other large country over the next 25 years. First, while China’s workforce starts to age, India has a favorable demography with one of the best dependency ratios in the world, and this will remain for a genera- tion. This “demographic dividend” has propelled many of Asia’s economic miracles. Second, although its growth seems somewhat chaotic when compared with the carefully orchestrated process in China, India’s democracy, despite its ineffectiveness, is more con- ducive to the flow of ideas. This gives India an edge in the knowledge-intensive age. But to fulfill its full potential, India needs to address its structural bottle-necks. To reap the demographic dividend, it will first need to find jobs for those who are joining the workforce. Removing some of the structural rigidities in the labor market will help. Its notorious infrastructure also requires an extensive overhaul in order to support a sprinting economy. Whether India can take off, therefore, depends to a large extent on whether its government can deliver.
In the coming years, as we dissect the impact of the global financial crisis as it makes its way into our annual data, productivity analysis will help cast valuable insight into how the long-term growth potential of an economy has been affected. As it stands at the moment, the prospect for the West looks less promising than for the East as far as future capability for productivity growth
7
is concerned. In focusing on the long-term analysis, the APO Productivity Databook not only looks into a country’s productivity performance but also its economic composition and sources of growth in order to provide readers with more comprehensive descrip-tions and comparisons of a country’s economic struc- ture and characteristics. Furthermore, we have been able to expand the number of countries covered in our total factor productivity (TFP) analysis from eight to 13 Asian countries.
International comparisons of economic perfor-mance are never a precise science, but are fraught with measurement and data comparability issues. Despite our best efforts in aligning the data, some data uncer-tainty remains. As we operate in a reality of incomplete information, some adjustments made are necessarily conjectural, while others are based on assumptions. In addressing this shortcoming, conclusions drawn are cross-referenced against other similar studies. How- ever, the magnitude of economic indicators and differ-ences could be subject to a higher degree of data uncertainty.
Bearing in mind these caveats, the main findings from our analysis are as follows.
Economic scale and growth
! In terms of exchange-rate-based GDP, Japan was still the largest Asian economy in 2008, with China (and other fast-growing economies) constantly erod-ing its lead. It is projected that China has overtaken Japan in 2010 as the second-largest economy in the world after the US. In 2008 the size of Asia23 was roughly equal to that of the US on this measure (Table 1).
! Based on GDP adjusted for purchasing power parity, China overtook Japan as the largest Asian economy in 2000. India came third. With its recent rapid growth, China is extending its lead. On this mea-sure, APO20 was of similar size to the US economy while Asia23 was 62 per cent larger in 2008. While Asia is expanding, EU15 has been shrinking in size against the US (Table 2 and Figure 3).
! Between 1990 and 2008 the economic growth dif-ferential between Asia and the US was 2.5 per cent per annum on average, of which China’s growth ex-plained 70.1 per cent and India’s 17.4 per cent. Japan was the only Asian economy which grew more slowly than the US (1.2 per cent versus 2.8 per cent), and was a drag of 17.6 per cent on the regional relative economic growth (Figure 4).
! In the 2000s growth recovered in Asia after the Asian financial crisis, achieving 6.8 per cent and
4.4 per cent on average a year for Asia23 and APO20 respectively in the period 2005–2008. Growth in the US and EU15 were 1.5 per cent and 1.9 per cent over the same period (Table 3).
! In 2000–2008 China and India contributed just over 50.0 per cent and 16.2 per cent to regional growth. Despite its lackluster growth of 1.2 per cent a year on average, Japan was the third-largest con-tributor due to its size (Figure 5).
Catching up in GDP per capita
! Our results show the outcome of the dramatic devel-opment effort of the four Asian Tigers. Singapore and Hong Kong have managed to close a per capi- ta GDP gap with the US of around 65 per cent in just under four decades. Singapore has even sur-passed the US since 2004, something that Japan has failed to achieve. In 2008 the ROC’s and Korea’s per capita GDP was 69 per cent and 58 per cent of that of the US, respectively (Figures 7 and 24).
! Despite their rapid growth, per capita GDP of China and India was 13 per cent and 6 per cent of that of the US in 2008, due to their population size. The level achieved by APO20 and Asia23 was similar, at around 14 per cent of that of the US, indicating that there is ample room for catch-up (Figure 7).
! The oil-exporting countries typically have per capita GDP many times that of any reference country. This is because the GDP measure exaggerates their in-come by erroneously including the resource rent. For these countries, the sustainable income level is lower than suggested by their headline GDP figures (Table 4, Boxes 3 and 6).
! Asia’s huge per capita GDP gap with the US is pre-dominantly explained by its labor productivity gap. With the exception of the four Asian Tigers, Japan, and Iran, all Asian countries have a labor productiv-ity gap of 60 per cent or more (Figure 9). However, labor productivity growth explained most of coun-tries’ per capita GDP growth, although the change in employment rate also played a significant role (Figure 10).
The demand-side story
! With a few exceptions, household consumption is the biggest component of GDP. Its share in GDP tends to be stable, if not trending slightly upwards, in more mature economies. In contrast, it tends to be more volatile and trend downwards in economies
2 Overview
8
undergoing rapid transformation (Table 6).
! Asia’s average household consumption share of 49.8 per cent is the lowest when compared with the US 69.9 per cent and EU15 57.5 per cent in 2008.
! China’s household consumption share of GDP fell from 54.7 per cent in 1970 to 46.4 per cent in 2000. Since then the share has reduced by a further 11 per cent in just eight years. However, given the recent developments in its labor market, household consumption share might have reached its trough and may even start to turn up.
! Asia on average invests more. While the investment share of GDP in the US and EU15 has been stable at around 20 per cent, the corresponding figures for APO20 and Asia23 are 5–10 percentage points and 10–15 percentage points higher respectively (Figure 19). China’s investment share of 43.9 per cent in 2008 is phenomenal.
! Net exports accounts for 2.6 per cent of Asia23’s GDP in 2008, up from 0.8 per cent in 1990. A lot of the strengthening was due to China’s net export share rising from 2.4 per cent in 2000 to 7.7 per cent in 2008. South Asia, like the US, has a sizeable trade deficit, while the position of net exports in EU15 has been more or less neutral.
! High household consumption share tends to corre-late with a high dependency ratio (Figure 14).
! The decomposition of household consumption dis-plays strongly the cross-country version of Angel’s law, whereby basic necessities account for a high proportion of household consumption in poor coun-tries and vice versa (Figure 18). Korea and India spent over 7 per cent of their household consump-tion on education, while the US spent almost one-fifth on health, unmatched in other countries.
! During the Asian financial crisis, when investment took a battering in many countries, household con-sumption was the main driver of growth. However, in some countries, like Hong Kong and Malaysia, net exports accounted for most of the economic growth (Figure 22).
! In the 2000s investment recovered in the Asian economy and drove growth. But for Singapore, Hong Kong and the ROC, the strength of net exports was still the dominant force behind their economic growth (Figure 22).
! According to countries’ annual data, the Asian fi-nancial crisis marked an exceptional time for many Asian economies, causing investment to nose-dive in 1998 and consumption to fall, albeit to a lesser extent. Net export growth, on the other hand, was exceptionally strong in some of these countries, which are likely to have benefited from the rapid devaluation of the Asian currencies at the time of the crisis. Similarly, the impact of the dot.com crash is visible from the data, most notably in the ROC (Fig-ure 23).
Economy-wide productivity – The supply-side story
GDP per worker! On the per worker GDP measure in 2008, Singa-
pore and Hong Kong have virtually closed the gap with the US (i.e. with a margin of !10 per cent), while the ROC and Japan sustained a gap of 25 per cent and Korea 40 per cent. But these are the ex-ceptions, as most Asian countries had a gap with the US of 80 per cent or more (Figure 24).
! Measured against the US level, per-worker GDP was 16 per cent, 14 per cent, and 11 per cent for APO20, Asia23, and ASEAN in 2008. The figures for China and India were 12 per cent and 8 per cent respectively. In the past decade or so, Asia as a group has achieved little change in its relative posi-tion against the US (Table 7).
! Growth of per-worker GDP in Asia has outstripped that in the US, allowing catch-up. After the Asian fi-nancial crisis, productivity growth has been acceler-ating. As a group, Asia23 achieved a yearly average productivity growth of 5.2 per cent in the period 2005–2008, up from 3.7 per cent in 2000–2005. In contrast, US productivity growth slowed rapidly from 2.1 per cent to 0.8 per cent on average a year over the same periods (Table 8).
GDP per hour! The productivity gap based on the per hour GDP
measure is generally wider between Asian countries and the US. In particular, the gaps between the Asian Tigers and the US increased more than 16 percent-age points, suggesting that the former work longer hours (Figure 26).
! Per hour GDP growth has been consistently higher that per worker GDP growth in the ROC, Korea, and Japan, suggesting that working hours are reducing (Table 10).
Total factor productivity! Over the period 1970–2008, China, Thailand, the
9
ROC, and Hong Kong achieved TFP growth faster than that of the US. China is a league of its own, with its yearly average TFP growth double that of the other three countries, whose TFP growth in turn is double the 0.8 per cent achieved by the US. Be-tween the two sub-periods 1970–1990 and 1990–2008, TFP growth generally slowed; China is the exception with TFP growth soaring from 1.7 per cent to 4.7 per cent between the two periods (Figure 30).
! Over the whole estimation period, capital input growth typically explained half or more of economic growth, of which 16 percentage points were contrib-uted by IT capital in the US compared with 3–10 percentage points in the Asian countries. The contri-bution from TFP growth was around one-fifth; its share of 36 per cent in China was the highest among all countries compared (Figures 31 and 32).
! The decade 1985–1995 appeared to be the golden period for TFP growth, accounting for over 30 per cent in eight of the countries studied. Economic growth in the earlier period was predominated by capital input growth, while countries’ experience in the more recent period was mixed (Figures 33 and 34).
! In the initial period, vibrant growth in the Asian Ti-gers was clearly driven by capital accumulation, but TFP growth gained significance in subsequent peri-ods. Although lower in percentage points, there has been a recent resurgence in contribution from TFP growth accounting for 45–60 per cent of economic growth, except in Singapore which has gone back to input-driven growth lately (Figure 35).
Enhancement of labor productivity growth! Capital deepening has been taking place in all
countries compared (Figure 37), but all countries have negative capital productivity growth. Where capital deepening was most rapid (e.g. at a rate of 9 per cent on average a year in Korea between 1970 and 2008), the fall in capital productivity was the steepest as well (at an average of 3 per cent a year in Korea) (Figure 38).
! Capital deepening was the prime source of labor productivity growth in the past four decades, with the exception of the US. But TFP growth also made a significant contribution, e.g. by 30 per cent in the Asian Tigers (except Singapore), 44 per cent in Thai-land, and 48 per cent in China (Figures 39 and 40).
! An allocation shift to IT capital can be clearly seen
from the composition of capital services. IT capital accumulation started in the 1980s in the US, in the mid-1990s in Japan, and at the turn of the century in the Asian Tigers (Figure 36).
! Comparing the sub-periods, the rise of IT capital contribution in explaining labor productivity growth, especially since 1995, is remarkable. It rose from a range of 2–7 per cent in the period 1970–1985 and 6–13 per cent in the period 1985–1995 to a range of 8–29 per cent in the period 1995–2008. In China it has more than tripled in the past decade, from 1 per cent in 1985–1995 to 7 per cent in 1995–2008, compared with around a quarter to one-third in the US since 1985 (Figure 42).
Industry perspective
Industry structure! Evidence supports the view that a country’s industry
structure transforms with its economic development. There is a broad negative correlation between the share of agriculture in total GDP and the per capita GDP gap with the US. Finance, real estate and busi-ness activities rises in weight as countries move up income level, whereas mining is the sector that de-fines the oil-exporting countries (Figure 44).
! Manufacturing is a significant sector, accounting for over 20 per cent of total value added in most Asian economies. It is particularly prominent in China, Ko-rea, and the ROC. Asian manufacturing is domi-nated by machinery and equipment (Figure 45).
! Asian countries are diversifying away from agricul-ture, which, however, still dominates employment. Agriculture accounts for 41.7 per cent of total em-ployment in 2008 for Asia29, down from 62.0 per cent in 1980. Its share in total value added was relatively stable at around 15–17 per cent up to 2000 before dropping to 12 per cent in 2008 (Fig-ure 46). Manufacturing is expanding without a pro-portionate rise in employment, suggesting sectoral labor productivity growth (Figure 50).
Industry origins of economic growth! Our results support the observation that China and
India have taken different development paths, with the former relying more on the traditional growth engine of manufacturing and the latter on services.
! In the past two-and-a-half decades China has been undergoing a slight transition, with its growth shifting from being manufacturing-driven to more service-driven. In the period 2000–2008 the contri-butions to economic growth by manufacturing and
2 Overview
10
services were 35.1 per cent and 44.3 per cent re-spectively, compared with 47.1 per cent and 30.1 per cent in the first half of the 1990s.
! In contrast, growth in India has always been more driven by services, the contribution of which rose from 50 per cent in the late 1980s to over 60 per cent in the 2000s, while manufacturing has never contributed more than one-fifth (Figure 51).
! One-third of Asia29’s regional growth originated from the expansion of manufacturing in the 2000s, two-thirds of which was accounted for by China. In other words, China’s manufacturing alone contrib-uted 21.4 per cent to regional growth (Figure 60).
Industry origins of labor productivity growth! Our results show that services are no longer a drag
on a country’s productivity performance, but are as capable as manufacturing in generating labor pro-ductivity growth.
! In the 2000s transport, storage, and communica-tions achieved the fastest labor productivity growth in Asia23 (at 4.0 per cent on average a year), fol-lowed by manufacturing (at 2.9 per cent) and whole-sale and retail trade, hotels, and restaurants (at 2.8 per cent). Agriculture also managed a labor produc-tivity growth of 2.2 per cent on average a year (Table 15).
! While the importance of manufacturing as a con-tributor to overall labor productivity growth has never waned in some countries (Korea, the ROC, China, and Thailand), services were contributing at least one-third or more in most Asian countries com-pared in the 2000s. Manufacturing has never been a major contributor in India in its recent develop-ment process, or in Hong Kong and Sri Lanka in the 2000s (Figures 63 and 66).
Real income and terms of trade
! Real GDP could systematically underestimate (over-estimate) growth in real income when terms of trade improve (deteriorate). It is generally observed that the trading gain effect is more significant in the short term than in the long term.
! Our results show that for most countries studied the difference between growth of real GDP and real in-come was within the margin of ±20 per cent over the long period 1970–2008. But for some coun-tries, the divergence can be immense.
! The extreme cases are experienced the oil-rich
nations. For example, real GDP underestimates Kuwait’s and Brunei’s real income growth by 730 per cent and 192 per cent respectively over the period 1970–2008. Singapore has the most negative trad-ing gain effect, with real income growth being 18 per cent lower than real GDP growth on average (Table 16 and Figure 69).
! Over shorter time periods, the impact of trading gain can have a larger impact on individual coun-tries. For example, trading gain has worked to coun-terbalance falling real GDP in Saudi Arabia and Brunei, leaving them with a handsome real income growth of 9.6 per cent and 9.7 per cent in the recent period of 2005–2008. In contrast, the effect of trad-ing gain in the ROC was to wipe out 90 per cent of the handsome 4.1 per cent real GDP growth on av-erage a year, leaving real income to grow at 0.4 per cent over the same period (Table 16 and Figure 70).
! Historically, trading gain has been significant in oil-rich countries, e.g. with annual real income growth being 5.0 percentage points higher than annual real GDP growth on average in Kuwait. For most countries the impact is modest, adding ±1 percent-age point to annual real GDP growth for most of the period 1971–2008. The huge volatility caused by oil price hikes can also be clearly discerned (Figure 73).
Asia is a diverse regional economy within which countries have embarked on their own journeys of economic development at different times and different paces. As shown by our analysis, nearly all countries are making concerted efforts to move away from agriculture and accumulate capital in order to improve their growth potential and catch up with the West. Their efforts are yielding results beyond just impressive growth rates. Our evidence confirms that countries’ capital accumulation is accompanied by strong productivity improvements. Through the statistics and data presented in this report, we manage to catch a glimpse of the unparalleled economic dynamics inherent in the region right now. Furthermore, the region as a whole has demonstrated unexpected resilience and strengths in the way it weathered the recent global financial storm. China in particular has been rising in the world economic rankings, having overtaken Germany as the largest exporter in 2009 and Japan as the second-largest economy in 2010. Growth in India has also received a sudden spur in recent years. As the rich economies are heavily laden by debt (to crisis point in some) and the associated difficulties, this may well prove to be an opportunity for the region to consolidate its development achievements further.
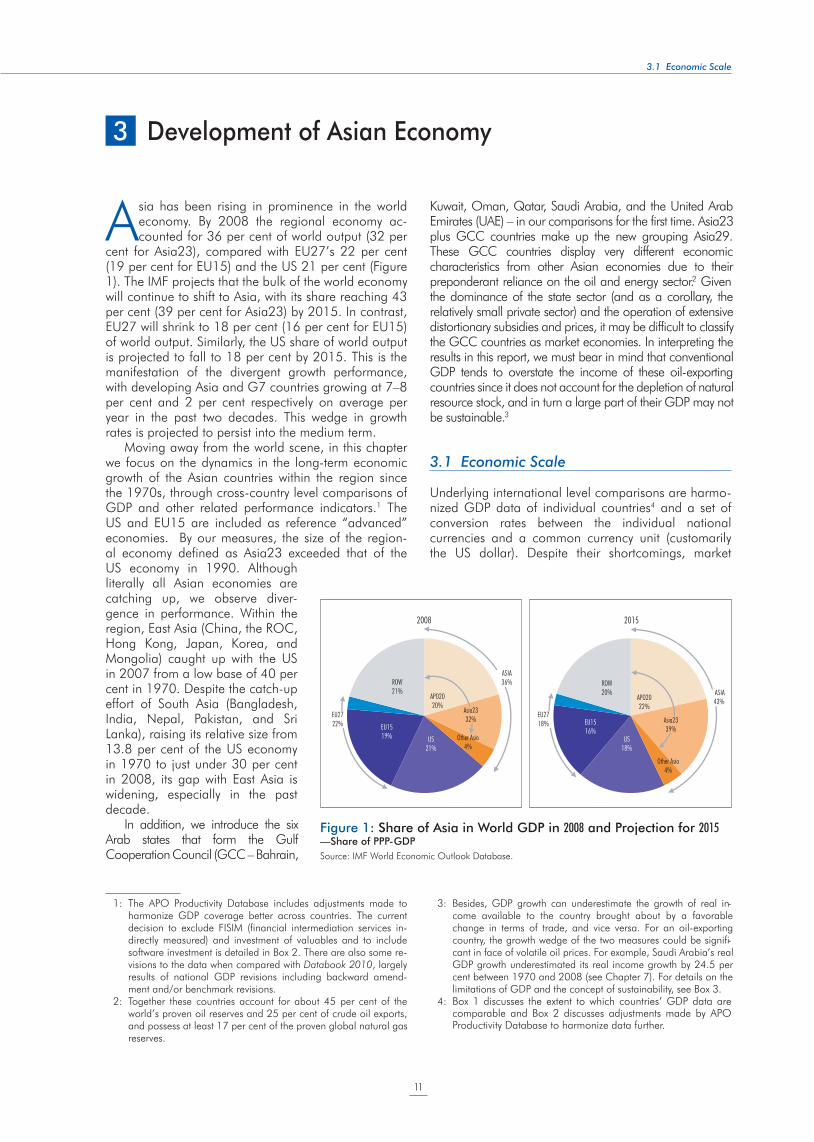
3.1 Economic Scale
11
Asia has been rising in prominence in the world economy. By 2008 the regional economy ac-counted for 36 per cent of world output (32 per
cent for Asia23), compared with EU27’s 22 per cent (19 per cent for EU15) and the US 21 per cent (Figure 1). The IMF projects that the bulk of the world economy will continue to shift to Asia, with its share reaching 43 per cent (39 per cent for Asia23) by 2015. In contrast, EU27 will shrink to 18 per cent (16 per cent for EU15) of world output. Similarly, the US share of world output is projected to fall to 18 per cent by 2015. This is the manifestation of the divergent growth performance, with developing Asia and G7 countries growing at 7–8 per cent and 2 per cent respectively on average per year in the past two decades. This wedge in growth rates is projected to persist into the medium term.
Moving away from the world scene, in this chapter we focus on the dynamics in the long-term economic growth of the Asian countries within the region since the 1970s, through cross-country level comparisons of GDP and other related performance indicators.1 The US and EU15 are included as reference “advanced” economies. By our measures, the size of the region- al economy defined as Asia23 exceeded that of the US economy in 1990. Although literally all Asian economies are catching up, we observe diver-gence in performance. Within the region, East Asia (China, the ROC, Hong Kong, Japan, Korea, and Mongolia) caught up with the US in 2007 from a low base of 40 per cent in 1970. Despite the catch-up effort of South Asia (Bangladesh, India, Nepal, Pakistan, and Sri Lanka), raising its relative size from 13.8 per cent of the US economy in 1970 to just under 30 per cent in 2008, its gap with East Asia is widening, especially in the past decade.
In addition, we introduce the six Arab states that form the Gulf Cooperation Council (GCC – Bahrain,
Kuwait, Oman, Qatar, Saudi Arabia, and the United Arab Emirates (UAE) – in our comparisons for the first time. Asia23 plus GCC countries make up the new grouping Asia29. These GCC countries display very different economic characteristics from other Asian economies due to their preponderant reliance on the oil and energy sector.2 Given the dominance of the state sector (and as a corollary, the relatively small private sector) and the operation of extensive distortionary subsidies and prices, it may be difficult to classify the GCC countries as market economies. In interpreting the results in this report, we must bear in mind that conventional GDP tends to overstate the income of these oil-exporting countries since it does not account for the depletion of natural resource stock, and in turn a large part of their GDP may not be sustainable.3
3.1 Economic Scale
Underlying international level comparisons are harmo-nized GDP data of individual countries4 and a set of conversion rates between the individual national currencies and a common currency unit (customarily the US dollar). Despite their shortcomings, market
3 Development of Asian Economy
APO2020%
Asia2332%
ASIA36%
US21%
EU1519%
EU2722%
ROW21%
2008
Other Asia4%
APO2022%
ASIA43%
US18%
EU1516%
EU2718%
ROW20%
2015
Other Asia4%
Asia2339%
Figure 1: Share of Asia in World GDP in 2008 and Projection for 2015—Share of PPP-GDP
Source: IMF World Economic Outlook Database.
1: The APO Productivity Database includes adjustments made to harmonize GDP coverage better across countries. The current decision to exclude FISIM (financial intermediation services in- directly measured) and investment of valuables and to include software investment is detailed in Box 2. There are also some re-visions to the data when compared with Databook 2010, largely results of national GDP revisions including backward amend-ment and/or benchmark revisions.
2: Together these countries account for about 45 per cent of the world’s proven oil reserves and 25 per cent of crude oil exports, and possess at least 17 per cent of the proven global natural gas reserves.
3: Besides, GDP growth can underestimate the growth of real in-come available to the country brought about by a favorable change in terms of trade, and vice versa. For an oil-exporting country, the growth wedge of the two measures could be signifi-cant in face of volatile oil prices. For example, Saudi Arabia’s real GDP growth underestimated its real income growth by 24.5 per cent between 1970 and 2008 (see Chapter 7). For details on the limitations of GDP and the concept of sustainability, see Box 3.
4: Box 1 discusses the extent to which countries’ GDP data are comparable and Box 2 discusses adjustments made by APO Productivity Database to harmonize data further.
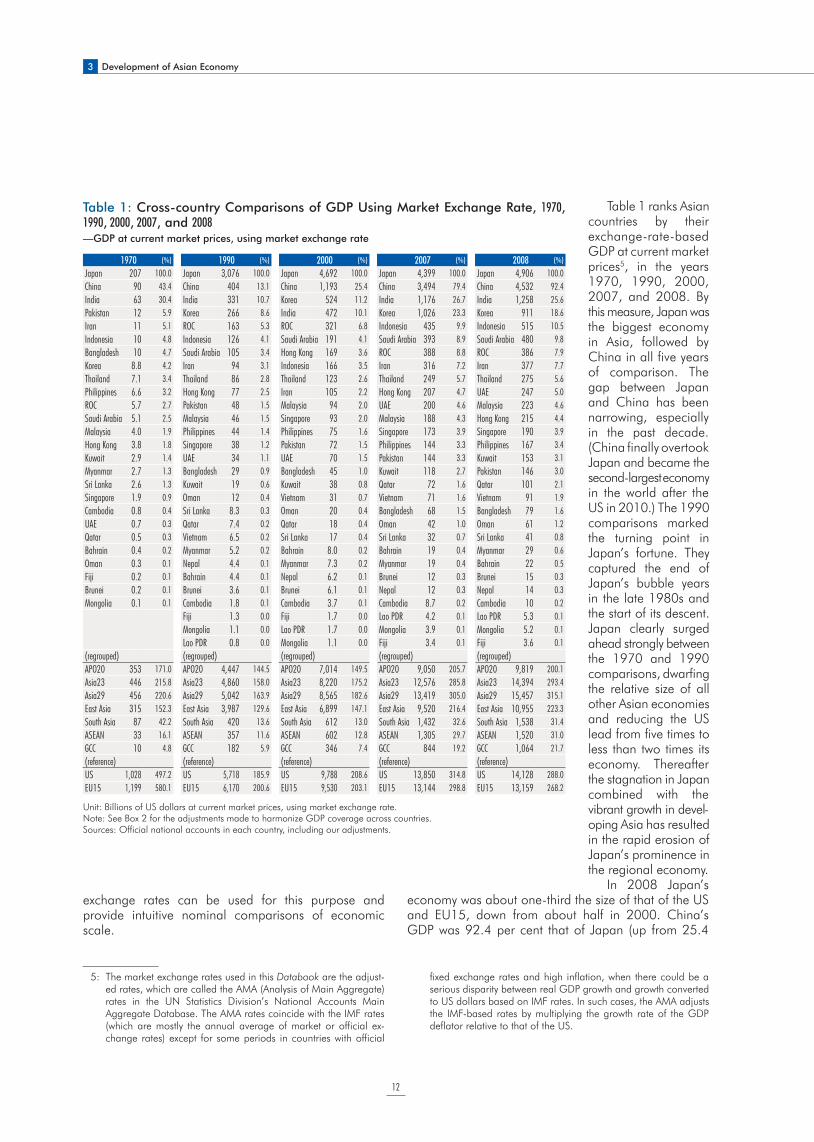
3 Development of Asian Economy
12
exchange rates can be used for this purpose and provide intuitive nominal comparisons of economic scale.
Table 1 ranks Asian countries by their exchange-rate-based GDP at current market prices5, in the years 1970, 1990, 2000, 2007, and 2008. By this measure, Japan was the biggest economy in Asia, followed by China in all five years of comparison. The gap between Japan and China has been narrowing, especially in the past decade. (China finally overtook Japan and became the second-largest economy in the world after the US in 2010.) The 1990 comparisons marked the turning point in Japan’s fortune. They captured the end of Japan’s bubble years in the late 1980s and the start of its descent. Japan clearly surged ahead strongly between the 1970 and 1990 comparisons, dwarfing the relative size of all other Asian economies and reducing the US lead from five times to less than two times its economy. Thereafter the stagnation in Japan combined with the vibrant growth in devel-oping Asia has resulted in the rapid erosion of Japan’s prominence in the regional economy.
In 2008 Japan’s economy was about one-third the size of that of the US and EU15, down from about half in 2000. China’s GDP was 92.4 per cent that of Japan (up from 25.4
1970 (%) 1990 (%) 2000 (%) 2007 (%) 2008 (%)
Japan 207 100.0 Japan 3,076 100.0 Japan 4,692 100.0 Japan 4,399 100.0 Japan 4,906 100.0
China 90 43.4 China 404 13.1 China 1,193 25.4 China 3,494 79.4 China 4,532 92.4
India 63 30.4 India 331 10.7 Korea 524 11.2 India 1,176 26.7 India 1,258 25.6
Pakistan 12 5.9 Korea 266 8.6 India 472 10.1 Korea 1,026 23.3 Korea 911 18.6
Iran 11 5.1 ROC 163 5.3 ROC 321 6.8 Indonesia 435 9.9 Indonesia 515 10.5
Indonesia 10 4.8 Indonesia 126 4.1 Saudi Arabia 191 4.1 Saudi Arabia 393 8.9 Saudi Arabia 480 9.8
Bangladesh 10 4.7 Saudi Arabia 105 3.4 Hong Kong 169 3.6 ROC 388 8.8 ROC 386 7.9
Korea 8.8 4.2 Iran 94 3.1 Indonesia 166 3.5 Iran 316 7.2 Iran 377 7.7
Thailand 7.1 3.4 Thailand 86 2.8 Thailand 123 2.6 Thailand 249 5.7 Thailand 275 5.6
Philippines 6.6 3.2 Hong Kong 77 2.5 Iran 105 2.2 Hong Kong 207 4.7 UAE 247 5.0
ROC 5.7 2.7 Pakistan 48 1.5 Malaysia 94 2.0 UAE 200 4.6 Malaysia 223 4.6
Saudi Arabia 5.1 2.5 Malaysia 46 1.5 Singapore 93 2.0 Malaysia 188 4.3 Hong Kong 215 4.4
Malaysia 4.0 1.9 Philippines 44 1.4 Philippines 75 1.6 Singapore 173 3.9 Singapore 190 3.9
Hong Kong 3.8 1.8 Singapore 38 1.2 Pakistan 72 1.5 Philippines 144 3.3 Philippines 167 3.4
Kuwait 2.9 1.4 UAE 34 1.1 UAE 70 1.5 Pakistan 144 3.3 Kuwait 153 3.1
Myanmar 2.7 1.3 Bangladesh 29 0.9 Bangladesh 45 1.0 Kuwait 118 2.7 Pakistan 146 3.0
Sri Lanka 2.6 1.3 Kuwait 19 0.6 Kuwait 38 0.8 Qatar 72 1.6 Qatar 101 2.1
Singapore 1.9 0.9 Oman 12 0.4 Vietnam 31 0.7 Vietnam 71 1.6 Vietnam 91 1.9
Cambodia 0.8 0.4 Sri Lanka 8.3 0.3 Oman 20 0.4 Bangladesh 68 1.5 Bangladesh 79 1.6
UAE 0.7 0.3 Qatar 7.4 0.2 Qatar 18 0.4 Oman 42 1.0 Oman 61 1.2
Qatar 0.5 0.3 Vietnam 6.5 0.2 Sri Lanka 17 0.4 Sri Lanka 32 0.7 Sri Lanka 41 0.8
Bahrain 0.4 0.2 Myanmar 5.2 0.2 Bahrain 8.0 0.2 Bahrain 19 0.4 Myanmar 29 0.6
Oman 0.3 0.1 Nepal 4.4 0.1 Myanmar 7.3 0.2 Myanmar 19 0.4 Bahrain 22 0.5
Fiji 0.2 0.1 Bahrain 4.4 0.1 Nepal 6.2 0.1 Brunei 12 0.3 Brunei 15 0.3
Brunei 0.2 0.1 Brunei 3.6 0.1 Brunei 6.1 0.1 Nepal 12 0.3 Nepal 14 0.3
Mongolia 0.1 0.1 Cambodia 1.8 0.1 Cambodia 3.7 0.1 Cambodia 8.7 0.2 Cambodia 10 0.2
Fiji 1.3 0.0 Fiji 1.7 0.0 Lao PDR 4.2 0.1 Lao PDR 5.3 0.1
Mongolia 1.1 0.0 Lao PDR 1.7 0.0 Mongolia 3.9 0.1 Mongolia 5.2 0.1
Lao PDR 0.8 0.0 Mongolia 1.1 0.0 Fiji 3.4 0.1 Fiji 3.6 0.1
(regrouped) (regrouped) (regrouped) (regrouped) (regrouped)
APO20 353 171.0 APO20 4,447 144.5 APO20 7,014 149.5 APO20 9,050 205.7 APO20 9,819 200.1
Asia23 446 215.8 Asia23 4,860 158.0 Asia23 8,220 175.2 Asia23 12,576 285.8 Asia23 14,394 293.4
Asia29 456 220.6 Asia29 5,042 163.9 Asia29 8,565 182.6 Asia29 13,419 305.0 Asia29 15,457 315.1
East Asia 315 152.3 East Asia 3,987 129.6 East Asia 6,899 147.1 East Asia 9,520 216.4 East Asia 10,955 223.3
South Asia 87 42.2 South Asia 420 13.6 South Asia 612 13.0 South Asia 1,432 32.6 South Asia 1,538 31.4
ASEAN 33 16.1 ASEAN 357 11.6 ASEAN 602 12.8 ASEAN 1,305 29.7 ASEAN 1,520 31.0
GCC 10 4.8 GCC 182 5.9 GCC 346 7.4 GCC 844 19.2 GCC 1,064 21.7
(reference) (reference) (reference) (reference) (reference)
US 1,028 497.2 US 5,718 185.9 US 9,788 208.6 US 13,850 314.8 US 14,128 288.0
EU15 1,199 580.1 EU15 6,170 200.6 EU15 9,530 203.1 EU15 13,144 298.8 EU15 13,159 268.2
Unit: Billions of US dollars at current market prices, using market exchange rate.Note: See Box 2 for the adjustments made to harmonize GDP coverage across countries.Sources: Official national accounts in each country, including our adjustments.
Table 1: Cross-country Comparisons of GDP Using Market Exchange Rate, 1970, 1990, 2000, 2007, and 2008—GDP at current market prices, using market exchange rate
5: The market exchange rates used in this Databook are the adjust-ed rates, which are called the AMA (Analysis of Main Aggregate) rates in the UN Statistics Division’s National Accounts Main Aggregate Database. The AMA rates coincide with the IMF rates (which are mostly the annual average of market or official ex-change rates) except for some periods in countries with official
fixed exchange rates and high inflation, when there could be a serious disparity between real GDP growth and growth converted to US dollars based on IMF rates. In such cases, the AMA adjusts the IMF-based rates by multiplying the growth rate of the GDP deflator relative to that of the US.
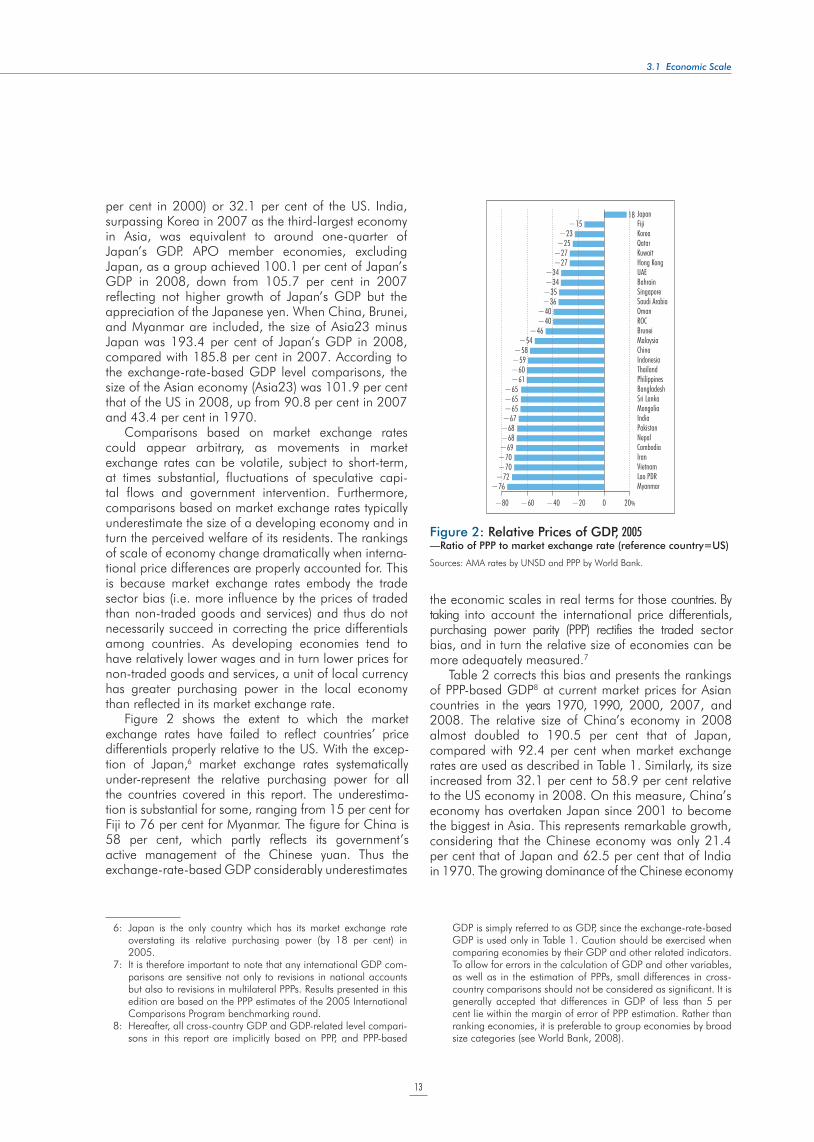
3.1 Economic Scale
13
per cent in 2000) or 32.1 per cent of the US. India, surpassing Korea in 2007 as the third-largest economy in Asia, was equivalent to around one-quarter of Japan’s GDP. APO member economies, excluding Japan, as a group achieved 100.1 per cent of Japan’s GDP in 2008, down from 105.7 per cent in 2007 reflecting not higher growth of Japan’s GDP but the appreciation of the Japanese yen. When China, Brunei, and Myanmar are included, the size of Asia23 minus Japan was 193.4 per cent of Japan’s GDP in 2008, compared with 185.8 per cent in 2007. According to the exchange-rate-based GDP level comparisons, the size of the Asian economy (Asia23) was 101.9 per cent that of the US in 2008, up from 90.8 per cent in 2007 and 43.4 per cent in 1970.
Comparisons based on market exchange rates could appear arbitrary, as movements in market exchange rates can be volatile, subject to short-term, at times substantial, fluctuations of speculative capi- tal flows and government intervention. Furthermore, comparisons based on market exchange rates typically underestimate the size of a developing economy and in turn the perceived welfare of its residents. The rankings of scale of economy change dramatically when interna-tional price differences are properly accounted for. This is because market exchange rates embody the trade sector bias (i.e. more influence by the prices of traded than non-traded goods and services) and thus do not necessarily succeed in correcting the price differentials among countries. As developing economies tend to have relatively lower wages and in turn lower prices for non-traded goods and services, a unit of local currency has greater purchasing power in the local economy than reflected in its market exchange rate.
Figure 2 shows the extent to which the market exchange rates have failed to reflect countries’ price differentials properly relative to the US. With the excep- tion of Japan,6 market exchange rates systematically under-represent the relative purchasing power for all the countries covered in this report. The underestima- tion is substantial for some, ranging from 15 per cent for Fiji to 76 per cent for Myanmar. The figure for China is 58 per cent, which partly reflects its government’s active management of the Chinese yuan. Thus the exchange-rate-based GDP considerably underestimates
the economic scales in real terms for those countries. By taking into account the international price differentials, purchasing power parity (PPP) rectifies the traded sector bias, and in turn the relative size of economies can be more adequately measured.7
Table 2 corrects this bias and presents the rankings of PPP-based GDP8 at current market prices for Asian countries in the years 1970, 1990, 2000, 2007, and 2008. The relative size of China’s economy in 2008 almost doubled to 190.5 per cent that of Japan, compared with 92.4 per cent when market exchange rates are used as described in Table 1. Similarly, its size increased from 32.1 per cent to 58.9 per cent relative to the US economy in 2008. On this measure, China’s economy has overtaken Japan since 2001 to become the biggest in Asia. This represents remarkable growth, considering that the Chinese economy was only 21.4 per cent that of Japan and 62.5 per cent that of India in 1970. The growing dominance of the Chinese economy
−76−72−70−70−69−68−68−67−65−65−65−61−60−59−58−54
−46−40−40−36−35−34−34−27−27−25−23−15
18
−80 −60 −40 −20 0 20%
JapanFijiKoreaQatarKuwaitHong KongUAEBahrainSingaporeSaudi ArabiaOmanROCBruneiMalaysiaChinaIndonesiaThailandPhilippinesBangladeshSri LankaMongoliaIndiaPakistanNepalCambodiaIranVietnamLao PDR Myanmar
Figure 2: Relative Prices of GDP, 2005— Ratio of PPP to market exchange rate (reference country=US)
Sources: AMA rates by UNSD and PPP by World Bank.
6: Japan is the only country which has its market exchange rate overstating its relative purchasing power (by 18 per cent) in 2005.
7: It is therefore important to note that any international GDP com-parisons are sensitive not only to revisions in national accounts but also to revisions in multilateral PPPs. Results presented in this edition are based on the PPP estimates of the 2005 International Comparisons Program benchmarking round.
8: Hereafter, all cross-country GDP and GDP-related level compari-sons in this report are implicitly based on PPP, and PPP-based
GDP is simply referred to as GDP, since the exchange-rate-based GDP is used only in Table 1. Caution should be exercised when comparing economies by their GDP and other related indicators. To allow for errors in the calculation of GDP and other variables, as well as in the estimation of PPPs, small differences in cross-country comparisons should not be considered as significant. It is generally accepted that differences in GDP of less than 5 per cent lie within the margin of error of PPP estimation. Rather than ranking economies, it is preferable to group economies by broad size categories (see World Bank, 2008).
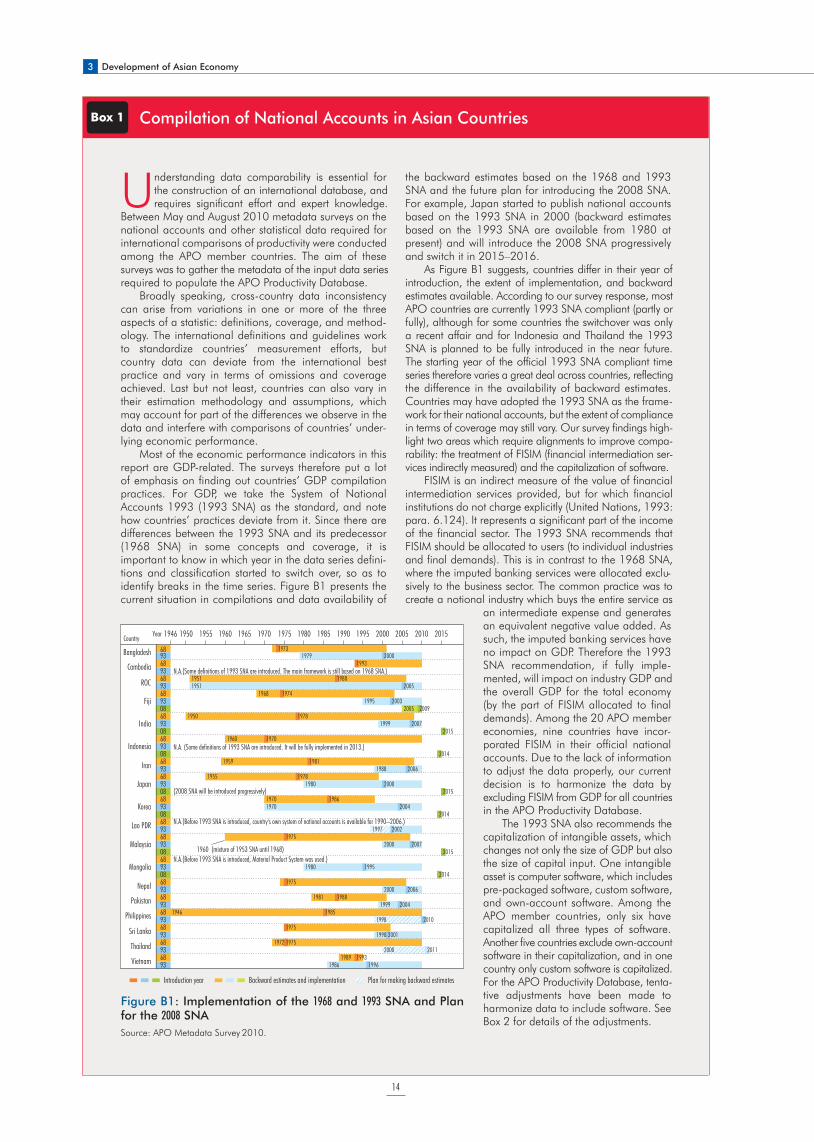
3 Development of Asian Economy
14
Box 1 Compilation of National Accounts in Asian Countries
Understanding data comparability is essential for the construction of an international database, and requires significant effort and expert knowledge.
Between May and August 2010 metadata surveys on the national accounts and other statistical data required for international comparisons of productivity were conducted among the APO member countries. The aim of these surveys was to gather the metadata of the input data series required to populate the APO Productivity Database.
Broadly speaking, cross-country data inconsistency can arise from variations in one or more of the three aspects of a statistic: definitions, coverage, and method-ology. The international definitions and guidelines work to standardize countries’ measurement efforts, but country data can deviate from the international best practice and vary in terms of omissions and coverage achieved. Last but not least, countries can also vary in their estimation methodology and assumptions, which may account for part of the differences we observe in the data and interfere with comparisons of countries’ under-lying economic performance.
Most of the economic performance indicators in this report are GDP-related. The surveys therefore put a lot of emphasis on finding out countries’ GDP compilation practices. For GDP, we take the System of National Accounts 1993 (1993 SNA) as the standard, and note how countries’ practices deviate from it. Since there are differences between the 1993 SNA and its predecessor (1968 SNA) in some concepts and coverage, it is important to know in which year in the data series defini-tions and classification started to switch over, so as to identify breaks in the time series. Figure B1 presents the current situation in compilations and data availability of
the backward estimates based on the 1968 and 1993 SNA and the future plan for introducing the 2008 SNA. For example, Japan started to publish national accounts based on the 1993 SNA in 2000 (backward estimates based on the 1993 SNA are available from 1980 at present) and will introduce the 2008 SNA progressively and switch it in 2015–2016.
As Figure B1 suggests, countries differ in their year of introduction, the extent of implementation, and backward estimates available. According to our survey response, most APO countries are currently 1993 SNA compliant (partly or fully), although for some countries the switchover was only a recent affair and for Indonesia and Thailand the 1993 SNA is planned to be fully introduced in the near future. The starting year of the official 1993 SNA compliant time series therefore varies a great deal across countries, reflecting the difference in the availability of backward estimates. Countries may have adopted the 1993 SNA as the frame- work for their national accounts, but the extent of compliance in terms of coverage may still vary. Our survey findings high- light two areas which require alignments to improve compa- rability: the treatment of FISIM (financial intermediation ser- vices indirectly measured) and the capitalization of software.
FISIM is an indirect measure of the value of financial intermediation services provided, but for which financial institutions do not charge explicitly (United Nations, 1993: para. 6.124). It represents a significant part of the income of the financial sector. The 1993 SNA recommends that FISIM should be allocated to users (to individual industries and final demands). This is in contrast to the 1968 SNA, where the imputed banking services were allocated exclu-sively to the business sector. The common practice was to create a notional industry which buys the entire service as
an intermediate expense and generates an equivalent negative value added. As such, the imputed banking services have no impact on GDP. Therefore the 1993 SNA recommendation, if fully imple-mented, will impact on industry GDP and the overall GDP for the total economy (by the part of FISIM allocated to final demands). Among the 20 APO member economies, nine countries have incor-porated FISIM in their official national accounts. Due to the lack of information to adjust the data properly, our current decision is to harmonize the data by excluding FISIM from GDP for all countries in the APO Productivity Database.
The 1993 SNA also recommends the capitalization of intangible assets, which changes not only the size of GDP but also the size of capital input. One intangible asset is computer software, which includes pre-packaged software, custom software, and own-account software. Among the APO member countries, only six have capitalized all three types of software. Another five countries exclude own-account software in their capitalization, and in one country only custom software is capitalized. For the APO Productivity Database, tenta- tive adjustments have been made to harmonize data to include software. See Box 2 for details of the adjustments.
Figure B1: Implementation of the 1968 and 1993 SNA and Plan for the 2008 SNA
1946 1950 1955 1960 1965 1970 1975 1980 1985 1990 1995 2000 2005 2010 2015
19731979 2000
1993
1951 19881951 2005
1968 19741995 2003
2005 20091950 1978
1999 20072015
1960 1970
20141959 1981
1988 20061955 1978
1980 2000(2008 SNA will be introduced progressively) 2015
1970 19861970 2004
2014
1997 2002
1960 (mixture of 1953 SNA until 1968)
19752000 2007
2015
1980 19952014
19752000 2006
1981 19881999 2004
1946 19851998 2010
19751998 2001
1972 19752000 2011
1989 1993
68936893689368930868930868930868936893086893086893689308689308689368936893689368936893 1986 1996
N.A.(Before 1993 SNA is introduced, Material Product System was used.)
Pakistan
Philippines
Iran
Korea
Indonesia
Sri Lanka
Vietnam
Introduction year Backward estimates and implementation Plan for making backward estimates
Thailand
N.A.(Before 1993 SNA is introduced, country's own system of national accounts is available for 1990–2006.)
Bangladesh
Cambodia
ROCN.A.(Some definitions of 1993 SNA are introduced. The main framework is still based on 1968 SNA.)
India
Lao PDR
Malaysia
Japan
Mongolia
Fiji
N.A. (Some definitions of 1993 SNA are introduced. It will be fully implemented in 2013.)
Nepal
YearCountry
Source: APO Metadata Survey 2010.
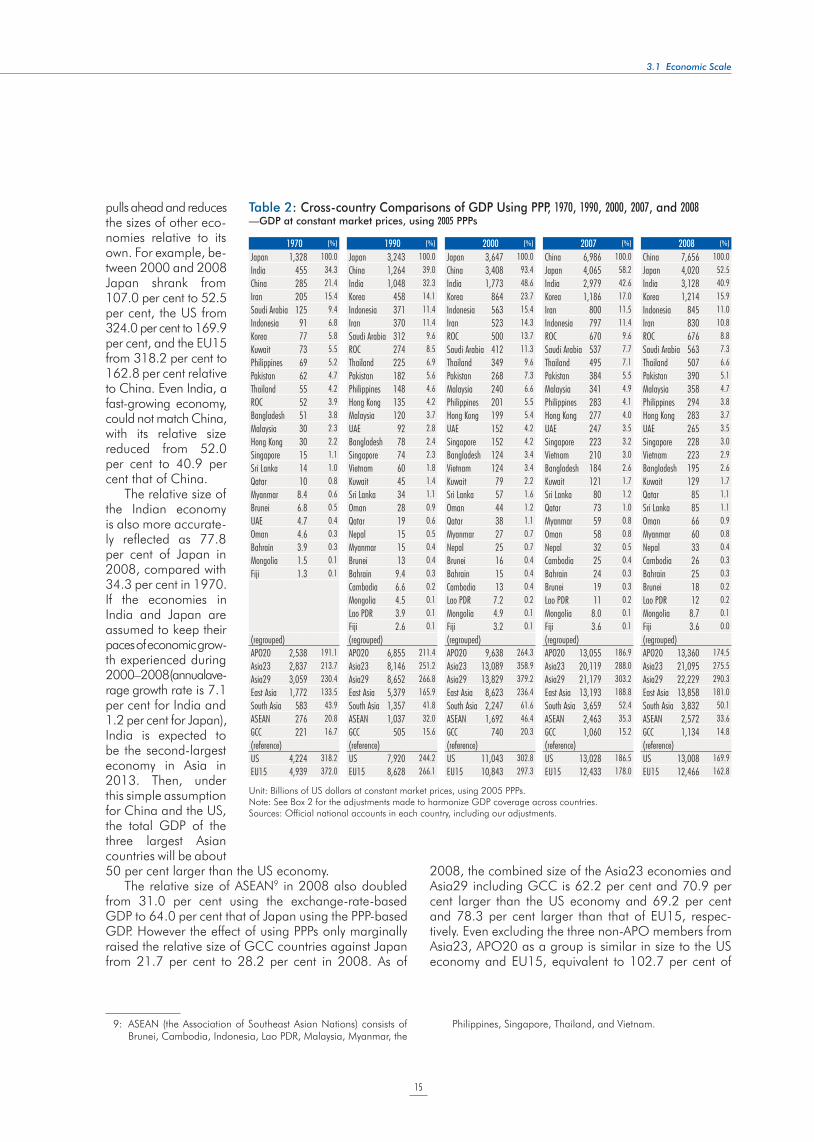
3.1 Economic Scale
15
pulls ahead and reduces the sizes of other eco- nomies relative to its own. For example, be- tween 2000 and 2008 Japan shrank from 107.0 per cent to 52.5 per cent, the US from 324.0 per cent to 169.9 per cent, and the EU15 from 318.2 per cent to 162.8 per cent relative to China. Even India, a fast-growing economy, could not match China, with its relative size reduced from 52.0 per cent to 40.9 per cent that of China.
The relative size of the Indian economy is also more accurate- ly reflected as 77.8 per cent of Japan in 2008, compared with 34.3 per cent in 1970. If the economies in India and Japan are assumed to keep their paces of economic grow- th experienced during 2000–2008 (annual ave- rage growth rate is 7.1 per cent for India and 1.2 per cent for Japan), India is expected to be the second-largest economy in Asia in 2013. Then, under this simple assumption for China and the US, the total GDP of the three largest Asian countries will be about 50 per cent larger than the US economy.
The relative size of ASEAN9 in 2008 also doubled from 31.0 per cent using the exchange-rate-based GDP to 64.0 per cent that of Japan using the PPP-based GDP. However the effect of using PPPs only marginally raised the relative size of GCC countries against Japan from 21.7 per cent to 28.2 per cent in 2008. As of
2008, the combined size of the Asia23 economies and Asia29 including GCC is 62.2 per cent and 70.9 per cent larger than the US economy and 69.2 per cent and 78.3 per cent larger than that of EU15, respec-tively. Even excluding the three non-APO members from Asia23, APO20 as a group is similar in size to the US economy and EU15, equivalent to 102.7 per cent of
1970 (%) 1990 (%) 2000 (%) 2007 (%) 2008 (%)
Japan 1,328 100.0 Japan 3,243 100.0 Japan 3,647 100.0 China 6,986 100.0 China 7,656 100.0
India 455 34.3 China 1,264 39.0 China 3,408 93.4 Japan 4,065 58.2 Japan 4,020 52.5
China 285 21.4 India 1,048 32.3 India 1,773 48.6 India 2,979 42.6 India 3,128 40.9
Iran 205 15.4 Korea 458 14.1 Korea 864 23.7 Korea 1,186 17.0 Korea 1,214 15.9
Saudi Arabia 125 9.4 Indonesia 371 11.4 Indonesia 563 15.4 Iran 800 11.5 Indonesia 845 11.0
Indonesia 91 6.8 Iran 370 11.4 Iran 523 14.3 Indonesia 797 11.4 Iran 830 10.8
Korea 77 5.8 Saudi Arabia 312 9.6 ROC 500 13.7 ROC 670 9.6 ROC 676 8.8
Kuwait 73 5.5 ROC 274 8.5 Saudi Arabia 412 11.3 Saudi Arabia 537 7.7 Saudi Arabia 563 7.3
Philippines 69 5.2 Thailand 225 6.9 Thailand 349 9.6 Thailand 495 7.1 Thailand 507 6.6
Pakistan 62 4.7 Pakistan 182 5.6 Pakistan 268 7.3 Pakistan 384 5.5 Pakistan 390 5.1
Thailand 55 4.2 Philippines 148 4.6 Malaysia 240 6.6 Malaysia 341 4.9 Malaysia 358 4.7
ROC 52 3.9 Hong Kong 135 4.2 Philippines 201 5.5 Philippines 283 4.1 Philippines 294 3.8
Bangladesh 51 3.8 Malaysia 120 3.7 Hong Kong 199 5.4 Hong Kong 277 4.0 Hong Kong 283 3.7
Malaysia 30 2.3 UAE 92 2.8 UAE 152 4.2 UAE 247 3.5 UAE 265 3.5
Hong Kong 30 2.2 Bangladesh 78 2.4 Singapore 152 4.2 Singapore 223 3.2 Singapore 228 3.0
Singapore 15 1.1 Singapore 74 2.3 Bangladesh 124 3.4 Vietnam 210 3.0 Vietnam 223 2.9
Sri Lanka 14 1.0 Vietnam 60 1.8 Vietnam 124 3.4 Bangladesh 184 2.6 Bangladesh 195 2.6
Qatar 10 0.8 Kuwait 45 1.4 Kuwait 79 2.2 Kuwait 121 1.7 Kuwait 129 1.7
Myanmar 8.4 0.6 Sri Lanka 34 1.1 Sri Lanka 57 1.6 Sri Lanka 80 1.2 Qatar 85 1.1
Brunei 6.8 0.5 Oman 28 0.9 Oman 44 1.2 Qatar 73 1.0 Sri Lanka 85 1.1
UAE 4.7 0.4 Qatar 19 0.6 Qatar 38 1.1 Myanmar 59 0.8 Oman 66 0.9
Oman 4.6 0.3 Nepal 15 0.5 Myanmar 27 0.7 Oman 58 0.8 Myanmar 60 0.8
Bahrain 3.9 0.3 Myanmar 15 0.4 Nepal 25 0.7 Nepal 32 0.5 Nepal 33 0.4
Mongolia 1.5 0.1 Brunei 13 0.4 Brunei 16 0.4 Cambodia 25 0.4 Cambodia 26 0.3
Fiji 1.3 0.1 Bahrain 9.4 0.3 Bahrain 15 0.4 Bahrain 24 0.3 Bahrain 25 0.3
Cambodia 6.6 0.2 Cambodia 13 0.4 Brunei 19 0.3 Brunei 18 0.2
Mongolia 4.5 0.1 Lao PDR 7.2 0.2 Lao PDR 11 0.2 Lao PDR 12 0.2
Lao PDR 3.9 0.1 Mongolia 4.9 0.1 Mongolia 8.0 0.1 Mongolia 8.7 0.1
Fiji 2.6 0.1 Fiji 3.2 0.1 Fiji 3.6 0.1 Fiji 3.6 0.0
(regrouped) (regrouped) (regrouped) (regrouped) (regrouped)
APO20 2,538 191.1 APO20 6,855 211.4 APO20 9,638 264.3 APO20 13,055 186.9 APO20 13,360 174.5
Asia23 2,837 213.7 Asia23 8,146 251.2 Asia23 13,089 358.9 Asia23 20,119 288.0 Asia23 21,095 275.5
Asia29 3,059 230.4 Asia29 8,652 266.8 Asia29 13,829 379.2 Asia29 21,179 303.2 Asia29 22,229 290.3
East Asia 1,772 133.5 East Asia 5,379 165.9 East Asia 8,623 236.4 East Asia 13,193 188.8 East Asia 13,858 181.0
South Asia 583 43.9 South Asia 1,357 41.8 South Asia 2,247 61.6 South Asia 3,659 52.4 South Asia 3,832 50.1
ASEAN 276 20.8 ASEAN 1,037 32.0 ASEAN 1,692 46.4 ASEAN 2,463 35.3 ASEAN 2,572 33.6
GCC 221 16.7 GCC 505 15.6 GCC 740 20.3 GCC 1,060 15.2 GCC 1,134 14.8
(reference) (reference) (reference) (reference) (reference)
US 4,224 318.2 US 7,920 244.2 US 11,043 302.8 US 13,028 186.5 US 13,008 169.9
EU15 4,939 372.0 EU15 8,628 266.1 EU15 10,843 297.3 EU15 12,433 178.0 EU15 12,466 162.8
Unit: Billions of US dollars at constant market prices, using 2005 PPPs.Note: See Box 2 for the adjustments made to harmonize GDP coverage across countries.Sources: Official national accounts in each country, including our adjustments.
Table 2: Cross-country Comparisons of GDP Using PPP, 1970, 1990, 2000, 2007, and 2008—GDP at constant market prices, using 2005 PPPs
9: ASEAN (the Association of Southeast Asian Nations) consists of Brunei, Cambodia, Indonesia, Lao PDR, Malaysia, Myanmar, the
Philippines, Singapore, Thailand, and Vietnam.
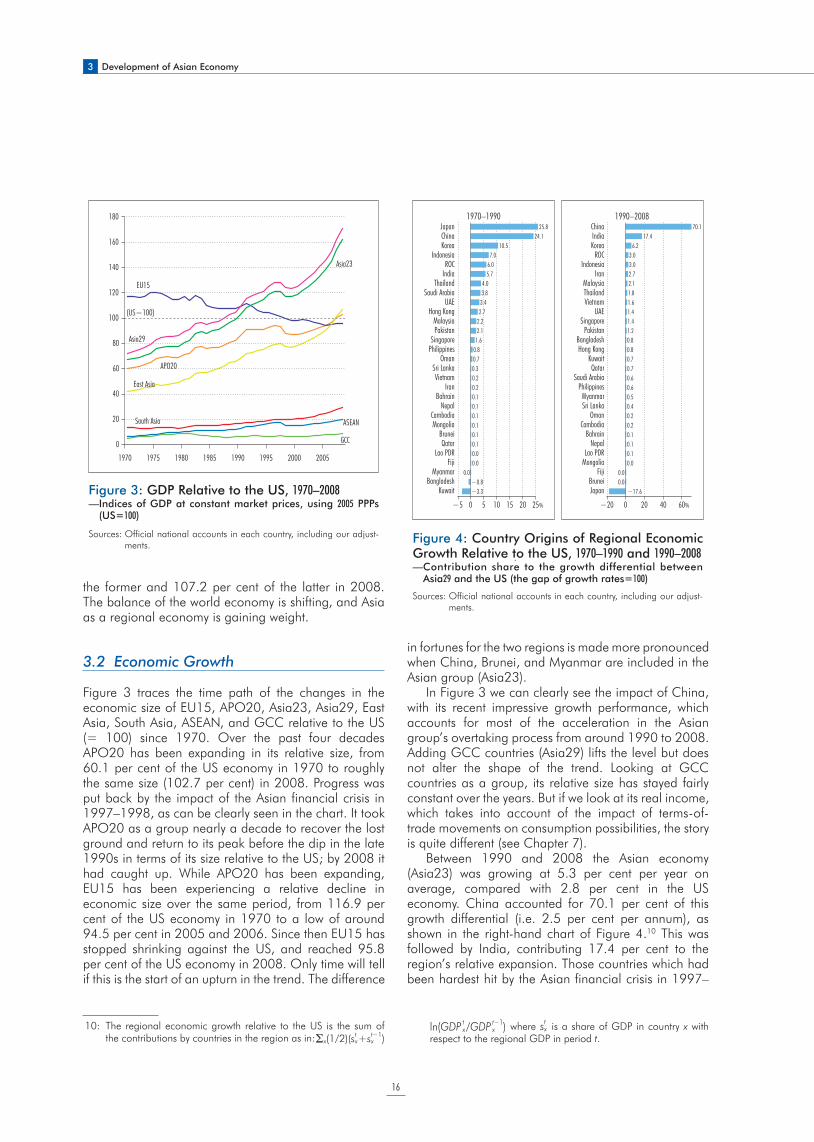
3 Development of Asian Economy
16
the former and 107.2 per cent of the latter in 2008. The balance of the world economy is shifting, and Asia as a regional economy is gaining weight.
3.2 Economic Growth
Figure 3 traces the time path of the changes in the economic size of EU15, APO20, Asia23, Asia29, East Asia, South Asia, ASEAN, and GCC relative to the US (= 100) since 1970. Over the past four decades APO20 has been expanding in its relative size, from 60.1 per cent of the US economy in 1970 to roughly the same size (102.7 per cent) in 2008. Progress was put back by the impact of the Asian financial crisis in 1997–1998, as can be clearly seen in the chart. It took APO20 as a group nearly a decade to recover the lost ground and return to its peak before the dip in the late 1990s in terms of its size relative to the US; by 2008 it had caught up. While APO20 has been expanding, EU15 has been experiencing a relative decline in economic size over the same period, from 116.9 per cent of the US economy in 1970 to a low of around 94.5 per cent in 2005 and 2006. Since then EU15 has stopped shrinking against the US, and reached 95.8 per cent of the US economy in 2008. Only time will tell if this is the start of an upturn in the trend. The difference
in fortunes for the two regions is made more pronounced when China, Brunei, and Myanmar are included in the Asian group (Asia23).
In Figure 3 we can clearly see the impact of China, with its recent impressive growth performance, which accounts for most of the acceleration in the Asian group’s overtaking process from around 1990 to 2008. Adding GCC countries (Asia29) lifts the level but does not alter the shape of the trend. Looking at GCC countries as a group, its relative size has stayed fairly constant over the years. But if we look at its real income, which takes into account of the impact of terms-of-trade movements on consumption possibilities, the story is quite different (see Chapter 7).
Between 1990 and 2008 the Asian economy (Asia23) was growing at 5.3 per cent per year on average, compared with 2.8 per cent in the US economy. China accounted for 70.1 per cent of this growth differential (i.e. 2.5 per cent per annum), as shown in the right-hand chart of Figure 4.10 This was followed by India, contributing 17.4 per cent to the region’s relative expansion. Those countries which had been hardest hit by the Asian financial crisis in 1997–
0
20
40
60
80
100
120
140
160
180
1970 1975 1980 1985 1990 1995 2000 2005
(US=100)
EU15
Asia29
GCC
APO20
ASEAN
Asia23
East Asia
South Asia
Figure 3: GDP Relative to the US, 1970–2008— Indices of GDP at constant market prices, using 2005 PPPs
(US=100)
Sources: Official national accounts in each country, including our adjust-ments.
10: The regional economic growth relative to the US is the sum of the contributions by countries in the region as in: x(1/2)(st
x+st−1x )ln(GDP t
x/GDP t−1x )
x(1/2)(stx+st−1
x )ln(GDP tx/GDP t−1
x ) where stx is a share of GDP in country x with
respect to the regional GDP in period t.
Figure 4: Country Origins of Regional Economic Growth Relative to the US, 1970–1990 and 1990–2008— Contribution share to the growth differential between
Asia29 and the US (the gap of growth rates=100)
Sources: Official national accounts in each country, including our adjust-ments.
−3.3−0.8
0.00.00.00.10.10.10.10.10.10.20.20.30.70.81.62.12.22.73.43.84.0
5.76.07.0
10.524.1
25.8
−5 0 5 10 15 20 25%
ChinaIndiaKorea
ROCIndonesia
IranMalaysiaThailandVietnam
UAESingapore
PakistanBangladeshHong Kong
KuwaitQatar
Saudi ArabiaPhilippines
MyanmarSri Lanka
OmanCambodia
BahrainNepal
Lao PDRMongolia
FijiBruneiJapan
1970–1990
−20 0 20 40 60%
−17.60.00.0
0.00.10.10.10.20.20.40.50.60.60.70.70.80.81.21.41.41.61.82.12.73.03.0
6.217.4
70.11990–2008
JapanChinaKorea
IndonesiaROC
IndiaThailand
Saudi ArabiaUAE
Hong KongMalaysiaPakistan
SingaporePhilippines
OmanSri LankaVietnam
IranBahrain
NepalCambodiaMongolia
BruneiQatar
Lao PDRFiji
MyanmarBangladesh
Kuwait
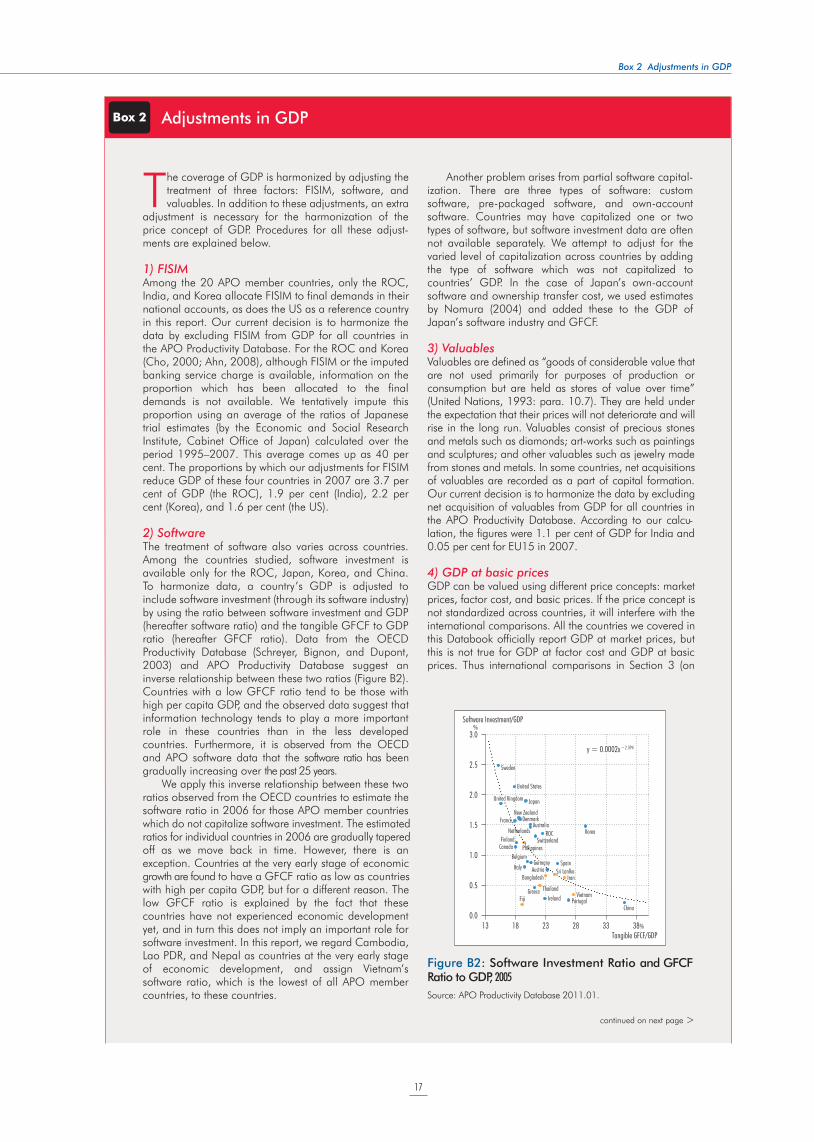
17
The coverage of GDP is harmonized by adjusting the treatment of three factors: FISIM, software, and valuables. In addition to these adjustments, an extra
adjustment is necessary for the harmonization of the price concept of GDP. Procedures for all these adjust-ments are explained below.
1) FISIMAmong the 20 APO member countries, only the ROC, India, and Korea allocate FISIM to final demands in their national accounts, as does the US as a reference country in this report. Our current decision is to harmonize the data by excluding FISIM from GDP for all countries in the APO Productivity Database. For the ROC and Korea (Cho, 2000; Ahn, 2008), although FISIM or the imputed banking service charge is available, information on the proportion which has been allocated to the final demands is not available. We tentatively impute this proportion using an average of the ratios of Japanese trial estimates (by the Economic and Social Research Institute, Cabinet Office of Japan) calculated over the period 1995–2007. This average comes up as 40 per cent. The proportions by which our adjustments for FISIM reduce GDP of these four countries in 2007 are 3.7 per cent of GDP (the ROC), 1.9 per cent (India), 2.2 per cent (Korea), and 1.6 per cent (the US).
2) SoftwareThe treatment of software also varies across countries. Among the countries studied, software investment is available only for the ROC, Japan, Korea, and China. To harmonize data, a country’s GDP is adjusted to include software investment (through its software industry) by using the ratio between software investment and GDP (hereafter software ratio) and the tangible GFCF to GDP ratio (hereafter GFCF ratio). Data from the OECD Productivity Database (Schreyer, Bignon, and Dupont, 2003) and APO Productivity Database suggest an inverse relationship between these two ratios (Figure B2). Countries with a low GFCF ratio tend to be those with high per capita GDP, and the observed data suggest that information technology tends to play a more important role in these countries than in the less developed countries. Furthermore, it is observed from the OECD and APO software data that the software ratio has been gradually increasing over the past 25 years.
We apply this inverse relationship between these two ratios observed from the OECD countries to estimate the software ratio in 2006 for those APO member countries which do not capitalize software investment. The estimated ratios for individual countries in 2006 are gradually tapered off as we move back in time. However, there is an exception. Countries at the very early stage of economic growth are found to have a GFCF ratio as low as countries with high per capita GDP, but for a different reason. The low GFCF ratio is explained by the fact that these countries have not experienced economic development yet, and in turn this does not imply an important role for software investment. In this report, we regard Cambodia, Lao PDR, and Nepal as countries at the very early stage of economic development, and assign Vietnam’s software ratio, which is the lowest of all APO member countries, to these countries.
Another problem arises from partial software capital-ization. There are three types of software: custom software, pre-packaged software, and own-account software. Countries may have capitalized one or two types of software, but software investment data are often not available separately. We attempt to adjust for the varied level of capitalization across countries by adding the type of software which was not capitalized to countries’ GDP. In the case of Japan’s own-account software and ownership transfer cost, we used estimates by Nomura (2004) and added these to the GDP of Japan’s software industry and GFCF.
3) ValuablesValuables are defined as “goods of considerable value that are not used primarily for purposes of production or consumption but are held as stores of value over time” (United Nations, 1993: para. 10.7). They are held under the expectation that their prices will not deteriorate and will rise in the long run. Valuables consist of precious stones and metals such as diamonds; art-works such as paintings and sculptures; and other valuables such as jewelry made from stones and metals. In some countries, net acquisitions of valuables are recorded as a part of capital formation. Our current decision is to harmonize the data by excluding net acquisition of valuables from GDP for all countries in the APO Productivity Database. According to our calcu-lation, the figures were 1.1 per cent of GDP for India and 0.05 per cent for EU15 in 2007.
4) GDP at basic pricesGDP can be valued using different price concepts: market prices, factor cost, and basic prices. If the price concept is not standardized across countries, it will interfere with the international comparisons. All the countries we covered in this Databook officially report GDP at market prices, but this is not true for GDP at factor cost and GDP at basic prices. Thus international comparisons in Section 3 (on
Box 2 Adjustments in GDP
Australia
Austria
France
Germany
United Kingdom
Australia
AustriaBangladesh
BelgiumBelgiumCanada
New Zealand
Finland
France
Germany
GreeceFiji Ireland
Thailand
Sri LanlkaIran
Italy
Japan
Netherlands
Denmark
PortugalVietnam
Spain
Sweden
United Kingdom
United States
SwitzerlandPhilippines
KoreaROC
China
y = 0.0002x−2.394y = 0.0002x−2.394
13 18 23 28 33 38%
Software Investment/GDP
3.0
2.5
2.0
1.5
1.0
0.5
0.0
%
Tangible GFCF/GDP
Figure B2: Software Investment Ratio and GFCF Ratio to GDP, 2005
Source: APO Productivity Database 2011.01.
Box 2 Adjustments in GDP
continued on next page >
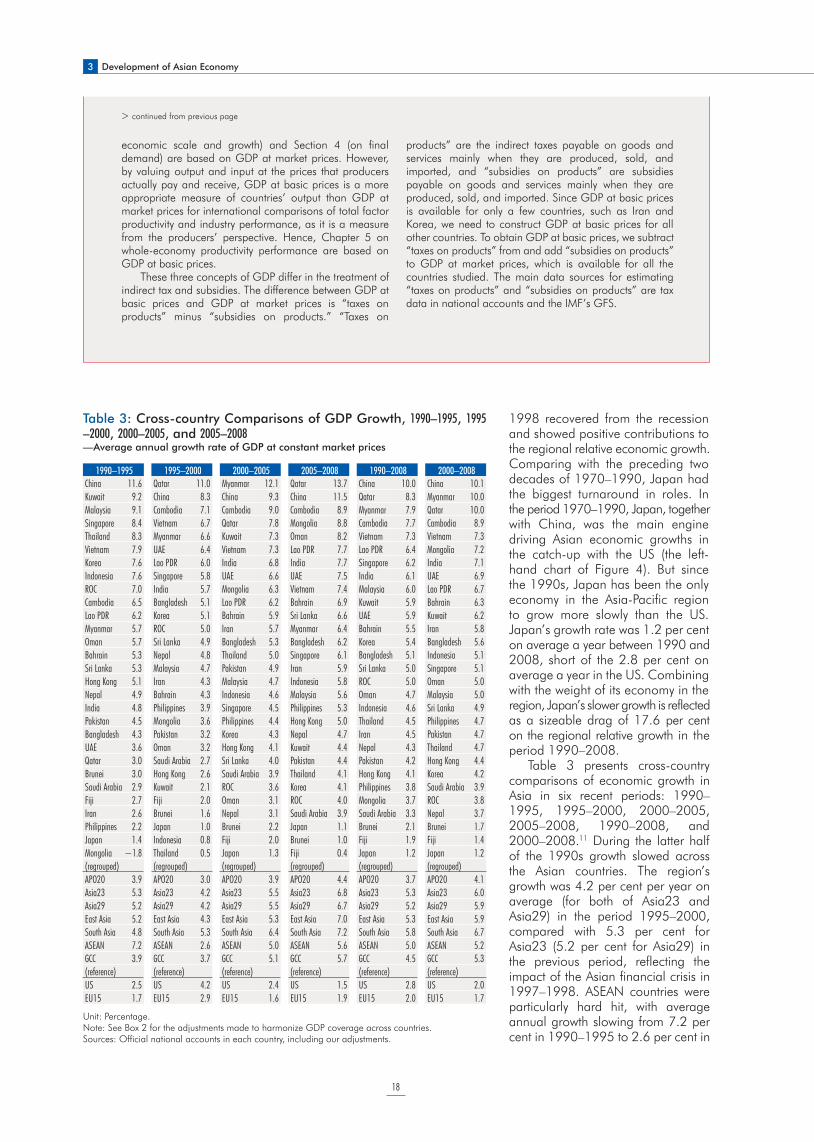
3 Development of Asian Economy
18
1998 recovered from the recession and showed positive contributions to the regional relative economic growth. Comparing with the preceding two decades of 1970–1990, Japan had the biggest turnaround in roles. In the period 1970–1990, Japan, together with China, was the main engine driving Asian economic growths in the catch-up with the US (the left-hand chart of Figure 4). But since the 1990s, Japan has been the only economy in the Asia-Pacific region to grow more slowly than the US. Japan’s growth rate was 1.2 per cent on average a year between 1990 and 2008, short of the 2.8 per cent on average a year in the US. Combining with the weight of its economy in the region, Japan’s slower growth is reflected as a sizeable drag of 17.6 per cent on the regional relative growth in the period 1990–2008.
Table 3 presents cross-country comparisons of economic growth in Asia in six recent periods: 1990–1995, 1995–2000, 2000–2005, 2005–2008, 1990–2008, and 2000–2008.11 During the latter half of the 1990s growth slowed across the Asian countries. The region’s growth was 4.2 per cent per year on average (for both of Asia23 and Asia29) in the period 1995–2000, compared with 5.3 per cent for Asia23 (5.2 per cent for Asia29) in the previous period, reflecting the impact of the Asian financial crisis in 1997–1998. ASEAN countries were particularly hard hit, with average annual growth slowing from 7.2 per cent in 1990–1995 to 2.6 per cent in
Unit: Percentage.Note: See Box 2 for the adjustments made to harmonize GDP coverage across countries.Sources: Official national accounts in each country, including our adjustments.
Table 3: Cross-country Comparisons of GDP Growth, 1990–1995, 1995–2000, 2000–2005, and 2005–2008—Average annual growth rate of GDP at constant market prices
1990–1995 1995–2000 2000–2005 2005–2008 1990–2008 2000–2008
China 11.6 Qatar 11.0 Myanmar 12.1 Qatar 13.7 China 10.0 China 10.1
Kuwait 9.2 China 8.3 China 9.3 China 11.5 Qatar 8.3 Myanmar 10.0
Malaysia 9.1 Cambodia 7.1 Cambodia 9.0 Cambodia 8.9 Myanmar 7.9 Qatar 10.0
Singapore 8.4 Vietnam 6.7 Qatar 7.8 Mongolia 8.8 Cambodia 7.7 Cambodia 8.9
Thailand 8.3 Myanmar 6.6 Kuwait 7.3 Oman 8.2 Vietnam 7.3 Vietnam 7.3
Vietnam 7.9 UAE 6.4 Vietnam 7.3 Lao PDR 7.7 Lao PDR 6.4 Mongolia 7.2
Korea 7.6 Lao PDR 6.0 India 6.8 India 7.7 Singapore 6.2 India 7.1
Indonesia 7.6 Singapore 5.8 UAE 6.6 UAE 7.5 India 6.1 UAE 6.9
ROC 7.0 India 5.7 Mongolia 6.3 Vietnam 7.4 Malaysia 6.0 Lao PDR 6.7
Cambodia 6.5 Bangladesh 5.1 Lao PDR 6.2 Bahrain 6.9 Kuwait 5.9 Bahrain 6.3
Lao PDR 6.2 Korea 5.1 Bahrain 5.9 Sri Lanka 6.6 UAE 5.9 Kuwait 6.2
Myanmar 5.7 ROC 5.0 Iran 5.7 Myanmar 6.4 Bahrain 5.5 Iran 5.8
Oman 5.7 Sri Lanka 4.9 Bangladesh 5.3 Bangladesh 6.2 Korea 5.4 Bangladesh 5.6
Bahrain 5.3 Nepal 4.8 Thailand 5.0 Singapore 6.1 Bangladesh 5.1 Indonesia 5.1
Sri Lanka 5.3 Malaysia 4.7 Pakistan 4.9 Iran 5.9 Sri Lanka 5.0 Singapore 5.1
Hong Kong 5.1 Iran 4.3 Malaysia 4.7 Indonesia 5.8 ROC 5.0 Oman 5.0
Nepal 4.9 Bahrain 4.3 Indonesia 4.6 Malaysia 5.6 Oman 4.7 Malaysia 5.0
India 4.8 Philippines 3.9 Singapore 4.5 Philippines 5.3 Indonesia 4.6 Sri Lanka 4.9
Pakistan 4.5 Mongolia 3.6 Philippines 4.4 Hong Kong 5.0 Thailand 4.5 Philippines 4.7
Bangladesh 4.3 Pakistan 3.2 Korea 4.3 Nepal 4.7 Iran 4.5 Pakistan 4.7
UAE 3.6 Oman 3.2 Hong Kong 4.1 Kuwait 4.4 Nepal 4.3 Thailand 4.7
Qatar 3.0 Saudi Arabia 2.7 Sri Lanka 4.0 Pakistan 4.4 Pakistan 4.2 Hong Kong 4.4
Brunei 3.0 Hong Kong 2.6 Saudi Arabia 3.9 Thailand 4.1 Hong Kong 4.1 Korea 4.2
Saudi Arabia 2.9 Kuwait 2.1 ROC 3.6 Korea 4.1 Philippines 3.8 Saudi Arabia 3.9
Fiji 2.7 Fiji 2.0 Oman 3.1 ROC 4.0 Mongolia 3.7 ROC 3.8
Iran 2.6 Brunei 1.6 Nepal 3.1 Saudi Arabia 3.9 Saudi Arabia 3.3 Nepal 3.7
Philippines 2.2 Japan 1.0 Brunei 2.2 Japan 1.1 Brunei 2.1 Brunei 1.7
Japan 1.4 Indonesia 0.8 Fiji 2.0 Brunei 1.0 Fiji 1.9 Fiji 1.4
Mongolia !1.8 Thailand 0.5 Japan 1.3 Fiji 0.4 Japan 1.2 Japan 1.2
(regrouped) (regrouped) (regrouped) (regrouped) (regrouped) (regrouped)
APO20 3.9 APO20 3.0 APO20 3.9 APO20 4.4 APO20 3.7 APO20 4.1
Asia23 5.3 Asia23 4.2 Asia23 5.5 Asia23 6.8 Asia23 5.3 Asia23 6.0
Asia29 5.2 Asia29 4.2 Asia29 5.5 Asia29 6.7 Asia29 5.2 Asia29 5.9
East Asia 5.2 East Asia 4.3 East Asia 5.3 East Asia 7.0 East Asia 5.3 East Asia 5.9
South Asia 4.8 South Asia 5.3 South Asia 6.4 South Asia 7.2 South Asia 5.8 South Asia 6.7
ASEAN 7.2 ASEAN 2.6 ASEAN 5.0 ASEAN 5.6 ASEAN 5.0 ASEAN 5.2
GCC 3.9 GCC 3.7 GCC 5.1 GCC 5.7 GCC 4.5 GCC 5.3
(reference) (reference) (reference) (reference) (reference) (reference)
US 2.5 US 4.2 US 2.4 US 1.5 US 2.8 US 2.0
EU15 1.7 EU15 2.9 EU15 1.6 EU15 1.9 EU15 2.0 EU15 1.7
economic scale and growth) and Section 4 (on final demand) are based on GDP at market prices. However, by valuing output and input at the prices that producers actually pay and receive, GDP at basic prices is a more appropriate measure of countries’ output than GDP at market prices for international comparisons of total factor productivity and industry performance, as it is a measure from the producers’ perspective. Hence, Chapter 5 on whole-economy productivity performance are based on GDP at basic prices.
These three concepts of GDP differ in the treatment of indirect tax and subsidies. The difference between GDP at basic prices and GDP at market prices is “taxes on products” minus “subsidies on products.” “Taxes on
products” are the indirect taxes payable on goods and services mainly when they are produced, sold, and imported, and “subsidies on products” are subsidies payable on goods and services mainly when they are produced, sold, and imported. Since GDP at basic prices is available for only a few countries, such as Iran and Korea, we need to construct GDP at basic prices for all other countries. To obtain GDP at basic prices, we subtract “taxes on products” from and add “subsidies on products” to GDP at market prices, which is available for all the countries studied. The main data sources for estimating “taxes on products” and “subsidies on products” are tax data in national accounts and the IMF’s GFS.
> continued from previous page
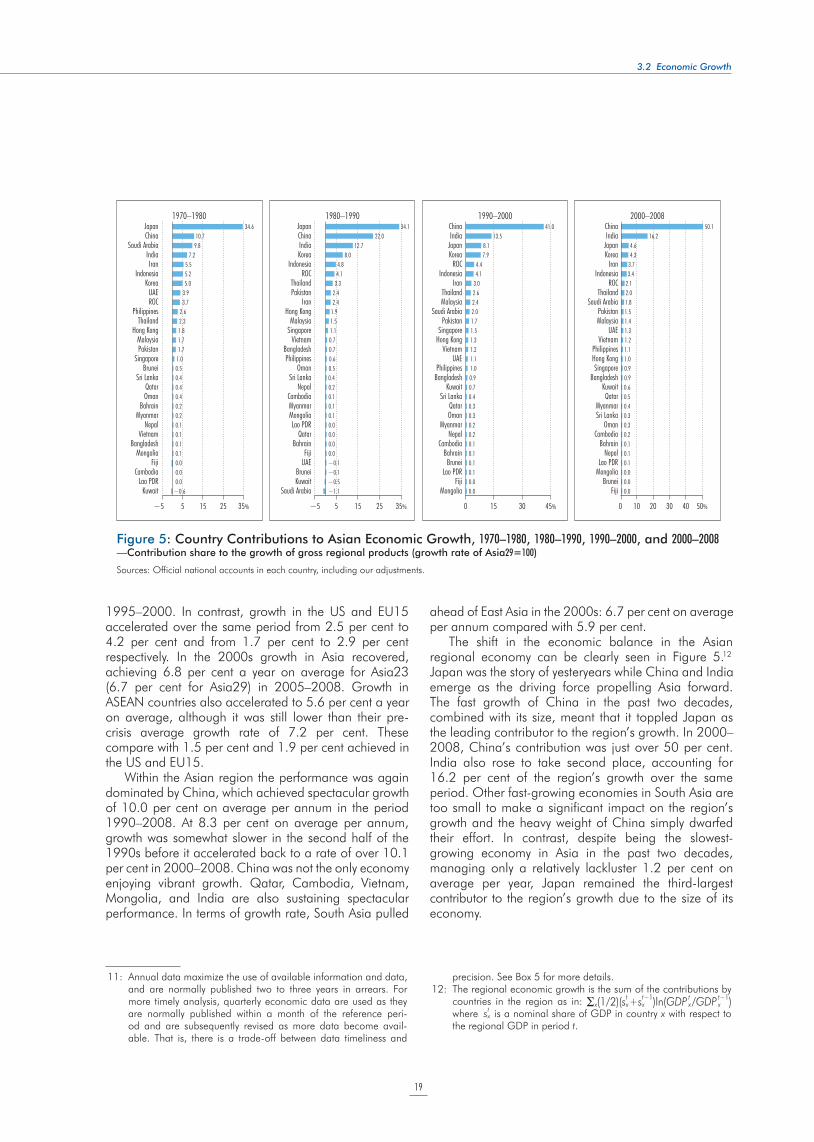
19
3.2 Economic Growth
1995–2000. In contrast, growth in the US and EU15 accelerated over the same period from 2.5 per cent to 4.2 per cent and from 1.7 per cent to 2.9 per cent respectively. In the 2000s growth in Asia recovered, achieving 6.8 per cent a year on average for Asia23 (6.7 per cent for Asia29) in 2005–2008. Growth in ASEAN countries also accelerated to 5.6 per cent a year on average, although it was still lower than their pre-crisis average growth rate of 7.2 per cent. These compare with 1.5 per cent and 1.9 per cent achieved in the US and EU15.
Within the Asian region the performance was again dominated by China, which achieved spectacular growth of 10.0 per cent on average per annum in the period 1990–2008. At 8.3 per cent on average per annum, growth was somewhat slower in the second half of the 1990s before it accelerated back to a rate of over 10.1 per cent in 2000–2008. China was not the only economy enjoying vibrant growth. Qatar, Cambodia, Vietnam, Mongolia, and India are also sustaining spectacular performance. In terms of growth rate, South Asia pulled
ahead of East Asia in the 2000s: 6.7 per cent on average per annum compared with 5.9 per cent.
The shift in the economic balance in the Asian regional economy can be clearly seen in Figure 5.12 Japan was the story of yesteryears while China and India emerge as the driving force propelling Asia forward. The fast growth of China in the past two decades, combined with its size, meant that it toppled Japan as the leading contributor to the region’s growth. In 2000–2008, China’s contribution was just over 50 per cent. India also rose to take second place, accounting for 16.2 per cent of the region’s growth over the same period. Other fast-growing economies in South Asia are too small to make a significant impact on the region’s growth and the heavy weight of China simply dwarfed their effort. In contrast, despite being the slowest-growing economy in Asia in the past two decades, managing only a relatively lackluster 1.2 per cent on average per year, Japan remained the third-largest contributor to the region’s growth due to the size of its economy.
11: Annual data maximize the use of available information and data, and are normally published two to three years in arrears. For more timely analysis, quarterly economic data are used as they are normally published within a month of the reference peri- od and are subsequently revised as more data become avail- able. That is, there is a trade-off between data timeliness and
precision. See Box 5 for more details.12: The regional economic growth is the sum of the contributions by
countries in the region as in: x(1/2)(stx+st−1
x )ln(GDP tx/GDP t−1
x ) where st
x is a nominal share of GDP in country x with respect to the regional GDP in period t.
−0.60.00.00.00.10.10.10.10.20.20.40.40.40.51.01.71.71.82.32.63.73.95.05.25.5
7.29.810.7
34.6
−5 5 15 25 35% −5 5 15 25 35%
1970–1980
−1.1−0.5−0.1−0.10.00.00.00.00.10.10.10.20.40.50.60.70.71.11.51.92.42.43.34.14.8
8.012.7
22.034.1
0.00.00.10.10.10.10.20.20.30.30.40.70.91.01.11.21.31.51.72.02.42.63.04.14.4
7.98.1
13.541.0
0 15 30 45%
1990–2000
0.00.00.00.10.10.10.20.30.30.40.50.60.90.91.01.11.21.31.41.51.82.02.13.43.74.34.6
16.250.1
0 10 20 30 40 50%
1980–1990 2000–2008ChinaIndia
JapanKorea
IranIndonesia
ROCThailand
Saudi ArabiaPakistanMalaysia
UAEVietnam
PhilippinesHong KongSingapore
BangladeshKuwaitQatar
MyanmarSri Lanka
OmanCambodia
BahrainNepal
Lao PDRMongolia
BruneiFiji
ChinaIndia
JapanKorea
ROCIndonesia
IranThailandMalaysia
Saudi ArabiaPakistan
SingaporeHong Kong
VietnamUAE
PhilippinesBangladesh
KuwaitSri Lanka
QatarOman
MyanmarNepal
CambodiaBahrainBrunei
Lao PDRFiji
Mongolia
JapanChina
Saudi ArabiaIndiaIran
IndonesiaKorea
UAEROC
PhilippinesThailand
Hong KongMalaysiaPakistan
SingaporeBrunei
Sri LankaQatarOman
BahrainMyanmar
NepalVietnam
BangladeshMongolia
FijiCambodia
Lao PDRKuwait
JapanChinaIndiaKorea
IndonesiaROC
ThailandPakistan
IranHong Kong
MalaysiaSingapore
VietnamBangladeshPhilippines
OmanSri Lanka
NepalCambodiaMyanmarMongoliaLao PDR
QatarBahrain
FijiUAE
BruneiKuwait
Saudi Arabia
Figure 5: Country Contributions to Asian Economic Growth, 1970–1980, 1980–1990, 1990–2000, and 2000–2008—Contribution share to the growth of gross regional products (growth rate of Asia29=100)
Sources: Official national accounts in each country, including our adjustments.
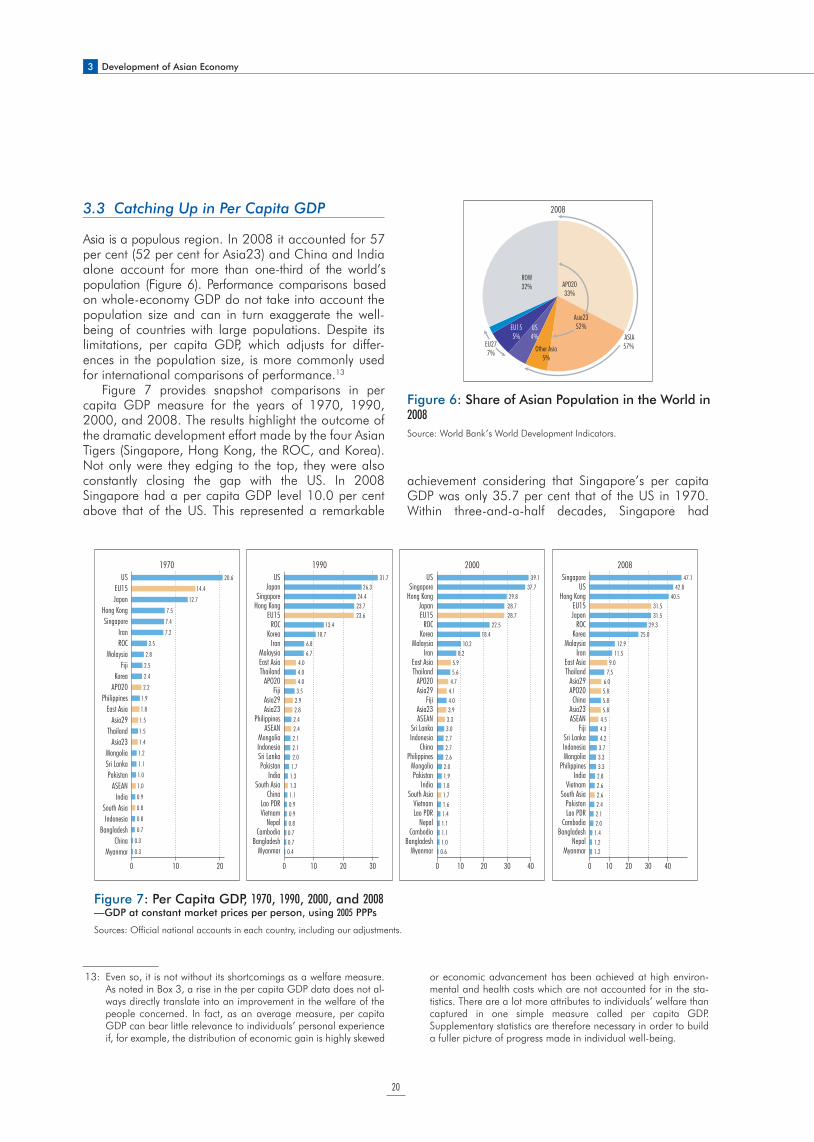
3 Development of Asian Economy
20
3.3 Catching Up in Per Capita GDP
Asia is a populous region. In 2008 it accounted for 57 per cent (52 per cent for Asia23) and China and India alone account for more than one-third of the world’s population (Figure 6). Performance comparisons based on whole-economy GDP do not take into account the population size and can in turn exaggerate the well-being of countries with large populations. Despite its limitations, per capita GDP, which adjusts for differ-ences in the population size, is more commonly used for international comparisons of performance.13
Figure 7 provides snapshot comparisons in per capita GDP measure for the years of 1970, 1990, 2000, and 2008. The results highlight the outcome of the dramatic development effort made by the four Asian Tigers (Singapore, Hong Kong, the ROC, and Korea). Not only were they edging to the top, they were also constantly closing the gap with the US. In 2008 Singapore had a per capita GDP level 10.0 per cent above that of the US. This represented a remarkable
achievement considering that Singapore’s per capita GDP was only 35.7 per cent that of the US in 1970. Within three-and-a-half decades, Singapore had
0.3
0.3
0.7
0.8
0.8
0.9
1.0
1.0
1.1
1.2
1.4
1.5
1.5
1.8
1.9
2.2
2.4
2.5
2.8
3.5
7.2
7.4
7.5
12.7
14.4
20.6
0 10 20
SingaporeUS
Hong KongEU15Japan
ROCKorea
MalaysiaIran
East AsiaThailand
Asia29APO20China
Asia23ASEAN
FijiSri LankaIndonesiaMongolia
PhilippinesIndia
VietnamSouth Asia
PakistanLao PDR
CambodiaBangladesh
NepalMyanmar
1970
2010 30
0.40.70.70.80.90.91.11.31.31.72.02.12.12.42.42.82.93.54.04.04.0
6.76.8
10.713.4
23.623.724.4
26.331.7
0
1990
0.61.01.11.11.41.61.71.81.92.02.62.72.73.03.33.94.04.14.75.65.9
8.210.2
18.422.5
28.728.729.8
37.739.1
0 10 20 30
2000 2008
1.21.21.42.02.12.42.62.62.83.33.33.74.24.34.55.85.85.86.0
7.59.0
11.5 12.9
25.029.3
31.531.5
40.542.8
47.1
0 20 301040 40
USEU15Japan
Hong KongSingapore
IranROC
MalaysiaFiji
KoreaAPO20
PhilippinesEast Asia
Asia29Thailand
Asia23MongoliaSri LankaPakistan
ASEANIndia
South AsiaIndonesia
BangladeshChina
Myanmar
USJapan
SingaporeHong Kong
EU15ROC
KoreaIran
MalaysiaEast AsiaThailand
APO20Fiji
Asia29Asia23
PhilippinesASEAN
MongoliaIndonesiaSri LankaPakistan
IndiaSouth Asia
ChinaLao PDRVietnam
NepalCambodia
BangladeshMyanmar
USSingapore
Hong KongJapanEU15
ROCKorea
MalaysiaIran
East AsiaThailand
APO20Asia29
FijiAsia23ASEAN
Sri LankaIndonesia
ChinaPhilippines
MongoliaPakistan
IndiaSouth Asia
VietnamLao PDR
NepalCambodia
BangladeshMyanmar
Figure 7: Per Capita GDP, 1970, 1990, 2000, and 2008—GDP at constant market prices per person, using 2005 PPPs
Sources: Official national accounts in each country, including our adjustments.
APO2033%
EU277%
ROW32%
2008
Other Asia5%
US4%
EU155%
Asia2352%
ASIA57%
Figure 6: Share of Asian Population in the World in 2008
Source: World Bank’s World Development Indicators.
13: Even so, it is not without its shortcomings as a welfare measure. As noted in Box 3, a rise in the per capita GDP data does not al-ways directly translate into an improvement in the welfare of the people concerned. In fact, as an average measure, per capita GDP can bear little relevance to individuals’ personal experience if, for example, the distribution of economic gain is highly skewed
or economic advancement has been achieved at high environ-mental and health costs which are not accounted for in the sta-tistics. There are a lot more attributes to individuals’ welfare than captured in one simple measure called per capita GDP. Supplementary statistics are therefore necessary in order to build a fuller picture of progress made in individual well-being.
21
GGDP is a measure of production, but it is often taken as a measure of welfare. The strong appeal of GDP stems from it being a single head-
line figure constructed on a more-or-less consistent basis of the System of National Accounts (SNA), allowing simple comparisons of socio-economic performance over time or across countries.
However, the SNA makes no claim that GDP is a welfare measure. Indeed the SNA highlights its several conventions that argue against the welfare interpretation of the accounts (para.1.75, United Nations, 2009). Among other things, the SNA acknowledges that the accounts do not capture welfare-reducing environmental externalities caused by some productive activities, and notes that major natural disasters (i.e. welfare-reducing external events) can be reflected as an increase in GDP if the need to repair the damage in their aftermath induces extra productive activities. Furthermore, welfare is not determined by economic factors alone but is necessarily a multi-faceted concept. While the basic structure of the SNA can be extended, by means of satellite accounts, to address some of the omissions, e.g. the environmental accounts and the household accounts, it is more difficult to envisage that other more subjective welfare parameters, such as health and satisfaction, can be meaningfully incorporated into a system designed primarily to facilitate economic analysis.
National accounts data used in this report are in compliance with the 1993 SNA for most countries. However, the 1993 SNA has become increasingly inadequate even in what it was designed to measure. It has fallen behind the rapidly changing economic environment in many countries, and has not taken advantage of the recent advancement in methodology research in measuring some of the more difficult compo-nents of the accounts. New aspects of economies have come into prominence, and in turn shifted the focus of analytical attention. To meet the arising needs of data users, an overhaul of the 1993 SNA has been carried out and the result of this effort is the 2008 SNA.
As economies evolve rapidly, the accuracy of GDP (under the 1993 SNA) in measuring growth has been compromised. More specifically, the 1993 SNA does not adequately capture “the new economy” – a term coined in the late 1990s to collectively refer to the new, high-growth industries which were on the cutting edge of knowledge and technology, such as the internet and the increasingly powerful computers. This failure stems from its coverage and the system’s insensitivity to quality changes.
To address these shortcomings, the 2008 SNA expands coverage by updating recommendations regarding the financial sector to reflect one of the fastest-changing segments of many economies. In particular, it provides a more comprehensive overview of financial services, expanding the financial assets boundary and introducing some new functional classifications. The 2008 SNA also recommends that producer unit undertaking ancillary activities to be recognized as a separate estab-lishment in certain cases, as opposed to be always regarded as an integral part of the establishments it served in the 1993 SNA. This mainly affects large establishments which engage in a large diversity of production, and will give rise to more homogeneous institutional units. As the
SNA defines industries in terms of establishments, this amendment will lead to a clearer demarcation of indus-tries, and in turn facilitate analyses of production, in which the technology of production plays an important role.
Furthermore, to better represent the knowledge economy, the 2008 SNA recommends that a separate establishment should be distinguished for research and development when possible, and that databases to be included in the asset category of computer software. The chapter concerning prices and volumes has also been significantly updated to reflect the latest methodological developments in the area, including the measurement of changes in quality over time. As quality change is an increasing feature of product markets, appropriate quality adjustment procedures have become all the more important in accurately measuring volume changes. For compiling volume indices of non-market services, prices of which are not available, the 2008 SNA recommends the direct “output volume method”, based on quantity indicators, adequately quality-adjusted, and weighted together using average cost weights. On the input side, the 2008 SNA recommends that estimates of capital services be compiled in a supplementary table, which will greatly facilitate, among other things, productivity analysis. Methods for compiling real income (see Chapter 7 in this report) have also been included in the 2008 SNA.
When implemented, the 2008 SNA should make a significant improvement in the accounts to track eco- nomic growth and developments more accurately, and to offer a wealth of data for analysing modern-day economies. Discussion of the broader welfare dimen-sions and indicators that falls outside the SNA can be found in Stiglitz, Sen, and Fitoussi (2009), covering the notions of quality of life and sustainability.
At the core of the concept of sustainability is a set of wealth accounts which go beyond the SNA to include natural capital, produced capital, intangible capital (i.e. human capital and institutional capital). Measuring and managing natural capital systematically is of particular pertinence to the oil-rich West Asian countries covered in this report. The World Bank (2011) presents a set of “wealth accounts” for over 150 countries for 1995, 2000, and 2005 to assess long term global, regional and country performance in building wealth. Their findings confirm expectations that developing countries differ sharply from developed countries in where their wealth is based. In 2005 natural capital (forests, farmland, energy, and minerals) accounted for 20–35 per cent of total wealth in the low-income group, compared with only 2 per cent in the high income OECD countries. The share of natural capital exceeded that of produced capital (13 per cent) in the low-income group. “Intangible” capital was the largest component across all country groups, accounting 57 per cent of total wealth in low income group and 81 per cent in the high income group. Growth in intangible capital accounted for nearly 100 per cent of the increase in wealth in Sub-Saharan Africa, Eastern Europe, and Central Asia. This share was 80 per cent in South Asia and 72 per cent in Latin America and Caribbean.
A strong message emerged from the World Bank report is that development is about leveraging natural capital for growth. The challenge is how a developing
Box 3 Limitations of GDP as a Welfare Measure
Box 3 Limitations of GDP as a Welfare Measure
continued on next page >

3 Development of Asian Economy
22
overtaken the US per capita GDP level by 2004.14 Hong Kong follows close behind, at 94.7 per cent of the US level. Japan’s per capita GDP level, at 73.6 per cent of the US level or around two-thirds of the group leader, Singapore, is similar to that of EU15. The ROC and Korea trail close behind at 68.6 per cent and 58.4 per cent of the US level, respectively.
The relative perfor-mance of China and India, the two most populous countries in the world, is pulled down on this measure due to their population size, with their per capita GDP at 13.5 per cent and 6.4 per cent that of the US in 2008, respectively. Even so, this should not tarnish their remarkable progress made over the past de- cades, especially China, whose per capita GDP was only 1.7 per cent that of the US in 1970. The per capita GDP level of Asia23 is 13.5 per cent that of the US. Thus the income gap between the US and the majority of Asian countries is
1970 (%) 1990 (%) 2000 (%) 2007 (%) 2008 (%)
Japan 12.7 100.0 Japan 26.3 100.0 Singapore 37.7 100.0 Singapore 48.6 100.0 Singapore 47.1 100.0
Hong Kong 7.5 59.1 Singapore 24.4 92.9 Hong Kong 29.8 79.1 Hong Kong 40.0 82.2 Hong Kong 40.5 86.1
Singapore 7.4 57.8 Hong Kong 23.7 90.3 Japan 28.7 76.3 Japan 31.8 65.4 Japan 31.5 66.9
Iran 7.2 56.6 ROC 13.4 51.2 ROC 22.5 59.6 ROC 29.2 60.1 ROC 29.3 62.3
ROC 3.5 27.7 Korea 10.7 40.7 Korea 18.4 48.8 Korea 24.5 50.4 Korea 25.0 53.1
Malaysia 2.8 22.0 Iran 6.8 25.9 Malaysia 10.2 27.1 Malaysia 12.6 25.8 Malaysia 12.9 27.4
Fiji 2.5 19.4 Malaysia 6.7 25.3 Iran 8.2 21.7 Iran 11.3 23.2 Iran 11.5 24.5
Korea 2.4 18.7 Thailand 4.0 15.1 Thailand 5.6 14.9 Thailand 7.4 15.2 Thailand 7.5 16.0
Philippines 1.9 14.9 Fiji 3.5 13.5 Fiji 4.0 10.7 China 5.3 10.9 China 5.8 12.3
Thailand 1.5 11.7 Philippines 2.4 9.3 Sri Lanka 3.0 8.0 Fiji 4.3 8.8 Fiji 4.3 9.1
Mongolia 1.2 9.2 Mongolia 2.1 8.2 Indonesia 2.7 7.2 Sri Lanka 4.0 8.3 Sri Lanka 4.2 9.0
Sri Lanka 1.1 8.8 Indonesia 2.1 7.9 China 2.7 7.1 Indonesia 3.5 7.3 Indonesia 3.7 7.9
Pakistan 1.0 8.0 Sri Lanka 2.0 7.6 Philippines 2.6 7.0 Philippines 3.2 6.6 Mongolia 3.3 7.0
India 0.8 6.7 Pakistan 1.7 6.4 Mongolia 2.0 5.4 Mongolia 3.1 6.3 Philippines 3.3 6.9
Indonesia 0.8 6.1 India 1.3 4.8 Pakistan 1.9 5.2 India 2.7 5.5 India 2.8 5.9
Bangladesh 0.7 5.8 China 1.1 4.2 India 1.8 4.7 Vietnam 2.5 5.1 Vietnam 2.6 5.6
China 0.3 2.7 Lao PDR 0.9 3.6 Vietnam 1.6 4.3 Pakistan 2.4 5.0 Pakistan 2.4 5.2
Myanmar 0.3 2.5 Vietnam 0.9 3.5 Lao PDR 1.4 3.7 Lao PDR 2.0 4.0 Lao PDR 2.1 4.4
Nepal 0.8 3.2 Nepal 1.1 2.9 Cambodia 1.9 3.9 Cambodia 2.0 4.2
Cambodia 0.7 2.8 Cambodia 1.1 2.9 Bangladesh 1.3 2.8 Bangladesh 1.4 3.0
Bangladesh 0.7 2.7 Bangladesh 1.0 2.7 Nepal 1.2 2.5 Nepal 1.2 2.6
Myanmar 0.4 1.4 Myanmar 0.6 1.5 Myanmar 1.2 2.5 Myanmar 1.2 2.6
Bahrain 18.8 148.1 Bahrain 19.4 74.0 Bahrain 23.9 63.6 Bahrain 31.4 64.7 Bahrain 32.7 69.5
Kuwait 97.6 767.1 Kuwait 21.0 80.0 Kuwait 35.9 95.3 Kuwait 45.5 93.5 Kuwait 47.5 100.8
Oman 6.1 48.2 Oman 15.4 58.7 Oman 18.4 48.9 Oman 21.4 44.0 Oman 23.7 50.3
Qatar 90.0 707.0 Qatar 40.8 155.3 Qatar 62.2 165.2 Qatar 64.4 132.5 Qatar 66.6 141.5
Saudi Arabia 21.8 171.6 Saudi Arabia 34.5 131.3 Saudi Arabia 19.9 52.9 Saudi Arabia 22.2 45.7 Saudi Arabia 22.8 48.5
UAE 19.7 154.8 UAE 86.0 327.7 UAE 50.8 134.9 UAE 55.0 113.1 UAE 55.7 118.3
Brunei 52.5 412.7 Brunei 86.1 328.1 Brunei 48.0 127.5 Brunei 48.7 100.1 Brunei 46.9 99.8
(regrouped) (regrouped) (regrouped) (regrouped) (regrouped)
APO20 2.2 17.7 APO20 4.0 15.1 APO20 4.7 12.5 APO20 5.8 11.9 APO20 5.8 12.4
Asia23 1.4 11.2 Asia23 2.8 10.7 Asia23 3.9 10.3 Asia23 5.5 11.4 Asia23 5.8 12.2
Asia29 1.5 12.1 Asia29 2.9 11.2 Asia29 4.1 10.8 Asia29 5.8 11.9 Asia29 6.0 12.8
East Asia 1.8 14.1 East Asia 4.0 15.3 East Asia 5.9 15.5 East Asia 8.6 17.7 East Asia 9.0 19.2
South Asia 0.8 6.6 South Asia 1.3 4.8 South Asia 1.7 4.5 South Asia 2.5 5.1 South Asia 2.6 5.5
ASEAN 1.0 7.7 ASEAN 2.4 9.0 ASEAN 3.3 8.7 ASEAN 4.4 9.0 ASEAN 4.5 9.5
GCC 28.4 223.1 GCC 22.0 83.9 GCC 25.1 66.7 GCC 29.5 60.7 GCC 30.7 65.2
(reference) (reference) (reference) (reference) (reference)
US 20.6 161.9 US 31.7 120.9 US 39.1 103.9 US 43.2 88.9 US 42.8 90.9
EU15 14.4 113.6 EU15 23.6 89.8 EU15 28.7 76.2 EU15 31.6 65.1 EU15 31.5 67.0
Unit: US dollar at constant market prices, using 2005 PPPs.Note: See Box 2 for the adjustments made to harmonize GDP coverage across countries.Sources: Official national accounts in each country, including our adjustments.
Table 4: Cross-country Comparisons of Per Capita GDP, 1970, 1990, 2000, 2007, and 2008—GDP at constant market prices per person, using 2005 PPPs
country transforms non-renewable capital into other assets. This requires not only efficient extraction of resources but also sound institutional capital for recov-ering the resource rent and making sure it is channeled into long-term growth through careful investment. Botswana was highlighted as the flagship country in this
respect. In contrast, Middle East and North Africa accumulated least additional wealth of all regions during the period of 1995!2005. This might suggest that they are not meeting their long-term development challenge especially if they are currently enjoying high GDP growth.
> continued from previous page
14: Singapore’s population comprises not only Singapore citizens but also non-citizens who have been granted permanent resi-dence in Singapore as well as non-permanent residents such as employment pass holders, work permit holders, and student pass holders. It is known that many workers and students commute to
Singapore from outside the country every day. According to the most recent census, in 2000 the share of Singapore citizens with respect to total population was 74 per cent, the share of perma-nent residents who are not Singapore citizens was 7 per cent, and the share of non-permanent residents was 19 per cent.
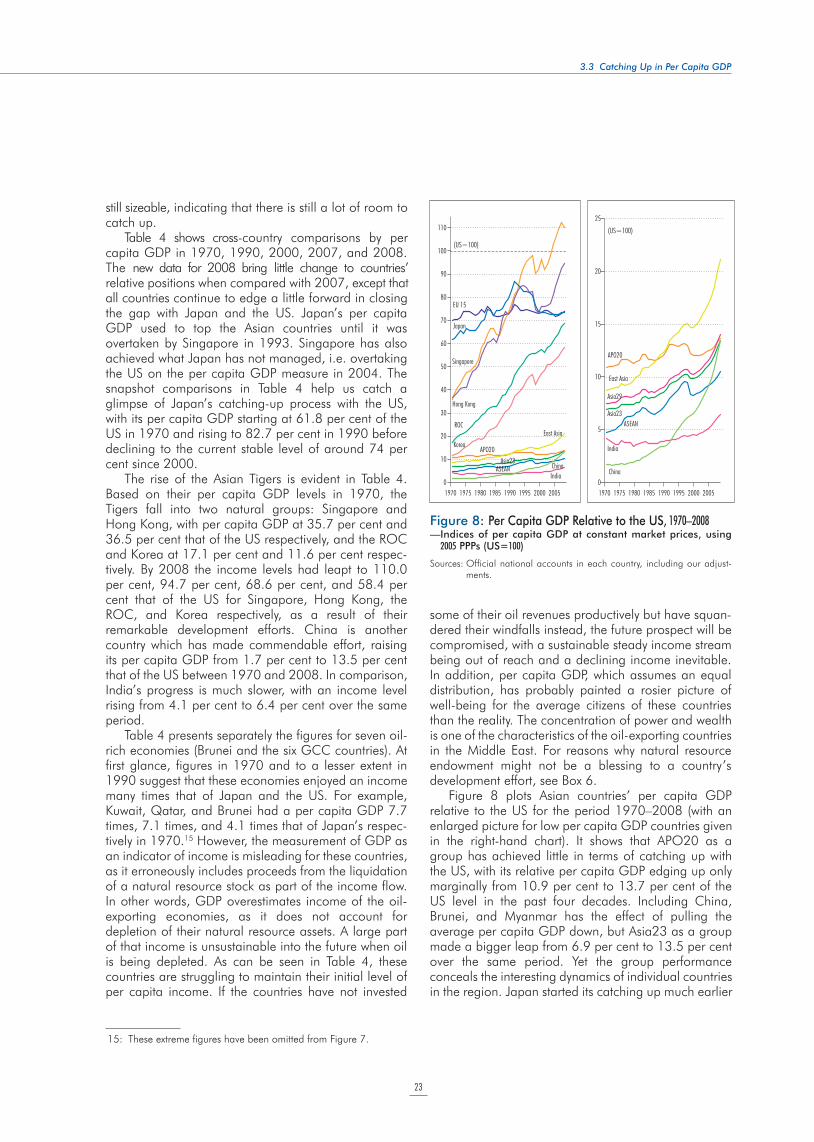
23
3.3 Catching Up in Per Capita GDP
still sizeable, indicating that there is still a lot of room to catch up.
Table 4 shows cross-country comparisons by per capita GDP in 1970, 1990, 2000, 2007, and 2008. The new data for 2008 bring little change to countries’ relative positions when compared with 2007, except that all countries continue to edge a little forward in closing the gap with Japan and the US. Japan’s per capita GDP used to top the Asian countries until it was overtaken by Singapore in 1993. Singapore has also achieved what Japan has not managed, i.e. overtaking the US on the per capita GDP measure in 2004. The snapshot comparisons in Table 4 help us catch a glimpse of Japan’s catching-up process with the US, with its per capita GDP starting at 61.8 per cent of the US in 1970 and rising to 82.7 per cent in 1990 before declining to the current stable level of around 74 per cent since 2000.
The rise of the Asian Tigers is evident in Table 4. Based on their per capita GDP levels in 1970, the Tigers fall into two natural groups: Singapore and Hong Kong, with per capita GDP at 35.7 per cent and 36.5 per cent that of the US respectively, and the ROC and Korea at 17.1 per cent and 11.6 per cent respec-tively. By 2008 the income levels had leapt to 110.0 per cent, 94.7 per cent, 68.6 per cent, and 58.4 per cent that of the US for Singapore, Hong Kong, the ROC, and Korea respectively, as a result of their remarkable development efforts. China is another country which has made commendable effort, raising its per capita GDP from 1.7 per cent to 13.5 per cent that of the US between 1970 and 2008. In comparison, India’s progress is much slower, with an income level rising from 4.1 per cent to 6.4 per cent over the same period.
Table 4 presents separately the figures for seven oil-rich economies (Brunei and the six GCC countries). At first glance, figures in 1970 and to a lesser extent in 1990 suggest that these economies enjoyed an income many times that of Japan and the US. For example, Kuwait, Qatar, and Brunei had a per capita GDP 7.7 times, 7.1 times, and 4.1 times that of Japan’s respec-tively in 1970.15 However, the measurement of GDP as an indicator of income is misleading for these countries, as it erroneously includes proceeds from the liquidation of a natural resource stock as part of the income flow. In other words, GDP overestimates income of the oil-exporting economies, as it does not account for depletion of their natural resource assets. A large part of that income is unsustainable into the future when oil is being depleted. As can be seen in Table 4, these countries are struggling to maintain their initial level of per capita income. If the countries have not invested
some of their oil revenues productively but have squan-dered their windfalls instead, the future prospect will be compromised, with a sustainable steady income stream being out of reach and a declining income inevitable. In addition, per capita GDP, which assumes an equal distribution, has probably painted a rosier picture of well-being for the average citizens of these countries than the reality. The concentration of power and wealth is one of the characteristics of the oil-exporting countries in the Middle East. For reasons why natural resource endowment might not be a blessing to a country’s development effort, see Box 6.
Figure 8 plots Asian countries’ per capita GDP relative to the US for the period 1970–2008 (with an enlarged picture for low per capita GDP countries given in the right-hand chart). It shows that APO20 as a group has achieved little in terms of catching up with the US, with its relative per capita GDP edging up only marginally from 10.9 per cent to 13.7 per cent of the US level in the past four decades. Including China, Brunei, and Myanmar has the effect of pulling the average per capita GDP down, but Asia23 as a group made a bigger leap from 6.9 per cent to 13.5 per cent over the same period. Yet the group performance conceals the interesting dynamics of individual countries in the region. Japan started its catching up much earlier
110
100
90
80
70
60
50
40
30
20
10
01970 1975 1980 1985 1990 1995 2000 2005
(US=100)
EU 15
Japan
Singapore
ROC
KoreaAPO20
India China
Hong Kong
Asia23ASEAN
East Asia
25
20
15
10
5
01970 1975 1980 1985 1990 1995 2000 2005
(US=100)
APO20
China
Asia23ASEAN
Asia29
East Asia
India
Figure 8: Per Capita GDP Relative to the US, 1970–2008— Indices of per capita GDP at constant market prices, using 2005 PPPs (US=100)
Sources: Official national accounts in each country, including our adjust-ments.
15: These extreme figures have been omitted from Figure 7.
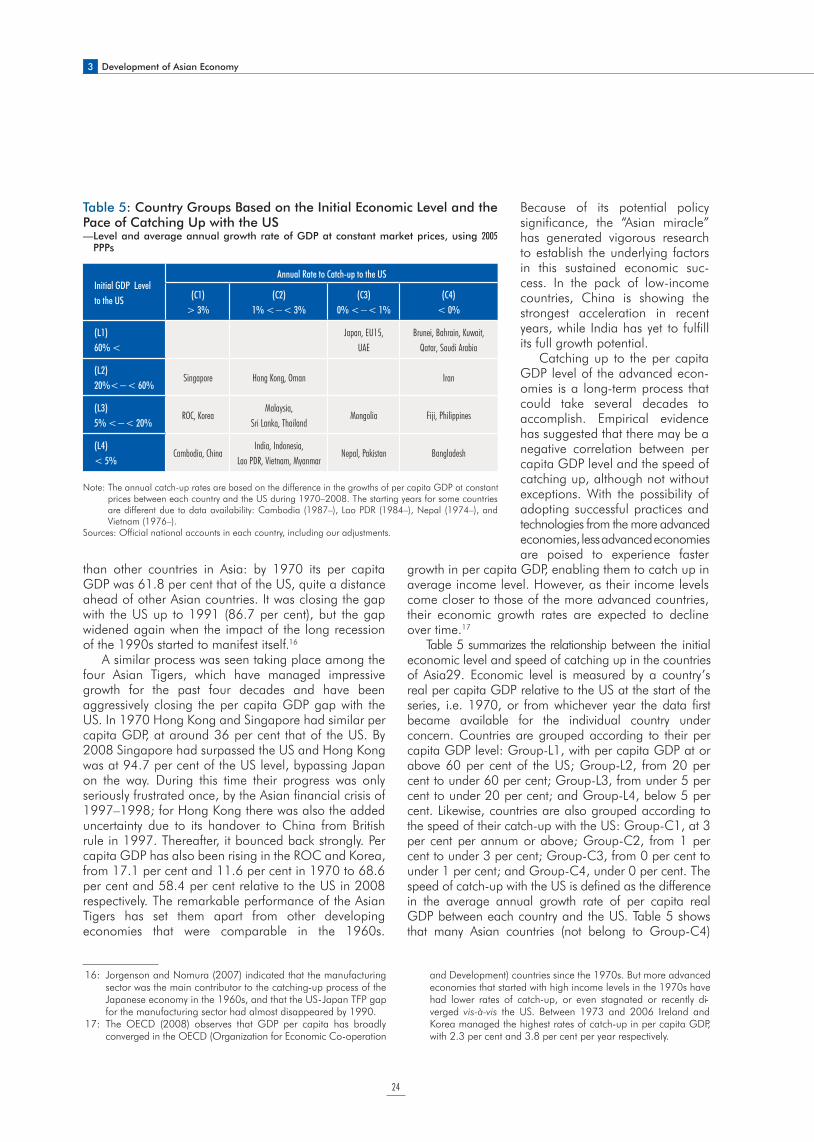
3 Development of Asian Economy
24
than other countries in Asia: by 1970 its per capita GDP was 61.8 per cent that of the US, quite a distance ahead of other Asian countries. It was closing the gap with the US up to 1991 (86.7 per cent), but the gap widened again when the impact of the long recession of the 1990s started to manifest itself.16
A similar process was seen taking place among the four Asian Tigers, which have managed impressive growth for the past four decades and have been aggressively closing the per capita GDP gap with the US. In 1970 Hong Kong and Singapore had similar per capita GDP, at around 36 per cent that of the US. By 2008 Singapore had surpassed the US and Hong Kong was at 94.7 per cent of the US level, bypassing Japan on the way. During this time their progress was only seriously frustrated once, by the Asian financial crisis of 1997–1998; for Hong Kong there was also the added uncertainty due to its handover to China from British rule in 1997. Thereafter, it bounced back strongly. Per capita GDP has also been rising in the ROC and Korea, from 17.1 per cent and 11.6 per cent in 1970 to 68.6 per cent and 58.4 per cent relative to the US in 2008 respectively. The remarkable performance of the Asian Tigers has set them apart from other developing economies that were comparable in the 1960s.
Because of its potential policy significance, the “Asian miracle” has generated vigorous research to establish the underlying factors in this sustained economic suc- cess. In the pack of low-income countries, China is showing the strongest acceleration in recent years, while India has yet to fulfill its full growth potential.
Catching up to the per capita GDP level of the advanced econ- omies is a long-term process that could take several decades to accomplish. Empirical evidence has suggested that there may be a negative correlation between per capita GDP level and the speed of catching up, although not without exceptions. With the possibility of adopting successful practices and technologies from the more advanced economies, less advanced economies are poised to experience faster
growth in per capita GDP, enabling them to catch up in average income level. However, as their income levels come closer to those of the more advanced countries, their economic growth rates are expected to decline over time.17
Table 5 summarizes the relationship between the initial economic level and speed of catching up in the countries of Asia29. Economic level is measured by a country’s real per capita GDP relative to the US at the start of the series, i.e. 1970, or from whichever year the data first became available for the individual country under concern. Countries are grouped according to their per capita GDP level: Group-L1, with per capita GDP at or above 60 per cent of the US; Group-L2, from 20 per cent to under 60 per cent; Group-L3, from under 5 per cent to under 20 per cent; and Group-L4, below 5 per cent. Likewise, countries are also grouped according to the speed of their catch-up with the US: Group-C1, at 3 per cent per annum or above; Group-C2, from 1 per cent to under 3 per cent; Group-C3, from 0 per cent to under 1 per cent; and Group-C4, under 0 per cent. The speed of catch-up with the US is defined as the difference in the average annual growth rate of per capita real GDP between each country and the US. Table 5 shows that many Asian countries (not belong to Group-C4)
Note: The annual catch-up rates are based on the difference in the growths of per capita GDP at constant prices between each country and the US during 1970–2008. The starting years for some countries are different due to data availability: Cambodia (1987–), Lao PDR (1984–), Nepal (1974–), and Vietnam (1976–).
Sources: Official national accounts in each country, including our adjustments.
Initial GDP Level
to the US
Annual Rate to Catch-up to the US
(C1)
> 3%
(C2)
1% <!< 3%
(C3)
0% <!< 1%
(C4)
< 0%
(L1)
60% <
Japan, EU15,
UAE
Brunei, Bahrain, Kuwait,
Qatar, Saudi Arabia
(L2)
20%<!< 60%Singapore Hong Kong, Oman Iran
(L3)
5% <!< 20%ROC, Korea
Malaysia,
Sri Lanka, ThailandMongolia Fiji, Philippines
(L4)
< 5%Cambodia, China
India, Indonesia,
Lao PDR, Vietnam, MyanmarNepal, Pakistan Bangladesh
Table 5: Country Groups Based on the Initial Economic Level and the Pace of Catching Up with the US— Level and average annual growth rate of GDP at constant market prices, using 2005
PPPs
16: Jorgenson and Nomura (2007) indicated that the manufacturing sector was the main contributor to the catching-up process of the Japanese economy in the 1960s, and that the US-Japan TFP gap for the manufacturing sector had almost disappeared by 1990.
17: The OECD (2008) observes that GDP per capita has broadly converged in the OECD (Organization for Economic Co-operation
and Development) countries since the 1970s. But more advanced economies that started with high income levels in the 1970s have had lower rates of catch-up, or even stagnated or recently di-verged vis-à-vis the US. Between 1973 and 2006 Ireland and Korea managed the highest rates of catch-up in per capita GDP, with 2.3 per cent and 3.8 per cent per year respectively.
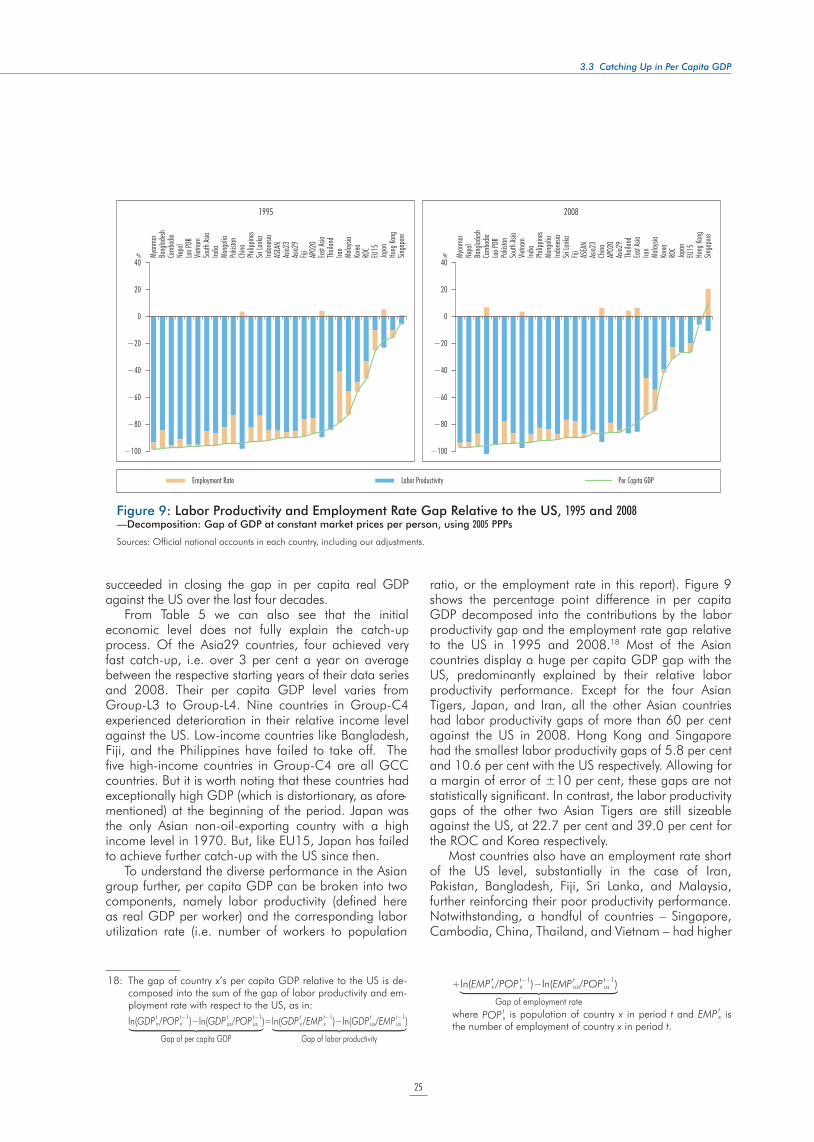
25
3.3 Catching Up in Per Capita GDP
Figure 9: Labor Productivity and Employment Rate Gap Relative to the US, 1995 and 2008—Decomposition: Gap of GDP at constant market prices per person, using 2005 PPPs
Sources: Official national accounts in each country, including our adjustments.
40
20
0
−20
−40
−60
−80
−100
1995 2008
Employment Rate Labor Productivity Per Capita GDP
Myan
mar
Bang
ladesh
Camb
odia
Nepa
lLa
o PDR
Vietna
mSo
uth As
iaInd
iaMo
ngoli
aPa
kistan
China
Philip
pines
Sri La
nka
Indon
esia
ASEA
NAsi
a23
Asia2
9Fij
iAP
O20
East
Asia
Thail
and
Iran
Malay
siaKo
reaRO
CEU
15Jap
anHo
ng Ko
ngSin
gapo
re
Myan
mar
Nepa
lBa
nglad
eshCa
mbod
iaLa
o PDR
Pakis
tanSo
uth As
iaVie
tnam
India
Philip
pines
Mong
olia
Indon
esia
Sri La
nka
Fiji
ASEA
NAsi
a23
China
APO2
0Asi
a29
Thail
and
East
Asia
Iran
Malay
siaKo
reaRO
CJap
anEU
15Ho
ng Ko
ngSin
gapo
re
%40
20
0
−20
−40
−60
−80
−100
%
succeeded in closing the gap in per capita real GDP against the US over the last four decades.
From Table 5 we can also see that the initial economic level does not fully explain the catch-up process. Of the Asia29 countries, four achieved very fast catch-up, i.e. over 3 per cent a year on average between the respective starting years of their data series and 2008. Their per capita GDP level varies from Group-L3 to Group-L4. Nine countries in Group-C4 experienced deterioration in their relative income level against the US. Low-income countries like Bangladesh, Fiji, and the Philippines have failed to take off. The five high-income countries in Group-C4 are all GCC countries. But it is worth noting that these countries had exceptionally high GDP (which is distortionary, as afore-mentioned) at the beginning of the period. Japan was the only Asian non-oil-exporting country with a high income level in 1970. But, like EU15, Japan has failed to achieve further catch-up with the US since then.
To understand the diverse performance in the Asian group further, per capita GDP can be broken into two components, namely labor productivity (defined here as real GDP per worker) and the corresponding labor utilization rate (i.e. number of workers to population
ratio, or the employment rate in this report). Figure 9 shows the percentage point difference in per capita GDP decomposed into the contributions by the labor productivity gap and the employment rate gap relative to the US in 1995 and 2008.18 Most of the Asian countries display a huge per capita GDP gap with the US, predominantly explained by their relative labor productivity performance. Except for the four Asian Tigers, Japan, and Iran, all the other Asian countries had labor productivity gaps of more than 60 per cent against the US in 2008. Hong Kong and Singapore had the smallest labor productivity gaps of 5.8 per cent and 10.6 per cent with the US respectively. Allowing for a margin of error of ±10 per cent, these gaps are not statistically significant. In contrast, the labor productivity gaps of the other two Asian Tigers are still sizeable against the US, at 22.7 per cent and 39.0 per cent for the ROC and Korea respectively.
Most countries also have an employment rate short of the US level, substantially in the case of Iran, Pakistan, Bangladesh, Fiji, Sri Lanka, and Malaysia, further reinforcing their poor productivity performance. Notwithstanding, a handful of countries – Singapore, Cambodia, China, Thailand, and Vietnam – had higher
18: The gap of country x’s per capita GDP relative to the US is de-composed into the sum of the gap of labor productivity and em-ployment rate with respect to the US, as in:
ln(GDP tx/POP t−1
x )−ln(GDP tus/POP t−1
us )=ln(GDP tx/EMP t−1
x )−ln(GDP tus/EMP t−1
us )+ln(EMP tx/POP t−1
x )−ln(EMP tus/POP t−1
us )
Gap of per capita GDP Gap of labor productivity Gap of employment rate
ln(GDP tx/POP t−1
x )−ln(GDP tus/POP t−1
us )=ln(GDP tx/EMP t−1
x )−ln(GDP tus/EMP t−1
us )+ln(EMP tx/POP t−1
x )−ln(EMP tus/POP t−1
us )
Gap of per capita GDP Gap of labor productivity Gap of employment rate where POP t
x is population of country x in period t and EMP tx is
the number of employment of country x in period t.
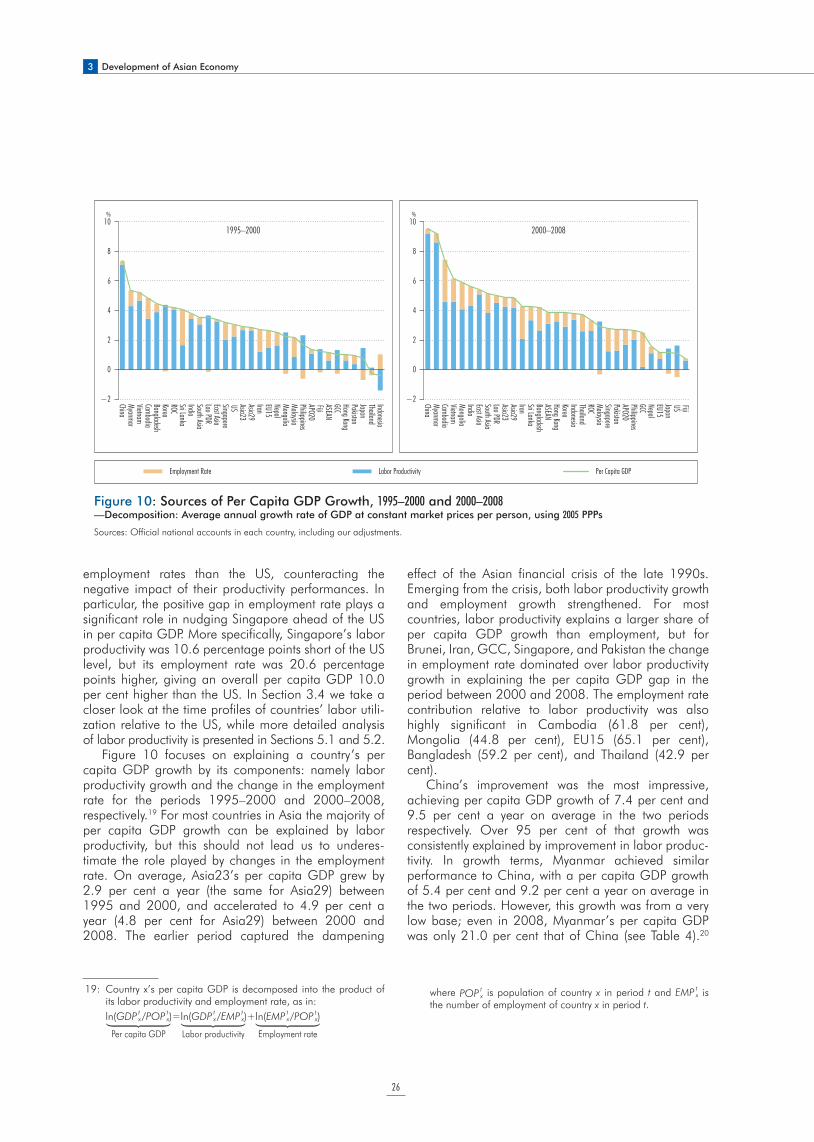
3 Development of Asian Economy
26
employment rates than the US, counteracting the negative impact of their productivity performances. In particular, the positive gap in employment rate plays a significant role in nudging Singapore ahead of the US in per capita GDP. More specifically, Singapore’s labor productivity was 10.6 percentage points short of the US level, but its employment rate was 20.6 percentage points higher, giving an overall per capita GDP 10.0 per cent higher than the US. In Section 3.4 we take a closer look at the time profiles of countries’ labor utili-zation relative to the US, while more detailed analysis of labor productivity is presented in Sections 5.1 and 5.2.
Figure 10 focuses on explaining a country’s per capita GDP growth by its components: namely labor productivity growth and the change in the employment rate for the periods 1995–2000 and 2000–2008, respectively.19 For most countries in Asia the majority of per capita GDP growth can be explained by labor productivity, but this should not lead us to underes-timate the role played by changes in the employment rate. On average, Asia23’s per capita GDP grew by 2.9 per cent a year (the same for Asia29) between 1995 and 2000, and accelerated to 4.9 per cent a year (4.8 per cent for Asia29) between 2000 and 2008. The earlier period captured the dampening
effect of the Asian financial crisis of the late 1990s. Emerging from the crisis, both labor productivity growth and employment growth strengthened. For most countries, labor productivity explains a larger share of per capita GDP growth than employment, but for Brunei, Iran, GCC, Singapore, and Pakistan the change in employment rate dominated over labor productivity growth in explaining the per capita GDP gap in the period between 2000 and 2008. The employment rate contribution relative to labor productivity was also highly significant in Cambodia (61.8 per cent), Mongolia (44.8 per cent), EU15 (65.1 per cent), Bangladesh (59.2 per cent), and Thailand (42.9 per cent).
China’s improvement was the most impressive, achieving per capita GDP growth of 7.4 per cent and 9.5 per cent a year on average in the two periods respectively. Over 95 per cent of that growth was consistently explained by improvement in labor produc-tivity. In growth terms, Myanmar achieved similar performance to China, with a per capita GDP growth of 5.4 per cent and 9.2 per cent a year on average in the two periods. However, this growth was from a very low base; even in 2008, Myanmar’s per capita GDP was only 21.0 per cent that of China (see Table 4).20
Figure 10: Sources of Per Capita GDP Growth, 1995–2000 and 2000–2008—Decomposition: Average annual growth rate of GDP at constant market prices per person, using 2005 PPPs
Sources: Official national accounts in each country, including our adjustments.
ChinaMyanmarVietnamCambodiaBangladeshKoreaROCSri LankaIndiaSouth AsiaLao PDREast AsiaSingaporeUS Asia23Asia29IranEU15NepalMongoliaMalaysiaPhilippinesAPO20FijiASEANGCCHong KongPakistanJapanThailandIndonesia
1995–200010
8
6
4
2
0
−2
%
ChinaMyanmarCambodiaVietnamMongoliaIndiaEast AsiaSouth AsiaLao PDRAsia23Asia29IranSri LankaBangladeshASEANHong KongKoreaIndonesiaThailandROCMalaysiaSingaporePakistanAPO20PhilippinesGCCNepalEU15JapanUS Fiji
2000–200810
8
6
4
2
0
−2
%
Employment Rate Labor Productivity Per Capita GDP
19: Country x’s per capita GDP is decomposed into the product of its labor productivity and employment rate, as in:
ln(GDP tx/POP t
x)=ln(GDP tx/EMP t
x)+ln(EMP tx/POP t
x)
Per capita GDP Labor productivity Employment rate
where POP tx is population of country x in period t and EMP t
x is the number of employment of country x in period t.
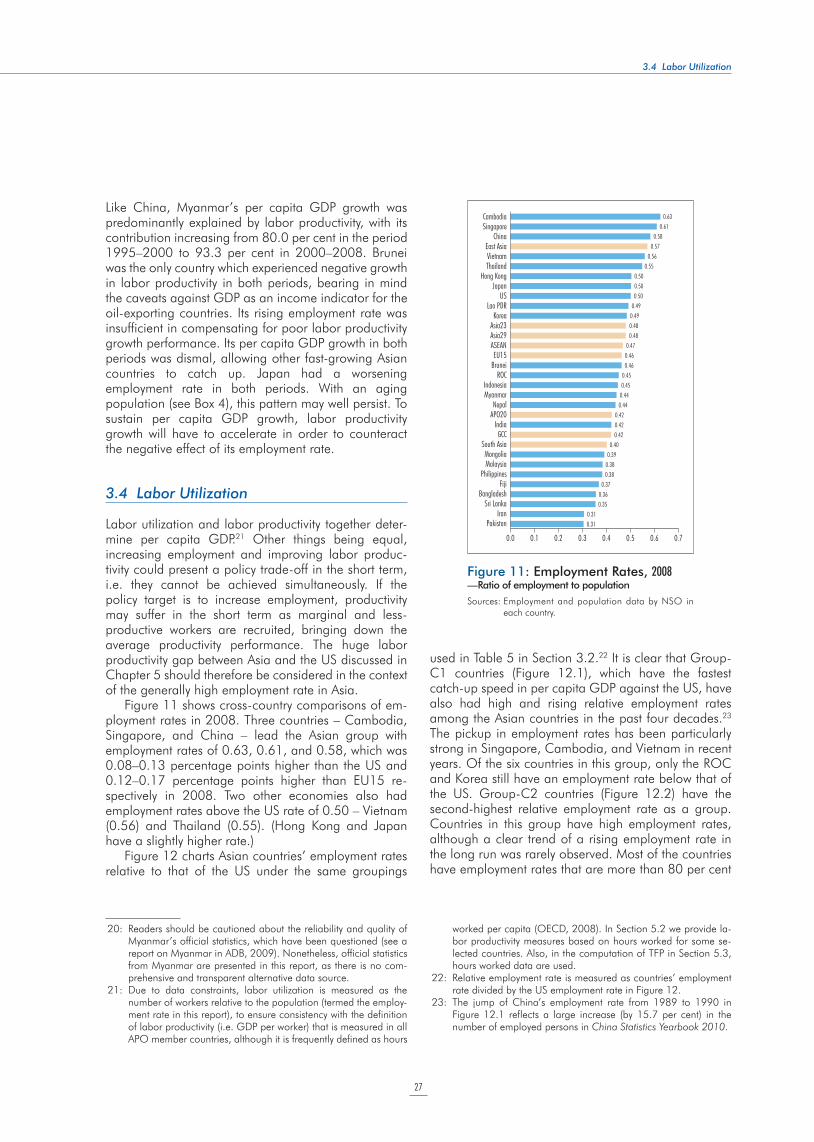
27
3.4 Labor Utilization
Like China, Myanmar’s per capita GDP growth was predominantly explained by labor productivity, with its contribution increasing from 80.0 per cent in the period 1995–2000 to 93.3 per cent in 2000–2008. Brunei was the only country which experienced negative growth in labor productivity in both periods, bearing in mind the caveats against GDP as an income indicator for the oil-exporting countries. Its rising employment rate was insufficient in compensating for poor labor productivity growth performance. Its per capita GDP growth in both periods was dismal, allowing other fast-growing Asian countries to catch up. Japan had a worsening employment rate in both periods. With an aging population (see Box 4), this pattern may well persist. To sustain per capita GDP growth, labor productivity growth will have to accelerate in order to counteract the negative effect of its employment rate.
3.4 Labor Utilization
Labor utilization and labor productivity together deter- mine per capita GDP.21 Other things being equal, increasing employment and improving labor produc-tivity could present a policy trade-off in the short term, i.e. they cannot be achieved simultaneously. If the policy target is to increase employment, productivity may suffer in the short term as marginal and less-productive workers are recruited, bringing down the average productivity performance. The huge labor productivity gap between Asia and the US discussed in Chapter 5 should therefore be considered in the context of the generally high employment rate in Asia.
Figure 11 shows cross-country comparisons of em- ployment rates in 2008. Three countries – Cambodia, Singapore, and China – lead the Asian group with employment rates of 0.63, 0.61, and 0.58, which was 0.08–0.13 percentage points higher than the US and 0.12–0.17 percentage points higher than EU15 re- spectively in 2008. Two other economies also had employment rates above the US rate of 0.50 – Vietnam (0.56) and Thailand (0.55). (Hong Kong and Japan have a slightly higher rate.)
Figure 12 charts Asian countries’ employment rates relative to that of the US under the same groupings
used in Table 5 in Section 3.2.22 It is clear that Group-C1 countries (Figure 12.1), which have the fastest catch-up speed in per capita GDP against the US, have also had high and rising relative employment rates among the Asian countries in the past four decades.23 The pickup in employment rates has been particularly strong in Singapore, Cambodia, and Vietnam in recent years. Of the six countries in this group, only the ROC and Korea still have an employment rate below that of the US. Group-C2 countries (Figure 12.2) have the second-highest relative employment rate as a group. Countries in this group have high employment rates, although a clear trend of a rising employment rate in the long run was rarely observed. Most of the countries have employment rates that are more than 80 per cent
0.310.31
0.350.36
0.370.380.380.390.40
0.420.420.42
0.440.440.450.45
0.460.460.47
0.480.480.490.490.500.500.50
0.550.56
0.570.58
0.610.63
0.0 0.1 0.2 0.3 0.4 0.5 0.6 0.7
CambodiaSingapore
ChinaEast AsiaVietnamThailand
Hong KongJapan
USLao PDR
KoreaAsia23Asia29ASEANEU15
BruneiROC
IndonesiaMyanmar
NepalAPO20
IndiaGCC
South AsiaMongoliaMalaysia
PhilippinesFiji
BangladeshSri Lanka
IranPakistan
Figure 11: Employment Rates, 2008—Ratio of employment to population
Sources: Employment and population data by NSO in each country.
20: Readers should be cautioned about the reliability and quality of Myanmar’s official statistics, which have been questioned (see a report on Myanmar in ADB, 2009). Nonetheless, official statistics from Myanmar are presented in this report, as there is no com-prehensive and transparent alternative data source.
21: Due to data constraints, labor utilization is measured as the number of workers relative to the population (termed the employ-ment rate in this report), to ensure consistency with the definition of labor productivity (i.e. GDP per worker) that is measured in all APO member countries, although it is frequently defined as hours
worked per capita (OECD, 2008). In Section 5.2 we provide la-bor productivity measures based on hours worked for some se-lected countries. Also, in the computation of TFP in Section 5.3, hours worked data are used.
22: Relative employment rate is measured as countries’ employment rate divided by the US employment rate in Figure 12.
23: The jump of China’s employment rate from 1989 to 1990 in Figure 12.1 reflects a large increase (by 15.7 per cent) in the number of employed persons in China Statistics Yearbook 2010.
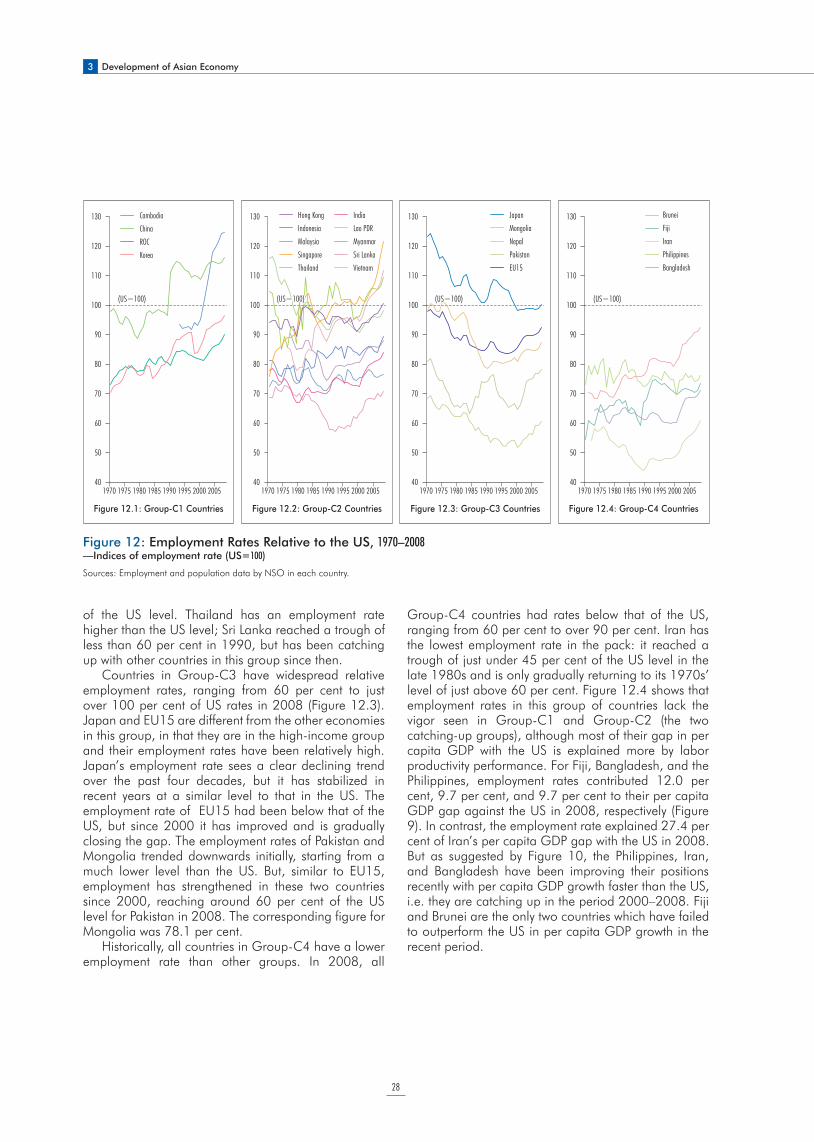
3 Development of Asian Economy
28
of the US level. Thailand has an employment rate higher than the US level; Sri Lanka reached a trough of less than 60 per cent in 1990, but has been catching up with other countries in this group since then.
Countries in Group-C3 have widespread relative employment rates, ranging from 60 per cent to just over 100 per cent of US rates in 2008 (Figure 12.3). Japan and EU15 are different from the other economies in this group, in that they are in the high-income group and their employment rates have been relatively high. Japan’s employment rate sees a clear declining trend over the past four decades, but it has stabilized in recent years at a similar level to that in the US. The employment rate of EU15 had been below that of the US, but since 2000 it has improved and is gradually closing the gap. The employment rates of Pakistan and Mongolia trended downwards initially, starting from a much lower level than the US. But, similar to EU15, employment has strengthened in these two countries since 2000, reaching around 60 per cent of the US level for Pakistan in 2008. The corresponding figure for Mongolia was 78.1 per cent.
Historically, all countries in Group-C4 have a lower employment rate than other groups. In 2008, all
Group-C4 countries had rates below that of the US, ranging from 60 per cent to over 90 per cent. Iran has the lowest employment rate in the pack: it reached a trough of just under 45 per cent of the US level in the late 1980s and is only gradually returning to its 1970s’ level of just above 60 per cent. Figure 12.4 shows that employment rates in this group of countries lack the vigor seen in Group-C1 and Group-C2 (the two catching-up groups), although most of their gap in per capita GDP with the US is explained more by labor productivity performance. For Fiji, Bangladesh, and the Philippines, employment rates contributed 12.0 per cent, 9.7 per cent, and 9.7 per cent to their per capita GDP gap against the US in 2008, respectively (Figure 9). In contrast, the employment rate explained 27.4 per cent of Iran’s per capita GDP gap with the US in 2008. But as suggested by Figure 10, the Philippines, Iran, and Bangladesh have been improving their positions recently with per capita GDP growth faster than the US, i.e. they are catching up in the period 2000–2008. Fiji and Brunei are the only two countries which have failed to outperform the US in per capita GDP growth in the recent period.
Figure 12: Employment Rates Relative to the US, 1970–2008—Indices of employment rate (US=100)
Sources: Employment and population data by NSO in each country.
130
120
110
100
90
80
70
60
50
401970 1975 1980 1985 1990 1995 2000 2005
(US=100)
CambodiaChinaROCKorea
130
120
110
100
90
80
70
60
50
401970 1975 1980 1985 1990 1995 2000 2005
130
120
110
100
90
80
70
60
50
401970 1975 1980 1985 1990 1995 2000 2005
(US=100)(US=100)
130
120
110
100
90
80
70
60
50
401970 1975 1980 1985 1990 1995 2000 2005
(US=100)
Hong Kong IndiaIndonesia Lao PDRMalaysia MyanmarSingapore Sri LankaThailand Vietnam
(US=100)(US=100)
JapanMongoliaNepalPakistanEU15
BruneiFijiIranPhilippinesBangladesh
Figure 12.1: Group-C1 Countries Figure 12.2: Group-C2 Countries Figure 12.3: Group-C3 Countries Figure 12.4: Group-C4 Countries
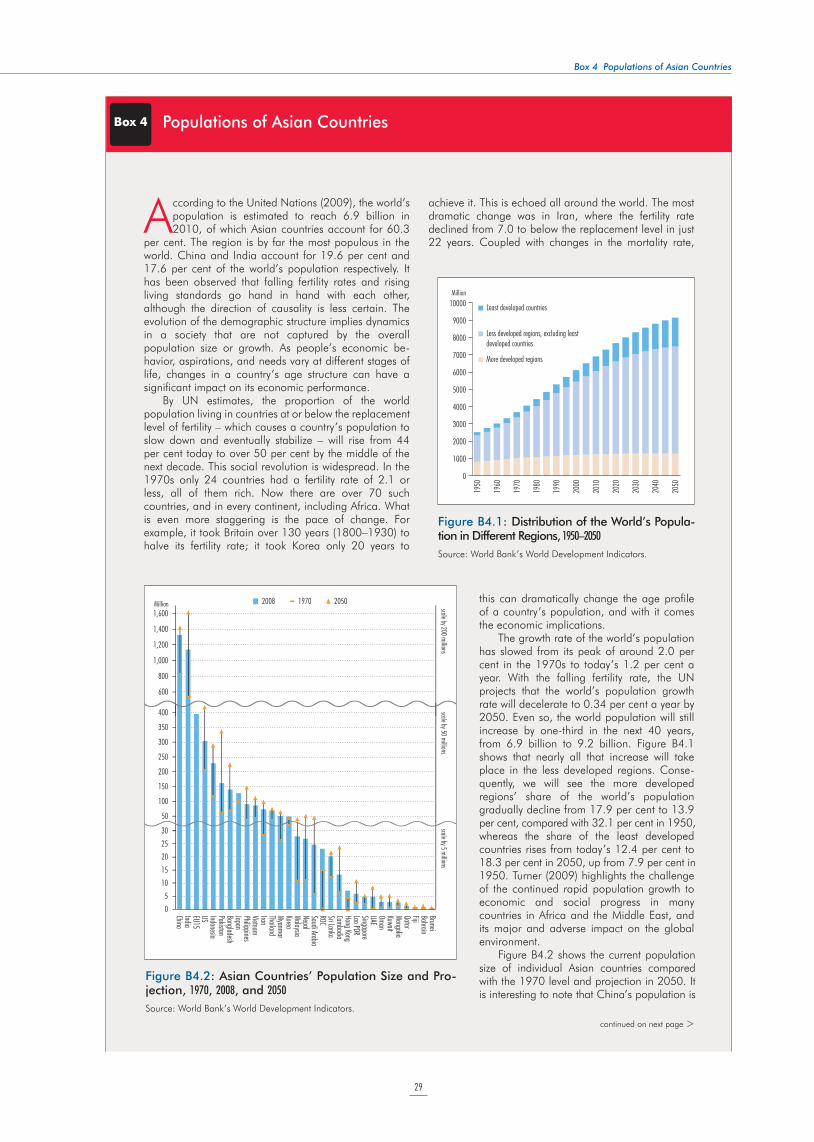
29
According to the United Nations (2009), the world’s population is estimated to reach 6.9 billion in 2010, of which Asian countries account for 60.3
per cent. The region is by far the most populous in the world. China and India account for 19.6 per cent and 17.6 per cent of the world’s population respectively. It has been observed that falling fertility rates and rising living standards go hand in hand with each other, although the direction of causality is less certain. The evolution of the demographic structure implies dynamics in a society that are not captured by the overall population size or growth. As people’s economic be- havior, aspirations, and needs vary at different stages of life, changes in a country’s age structure can have a significant impact on its economic performance.
By UN estimates, the proportion of the world population living in countries at or below the replacement level of fertility – which causes a country’s population to slow down and eventually stabilize – will rise from 44 per cent today to over 50 per cent by the middle of the next decade. This social revolution is widespread. In the 1970s only 24 countries had a fertility rate of 2.1 or less, all of them rich. Now there are over 70 such countries, and in every continent, including Africa. What is even more staggering is the pace of change. For example, it took Britain over 130 years (1800–1930) to halve its fertility rate; it took Korea only 20 years to
achieve it. This is echoed all around the world. The most dramatic change was in Iran, where the fertility rate declined from 7.0 to below the replacement level in just 22 years. Coupled with changes in the mortality rate,
this can dramatically change the age profile of a country’s population, and with it comes the economic implications.
The growth rate of the world’s population has slowed from its peak of around 2.0 per cent in the 1970s to today’s 1.2 per cent a year. With the falling fertility rate, the UN projects that the world’s population growth rate will decelerate to 0.34 per cent a year by 2050. Even so, the world population will still increase by one-third in the next 40 years, from 6.9 billion to 9.2 billion. Figure B4.1 shows that nearly all that increase will take place in the less developed regions. Conse-quently, we will see the more developed regions’ share of the world’s population gradually decline from 17.9 per cent to 13.9 per cent, compared with 32.1 per cent in 1950, whereas the share of the least developed countries rises from today’s 12.4 per cent to 18.3 per cent in 2050, up from 7.9 per cent in 1950. Turner (2009) highlights the challenge of the continued rapid population growth to economic and social progress in many countries in Africa and the Middle East, and its major and adverse impact on the global environment.
Figure B4.2 shows the current population size of individual Asian countries compared with the 1970 level and projection in 2050. It is interesting to note that China’s population is
continued on next page >
Box 4 Populations of Asian Countries
10000
9000
8000
7000
6000
5000
4000
3000
2000
1000
0
Least developed countries
Less developed regions, excluding least developed countries
2050
1950
1960
1970
1980
1990
2000
2010
2020
2030
2040
More developed regions
Million
Figure B4.1: Distribution of the World’s Popula-tion in Different Regions, 1950–2050
Source: World Bank’s World Development Indicators.
Box 4 Populations of Asian Countries
1,600
1,400
1,200
1,000
800
600
2008 1970 2050
400
350
300
250
200
150
100
50
3025201510
50
scale by 200 millionsscale by 50 millions
scale by 5 millionsBruneiBahrainFijiQatarMongoliaKuwaitOmanUAESingaporeLao PDRHong KongCambodiaSri LankaROCSaudi ArabiaNepalMalaysiaKoreaMyanmarThailandIranVietnamPhilippinesJapanBangladeshPakistanIndonesiaUSEU15IndiaChina
Million
Figure B4.2: Asian Countries’ Population Size and Pro- jection, 1970, 2008, and 2050
Source: World Bank’s World Development Indicators.
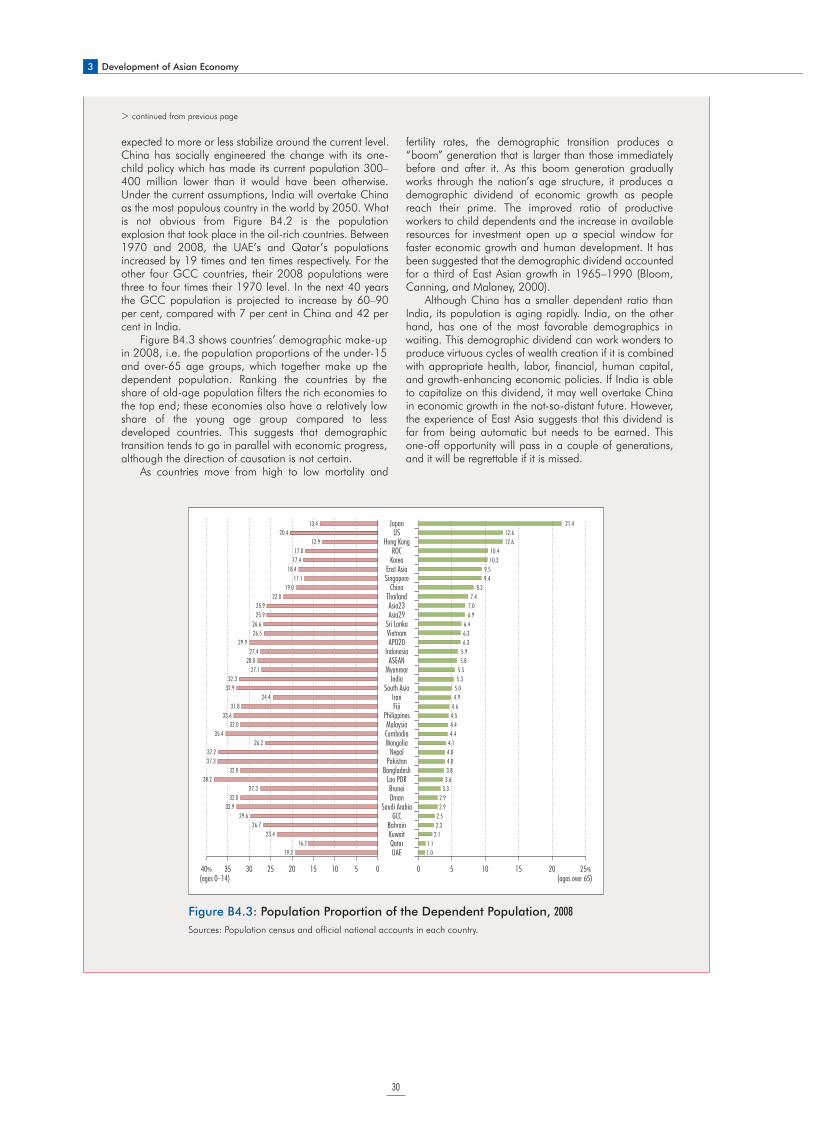
3 Development of Asian Economy
30
> continued from previous page
expected to more or less stabilize around the current level. China has socially engineered the change with its one-child policy which has made its current population 300–400 million lower than it would have been otherwise. Under the current assumptions, India will overtake China as the most populous country in the world by 2050. What is not obvious from Figure B4.2 is the population explosion that took place in the oil-rich countries. Between 1970 and 2008, the UAE’s and Qatar’s populations increased by 19 times and ten times respectively. For the other four GCC countries, their 2008 populations were three to four times their 1970 level. In the next 40 years the GCC population is projected to increase by 60–90 per cent, compared with 7 per cent in China and 42 per cent in India.
Figure B4.3 shows countries’ demographic make-up in 2008, i.e. the population proportions of the under-15 and over-65 age groups, which together make up the dependent population. Ranking the countries by the share of old-age population filters the rich economies to the top end; these economies also have a relatively low share of the young age group compared to less developed countries. This suggests that demographic transition tends to go in parallel with economic progress, although the direction of causation is not certain.
As countries move from high to low mortality and
fertility rates, the demographic transition produces a “boom” generation that is larger than those immediately before and after it. As this boom generation gradually works through the nation’s age structure, it produces a demographic dividend of economic growth as people reach their prime. The improved ratio of productive workers to child dependents and the increase in available resources for investment open up a special window for faster economic growth and human development. It has been suggested that the demographic dividend accounted for a third of East Asian growth in 1965–1990 (Bloom, Canning, and Malaney, 2000).
Although China has a smaller dependent ratio than India, its population is aging rapidly. India, on the other hand, has one of the most favorable demographics in waiting. This demographic dividend can work wonders to produce virtuous cycles of wealth creation if it is combined with appropriate health, labor, financial, human capital, and growth-enhancing economic policies. If India is able to capitalize on this dividend, it may well overtake China in economic growth in the not-so-distant future. However, the experience of East Asia suggests that this dividend is far from being automatic but needs to be earned. This one-off opportunity will pass in a couple of generations, and it will be regrettable if it is missed.
0510152025303540% 10 15 20 25%(ages 0−14)
0 5(ages over 65)
19.216.2
23.426.7
29.632.9
32.027.3
38.232.0
37.337.2
26.235.4
32.033.6
31.824.4
32.932.3
27.128.0
27.429.9
26.526.6
25.925.9
22.019.0
17.118.4
17.417.0
12.920.4
13.4
1.01.1
2.12.32.5
2.92.9
3.33.63.84.04.04.14.44.44.54.64.95.05.35.55.85.96.36.36.4
6.97.07.4
8.29.49.5
10.310.4
12.612.6
21.4JapanUS
Hong KongROC
KoreaEast AsiaSingapore
ChinaThailandAsia23Asia29
Sri LankaVietnamAPO20
IndonesiaASEAN
MyanmarIndia
South AsiaIranFiji
PhilippinesMalaysiaCambodiaMongolia
NepalPakistan
BangladeshLao PDRBruneiOman
Saudi ArabiaGCC
BahrainKuwaitQatarUAE
Figure B4.3: Population Proportion of the Dependent Population, 2008
Sources: Population census and official national accounts in each country.
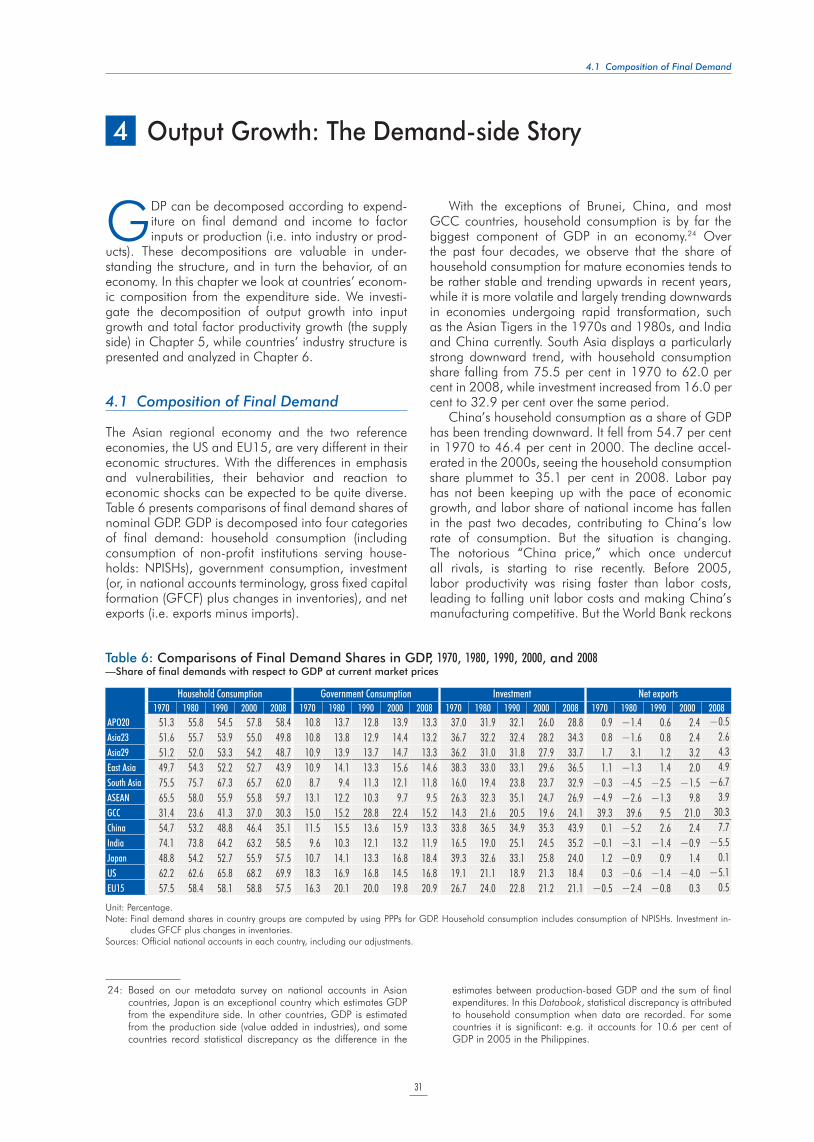
4.1 Composition of Final Demand
31
GDP can be decomposed according to expend- iture on final demand and income to factor inputs or production (i.e. into industry or prod-
ucts). These decompositions are valuable in under-standing the structure, and in turn the behavior, of an economy. In this chapter we look at countries’ econom-ic composition from the expenditure side. We investi-gate the decomposition of output growth into input growth and total factor productivity growth (the supply side) in Chapter 5, while countries’ industry structure is presented and analyzed in Chapter 6.
4.1 Composition of Final Demand
The Asian regional economy and the two reference economies, the US and EU15, are very different in their economic structures. With the differences in emphasis and vulnerabilities, their behavior and reaction to economic shocks can be expected to be quite diverse. Table 6 presents comparisons of final demand shares of nominal GDP. GDP is decomposed into four categories of final demand: household consumption (including consumption of non-profit institutions serving house-holds: NPISHs), government consumption, investment (or, in national accounts terminology, gross fixed capital formation (GFCF) plus changes in inventories), and net exports (i.e. exports minus imports).
With the exceptions of Brunei, China, and most GCC countries, household consumption is by far the biggest component of GDP in an economy.24 Over the past four decades, we observe that the share of household consumption for mature economies tends to be rather stable and trending upwards in recent years, while it is more volatile and largely trending downwards in economies undergoing rapid transformation, such as the Asian Tigers in the 1970s and 1980s, and India and China currently. South Asia displays a particularly strong downward trend, with household consumption share falling from 75.5 per cent in 1970 to 62.0 per cent in 2008, while investment increased from 16.0 per cent to 32.9 per cent over the same period.
China’s household consumption as a share of GDP has been trending downward. It fell from 54.7 per cent in 1970 to 46.4 per cent in 2000. The decline accel-erated in the 2000s, seeing the household consumption share plummet to 35.1 per cent in 2008. Labor pay has not been keeping up with the pace of economic growth, and labor share of national income has fallen in the past two decades, contributing to China’s low rate of consumption. But the situation is changing. The notorious “China price,” which once undercut all rivals, is starting to rise recently. Before 2005, labor productivity was rising faster than labor costs, leading to falling unit labor costs and making China’s manufacturing competitive. But the World Bank reckons
4 Output Growth: The Demand-side Story
24: Based on our metadata survey on national accounts in Asian countries, Japan is an exceptional country which estimates GDP from the expenditure side. In other countries, GDP is estimated from the production side (value added in industries), and some countries record statistical discrepancy as the difference in the
estimates between production-based GDP and the sum of final expenditures. In this Databook, statistical discrepancy is attributed to household consumption when data are recorded. For some countries it is significant: e.g. it accounts for 10.6 per cent of GDP in 2005 in the Philippines.
Household Consumption Government Consumption Investment Net exports
1970 1980 1990 2000 2008 1970 1980 1990 2000 2008 1970 1980 1990 2000 2008 1970 1980 1990 2000 2008
APO20 51.3 55.8 54.5 57.8 58.4 10.8 13.7 12.8 13.9 13.3 37.0 31.9 32.1 26.0 28.8 0.9 !1.4 0.6 2.4 !0.5
Asia23 51.6 55.7 53.9 55.0 49.8 10.8 13.8 12.9 14.4 13.2 36.7 32.2 32.4 28.2 34.3 0.8 !1.6 0.8 2.4 2.6
Asia29 51.2 52.0 53.3 54.2 48.7 10.9 13.9 13.7 14.7 13.3 36.2 31.0 31.8 27.9 33.7 1.7 3.1 1.2 3.2 4.3
East Asia 49.7 54.3 52.2 52.7 43.9 10.9 14.1 13.3 15.6 14.6 38.3 33.0 33.1 29.6 36.5 1.1 !1.3 1.4 2.0 4.9
South Asia 75.5 75.7 67.3 65.7 62.0 8.7 9.4 11.3 12.1 11.8 16.0 19.4 23.8 23.7 32.9 !0.3 !4.5 !2.5 !1.5 !6.7
ASEAN 65.5 58.0 55.9 55.8 59.7 13.1 12.2 10.3 9.7 9.5 26.3 32.3 35.1 24.7 26.9 !4.9 !2.6 !1.3 9.8 3.9
GCC 31.4 23.6 41.3 37.0 30.3 15.0 15.2 28.8 22.4 15.2 14.3 21.6 20.5 19.6 24.1 39.3 39.6 9.5 21.0 30.3
China 54.7 53.2 48.8 46.4 35.1 11.5 15.5 13.6 15.9 13.3 33.8 36.5 34.9 35.3 43.9 0.1 !5.2 2.6 2.4 7.7
India 74.1 73.8 64.2 63.2 58.5 9.6 10.3 12.1 13.2 11.9 16.5 19.0 25.1 24.5 35.2 !0.1 !3.1 !1.4 !0.9 !5.5
Japan 48.8 54.2 52.7 55.9 57.5 10.7 14.1 13.3 16.8 18.4 39.3 32.6 33.1 25.8 24.0 1.2 !0.9 0.9 1.4 0.1
US 62.2 62.6 65.8 68.2 69.9 18.3 16.9 16.8 14.5 16.8 19.1 21.1 18.9 21.3 18.4 0.3 !0.6 !1.4 !4.0 !5.1
EU15 57.5 58.4 58.1 58.8 57.5 16.3 20.1 20.0 19.8 20.9 26.7 24.0 22.8 21.2 21.1 !0.5 !2.4 !0.8 0.3 0.5
Unit: Percentage.Note: Final demand shares in country groups are computed by using PPPs for GDP. Household consumption includes consumption of NPISHs. Investment in-
cludes GFCF plus changes in inventories.Sources: Official national accounts in each country, including our adjustments.
Table 6: Comparisons of Final Demand Shares in GDP, 1970, 1980, 1990, 2000, and 2008—Share of final demands with respect to GDP at current market prices
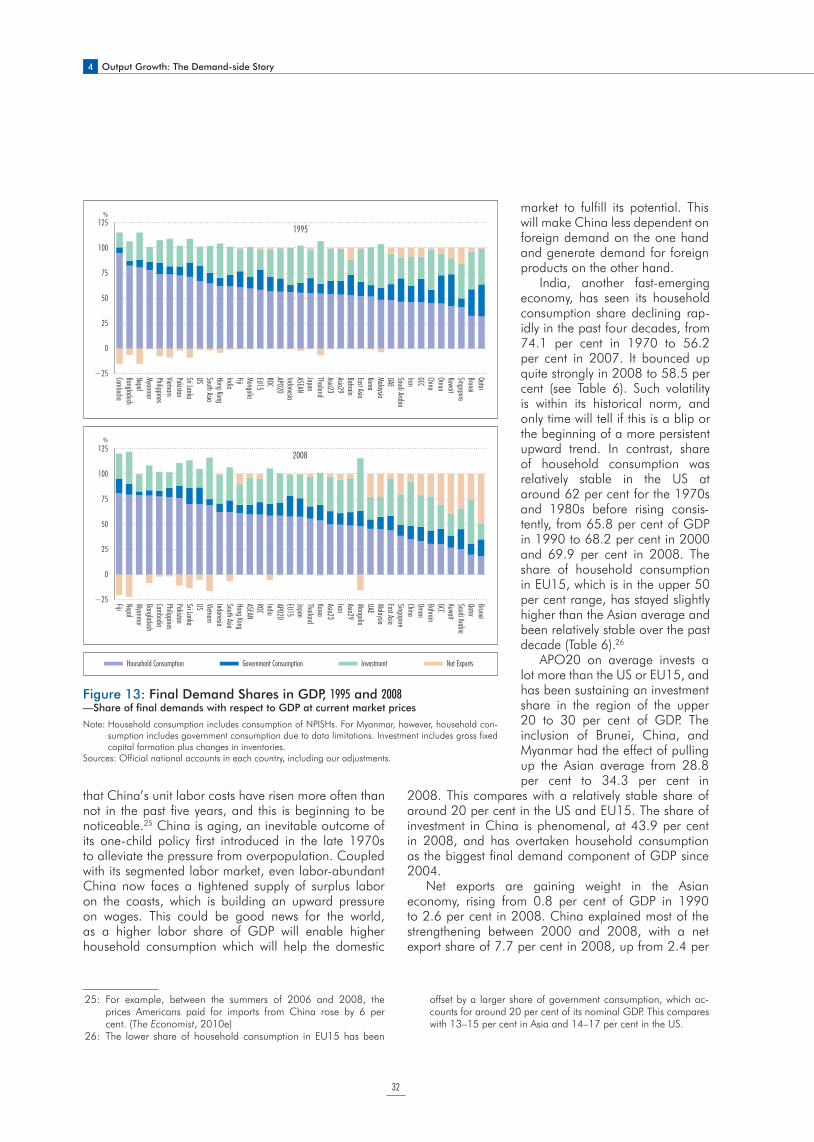
4 Output Growth: The Demand-side Story
32
that China’s unit labor costs have risen more often than not in the past five years, and this is beginning to be noticeable.25 China is aging, an inevitable outcome of its one-child policy first introduced in the late 1970s to alleviate the pressure from overpopulation. Coupled with its segmented labor market, even labor-abundant China now faces a tightened supply of surplus labor on the coasts, which is building an upward pressure on wages. This could be good news for the world, as a higher labor share of GDP will enable higher household consumption which will help the domestic
market to fulfill its potential. This will make China less dependent on foreign demand on the one hand and generate demand for foreign products on the other hand.
India, another fast-emerging economy, has seen its household consumption share declining rap- idly in the past four decades, from 74.1 per cent in 1970 to 56.2 per cent in 2007. It bounced up quite strongly in 2008 to 58.5 per cent (see Table 6). Such volatility is within its historical norm, and only time will tell if this is a blip or the beginning of a more persistent upward trend. In contrast, share of household consumption was relatively stable in the US at around 62 per cent for the 1970s and 1980s before rising consis-tently, from 65.8 per cent of GDP in 1990 to 68.2 per cent in 2000 and 69.9 per cent in 2008. The share of household consumption in EU15, which is in the upper 50 per cent range, has stayed slightly higher than the Asian average and been relatively stable over the past decade (Table 6).26
APO20 on average invests a lot more than the US or EU15, and has been sustaining an investment share in the region of the upper 20 to 30 per cent of GDP. The inclusion of Brunei, China, and Myanmar had the effect of pulling up the Asian average from 28.8 per cent to 34.3 per cent in
2008. This compares with a relatively stable share of around 20 per cent in the US and EU15. The share of investment in China is phenomenal, at 43.9 per cent in 2008, and has overtaken household consumption as the biggest final demand component of GDP since 2004.
Net exports are gaining weight in the Asian economy, rising from 0.8 per cent of GDP in 1990 to 2.6 per cent in 2008. China explained most of the strengthening between 2000 and 2008, with a net export share of 7.7 per cent in 2008, up from 2.4 per
25: For example, between the summers of 2006 and 2008, the prices Americans paid for imports from China rose by 6 per cent. (The Economist, 2010e)
26: The lower share of household consumption in EU15 has been
offset by a larger share of government consumption, which ac-counts for around 20 per cent of its nominal GDP. This compares with 13–15 per cent in Asia and 14–17 per cent in the US.
%
%
125
100
75
50
25
0
−25
125
100
75
50
25
0
−25
1995
Qatar BruneiSingaporeKuwaitOmanChinaGCCIranSaudi ArabiaUAEMalaysiaKoreaEast AsiaBahrainAsia29Asia23ThailandJapanASEANIndonesiaAPO20ROCEU15MongoliaFijiIndiaHong KongSouth AsiaUSSri LankaPakistanVietnamPhilippinesMyanmarNepalBangladeshCambodia
Household Consumption Government Consumption Investment Net Exports
BruneiQatar Saudi ArabiaKuwaitGCCBahrainOmanChinaSingaporeEast AsiaMalaysiaUAEMongoliaAsia29IranAsia23KoreaThailandJapanEU15APO20IndiaROCASEANHong KongSouth AsiaIndonesiaVietnamUSSri LankaPakistanPhilippinesCambodiaBangladeshMyanmarNepalFiji
2008
Figure 13: Final Demand Shares in GDP, 1995 and 2008—Share of final demands with respect to GDP at current market prices
Note: Household consumption includes consumption of NPISHs. For Myanmar, however, household con-sumption includes government consumption due to data limitations. Investment includes gross fixed capital formation plus changes in inventories.
Sources: Official national accounts in each country, including our adjustments.
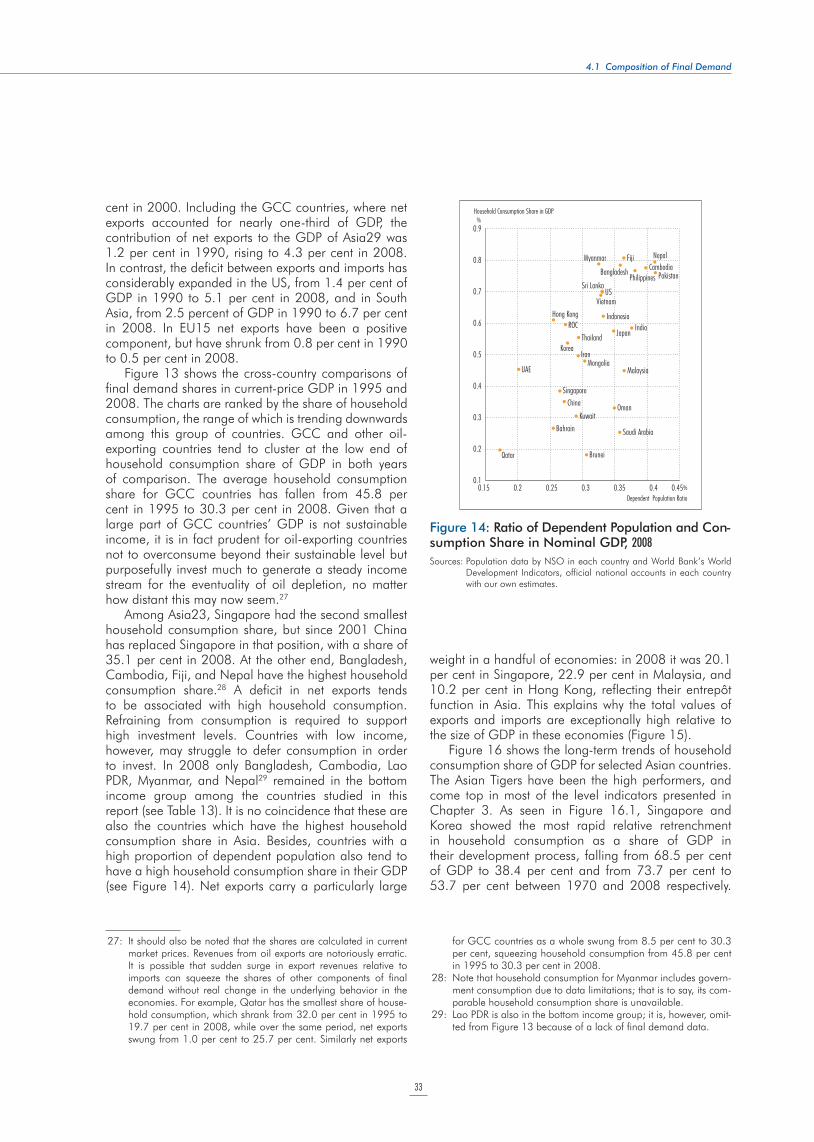
4.1 Composition of Final Demand
33
cent in 2000. Including the GCC countries, where net exports accounted for nearly one-third of GDP, the contribution of net exports to the GDP of Asia29 was 1.2 per cent in 1990, rising to 4.3 per cent in 2008. In contrast, the deficit between exports and imports has considerably expanded in the US, from 1.4 per cent of GDP in 1990 to 5.1 per cent in 2008, and in South Asia, from 2.5 percent of GDP in 1990 to 6.7 per cent in 2008. In EU15 net exports have been a positive component, but have shrunk from 0.8 per cent in 1990 to 0.5 per cent in 2008.
Figure 13 shows the cross-country comparisons of final demand shares in current-price GDP in 1995 and 2008. The charts are ranked by the share of household consumption, the range of which is trending downwards among this group of countries. GCC and other oil-exporting countries tend to cluster at the low end of household consumption share of GDP in both years of comparison. The average household consumption share for GCC countries has fallen from 45.8 per cent in 1995 to 30.3 per cent in 2008. Given that a large part of GCC countries’ GDP is not sustainable income, it is in fact prudent for oil-exporting countries not to overconsume beyond their sustainable level but purposefully invest much to generate a steady income stream for the eventuality of oil depletion, no matter how distant this may now seem.27
Among Asia23, Singapore had the second smallest household consumption share, but since 2001 China has replaced Singapore in that position, with a share of 35.1 per cent in 2008. At the other end, Bangladesh, Cambodia, Fiji, and Nepal have the highest household consumption share.28 A deficit in net exports tends to be associated with high household consumption. Refraining from consumption is required to support high investment levels. Countries with low income, however, may struggle to defer consumption in order to invest. In 2008 only Bangladesh, Cambodia, Lao PDR, Myanmar, and Nepal29 remained in the bottom income group among the countries studied in this report (see Table 13). It is no coincidence that these are also the countries which have the highest household consumption share in Asia. Besides, countries with a high proportion of dependent population also tend to have a high household consumption share in their GDP (see Figure 14). Net exports carry a particularly large
weight in a handful of economies: in 2008 it was 20.1 per cent in Singapore, 22.9 per cent in Malaysia, and 10.2 per cent in Hong Kong, reflecting their entrepôt function in Asia. This explains why the total values of exports and imports are exceptionally high relative to the size of GDP in these economies (Figure 15).
Figure 16 shows the long-term trends of household consumption share of GDP for selected Asian countries. The Asian Tigers have been the high performers, and come top in most of the level indicators presented in Chapter 3. As seen in Figure 16.1, Singapore and Korea showed the most rapid relative retrenchment in household consumption as a share of GDP in their development process, falling from 68.5 per cent of GDP to 38.4 per cent and from 73.7 per cent to 53.7 per cent between 1970 and 2008 respectively.
0.9
0.8
0.7
0.6
0.5
0.4
0.3
0.2
0.1
Bangladesh Cambodia
ROC
Fiji
Hong Kong
IndiaIndonesia
Iran
Japan
Korea
MalaysiaMongolia
Nepal
PakistanPhilippines
Singapore
Sri Lanka
Thailand
Vietnam
China
Brunei
Myanmar
KuwaitBahrain
Oman
Qatar
Saudi Arabia
UAE
US
0.15 0.2 0.25 0.3 0.35 0.4 0.45%
%
Dependent Population Ratio
Household Consumption Share in GDP
Figure 14: Ratio of Dependent Population and Con-sumption Share in Nominal GDP, 2008
Sources: Population data by NSO in each country and World Bank’s World Development Indicators, official national accounts in each country with our own estimates.
27: It should also be noted that the shares are calculated in current market prices. Revenues from oil exports are notoriously erratic. It is possible that sudden surge in export revenues relative to imports can squeeze the shares of other components of final demand without real change in the underlying behavior in the economies. For example, Qatar has the smallest share of house-hold consumption, which shrank from 32.0 per cent in 1995 to 19.7 per cent in 2008, while over the same period, net exports swung from 1.0 per cent to 25.7 per cent. Similarly net exports
for GCC countries as a whole swung from 8.5 per cent to 30.3 per cent, squeezing household consumption from 45.8 per cent in 1995 to 30.3 per cent in 2008.
28: Note that household consumption for Myanmar includes govern-ment consumption due to data limitations; that is to say, its com-parable household consumption share is unavailable.
29: Lao PDR is also in the bottom income group; it is, however, omit-ted from Figure 13 because of a lack of final demand data.
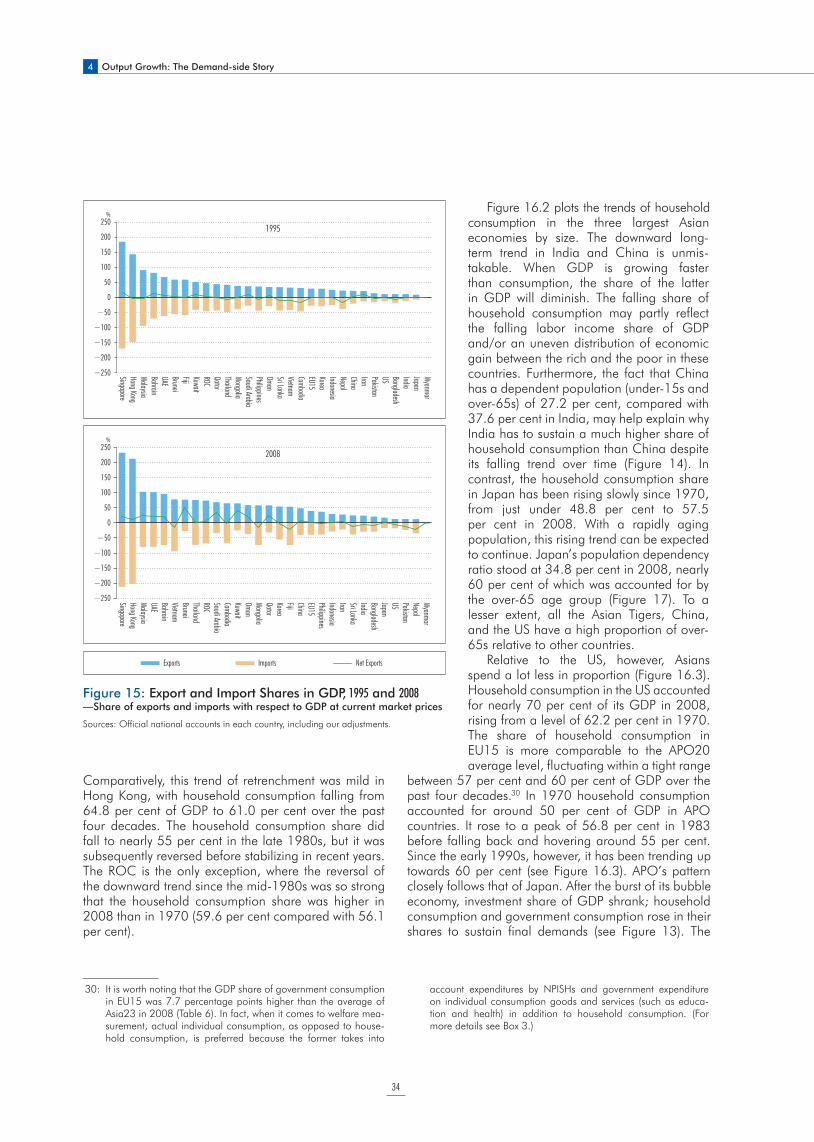
4 Output Growth: The Demand-side Story
34
Comparatively, this trend of retrenchment was mild in Hong Kong, with household consumption falling from 64.8 per cent of GDP to 61.0 per cent over the past four decades. The household consumption share did fall to nearly 55 per cent in the late 1980s, but it was subsequently reversed before stabilizing in recent years. The ROC is the only exception, where the reversal of the downward trend since the mid-1980s was so strong that the household consumption share was higher in 2008 than in 1970 (59.6 per cent compared with 56.1 per cent).
Figure 16.2 plots the trends of household consumption in the three largest Asian economies by size. The downward long-term trend in India and China is unmis-takable. When GDP is growing faster than consumption, the share of the latter in GDP will diminish. The falling share of household consumption may partly reflect the falling labor income share of GDP and/or an uneven distribution of economic gain between the rich and the poor in these countries. Furthermore, the fact that China has a dependent population (under-15s and over-65s) of 27.2 per cent, compared with 37.6 per cent in India, may help explain why India has to sustain a much higher share of household consumption than China despite its falling trend over time (Figure 14). In contrast, the household consumption share in Japan has been rising slowly since 1970, from just under 48.8 per cent to 57.5 per cent in 2008. With a rapidly aging population, this rising trend can be expected to continue. Japan’s population dependency ratio stood at 34.8 per cent in 2008, nearly 60 per cent of which was accounted for by the over-65 age group (Figure 17). To a lesser extent, all the Asian Tigers, China, and the US have a high proportion of over-65s relative to other countries.
Relative to the US, however, Asians spend a lot less in proportion (Figure 16.3). Household consumption in the US accounted for nearly 70 per cent of its GDP in 2008, rising from a level of 62.2 per cent in 1970. The share of household consumption in EU15 is more comparable to the APO20 average level, fluctuating within a tight range
between 57 per cent and 60 per cent of GDP over the past four decades.30 In 1970 household consumption accounted for around 50 per cent of GDP in APO countries. It rose to a peak of 56.8 per cent in 1983 before falling back and hovering around 55 per cent. Since the early 1990s, however, it has been trending up towards 60 per cent (see Figure 16.3). APO’s pattern closely follows that of Japan. After the burst of its bubble economy, investment share of GDP shrank; household consumption and government consumption rose in their shares to sustain final demands (see Figure 13). The
30: It is worth noting that the GDP share of government consumption in EU15 was 7.7 percentage points higher than the average of Asia23 in 2008 (Table 6). In fact, when it comes to welfare mea-surement, actual individual consumption, as opposed to house-hold consumption, is preferred because the former takes into
account expenditures by NPISHs and government expenditure on individual consumption goods and services (such as educa-tion and health) in addition to household consumption. (For more details see Box 3.)
MyanmarJapanIndiaBangladeshUSPakistanIranChinaNepalIndonesiaKoreaEU15CambodiaVietnamSri LankaOmanPhilippinesSaudi ArabiaMongoliaThailandQatarROCKuwaitFijiBruneiUAEBahrainMalaysiaHong KongSingapore
1995250
200
150
100
50
0
−50
−100
−150
−200
−250
Hong KongSingapore
MalaysiaUAEBahrainVietnam BruneiThailandROCSaudi Arabia CambodiaKuwaitOmanMongoliaQatarKoreaFijiChinaEU15PhilippinesIndonesiaIranSri LankaIndiaBangladeshJapanUS PakistanNepalMyanmar
2008
Exports Imports Net Exports
%
250
200
150
100
50
0
−50
−100
−150
−200
−250
%
Figure 15: Export and Import Shares in GDP, 1995 and 2008— Share of exports and imports with respect to GDP at current market prices
Sources: Official national accounts in each country, including our adjustments.
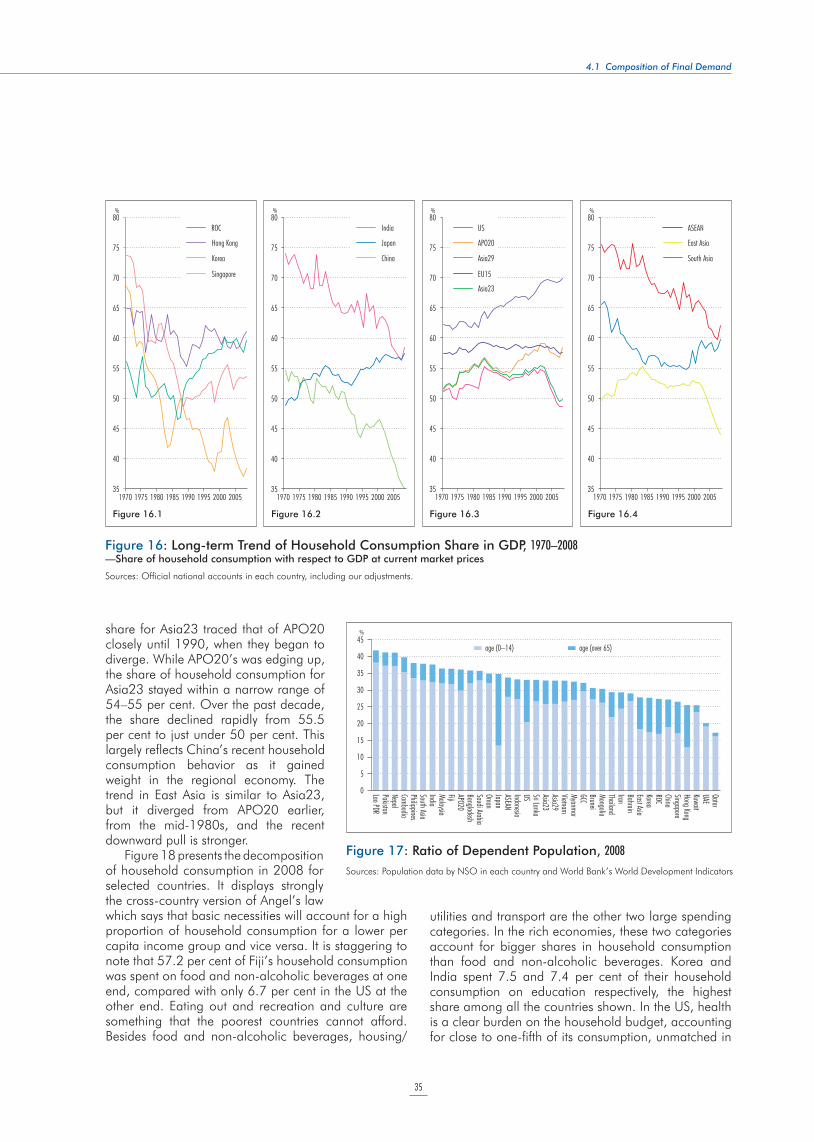
4.1 Composition of Final Demand
35
share for Asia23 traced that of APO20 closely until 1990, when they began to diverge. While APO20’s was edging up, the share of household consumption for Asia23 stayed within a narrow range of 54–55 per cent. Over the past decade, the share declined rapidly from 55.5 per cent to just under 50 per cent. This largely reflects China’s recent household consumption behavior as it gained weight in the regional economy. The trend in East Asia is similar to Asia23, but it diverged from APO20 earlier, from the mid-1980s, and the recent downward pull is stronger.
Figure 18 presents the decomposition of household consumption in 2008 for selected countries. It displays strongly the cross-country version of Angel’s law which says that basic necessities will account for a high proportion of household consumption for a lower per capita income group and vice versa. It is staggering to note that 57.2 per cent of Fiji’s household consumption was spent on food and non-alcoholic beverages at one end, compared with only 6.7 per cent in the US at the other end. Eating out and recreation and culture are something that the poorest countries cannot afford. Besides food and non-alcoholic beverages, housing/
utilities and transport are the other two large spending categories. In the rich economies, these two categories account for bigger shares in household consumption than food and non-alcoholic beverages. Korea and India spent 7.5 and 7.4 per cent of their household consumption on education respectively, the highest share among all the countries shown. In the US, health is a clear burden on the household budget, accounting for close to one-fifth of its consumption, unmatched in
Figure 16: Long-term Trend of Household Consumption Share in GDP, 1970–2008—Share of household consumption with respect to GDP at current market prices
Sources: Official national accounts in each country, including our adjustments.
% % % %
35
Figure 16.1 Figure 16.2 Figure 16.3 Figure 16.4
40
45
50
55
60
65
70
75
80
1970 1975 1980 1985 1990 1995 2000 2005
ROC
Hong Kong
Korea
Singapore
35
40
45
50
55
60
65
70
75
80
1970 1975 1980 1985 1990 1995 2000 2005
India
Japan
China
35
40
45
50
55
60
65
70
75
80
1970 1975 1980 1985 1990 1995 2000 2005
US
EU15
APO20
Asia23
Asia29
35
40
45
50
55
60
65
70
75
80
1970 1975 1980 1985 1990 1995 2000 2005
ASEAN
East Asia
South Asia
QatarUAEKuwaitHong KongSingaporeChinaROCKoreaEast AsiaBahrainIranThailandMongoliaBruneiGCCMyanmarVietnamAsia29Asia23Sri LankaUSIndonesiaASEANJapanOmanSaudi ArabiaBangladeshAPO20FijiMalaysiaIndiaSouth AsiaPhilippinesCambodiaNepalPakistanLao PDR
45
40
35
30
25
20
15
10
5
0
%
age (0–14) age (over 65)
Figure 17: Ratio of Dependent Population, 2008
Sources: Population data by NSO in each country and World Bank’s World Development Indicators
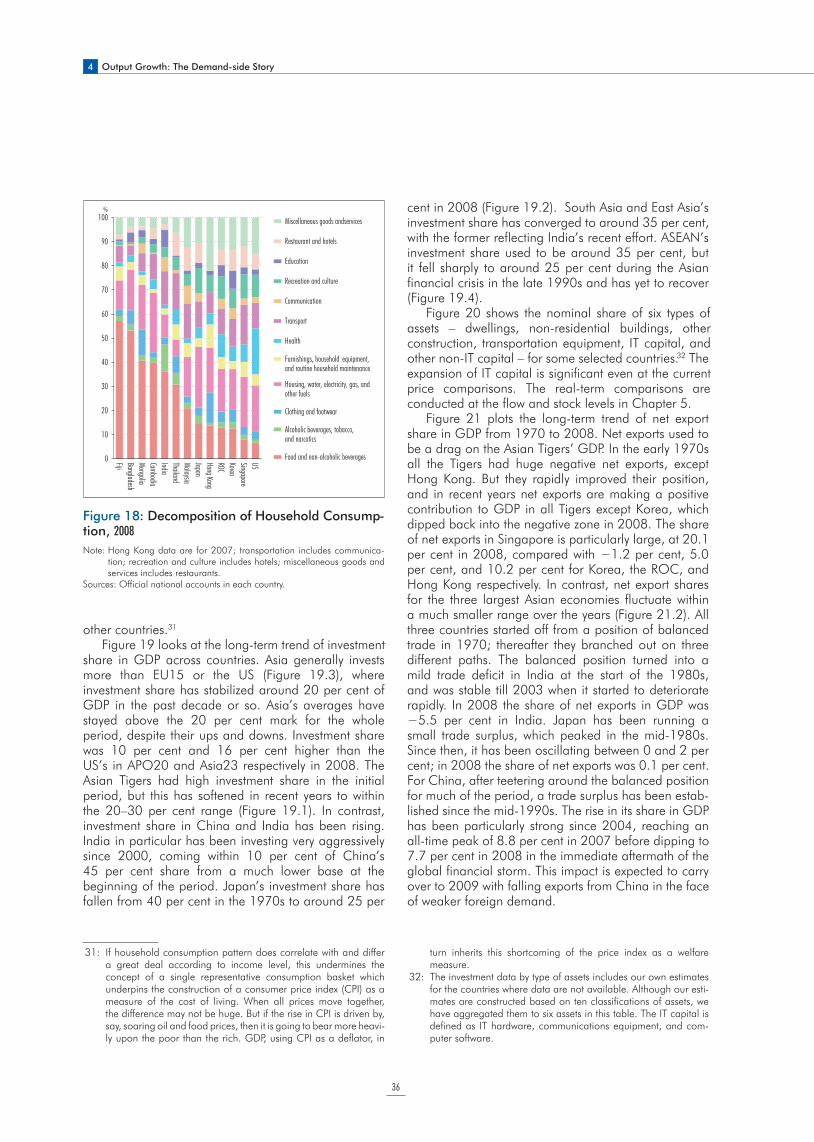
4 Output Growth: The Demand-side Story
36
other countries.31
Figure 19 looks at the long-term trend of investment share in GDP across countries. Asia generally invests more than EU15 or the US (Figure 19.3), where investment share has stabilized around 20 per cent of GDP in the past decade or so. Asia’s averages have stayed above the 20 per cent mark for the whole period, despite their ups and downs. Investment share was 10 per cent and 16 per cent higher than the US’s in APO20 and Asia23 respectively in 2008. The Asian Tigers had high investment share in the initial period, but this has softened in recent years to within the 20–30 per cent range (Figure 19.1). In contrast, investment share in China and India has been rising. India in particular has been investing very aggressively since 2000, coming within 10 per cent of China’s 45 per cent share from a much lower base at the beginning of the period. Japan’s investment share has fallen from 40 per cent in the 1970s to around 25 per
cent in 2008 (Figure 19.2). South Asia and East Asia’s investment share has converged to around 35 per cent, with the former reflecting India’s recent effort. ASEAN’s investment share used to be around 35 per cent, but it fell sharply to around 25 per cent during the Asian financial crisis in the late 1990s and has yet to recover (Figure 19.4).
Figure 20 shows the nominal share of six types of assets – dwellings, non-residential buildings, other construction, transportation equipment, IT capital, and other non-IT capital – for some selected countries.32 The expansion of IT capital is significant even at the current price comparisons. The real-term comparisons are conducted at the flow and stock levels in Chapter 5.
Figure 21 plots the long-term trend of net export share in GDP from 1970 to 2008. Net exports used to be a drag on the Asian Tigers’ GDP. In the early 1970s all the Tigers had huge negative net exports, except Hong Kong. But they rapidly improved their position, and in recent years net exports are making a positive contribution to GDP in all Tigers except Korea, which dipped back into the negative zone in 2008. The share of net exports in Singapore is particularly large, at 20.1 per cent in 2008, compared with !1.2 per cent, 5.0 per cent, and 10.2 per cent for Korea, the ROC, and Hong Kong respectively. In contrast, net export shares for the three largest Asian economies fluctuate within a much smaller range over the years (Figure 21.2). All three countries started off from a position of balanced trade in 1970; thereafter they branched out on three different paths. The balanced position turned into a mild trade deficit in India at the start of the 1980s, and was stable till 2003 when it started to deteriorate rapidly. In 2008 the share of net exports in GDP was !5.5 per cent in India. Japan has been running a small trade surplus, which peaked in the mid-1980s. Since then, it has been oscillating between 0 and 2 per cent; in 2008 the share of net exports was 0.1 per cent. For China, after teetering around the balanced position for much of the period, a trade surplus has been estab-lished since the mid-1990s. The rise in its share in GDP has been particularly strong since 2004, reaching an all-time peak of 8.8 per cent in 2007 before dipping to 7.7 per cent in 2008 in the immediate aftermath of the global financial storm. This impact is expected to carry over to 2009 with falling exports from China in the face of weaker foreign demand.
Health
Miscellaneous goods andservices
Restaurant and hotels
Education
Recreation and culture
Communication
Transport
Furnishings, household equipment,and routine household maintenance
Housing, water, electricity, gas, andother fuels
Clothing and footwear
Alcoholic beverages, tobacco,and narcotics
Food and non-alcoholic beveragesUSSingaporeKoreaROCHong KongJapanMalaysiaThailandIndiaCambodiaMongoliaBangladeshFiji
100
90
80
70
60
50
40
30
20
10
0
%
Figure 18: Decomposition of Household Consump-tion, 2008
Note: Hong Kong data are for 2007; transportation includes communica-tion; recreation and culture includes hotels; miscellaneous goods and services includes restaurants.
Sources: Official national accounts in each country.
31: If household consumption pattern does correlate with and differ a great deal according to income level, this undermines the concept of a single representative consumption basket which underpins the construction of a consumer price index (CPI) as a measure of the cost of living. When all prices move together, the difference may not be huge. But if the rise in CPI is driven by, say, soaring oil and food prices, then it is going to bear more heavi- ly upon the poor than the rich. GDP, using CPI as a deflator, in
turn inherits this shortcoming of the price index as a welfare measure.
32: The investment data by type of assets includes our own estimates for the countries where data are not available. Although our esti-mates are constructed based on ten classifications of assets, we have aggregated them to six assets in this table. The IT capital is defined as IT hardware, communications equipment, and com-puter software.
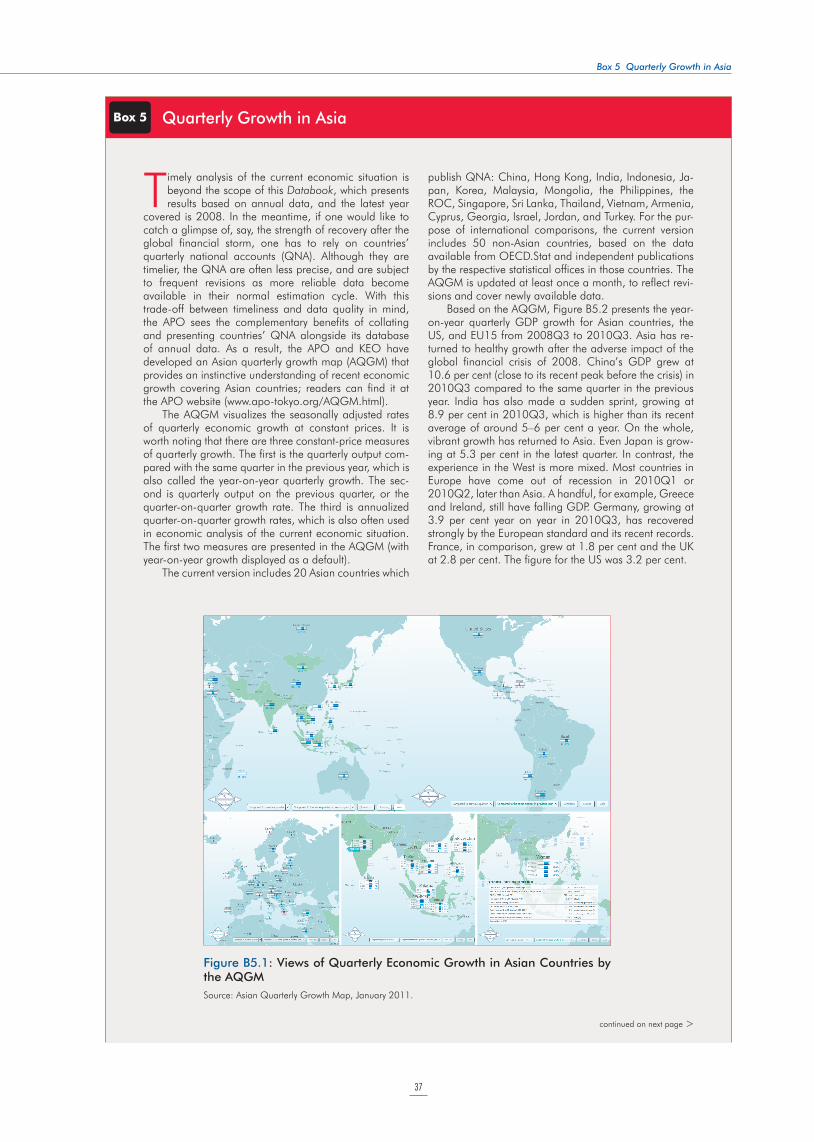
37
Timely analysis of the current economic situation is beyond the scope of this Databook, which presents results based on annual data, and the latest year
covered is 2008. In the meantime, if one would like to catch a glimpse of, say, the strength of recovery after the global financial storm, one has to rely on countries’ quarterly national accounts (QNA). Although they are timelier, the QNA are often less precise, and are subject to frequent revisions as more reliable data become available in their normal estimation cycle. With this trade-off between timeliness and data quality in mind, the APO sees the complementary benefits of collating and presenting countries’ QNA alongside its database of annual data. As a result, the APO and KEO have developed an Asian quarterly growth map (AQGM) that provides an instinctive understanding of recent economic growth covering Asian countries; readers can find it at the APO website (www.apo-tokyo.org/AQGM.html).
The AQGM visualizes the seasonally adjusted rates of quarterly economic growth at constant prices. It is worth noting that there are three constant-price measures of quarterly growth. The first is the quarterly output com-pared with the same quarter in the previous year, which is also called the year-on-year quarterly growth. The sec-ond is quarterly output on the previous quarter, or the quarter-on-quarter growth rate. The third is annualized quarter-on-quarter growth rates, which is also often used in economic analysis of the current economic situation. The first two measures are presented in the AQGM (with year-on-year growth displayed as a default).
The current version includes 20 Asian countries which
publish QNA: China, Hong Kong, India, Indonesia, Ja-pan, Korea, Malaysia, Mongolia, the Philippines, the ROC, Singapore, Sri Lanka, Thailand, Vietnam, Armenia, Cyprus, Georgia, Israel, Jordan, and Turkey. For the pur-pose of international comparisons, the current version includes 50 non-Asian countries, based on the data available from OECD.Stat and independent publications by the respective statistical offices in those countries. The AQGM is updated at least once a month, to reflect revi-sions and cover newly available data.
Based on the AQGM, Figure B5.2 presents the year-on-year quarterly GDP growth for Asian countries, the US, and EU15 from 2008Q3 to 2010Q3. Asia has re-turned to healthy growth after the adverse impact of the global financial crisis of 2008. China’s GDP grew at 10.6 per cent (close to its recent peak before the crisis) in 2010Q3 compared to the same quarter in the previous year. India has also made a sudden sprint, growing at 8.9 per cent in 2010Q3, which is higher than its recent average of around 5–6 per cent a year. On the whole, vibrant growth has returned to Asia. Even Japan is grow-ing at 5.3 per cent in the latest quarter. In contrast, the experience in the West is more mixed. Most countries in Europe have come out of recession in 2010Q1 or 2010Q2, later than Asia. A handful, for example, Greece and Ireland, still have falling GDP. Germany, growing at 3.9 per cent year on year in 2010Q3, has recovered strongly by the European standard and its recent records. France, in comparison, grew at 1.8 per cent and the UK at 2.8 per cent. The figure for the US was 3.2 per cent.
Box 5 Quarterly Growth in Asia
continued on next page >
Box 5 Quarterly Growth in Asia
Figure B5.1: Views of Quarterly Economic Growth in Asian Countries by the AQGM
Source: Asian Quarterly Growth Map, January 2011.
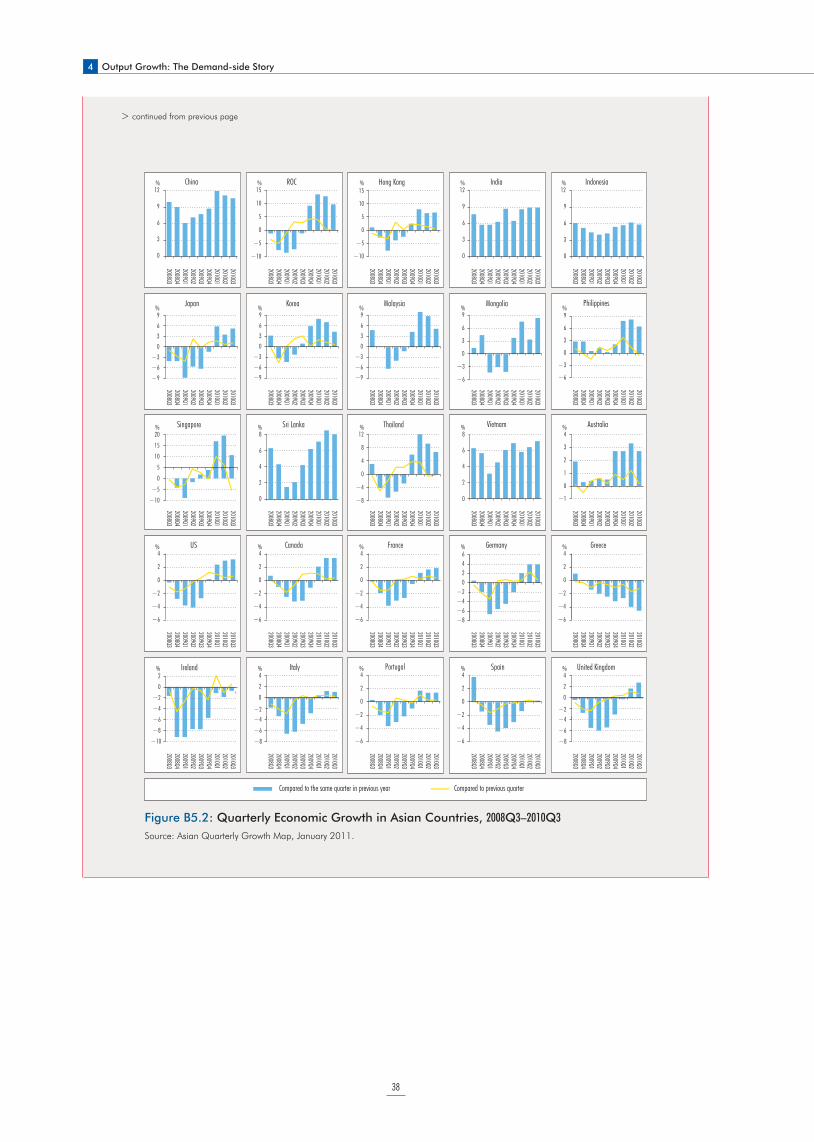
4 Output Growth: The Demand-side Story
38
> continued from previous page
Figure B5.2: Quarterly Economic Growth in Asian Countries, 2008Q3–2010Q3
Source: Asian Quarterly Growth Map, January 2011.
20
15
10
5
0
−5
−10
Singapore
0
2
4
6
8Sri Lanka
12
8
4
0
−4
−8
Thailand
0
2
4
6
8Vietnam
France
SpainPortugal
−6
−4
−2
0
2
4US
United Kingdom
−10
−8
−6
−4
−2
0
2Ireland
15
10
5
0
−5
−10
ROC12
9
6
3
0
2008Q32008Q42009Q12009Q22009Q32009Q42010Q12010Q22010Q3
2008Q32008Q42009Q12009Q22009Q32009Q42010Q12010Q22010Q3
2008Q32008Q42009Q12009Q22009Q32009Q42010Q12010Q22010Q3
2008Q32008Q42009Q12009Q22009Q32009Q42010Q12010Q22010Q3
2008Q32008Q42009Q12009Q22009Q32009Q42010Q12010Q22010Q3
2008Q32008Q42009Q12009Q22009Q32009Q42010Q12010Q22010Q3
2008Q32008Q42009Q12009Q22009Q32009Q42010Q12010Q22010Q3
2008Q32008Q42009Q12009Q22009Q32009Q42010Q12010Q22010Q3
2008Q32008Q42009Q12009Q22009Q32009Q42010Q12010Q22010Q3
2008Q32008Q42009Q12009Q22009Q32009Q42010Q12010Q22010Q3
2008Q32008Q42009Q12009Q22009Q32009Q42010Q12010Q22010Q3
2008Q32008Q42009Q12009Q22009Q32009Q42010Q12010Q22010Q3
2008Q32008Q42009Q12009Q22009Q32009Q42010Q12010Q22010Q3
2008Q32008Q42009Q12009Q22009Q32009Q42010Q12010Q22010Q3
2008Q32008Q42009Q12009Q22009Q32009Q42010Q12010Q22010Q3
2008Q32008Q42009Q12009Q22009Q32009Q42010Q12010Q22010Q3
2008Q32008Q42009Q12009Q22009Q32009Q42010Q12010Q22010Q3
2008Q32008Q42009Q12009Q22009Q32009Q42010Q12010Q22010Q3
2008Q32008Q42009Q12009Q22009Q32009Q42010Q12010Q22010Q3
2008Q32008Q42009Q12009Q22009Q32009Q42010Q12010Q22010Q3
2008Q32008Q42009Q12009Q22009Q32009Q42010Q12010Q22010Q3
2008Q32008Q42009Q12009Q22009Q32009Q42010Q12010Q22010Q3
2008Q32008Q42009Q12009Q22009Q32009Q42010Q12010Q22010Q3
2008Q32008Q42009Q12009Q22009Q32009Q42010Q12010Q22010Q3
2008Q32008Q42009Q12009Q22009Q32009Q42010Q12010Q22010Q3
China India12
9
6
3
0
Indonesia
0
3
6
9
1215
10
5
0
−5
−10
Hong Kong
−6
−3
0
3
6
9
Philippines9
6
3
0
−3
−6
−9
Japan Korea
−9−6
−3
03
69
Malaysia
−9−6
−3
03
69
−6
−3
0
3
6
9
Mongolia
−1
0
1
2
3
4Australia
Canada
−6
−4
−2
0
2
4
−6
−4
−2
0
2
4Greece
−6
−4
−2
0
2
4
−6
−4
−2
0
2
4
−6
−4
−2
0
2
4
−8−6−4−2
0246
Germany
−8
−6
−4−2
0
2
4Italy
−8
−6
−4−2
0
2
4
Compared to the same quarter in previous year Compared to previous quarter
% % % % %
% % % % %
% % % % %
% % % % %
% % % % %
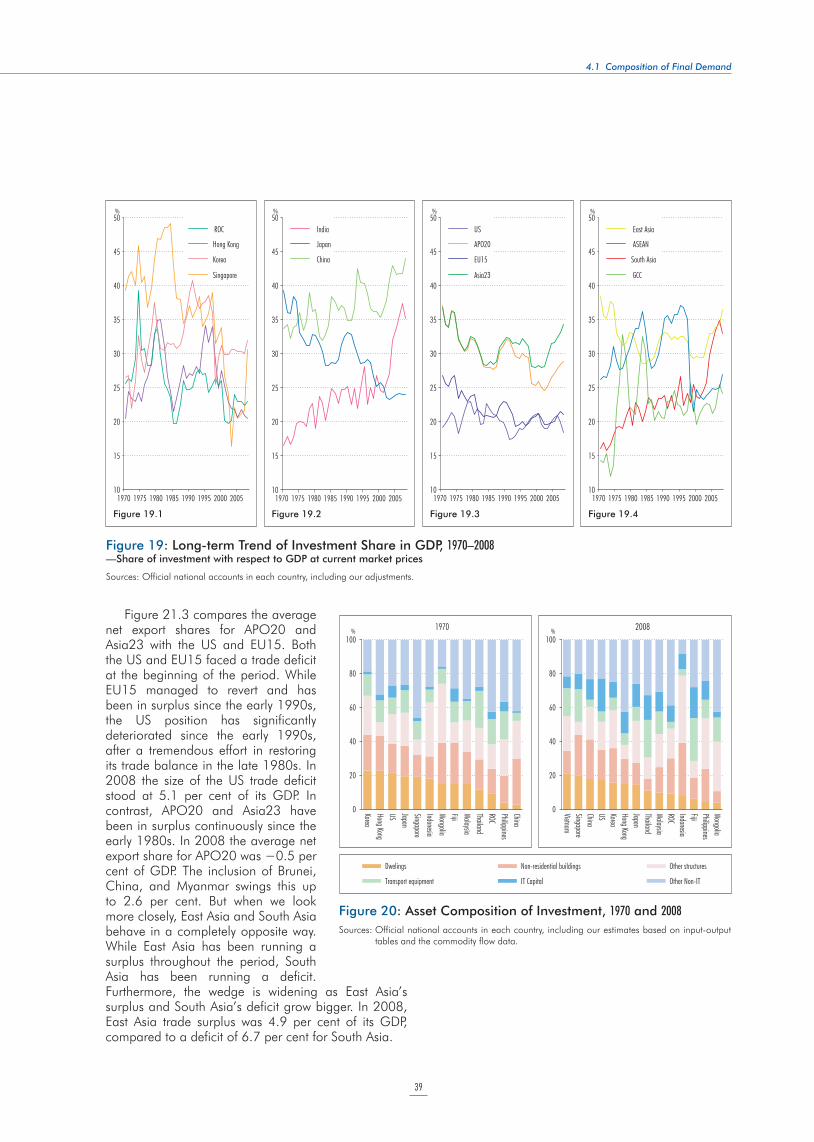
4.1 Composition of Final Demand
39
Figure 21.3 compares the average net export shares for APO20 and Asia23 with the US and EU15. Both the US and EU15 faced a trade deficit at the beginning of the period. While EU15 managed to revert and has been in surplus since the early 1990s, the US position has significantly deteriorated since the early 1990s, after a tremendous effort in restoring its trade balance in the late 1980s. In 2008 the size of the US trade deficit stood at 5.1 per cent of its GDP. In contrast, APO20 and Asia23 have been in surplus continuously since the early 1980s. In 2008 the average net export share for APO20 was !0.5 per cent of GDP. The inclusion of Brunei, China, and Myanmar swings this up to 2.6 per cent. But when we look more closely, East Asia and South Asia behave in a completely opposite way. While East Asia has been running a surplus throughout the period, South Asia has been running a deficit. Furthermore, the wedge is widening as East Asia’s surplus and South Asia’s deficit grow bigger. In 2008, East Asia trade surplus was 4.9 per cent of its GDP, compared to a deficit of 6.7 per cent for South Asia.
Figure 19.1 Figure 19.2 Figure 19.3 Figure 19.4
% % % %
10
15
20
25
30
35
40
45
50
1970 1975 1980 1985 1990 1995 2000 2005
ROC
Hong Kong
Korea
Singapore
10
15
20
25
30
35
40
45
50
1970 1975 1980 1985 1990 1995 2000 2005
India
Japan
China
10
15
20
25
30
35
40
45
50
1970 1975 1980 1985 1990 1995 2000 2005
US
APO20
EU15
Asia23
10
15
20
25
30
35
40
45
50
1970 1975 1980 1985 1990 1995 2000 2005
East Asia
ASEAN
South Asia
GCC
Figure 19: Long-term Trend of Investment Share in GDP, 1970–2008—Share of investment with respect to GDP at current market prices
Sources: Official national accounts in each country, including our adjustments.
100
80
60
40
20
0
100
80
60
40
20
0KoreaHong KongUS JapanSingaporeIndonesiaMongoliaFijiMalaysiaThailandROCPhilippinesChina
1970
VietnamSingaporeChinaUS KoreaHong KongJapanThailandMalaysiaROCIndonesiaFijiPhilippinesMongolia
2008
Dwelings
Transport equipment
Non-residential buildings
IT Capital
Other structures
Other Non-IT
% %
Figure 20: Asset Composition of Investment, 1970 and 2008
Sources: Official national accounts in each country, including our estimates based on input-output tables and the commodity flow data.
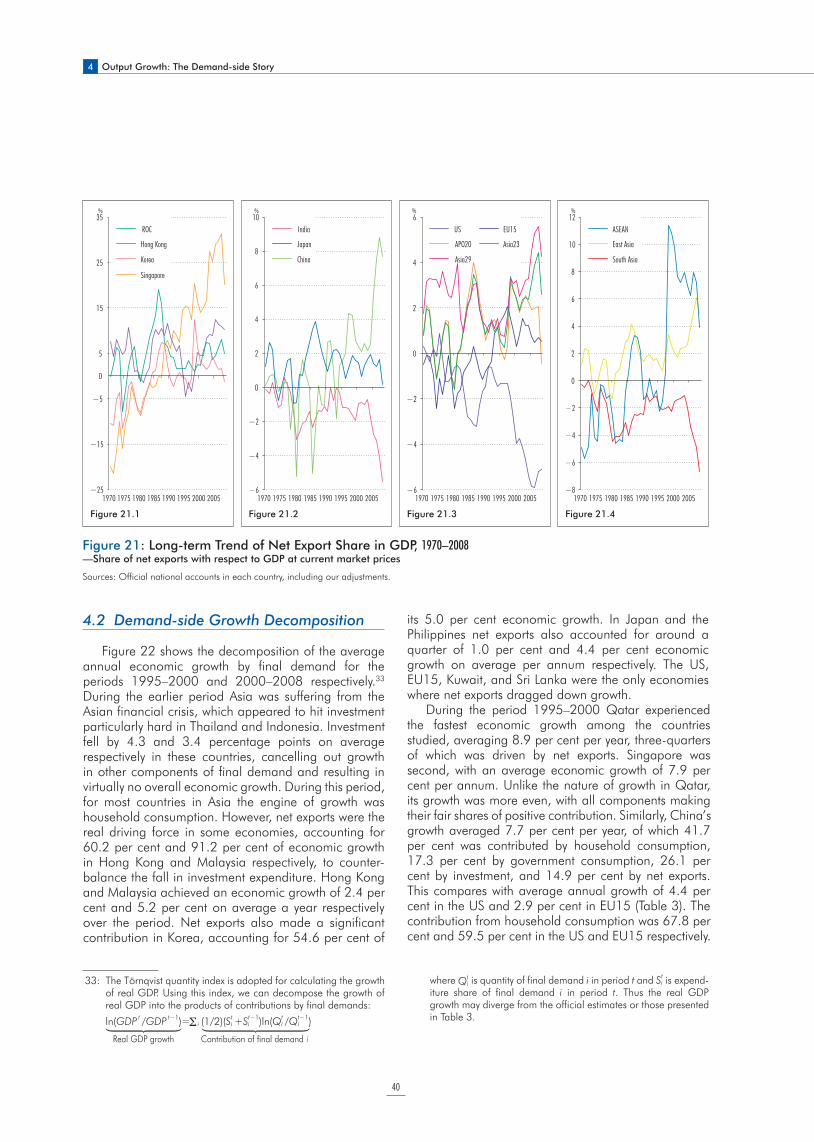
4 Output Growth: The Demand-side Story
40
4.2 Demand-side Growth Decomposition
Figure 22 shows the decomposition of the average annual economic growth by final demand for the periods 1995–2000 and 2000–2008 respectively.33 During the earlier period Asia was suffering from the Asian financial crisis, which appeared to hit investment particularly hard in Thailand and Indonesia. Investment fell by 4.3 and 3.4 percentage points on average respectively in these countries, cancelling out growth in other components of final demand and resulting in virtually no overall economic growth. During this period, for most countries in Asia the engine of growth was household consumption. However, net exports were the real driving force in some economies, accounting for 60.2 per cent and 91.2 per cent of economic growth in Hong Kong and Malaysia respectively, to counter-balance the fall in investment expenditure. Hong Kong and Malaysia achieved an economic growth of 2.4 per cent and 5.2 per cent on average a year respectively over the period. Net exports also made a significant contribution in Korea, accounting for 54.6 per cent of
its 5.0 per cent economic growth. In Japan and the Philippines net exports also accounted for around a quarter of 1.0 per cent and 4.4 per cent economic growth on average per annum respectively. The US, EU15, Kuwait, and Sri Lanka were the only economies where net exports dragged down growth.
During the period 1995–2000 Qatar experienced the fastest economic growth among the countries studied, averaging 8.9 per cent per year, three-quarters of which was driven by net exports. Singapore was second, with an average economic growth of 7.9 per cent per annum. Unlike the nature of growth in Qatar, its growth was more even, with all components making their fair shares of positive contribution. Similarly, China’s growth averaged 7.7 per cent per year, of which 41.7 per cent was contributed by household consumption, 17.3 per cent by government consumption, 26.1 per cent by investment, and 14.9 per cent by net exports. This compares with average annual growth of 4.4 per cent in the US and 2.9 per cent in EU15 (Table 3). The contribution from household consumption was 67.8 per cent and 59.5 per cent in the US and EU15 respectively.
33: The Törnqvist quantity index is adopted for calculating the growth of real GDP. Using this index, we can decompose the growth of real GDP into the products of contributions by final demands:
ln(GDP t /GDP t−1)= i (1/2)(Sti +St−1
i )ln(Qti /Qt−1
i )
Real GDP growth Contribution of final demand i
where Qti is quantity of final demand i in period t and St
i is expend- iture share of final demand i in period t. Thus the real GDP growth may diverge from the official estimates or those presented in Table 3.
% % % %
−25
−15
−5
5
0
15
25
35
1970 1975 1980 1985 1990 1995 2000 2005−6
−4
−2
0
2
4
6
8
10
1970 1975 1980 1985 1990 1995 2000 2005
India
Japan
China
−6
−4
−2
0
2
4
6
1970 1975 1980 1985 1990 1995 2000 2005
US
APO20
Asia29
−8
−6
−4
−2
0
2
4
6
8
10
12
1970 1975 1980 1985 1990 1995 2000 2005
ASEAN
East Asia
South Asia
EU15
Asia23
ROC
Hong Kong
Korea
Singapore
Figure 21.2Figure 21.1 Figure 21.3 Figure 21.4
Figure 21: Long-term Trend of Net Export Share in GDP, 1970–2008—Share of net exports with respect to GDP at current market prices
Sources: Official national accounts in each country, including our adjustments.
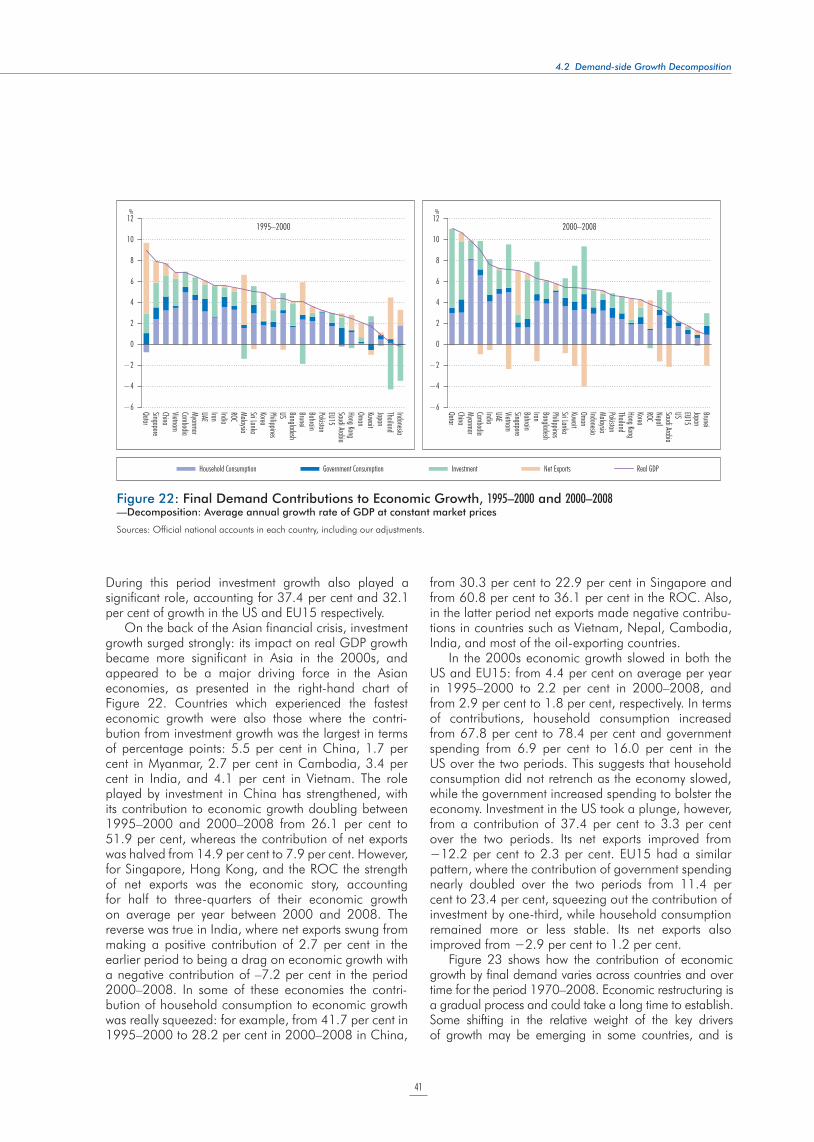
41
4.2 Demand-side Growth Decomposition
During this period investment growth also played a significant role, accounting for 37.4 per cent and 32.1 per cent of growth in the US and EU15 respectively.
On the back of the Asian financial crisis, investment growth surged strongly: its impact on real GDP growth became more significant in Asia in the 2000s, and appeared to be a major driving force in the Asian economies, as presented in the right-hand chart of Figure 22. Countries which experienced the fastest economic growth were also those where the contri-bution from investment growth was the largest in terms of percentage points: 5.5 per cent in China, 1.7 per cent in Myanmar, 2.7 per cent in Cambodia, 3.4 per cent in India, and 4.1 per cent in Vietnam. The role played by investment in China has strengthened, with its contribution to economic growth doubling between 1995–2000 and 2000–2008 from 26.1 per cent to 51.9 per cent, whereas the contribution of net exports was halved from 14.9 per cent to 7.9 per cent. However, for Singapore, Hong Kong, and the ROC the strength of net exports was the economic story, accounting for half to three-quarters of their economic growth on average per year between 2000 and 2008. The reverse was true in India, where net exports swung from making a positive contribution of 2.7 per cent in the earlier period to being a drag on economic growth with a negative contribution of –7.2 per cent in the period 2000–2008. In some of these economies the contri-bution of household consumption to economic growth was really squeezed: for example, from 41.7 per cent in 1995–2000 to 28.2 per cent in 2000–2008 in China,
from 30.3 per cent to 22.9 per cent in Singapore and from 60.8 per cent to 36.1 per cent in the ROC. Also, in the latter period net exports made negative contribu-tions in countries such as Vietnam, Nepal, Cambodia, India, and most of the oil-exporting countries.
In the 2000s economic growth slowed in both the US and EU15: from 4.4 per cent on average per year in 1995–2000 to 2.2 per cent in 2000–2008, and from 2.9 per cent to 1.8 per cent, respectively. In terms of contributions, household consumption increased from 67.8 per cent to 78.4 per cent and government spending from 6.9 per cent to 16.0 per cent in the US over the two periods. This suggests that household consumption did not retrench as the economy slowed, while the government increased spending to bolster the economy. Investment in the US took a plunge, however, from a contribution of 37.4 per cent to 3.3 per cent over the two periods. Its net exports improved from !12.2 per cent to 2.3 per cent. EU15 had a similar pattern, where the contribution of government spending nearly doubled over the two periods from 11.4 per cent to 23.4 per cent, squeezing out the contribution of investment by one-third, while household consumption remained more or less stable. Its net exports also improved from !2.9 per cent to 1.2 per cent.
Figure 23 shows how the contribution of economic growth by final demand varies across countries and over time for the period 1970–2008. Economic restructuring is a gradual process and could take a long time to establish. Some shifting in the relative weight of the key drivers of growth may be emerging in some countries, and is
%%12
10
8
6
4
2
0
−2
−4
−6
12
10
8
6
4
2
0
−2
−4
−6QatarSingaporeChinaVietnamCambodiaMyanmarUAEIranIndiaROCMalaysiaSri LankaKoreaPhilippinesUS BangladeshBruneiBahrainPakistanEU15Saudi ArabiaHong KongOmanKuwaitJapanThailandIndonesia
1995–2000
QatarChinaMyanmarCambodiaIndiaUAEVietnamSingaporeBahrainIranBangladeshPhilippinesSri LankaKuwaitOmanIndonesiaMalaysiaPakistanThailandHong KongKoreaROCNepalSaudi ArabiaUS EU15JapanBrunei
2000–2008
Household Consumption Government Consumption Investment Net Exports Real GDP
Figure 22: Final Demand Contributions to Economic Growth, 1995–2000 and 2000–2008—Decomposition: Average annual growth rate of GDP at constant market prices
Sources: Official national accounts in each country, including our adjustments.
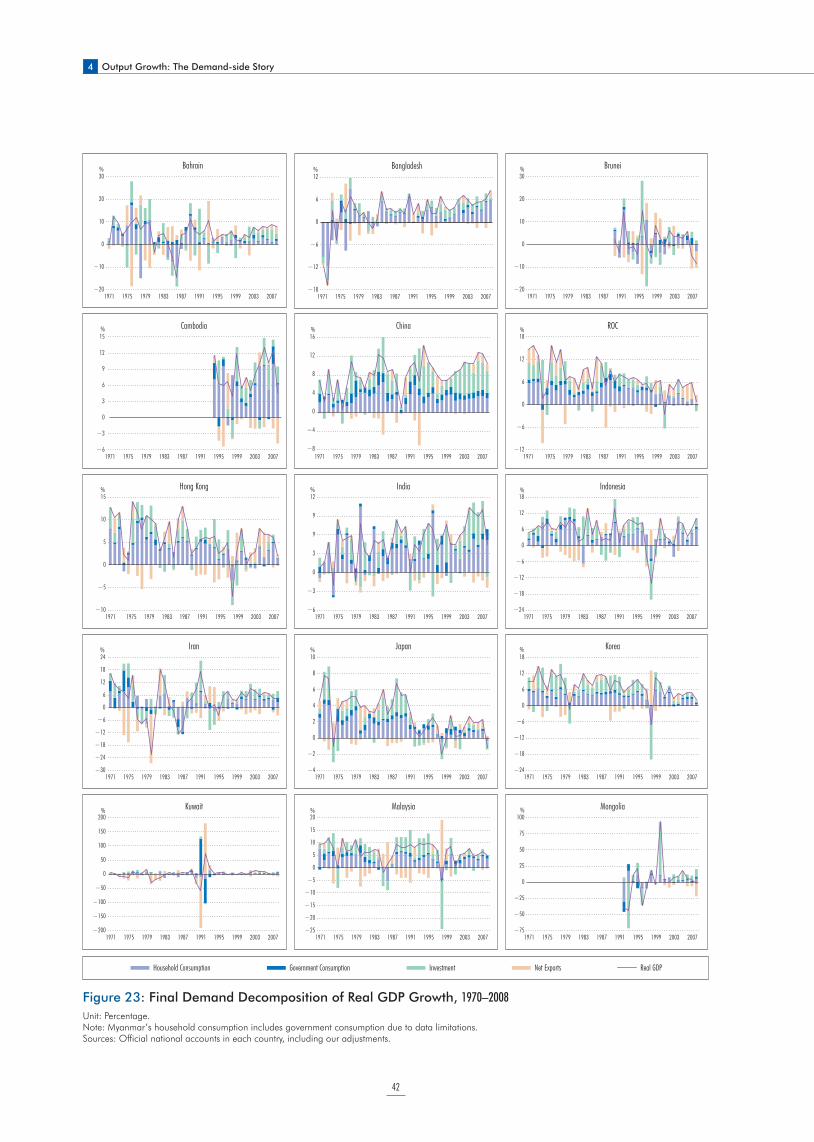
4 Output Growth: The Demand-side Story
42
12
6
0
−6
−12
−18
%
1971 1975 1979 1983 1987 1991 1995 1999 2003 2007
30
20
10
0
−10
−20
%
1971 1975 1979 1983 1987 1991 1995 1999 2003 2007
30
20
10
0
−10
−20
%
1971 1975 1979 1983 1987 1991 1995 1999 2003 2007
15
12
9
6
3
0
−3
−6
%
1971 1975 1979 1983 1987 1991 1995 1999 2003 2007
16
12
8
4
0
−4
−8
%
1971 1975 1979 1983 1987 1991 1995 1999 2003 2007
18
12
6
0
−6
−12
%
1971 1975 1979 1983 1987 1991 1995 1999 2003 2007
15
10
5
0
−5
−10
%
1971 1975 1979 1983 1987 1991 1995 1999 2003 2007
12
9
9
3
0
−3
−6
%
1971 1975 1979 1983 1987 1991 1995 1999 2003 2007
18
12
6
0
−6
−12
−18
−24
%
1971 1975 1979 1983 1987 1991 1995 1999 2003 2007
24
18
12
6
0
−6
−12
−18
−24
−30
%
1971 1975 1979 1983 1987 1991 1995 1999 2003 2007
10
8
6
4
2
0
−2
−4
%
1971 1975 1979 1983 1987 1991 1995 1999 2003 2007
18
12
6
0
−6
−12
−18
−24
%
1971 1975 1979 1983 1987 1991 1995 1999 2003 2007
200
150
100
50
0
−50
−100
−150
−200
%
1971 1975 1979 1983 1987 1991 1995 1999 2003 2007
20
15
10
5
0
−5
−10
−15
−20
−25
%
1971 1975 1979 1983 1987 1991 1995 1999 2003 2007
100
75
50
25
0
−25
−50
−75
BangladeshBahrain Brunei
Cambodia China ROC
Hong Kong India Indonesia
Iran Japan Korea
Kuwait Malaysia Mongolia%
1971 1975 1979 1983 1987 1991 1995 1999 2003 2007
Net ExportsInvestmentGovernment ConsumptionHousehold Consumption Real GDP
Figure 23: Final Demand Decomposition of Real GDP Growth, 1970–2008
Unit: Percentage. Note: Myanmar’s household consumption includes government consumption due to data limitations.Sources: Official national accounts in each country, including our adjustments.

43
4.2 Demand-side Growth Decomposition
16
12
8
4
0
−4
−8
−12
−16
%
1971 1975 1979 1983 1987 1991 1995 1999 2003 2007
8
6
4
2
0
−2
−4
%
1971 1975 1979 1983 1987 1991 1995 1999 2003 2007
40
30
20
10
0
−10
−20
−30
%
1971 1975 1979 1983 1987 1991 1995 1999 2003 2007
12
9
6
3
0
−3
−6
%
1971 1975 1979 1983 1987 1991 1995 1999 2003 2007
12
9
6
3
0
−3
−6
−9
−12
%
1971 1975 1979 1983 1987 1991 1995 1999 2003 2007
30
20
10
0
−10
−20
−30
%
1971 1975 1979 1983 1987 1991 1995 1999 2003 2007
60
45
30
15
0
−15
−30
%
1971 1975 1979 1983 1987 1991 1995 1999 2003 2007
15
10
5
0
−5
−10
%
1971 1975 1979 1983 1987 1991 1995 1999 2003 2007
18
13
8
3
−2
−7
−12
%
1971 1975 1979 1983 1987 1991 1995 1999 2003 2007
18
9
0
−9
−18
−27
%
1971 1975 1979 1983 1987 1991 1995 1999 2003 2007
120
90
60
30
0
−30
%
1971 1975 1979 1983 1987 1991 1995 1999 2003 2007
30
20
10
0
−10
−20
%
1971 1975 1979 1983 1987 1991 1995 1999 2003 2007
10
8
6
4
2
0
−2
−4
%
1971 1975 1979 1983 1987 1991 1995 1999 2003 2007
6
4
2
0
−2
−4
Myanmar Nepal Oman
Pakistan Philippines Qatar
Saudi Arabia Singapore Sri Lanka
Thailand UAE Vietnam
US EU15%
1971 1975 1979 1983 1987 1991 1995 1999 2003 2007
Net ExportsInvestmentGovernment ConsumptionHousehold Consumption Real GDP
4 Output Growth: The Demand-side Story
44
discernible in our data covering almost four decades. Furthermore, the Asian financial crisis of 1997–1998 marked an exceptional time for many Asian economies. Its impact can clearly be seen in Indonesia, Korea, Malaysia, Singapore, and Thailand, where investment took a nose-dive in 1998; consumption also fell, albeit to a lesser extent. In contrast, net export growth was excep-tionally strong, and was likely to have benefited from the rapid devaluation of the Asian currencies at the time of the crisis.34 We are also beginning to see the impact of the global financial crisis of 2007–2008 coming through the annual data. For most countries, the economic slowdown started in 2007 and accelerated into 2008, albeit more sharply in some than others. The US, EU15, and the ROC achieved virtually no growth in 2008, while the Japanese economy actually contracted. Most of the other countries also experienced a slowdown in growth.
Household consumption has been one key driver of economic growth in the Asian countries, but its importance varies across countries and across time. In the ROC and Hong Kong, for example, it bore a much larger weight at the beginning of the period, but in recent years the percentage contributed by household consumption has been much lower. Investment has, on the one hand, been a consistent and significant driver of economic growth in many Asian economies (notably in the four Asian Tigers, and more recently in China, India, Vietnam, and Thailand); on the other hand, it has also contributed to the volatility of economies.
Net exports have been a significant driver in Asia, and subject to wider swings when compared to the US and EU15. In the ROC they were a key engine of growth in the 1970s. In the latter half of the 1980s and the 1990s growth was mainly about household consumption and investment. Since the turn of the millennium, however, net exports have regained their importance as a driver of economic growth. Similarly, in the 2000s growth in Hong Kong has been mainly led by net exports, as has growth in Singapore barring 2004. The story in Korea has been about household consumption and investment; the role of net exports has not been firmly established. In contrast, net exports have emerged to play a more significant role in Japan’s modest growth in the past five years.
For China, investment is clearly a key driver in the economy, and since the early 1990s it has often been the main contributor to economic growth. In recent years net exports have also emerged as being capable of making a positive contribution to growth. In contrast, the promi-nence of investment in India is less stark than in China, and net exports are still a drag on its growth effort.
For the US, household consumption as the key
component of economic growth has never been challenged. Investment was strong and consistent for a decade in the 1990s, but contracted after the burst of the dot.com bubble at the turn of the millennium before recovering in recent years. Investment began to fall in 2007 (!0.5 per cent), and continued in 2008 (!1.4 per cent) in the wake of the global financial crisis. Government consumption also went through ebbs and flows. It was strong in the 1980s, fueling overall economic growth. A clear effort to restrain it took place in the early 1990s before it picked up again. Growth in government consumption doubled from 0.2 per cent to 0.5 per cent between 2007 and 2008. Since the early 1990s net exports have played a negligible role in US economic growth, if not being a drag on the economy.
Like the US, economic growth in EU15 is largely determined by household consumption and investment. Net exports have not been making a significant contri-bution to growth in recent years. Growth of government consumption has been steady throughout the period, but efforts at restraint during the 1990s can clearly be seen before growth picked up again in the 2000s.
It is difficult to understand the oil-exporting econ- omies fully without analyzing the oil market in paral- lel. We can clearly observe its volatility from Figure 23, with huge swings from peak to trough particu- larly in the 1970s. The oil booms of the 1970s brought benefits, but the downturns also hurt. Net exports are still erratic, but overall volatility seemed to have reduced in the past two decades. Qatar experienced the fastest GDP growth among the oil-exporting countries in recent years with very strong investment growth, but its economy is still very dependent on oil and gas and related industries, which account for over 50 per cent of its GDP in 2008 (Figure 44), roughly 80 per cent of its export earnings, and 70 per cent of government revenues in the 2000s.35 In contrast, Bahrain has diversified to be a regional banking and financial center and benefited from the regional boom in recent years. Even so, petroleum production and processing still account for less than 30 per cent of its GDP in 2008 (Figure 44), about 60 per cent of export earnings, and 75 per cent of government revenues in the 2000s.36 The economic fortunes of these countries are therefore tied up with the rest of the world via their dependence on the oil and gas industry. For example, demand for oil has been driven up by the rapid growth in emerging economies. If, say, China slows down, the demand for oil will also relent. Their future depends on how well they can diversify away from oil and gas while the stock of natural resources lasts.
34: It appears that some Asian countries, for example the ROC, Hong Kong, Japan, and Malaysia, also suffered adversely in 2001 following the burst of the dot.com bubble.
35: Data from the series of Annual Statistical Abstract, State of Qatar.
36: Data from Ministry of Finance, Kingdom of Bahrain.
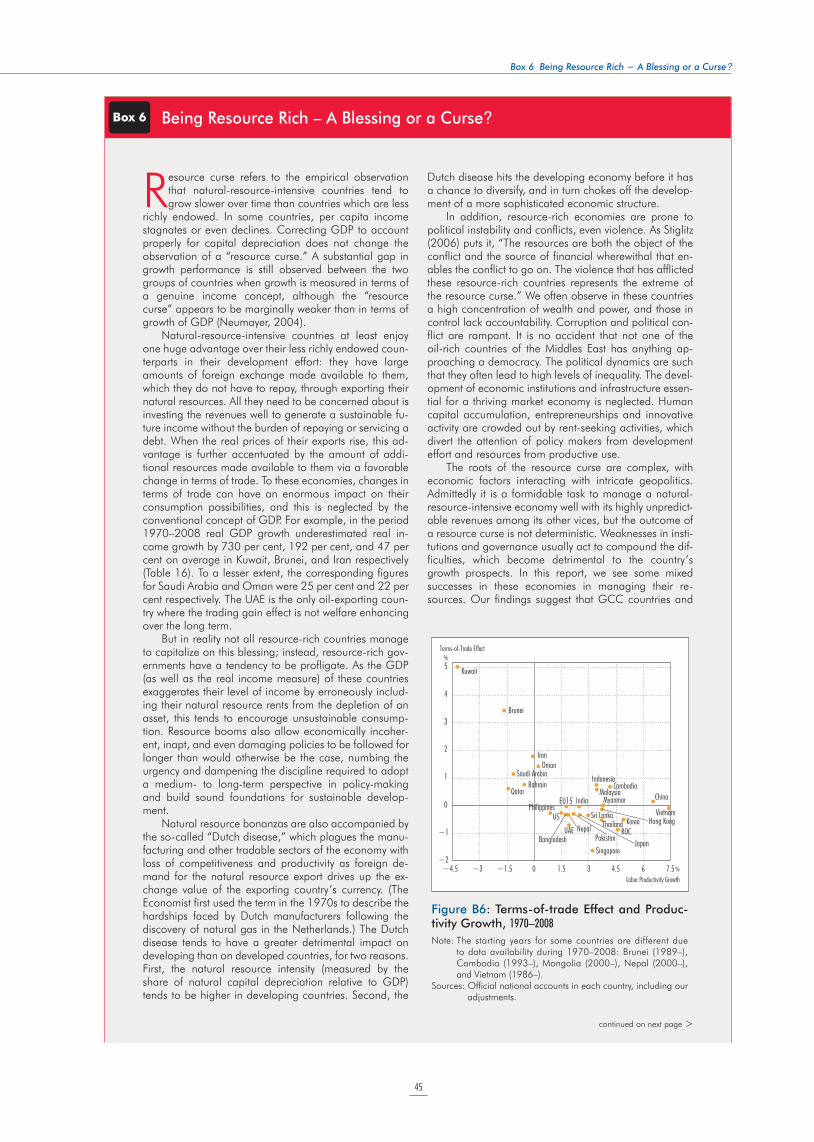
45
Resource curse refers to the empirical observation that natural-resource-intensive countries tend to grow slower over time than countries which are less
richly endowed. In some countries, per capita income stagnates or even declines. Correcting GDP to account properly for capital depreciation does not change the observation of a “resource curse.” A substantial gap in growth performance is still observed between the two groups of countries when growth is measured in terms of a genuine income concept, although the “resource curse” appears to be marginally weaker than in terms of growth of GDP (Neumayer, 2004).
Natural-resource-intensive countries at least enjoy one huge advantage over their less richly endowed coun-terparts in their development effort: they have large amounts of foreign exchange made available to them, which they do not have to repay, through exporting their natural resources. All they need to be concerned about is investing the revenues well to generate a sustainable fu-ture income without the burden of repaying or servicing a debt. When the real prices of their exports rise, this ad-vantage is further accentuated by the amount of addi-tional resources made available to them via a favorable change in terms of trade. To these economies, changes in terms of trade can have an enormous impact on their consumption possibilities, and this is neglected by the conventional concept of GDP. For example, in the period 1970–2008 real GDP growth underestimated real in-come growth by 730 per cent, 192 per cent, and 47 per cent on average in Kuwait, Brunei, and Iran respectively (Table 16). To a lesser extent, the corresponding figures for Saudi Arabia and Oman were 25 per cent and 22 per cent respectively. The UAE is the only oil-exporting coun-try where the trading gain effect is not welfare enhancing over the long term.
But in reality not all resource-rich countries manage to capitalize on this blessing; instead, resource-rich gov-ernments have a tendency to be profligate. As the GDP (as well as the real income measure) of these countries exaggerates their level of income by erroneously includ-ing their natural resource rents from the depletion of an asset, this tends to encourage unsustainable consump-tion. Resource booms also allow economically incoher-ent, inapt, and even damaging policies to be followed for longer than would otherwise be the case, numbing the urgency and dampening the discipline required to adopt a medium- to long-term perspective in policy-making and build sound foundations for sustainable develop-ment.
Natural resource bonanzas are also accompanied by the so-called “Dutch disease,” which plagues the manu-facturing and other tradable sectors of the economy with loss of competitiveness and productivity as foreign de-mand for the natural resource export drives up the ex-change value of the exporting country’s currency. (The Economist first used the term in the 1970s to describe the hardships faced by Dutch manufacturers following the discovery of natural gas in the Netherlands.) The Dutch disease tends to have a greater detrimental impact on developing than on developed countries, for two reasons. First, the natural resource intensity (measured by the share of natural capital depreciation relative to GDP) tends to be higher in developing countries. Second, the
Dutch disease hits the developing economy before it has a chance to diversify, and in turn chokes off the develop-ment of a more sophisticated economic structure.
In addition, resource-rich economies are prone to political instability and conflicts, even violence. As Stiglitz (2006) puts it, “The resources are both the object of the conflict and the source of financial wherewithal that en-ables the conflict to go on. The violence that has afflicted these resource-rich countries represents the extreme of the resource curse.” We often observe in these countries a high concentration of wealth and power, and those in control lack accountability. Corruption and political con-flict are rampant. It is no accident that not one of the oil-rich countries of the Middles East has anything ap-proaching a democracy. The political dynamics are such that they often lead to high levels of inequality. The devel-opment of economic institutions and infrastructure essen-tial for a thriving market economy is neglected. Human capital accumulation, entrepreneurships and innovative activity are crowded out by rent-seeking activities, which divert the attention of policy makers from development effort and resources from productive use.
The roots of the resource curse are complex, with economic factors interacting with intricate geopolitics. Admittedly it is a formidable task to manage a natural-resource-intensive economy well with its highly unpredict-able revenues among its other vices, but the outcome of a resource curse is not deterministic. Weaknesses in insti-tutions and governance usually act to compound the dif-ficulties, which become detrimental to the country’s growth prospects. In this report, we see some mixed successes in these economies in managing their re- sources. Our findings suggest that GCC countries and
Box 6 Being Resource Rich – A Blessing or a Curse?
Figure B6: Terms-of-trade Effect and Produc- tivity Growth, 1970–2008
Note: The starting years for some countries are different due to data availability during 1970–2008: Brunei (1989–), Cambodia (1993–), Mongolia (2000–), Nepal (2000–), and Vietnam (1986–).
Sources: Official national accounts in each country, including our adjustments.
Bangladesh
Cambodia
ROCHong Kong
India
Indonesia
Iran
Japan
Korea
Malaysia
NepalPakistan
Philippines
Singapore
Sri LankaThailand
Vietnam
China
Brunei
Myanmar
Bahrain
Kuwait
Oman
Qatar
Saudi Arabia
UAE
US
EU15
Labor Productivity Growth
Terms-of-Trade Effect
−1
−2
0
1
2
3
4
5
−4.5 −3 −1.5 0 1.5 3 4.5 6 7.5
%
%
continued on next page >
Box 6 Being Resource Rich ! A Blessing or a Curse?

4 Output Growth: The Demand-side Story
46
other oil-exporting nation still rely predominantly on the mining sector for revenues and growth, giving rise to huge economic volatility. This economic structure is prob-ably not conducive to labor productivity growth, as seen in Figure B6; the productivity performance of oil-exporting countries is the worst among all countries compared. In face of reduction in oil and gas production, some coun-tries seem to be better adapted than others. Bahrain has been successful in branching into finance, real estate and business activities, which accounted for 41 per cent of its
6.4 per cent overall growth over the period 2000–2008. Oman also sustained growth of 4.1 per cent on average a year, 76 per cent of which originated from the service sector. In contrast, Brunei has not managed as well, with dismal growth of 0.9 per cent on average a year over the same period. Historically, Brunei has been enjoying a fa-vorable terms-of-trade effect which works to counterbal-ance its less-than-impressive growth performance and its poor labor productivity growth (Figure B6).
> continued from previous page
5.1 Per Worker Measure of Labor Productivity
47
Productivity performance is crucial to a country’s future economic prospect. As the factors of inputs (labor and capital devoted to production) cannot
increase indefinitely, productivity gains, which enable an economy to produce more for the same amount of inputs, are the only route to sustain economic growth in the long run. It follows that monitoring and improving national productivity capability (the supply side of the economy) are important aspects of public policy in many countries.37
As a ratio of a volume measure of output to a volume measure of input use, productivity is simple as a notion. But when comes to applying it, we quickly realize the complexity in operationalizing this notion to suit different purposes and in a world with data limitations. Consequently we have different measures of productivity for different purposes, and different estimation approaches and definitions subject to the data used. In this report, national accounts are the basis for our productivity estimates, and in turn growth accounting with the appropriate choice of index numbers is adopted here as our estimation approach.38 We present two productivity measures in this chapter, namely labor productivity and total factor productivity (TFP).
Labor productivity can be measured in a number of ways, depending on the definitions of output and labor input measures. The preferred measure is the basic-price GDP per actual hour worked, which adjusts for different work patterns across countries and across time.39 However, total actual hours worked cannot be constructed for all the countries studied. To include all countries and define Asian country groups, therefore, the labor productivity measure in terms of GDP per worker is used in Section 5.1. To the extent that the high-performing Asian countries tend to work longer hours than the US on average, the per-worker-based labor productivity gaps probably put the Asian countries in a more favorable light than otherwise. Although being a one-factor or partial-factor productivity mea- sure, interest in labor productivity has never waned due
to its simplicity as a concept, its broad availability and its direct link to per capita GDP performance. In Section 3.3, we see how the per capita GDP gap with the US for most Asian economies is largely explained by their labor productivity shortfalls. The cross-country comparisons of labor productivity performance con- ducted in Section 5.1 are based on a definition com- patible with Sections 3.3 and 3.4, namely GDP per worker. In Section 5.2, we shift our focus to our own estimates of the alternative labor productivity measure, namely GDP per hour worked for some selected Asian countries. In Section 5.3 we include capital input as another key factor of production and present the TFP estimates for 13 Asian countries and the US, based on our estimates of capital services.
5.1 Per Worker Measure of Labor Productivity
Figure 24 presents the cross-country comparisons of labor productivity level in 2008, measured as GDP per worker. These figures are discussed, with the US level serving as the benchmark (= 100).40 Singapore and Hong Kong achieved a labor productivity level that was close to the US level, i.e. within !10 per cent that of the US. The ROC and Japan took third and fourth places among the Asian group, with productivity levels around 25 per cent below that of the US. Korea followed, with a gap of 40 per cent. Iran and Malaysia achieved productivity levels which are around 40–45 per cent of the US level. Thereafter the Asian group displayed a long tail of countries with labor productivity levels of less than 20 per cent that of the US, pulling down the average performance of the group to 16 per cent for APO20, 14 per cent for Asia23, and 11 per cent for ASEAN. Included in the long tail were China and India, with productivity levels that were 12 per cent and 8 per cent of the US level, respectively.
Table 7 presents cross-country comparisons of labor productivity levels defined by per-worker GDP in 1970,
5 Productivity: The Supply-side Story
37: For example, the UK government sets out public service agree-ments (PSAs) which outline the improvements that are expected by government expenditure. The PSAs are agreed every three years between the main government departments and the Treasury as part of the spending review process. Top of the 30 targets, PSA1 aims to “raise the productivity of the UK economy.” The EU KLEMS project, which was funded by the European Commission and ran from 2003 to 2008, was also a major ini-tiative responding to, among other things, the data demands arising from policy evaluation, especially in the assessment of the goals concerning competitiveness and economic growth poten-tial as established by the Lisbon and Barcelona summit goals.
38: The growth accounting approach is based on the microeconomic production theory and the nominal accounting balance of input and output of production. The standard model was presented by Solow (1957) and has been developed by researchers such as Zvi Griliches, Dale Jorgenson, Charles Hulten, and Erwin Diewert.
See Jorgenson and Griliches (1967) for example. Also see OECD (2001) that presents definitions, theoretical foundations, and a number of practical issues in measuring productivity.
39: GDP is valued at basic prices in this chapter, as opposed to GDP at market prices used in the previous chapters. GDP at basic prices is defined as GDP at market prices minus net indirect taxes on products. Since it reflects prices actually paid and received by the producer, it is more relevant to productivity comparisons. As most Asian countries do not provide the official estimates for GDP at basic prices in their national accounts, they are calculat-ed based on available tax data. See Box 2 for the methods em-ployed for our calculations.
40: Cross-country level productivity comparisons are notoriously dif-ficult and hence are subject to a lot of data uncertainty. Estimates should therefore be taken as indicative for broad groupings rath-er than for precise ranking.
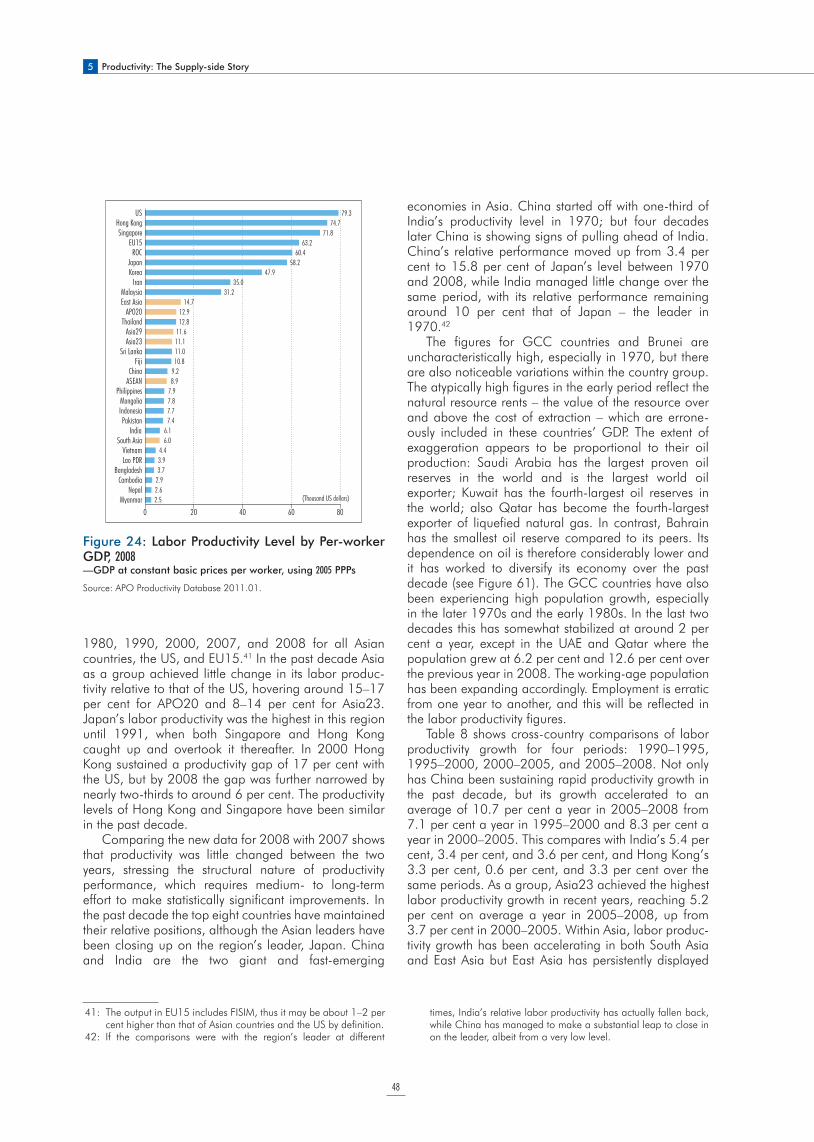
5 Productivity: The Supply-side Story
48
1980, 1990, 2000, 2007, and 2008 for all Asian countries, the US, and EU15.41 In the past decade Asia as a group achieved little change in its labor produc-tivity relative to that of the US, hovering around 15–17 per cent for APO20 and 8–14 per cent for Asia23. Japan’s labor productivity was the highest in this region until 1991, when both Singapore and Hong Kong caught up and overtook it thereafter. In 2000 Hong Kong sustained a productivity gap of 17 per cent with the US, but by 2008 the gap was further narrowed by nearly two-thirds to around 6 per cent. The productivity levels of Hong Kong and Singapore have been similar in the past decade.
Comparing the new data for 2008 with 2007 shows that productivity was little changed between the two years, stressing the structural nature of productivity performance, which requires medium- to long-term effort to make statistically significant improvements. In the past decade the top eight countries have maintained their relative positions, although the Asian leaders have been closing up on the region’s leader, Japan. China and India are the two giant and fast-emerging
economies in Asia. China started off with one-third of India’s productivity level in 1970; but four decades later China is showing signs of pulling ahead of India. China’s relative performance moved up from 3.4 per cent to 15.8 per cent of Japan’s level between 1970 and 2008, while India managed little change over the same period, with its relative performance remaining around 10 per cent that of Japan – the leader in 1970.42
The figures for GCC countries and Brunei are uncharacteristically high, especially in 1970, but there are also noticeable variations within the country group. The atypically high figures in the early period reflect the natural resource rents – the value of the resource over and above the cost of extraction – which are errone-ously included in these countries’ GDP. The extent of exaggeration appears to be proportional to their oil production: Saudi Arabia has the largest proven oil reserves in the world and is the largest world oil exporter; Kuwait has the fourth-largest oil reserves in the world; also Qatar has become the fourth-largest exporter of liquefied natural gas. In contrast, Bahrain has the smallest oil reserve compared to its peers. Its dependence on oil is therefore considerably lower and it has worked to diversify its economy over the past decade (see Figure 61). The GCC countries have also been experiencing high population growth, especially in the later 1970s and the early 1980s. In the last two decades this has somewhat stabilized at around 2 per cent a year, except in the UAE and Qatar where the population grew at 6.2 per cent and 12.6 per cent over the previous year in 2008. The working-age population has been expanding accordingly. Employment is erratic from one year to another, and this will be reflected in the labor productivity figures.
Table 8 shows cross-country comparisons of labor productivity growth for four periods: 1990–1995, 1995–2000, 2000–2005, and 2005–2008. Not only has China been sustaining rapid productivity growth in the past decade, but its growth accelerated to an average of 10.7 per cent a year in 2005–2008 from 7.1 per cent a year in 1995–2000 and 8.3 per cent a year in 2000–2005. This compares with India’s 5.4 per cent, 3.4 per cent, and 3.6 per cent, and Hong Kong’s 3.3 per cent, 0.6 per cent, and 3.3 per cent over the same periods. As a group, Asia23 achieved the highest labor productivity growth in recent years, reaching 5.2 per cent on average a year in 2005–2008, up from 3.7 per cent in 2000–2005. Within Asia, labor produc-tivity growth has been accelerating in both South Asia and East Asia but East Asia has persistently displayed
41: The output in EU15 includes FISIM, thus it may be about 1–2 per cent higher than that of Asian countries and the US by definition.
42: If the comparisons were with the region’s leader at different
times, India’s relative labor productivity has actually fallen back, while China has managed to make a substantial leap to close in on the leader, albeit from a very low level.
MyanmarNepal
CambodiaBangladesh
Lao PDRVietnam
South AsiaIndia
PakistanIndonesiaMongolia
PhilippinesASEANChina
FijiSri Lanka
Asia23Asia29
ThailandAPO20
East AsiaMalaysia
IranKoreaJapan
ROCEU15
SingaporeHong Kong
US
2.52.62.93.73.94.4
6.06.1
7.47.77.87.98.99.210.811.011.111.612.812.9
14.731.2
35.047.9
58.260.4
63.271.8
74.779.3
0 20 40 60 80
(Thousand US dollars)(Thousand US dollars)
Figure 24: Labor Productivity Level by Per-worker GDP, 2008— GDP at constant basic prices per worker, using 2005 PPPs
Source: APO Productivity Database 2011.01.
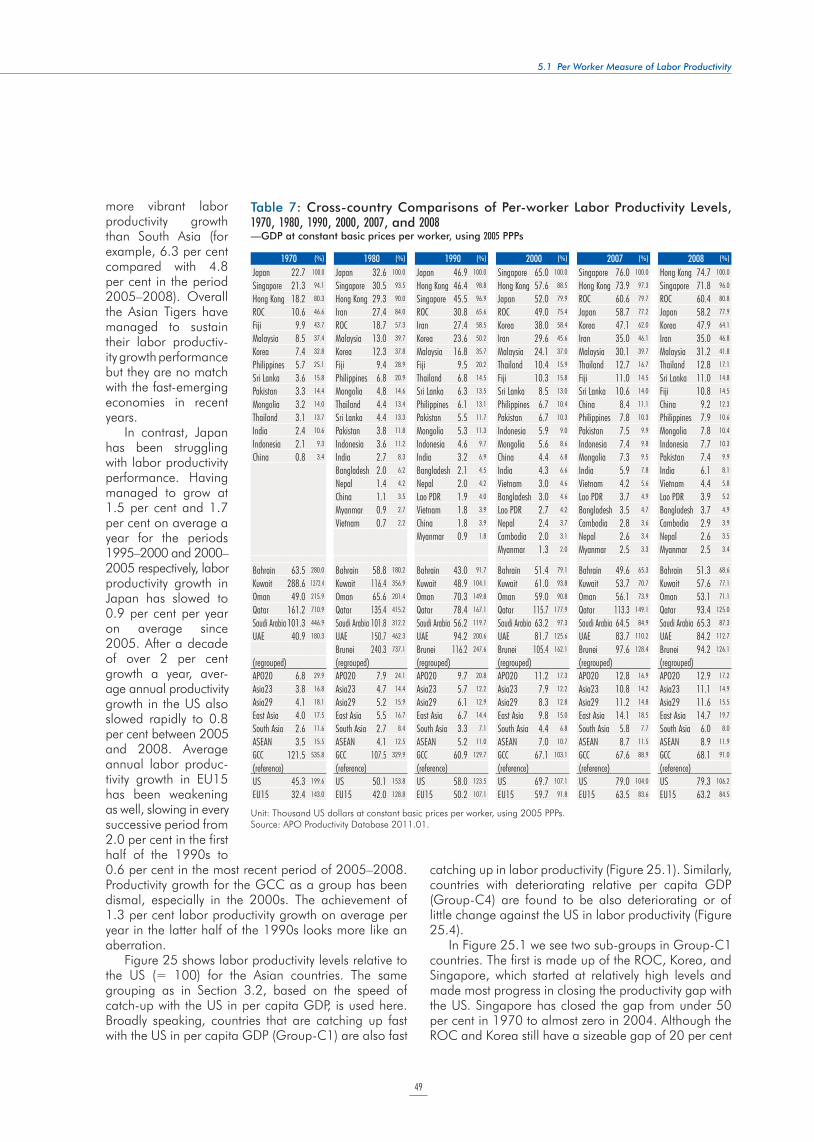
5.1 Per Worker Measure of Labor Productivity
49
more vibrant labor productivity growth than South Asia (for example, 6.3 per cent compared with 4.8 per cent in the period 2005–2008). Overall the Asian Tigers have managed to sustain their labor productiv- ity growth performance but they are no match with the fast-emerging economies in recent years.
In contrast, Japan has been struggling with labor productivity performance. Having managed to grow at 1.5 per cent and 1.7 per cent on average a year for the periods 1995–2000 and 2000–2005 respectively, labor productivity growth in Japan has slowed to 0.9 per cent per year on average since 2005. After a decade of over 2 per cent growth a year, aver- age annual productivity growth in the US also slowed rapidly to 0.8 per cent between 2005 and 2008. Average annual labor produc-tivity growth in EU15 has been weakening as well, slowing in every successive period from 2.0 per cent in the first half of the 1990s to 0.6 per cent in the most recent period of 2005–2008. Productivity growth for the GCC as a group has been dismal, especially in the 2000s. The achievement of 1.3 per cent labor productivity growth on average per year in the latter half of the 1990s looks more like an aberration.
Figure 25 shows labor productivity levels relative to the US (= 100) for the Asian countries. The same grouping as in Section 3.2, based on the speed of catch-up with the US in per capita GDP, is used here. Broadly speaking, countries that are catching up fast with the US in per capita GDP (Group-C1) are also fast
catching up in labor productivity (Figure 25.1). Similarly, countries with deteriorating relative per capita GDP (Group-C4) are found to be also deteriorating or of little change against the US in labor productivity (Figure 25.4).
In Figure 25.1 we see two sub-groups in Group-C1 countries. The first is made up of the ROC, Korea, and Singapore, which started at relatively high levels and made most progress in closing the productivity gap with the US. Singapore has closed the gap from under 50 per cent in 1970 to almost zero in 2004. Although the ROC and Korea still have a sizeable gap of 20 per cent
1970 (%) 1980 (%) 1990 (%) 2000 (%) 2007 (%) 2008 (%)
Japan 22.7 100.0 Japan 32.6 100.0 Japan 46.9 100.0 Singapore 65.0 100.0 Singapore 76.0 100.0 Hong Kong 74.7 100.0
Singapore 21.3 94.1 Singapore 30.5 93.5 Hong Kong 46.4 98.8 Hong Kong 57.6 88.5 Hong Kong 73.9 97.3 Singapore 71.8 96.0
Hong Kong 18.2 80.3 Hong Kong 29.3 90.0 Singapore 45.5 96.9 Japan 52.0 79.9 ROC 60.6 79.7 ROC 60.4 80.8
ROC 10.6 46.6 Iran 27.4 84.0 ROC 30.8 65.6 ROC 49.0 75.4 Japan 58.7 77.2 Japan 58.2 77.9
Fiji 9.9 43.7 ROC 18.7 57.3 Iran 27.4 58.5 Korea 38.0 58.4 Korea 47.1 62.0 Korea 47.9 64.1
Malaysia 8.5 37.4 Malaysia 13.0 39.7 Korea 23.6 50.2 Iran 29.6 45.6 Iran 35.0 46.1 Iran 35.0 46.8
Korea 7.4 32.8 Korea 12.3 37.8 Malaysia 16.8 35.7 Malaysia 24.1 37.0 Malaysia 30.1 39.7 Malaysia 31.2 41.8
Philippines 5.7 25.1 Fiji 9.4 28.9 Fiji 9.5 20.2 Thailand 10.4 15.9 Thailand 12.7 16.7 Thailand 12.8 17.1
Sri Lanka 3.6 15.8 Philippines 6.8 20.9 Thailand 6.8 14.5 Fiji 10.3 15.8 Fiji 11.0 14.5 Sri Lanka 11.0 14.8
Pakistan 3.3 14.4 Mongolia 4.8 14.6 Sri Lanka 6.3 13.5 Sri Lanka 8.5 13.0 Sri Lanka 10.6 14.0 Fiji 10.8 14.5
Mongolia 3.2 14.0 Thailand 4.4 13.4 Philippines 6.1 13.1 Philippines 6.7 10.4 China 8.4 11.1 China 9.2 12.3
Thailand 3.1 13.7 Sri Lanka 4.4 13.3 Pakistan 5.5 11.7 Pakistan 6.7 10.3 Philippines 7.8 10.3 Philippines 7.9 10.6
India 2.4 10.6 Pakistan 3.8 11.8 Mongolia 5.3 11.3 Indonesia 5.9 9.0 Pakistan 7.5 9.9 Mongolia 7.8 10.4
Indonesia 2.1 9.3 Indonesia 3.6 11.2 Indonesia 4.6 9.7 Mongolia 5.6 8.6 Indonesia 7.4 9.8 Indonesia 7.7 10.3
China 0.8 3.4 India 2.7 8.3 India 3.2 6.9 China 4.4 6.8 Mongolia 7.3 9.5 Pakistan 7.4 9.9
Bangladesh 2.0 6.2 Bangladesh 2.1 4.5 India 4.3 6.6 India 5.9 7.8 India 6.1 8.1
Nepal 1.4 4.2 Nepal 2.0 4.2 Vietnam 3.0 4.6 Vietnam 4.2 5.6 Vietnam 4.4 5.8
China 1.1 3.5 Lao PDR 1.9 4.0 Bangladesh 3.0 4.6 Lao PDR 3.7 4.9 Lao PDR 3.9 5.2
Myanmar 0.9 2.7 Vietnam 1.8 3.9 Lao PDR 2.7 4.2 Bangladesh 3.5 4.7 Bangladesh 3.7 4.9
Vietnam 0.7 2.2 China 1.8 3.9 Nepal 2.4 3.7 Cambodia 2.8 3.6 Cambodia 2.9 3.9
Myanmar 0.9 1.8 Cambodia 2.0 3.1 Nepal 2.6 3.4 Nepal 2.6 3.5
Myanmar 1.3 2.0 Myanmar 2.5 3.3 Myanmar 2.5 3.4
Bahrain 63.5 280.0 Bahrain 58.8 180.2 Bahrain 43.0 91.7 Bahrain 51.4 79.1 Bahrain 49.6 65.3 Bahrain 51.3 68.6
Kuwait 288.6 1272.4 Kuwait 116.4 356.9 Kuwait 48.9 104.1 Kuwait 61.0 93.8 Kuwait 53.7 70.7 Kuwait 57.6 77.1
Oman 49.0 215.9 Oman 65.6 201.4 Oman 70.3 149.8 Oman 59.0 90.8 Oman 56.1 73.9 Oman 53.1 71.1
Qatar 161.2 710.9 Qatar 135.4 415.2 Qatar 78.4 167.1 Qatar 115.7 177.9 Qatar 113.3 149.1 Qatar 93.4 125.0
Saudi Arabia 101.3 446.9 Saudi Arabia 101.8 312.2 Saudi Arabia 56.2 119.7 Saudi Arabia 63.2 97.3 Saudi Arabia 64.5 84.9 Saudi Arabia 65.3 87.3
UAE 40.9 180.3 UAE 150.7 462.3 UAE 94.2 200.6 UAE 81.7 125.6 UAE 83.7 110.2 UAE 84.2 112.7
Brunei 240.3 737.1 Brunei 116.2 247.6 Brunei 105.4 162.1 Brunei 97.6 128.4 Brunei 94.2 126.1
(regrouped) (regrouped) (regrouped) (regrouped) (regrouped) (regrouped)
APO20 6.8 29.9 APO20 7.9 24.1 APO20 9.7 20.8 APO20 11.2 17.3 APO20 12.8 16.9 APO20 12.9 17.2
Asia23 3.8 16.8 Asia23 4.7 14.4 Asia23 5.7 12.2 Asia23 7.9 12.2 Asia23 10.8 14.2 Asia23 11.1 14.9
Asia29 4.1 18.1 Asia29 5.2 15.9 Asia29 6.1 12.9 Asia29 8.3 12.8 Asia29 11.2 14.8 Asia29 11.6 15.5
East Asia 4.0 17.5 East Asia 5.5 16.7 East Asia 6.7 14.4 East Asia 9.8 15.0 East Asia 14.1 18.5 East Asia 14.7 19.7
South Asia 2.6 11.6 South Asia 2.7 8.4 South Asia 3.3 7.1 South Asia 4.4 6.8 South Asia 5.8 7.7 South Asia 6.0 8.0
ASEAN 3.5 15.5 ASEAN 4.1 12.5 ASEAN 5.2 11.0 ASEAN 7.0 10.7 ASEAN 8.7 11.5 ASEAN 8.9 11.9
GCC 121.5 535.8 GCC 107.5 329.9 GCC 60.9 129.7 GCC 67.1 103.1 GCC 67.6 88.9 GCC 68.1 91.0
(reference) (reference) (reference) (reference) (reference) (reference)
US 45.3 199.6 US 50.1 153.8 US 58.0 123.5 US 69.7 107.1 US 79.0 104.0 US 79.3 106.2
EU15 32.4 143.0 EU15 42.0 128.8 EU15 50.2 107.1 EU15 59.7 91.8 EU15 63.5 83.6 EU15 63.2 84.5
Unit: Thousand US dollars at constant basic prices per worker, using 2005 PPPs.Source: APO Productivity Database 2011.01.
Table 7: Cross-country Comparisons of Per-worker Labor Productivity Levels, 1970, 1980, 1990, 2000, 2007, and 2008—GDP at constant basic prices per worker, using 2005 PPPs
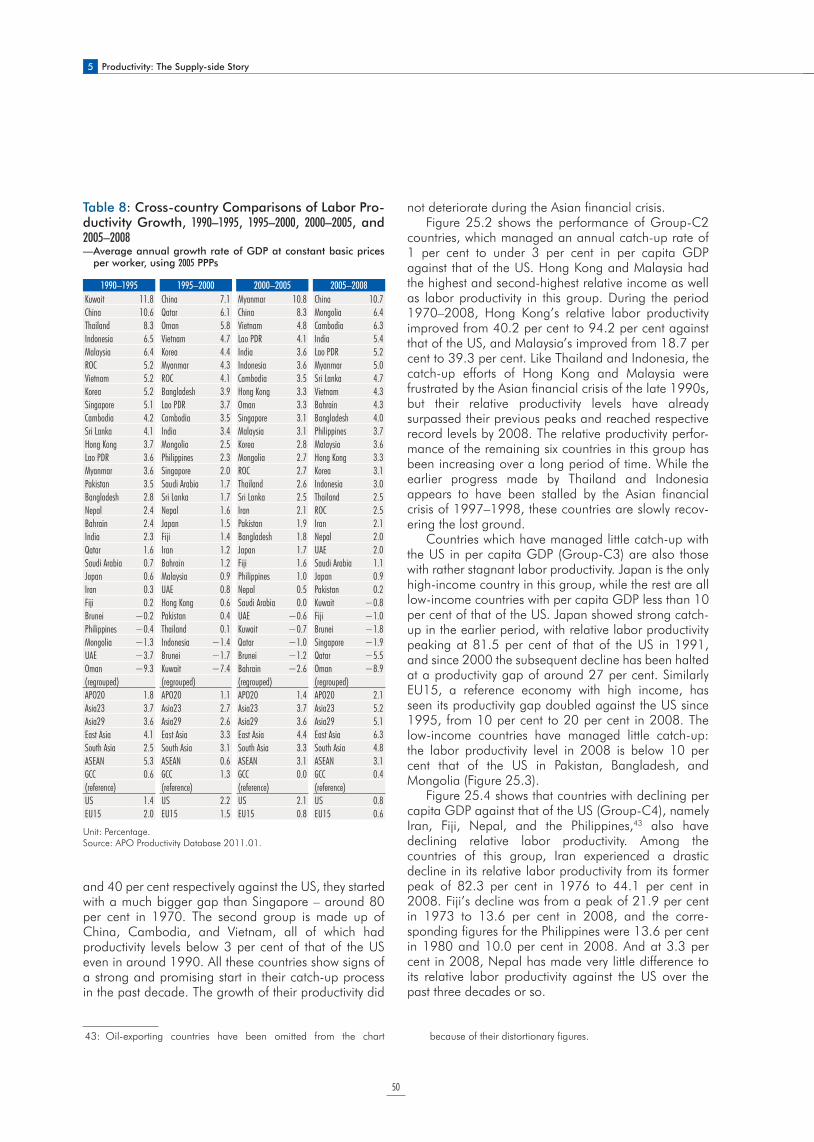
5 Productivity: The Supply-side Story
50
not deteriorate during the Asian financial crisis.Figure 25.2 shows the performance of Group-C2
countries, which managed an annual catch-up rate of 1 per cent to under 3 per cent in per capita GDP against that of the US. Hong Kong and Malaysia had the highest and second-highest relative income as well as labor productivity in this group. During the period 1970–2008, Hong Kong’s relative labor productivity improved from 40.2 per cent to 94.2 per cent against that of the US, and Malaysia’s improved from 18.7 per cent to 39.3 per cent. Like Thailand and Indonesia, the catch-up efforts of Hong Kong and Malaysia were frustrated by the Asian financial crisis of the late 1990s, but their relative productivity levels have already surpassed their previous peaks and reached respective record levels by 2008. The relative productivity perfor-mance of the remaining six countries in this group has been increasing over a long period of time. While the earlier progress made by Thailand and Indonesia appears to have been stalled by the Asian financial crisis of 1997–1998, these countries are slowly recov-ering the lost ground.
Countries which have managed little catch-up with the US in per capita GDP (Group-C3) are also those with rather stagnant labor productivity. Japan is the only high-income country in this group, while the rest are all low-income countries with per capita GDP less than 10 per cent of that of the US. Japan showed strong catch-up in the earlier period, with relative labor productivity peaking at 81.5 per cent of that of the US in 1991, and since 2000 the subsequent decline has been halted at a productivity gap of around 27 per cent. Similarly EU15, a reference economy with high income, has seen its productivity gap doubled against the US since 1995, from 10 per cent to 20 per cent in 2008. The low-income countries have managed little catch-up: the labor productivity level in 2008 is below 10 per cent that of the US in Pakistan, Bangladesh, and Mongolia (Figure 25.3).
Figure 25.4 shows that countries with declining per capita GDP against that of the US (Group-C4), namely Iran, Fiji, Nepal, and the Philippines,43 also have declining relative labor productivity. Among the countries of this group, Iran experienced a drastic decline in its relative labor productivity from its former peak of 82.3 per cent in 1976 to 44.1 per cent in 2008. Fiji’s decline was from a peak of 21.9 per cent in 1973 to 13.6 per cent in 2008, and the corre-sponding figures for the Philippines were 13.6 per cent in 1980 and 10.0 per cent in 2008. And at 3.3 per cent in 2008, Nepal has made very little difference to its relative labor productivity against the US over the past three decades or so.
43: Oil-exporting countries have been omitted from the chart because of their distortionary figures.
and 40 per cent respectively against the US, they started with a much bigger gap than Singapore – around 80 per cent in 1970. The second group is made up of China, Cambodia, and Vietnam, all of which had productivity levels below 3 per cent of that of the US even in around 1990. All these countries show signs of a strong and promising start in their catch-up process in the past decade. The growth of their productivity did
1990–1995 1995–2000 2000–2005 2005–2008
Kuwait 11.8 China 7.1 Myanmar 10.8 China 10.7
China 10.6 Qatar 6.1 China 8.3 Mongolia 6.4
Thailand 8.3 Oman 5.8 Vietnam 4.8 Cambodia 6.3
Indonesia 6.5 Vietnam 4.7 Lao PDR 4.1 India 5.4
Malaysia 6.4 Korea 4.4 India 3.6 Lao PDR 5.2
ROC 5.2 Myanmar 4.3 Indonesia 3.6 Myanmar 5.0
Vietnam 5.2 ROC 4.1 Cambodia 3.5 Sri Lanka 4.7
Korea 5.2 Bangladesh 3.9 Hong Kong 3.3 Vietnam 4.3
Singapore 5.1 Lao PDR 3.7 Oman 3.3 Bahrain 4.3
Cambodia 4.2 Cambodia 3.5 Singapore 3.1 Bangladesh 4.0
Sri Lanka 4.1 India 3.4 Malaysia 3.1 Philippines 3.7
Hong Kong 3.7 Mongolia 2.5 Korea 2.8 Malaysia 3.6
Lao PDR 3.6 Philippines 2.3 Mongolia 2.7 Hong Kong 3.3
Myanmar 3.6 Singapore 2.0 ROC 2.7 Korea 3.1
Pakistan 3.5 Saudi Arabia 1.7 Thailand 2.6 Indonesia 3.0
Bangladesh 2.8 Sri Lanka 1.7 Sri Lanka 2.5 Thailand 2.5
Nepal 2.4 Nepal 1.6 Iran 2.1 ROC 2.5
Bahrain 2.4 Japan 1.5 Pakistan 1.9 Iran 2.1
India 2.3 Fiji 1.4 Bangladesh 1.8 Nepal 2.0
Qatar 1.6 Iran 1.2 Japan 1.7 UAE 2.0
Saudi Arabia 0.7 Bahrain 1.2 Fiji 1.6 Saudi Arabia 1.1
Japan 0.6 Malaysia 0.9 Philippines 1.0 Japan 0.9
Iran 0.3 UAE 0.8 Nepal 0.5 Pakistan 0.2
Fiji 0.2 Hong Kong 0.6 Saudi Arabia 0.0 Kuwait !0.8
Brunei !0.2 Pakistan 0.4 UAE !0.6 Fiji !1.0
Philippines !0.4 Thailand 0.1 Kuwait !0.7 Brunei !1.8
Mongolia !1.3 Indonesia !1.4 Qatar !1.0 Singapore !1.9
UAE !3.7 Brunei !1.7 Brunei !1.2 Qatar !5.5
Oman !9.3 Kuwait !7.4 Bahrain !2.6 Oman !8.9
(regrouped) (regrouped) (regrouped) (regrouped)
APO20 1.8 APO20 1.1 APO20 1.4 APO20 2.1
Asia23 3.7 Asia23 2.7 Asia23 3.7 Asia23 5.2
Asia29 3.6 Asia29 2.6 Asia29 3.6 Asia29 5.1
East Asia 4.1 East Asia 3.3 East Asia 4.4 East Asia 6.3
South Asia 2.5 South Asia 3.1 South Asia 3.3 South Asia 4.8
ASEAN 5.3 ASEAN 0.6 ASEAN 3.1 ASEAN 3.1
GCC 0.6 GCC 1.3 GCC 0.0 GCC 0.4
(reference) (reference) (reference) (reference)
US 1.4 US 2.2 US 2.1 US 0.8
EU15 2.0 EU15 1.5 EU15 0.8 EU15 0.6
Unit: Percentage.Source: APO Productivity Database 2011.01.
Table 8: Cross-country Comparisons of Labor Pro-ductivity Growth, 1990–1995, 1995–2000, 2000–2005, and 2005–2008— Average annual growth rate of GDP at constant basic prices
per worker, using 2005 PPPs
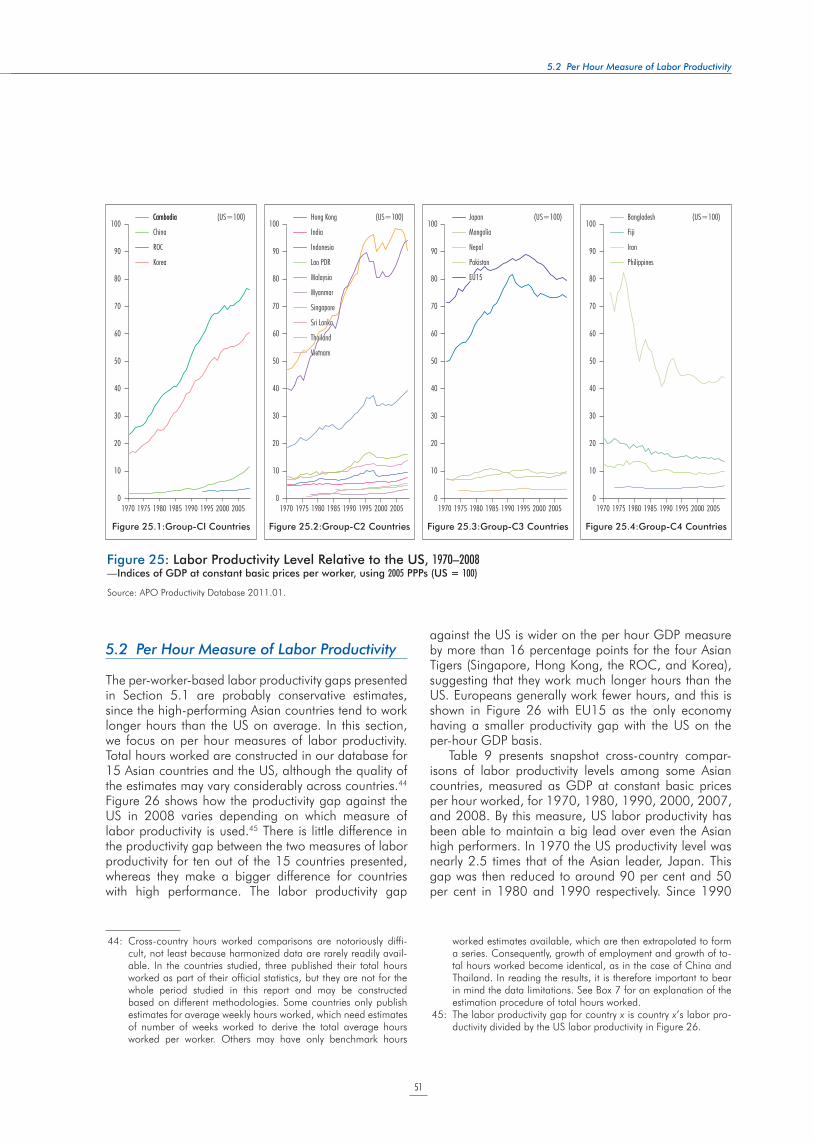
51
5.2 Per Hour Measure of Labor Productivity
5.2 Per Hour Measure of Labor Productivity
The per-worker-based labor productivity gaps presented in Section 5.1 are probably conservative estimates, since the high-performing Asian countries tend to work longer hours than the US on average. In this section, we focus on per hour measures of labor productivity. Total hours worked are constructed in our database for 15 Asian countries and the US, although the quality of the estimates may vary considerably across countries.44 Figure 26 shows how the productivity gap against the US in 2008 varies depending on which measure of labor productivity is used.45 There is little difference in the productivity gap between the two measures of labor productivity for ten out of the 15 countries presented, whereas they make a bigger difference for countries with high performance. The labor productivity gap
against the US is wider on the per hour GDP measure by more than 16 percentage points for the four Asian Tigers (Singapore, Hong Kong, the ROC, and Korea), suggesting that they work much longer hours than the US. Europeans generally work fewer hours, and this is shown in Figure 26 with EU15 as the only economy having a smaller productivity gap with the US on the per-hour GDP basis.
Table 9 presents snapshot cross-country compar-isons of labor productivity levels among some Asian countries, measured as GDP at constant basic prices per hour worked, for 1970, 1980, 1990, 2000, 2007, and 2008. By this measure, US labor productivity has been able to maintain a big lead over even the Asian high performers. In 1970 the US productivity level was nearly 2.5 times that of the Asian leader, Japan. This gap was then reduced to around 90 per cent and 50 per cent in 1980 and 1990 respectively. Since 1990
Figure 25.1:Group-CI Countries Figure 25.2:Group-C2 Countries Figure 25.3:Group-C3 Countries Figure 25.4:Group-C4 Countries
100
90
80
70
60
50
40
30
20
10
01970 1975 1980 1985 1990 1995 2000 2005 1970 1975 1980 1985 1990 1995 2000 2005 1970 1975 1980 1985 1990 1995 2000 2005 1970 1975 1980 1985 1990 1995 2000 2005
Cambodia (US=100) Hong Kong
India
Indonesia
Lao PDR
Malaysia
Myanmar
Singapore
Sri Lanka
Thailand
Vietnam
(US=100) Japan
Mongolia
Nepal
Pakistan
EU15
(US=100) Bangladesh
Fiji
Iran
Philippines
(US=100)100
90
80
70
60
50
40
30
20
10
0
100
90
80
70
60
50
40
30
20
10
0
100
90
80
70
60
50
40
30
20
10
0
Cambodia
China
ROC
Korea
Hong Kong
India
Indonesia
Lao PDR
Malaysia
Myanmar
Singapore
Sri Lanka
Thailand
Vietnam
Japan
Mongolia
Nepal
Pakistan
EU15
Figure 25: Labor Productivity Level Relative to the US, 1970–2008—Indices of GDP at constant basic prices per worker, using 2005 PPPs (US = 100)
Source: APO Productivity Database 2011.01.
44: Cross-country hours worked comparisons are notoriously diffi-cult, not least because harmonized data are rarely readily avail-able. In the countries studied, three published their total hours worked as part of their official statistics, but they are not for the whole period studied in this report and may be constructed based on different methodologies. Some countries only publish estimates for average weekly hours worked, which need estimates of number of weeks worked to derive the total average hours worked per worker. Others may have only benchmark hours
worked estimates available, which are then extrapolated to form a series. Consequently, growth of employment and growth of to-tal hours worked become identical, as in the case of China and Thailand. In reading the results, it is therefore important to bear in mind the data limitations. See Box 7 for an explanation of the estimation procedure of total hours worked.
45: The labor productivity gap for country x is country x’s labor pro-ductivity divided by the US labor productivity in Figure 26.
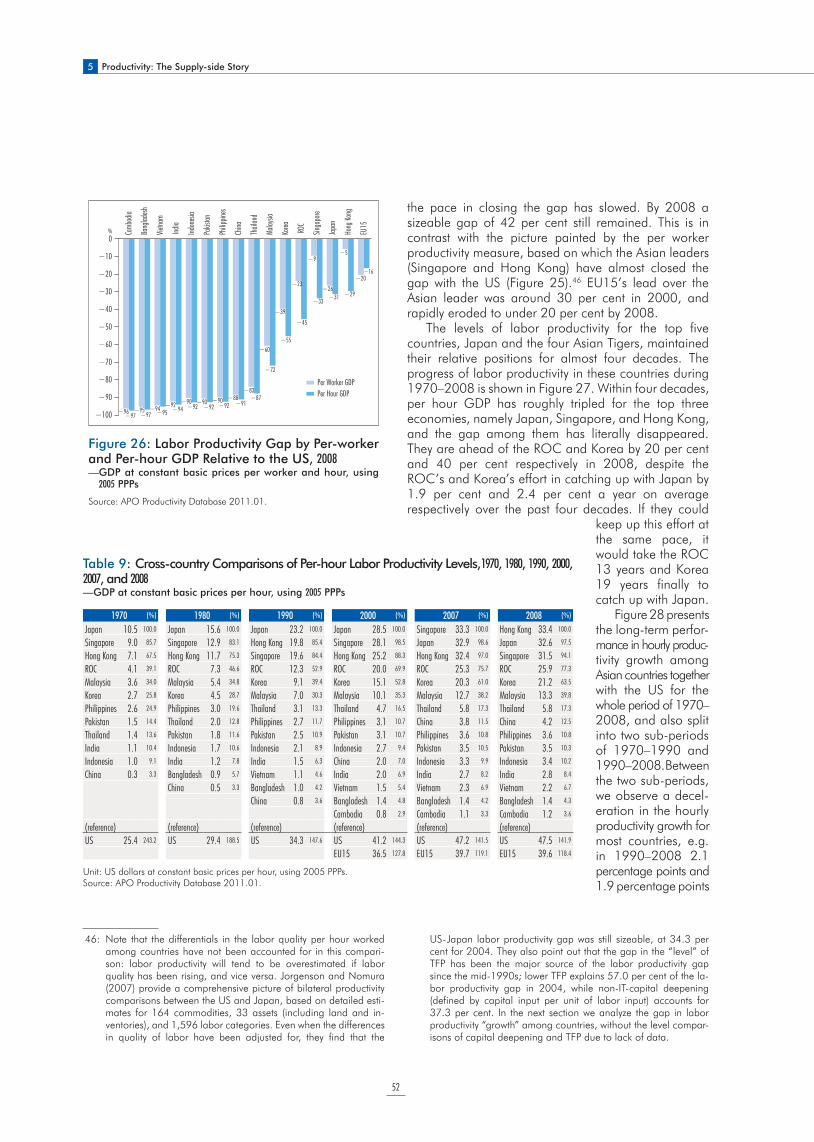
5 Productivity: The Supply-side Story
52
the pace in closing the gap has slowed. By 2008 a sizeable gap of 42 per cent still remained. This is in contrast with the picture painted by the per worker productivity measure, based on which the Asian leaders (Singapore and Hong Kong) have almost closed the gap with the US (Figure 25).46 EU15’s lead over the Asian leader was around 30 per cent in 2000, and rapidly eroded to under 20 per cent by 2008.
The levels of labor productivity for the top five countries, Japan and the four Asian Tigers, maintained their relative positions for almost four decades. The progress of labor productivity in these countries during 1970–2008 is shown in Figure 27. Within four decades, per hour GDP has roughly tripled for the top three economies, namely Japan, Singapore, and Hong Kong, and the gap among them has literally disappeared. They are ahead of the ROC and Korea by 20 per cent and 40 per cent respectively in 2008, despite the ROC’s and Korea’s effort in catching up with Japan by 1.9 per cent and 2.4 per cent a year on average respectively over the past four decades. If they could
keep up this effort at the same pace, it would take the ROC 13 years and Korea 19 years finally to catch up with Japan.
Figure 28 presents the long-term perfor-mance in hourly produc-tivity growth among Asian countries together with the US for the whole period of 1970–2008, and also split into two sub-periods of 1970–1990 and 1990–2008. Between the two sub-periods, we observe a decel-eration in the hourly productivity growth for most countries, e.g. in 1990–2008 2.1 percentage points and 1.9 percentage points
46: Note that the differentials in the labor quality per hour worked among countries have not been accounted for in this compari-son: labor productivity will tend to be overestimated if labor quality has been rising, and vice versa. Jorgenson and Nomura (2007) provide a comprehensive picture of bilateral productivity comparisons between the US and Japan, based on detailed esti-mates for 164 commodities, 33 assets (including land and in-ventories), and 1,596 labor categories. Even when the differences in quality of labor have been adjusted for, they find that the
US-Japan labor productivity gap was still sizeable, at 34.3 per cent for 2004. They also point out that the gap in the “level” of TFP has been the major source of the labor productivity gap since the mid-1990s; lower TFP explains 57.0 per cent of the la-bor productivity gap in 2004, while non-IT-capital deepening (defined by capital input per unit of labor input) accounts for 37.3 per cent. In the next section we analyze the gap in labor productivity “growth” among countries, without the level compar-isons of capital deepening and TFP due to lack of data.
1970 (%) 1980 (%) 1990 (%) 2000 (%) 2007 (%) 2008 (%)
Japan 10.5 100.0 Japan 15.6 100.0 Japan 23.2 100.0 Japan 28.5 100.0 Singapore 33.3 100.0 Hong Kong 33.4 100.0
Singapore 9.0 85.7 Singapore 12.9 83.1 Hong Kong 19.8 85.4 Singapore 28.1 98.5 Japan 32.9 98.6 Japan 32.6 97.5
Hong Kong 7.1 67.5 Hong Kong 11.7 75.3 Singapore 19.6 84.4 Hong Kong 25.2 88.3 Hong Kong 32.4 97.0 Singapore 31.5 94.1
ROC 4.1 39.1 ROC 7.3 46.6 ROC 12.3 52.9 ROC 20.0 69.9 ROC 25.3 75.7 ROC 25.9 77.3
Malaysia 3.6 34.0 Malaysia 5.4 34.8 Korea 9.1 39.4 Korea 15.1 52.8 Korea 20.3 61.0 Korea 21.2 63.5
Korea 2.7 25.8 Korea 4.5 28.7 Malaysia 7.0 30.3 Malaysia 10.1 35.3 Malaysia 12.7 38.2 Malaysia 13.3 39.8
Philippines 2.6 24.9 Philippines 3.0 19.6 Thailand 3.1 13.3 Thailand 4.7 16.5 Thailand 5.8 17.3 Thailand 5.8 17.3
Pakistan 1.5 14.4 Thailand 2.0 12.8 Philippines 2.7 11.7 Philippines 3.1 10.7 China 3.8 11.5 China 4.2 12.5
Thailand 1.4 13.6 Pakistan 1.8 11.6 Pakistan 2.5 10.9 Pakistan 3.1 10.7 Philippines 3.6 10.8 Philippines 3.6 10.8
India 1.1 10.4 Indonesia 1.7 10.6 Indonesia 2.1 8.9 Indonesia 2.7 9.4 Pakistan 3.5 10.5 Pakistan 3.5 10.3
Indonesia 1.0 9.1 India 1.2 7.8 India 1.5 6.3 China 2.0 7.0 Indonesia 3.3 9.9 Indonesia 3.4 10.2
China 0.3 3.3 Bangladesh 0.9 5.7 Vietnam 1.1 4.6 India 2.0 6.9 India 2.7 8.2 India 2.8 8.4
China 0.5 3.3 Bangladesh 1.0 4.2 Vietnam 1.5 5.4 Vietnam 2.3 6.9 Vietnam 2.2 6.7
China 0.8 3.6 Bangladesh 1.4 4.8 Bangladesh 1.4 4.2 Bangladesh 1.4 4.3
Cambodia 0.8 2.9 Cambodia 1.1 3.3 Cambodia 1.2 3.6
(reference) (reference) (reference) (reference) (reference) (reference)
US 25.4 243.2 US 29.4 188.5 US 34.3 147.6 US 41.2 144.3 US 47.2 141.5 US 47.5 141.9
EU15 36.5 127.8 EU15 39.7 119.1 EU15 39.6 118.4
Unit: US dollars at constant basic prices per hour, using 2005 PPPs.Source: APO Productivity Database 2011.01.
Table 9: Cross-country Comparisons of Per-hour Labor Productivity Levels, 1970, 1980, 1990, 2000, 2007, and 2008 —GDP at constant basic prices per hour, using 2005 PPPs
0
−10
−20
−30
−40
−50
−60
−70
−80
−90
−100 −96 −95 −94 −92 −90 −90 −90 −88−83
−60
−39
−23
−9
−26
−5
−20
−97 −97 −95 −94 −92 −92 −92 −91−87
−72
−55
−45
−33−31 −29
−16
Camb
odia
Bang
ladesh
Vietna
m
India
Indon
esia
Pakis
tan
Philip
pines
China
Thail
and
Malay
sia
Korea ROC
Singa
pore
Japan
Hong
Kong
EU15
Per Worker GDP Per Hour GDP
%
Figure 26: Labor Productivity Gap by Per-worker and Per-hour GDP Relative to the US, 2008— GDP at constant basic prices per worker and hour, using 2005 PPPs
Source: APO Productivity Database 2011.01.
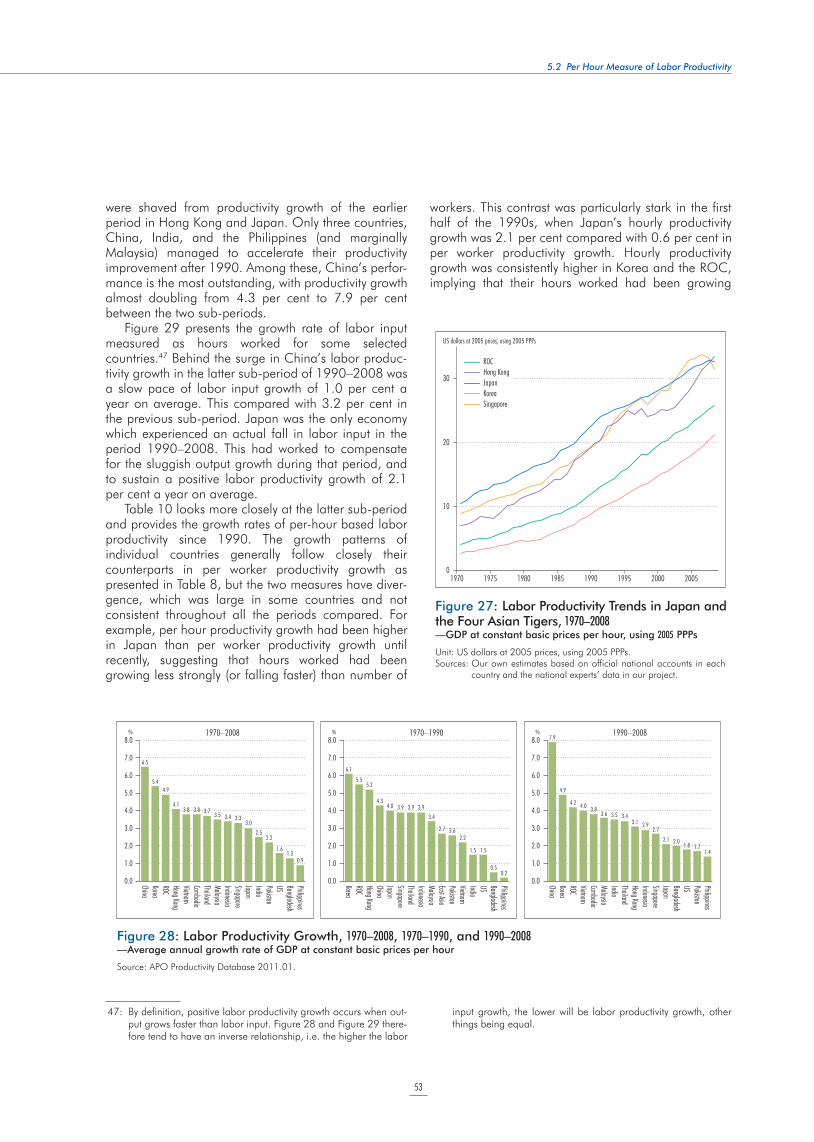
53
5.2 Per Hour Measure of Labor Productivity
were shaved from productivity growth of the earlier period in Hong Kong and Japan. Only three countries, China, India, and the Philippines (and marginally Malaysia) managed to accelerate their productivity improvement after 1990. Among these, China’s perfor-mance is the most outstanding, with productivity growth almost doubling from 4.3 per cent to 7.9 per cent between the two sub-periods.
Figure 29 presents the growth rate of labor input measured as hours worked for some selected countries.47 Behind the surge in China’s labor produc-tivity growth in the latter sub-period of 1990–2008 was a slow pace of labor input growth of 1.0 per cent a year on average. This compared with 3.2 per cent in the previous sub-period. Japan was the only economy which experienced an actual fall in labor input in the period 1990–2008. This had worked to compensate for the sluggish output growth during that period, and to sustain a positive labor productivity growth of 2.1 per cent a year on average.
Table 10 looks more closely at the latter sub-period and provides the growth rates of per-hour based labor productivity since 1990. The growth patterns of individual countries generally follow closely their counterparts in per worker productivity growth as presented in Table 8, but the two measures have diver-gence, which was large in some countries and not consistent throughout all the periods compared. For example, per hour productivity growth had been higher in Japan than per worker productivity growth until recently, suggesting that hours worked had been growing less strongly (or falling faster) than number of
workers. This contrast was particularly stark in the first half of the 1990s, when Japan’s hourly productivity growth was 2.1 per cent compared with 0.6 per cent in per worker productivity growth. Hourly productivity growth was consistently higher in Korea and the ROC, implying that their hours worked had been growing
47: By definition, positive labor productivity growth occurs when out-put grows faster than labor input. Figure 28 and Figure 29 there-fore tend to have an inverse relationship, i.e. the higher the labor
input growth, the lower will be labor productivity growth, other things being equal.
30
20
10
01970 1975 1980 1985 1990 1995 2000 2005
ROCHong KongJapanKoreaSingapore
US dollars at 2005 prices, using 2005 PPPs
Figure 27: Labor Productivity Trends in Japan and the Four Asian Tigers, 1970–2008— GDP at constant basic prices per hour, using 2005 PPPs
Unit: US dollars at 2005 prices, using 2005 PPPs.Sources: Our own estimates based on official national accounts in each
country and the national experts’ data in our project.
8.0
7.0
6.0
5.0
4.0
3.0
2.0
1.0
0.0
6.5
5.44.9
4.13.8 3.8 3.7
3.5 3.4 3.33.0
2.52.2
1.61.3
0.9
ChinaKoreaROCHong KongVietnamCambodiaThailandMalaysiaIndonesiaSingaporeJapanIndiaPakistanUS BangladeshPhilippines
1970–20087.9
4.9
4.2 4.0 3.83.6 3.5 3.4
3.1 2.92.7
2.1 2.01.8 1.7
1.4
ChinaKoreaROCVietnamCambodiaMalaysiaIndiaThailandHong KongIndonesiaSingaporeJapanBangladeshUS PakistanPhilippines
1990–2008
6.1
5.55.2
4.34.0 3.9 3.9 3.9
3.4
2.7 2.62.2
1.5 1.5
0.50.2
KoreaROCHong KongChinaJapanSingaporeThailandIndonesiaMalaysiaEast AsiaPakistanVietnamIndiaUS BangladeshPhilippines
1970–19908.0
7.0
6.0
5.0
4.0
3.0
2.0
1.0
0.0
8.0
7.0
6.0
5.0
4.0
3.0
2.0
1.0
0.0
% % %
Figure 28: Labor Productivity Growth, 1970–2008, 1970–1990, and 1990–2008—Average annual growth rate of GDP at constant basic prices per hour
Source: APO Productivity Database 2011.01.
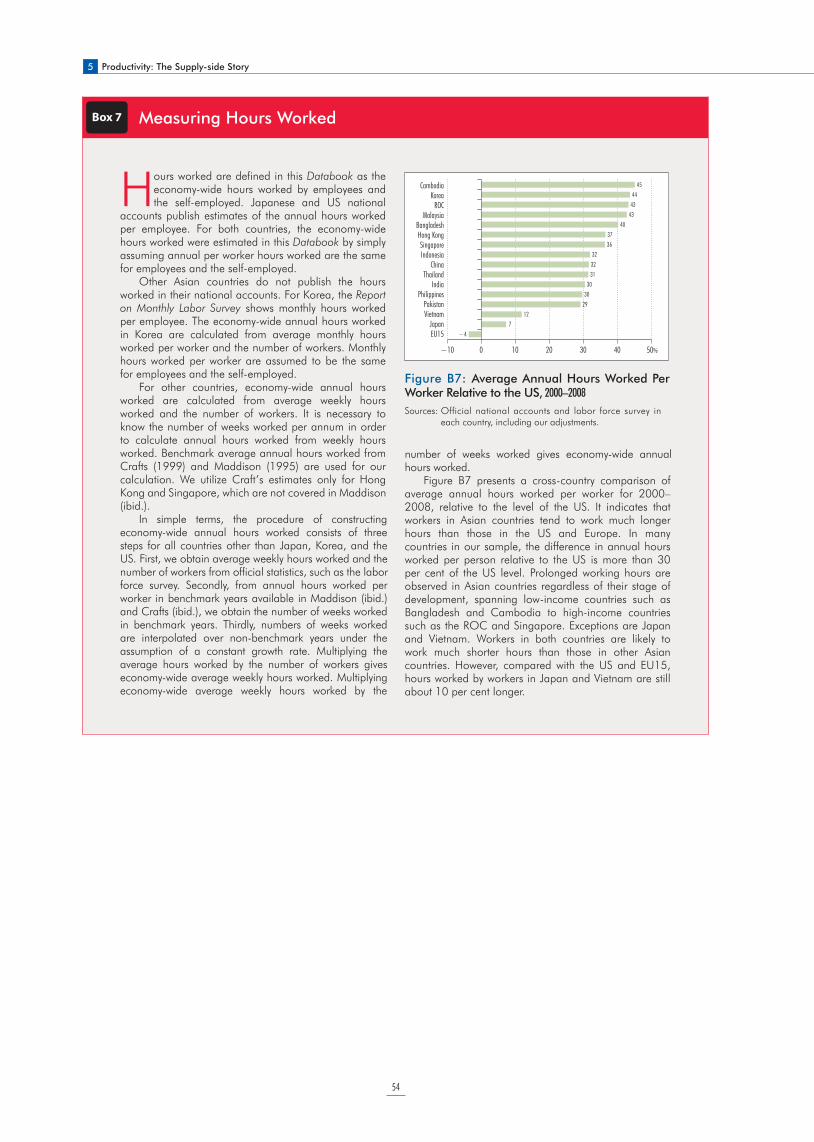
5 Productivity: The Supply-side Story
54
Box 7 Measuring Hours Worked
Hours worked are defined in this Databook as the economy-wide hours worked by employees and the self-employed. Japanese and US national
accounts publish estimates of the annual hours worked per employee. For both countries, the economy-wide hours worked were estimated in this Databook by simply assuming annual per worker hours worked are the same for employees and the self-employed.
Other Asian countries do not publish the hours worked in their national accounts. For Korea, the Report on Monthly Labor Survey shows monthly hours worked per employee. The economy-wide annual hours worked in Korea are calculated from average monthly hours worked per worker and the number of workers. Monthly hours worked per worker are assumed to be the same for employees and the self-employed.
For other countries, economy-wide annual hours worked are calculated from average weekly hours worked and the number of workers. It is necessary to know the number of weeks worked per annum in order to calculate annual hours worked from weekly hours worked. Benchmark average annual hours worked from Crafts (1999) and Maddison (1995) are used for our calculation. We utilize Craft’s estimates only for Hong Kong and Singapore, which are not covered in Maddison (ibid.).
In simple terms, the procedure of constructing economy-wide annual hours worked consists of three steps for all countries other than Japan, Korea, and the US. First, we obtain average weekly hours worked and the number of workers from official statistics, such as the labor force survey. Secondly, from annual hours worked per worker in benchmark years available in Maddison (ibid.) and Crafts (ibid.), we obtain the number of weeks worked in benchmark years. Thirdly, numbers of weeks worked are interpolated over non-benchmark years under the assumption of a constant growth rate. Multiplying the average hours worked by the number of workers gives economy-wide average weekly hours worked. Multiplying economy-wide average weekly hours worked by the
number of weeks worked gives economy-wide annual hours worked.
Figure B7 presents a cross-country comparison of average annual hours worked per worker for 2000–2008, relative to the level of the US. It indicates that workers in Asian countries tend to work much longer hours than those in the US and Europe. In many countries in our sample, the difference in annual hours worked per person relative to the US is more than 30 per cent of the US level. Prolonged working hours are observed in Asian countries regardless of their stage of development, spanning low-income countries such as Bangladesh and Cambodia to high-income countries such as the ROC and Singapore. Exceptions are Japan and Vietnam. Workers in both countries are likely to work much shorter hours than those in other Asian countries. However, compared with the US and EU15, hours worked by workers in Japan and Vietnam are still about 10 per cent longer.
Figure B7: Average Annual Hours Worked Per Worker Relative to the US, 2000–2008
−47
122930
30313232
3637
40434344
45
−10 0 10 20 30 40 50%
CambodiaKorea
ROCMalaysia
BangladeshHong KongSingaporeIndonesia
ChinaThailand
IndiaPhilippines
PakistanVietnam
JapanEU15
Sources: Official national accounts and labor force survey in each country, including our adjustments.
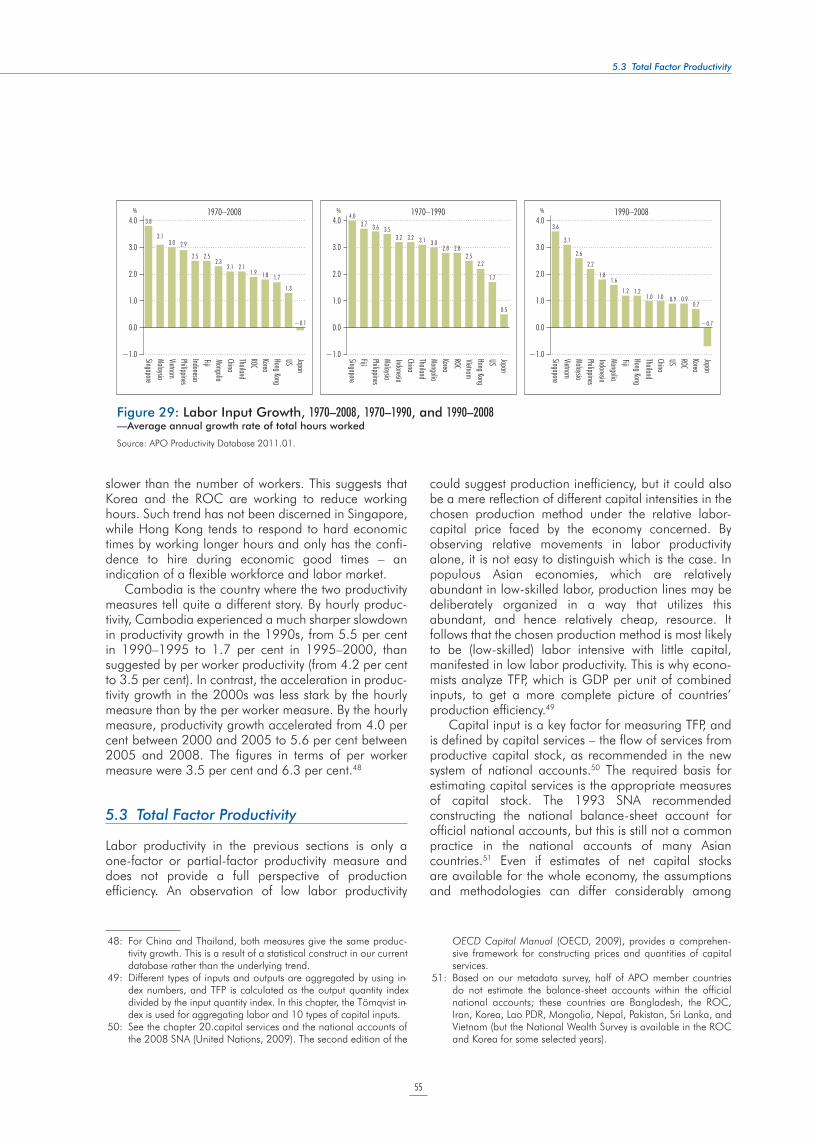
55
5.3 Total Factor Productivity
slower than the number of workers. This suggests that Korea and the ROC are working to reduce working hours. Such trend has not been discerned in Singapore, while Hong Kong tends to respond to hard economic times by working longer hours and only has the confi-dence to hire during economic good times – an indication of a flexible workforce and labor market.
Cambodia is the country where the two productivity measures tell quite a different story. By hourly produc-tivity, Cambodia experienced a much sharper slowdown in productivity growth in the 1990s, from 5.5 per cent in 1990–1995 to 1.7 per cent in 1995–2000, than suggested by per worker productivity (from 4.2 per cent to 3.5 per cent). In contrast, the acceleration in produc-tivity growth in the 2000s was less stark by the hourly measure than by the per worker measure. By the hourly measure, productivity growth accelerated from 4.0 per cent between 2000 and 2005 to 5.6 per cent between 2005 and 2008. The figures in terms of per worker measure were 3.5 per cent and 6.3 per cent.48
5.3 Total Factor Productivity
Labor productivity in the previous sections is only a one-factor or partial-factor productivity measure and does not provide a full perspective of production efficiency. An observation of low labor productivity
could suggest production inefficiency, but it could also be a mere reflection of different capital intensities in the chosen production method under the relative labor-capital price faced by the economy concerned. By observing relative movements in labor productivity alone, it is not easy to distinguish which is the case. In populous Asian economies, which are relatively abundant in low-skilled labor, production lines may be deliberately organized in a way that utilizes this abundant, and hence relatively cheap, resource. It follows that the chosen production method is most likely to be (low-skilled) labor intensive with little capital, manifested in low labor productivity. This is why econo-mists analyze TFP, which is GDP per unit of combined inputs, to get a more complete picture of countries’ production efficiency.49
Capital input is a key factor for measuring TFP, and is defined by capital services – the flow of services from productive capital stock, as recommended in the new system of national accounts.50 The required basis for estimating capital services is the appropriate measures of capital stock. The 1993 SNA recommended constructing the national balance-sheet account for official national accounts, but this is still not a common practice in the national accounts of many Asian countries.51 Even if estimates of net capital stocks are available for the whole economy, the assumptions and methodologies can differ considerably among
4.0
3.0
2.0
1.0
0.0
−1.0
4.0
3.0
2.0
1.0
0.0
−1.0
4.0
3.0
2.0
1.0
0.0
−1.0
% % %
3.8
3.13.0 2.9
2.5 2.52.3
2.1 2.11.9 1.8 1.7
1.3
−0.1
SingaporeMalaysia
PhilippinesVietnam
IndonesiaFijiMongoliaChinaThailandROCKoreaHong KongUS Japan
1970–20083.6
3.1
2.6
2.2
1.81.6
1.2 1.21.0 1.0 0.9 0.9
0.7
−0.7
SingaporeVietnam
MongoliaIndonesia
MalaysiaPhilippines
FijiHong KongThailandChinaUS ROCKoreaJapan
1990–20084.0
3.63.73.5
3.2 3.2 3.1 3.02.8 2.8
2.52.2
1.7
0.5
Singapore
PhilippinesFiji
MalaysiaIndonesiaChinaThailandMongoliaKoreaROCVietnamHong KongUS Japan
1970–1990
Figure 29: Labor Input Growth, 1970–2008, 1970–1990, and 1990–2008—Average annual growth rate of total hours worked
Source: APO Productivity Database 2011.01.
48: For China and Thailand, both measures give the same produc-tivity growth. This is a result of a statistical construct in our current database rather than the underlying trend.
49: Different types of inputs and outputs are aggregated by using in-dex numbers, and TFP is calculated as the output quantity index divided by the input quantity index. In this chapter, the Törnqvist in-dex is used for aggregating labor and 10 types of capital inputs.
50: See the chapter 20.capital services and the national accounts of the 2008 SNA (United Nations, 2009). The second edition of the
OECD Capital Manual (OECD, 2009), provides a comprehen-sive framework for constructing prices and quantities of capital services.
51: Based on our metadata survey, half of APO member countries do not estimate the balance-sheet accounts within the official national accounts; these countries are Bangladesh, the ROC, Iran, Korea, Lao PDR, Mongolia, Nepal, Pakistan, Sri Lanka, and Vietnam (but the National Wealth Survey is available in the ROC and Korea for some selected years).
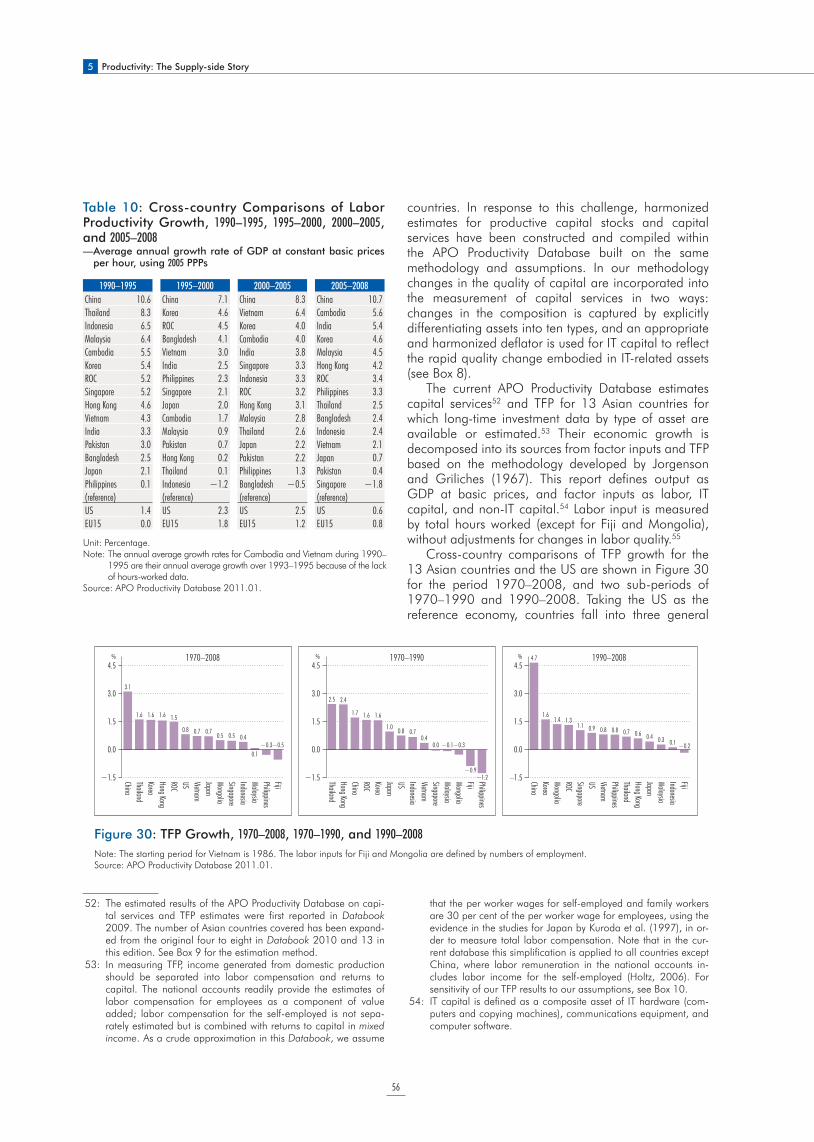
5 Productivity: The Supply-side Story
56
countries. In response to this challenge, harmonized estimates for productive capital stocks and capital services have been constructed and compiled within the APO Productivity Database built on the same methodology and assumptions. In our methodology changes in the quality of capital are incorporated into the measurement of capital services in two ways: changes in the composition is captured by explicitly differentiating assets into ten types, and an appropriate and harmonized deflator is used for IT capital to reflect the rapid quality change embodied in IT-related assets (see Box 8).
The current APO Productivity Database estimates capital services52 and TFP for 13 Asian countries for which long-time investment data by type of asset are available or estimated.53 Their economic growth is decomposed into its sources from factor inputs and TFP based on the methodology developed by Jorgenson and Griliches (1967). This report defines output as GDP at basic prices, and factor inputs as labor, IT capital, and non-IT capital.54 Labor input is measured by total hours worked (except for Fiji and Mongolia), without adjustments for changes in labor quality.55
Cross-country comparisons of TFP growth for the 13 Asian countries and the US are shown in Figure 30 for the period 1970–2008, and two sub-periods of 1970–1990 and 1990–2008. Taking the US as the reference economy, countries fall into three general
52: The estimated results of the APO Productivity Database on capi-tal services and TFP estimates were first reported in Databook 2009. The number of Asian countries covered has been expand-ed from the original four to eight in Databook 2010 and 13 in this edition. See Box 9 for the estimation method.
53: In measuring TFP, income generated from domestic production should be separated into labor compensation and returns to capital. The national accounts readily provide the estimates of labor compensation for employees as a component of value added; labor compensation for the self-employed is not sepa-rately estimated but is combined with returns to capital in mixed income. As a crude approximation in this Databook, we assume
that the per worker wages for self-employed and family workers are 30 per cent of the per worker wage for employees, using the evidence in the studies for Japan by Kuroda et al. (1997), in or-der to measure total labor compensation. Note that in the cur-rent database this simplification is applied to all countries except China, where labor remuneration in the national accounts in-cludes labor income for the self-employed (Holtz, 2006). For sensitivity of our TFP results to our assumptions, see Box 10.
54: IT capital is defined as a composite asset of IT hardware (com-puters and copying machines), communications equipment, and computer software.
1990–1995 1995–2000 2000–2005 2005–2008
China 10.6 China 7.1 China 8.3 China 10.7
Thailand 8.3 Korea 4.6 Vietnam 6.4 Cambodia 5.6
Indonesia 6.5 ROC 4.5 Korea 4.0 India 5.4
Malaysia 6.4 Bangladesh 4.1 Cambodia 4.0 Korea 4.6
Cambodia 5.5 Vietnam 3.0 India 3.8 Malaysia 4.5
Korea 5.4 India 2.5 Singapore 3.3 Hong Kong 4.2
ROC 5.2 Philippines 2.3 Indonesia 3.3 ROC 3.4
Singapore 5.2 Singapore 2.1 ROC 3.2 Philippines 3.3
Hong Kong 4.6 Japan 2.0 Hong Kong 3.1 Thailand 2.5
Vietnam 4.3 Cambodia 1.7 Malaysia 2.8 Bangladesh 2.4
India 3.3 Malaysia 0.9 Thailand 2.6 Indonesia 2.4
Pakistan 3.0 Pakistan 0.7 Japan 2.2 Vietnam 2.1
Bangladesh 2.5 Hong Kong 0.2 Pakistan 2.2 Japan 0.7
Japan 2.1 Thailand 0.1 Philippines 1.3 Pakistan 0.4
Philippines 0.1 Indonesia !1.2 Bangladesh !0.5 Singapore !1.8
(reference) (reference) (reference) (reference)
US 1.4 US 2.3 US 2.5 US 0.6
EU15 0.0 EU15 1.8 EU15 1.2 EU15 0.8
Unit: Percentage.Note: The annual average growth rates for Cambodia and Vietnam during 1990–
1995 are their annual average growth over 1993–1995 because of the lack of hours-worked data.
Source: APO Productivity Database 2011.01.
Table 10: Cross-country Comparisons of Labor Productivity Growth, 1990–1995, 1995–2000, 2000–2005, and 2005–2008— Average annual growth rate of GDP at constant basic prices
per hour, using 2005 PPPs
4.5
3.0
1.5
0.0
−1.5
%4.5
3.0
1.5
0.0
−1.5
%4.5
3.0
1.5
0.0
–1.5
%
3.1
1.6 1.6 1.6 1.5
0.8 0.7 0.70.5 0.5 0.4
0.1−0.3−0.5
1970–2008 4.7
1.61.4 1.3
1.1 0.9 0.8 0.8 0.7 0.6 0.4 0.3 0.1 −0.2
1990–2008
ChinaThailandKoreaHong Kong ROCUS Vietnam JapanMongoliaSingaporeIndonesiaMalaysiaPhilippinesFiji
ChinaKoreaMongoliaROCSingaporeUS Vietnam PhilippinesThailandHong Kong JapanMalaysiaIndonesiaFiji
ThailandHong Kong ChinaROCKoreaJapanUS IndonesiaVietnam SingaporeMalaysiaMongoliaFijiPhilippines
2.5 2.4
1.7 1.6 1.6
1.0 0.8 0.70.4
0.0 −0.1−0.3
−0.9−1.2
1970–1990
Figure 30: TFP Growth, 1970–2008, 1970–1990, and 1990–2008
Note: The starting period for Vietnam is 1986. The labor inputs for Fiji and Mongolia are defined by numbers of employment.Source: APO Productivity Database 2011.01.
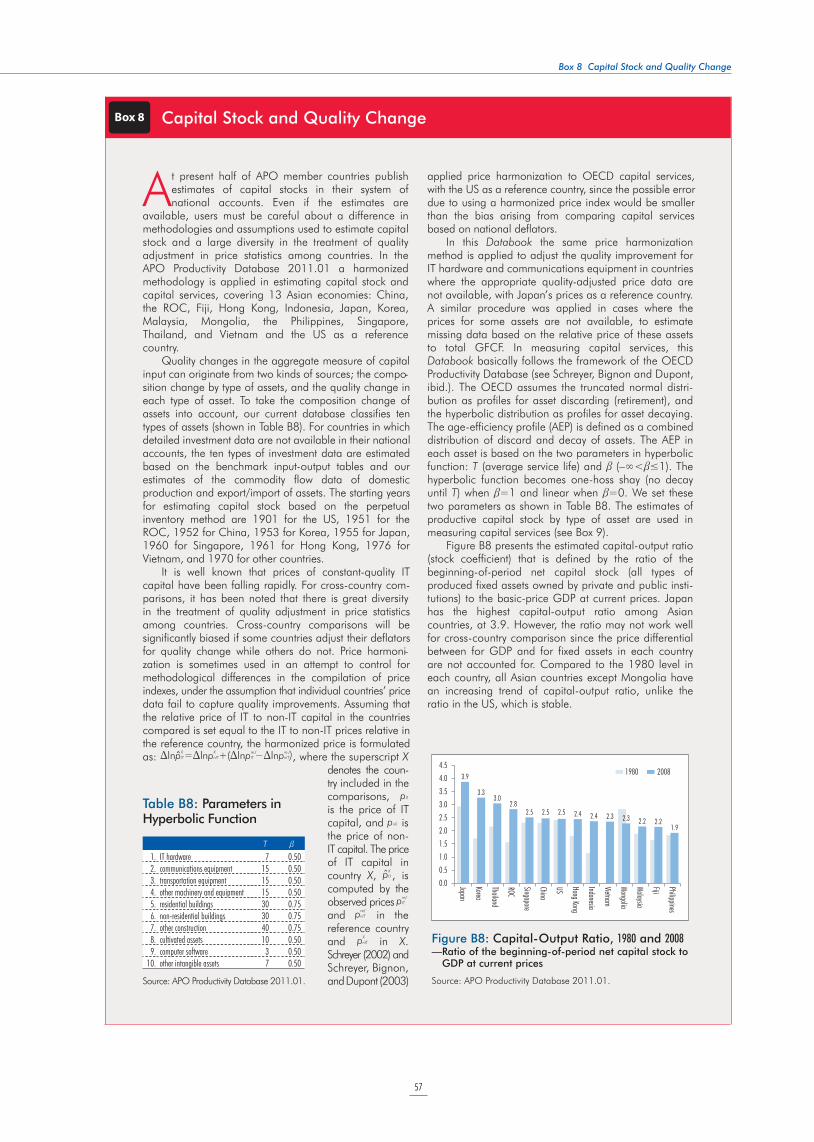
57
Box 8 Capital Stock and Quality Change
At present half of APO member countries publish estimates of capital stocks in their system of national accounts. Even if the estimates are
available, users must be careful about a difference in methodologies and assumptions used to estimate capital stock and a large diversity in the treatment of quality adjustment in price statistics among countries. In the APO Productivity Database 2011.01 a harmonized methodology is applied in estimating capital stock and capital services, covering 13 Asian economies: China, the ROC, Fiji, Hong Kong, Indonesia, Japan, Korea, Malaysia, Mongolia, the Philippines, Singapore, Thailand, and Vietnam and the US as a reference country.
Quality changes in the aggregate measure of capital input can originate from two kinds of sources; the compo-sition change by type of assets, and the quality change in each type of asset. To take the composition change of assets into account, our current database classifies ten types of assets (shown in Table B8). For countries in which detailed investment data are not available in their national accounts, the ten types of investment data are estimated based on the benchmark input-output tables and our estimates of the commodity flow data of domestic production and export/import of assets. The starting years for estimating capital stock based on the perpetual inventory method are 1901 for the US, 1951 for the ROC, 1952 for China, 1953 for Korea, 1955 for Japan, 1960 for Singapore, 1961 for Hong Kong, 1976 for Vietnam, and 1970 for other countries.
It is well known that prices of constant-quality IT capital have been falling rapidly. For cross-country com- parisons, it has been noted that there is great diversity in the treatment of quality adjustment in price statistics among countries. Cross-country comparisons will be significantly biased if some countries adjust their deflators for quality change while others do not. Price harmoni-zation is sometimes used in an attempt to control for methodological differences in the compilation of price indexes, under the assumption that individual countries’ price data fail to capture quality improvements. Assuming that the relative price of IT to non-IT capital in the countries compared is set equal to the IT to non-IT prices relative in the reference country, the harmonized price is formulated as: DlnpX
IT=DlnpXnIT+(Dlnpre
IT −DlnprenIT), where the superscript X
denotes the coun- try included in the comparisons, pIT is the price of IT capital, and pnIT is the price of non-IT capital. The price of IT capital in country X, pX
IT, is computed by the observed prices p
reIT
and pre!nIT in the
reference country and pX
nIT in X. Schreyer (2002) and Schreyer, Bignon, and Dupont (2003)
applied price harmonization to OECD capital services, with the US as a reference country, since the possible error due to using a harmonized price index would be smaller than the bias arising from comparing capital services based on national deflators.
In this Databook the same price harmonization method is applied to adjust the quality improvement for IT hardware and communications equipment in countries where the appropriate quality-adjusted price data are not available, with Japan’s prices as a reference country. A similar procedure was applied in cases where the prices for some assets are not available, to estimate missing data based on the relative price of these assets to total GFCF. In measuring capital services, this Databook basically follows the framework of the OECD Productivity Database (see Schreyer, Bignon and Dupont, ibid.). The OECD assumes the truncated normal distri-bution as profiles for asset discarding (retirement), and the hyperbolic distribution as profiles for asset decaying. The age-efficiency profile (AEP) is defined as a combined distribution of discard and decay of assets. The AEP in each asset is based on the two parameters in hyperbolic function: T (average service life) and b (–!<b"1). The hyperbolic function becomes one-hoss shay (no decay until T) when b=1 and linear when b=0. We set these two parameters as shown in Table B8. The estimates of productive capital stock by type of asset are used in measuring capital services (see Box 9).
Figure B8 presents the estimated capital-output ratio (stock coefficient) that is defined by the ratio of the beginning-of-period net capital stock (all types of produced fixed assets owned by private and public insti-tutions) to the basic-price GDP at current prices. Japan has the highest capital-output ratio among Asian countries, at 3.9. However, the ratio may not work well for cross-country comparison since the price differential between for GDP and for fixed assets in each country are not accounted for. Compared to the 1980 level in each country, all Asian countries except Mongolia have an increasing trend of capital-output ratio, unlike the ratio in the US, which is stable.
T b
1. IT hardware 7 0.50
2. communications equipment 15 0.50
3. transportation equipment 15 0.50
4. other machinery and equipment 15 0.50
5. residential buildings 30 0.75
6. non-residential buildings 30 0.75
7. other construction 40 0.75
8. cultivated assets 10 0.50
9. computer software 3 0.50
10. other intangible assets 7 0.50
Source: APO Productivity Database 2011.01.
Table B8: Parameters in Hyperbolic Function
Figure B8: Capital-Output Ratio, 1980 and 2008— Ratio of the beginning-of-period net capital stock to
GDP at current prices
4.54.03.53.02.52.01.51.00.50.0
3.9
3.33.0
2.82.5 2.5 2.5 2.4 2.4 2.3 2.3 2.2 2.2
1.9
Japan
Korea
Thailand
ROC
Singapore
China
US Hong Kong
Indonesia
Vietnam
Mongolia
Malaysia
Fiji
Philippines
1980 2008
Source: APO Productivity Database 2011.01.
Box 8 Capital Stock and Quality Change
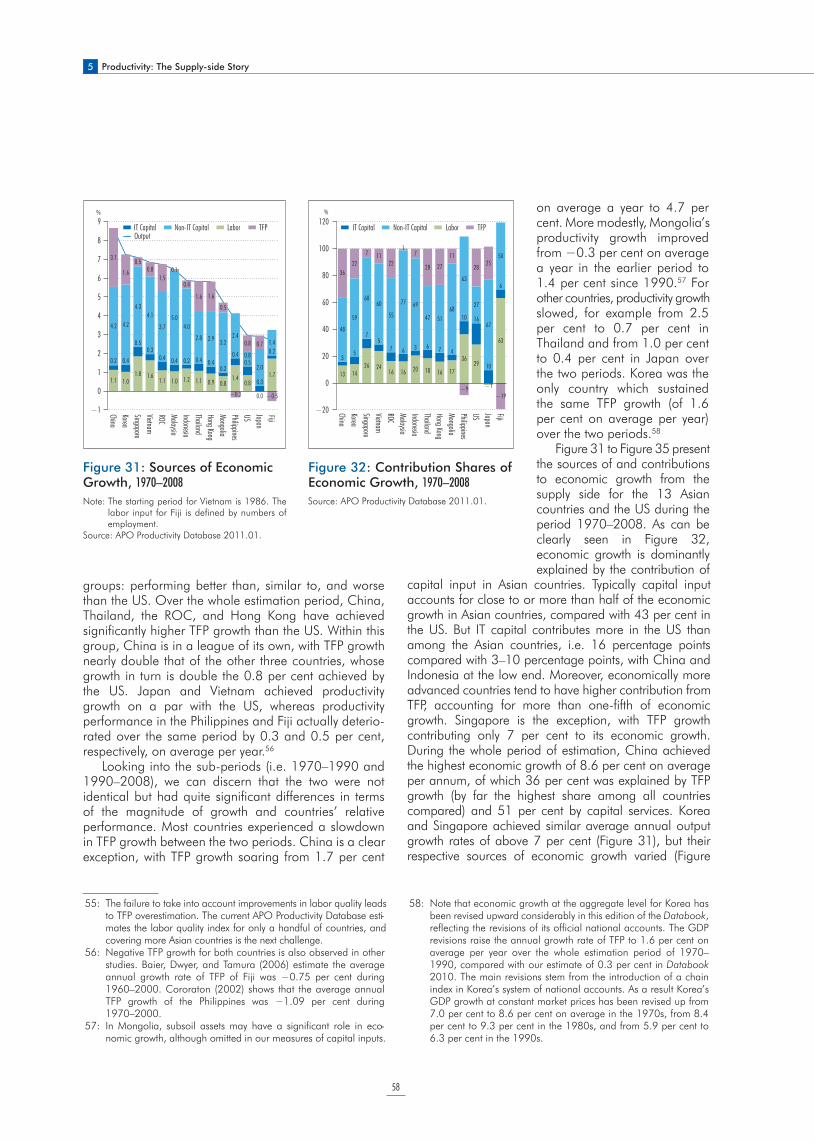
5 Productivity: The Supply-side Story
58
groups: performing better than, similar to, and worse than the US. Over the whole estimation period, China, Thailand, the ROC, and Hong Kong have achieved significantly higher TFP growth than the US. Within this group, China is in a league of its own, with TFP growth nearly double that of the other three countries, whose growth in turn is double the 0.8 per cent achieved by the US. Japan and Vietnam achieved productivity growth on a par with the US, whereas productivity performance in the Philippines and Fiji actually deterio-rated over the same period by 0.3 and 0.5 per cent, respectively, on average per year.56
Looking into the sub-periods (i.e. 1970–1990 and 1990–2008), we can discern that the two were not identical but had quite significant differences in terms of the magnitude of growth and countries’ relative performance. Most countries experienced a slowdown in TFP growth between the two periods. China is a clear exception, with TFP growth soaring from 1.7 per cent
on average a year to 4.7 per cent. More modestly, Mongolia’s productivity growth improved from !0.3 per cent on average a year in the earlier period to 1.4 per cent since 1990.57 For other countries, productivity growth slowed, for example from 2.5 per cent to 0.7 per cent in Thailand and from 1.0 per cent to 0.4 per cent in Japan over the two periods. Korea was the only country which sustained the same TFP growth (of 1.6 per cent on average per year) over the two periods.58
Figure 31 to Figure 35 present the sources of and contributions to economic growth from the supply side for the 13 Asian countries and the US during the period 1970–2008. As can be clearly seen in Figure 32, economic growth is dominantly explained by the contribution of
capital input in Asian countries. Typically capital input accounts for close to or more than half of the economic growth in Asian countries, compared with 43 per cent in the US. But IT capital contributes more in the US than among the Asian countries, i.e. 16 percentage points compared with 3–10 percentage points, with China and Indonesia at the low end. Moreover, economically more advanced countries tend to have higher contribution from TFP, accounting for more than one-fifth of economic growth. Singapore is the exception, with TFP growth contributing only 7 per cent to its economic growth. During the whole period of estimation, China achieved the highest economic growth of 8.6 per cent on average per annum, of which 36 per cent was explained by TFP growth (by far the highest share among all countries compared) and 51 per cent by capital services. Korea and Singapore achieved similar average annual output growth rates of above 7 per cent (Figure 31), but their respective sources of economic growth varied (Figure
55: The failure to take into account improvements in labor quality leads to TFP overestimation. The current APO Productivity Database esti-mates the labor quality index for only a handful of countries, and covering more Asian countries is the next challenge.
56: Negative TFP growth for both countries is also observed in other studies. Baier, Dwyer, and Tamura (2006) estimate the average annual growth rate of TFP of Fiji was !0.75 per cent during 1960–2000. Cororaton (2002) shows that the average annual TFP growth of the Philippines was !1.09 per cent during 1970–2000.
57: In Mongolia, subsoil assets may have a significant role in eco-nomic growth, although omitted in our measures of capital inputs.
58: Note that economic growth at the aggregate level for Korea has been revised upward considerably in this edition of the Databook, reflecting the revisions of its official national accounts. The GDP revisions raise the annual growth rate of TFP to 1.6 per cent on average per year over the whole estimation period of 1970–1990, compared with our estimate of 0.3 per cent in Databook 2010. The main revisions stem from the introduction of a chain index in Korea’s system of national accounts. As a result Korea’s GDP growth at constant market prices has been revised up from 7.0 per cent to 8.6 per cent on average in the 1970s, from 8.4 per cent to 9.3 per cent in the 1980s, and from 5.9 per cent to 6.3 per cent in the 1990s.
Figure 31: Sources of Economic Growth, 1970–2008
Note: The starting period for Vietnam is 1986. The labor input for Fiji is defined by numbers of employment.
Source: APO Productivity Database 2011.01.
Figure 32: Contribution Shares of Economic Growth, 1970–2008
Source: APO Productivity Database 2011.01.
9
8
7
6
5
4
3
2
1
0
−1
%
1.1 1.01.8 1.6
1.1 1.0 1.2 1.1 0.9 0.81.4
0.8
0.0
1.7
0.2 0.4
0.50.3
0.4 0.4 0.2 0.4 0.40.2
0.40.5
0.3
0.2
4.2 4.2
4.34.1
3.75.0
4.0
2.8 2.9 3.22.4
0.8
2.0
1.4
3.1
1.6
0.50.8
1.50.1
0.4
1.6 1.6
0.5
−0.3
0.8 0.7
−0.5
ChinaKoreaSingaporeVietnam ROCMalaysiaIndonesiaThailandHong Kong MongoliaPhilippinesUS JapanFiji
Output
120
100
80
60
40
20
0
−20 ChinaKoreaSingaporeVietnam ROCMalaysiaIndonesiaThailandHong Kong MongoliaPhilippinesUS JapanFiji
13 1426 24
16 16 20 18 16 17
3629
−1
63
35
75
7 6 3 6 7 4
10 16
10
6
48
59
6060
55
77 69
47 5168
63
27
67
50
3622
7 1122
17
28 27
11
−9
2825
−19
TFP Non-IT Capital IT Capital Labor TFP Non-IT Capital IT Capital Labor
%
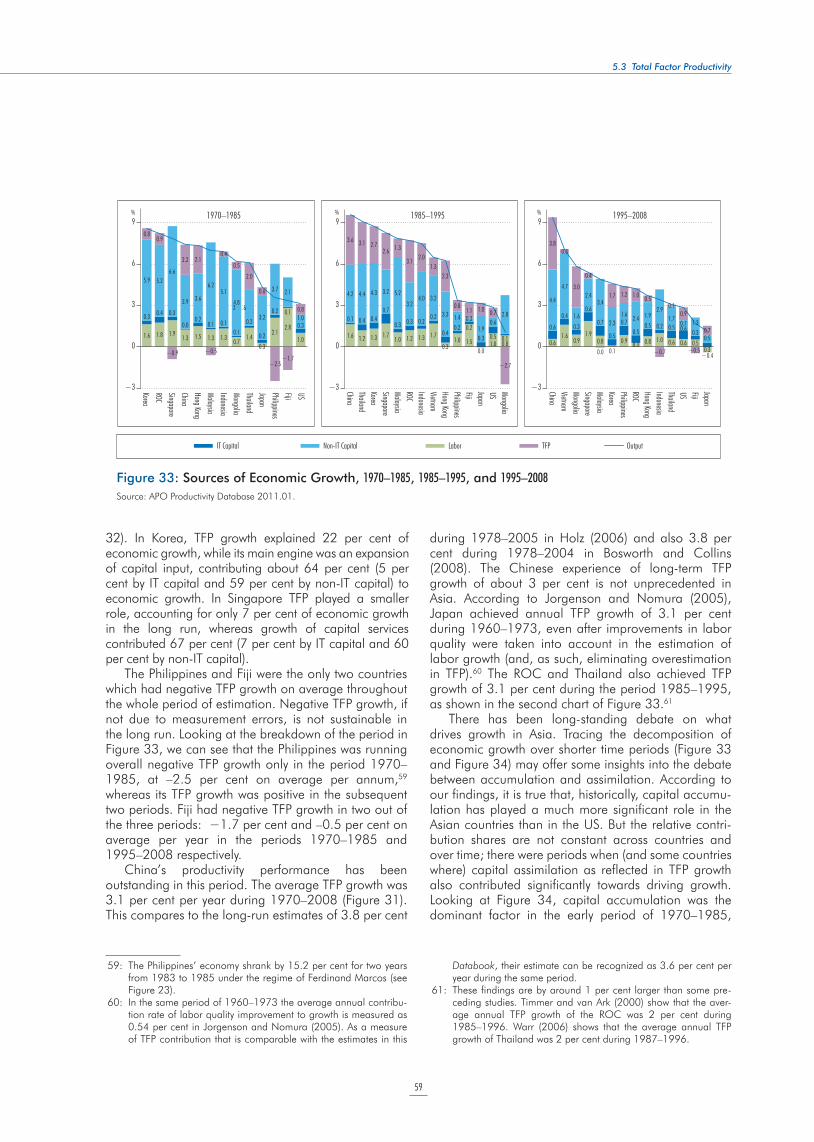
59
5.3 Total Factor Productivity
32). In Korea, TFP growth explained 22 per cent of economic growth, while its main engine was an expansion of capital input, contributing about 64 per cent (5 per cent by IT capital and 59 per cent by non-IT capital) to economic growth. In Singapore TFP played a smaller role, accounting for only 7 per cent of economic growth in the long run, whereas growth of capital services contributed 67 per cent (7 per cent by IT capital and 60 per cent by non-IT capital).
The Philippines and Fiji were the only two countries which had negative TFP growth on average throughout the whole period of estimation. Negative TFP growth, if not due to measurement errors, is not sustainable in the long run. Looking at the breakdown of the period in Figure 33, we can see that the Philippines was running overall negative TFP growth only in the period 1970–1985, at –2.5 per cent on average per annum,59 whereas its TFP growth was positive in the subsequent two periods. Fiji had negative TFP growth in two out of the three periods: !1.7 per cent and –0.5 per cent on average per year in the periods 1970–1985 and 1995–2008 respectively.
China’s productivity performance has been outstanding in this period. The average TFP growth was 3.1 per cent per year during 1970–2008 (Figure 31). This compares to the long-run estimates of 3.8 per cent
during 1978–2005 in Holz (2006) and also 3.8 per cent during 1978–2004 in Bosworth and Collins (2008). The Chinese experience of long-term TFP growth of about 3 per cent is not unprecedented in Asia. According to Jorgenson and Nomura (2005), Japan achieved annual TFP growth of 3.1 per cent during 1960–1973, even after improvements in labor quality were taken into account in the estimation of labor growth (and, as such, eliminating overestimation in TFP).60 The ROC and Thailand also achieved TFP growth of 3.1 per cent during the period 1985–1995, as shown in the second chart of Figure 33.61
There has been long-standing debate on what drives growth in Asia. Tracing the decomposition of economic growth over shorter time periods (Figure 33 and Figure 34) may offer some insights into the debate between accumulation and assimilation. According to our findings, it is true that, historically, capital accumu-lation has played a much more significant role in the Asian countries than in the US. But the relative contri-bution shares are not constant across countries and over time; there were periods when (and some countries where) capital assimilation as reflected in TFP growth also contributed significantly towards driving growth. Looking at Figure 34, capital accumulation was the dominant factor in the early period of 1970–1985,
IT Capital Non-IT Capital Labor TFP Output
9
6
3
0
−3
%9
6
3
0
−3
%9
6
3
0
−3
%
1.6 1.8 1.91.3 1.5 1.3 1.3
0.71.4
0.3
2.12.8
1.0
0.3 0.4 0.3
0.00.2
0.1 0.10.1
0.2
0.2
0.2 0.1
0.3
5.9 5.26.6
3.9 3.6
6.25.1
4.82 .6
3.2
3.7 2.1
1.0
0.80.9
−0.9
2.2 2.1
−0.5
0.4
0.5
2.0
0.6
−2.5−1.7
0.8
KoreaROCSingaporeChinaHong Kong MalaysiaIndonesiaMongoliaThailandJapanPhilippinesFijiUS
1970–1985
1.6 1.2 1.3 1.71.0 1.2 1.3 1.7
0.31.0 1.5
0.01.0 0.8
0.1 0.4 0.40.7
0.3 0.3 0.20.2
0.40.2 0.2
0.3 0.5 0.1
4.2 4.4 4.3 3.2 5.2
3.24.0 3.2
3.3 1.4 0.31.9
0.62.8
3.6 3.1 2.72.6 1.3
3.12.0
1.32.3
0.81.1 1.0 0.7
−2.7
ChinaThailandKoreaSingaporeMalaysiaROCIndonesiaVietnam Hong Kong PhilippinesFijiJapanUS Mongolia
1985–1995
0.61.6
0.91.9
0.80.1
0.9 0.3 0.8 1.0 0.6 0.6 0.5
−0.4
0.6
0.4
0.3
0.6
0.7
0.5
0.70.5
0.5 0.2 0.5 0.6 0.3
0.3
4.4
4.7
1.6
2.43.4
2.31.6
2.4 1.92.9
1.70.7 1.3
0.5
3.80.3
3.0
0.4
0.0
1.7 1.2 1.0 0.5
−0.7
0.10.9
−0.5
0.7
ChinaVietnam MongoliaSingaporeMalaysiaKoreaPhilippinesROCHong Kong IndonesiaThailandUS FijiJapan
1995–2008
Figure 33: Sources of Economic Growth, 1970–1985, 1985–1995, and 1995–2008
Source: APO Productivity Database 2011.01.
59: The Philippines’ economy shrank by 15.2 per cent for two years from 1983 to 1985 under the regime of Ferdinand Marcos (see Figure 23).
60: In the same period of 1960–1973 the average annual contribu-tion rate of labor quality improvement to growth is measured as 0.54 per cent in Jorgenson and Nomura (2005). As a measure of TFP contribution that is comparable with the estimates in this
Databook, their estimate can be recognized as 3.6 per cent per year during the same period.
61: These findings are by around 1 per cent larger than some pre-ceding studies. Timmer and van Ark (2000) show that the aver-age annual TFP growth of the ROC was 2 per cent during 1985–1996. Warr (2006) shows that the average annual TFP growth of Thailand was 2 per cent during 1987–1996.
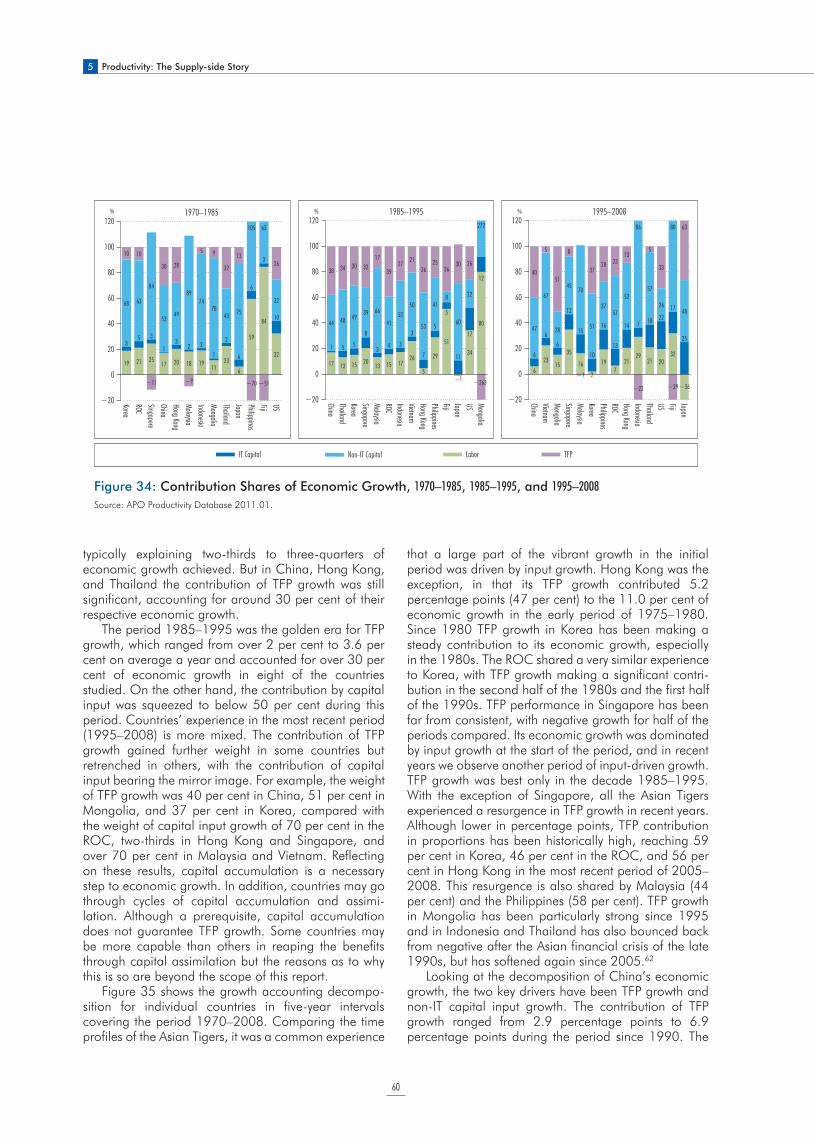
5 Productivity: The Supply-side Story
60
typically explaining two-thirds to three-quarters of economic growth achieved. But in China, Hong Kong, and Thailand the contribution of TFP growth was still significant, accounting for around 30 per cent of their respective economic growth.
The period 1985–1995 was the golden era for TFP growth, which ranged from over 2 per cent to 3.6 per cent on average a year and accounted for over 30 per cent of economic growth in eight of the countries studied. On the other hand, the contribution by capital input was squeezed to below 50 per cent during this period. Countries’ experience in the most recent period (1995–2008) is more mixed. The contribution of TFP growth gained further weight in some countries but retrenched in others, with the contribution of capital input bearing the mirror image. For example, the weight of TFP growth was 40 per cent in China, 51 per cent in Mongolia, and 37 per cent in Korea, compared with the weight of capital input growth of 70 per cent in the ROC, two-thirds in Hong Kong and Singapore, and over 70 per cent in Malaysia and Vietnam. Reflecting on these results, capital accumulation is a necessary step to economic growth. In addition, countries may go through cycles of capital accumulation and assimi-lation. Although a prerequisite, capital accumulation does not guarantee TFP growth. Some countries may be more capable than others in reaping the benefits through capital assimilation but the reasons as to why this is so are beyond the scope of this report.
Figure 35 shows the growth accounting decompo-sition for individual countries in five-year intervals covering the period 1970–2008. Comparing the time profiles of the Asian Tigers, it was a common experience
that a large part of the vibrant growth in the initial period was driven by input growth. Hong Kong was the exception, in that its TFP growth contributed 5.2 percentage points (47 per cent) to the 11.0 per cent of economic growth in the early period of 1975–1980. Since 1980 TFP growth in Korea has been making a steady contribution to its economic growth, especially in the 1980s. The ROC shared a very similar experience to Korea, with TFP growth making a significant contri-bution in the second half of the 1980s and the first half of the 1990s. TFP performance in Singapore has been far from consistent, with negative growth for half of the periods compared. Its economic growth was dominated by input growth at the start of the period, and in recent years we observe another period of input-driven growth. TFP growth was best only in the decade 1985–1995. With the exception of Singapore, all the Asian Tigers experienced a resurgence in TFP growth in recent years. Although lower in percentage points, TFP contribution in proportions has been historically high, reaching 59 per cent in Korea, 46 per cent in the ROC, and 56 per cent in Hong Kong in the most recent period of 2005–2008. This resurgence is also shared by Malaysia (44 per cent) and the Philippines (58 per cent). TFP growth in Mongolia has been particularly strong since 1995 and in Indonesia and Thailand has also bounced back from negative after the Asian financial crisis of the late 1990s, but has softened again since 2005.62
Looking at the decomposition of China’s economic growth, the two key drivers have been TFP growth and non-IT capital input growth. The contribution of TFP growth ranged from 2.9 percentage points to 6.9 percentage points during the period since 1990. The
IT Capital Non-IT Capital Labor TFP
120
100
80
60
40
20
0
−20
120
100
80
60
40
20
0
−20
120
100
80
60
40
20
0
−20
% % %
19 21 2517 20 18 19
1123
6
59
84
32
35 3
13
2 21
2
6
6
3
10
68 63
84
5349
8974
7843 75
105 63
32
10 10
−11
30 28
−9
5 9
32
13
−70 −51
26
KoreaROCSingaporeChinaHong Kong MalaysiaIndonesiaMongoliaThailandJapanPhilippinesFijiUS
1970–1985
17 13 15 2013 15 17
26
5
29
51
−1
34
80
1 5 5
8
34 3
3
7
5
5
11
17
12
272
44 48 4939 66
4152
50
53
418
60
22
38 34 30 3217
3927 21
3625
3630 26
−263
ChinaThailandKoreaSingaporeMalaysiaROCIndonesiaVietnam Hong Kong PhilippinesFijiJapanUS Mongolia
1985–1995
6
2315
35
16
2
197
2129
21 2032
−36
6
66
12
15
10
16
13
14 7 18 2217
2547
67
28
4570
51
3757
52
86
57
26
80
48
40
5
51
8
−1
3728 23
13
−22
5
33
−29
63
ChinaVietnam MongoliaSingaporeMalaysiaKoreaPhilippinesROCHong Kong IndonesiaThailandUS FijiJapan
1995–2008
Figure 34: Contribution Shares of Economic Growth, 1970–1985, 1985–1995, and 1995–2008
Source: APO Productivity Database 2011.01.
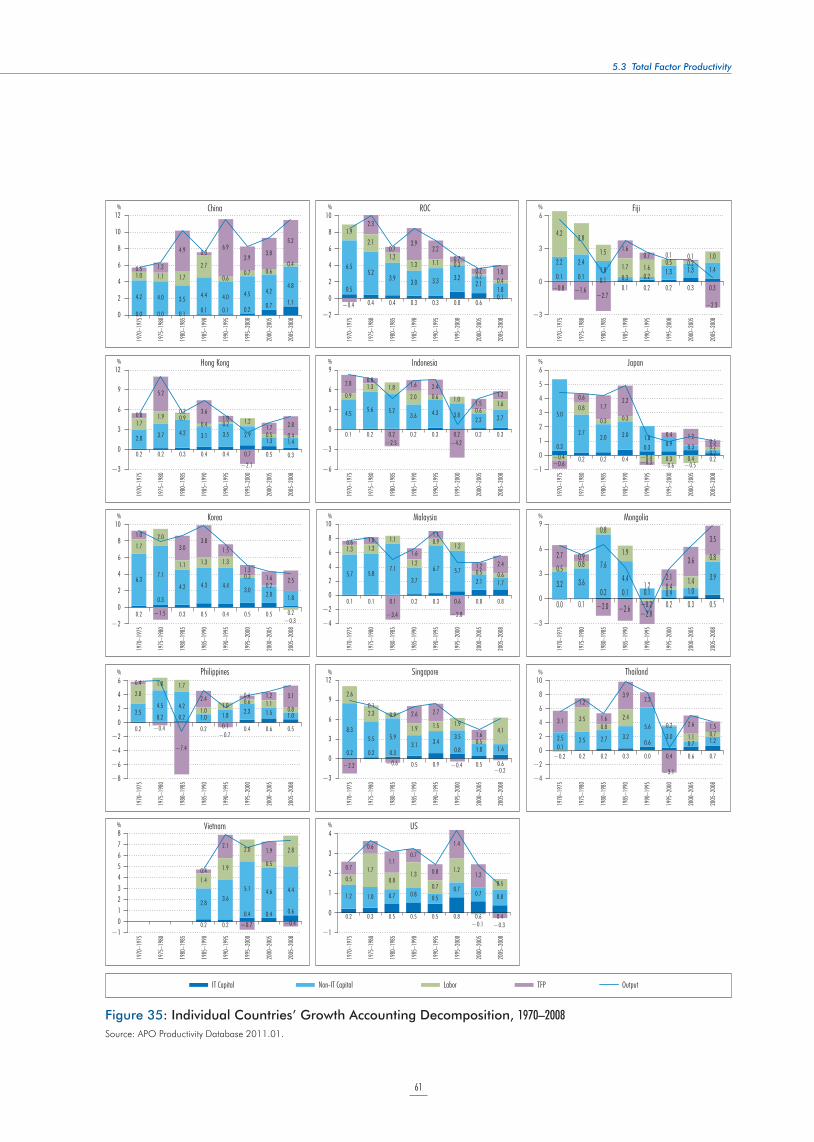
61
5.3 Total Factor Productivity
IT Capital Non-IT Capital Labor TFP Output
0.0 0.0 0.1 0.1 0.1 0.20.7 1.1
4.2 4.0 3.54.4 4.0 4.5 4.2
4.81.0 1.1 1.7
2.7
0.60.7 0.6
0.40.5 1.2
4.9 0.36.9
2.93.8
5.2
12
10
8
6
4
2
0
%
12
9
6
3
0
−3
10
8
6
4
2
0
−2
6
4
2
0
−2
−4
−6
−8
876543210
−1
%
%
%
China
0.2 0.2 0.3 0.4 0.4 0.7 0.5 0.3
2.8 3.7 4.2 3.1 3.5 2.91.3 1.4
1.71.9 0.9
0.4 0.2 1.2
0.5 0.4
0.8
5.2
0.2 3.61.0
−2.1
1.7 2.8
Hong Kong
0.2
0.3
0.3 0.5 0.4 0.5 0.5 0.2
6.37.1
4.2 4.3 4.43.0
2.0 1.8
1.72.0
1.1 1.3 1.3
0.30.2
−0.3
1.0
−1.5
3.03.8
1.5
1.31.6 2.5
Korea
0.2
0.2 0.2
0.2 0.1 0.4 0.6 0.5
2.54.5 4.2
1.0 1.8 2.3 1.5 1.0
2.81.8 1.7
1.01.0 0.6 1.1
0.8
0.4
−0.4
−7.4
2.4
−0.7
0.6 1.2 3.1
Philippines
0.2 0.2
0.4 0.4 0.62.8
3.65.1 4.6 4.4
1.4
1.9
2.0
0.5
2.8
0.4
2.1
−0.7
1.9
−0.4
Vietnam
10
8
6
4
2
0
−2
%
9
6
3
0
−3
−6
0.5
0.4 0.4 0.3 0.3 0.8 0.60.1
6.55.2
3.9 3.0 3.3 3.22.1
1.8
1.92.1
1.21.3 1.1 0.3
0.20.4
−0.4
2.3
0.73.9
2.20.7
0.7 1.8
ROC
0.1 0.2 0.2 0.2 0.3 0.2 0.2 0.3
4.5 5.6 5.23.6 4.3 3.8
2.2 2.7
0.91.3 1.8
2.0 0.6 1.0
0.61.6
2.8 0.8
−2.5
1.6 2.4
−4.2
1.51.2
Indonesia
10
8
6
4
2
0
−2
−4
%
0.1 0.1 0.1 0.2 0.3 0.6 0.8 0.8
5.7 5.87.1
3.7
6.7 5.7
2.1 1.7
1.3 1.31.1
1.2
0.91.2
0.5 0.6
0.6 1.0
−3.4
1.6
1.1
−2.8
1.2 2.4
Malaysia
12
9
6
3
0
−3
%
0.2 0.2 0.3
0.5 0.9
0.8
0.5 0.6
8.35.5 5.9
3.1 3.43.5
1.8 1.6
2.6
2.3 0.9
1.9 1.5 1.9
0.5
4.1
−2.2
0.1
−0.6
2.6 2.7
−0.4
1.6
−0.2
Singapore
4
3
2
1
0
−1
%
0.2 0.3 0.5 0.5 0.5 0.8 0.6 0.4
1.2 1.0 0.7 0.8 0.50.7
0.7 0.8
0.51.7
0.81.3
0.7
1.2
−0.1
0.5
0.7
0.6
1.10.7
0.8
1.4
1.2
−0.3
US
6
3
0
−3
%
6
5
4
3
2
1
0
−1
% % %
0.1 0.1 0.10.1 0.2 0.2 0.3
2.2 2.41.8
0.3 0.21.3 1.3 1.4
4.22.8
1.5
1.7 1.60.5 0.2
1.0
−0.8 −1.6−2.7
1.60.7 0.1 0.1
−2.3
1970
–197
5
1975
–198
0
1980
–198
5
1985
–199
0
1990
–199
5
1995
–200
0
2000
–200
5
2005
–200
8
1970
–197
5
1975
–198
0
1980
–198
5
1985
–199
0
1990
–199
5
1995
–200
0
2000
–200
5
2005
–200
8
1970
–197
5
1975
–198
0
1980
–198
5
1985
–199
0
1990
–199
5
1995
–200
0
2000
–200
5
2005
–200
8
1970
–197
5
1975
–198
0
1980
–198
5
1985
–199
0
1990
–199
5
1995
–200
0
2000
–200
5
2005
–200
8
1970
–197
5
1975
–198
0
1980
–198
5
1985
–199
0
1990
–199
5
1995
–200
0
2000
–200
5
2005
–200
8
1970
–197
5
1975
–198
0
1980
–198
5
1985
–199
0
1990
–199
5
1995
–200
0
2000
–200
5
2005
–200
8
1970
–197
5
1975
–198
0
1980
–198
5
1985
–199
0
1990
–199
5
1995
–200
0
2000
–200
5
2005
–200
8
1970
–197
5
1975
–198
0
1980
–198
5
1985
–199
0
1990
–199
5
1995
–200
0
2000
–200
5
2005
–200
8
1970
–197
5
1975
–198
0
1980
–198
5
1985
–199
0
1990
–199
5
1995
–200
0
2000
–200
5
2005
–200
8
1970
–197
5
1975
–198
0
1980
–198
5
1985
–199
0
1990
–199
5
1995
–200
0
2000
–200
5
2005
–200
8
1970
–197
5
1975
–198
0
1980
–198
5
1985
–199
0
1990
–199
5
1995
–200
0
2000
–200
5
2005
–200
8
1970
–197
5
1975
–198
0
1980
–198
5
1985
–199
0
1990
–199
5
1995
–200
0
2000
–200
5
2005
–200
8
1970
–197
5
1975
–198
0
1980
–198
5
1985
–199
0
1990
–199
5
1995
–200
0
2000
–200
5
2005
–200
8
1970
–197
5
1975
–198
0
1980
–198
5
1985
–199
0
1990
–199
5
1995
–200
0
2000
–200
5
2005
–200
8
Fiji
0.3
0.2 0.2 0.4
0.3
0.3 0.4 0.2
5.0
2.72.0 2.0 1.8
0.9 0.30.2−0.4
0.8
0.3 0.3
−0.4−0.6 −0.5
0.2
−0.6
0.61.7
2.2
−0.3
0.4 1.20.5
Japan
9
6
3
0
−3
%
0.0 0.10.2 0.1 0.1
0.2 0.3 0.5
3.2 3.6
7.6
4.41.2
0.9 1.0
3.90.5 0.8
0.8
1.9
−0.2
0.41.4
0.82.7 0.9
−2.0 −2.6 −2.8
2.1
3.6
3.5
Mongolia
10
8
6
4
2
0
−2
−4
%
0.10.2 0.2 0.3
0.6
0.4 0.6 0.7
2.5 2.5 2.7 3.25.6
3.00.7 1.2
−0.2
3.50.8
2.4
0.0
0.2
1.1 0.7
3.1
1.2
1.6
3.92.2
−3.1
2.6 1.5
Thailand
0.3
Figure 35: Individual Countries’ Growth Accounting Decomposition, 1970–2008
Source: APO Productivity Database 2011.01.
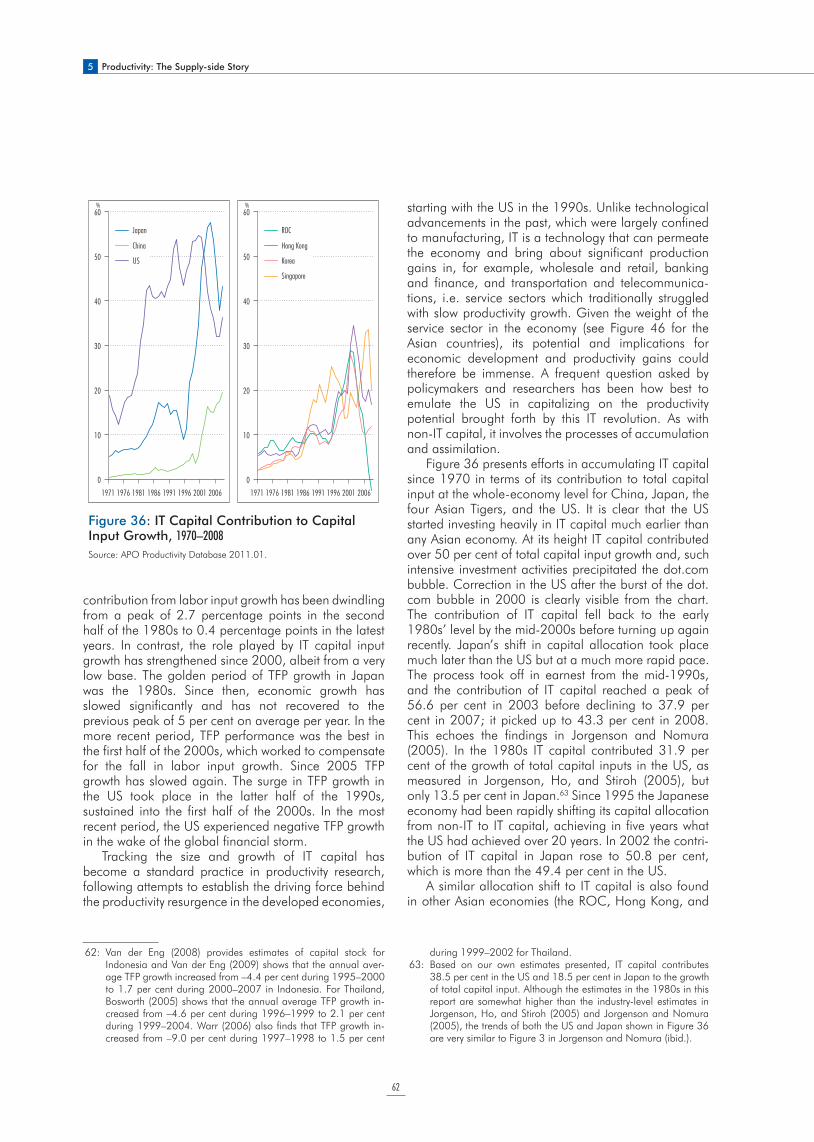
5 Productivity: The Supply-side Story
62
contribution from labor input growth has been dwindling from a peak of 2.7 percentage points in the second half of the 1980s to 0.4 percentage points in the latest years. In contrast, the role played by IT capital input growth has strengthened since 2000, albeit from a very low base. The golden period of TFP growth in Japan was the 1980s. Since then, economic growth has slowed significantly and has not recovered to the previous peak of 5 per cent on average per year. In the more recent period, TFP performance was the best in the first half of the 2000s, which worked to compensate for the fall in labor input growth. Since 2005 TFP growth has slowed again. The surge in TFP growth in the US took place in the latter half of the 1990s, sustained into the first half of the 2000s. In the most recent period, the US experienced negative TFP growth in the wake of the global financial storm.
Tracking the size and growth of IT capital has become a standard practice in productivity research, following attempts to establish the driving force behind the productivity resurgence in the developed economies,
starting with the US in the 1990s. Unlike technological advancements in the past, which were largely confined to manufacturing, IT is a technology that can permeate the economy and bring about significant production gains in, for example, wholesale and retail, banking and finance, and transportation and telecommunica-tions, i.e. service sectors which traditionally struggled with slow productivity growth. Given the weight of the service sector in the economy (see Figure 46 for the Asian countries), its potential and implications for economic development and productivity gains could therefore be immense. A frequent question asked by policymakers and researchers has been how best to emulate the US in capitalizing on the productivity potential brought forth by this IT revolution. As with non-IT capital, it involves the processes of accumulation and assimilation.
Figure 36 presents efforts in accumulating IT capital since 1970 in terms of its contribution to total capital input at the whole-economy level for China, Japan, the four Asian Tigers, and the US. It is clear that the US started investing heavily in IT capital much earlier than any Asian economy. At its height IT capital contributed over 50 per cent of total capital input growth and, such intensive investment activities precipitated the dot.com bubble. Correction in the US after the burst of the dot.com bubble in 2000 is clearly visible from the chart. The contribution of IT capital fell back to the early 1980s’ level by the mid-2000s before turning up again recently. Japan’s shift in capital allocation took place much later than the US but at a much more rapid pace. The process took off in earnest from the mid-1990s, and the contribution of IT capital reached a peak of 56.6 per cent in 2003 before declining to 37.9 per cent in 2007; it picked up to 43.3 per cent in 2008. This echoes the findings in Jorgenson and Nomura (2005). In the 1980s IT capital contributed 31.9 per cent of the growth of total capital inputs in the US, as measured in Jorgenson, Ho, and Stiroh (2005), but only 13.5 per cent in Japan.63 Since 1995 the Japanese economy had been rapidly shifting its capital allocation from non-IT to IT capital, achieving in five years what the US had achieved over 20 years. In 2002 the contri-bution of IT capital in Japan rose to 50.8 per cent, which is more than the 49.4 per cent in the US.
A similar allocation shift to IT capital is also found in other Asian economies (the ROC, Hong Kong, and
62: Van der Eng (2008) provides estimates of capital stock for Indonesia and Van der Eng (2009) shows that the annual aver-age TFP growth increased from –4.4 per cent during 1995–2000 to 1.7 per cent during 2000–2007 in Indonesia. For Thailand, Bosworth (2005) shows that the annual average TFP growth in-creased from –4.6 per cent during 1996–1999 to 2.1 per cent during 1999–2004. Warr (2006) also finds that TFP growth in-creased from –9.0 per cent during 1997–1998 to 1.5 per cent
during 1999–2002 for Thailand.63: Based on our own estimates presented, IT capital contributes
38.5 per cent in the US and 18.5 per cent in Japan to the growth of total capital input. Although the estimates in the 1980s in this report are somewhat higher than the industry-level estimates in Jorgenson, Ho, and Stiroh (2005) and Jorgenson and Nomura (2005), the trends of both the US and Japan shown in Figure 36 are very similar to Figure 3 in Jorgenson and Nomura (ibid.).
60
50
40
30
20
10
01971 1976 1981 1986 1991 1996 2001 2006
Japan
China
US
1971 1976 1981 1986 1991 1996 2001 2006
ROC
Hong Kong
Korea
Singapore
60
50
40
30
20
10
0
% %
Figure 36: IT Capital Contribution to Capital Input Growth, 1970–2008
Source: APO Productivity Database 2011.01.
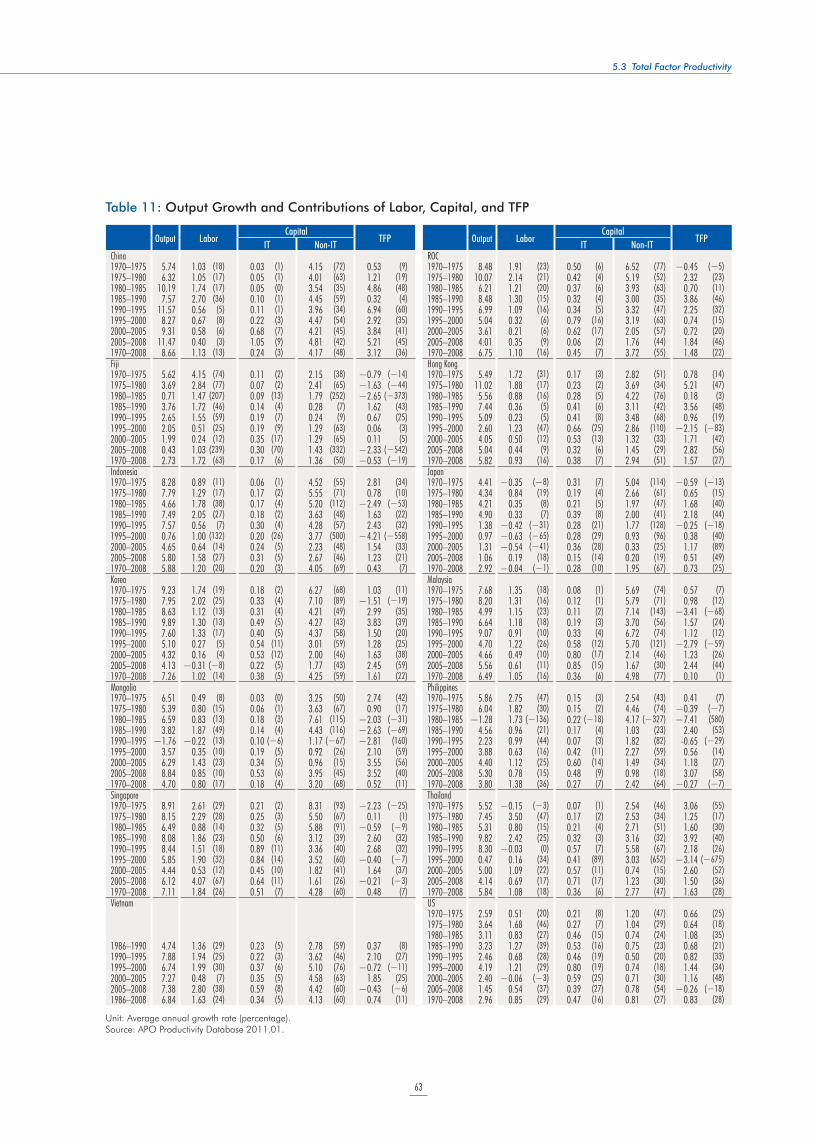
63
5.3 Total Factor Productivity
Output LaborCapital
TFP Output LaborCapital
TFPIT Non-IT IT Non-IT
China ROC1970–1975 5.74 1.03 (18) 0.03 (1) 4.15 (72) 0.53 (9) 1970–1975 8.48 1.91 (23) 0.50 (6) 6.52 (77) !0.45 (!5)
1975–1980 6.32 1.05 (17) 0.05 (1) 4.01 (63) 1.21 (19) 1975–1980 10.07 2.14 (21) 0.42 (4) 5.19 (52) 2.32 (23)
1980–1985 10.19 1.74 (17) 0.05 (0) 3.54 (35) 4.86 (48) 1980–1985 6.21 1.21 (20) 0.37 (6) 3.93 (63) 0.70 (11)
1985–1990 7.57 2.70 (36) 0.10 (1) 4.45 (59) 0.32 (4) 1985–1990 8.48 1.30 (15) 0.32 (4) 3.00 (35) 3.86 (46)
1990–1995 11.57 0.56 (5) 0.11 (1) 3.96 (34) 6.94 (60) 1990–1995 6.99 1.09 (16) 0.34 (5) 3.32 (47) 2.25 (32)
1995–2000 8.27 0.67 (8) 0.22 (3) 4.47 (54) 2.92 (35) 1995–2000 5.04 0.32 (6) 0.79 (16) 3.19 (63) 0.74 (15)
2000–2005 9.31 0.58 (6) 0.68 (7) 4.21 (45) 3.84 (41) 2000–2005 3.61 0.21 (6) 0.62 (17) 2.05 (57) 0.72 (20)
2005–2008 11.47 0.40 (3) 1.05 (9) 4.81 (42) 5.21 (45) 2005–2008 4.01 0.35 (9) 0.06 (2) 1.76 (44) 1.84 (46)
1970–2008 8.66 1.13 (13) 0.24 (3) 4.17 (48) 3.12 (36) 1970–2008 6.75 1.10 (16) 0.45 (7) 3.72 (55) 1.48 (22)
Fiji Hong Kong1970–1975 5.62 4.15 (74) 0.11 (2) 2.15 (38) !0.79 (!14) 1970–1975 5.49 1.72 (31) 0.17 (3) 2.82 (51) 0.78 (14)
1975–1980 3.69 2.84 (77) 0.07 (2) 2.41 (65) !1.63 (!44) 1975–1980 11.02 1.88 (17) 0.23 (2) 3.69 (34) 5.21 (47)
1980–1985 0.71 1.47 (207) 0.09 (13) 1.79 (252) !2.65 (!373) 1980–1985 5.56 0.88 (16) 0.28 (5) 4.22 (76) 0.18 (3)
1985–1990 3.76 1.72 (46) 0.14 (4) 0.28 (7) 1.62 (43) 1985–1990 7.44 0.36 (5) 0.41 (6) 3.11 (42) 3.56 (48)
1990–1995 2.65 1.55 (59) 0.19 (7) 0.24 (9) 0.67 (25) 1990–1995 5.09 0.23 (5) 0.41 (8) 3.48 (68) 0.96 (19)
1995–2000 2.05 0.51 (25) 0.19 (9) 1.29 (63) 0.06 (3) 1995–2000 2.60 1.23 (47) 0.66 (25) 2.86 (110) !2.15 (!83)
2000–2005 1.99 0.24 (12) 0.35 (17) 1.29 (65) 0.11 (5) 2000–2005 4.05 0.50 (12) 0.53 (13) 1.32 (33) 1.71 (42)
2005–2008 0.43 1.03 (239) 0.30 (70) 1.43 (332) !2.33 (!542) 2005–2008 5.04 0.44 (9) 0.32 (6) 1.45 (29) 2.82 (56)
1970–2008 2.73 1.72 (63) 0.17 (6) 1.36 (50) !0.53 (!19) 1970–2008 5.82 0.93 (16) 0.38 (7) 2.94 (51) 1.57 (27)
Indonesia Japan1970–1975 8.28 0.89 (11) 0.06 (1) 4.52 (55) 2.81 (34) 1970–1975 4.41 !0.35 (!8) 0.31 (7) 5.04 (114) !0.59 (!13)
1975–1980 7.79 1.29 (17) 0.17 (2) 5.55 (71) 0.78 (10) 1975–1980 4.34 0.84 (19) 0.19 (4) 2.66 (61) 0.65 (15)
1980–1985 4.66 1.78 (38) 0.17 (4) 5.20 (112) !2.49 (!53) 1980–1985 4.21 0.35 (8) 0.21 (5) 1.97 (47) 1.68 (40)
1985–1990 7.49 2.05 (27) 0.18 (2) 3.63 (48) 1.63 (22) 1985–1990 4.90 0.33 (7) 0.39 (8) 2.00 (41) 2.18 (44)
1990–1995 7.57 0.56 (7) 0.30 (4) 4.28 (57) 2.43 (32) 1990–1995 1.38 !0.42 (!31) 0.28 (21) 1.77 (128) !0.25 (!18)
1995–2000 0.76 1.00 (132) 0.20 (26) 3.77 (500) !4.21 (!558) 1995–2000 0.97 !0.63 (!65) 0.28 (29) 0.93 (96) 0.38 (40)
2000–2005 4.65 0.64 (14) 0.24 (5) 2.23 (48) 1.54 (33) 2000–2005 1.31 !0.54 (!41) 0.36 (28) 0.33 (25) 1.17 (89)
2005–2008 5.80 1.58 (27) 0.31 (5) 2.67 (46) 1.23 (21) 2005–2008 1.06 0.19 (18) 0.15 (14) 0.20 (19) 0.51 (49)
1970–2008 5.88 1.20 (20) 0.20 (3) 4.05 (69) 0.43 (7) 1970–2008 2.92 !0.04 (!1) 0.28 (10) 1.95 (67) 0.73 (25)
Korea Malaysia1970–1975 9.23 1.74 (19) 0.18 (2) 6.27 (68) 1.03 (11) 1970–1975 7.68 1.35 (18) 0.08 (1) 5.69 (74) 0.57 (7)
1975–1980 7.95 2.02 (25) 0.33 (4) 7.10 (89) !1.51 (!19) 1975–1980 8.20 1.31 (16) 0.12 (1) 5.79 (71) 0.98 (12)
1980–1985 8.63 1.12 (13) 0.31 (4) 4.21 (49) 2.99 (35) 1980–1985 4.99 1.15 (23) 0.11 (2) 7.14 (143) !3.41 (!68)
1985–1990 9.89 1.30 (13) 0.49 (5) 4.27 (43) 3.83 (39) 1985–1990 6.64 1.18 (18) 0.19 (3) 3.70 (56) 1.57 (24)
1990–1995 7.60 1.33 (17) 0.40 (5) 4.37 (58) 1.50 (20) 1990–1995 9.07 0.91 (10) 0.33 (4) 6.72 (74) 1.12 (12)
1995–2000 5.10 0.27 (5) 0.54 (11) 3.01 (59) 1.28 (25) 1995–2000 4.70 1.22 (26) 0.58 (12) 5.70 (121) !2.79 (!59)
2000–2005 4.32 0.16 (4) 0.53 (12) 2.00 (46) 1.63 (38) 2000–2005 4.66 0.49 (10) 0.80 (17) 2.14 (46) 1.23 (26)
2005–2008 4.13 !0.31 (!8) 0.22 (5) 1.77 (43) 2.45 (59) 2005–2008 5.56 0.61 (11) 0.85 (15) 1.67 (30) 2.44 (44)
1970–2008 7.26 1.02 (14) 0.38 (5) 4.25 (59) 1.61 (22) 1970–2008 6.49 1.05 (16) 0.36 (6) 4.98 (77) 0.10 (1)
Mongolia Philippines1970–1975 6.51 0.49 (8) 0.03 (0) 3.25 (50) 2.74 (42) 1970–1975 5.86 2.75 (47) 0.15 (3) 2.54 (43) 0.41 (7)
1975–1980 5.39 0.80 (15) 0.06 (1) 3.63 (67) 0.90 (17) 1975–1980 6.04 1.82 (30) 0.15 (2) 4.46 (74) !0.39 (!7)
1980–1985 6.59 0.83 (13) 0.18 (3) 7.61 (115) !2.03 (!31) 1980–1985 !1.28 1.73 (!136) 0.22 (!18) 4.17 (!327) !7.41 (580)
1985–1990 3.82 1.87 (49) 0.14 (4) 4.43 (116) !2.63 (!69) 1985–1990 4.56 0.96 (21) 0.17 (4) 1.03 (23) 2.40 (53)
1990–1995 !1.76 !0.22 (13) 0.10 (!6) 1.17 (!67) !2.81 (160) 1990–1995 2.23 0.99 (44) 0.07 (3) 1.82 (82) -0.65 (!29)
1995–2000 3.57 0.35 (10) 0.19 (5) 0.92 (26) 2.10 (59) 1995–2000 3.88 0.63 (16) 0.42 (11) 2.27 (59) 0.56 (14)
2000–2005 6.29 1.43 (23) 0.34 (5) 0.96 (15) 3.55 (56) 2000–2005 4.40 1.12 (25) 0.60 (14) 1.49 (34) 1.18 (27)
2005–2008 8.84 0.85 (10) 0.53 (6) 3.95 (45) 3.52 (40) 2005–2008 5.30 0.78 (15) 0.48 (9) 0.98 (18) 3.07 (58)
1970–2008 4.70 0.80 (17) 0.18 (4) 3.20 (68) 0.52 (11) 1970–2008 3.80 1.38 (36) 0.27 (7) 2.42 (64) !0.27 (!7)
Singapore Thailand1970–1975 8.91 2.61 (29) 0.21 (2) 8.31 (93) !2.23 (!25) 1970–1975 5.52 !0.15 (!3) 0.07 (1) 2.54 (46) 3.06 (55)
1975–1980 8.15 2.29 (28) 0.25 (3) 5.50 (67) 0.11 (1) 1975–1980 7.45 3.50 (47) 0.17 (2) 2.53 (34) 1.25 (17)
1980–1985 6.49 0.88 (14) 0.32 (5) 5.88 (91) !0.59 (!9) 1980–1985 5.31 0.80 (15) 0.21 (4) 2.71 (51) 1.60 (30)
1985–1990 8.08 1.86 (23) 0.50 (6) 3.12 (39) 2.60 (32) 1985–1990 9.82 2.42 (25) 0.32 (3) 3.16 (32) 3.92 (40)
1990–1995 8.44 1.51 (18) 0.89 (11) 3.36 (40) 2.68 (32) 1990–1995 8.30 !0.03 (0) 0.57 (7) 5.58 (67) 2.18 (26)
1995–2000 5.85 1.90 (32) 0.84 (14) 3.52 (60) !0.40 (!7) 1995–2000 0.47 0.16 (34) 0.41 (89) 3.03 (652) !3.14 (!675)
2000–2005 4.44 0.53 (12) 0.45 (10) 1.82 (41) 1.64 (37) 2000–2005 5.00 1.09 (22) 0.57 (11) 0.74 (15) 2.60 (52)
2005–2008 6.12 4.07 (67) 0.64 (11) 1.61 (26) !0.21 (!3) 2005–2008 4.14 0.69 (17) 0.71 (17) 1.23 (30) 1.50 (36)
1970–2008 7.11 1.84 (26) 0.51 (7) 4.28 (60) 0.48 (7) 1970–2008 5.84 1.08 (18) 0.36 (6) 2.77 (47) 1.63 (28)
Vietnam US1970–1975 2.59 0.51 (20) 0.21 (8) 1.20 (47) 0.66 (25)
1975–1980 3.64 1.68 (46) 0.27 (7) 1.04 (29) 0.64 (18)
1980–1985 3.11 0.83 (27) 0.46 (15) 0.74 (24) 1.08 (35)
1986–1990 4.74 1.36 (29) 0.23 (5) 2.78 (59) 0.37 (8) 1985–1990 3.23 1.27 (39) 0.53 (16) 0.75 (23) 0.68 (21)
1990–1995 7.88 1.94 (25) 0.22 (3) 3.62 (46) 2.10 (27) 1990–1995 2.46 0.68 (28) 0.46 (19) 0.50 (20) 0.82 (33)
1995–2000 6.74 1.99 (30) 0.37 (6) 5.10 (76) !0.72 (!11) 1995–2000 4.19 1.21 (29) 0.80 (19) 0.74 (18) 1.44 (34)
2000–2005 7.27 0.48 (7) 0.35 (5) 4.58 (63) 1.85 (25) 2000–2005 2.40 !0.06 (!3) 0.59 (25) 0.71 (30) 1.16 (48)
2005–2008 7.38 2.80 (38) 0.59 (8) 4.42 (60) !0.43 (!6) 2005–2008 1.45 0.54 (37) 0.39 (27) 0.78 (54) !0.26 (!18)
1986–2008 6.84 1.63 (24) 0.34 (5) 4.13 (60) 0.74 (11) 1970–2008 2.96 0.85 (29) 0.47 (16) 0.81 (27) 0.83 (28)
Unit: Average annual growth rate (percentage).Source: APO Productivity Database 2011.01.
Table 11: Output Growth and Contributions of Labor, Capital, and TFP
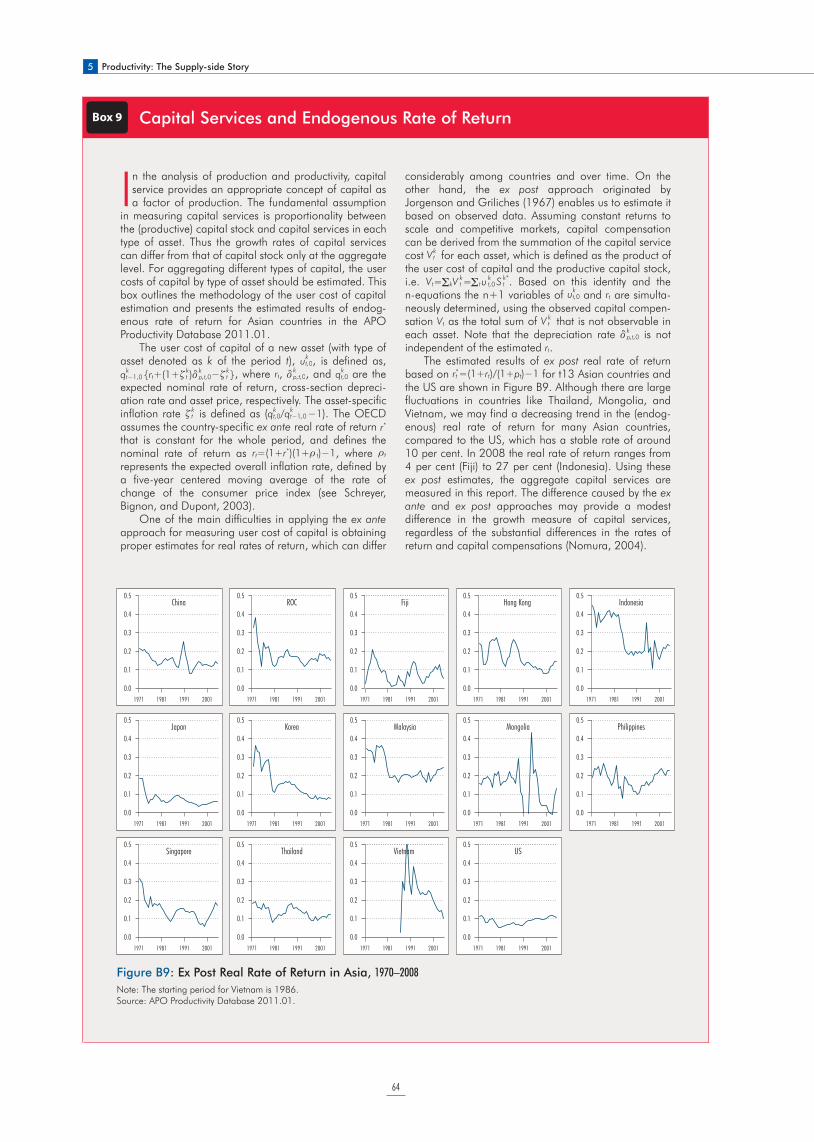
5 Productivity: The Supply-side Story
64
Box 9 Capital Services and Endogenous Rate of Return
In the analysis of production and productivity, capital service provides an appropriate concept of capital as a factor of production. The fundamental assumption
in measuring capital services is proportionality between the (productive) capital stock and capital services in each type of asset. Thus the growth rates of capital services can differ from that of capital stock only at the aggregate level. For aggregating different types of capital, the user costs of capital by type of asset should be estimated. This box outlines the methodology of the user cost of capital estimation and presents the estimated results of endog-enous rate of return for Asian countries in the APO Productivity Database 2011.01.
The user cost of capital of a new asset (with type of asset denoted as k of the period t), uk
t,0, is defined as,qk
t−1,0{rt+(1+g kt )d k
p,t,0−g kt }, where rt, d
kp,t,0, and qk
t,0 are the expected nominal rate of return, cross-section depreci-ation rate and asset price, respectively. The asset-specific inflation rate g k
t is defined as (qkt,0/qk
t−1,0−1). The OECD assumes the country-specific ex ante real rate of return r*
t that is constant for the whole period, and defines the nominal rate of return as rt=(1+r*
t )(1+t t)−1, where tt
represents the expected overall inflation rate, defined by a five-year centered moving average of the rate of change of the consumer price index (see Schreyer, Bignon, and Dupont, 2003).
One of the main difficulties in applying the ex ante approach for measuring user cost of capital is obtaining proper estimates for real rates of return, which can differ
considerably among countries and over time. On the other hand, the ex post approach originated by Jorgenson and Griliches (1967) enables us to estimate it based on observed data. Assuming constant returns to scale and competitive markets, capital compensation can be derived from the summation of the capital service cost Vk
t for each asset, which is defined as the product of the user cost of capital and the productive capital stock, i.e. Vt= kV
kt = tu
kt,0 S k*
t . Based on this identity and the n-equations the n+1 variables of uk
t,0 and rt are simulta-neously determined, using the observed capital compen-sation Vt as the total sum of V k
t that is not observable in each asset. Note that the depreciation rate d k
p,t,0 is not independent of the estimated rt.
The estimated results of ex post real rate of return based on r*
t =(1+rt)/(1+pt)−1 for t13 Asian countries and the US are shown in Figure B9. Although there are large fluctuations in countries like Thailand, Mongolia, and Vietnam, we may find a decreasing trend in the (endog-enous) real rate of return for many Asian countries, compared to the US, which has a stable rate of around 10 per cent. In 2008 the real rate of return ranges from 4 per cent (Fiji) to 27 per cent (Indonesia). Using these ex post estimates, the aggregate capital services are measured in this report. The difference caused by the ex ante and ex post approaches may provide a modest difference in the growth measure of capital services, regardless of the substantial differences in the rates of return and capital compensations (Nomura, 2004).
Figure B9: Ex Post Real Rate of Return in Asia, 1970–2008
China ROC Fiji Hong Kong Indonesia
Japan Korea Malaysia Mongolia Philippines
Singapore Thailand Vietnam US
1971 1981 1991 2001
0.5
0.4
0.3
0.2
0.1
0.0
1971 1981 1991 2001
0.5
0.4
0.3
0.2
0.1
0.0
1971 1981 1991 2001 1971 1981 1991 2001 1971 1981 1991 2001 1971 1981 1991 2001
0.5
0.4
0.3
0.2
0.1
0.0
0.5
0.4
0.3
0.2
0.1
0.0
0.5
0.4
0.3
0.2
0.1
0.0
0.5
0.4
0.3
0.2
0.1
0.0
1971 1981 1991 2001 1971 1981 1991 2001 1971 1981 1991 2001 1971 1981 1991 2001
0.5
0.4
0.3
0.2
0.1
0.0
0.5
0.4
0.3
0.2
0.1
0.0
0.5
0.4
0.3
0.2
0.1
0.0
0.5
0.4
0.3
0.2
0.1
0.0
1971 1981 1991 2001
0.5
0.4
0.3
0.2
0.1
0.01971 1981 1991 2001 1971 1981 1991 2001 1971 1981 1991 2001
0.5
0.4
0.3
0.2
0.1
0.0
0.5
0.4
0.3
0.2
0.1
0.0
0.5
0.4
0.3
0.2
0.1
0.0
Note: The starting period for Vietnam is 1986.Source: APO Productivity Database 2011.01.
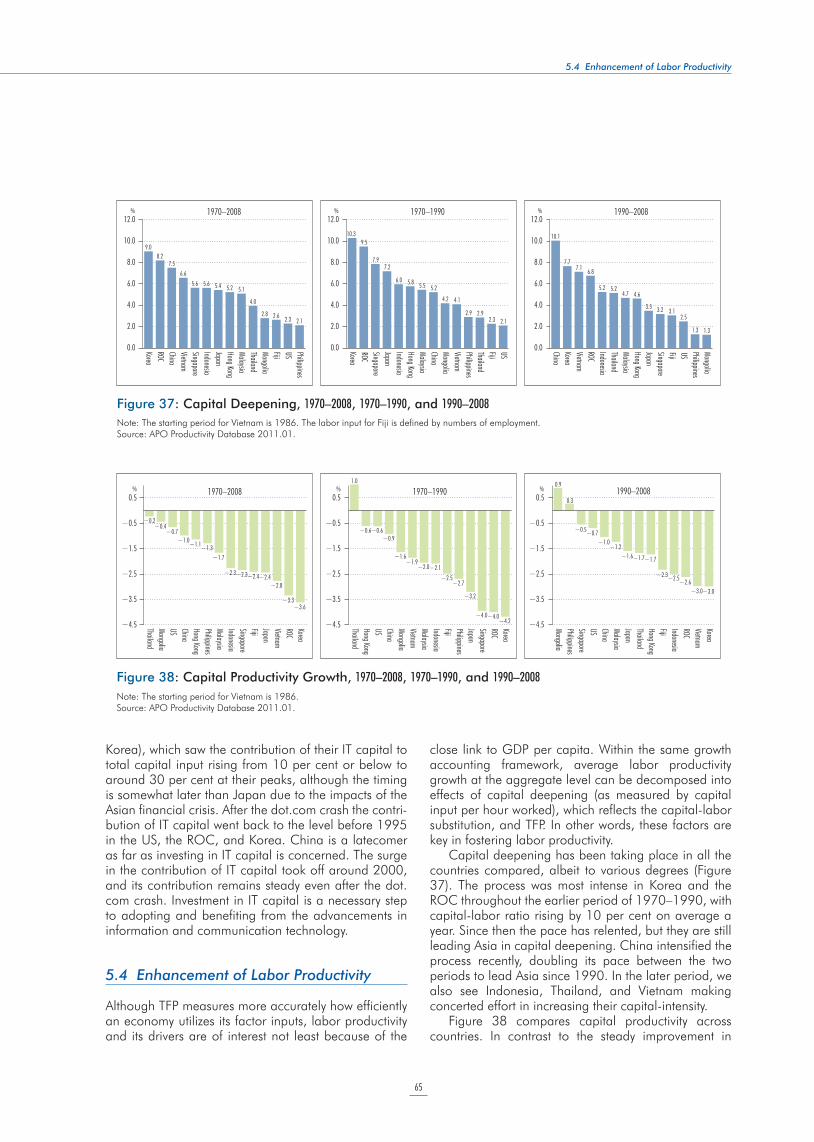
65
5.4 Enhancement of Labor Productivity
Korea), which saw the contribution of their IT capital to total capital input rising from 10 per cent or below to around 30 per cent at their peaks, although the timing is somewhat later than Japan due to the impacts of the Asian financial crisis. After the dot.com crash the contri-bution of IT capital went back to the level before 1995 in the US, the ROC, and Korea. China is a latecomer as far as investing in IT capital is concerned. The surge in the contribution of IT capital took off around 2000, and its contribution remains steady even after the dot.com crash. Investment in IT capital is a necessary step to adopting and benefiting from the advancements in information and communication technology.
5.4 Enhancement of Labor Productivity
Although TFP measures more accurately how efficiently an economy utilizes its factor inputs, labor productivity and its drivers are of interest not least because of the
close link to GDP per capita. Within the same growth accounting framework, average labor productivity growth at the aggregate level can be decomposed into effects of capital deepening (as measured by capital input per hour worked), which reflects the capital-labor substitution, and TFP. In other words, these factors are key in fostering labor productivity.
Capital deepening has been taking place in all the countries compared, albeit to various degrees (Figure 37). The process was most intense in Korea and the ROC throughout the earlier period of 1970–1990, with capital-labor ratio rising by 10 per cent on average a year. Since then the pace has relented, but they are still leading Asia in capital deepening. China intensified the process recently, doubling its pace between the two periods to lead Asia since 1990. In the later period, we also see Indonesia, Thailand, and Vietnam making concerted effort in increasing their capital-intensity.
Figure 38 compares capital productivity across countries. In contrast to the steady improvement in
12.0
10.0
8.0
6.0
4.0
2.0
0.0
12.0
10.0
8.0
6.0
4.0
2.0
0.0
12.0
10.0
8.0
6.0
4.0
2.0
0.0
% % %
9.08.2
7.56.6
5.6 5.6 5.4 5.2 5.1
4.0
2.8 2.6 2.3 2.1
KoreaROCChinaVietnam SingaporeIndonesiaJapanHong Kong MalaysiaThailandMongoliaFijiUS Philippines
1970–2008
10.1
7.77.1 6.8
5.2 5.24.7 4.6
3.5 3.2 3.12.5
1.3 1.3
ChinaKoreaVietnam ROCIndonesiaThailandMalaysiaHong Kong JapanSingaporeFijiUS PhilippinesMongolia
1990–2008
10.39.5
7.97.2
6.0 5.8 5.5 5.2
4.2 4.1
2.9 2.92.3 2.1
KoreaROCSingaporeJapanIndonesiaHong Kong MalaysiaChinaMongoliaVietnam PhilippinesThailandFijiUS
1970–1990
Figure 37: Capital Deepening, 1970–2008, 1970–1990, and 1990–2008
Note: The starting period for Vietnam is 1986. The labor input for Fiji is defined by numbers of employment.Source: APO Productivity Database 2011.01.
0.5
−0.5
−1.5
−2.5
−3.5
−4.5
0.5
−0.5
−1.5
−2.5
−3.5
−4.5
% %0.5
−0.5
−1.5
−2.5
−3.5
−4.5
%
−0.4−0.2
−0.7−1.0−1.1−1.3
−1.7
−2.3−2.3−2.4−2.4−2.8
−3.3−3.6
ThailandMongoliaUS ChinaHong Kong PhilippinesMalaysiaIndonesiaSingaporeFijiJapanVietnam ROCKorea
1970–20080.9
0.3
−0.5−0.7−1.0
−1.2−1.6−1.7−1.7
−2.3−2.5−2.6−3.0−3.0
MongoliaPhilippinesSingaporeUS ChinaMalaysiaJapanThailandHong Kong FijiIndonesiaROCVietnam Korea
1990–2008
−0.6
1.0
−0.6−0.9
−1.6−1.9
−2.0−2.1−2.5
−2.7
−3.2
−4.0−4.0−4.2
ThailandHong Kong US ChinaMongoliaVietnam MalaysiaIndonesiaFijiPhilippinesJapanSingaporeROCKorea
1970–1990
Figure 38: Capital Productivity Growth, 1970–2008, 1970–1990, and 1990–2008
Note: The starting period for Vietnam is 1986.Source: APO Productivity Database 2011.01.
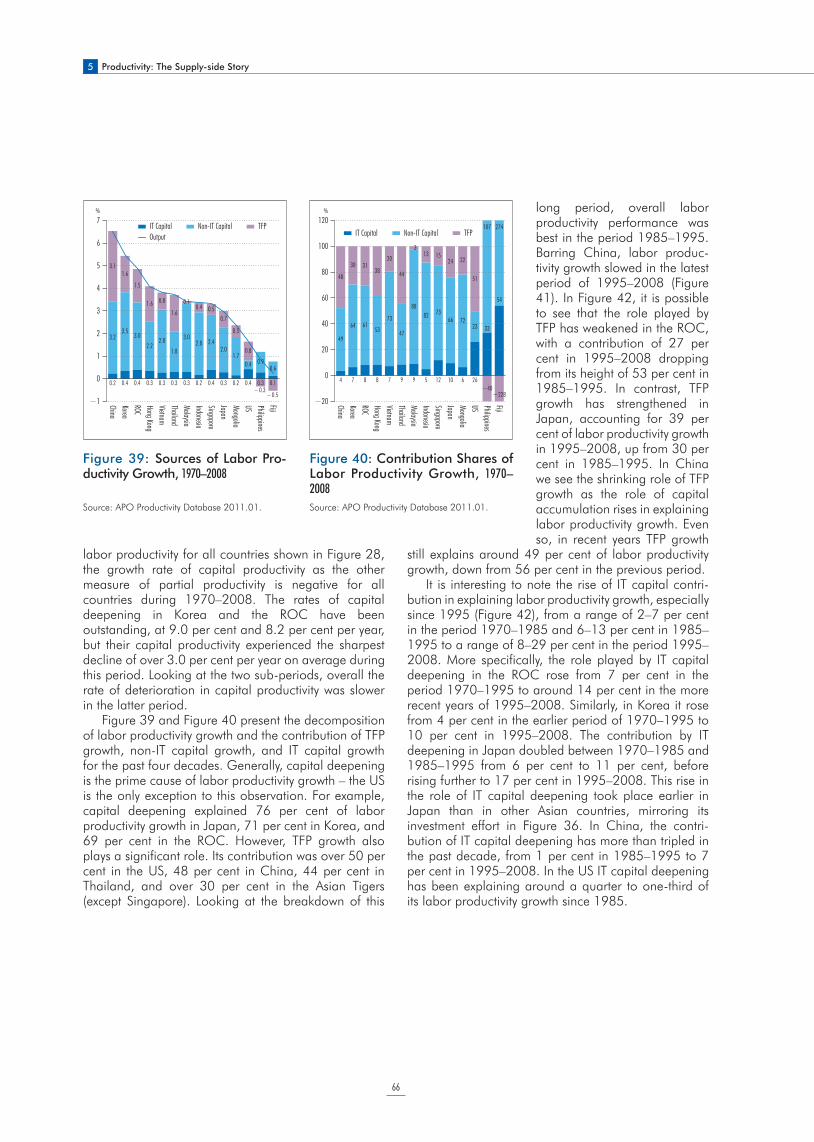
5 Productivity: The Supply-side Story
66
labor productivity for all countries shown in Figure 28, the growth rate of capital productivity as the other measure of partial productivity is negative for all countries during 1970–2008. The rates of capital deepening in Korea and the ROC have been outstanding, at 9.0 per cent and 8.2 per cent per year, but their capital productivity experienced the sharpest decline of over 3.0 per cent per year on average during this period. Looking at the two sub-periods, overall the rate of deterioration in capital productivity was slower in the latter period.
Figure 39 and Figure 40 present the decomposition of labor productivity growth and the contribution of TFP growth, non-IT capital growth, and IT capital growth for the past four decades. Generally, capital deepening is the prime cause of labor productivity growth – the US is the only exception to this observation. For example, capital deepening explained 76 per cent of labor productivity growth in Japan, 71 per cent in Korea, and 69 per cent in the ROC. However, TFP growth also plays a significant role. Its contribution was over 50 per cent in the US, 48 per cent in China, 44 per cent in Thailand, and over 30 per cent in the Asian Tigers (except Singapore). Looking at the breakdown of this
long period, overall labor productivity performance was best in the period 1985–1995. Barring China, labor produc-tivity growth slowed in the latest period of 1995–2008 (Figure 41). In Figure 42, it is possible to see that the role played by TFP has weakened in the ROC, with a contribution of 27 per cent in 1995–2008 dropping from its height of 53 per cent in 1985–1995. In contrast, TFP growth has strengthened in Japan, accounting for 39 per cent of labor productivity growth in 1995–2008, up from 30 per cent in 1985–1995. In China we see the shrinking role of TFP growth as the role of capital accumulation rises in explaining labor productivity growth. Even so, in recent years TFP growth
still explains around 49 per cent of labor productivity growth, down from 56 per cent in the previous period.
It is interesting to note the rise of IT capital contri-bution in explaining labor productivity growth, especially since 1995 (Figure 42), from a range of 2–7 per cent in the period 1970–1985 and 6–13 per cent in 1985–1995 to a range of 8–29 per cent in the period 1995–2008. More specifically, the role played by IT capital deepening in the ROC rose from 7 per cent in the period 1970–1995 to around 14 per cent in the more recent years of 1995–2008. Similarly, in Korea it rose from 4 per cent in the earlier period of 1970–1995 to 10 per cent in 1995–2008. The contribution by IT deepening in Japan doubled between 1970–1985 and 1985–1995 from 6 per cent to 11 per cent, before rising further to 17 per cent in 1995–2008. This rise in the role of IT capital deepening took place earlier in Japan than in other Asian countries, mirroring its investment effort in Figure 36. In China, the contri-bution of IT capital deepening has more than tripled in the past decade, from 1 per cent in 1985–1995 to 7 per cent in 1995–2008. In the US IT capital deepening has been explaining around a quarter to one-third of its labor productivity growth since 1985.
Figure 39: Sources of Labor Pro-ductivity Growth, 1970–2008
Source: APO Productivity Database 2011.01.
Figure 40: Contribution Shares of Labor Productivity Growth, 1970–2008
Source: APO Productivity Database 2011.01.
7
6
5
4
3
2
1
0
−1
%
ChinaKoreaROCHong Kong Vietnam ThailandMalaysiaIndonesiaSingaporeJapanMongoliaUS PhilippinesFiji
0.2 0.4 0.4 0.3 0.3 0.3 0.3 0.2 0.4 0.3 0.2 0.4 0.3 0.1
3.23.5
3.02.2
2.8
1.8
3.02.8 2.4
2.01.7
0.4 0.90.6
3.11.6
1.5
1.6 0.8
1.6
0.10.4 0.5
0.7
0.5
0.8
−0.3−0.5
Output
%120
100
80
60
40
20
0
−20 ChinaKoreaROCHong Kong Vietnam ThailandMalaysiaIndonesiaSingaporeJapanMongoliaUS PhilippinesFiji
4 7 8 8 7 9 9 5 12 10 6 26
33
49
64 6153
73
47
8882 73
66 7223
107
54
274
48
30 3138
20
44
313 15
24 22
51
−40−228
TFP IT Capital Non-IT CapitalTFP IT Capital Non-IT Capital
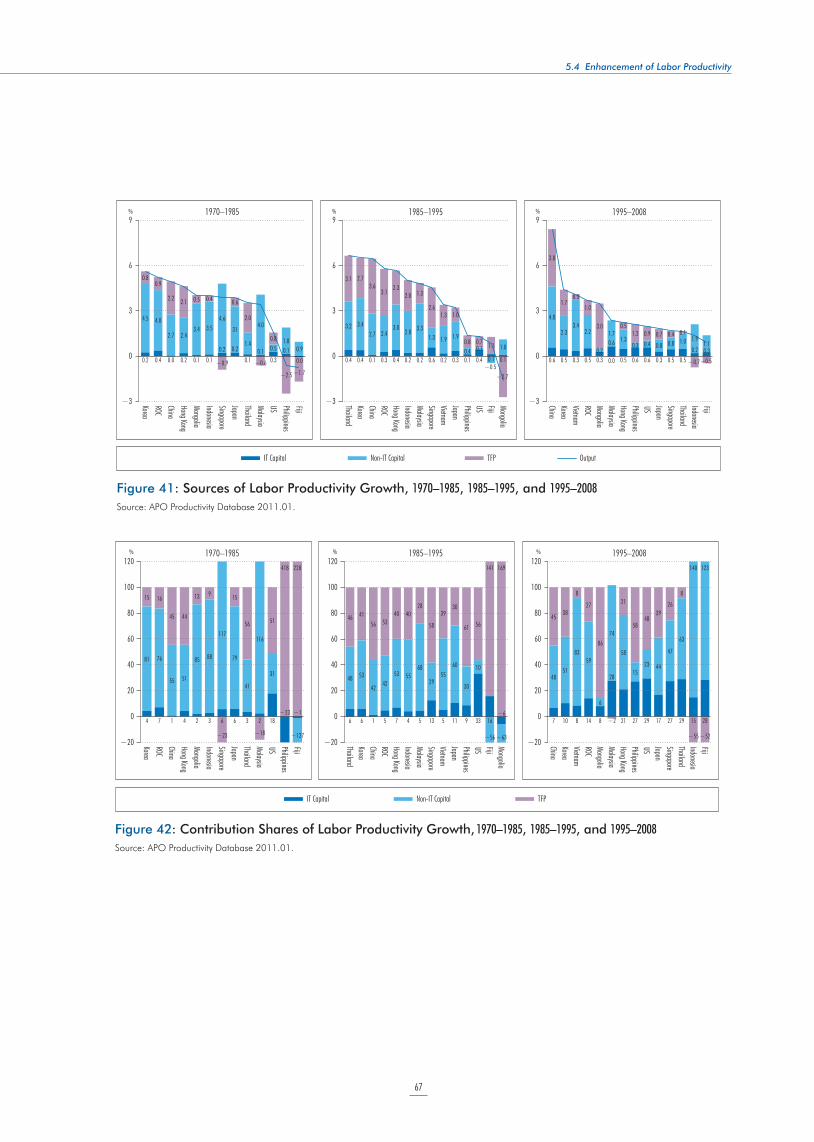
67
5.4 Enhancement of Labor Productivity
9
6
3
0
−3 KoreaROCChinaHong Kong MongoliaIndonesiaSingaporeJapanThailandMalaysiaUS PhilippinesFiji
1970–1985
0.4 0.4 0.1 0.3 0.4 0.2 0.2 0.6 0.2 0.3 0.1 0.4 0.1 0.1
3.2 3.42.7 2.4
3.02.8 3.3
1.3 1.9 1.9
0.4 0.1
−0.5
1.0
3.1 2.73.6
3.12.3
2.0 1.3
2.61.3 1.0
0.8 0.7 1.1
−2.7
ThailandKoreaChinaROCHong Kong IndonesiaMalaysiaSingaporeVietnam JapanPhilippinesUS FijiMongolia
1985–1995
0.6 0.5 0.3 0.5 0.3
0.6
0.5 0.6 0.6 0.3 0.5 0.50.2 0.3
4.0
2.33.4
2.2
0.2
1.71.3
0.3 0.4 0.8 0.8 1.0 1.91.1
3.8
1.70.3
1.0
3.0
0.0
0.51.2 0.9 0.7 0.4 0.1
−0.7−0.5
ChinaKoreaVietnam ROCMongoliaMalaysiaHong Kong PhilippinesUS JapanSingaporeThailandIndonesiaFiji
1995–20089
6
3
0
−3
9
6
3
0
−3
% % %
0.0
0.9
−1.7
0.2 0.4 0.0 0.2 0.1 0.1
0.2 0.2
0.10.1
0.30.1
4.5 4.0
2.7 2.43.4 3.5
4.6
31
1.4
4.0
0.51.8
0.80.9
2.2 2.1 0.5 0.4
−0.9
0.6
2.0
−0.6
0.8
−2.5
IT Capital Non-IT Capital TFP Output
Figure 41: Sources of Labor Productivity Growth, 1970–1985, 1985–1995, and 1995–2008
Source: APO Productivity Database 2011.01.
120
100
80
60
40
20
0
−20
4 7 1 4 2 3 6 6 3 2 18−23 −1
81 76
55 51
85 88
117
79
41
116
31
15 16
45 44
13 9
−23
15
56
−18 −127
51
418 228
KoreaROCChinaHong Kong MongoliaIndonesiaSingaporeJapanThailandMalaysiaUS PhilippinesFiji
1970–1985
6 6 1 5 7 4 5 13 5 11 9 33 16−6
48 53
4242
53 5568
2955
60
30
10
−56 −63
46 4156 53
40 4028
58
3930
61 56
141 169
ThailandKoreaChinaROCHong Kong IndonesiaMalaysiaSingaporeVietnam JapanPhilippinesUS FijiMongolia
1985–1995
7 10 8 14 8
28
21 27 29 17 27 29 15 28
4851
8359
6
74
58
1523 44
47
63
140 123
4538
8
27
86
−2
21
5848
3926
8
−55 −52
ChinaKoreaVietnam ROCMongoliaMalaysiaHong Kong PhilippinesUS JapanSingaporeThailandIndonesiaFiji
1995–2008120
100
80
60
40
20
0
−20
120
100
80
60
40
20
0
−20
% % %
IT Capital Non-IT Capital TFP
Figure 42: Contribution Shares of Labor Productivity Growth, 1970–1985, 1985–1995, and 1995–2008
Source: APO Productivity Database 2011.01.
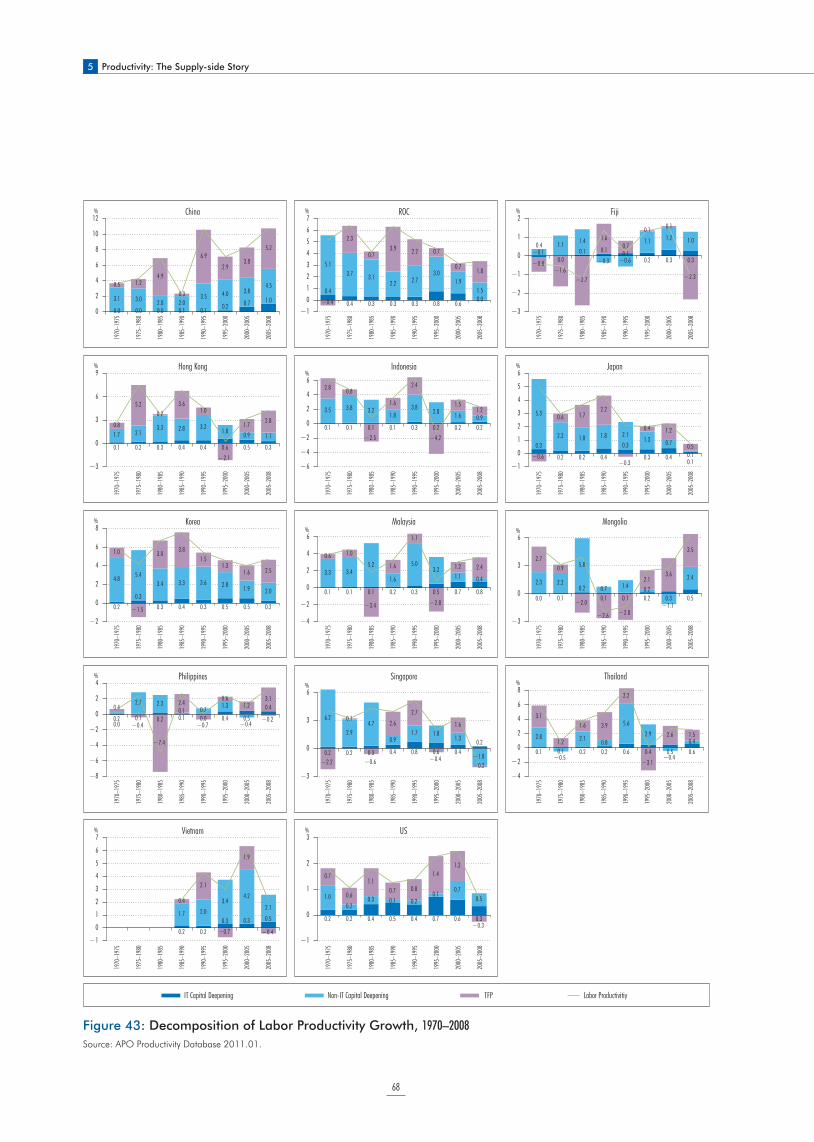
5 Productivity: The Supply-side Story
68
IT Capital Deepening Non-IT Capital Deepening TFP Labor Productivitiy
1970
–197
5
1975
–198
0
1980
–198
5
1985
–199
0
1990
–199
5
1995
–200
0
2000
–200
5
2005
–200
8
1970
–197
5
1975
–198
0
1980
–198
5
1985
–199
0
1990
–199
5
1995
–200
0
2000
–200
5
2005
–200
8
7
6
5
4
3
2
1
0
−10.2 0.2
0.3 0.3 0.51.7 2.0
3.44.2
2.10.4
2.1
−0.7
1.9
−0.4
Vietnam3
2
1
0
−1
% %
0.2 0.2 0.4 0.5 0.4 0.7 0.6 0.3
1.00.2
0.3 0.1 0.20.1
0.70.5
0.7
0.6
1.10.7 0.8
1.41.2
−0.3
US
9
6
3
0
−3
1970
–197
5
1975
–198
0
1980
–198
5
1985
–199
0
1990
–199
5
1995
–200
0
2000
–200
5
2005
–200
8
1970
–197
5
1975
–198
0
1980
–198
5
1985
–199
0
1990
–199
5
1995
–200
0
2000
–200
5
2005
–200
8
1970
–197
5
1975
–198
0
1980
–198
5
1985
–199
0
1990
–199
5
1995
–200
0
2000
–200
5
2005
–200
8
0.1 0.2 0.3 0.4 0.4 0.6 0.5 0.3
1.7 2.13.3 2.8 3.2
1.8 0.9 1.1
0.8
5.20.2
3.61.0
−2.1
1.7 2.8
Hong Kong6
4
2
0
−2
−4
−6
%
0.1 0.1 0.1 0.1 0.3 0.2 0.2 0.2
3.5 3.8 3.21.8
3.82.8 1.6 0.9
2.8 0.8
−2.5
1.6
2.4
−4.2
1.51.2
Indonesia6
5
4
3
2
1
0
−1
% %
0.3
0.2 0.2 0.4
0.3
0.3 0.40.1
5.3
2.2 1.8 1.8 2.11.3 0.7
0.1−0.6
0.6 1.72.2
−0.3
0.4 1.2
0.5
Japan
12
10
8
6
4
2
0
1970
–197
5
1975
–198
0
1980
–198
5
1985
–199
0
1990
–199
5
1995
–200
0
2000
–200
5
2005
–200
8
1970
–197
5
1975
–198
0
1980
–198
5
1985
–199
0
1990
–199
5
1995
–200
0
2000
–200
5
2005
–200
8
1970
–197
5
1975
–198
0
1980
–198
5
1985
–199
0
1990
–199
5
1995
–200
0
2000
–200
5
2005
–200
8
0.0 0.0 0.0 0.1 0.10.2 0.7 1.03.1 3.0 2.0 2.0
3.5 4.0 3.84.50.5 1.2
4.9
0.3
6.9
2.93.8
5.2
China
0.4
0.4 0.3 0.3 0.3 0.8 0.60.0
5.13.7 3.1
2.2 2.73.0
1.91.5
−0.4
2.3
0.73.9 2.2 0.7
0.71.8
ROC76543210
−1
−0.10.0
0.1 0.1 0.10.2 0.3 0.3
0.4 1.1 1.4
−0.3 −0.6
1.1 1.2 1.0
−0.8−1.6
−2.7
1.60.7
0.1 0.1
−2.3
Fiji2
1
0
−1
−2
−3
% % %
1970
–197
5
1975
–198
0
1980
–198
5
1985
–199
0
1990
–199
5
1995
–200
0
2000
–200
5
2005
–200
8
1970
–197
5
1975
–198
0
1980
–198
5
1985
–199
0
1990
–199
5
1995
–200
0
2000
–200
5
2005
–200
8
1970
–197
5
1975
–198
0
1980
–198
5
1985
–199
0
1990
–199
5
1995
–200
0
2000
–200
5
2005
–200
8
0.20.3
0.3 0.4 0.3 0.5 0.5 0.2
4.8 5.43.4 3.3 3.6 2.8
1.9 2.0
1.0
−1.5
3.03.8
1.51.3
1.6 2.5
Korea8
6
4
2
0
−2
%
0.1 0.1 0.1 0.2 0.3 0.5 0.7 0.8
3.3 3.45.2
1.6
5.03.2
1.1 0.4
0.6 1.0
−3.4
1.6
1.1
−2.8
1.2 2.4
Malaysia6
4
2
0
−2
−4
%
0.0 0.10.2
0.1 0.1 0.2 0.3 0.5
2.3 2.2
5.8
0.7 1.4 0.2
−1.1
2.4
2.70.9
−2.0
−2.6 −2.8
2.13.6
3.5
Mongolia
6
3
0
−3
%
1970
–197
5
1975
–198
0
1980
–198
5
1985
–199
0
1990
–199
5
1995
–200
0
2000
–200
5
2005
–200
8
1970
–197
5
1975
–198
0
1980
–198
5
1985
–199
0
1990
–199
5
1995
–200
0
2000
–200
5
2005
–200
8
1970
–197
5
1975
–198
0
1980
–198
5
1985
–199
0
1990
–199
5
1995
–200
0
2000
–200
5
2005
–200
8
0.00.1 0.2
0.10.0 0.4 0.5
0.4
0.2
2.7 2.3
0.10.7
1.3
−0.4−0.2
0.4
−0.4
−7.4
2.4
−0.7
0.61.2
3.1
Philippines4
2
0
−2
−4
−6
−8
%
0.2 0.2 0.3 0.4 0.8 0.6 0.40.2
6.2
2.94.7
0.91.7 1.8
1.3
−1.8−2.2
0.1
−0.6
2.6
2.7
−0.4
1.6
−0.2
Singapore
6
3
0
−3
%
0.1 0.1 0.2 0.2 0.6 0.4 0.5 0.6
2.8
−0.5
2.1 0.8
5.6
2.9
−0.4
0.4
3.1
1.2
1.6 3.9
2.2
−3.1
2.6 1.5
Thailand8
6
4
2
0
−2
−4
%
Figure 43: Decomposition of Labor Productivity Growth, 1970–2008
Source: APO Productivity Database 2011.01.
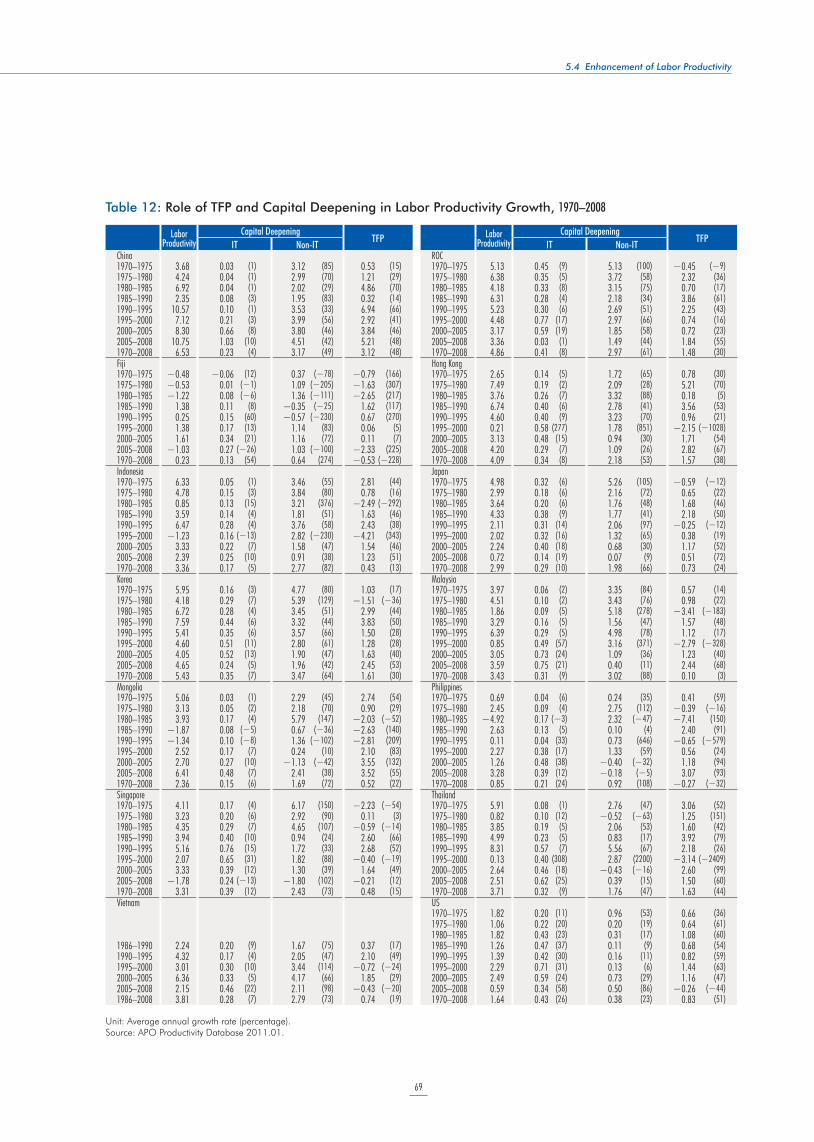
69
5.4 Enhancement of Labor Productivity
Labor Productivity
Capital DeepeningTFP Labor
ProductivityCapital Deepening
TFPIT Non-IT IT Non-IT
China ROC1970–1975 3.68 0.03 (1) 3.12 (85) 0.53 (15) 1970–1975 5.13 0.45 (9) 5.13 (100) !0.45 (!9)
1975–1980 4.24 0.04 (1) 2.99 (70) 1.21 (29) 1975–1980 6.38 0.35 (5) 3.72 (58) 2.32 (36)
1980–1985 6.92 0.04 (1) 2.02 (29) 4.86 (70) 1980–1985 4.18 0.33 (8) 3.15 (75) 0.70 (17)
1985–1990 2.35 0.08 (3) 1.95 (83) 0.32 (14) 1985–1990 6.31 0.28 (4) 2.18 (34) 3.86 (61)
1990–1995 10.57 0.10 (1) 3.53 (33) 6.94 (66) 1990–1995 5.23 0.30 (6) 2.69 (51) 2.25 (43)
1995–2000 7.12 0.21 (3) 3.99 (56) 2.92 (41) 1995–2000 4.48 0.77 (17) 2.97 (66) 0.74 (16)
2000–2005 8.30 0.66 (8) 3.80 (46) 3.84 (46) 2000–2005 3.17 0.59 (19) 1.85 (58) 0.72 (23)
2005–2008 10.75 1.03 (10) 4.51 (42) 5.21 (48) 2005–2008 3.36 0.03 (1) 1.49 (44) 1.84 (55)
1970–2008 6.53 0.23 (4) 3.17 (49) 3.12 (48) 1970–2008 4.86 0.41 (8) 2.97 (61) 1.48 (30)
Fiji Hong Kong1970–1975 !0.48 !0.06 (12) 0.37 (!78) !0.79 (166) 1970–1975 2.65 0.14 (5) 1.72 (65) 0.78 (30)
1975–1980 !0.53 0.01 (!1) 1.09 (!205) !1.63 (307) 1975–1980 7.49 0.19 (2) 2.09 (28) 5.21 (70)
1980–1985 !1.22 0.08 (!6) 1.36 (!111) !2.65 (217) 1980–1985 3.76 0.26 (7) 3.32 (88) 0.18 (5)
1985–1990 1.38 0.11 (8) !0.35 (!25) 1.62 (117) 1985–1990 6.74 0.40 (6) 2.78 (41) 3.56 (53)
1990–1995 0.25 0.15 (60) !0.57 (!230) 0.67 (270) 1990–1995 4.60 0.40 (9) 3.23 (70) 0.96 (21)
1995–2000 1.38 0.17 (13) 1.14 (83) 0.06 (5) 1995–2000 0.21 0.58 (277) 1.78 (851) !2.15 (!1028)
2000–2005 1.61 0.34 (21) 1.16 (72) 0.11 (7) 2000–2005 3.13 0.48 (15) 0.94 (30) 1.71 (54)
2005–2008 !1.03 0.27 (!26) 1.03 (!100) !2.33 (225) 2005–2008 4.20 0.29 (7) 1.09 (26) 2.82 (67)
1970–2008 0.23 0.13 (54) 0.64 (274) !0.53 (!228) 1970–2008 4.09 0.34 (8) 2.18 (53) 1.57 (38)
Indonesia Japan1970–1975 6.33 0.05 (1) 3.46 (55) 2.81 (44) 1970–1975 4.98 0.32 (6) 5.26 (105) !0.59 (!12)
1975–1980 4.78 0.15 (3) 3.84 (80) 0.78 (16) 1975–1980 2.99 0.18 (6) 2.16 (72) 0.65 (22)
1980–1985 0.85 0.13 (15) 3.21 (376) !2.49 (!292) 1980–1985 3.64 0.20 (6) 1.76 (48) 1.68 (46)
1985–1990 3.59 0.14 (4) 1.81 (51) 1.63 (46) 1985–1990 4.33 0.38 (9) 1.77 (41) 2.18 (50)
1990–1995 6.47 0.28 (4) 3.76 (58) 2.43 (38) 1990–1995 2.11 0.31 (14) 2.06 (97) !0.25 (!12)
1995–2000 !1.23 0.16 (!13) 2.82 (!230) !4.21 (343) 1995–2000 2.02 0.32 (16) 1.32 (65) 0.38 (19)
2000–2005 3.33 0.22 (7) 1.58 (47) 1.54 (46) 2000–2005 2.24 0.40 (18) 0.68 (30) 1.17 (52)
2005–2008 2.39 0.25 (10) 0.91 (38) 1.23 (51) 2005–2008 0.72 0.14 (19) 0.07 (9) 0.51 (72)
1970–2008 3.36 0.17 (5) 2.77 (82) 0.43 (13) 1970–2008 2.99 0.29 (10) 1.98 (66) 0.73 (24)
Korea Malaysia1970–1975 5.95 0.16 (3) 4.77 (80) 1.03 (17) 1970–1975 3.97 0.06 (2) 3.35 (84) 0.57 (14)
1975–1980 4.18 0.29 (7) 5.39 (129) !1.51 (!36) 1975–1980 4.51 0.10 (2) 3.43 (76) 0.98 (22)
1980–1985 6.72 0.28 (4) 3.45 (51) 2.99 (44) 1980–1985 1.86 0.09 (5) 5.18 (278) !3.41 (!183)
1985–1990 7.59 0.44 (6) 3.32 (44) 3.83 (50) 1985–1990 3.29 0.16 (5) 1.56 (47) 1.57 (48)
1990–1995 5.41 0.35 (6) 3.57 (66) 1.50 (28) 1990–1995 6.39 0.29 (5) 4.98 (78) 1.12 (17)
1995–2000 4.60 0.51 (11) 2.80 (61) 1.28 (28) 1995–2000 0.85 0.49 (57) 3.16 (371) !2.79 (!328)
2000–2005 4.05 0.52 (13) 1.90 (47) 1.63 (40) 2000–2005 3.05 0.73 (24) 1.09 (36) 1.23 (40)
2005–2008 4.65 0.24 (5) 1.96 (42) 2.45 (53) 2005–2008 3.59 0.75 (21) 0.40 (11) 2.44 (68)
1970–2008 5.43 0.35 (7) 3.47 (64) 1.61 (30) 1970–2008 3.43 0.31 (9) 3.02 (88) 0.10 (3)
Mongolia Philippines1970–1975 5.06 0.03 (1) 2.29 (45) 2.74 (54) 1970–1975 0.69 0.04 (6) 0.24 (35) 0.41 (59)
1975–1980 3.13 0.05 (2) 2.18 (70) 0.90 (29) 1975–1980 2.45 0.09 (4) 2.75 (112) !0.39 (!16)
1980–1985 3.93 0.17 (4) 5.79 (147) !2.03 (!52) 1980–1985 !4.92 0.17 (!3) 2.32 (!47) !7.41 (150)
1985–1990 !1.87 0.08 (!5) 0.67 (!36) !2.63 (140) 1985–1990 2.63 0.13 (5) 0.10 (4) 2.40 (91)
1990–1995 !1.34 0.10 (!8) 1.36 (!102) !2.81 (209) 1990–1995 0.11 0.04 (33) 0.73 (646) !0.65 (!579)
1995–2000 2.52 0.17 (7) 0.24 (10) 2.10 (83) 1995–2000 2.27 0.38 (17) 1.33 (59) 0.56 (24)
2000–2005 2.70 0.27 (10) !1.13 (!42) 3.55 (132) 2000–2005 1.26 0.48 (38) !0.40 (!32) 1.18 (94)
2005–2008 6.41 0.48 (7) 2.41 (38) 3.52 (55) 2005–2008 3.28 0.39 (12) !0.18 (!5) 3.07 (93)
1970–2008 2.36 0.15 (6) 1.69 (72) 0.52 (22) 1970–2008 0.85 0.21 (24) 0.92 (108) !0.27 (!32)
Singapore Thailand1970–1975 4.11 0.17 (4) 6.17 (150) !2.23 (!54) 1970–1975 5.91 0.08 (1) 2.76 (47) 3.06 (52)
1975–1980 3.23 0.20 (6) 2.92 (90) 0.11 (3) 1975–1980 0.82 0.10 (12) !0.52 (!63) 1.25 (151)
1980–1985 4.35 0.29 (7) 4.65 (107) !0.59 (!14) 1980–1985 3.85 0.19 (5) 2.06 (53) 1.60 (42)
1985–1990 3.94 0.40 (10) 0.94 (24) 2.60 (66) 1985–1990 4.99 0.23 (5) 0.83 (17) 3.92 (79)
1990–1995 5.16 0.76 (15) 1.72 (33) 2.68 (52) 1990–1995 8.31 0.57 (7) 5.56 (67) 2.18 (26)
1995–2000 2.07 0.65 (31) 1.82 (88) !0.40 (!19) 1995–2000 0.13 0.40 (308) 2.87 (2200) !3.14 (!2409)
2000–2005 3.33 0.39 (12) 1.30 (39) 1.64 (49) 2000–2005 2.64 0.46 (18) !0.43 (!16) 2.60 (99)
2005–2008 !1.78 0.24 (!13) !1.80 (102) !0.21 (12) 2005–2008 2.51 0.62 (25) 0.39 (15) 1.50 (60)
1970–2008 3.31 0.39 (12) 2.43 (73) 0.48 (15) 1970–2008 3.71 0.32 (9) 1.76 (47) 1.63 (44)
Vietnam US1970–1975 1.82 0.20 (11) 0.96 (53) 0.66 (36)
1975–1980 1.06 0.22 (20) 0.20 (19) 0.64 (61)
1980–1985 1.82 0.43 (23) 0.31 (17) 1.08 (60)
1986–1990 2.24 0.20 (9) 1.67 (75) 0.37 (17) 1985–1990 1.26 0.47 (37) 0.11 (9) 0.68 (54)
1990–1995 4.32 0.17 (4) 2.05 (47) 2.10 (49) 1990–1995 1.39 0.42 (30) 0.16 (11) 0.82 (59)
1995–2000 3.01 0.30 (10) 3.44 (114) !0.72 (!24) 1995–2000 2.29 0.71 (31) 0.13 (6) 1.44 (63)
2000–2005 6.36 0.33 (5) 4.17 (66) 1.85 (29) 2000–2005 2.49 0.59 (24) 0.73 (29) 1.16 (47)
2005–2008 2.15 0.46 (22) 2.11 (98) !0.43 (!20) 2005–2008 0.59 0.34 (58) 0.50 (86) !0.26 (!44)
1986–2008 3.81 0.28 (7) 2.79 (73) 0.74 (19) 1970–2008 1.64 0.43 (26) 0.38 (23) 0.83 (51)
Unit: Average annual growth rate (percentage).Source: APO Productivity Database 2011.01.
Table 12: Role of TFP and Capital Deepening in Labor Productivity Growth, 1970–2008
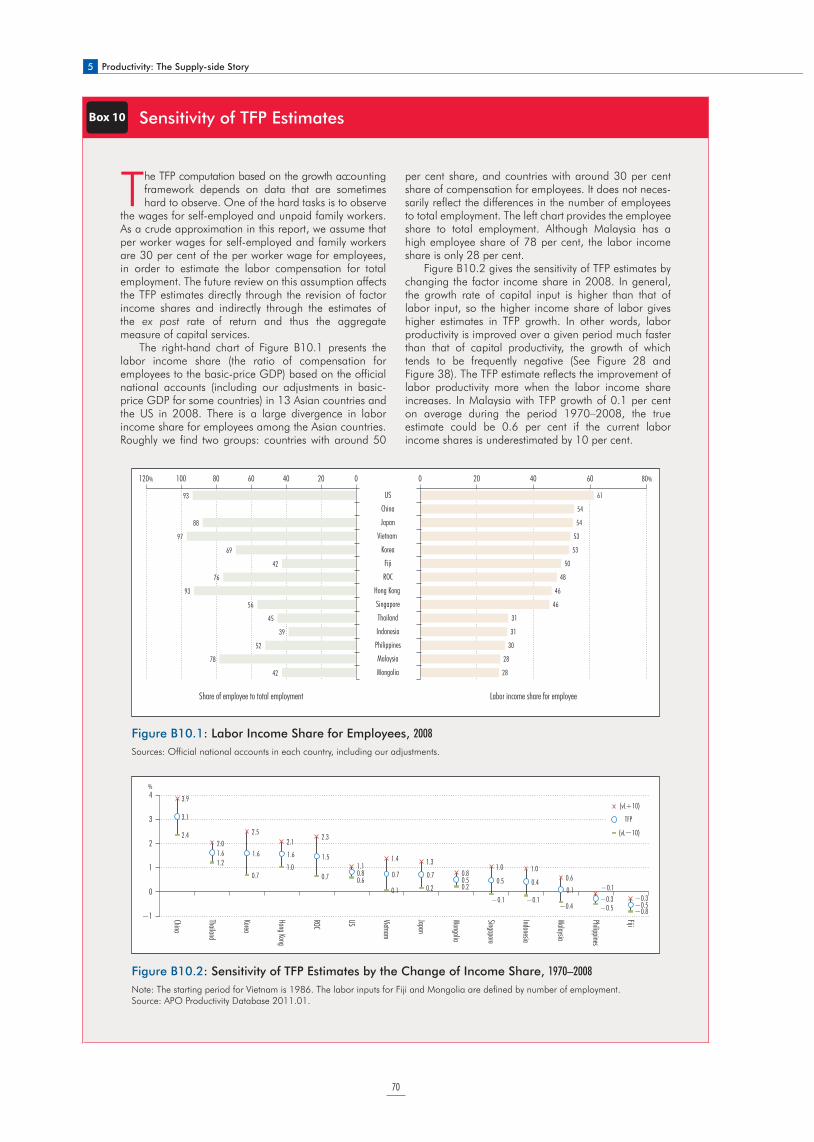
5 Productivity: The Supply-side Story
70
Box 10 Sensitivity of TFP Estimates
The TFP computation based on the growth accounting framework depends on data that are sometimes hard to observe. One of the hard tasks is to observe
the wages for self-employed and unpaid family workers. As a crude approximation in this report, we assume that per worker wages for self-employed and family workers are 30 per cent of the per worker wage for employees, in order to estimate the labor compensation for total employment. The future review on this assumption affects the TFP estimates directly through the revision of factor income shares and indirectly through the estimates of the ex post rate of return and thus the aggregate measure of capital services.
The right-hand chart of Figure B10.1 presents the labor income share (the ratio of compensation for employees to the basic-price GDP) based on the official national accounts (including our adjustments in basic-price GDP for some countries) in 13 Asian countries and the US in 2008. There is a large divergence in labor income share for employees among the Asian countries. Roughly we find two groups: countries with around 50
per cent share, and countries with around 30 per cent share of compensation for employees. It does not neces-sarily reflect the differences in the number of employees to total employment. The left chart provides the employee share to total employment. Although Malaysia has a high employee share of 78 per cent, the labor income share is only 28 per cent.
Figure B10.2 gives the sensitivity of TFP estimates by changing the factor income share in 2008. In general, the growth rate of capital input is higher than that of labor input, so the higher income share of labor gives higher estimates in TFP growth. In other words, labor productivity is improved over a given period much faster than that of capital productivity, the growth of which tends to be frequently negative (See Figure 28 and Figure 38). The TFP estimate reflects the improvement of labor productivity more when the labor income share increases. In Malaysia with TFP growth of 0.1 per cent on average during the period 1970–2008, the true estimate could be 0.6 per cent if the current labor income shares is underestimated by 10 per cent.
Figure B10.1: Labor Income Share for Employees, 2008
Sources: Official national accounts in each country, including our adjustments.
120%
93
88
97
69
42
76
93
56
45
39
52
78
42
020406080100
Share of employee to total employment
0 20 40 60 80%
US
China
Japan
Vietnam
Korea
Fiji
ROC
Hong Kong
Singapore
Thailand
Indonesia
Philippines
Malaysia
Mongolia
61
54
54
53
53
50
48
46
46
31
31
30
28
28
Labor income share for employee
Figure B10.2: Sensitivity of TFP Estimates by the Change of Income Share, 1970–2008
Note: The starting period for Vietnam is 1986. The labor inputs for Fiji and Mongolia are defined by number of employment.Source: APO Productivity Database 2011.01.
4
3
2
1
0
−1
%
3.1
1.6 1.6 1.6 1.5
0.8 0.7 0.70.5 0.5 0.4
0.1−0.3
−0.5
3.9
2.02.5
2.12.3
1.11.4 1.3
0.81.0 1.0
0.6−0.1
−0.3
2.4
1.2
0.71.0
0.7 0.60.1 0.2 0.2
−0.1 −0.1−0.4 −0.5 −0.8
China
Thailand
Korea
Hong Kong
ROC
US Vietnam
Japan
Mongolia
Singapore
Indonesia
Malaysia
Philippines
Fiji
TFP
(vL+10)
(vL−10)
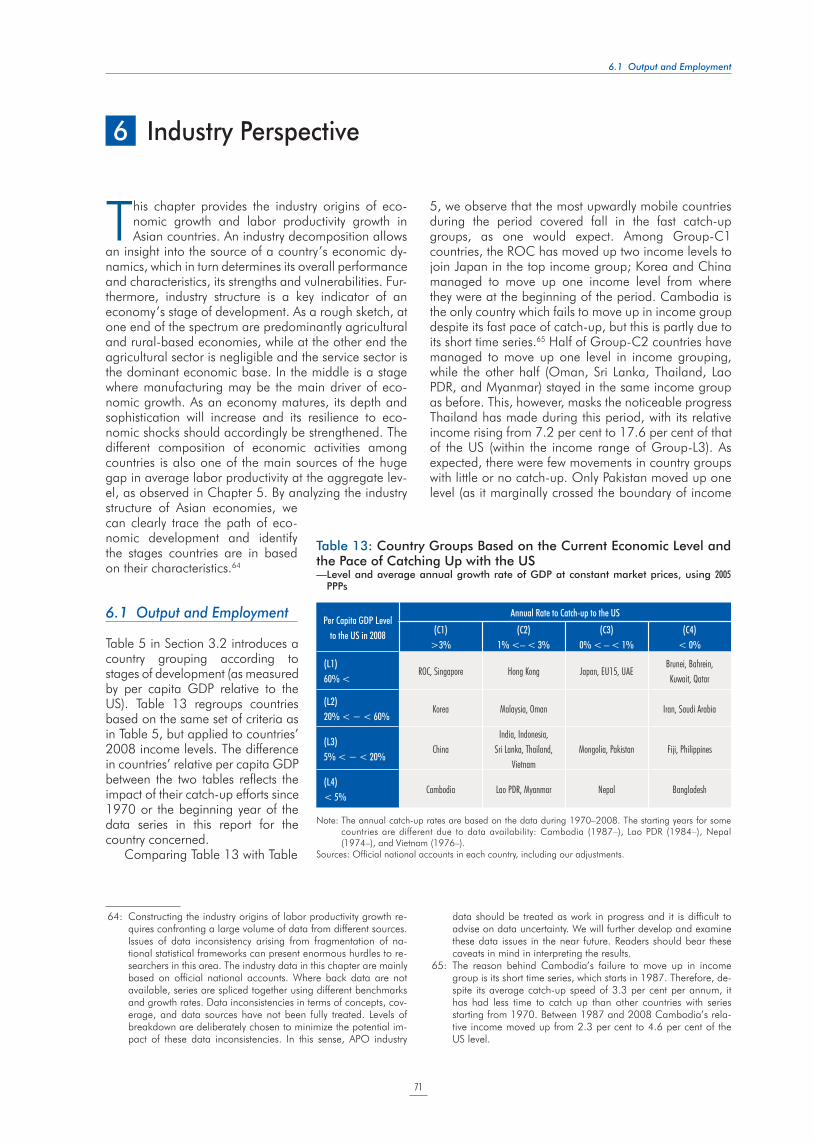
6.1 Output and Employment
71
This chapter provides the industry origins of eco-nomic growth and labor productivity growth in Asian countries. An industry decomposition allows
an insight into the source of a country’s economic dy-namics, which in turn determines its overall performance and characteristics, its strengths and vulnerabilities. Fur-thermore, industry structure is a key indicator of an economy’s stage of development. As a rough sketch, at one end of the spectrum are predominantly agricultural and rural-based economies, while at the other end the agricultural sector is negligible and the service sector is the dominant economic base. In the middle is a stage where manufacturing may be the main driver of eco-nomic growth. As an economy matures, its depth and sophistication will increase and its resilience to eco-nomic shocks should accordingly be strengthened. The different composition of economic activities among countries is also one of the main sources of the huge gap in average labor productivity at the aggregate lev-el, as observed in Chapter 5. By analyzing the industry structure of Asian economies, we can clearly trace the path of eco-nomic development and identify the stages countries are in based on their characteristics.64
6.1 Output and Employment
Table 5 in Section 3.2 introduces a country grouping according to stages of development (as measured by per capita GDP relative to the US). Table 13 regroups countries based on the same set of criteria as in Table 5, but applied to countries’ 2008 income levels. The difference in countries’ relative per capita GDP between the two tables reflects the impact of their catch-up efforts since 1970 or the beginning year of the data series in this report for the country concerned.
Comparing Table 13 with Table
5, we observe that the most upwardly mobile countries during the period covered fall in the fast catch-up groups, as one would expect. Among Group-C1 countries, the ROC has moved up two income levels to join Japan in the top income group; Korea and China managed to move up one income level from where they were at the beginning of the period. Cambodia is the only country which fails to move up in income group despite its fast pace of catch-up, but this is partly due to its short time series.65 Half of Group-C2 countries have managed to move up one level in income grouping, while the other half (Oman, Sri Lanka, Thailand, Lao PDR, and Myanmar) stayed in the same income group as before. This, however, masks the noticeable progress Thailand has made during this period, with its relative income rising from 7.2 per cent to 17.6 per cent of that of the US (within the income range of Group-L3). As expected, there were few movements in country groups with little or no catch-up. Only Pakistan moved up one level (as it marginally crossed the boundary of income
6 Industry Perspective
64: Constructing the industry origins of labor productivity growth re-quires confronting a large volume of data from different sources. Issues of data inconsistency arising from fragmentation of na-tional statistical frameworks can present enormous hurdles to re-searchers in this area. The industry data in this chapter are mainly based on official national accounts. Where back data are not available, series are spliced together using different benchmarks and growth rates. Data inconsistencies in terms of concepts, cov-erage, and data sources have not been fully treated. Levels of breakdown are deliberately chosen to minimize the potential im-pact of these data inconsistencies. In this sense, APO industry
data should be treated as work in progress and it is difficult to advise on data uncertainty. We will further develop and examine these data issues in the near future. Readers should bear these caveats in mind in interpreting the results.
65: The reason behind Cambodia’s failure to move up in income group is its short time series, which starts in 1987. Therefore, de-spite its average catch-up speed of 3.3 per cent per annum, it has had less time to catch up than other countries with series starting from 1970. Between 1987 and 2008 Cambodia’s rela-tive income moved up from 2.3 per cent to 4.6 per cent of the US level.
Note: The annual catch-up rates are based on the data during 1970–2008. The starting years for some countries are different due to data availability: Cambodia (1987–), Lao PDR (1984–), Nepal (1974–), and Vietnam (1976–).
Sources: Official national accounts in each country, including our adjustments.
Per Capita GDP Level
to the US in 2008
Annual Rate to Catch-up to the US
(C1)
>3%
(C2)
1% <– < 3%
(C3)
0% < – < 1%
(C4)
< 0%
(L1)
60% <ROC, Singapore Hong Kong Japan, EU15, UAE
Brunei, Bahrein,
Kuwait, Qatar
(L2)
20% < ! < 60%Korea Malaysia, Oman Iran, Saudi Arabia
(L3)
5% < ! < 20%China
India, Indonesia,
Sri Lanka, Thailand,
Vietnam
Mongolia, Pakistan Fiji, Philippines
(L4)
< 5%Cambodia Lao PDR, Myanmar Nepal Bangladesh
Table 13: Country Groups Based on the Current Economic Level and the Pace of Catching Up with the US— Level and average annual growth rate of GDP at constant market prices, using 2005
PPPs
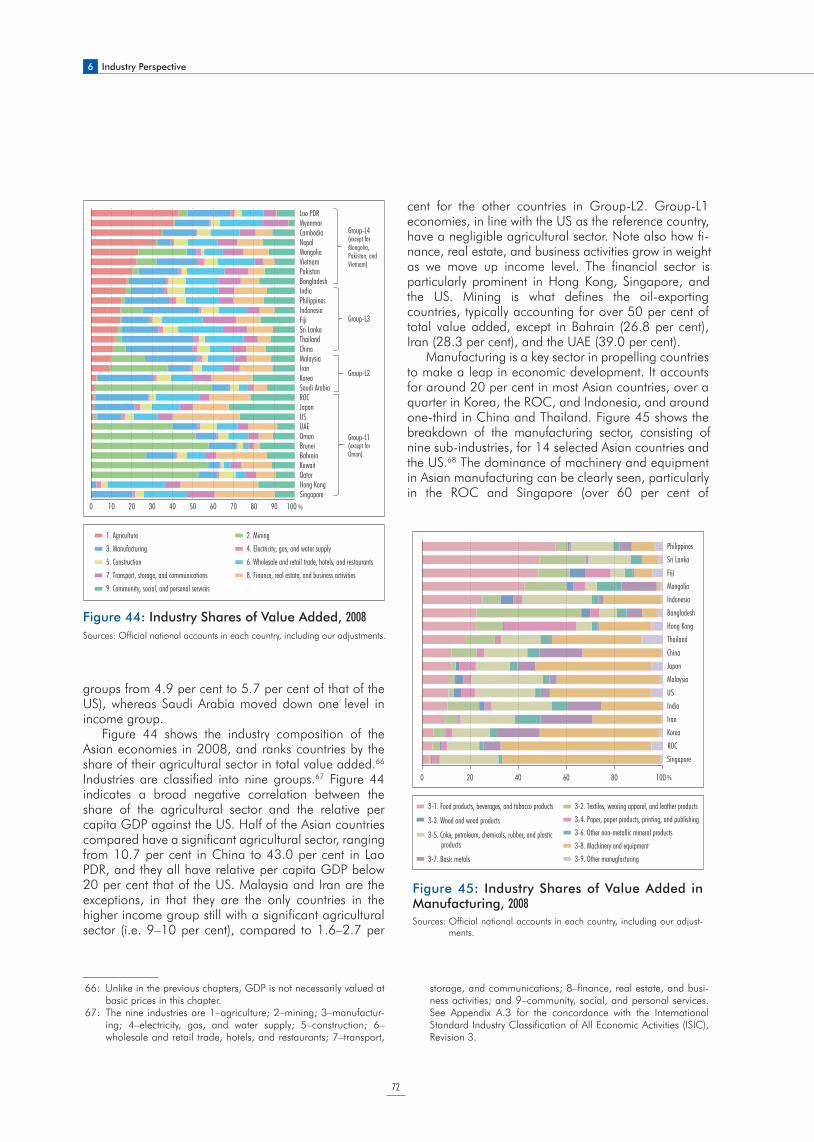
6 Industry Perspective
72
groups from 4.9 per cent to 5.7 per cent of that of the US), whereas Saudi Arabia moved down one level in income group.
Figure 44 shows the industry composition of the Asian economies in 2008, and ranks countries by the share of their agricultural sector in total value added.66 Industries are classified into nine groups.67 Figure 44 indicates a broad negative correlation between the share of the agricultural sector and the relative per capita GDP against the US. Half of the Asian countries compared have a significant agricultural sector, ranging from 10.7 per cent in China to 43.0 per cent in Lao PDR, and they all have relative per capita GDP below 20 per cent that of the US. Malaysia and Iran are the exceptions, in that they are the only countries in the higher income group still with a significant agricultural sector (i.e. 9–10 per cent), compared to 1.6–2.7 per
cent for the other countries in Group-L2. Group-L1 economies, in line with the US as the reference country, have a negligible agricultural sector. Note also how fi- nance, real estate, and business activities grow in weight as we move up income level. The financial sector is particularly prominent in Hong Kong, Singapore, and the US. Mining is what defines the oil-exporting countries, typically accounting for over 50 per cent of total value added, except in Bahrain (26.8 per cent), Iran (28.3 per cent), and the UAE (39.0 per cent).
Manufacturing is a key sector in propelling countries to make a leap in economic development. It accounts for around 20 per cent in most Asian countries, over a quarter in Korea, the ROC, and Indonesia, and around one-third in China and Thailand. Figure 45 shows the breakdown of the manufacturing sector, consisting of nine sub-industries, for 14 selected Asian countries and the US.68 The dominance of machinery and equipment in Asian manufacturing can be clearly seen, particularly in the ROC and Singapore (over 60 per cent of
0 10 20 30 40 50 60 70 80 90 100 %SingaporeHong KongQatarKuwaitBahrainBruneiOmanUAEUSJapanROCSaudi Arabia KoreaIranMalaysiaChinaThailandSri LankaFijiIndonesiaPhilippinesIndiaBangladeshPakistanVietnam MongoliaNepalCambodiaMyanmarLao PDR
Group-L3
Group-L2
Group-L1(except for Oman)
Group-L4(except for Mongolia,Pakistan, and Vietnam)
3. Manufacturing2. Mining1. Agriculture4. Electricity, gas, and water supply
7. Transport, storage, and communications 5. Construction
8. Finance, real estate, and business activities 6. Wholesale and retail trade, hotels, and restaurants
9. Community, social, and personal services
Figure 44: Industry Shares of Value Added, 2008
Sources: Official national accounts in each country, including our adjustments.
66: Unlike in the previous chapters, GDP is not necessarily valued at basic prices in this chapter.
67: The nine industries are 1–agriculture; 2–mining; 3–manufactur-ing; 4–electricity, gas, and water supply; 5–construction; 6–wholesale and retail trade, hotels, and restaurants; 7–transport,
storage, and communications; 8–finance, real estate, and busi-ness activities; and 9–community, social, and personal services. See Appendix A.3 for the concordance with the International Standard Industry Classification of All Economic Activities (ISIC), Revision 3.
3-1. Food products, beverages, and tobacco products
3-3. Wood and wood products
3-5. Coke, petroleum, chemicals, rubber, and plastic products
3-7. Basic metals
3-2. Textiles, wearing apparel, and leather products3-4. Paper, paper products, printing, and publishing3-6. Other non-metallic mineral products3-8. Machinery and equipment3-9. Other manugfacturing
0 20 40 60 80 100 %
Philippines
SingaporeROCKoreaIranIndiaUSMalaysiaJapanChinaThailandHong KongBangladeshIndonesiaMongoliaFijiSri Lanka
Figure 45: Industry Shares of Value Added in Manufacturing, 2008
Sources: Official national accounts in each country, including our adjust-ments.
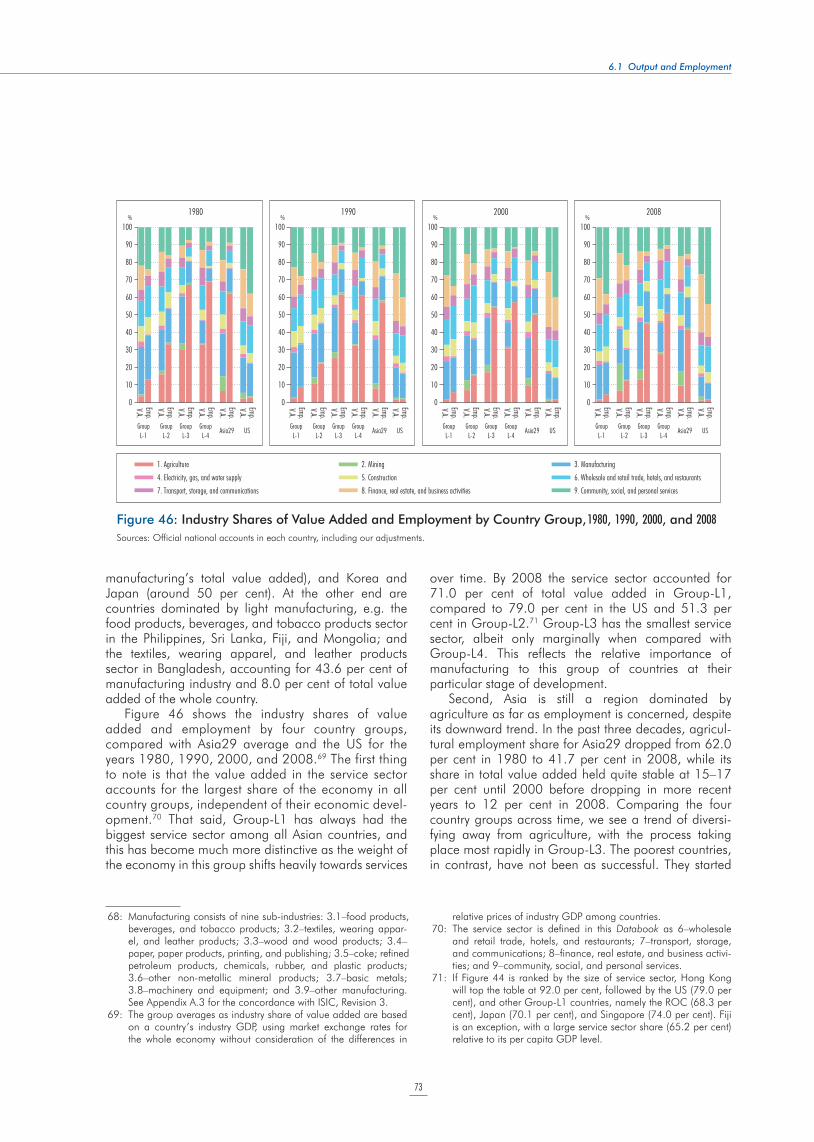
6.1 Output and Employment
73
manufacturing’s total value added), and Korea and Japan (around 50 per cent). At the other end are countries dominated by light manufacturing, e.g. the food products, beverages, and tobacco products sector in the Philippines, Sri Lanka, Fiji, and Mongolia; and the textiles, wearing apparel, and leather products sector in Bangladesh, accounting for 43.6 per cent of manufacturing industry and 8.0 per cent of total value added of the whole country.
Figure 46 shows the industry shares of value added and employment by four country groups, compared with Asia29 average and the US for the years 1980, 1990, 2000, and 2008.69 The first thing to note is that the value added in the service sector accounts for the largest share of the economy in all country groups, independent of their economic devel-opment.70 That said, Group-L1 has always had the biggest service sector among all Asian countries, and this has become much more distinctive as the weight of the economy in this group shifts heavily towards services
over time. By 2008 the service sector accounted for 71.0 per cent of total value added in Group-L1, compared to 79.0 per cent in the US and 51.3 per cent in Group-L2.71 Group-L3 has the smallest service sector, albeit only marginally when compared with Group-L4. This reflects the relative importance of manufacturing to this group of countries at their particular stage of development.
Second, Asia is still a region dominated by agriculture as far as employment is concerned, despite its downward trend. In the past three decades, agricul-tural employment share for Asia29 dropped from 62.0 per cent in 1980 to 41.7 per cent in 2008, while its share in total value added held quite stable at 15–17 per cent until 2000 before dropping in more recent years to 12 per cent in 2008. Comparing the four country groups across time, we see a trend of diversi-fying away from agriculture, with the process taking place most rapidly in Group-L3. The poorest countries, in contrast, have not been as successful. They started
68: Manufacturing consists of nine sub-industries: 3.1–food products, beverages, and tobacco products; 3.2–textiles, wearing appar- el, and leather products; 3.3–wood and wood products; 3.4– paper, paper products, printing, and publishing; 3.5–coke; refined petroleum products, chemicals, rubber, and plastic products; 3.6–other non-metallic mineral products; 3.7–basic metals; 3.8–machinery and equipment; and 3.9–other manufacturing. See Appendix A.3 for the concordance with ISIC, Revision 3.
69: The group averages as industry share of value added are based on a country’s industry GDP, using market exchange rates for the whole economy without consideration of the differences in
relative prices of industry GDP among countries. 70: The service sector is defined in this Databook as 6–wholesale
and retail trade, hotels, and restaurants; 7–transport, storage, and communications; 8–finance, real estate, and business activi-ties; and 9–community, social, and personal services.
71: If Figure 44 is ranked by the size of service sector, Hong Kong will top the table at 92.0 per cent, followed by the US (79.0 per cent), and other Group-L1 countries, namely the ROC (68.3 per cent), Japan (70.1 per cent), and Singapore (74.0 per cent). Fiji is an exception, with a large service sector share (65.2 per cent) relative to its per capita GDP level.
1980
GroupL-1
GroupL-2
GroupL-3
GroupL-4
Asia29 US
Emp.V.A.
Emp.V.A.
Emp.V.A.
Emp.V.A.
Emp.V.A.
Emp.V.A.
100
90
80
70
60
50
40
30
20
10
0
100
90
80
70
60
50
40
30
20
10
0
100
90
80
70
60
50
40
30
20
10
0
100
90
80
70
60
50
40
30
20
10
0
%1990
%2000
%2008
GroupL-1
GroupL-2
GroupL-3
GroupL-4
Asia29 US
Emp.V.A.
Emp.V.A.
Emp.V.A.
Emp.V.A.
Emp.V.A.
Emp.V.A.
GroupL-1
GroupL-2
GroupL-3
GroupL-4
Asia29 US
Emp.V.A.
Emp.V.A.
Emp.V.A.
Emp.V.A.
Emp.V.A.
Emp.V.A.
GroupL-1
GroupL-2
GroupL-3
GroupL-4
Asia29 US
Emp.V.A.
Emp.V.A.
Emp.V.A.
Emp.V.A.
Emp.V.A.
Emp.V.A.
%
3. Manufacturing6. Wholesale and retail trade, hotels, and restaurants 9. Community, social, and personal services
2. Mining5. Construction 8. Finance, real estate, and business activities
1. Agriculture4. Electricity, gas, and water supply7. Transport, storage, and communications
Figure 46: Industry Shares of Value Added and Employment by Country Group, 1980, 1990, 2000, and 2008
Sources: Official national accounts in each country, including our adjustments.
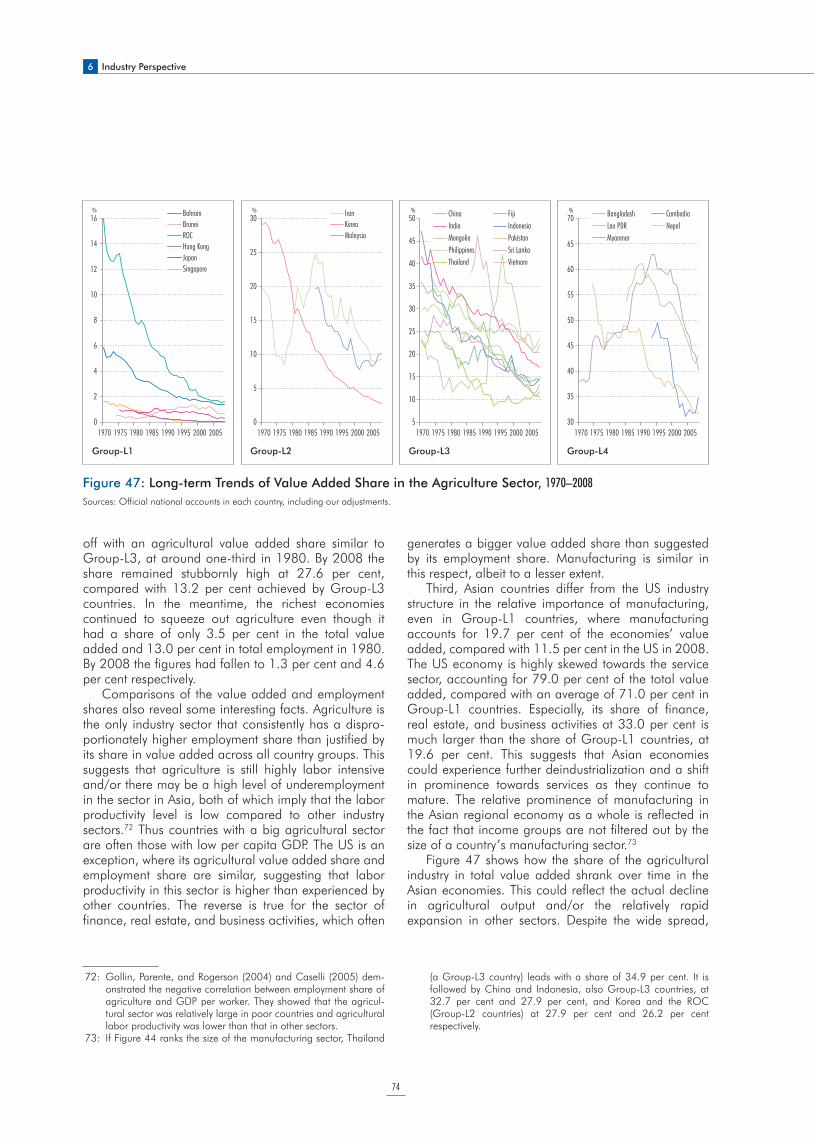
6 Industry Perspective
74
off with an agricultural value added share similar to Group-L3, at around one-third in 1980. By 2008 the share remained stubbornly high at 27.6 per cent, compared with 13.2 per cent achieved by Group-L3 countries. In the meantime, the richest economies continued to squeeze out agriculture even though it had a share of only 3.5 per cent in the total value added and 13.0 per cent in total employment in 1980. By 2008 the figures had fallen to 1.3 per cent and 4.6 per cent respectively.
Comparisons of the value added and employment shares also reveal some interesting facts. Agriculture is the only industry sector that consistently has a dispro-portionately higher employment share than justified by its share in value added across all country groups. This suggests that agriculture is still highly labor intensive and/or there may be a high level of underemployment in the sector in Asia, both of which imply that the labor productivity level is low compared to other industry sectors.72 Thus countries with a big agricultural sector are often those with low per capita GDP. The US is an exception, where its agricultural value added share and employment share are similar, suggesting that labor productivity in this sector is higher than experienced by other countries. The reverse is true for the sector of finance, real estate, and business activities, which often
generates a bigger value added share than suggested by its employment share. Manufacturing is similar in this respect, albeit to a lesser extent.
Third, Asian countries differ from the US industry structure in the relative importance of manufacturing, even in Group-L1 countries, where manufacturing accounts for 19.7 per cent of the economies’ value added, compared with 11.5 per cent in the US in 2008. The US economy is highly skewed towards the service sector, accounting for 79.0 per cent of the total value added, compared with an average of 71.0 per cent in Group-L1 countries. Especially, its share of finance, real estate, and business activities at 33.0 per cent is much larger than the share of Group-L1 countries, at 19.6 per cent. This suggests that Asian economies could experience further deindustrialization and a shift in prominence towards services as they continue to mature. The relative prominence of manufacturing in the Asian regional economy as a whole is reflected in the fact that income groups are not filtered out by the size of a country’s manufacturing sector.73
Figure 47 shows how the share of the agricultural industry in total value added shrank over time in the Asian economies. This could reflect the actual decline in agricultural output and/or the relatively rapid expansion in other sectors. Despite the wide spread,
16
14
12
10
8
6
4
2
0
BahrainBruneiROCHong KongJapanSingapore
1970 1975 1980 1985 1990 1995 2000 2005
Group-L1
30
25
20
15
10
5
0
IranKoreaMalaysia
1970 1975 1980 1985 1990 1995 2000 2005
Group-L2
50
45
40
35
30
25
20
15
10
5
China FijiIndia IndonesiaMongolia PakistanPhilippines Sri LankaThailand Vietnam
1970 1975 1980 1985 1990 1995 2000 2005
Group-L3
70
65
60
55
50
45
40
35
30
Bangladesh CambodiaLao PDR NepalMyanmar
1970 1975 1980 1985 1990 1995 2000 2005
Group-L4
% % % %
Figure 47: Long-term Trends of Value Added Share in the Agriculture Sector, 1970–2008
Sources: Official national accounts in each country, including our adjustments.
72: Gollin, Parente, and Rogerson (2004) and Caselli (2005) dem-onstrated the negative correlation between employment share of agriculture and GDP per worker. They showed that the agricul-tural sector was relatively large in poor countries and agricultural labor productivity was lower than that in other sectors.
73: If Figure 44 ranks the size of the manufacturing sector, Thailand
(a Group-L3 country) leads with a share of 34.9 per cent. It is followed by China and Indonesia, also Group-L3 countries, at 32.7 per cent and 27.9 per cent, and Korea and the ROC (Group-L2 countries) at 27.9 per cent and 26.2 per cent respectively.
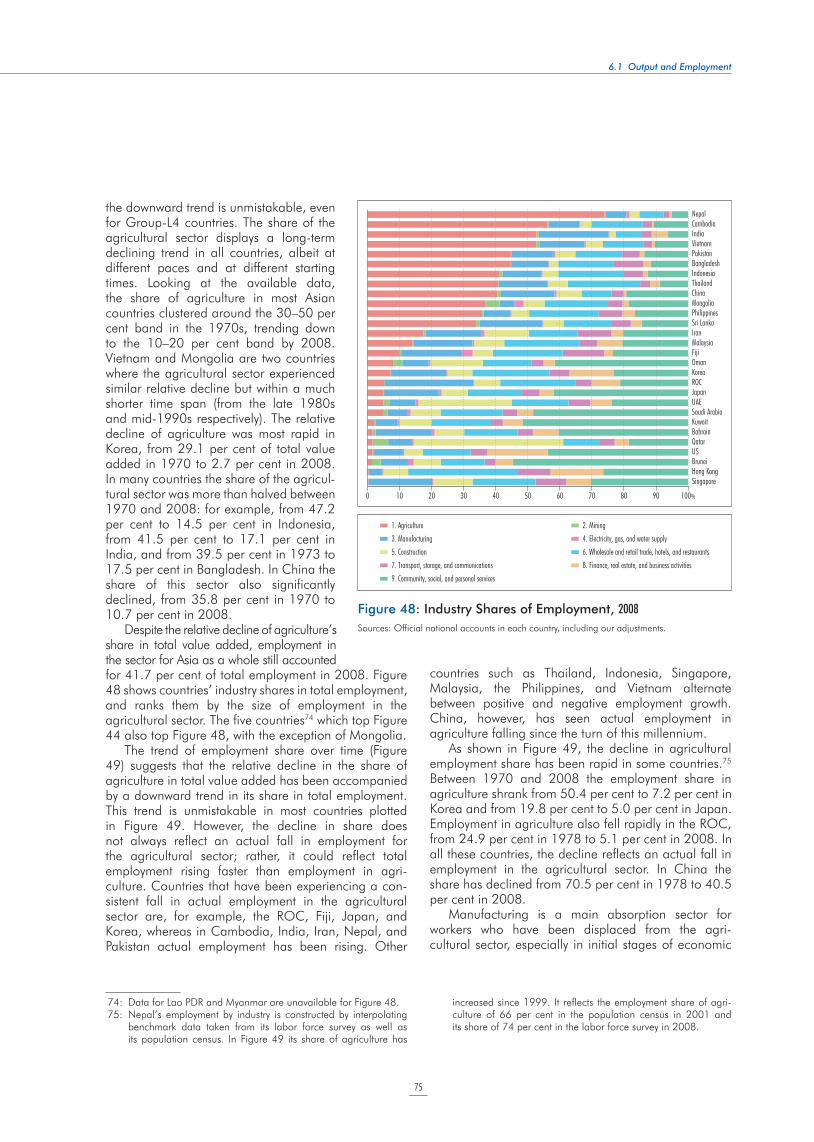
6.1 Output and Employment
75
the downward trend is unmistakable, even for Group-L4 countries. The share of the agricultural sector displays a long-term declining trend in all countries, albeit at different paces and at different starting times. Looking at the available data, the share of agriculture in most Asian countries clustered around the 30–50 per cent band in the 1970s, trending down to the 10–20 per cent band by 2008. Vietnam and Mongolia are two countries where the agricultural sector experienced similar relative decline but within a much shorter time span (from the late 1980s and mid-1990s respectively). The relative decline of agriculture was most rapid in Korea, from 29.1 per cent of total value added in 1970 to 2.7 per cent in 2008. In many countries the share of the agricul-tural sector was more than halved between 1970 and 2008: for example, from 47.2 per cent to 14.5 per cent in Indonesia, from 41.5 per cent to 17.1 per cent in India, and from 39.5 per cent in 1973 to 17.5 per cent in Bangladesh. In China the share of this sector also significantly declined, from 35.8 per cent in 1970 to 10.7 per cent in 2008.
Despite the relative decline of agriculture’s share in total value added, employment in the sector for Asia as a whole still accounted for 41.7 per cent of total employment in 2008. Figure 48 shows countries’ industry shares in total employment, and ranks them by the size of employment in the agricultural sector. The five countries74 which top Figure 44 also top Figure 48, with the exception of Mongolia.
The trend of employment share over time (Figure 49) suggests that the relative decline in the share of agriculture in total value added has been accompanied by a downward trend in its share in total employment. This trend is unmistakable in most countries plotted in Figure 49. However, the decline in share does not always reflect an actual fall in employment for the agricultural sector; rather, it could reflect total employment rising faster than employment in agri- culture. Countries that have been experiencing a con- sistent fall in actual employment in the agricultural sector are, for example, the ROC, Fiji, Japan, and Korea, whereas in Cambodia, India, Iran, Nepal, and Pakistan actual employment has been rising. Other
countries such as Thailand, Indonesia, Singapore, Malaysia, the Philippines, and Vietnam alternate between positive and negative employment growth. China, however, has seen actual employment in agriculture falling since the turn of this millennium.
As shown in Figure 49, the decline in agricultural employment share has been rapid in some countries.75 Between 1970 and 2008 the employment share in agriculture shrank from 50.4 per cent to 7.2 per cent in Korea and from 19.8 per cent to 5.0 per cent in Japan. Employment in agriculture also fell rapidly in the ROC, from 24.9 per cent in 1978 to 5.1 per cent in 2008. In all these countries, the decline reflects an actual fall in employment in the agricultural sector. In China the share has declined from 70.5 per cent in 1978 to 40.5 per cent in 2008.
Manufacturing is a main absorption sector for workers who have been displaced from the agri- cultural sector, especially in initial stages of economic
74: Data for Lao PDR and Myanmar are unavailable for Figure 48.75: Nepal’s employment by industry is constructed by interpolating
benchmark data taken from its labor force survey as well as its population census. In Figure 49 its share of agriculture has
increased since 1999. It reflects the employment share of agri-culture of 66 per cent in the population census in 2001 and its share of 74 per cent in the labor force survey in 2008.
0 10 20 30 40 50 60 70 80 90 100%
SingaporeHong KongBruneiUSQatarBahrainKuwaitSaudi ArabiaUAEJapanROCKoreaOmanFijiMalaysiaIranSri LankaPhilippinesMongoliaChinaThailandIndonesiaBangladeshPakistanVietnamIndiaCambodiaNepal
3. Manufacturing2. Mining1. Agriculture 4. Electricity, gas, and water supply
7. Transport, storage, and communications5. Construction
8. Finance, real estate, and business activities 6. Wholesale and retail trade, hotels, and restaurants
9. Community, social, and personal services
Figure 48: Industry Shares of Employment, 2008
Sources: Official national accounts in each country, including our adjustments.
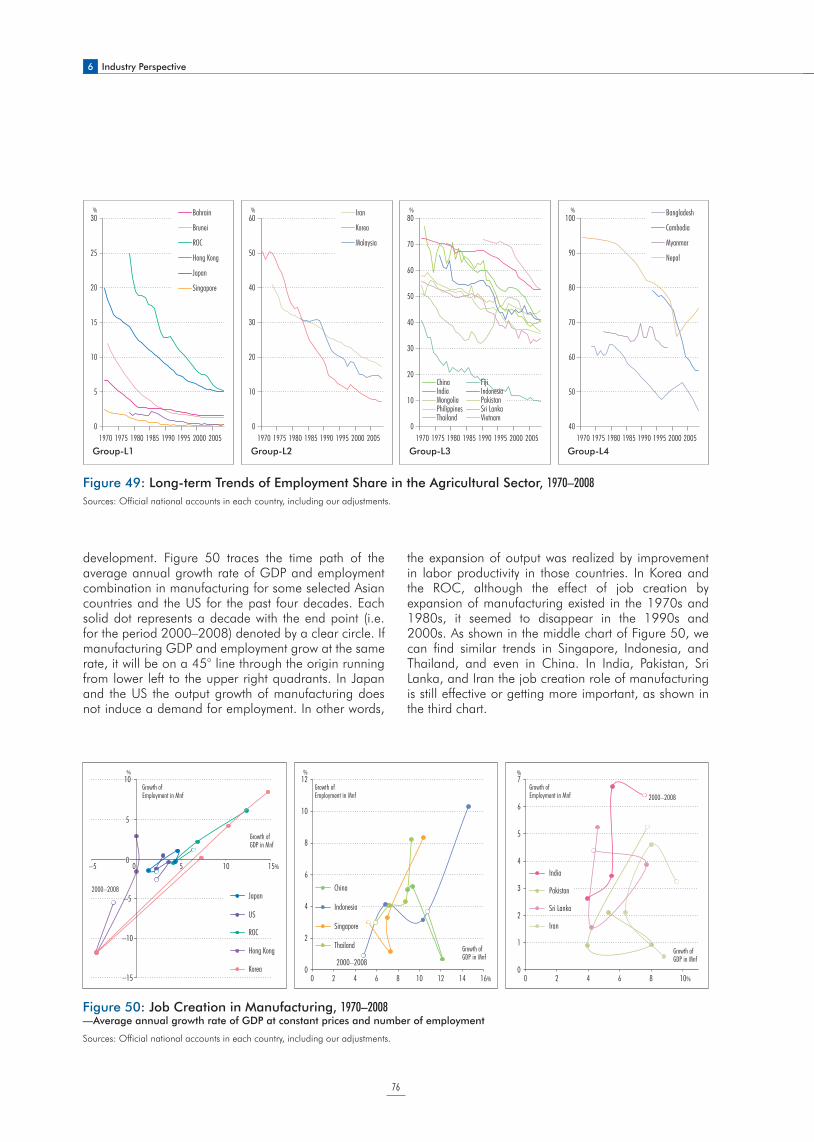
6 Industry Perspective
76
development. Figure 50 traces the time path of the average annual growth rate of GDP and employment combination in manufacturing for some selected Asian countries and the US for the past four decades. Each solid dot represents a decade with the end point (i.e. for the period 2000–2008) denoted by a clear circle. If manufacturing GDP and employment grow at the same rate, it will be on a 45° line through the origin running from lower left to the upper right quadrants. In Japan and the US the output growth of manufacturing does not induce a demand for employment. In other words,
the expansion of output was realized by improvement in labor productivity in those countries. In Korea and the ROC, although the effect of job creation by expansion of manufacturing existed in the 1970s and 1980s, it seemed to disappear in the 1990s and 2000s. As shown in the middle chart of Figure 50, we can find similar trends in Singapore, Indonesia, and Thailand, and even in China. In India, Pakistan, Sri Lanka, and Iran the job creation role of manufacturing is still effective or getting more important, as shown in the third chart.
60
50
40
30
20
10
01970 1975 1980 1985 1990 1995 2000 2005
Iran
Korea
Malaysia
80
70
60
50
40
30
20
10
01970 1975 1980 1985 1990 1995 2000 2005
China FijiIndia IndonesiaMongolia PakistanPhilippines Sri LankaThailand Vietnam
100
90
80
70
60
50
401970 1975 1980 1985 1990 1995 2000 2005
Bangladesh
Cambodia
Myanmar
Nepal
30
25
20
15
10
5
01970 1975 1980 1985 1990 1995 2000 2005
Bahrain
Brunei
ROC
Hong Kong
Japan
Singapore
Group-L1 Group-L2 Group-L3 Group-L4
% % % %
Figure 49: Long-term Trends of Employment Share in the Agricultural Sector, 1970–2008
Sources: Official national accounts in each country, including our adjustments.
–15
–10
–5
00
5
10
–5 0 5 10 15%
Japan
US
ROC
Hong Kong
Korea
Growth ofEmployment in Mnf
Growth of GDP in Mnf
2000–2008
%12
10
8
6
4
2
00 2 4 6 8 10 12 14 16%
China
Indonesia
Singapore
Thailand
Growth ofEmployment in Mnf
Growth of GDP in Mnf
2000–2008
%7
6
5
4
3
2
1
00 2 4 6 8 10%
India
Pakistan
Sri Lanka
Iran
Growth ofEmployment in Mnf
Growth of GDP in Mnf
2000–2008
%
Figure 50: Job Creation in Manufacturing, 1970–2008—Average annual growth rate of GDP at constant prices and number of employment
Sources: Official national accounts in each country, including our adjustments.
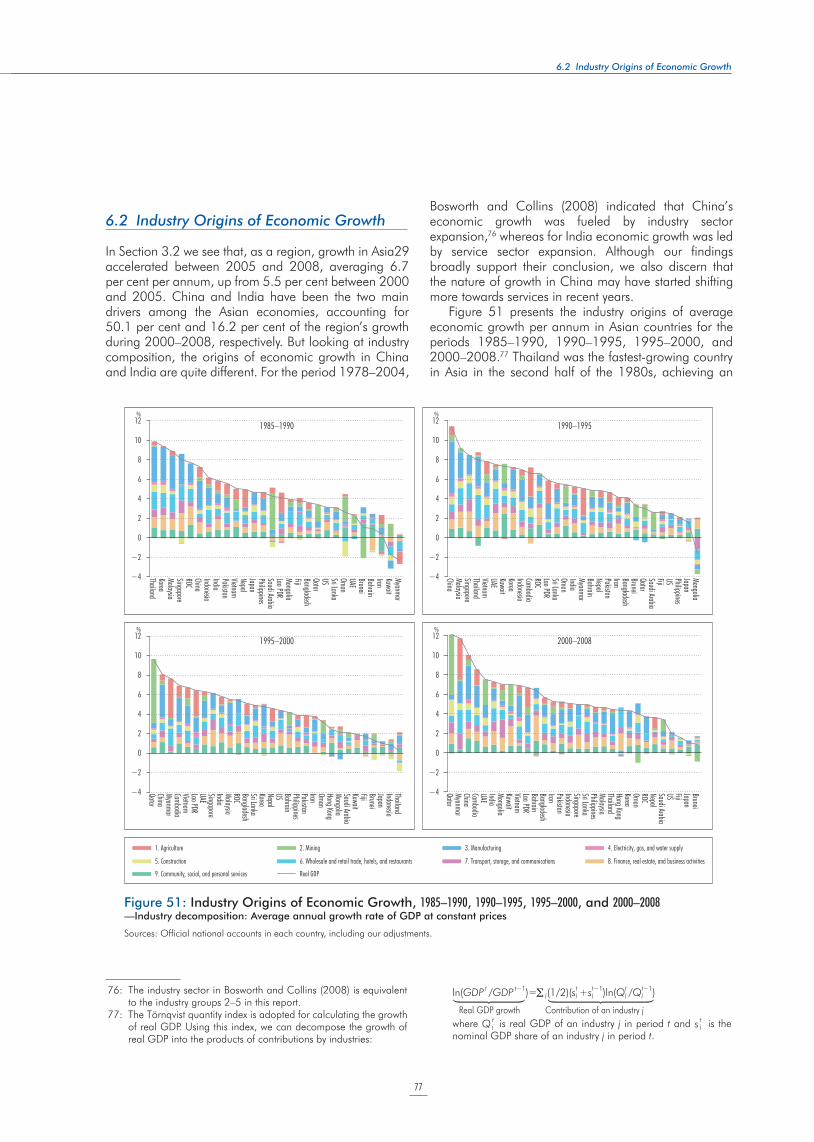
77
6.2 Industry Origins of Economic Growth
6.2 Industry Origins of Economic Growth
In Section 3.2 we see that, as a region, growth in Asia29 accelerated between 2005 and 2008, averaging 6.7 per cent per annum, up from 5.5 per cent between 2000 and 2005. China and India have been the two main drivers among the Asian economies, accounting for 50.1 per cent and 16.2 per cent of the region’s growth during 2000–2008, respectively. But looking at industry composition, the origins of economic growth in China and India are quite different. For the period 1978–2004,
Bosworth and Collins (2008) indicated that China’s economic growth was fueled by industry sector expansion,76 whereas for India economic growth was led by service sector expansion. Although our findings broadly support their conclusion, we also discern that the nature of growth in China may have started shifting more towards services in recent years.
Figure 51 presents the industry origins of average economic growth per annum in Asian countries for the periods 1985–1990, 1990–1995, 1995–2000, and 2000–2008.77 Thailand was the fastest-growing country in Asia in the second half of the 1980s, achieving an
76: The industry sector in Bosworth and Collins (2008) is equivalent to the industry groups 2–5 in this report.
77: The Törnqvist quantity index is adopted for calculating the growth of real GDP. Using this index, we can decompose the growth of real GDP into the products of contributions by industries:
ln(GDP tx/GDP t−1
x )= j(1/2)(stj +st−1
j )ln(Qtj /Qt−1
j )
Real GDP growth Contribution of an industry j where Q t
j is real GDP of an industry j in period t and s tj is the
nominal GDP share of an industry j in period t.
ThailandKoreaMalaysiaSingaporeROCChinaIndonesiaIndiaPakistanVietnamNepalJapanPhilippinesSaudi ArabiaLao PDRMongoliaFijiBangladeshQatarUS Sri LankaOmanUAEBruneiBahrainIranKuwaitMyanmar
1985–1990
9. Community, social, and personal services
8. Finance, real estate, and business activities7. Transport, storage, and communications6. Wholesale and retail trade, hotels, and restaurants5. Construction
4. Electricity, gas, and water supply3. Manufacturing2. Mining1. Agriculture
Real GDP
ChinaMalaysiaSingaporeThailandVietnamUAEKuwaitKoreaIndonesiaCambodiaROCLao PDRSri LankaOmanIndiaMyanmarBahrainNepalPakistanIranBangladeshBruneiQatarSaudi ArabiaFijiUS PhilippinesJapanMongolia
1990–1995
QatarChinaMyanmarCambodiaVietnamLao PDRUAESingaporeIndiaMalaysiaROCBangladeshSri LankaKoreaNepalUS BahrainPhilippinesPakistanIranOmanHong KongMongoliaSaudi ArabiaKuwaitFijiBruneiJapanIndonesiaThailand
1995–2000
12
10
8
6
4
2
0
−2
−4
%12
10
8
6
4
2
0
−2
−4
%
12
10
8
6
4
2
0
−2
−4
%12
10
8
6
4
2
0
−2
−4
%
QatarMyanmarChinaCambodiaUAEIndiaMongoliaKuwaitVietnamLao PDRBahrainBangladeshIranPakistanIndonesiaSingaporeSri LankaPhilippinesMalaysiaThailandHong KongKoreaOmanROCNepalSaudi ArabiaUS FijiJapanBrunei
2000–2008
Figure 51: Industry Origins of Economic Growth, 1985–1990, 1990–1995, 1995–2000, and 2000–2008—Industry decomposition: Average annual growth rate of GDP at constant prices
Sources: Official national accounts in each country, including our adjustments.
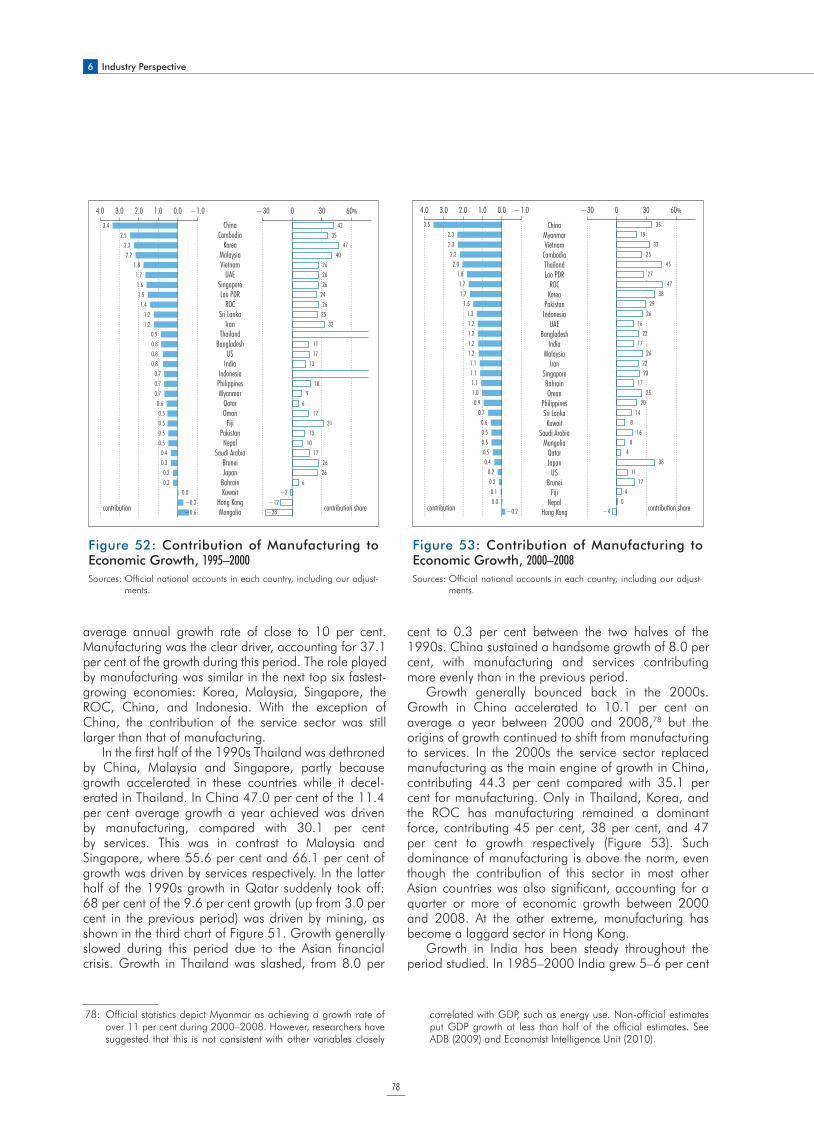
6 Industry Perspective
78
average annual growth rate of close to 10 per cent. Manufacturing was the clear driver, accounting for 37.1 per cent of the growth during this period. The role played by manufacturing was similar in the next top six fastest-growing economies: Korea, Malaysia, Singapore, the ROC, China, and Indonesia. With the exception of China, the contribution of the service sector was still larger than that of manufacturing.
In the first half of the 1990s Thailand was dethroned by China, Malaysia and Singapore, partly because growth accelerated in these countries while it decel-erated in Thailand. In China 47.0 per cent of the 11.4 per cent average growth a year achieved was driven by manufacturing, compared with 30.1 per cent by services. This was in contrast to Malaysia and Singapore, where 55.6 per cent and 66.1 per cent of growth was driven by services respectively. In the latter half of the 1990s growth in Qatar suddenly took off: 68 per cent of the 9.6 per cent growth (up from 3.0 per cent in the previous period) was driven by mining, as shown in the third chart of Figure 51. Growth generally slowed during this period due to the Asian financial crisis. Growth in Thailand was slashed, from 8.0 per
cent to 0.3 per cent between the two halves of the 1990s. China sustained a handsome growth of 8.0 per cent, with manufacturing and services contributing more evenly than in the previous period.
Growth generally bounced back in the 2000s. Growth in China accelerated to 10.1 per cent on average a year between 2000 and 2008,78 but the origins of growth continued to shift from manufacturing to services. In the 2000s the service sector replaced manufacturing as the main engine of growth in China, contributing 44.3 per cent compared with 35.1 per cent for manufacturing. Only in Thailand, Korea, and the ROC has manufacturing remained a dominant force, contributing 45 per cent, 38 per cent, and 47 per cent to growth respectively (Figure 53). Such dominance of manufacturing is above the norm, even though the contribution of this sector in most other Asian countries was also significant, accounting for a quarter or more of economic growth between 2000 and 2008. At the other extreme, manufacturing has become a laggard sector in Hong Kong.
Growth in India has been steady throughout the period studied. In 1985–2000 India grew 5–6 per cent
−28
4235
4740
262626
242625
32
1717
13
189
617
3113
1017
2626
6−2
−12contribution share
3.42.5
2.32.2
1.81.71.61.51.4
1.21.2
0.90.80.80.8
0.70.70.70.60.50.50.50.50.40.30.20.2
0.0−0.3−0.6
−30 0 30 60%−1.00.01.02.03.04.0
contribution
ChinaCambodia
KoreaMalaysiaVietnam
UAESingaporeLao PDR
ROCSri Lanka
IranThailand
BangladeshUS
IndiaIndonesiaPhilippinesMyanmar
QatarOman
FijiPakistanNepal
Saudi ArabiaBruneiJapan
BahrainKuwait
Hong KongMongolia
Figure 52: Contribution of Manufacturing to Economic Growth, 1995–2000
Sources: Official national accounts in each country, including our adjust-ments.
78: Official statistics depict Myanmar as achieving a growth rate of over 11 per cent during 2000–2008. However, researchers have suggested that this is not consistent with other variables closely
correlated with GDP, such as energy use. Non-official estimates put GDP growth at less than half of the official estimates. See ADB (2009) and Economist Intelligence Unit (2010).
−30 0 30 60%−1.00.01.02.03.04.0
3519
3325
4527
4738
2926
1622
1726
2223
1725
2014
816
84
3811
174
0−4 contribution share
3.5
−0.2
2.32.32.2
2.01.81.71.7
1.51.31.21.21.21.21.11.11.11.00.9
0.70.60.50.50.50.4
0.20.20.10.0
contribution
ChinaMyanmarVietnam
CambodiaThailandLao PDR
ROCKorea
PakistanIndonesia
UAEBangladesh
IndiaMalaysia
IranSingaporeBahrainOman
PhilippinesSri LankaKuwait
Saudi ArabiaMongolia
QatarJapan
USBrunei
FijiNepal
Hong Kong
Figure 53: Contribution of Manufacturing to Economic Growth, 2000–2008
Sources: Official national accounts in each country, including our adjust-ments.
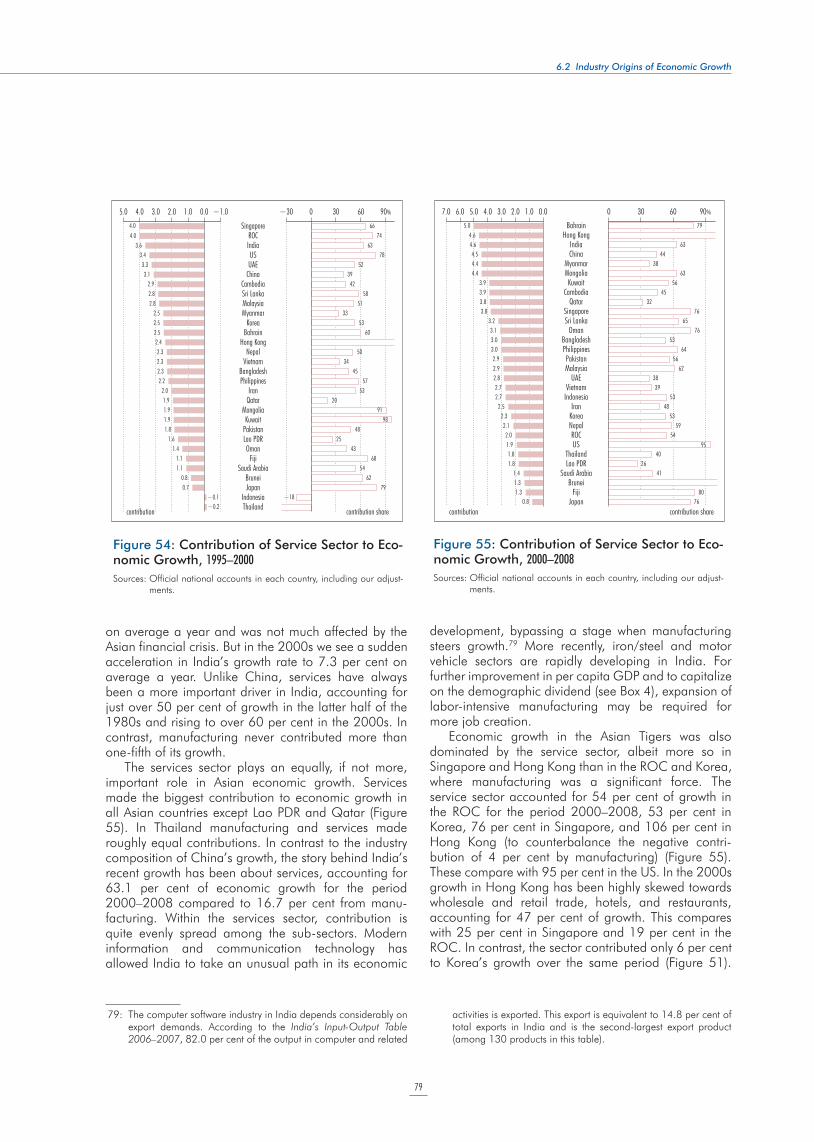
79
6.2 Industry Origins of Economic Growth
on average a year and was not much affected by the Asian financial crisis. But in the 2000s we see a sudden acceleration in India’s growth rate to 7.3 per cent on average a year. Unlike China, services have always been a more important driver in India, accounting for just over 50 per cent of growth in the latter half of the 1980s and rising to over 60 per cent in the 2000s. In contrast, manufacturing never contributed more than one-fifth of its growth.
The services sector plays an equally, if not more, important role in Asian economic growth. Services made the biggest contribution to economic growth in all Asian countries except Lao PDR and Qatar (Figure 55). In Thailand manufacturing and services made roughly equal contributions. In contrast to the industry composition of China’s growth, the story behind India’s recent growth has been about services, accounting for 63.1 per cent of economic growth for the period 2000–2008 compared to 16.7 per cent from manu- facturing. Within the services sector, contribution is quite evenly spread among the sub-sectors. Modern information and communication technology has allowed India to take an unusual path in its economic
development, bypassing a stage when manufacturing steers growth.79 More recently, iron/steel and motor vehicle sectors are rapidly developing in India. For further improvement in per capita GDP and to capitalize on the demographic dividend (see Box 4), expansion of labor-intensive manufacturing may be required for more job creation.
Economic growth in the Asian Tigers was also dominated by the service sector, albeit more so in Singapore and Hong Kong than in the ROC and Korea, where manufacturing was a significant force. The service sector accounted for 54 per cent of growth in the ROC for the period 2000–2008, 53 per cent in Korea, 76 per cent in Singapore, and 106 per cent in Hong Kong (to counterbalance the negative contri-bution of 4 per cent by manufacturing) (Figure 55). These compare with 95 per cent in the US. In the 2000s growth in Hong Kong has been highly skewed towards wholesale and retail trade, hotels, and restaurants, accounting for 47 per cent of growth. This compares with 25 per cent in Singapore and 19 per cent in the ROC. In contrast, the sector contributed only 6 per cent to Korea’s growth over the same period (Figure 51).
−18
9198
6674
6378
523942
5851
3353
60
5034
4557
5320
4825
4368
5462
79
contribution share−0.2
4.04.0
3.63.43.33.1
2.92.82.8
2.52.52.52.42.32.32.32.2
2.01.91.91.91.8
1.61.4
1.11.1
0.80.7
−0.1
contribution
−30 0 30 90%60−1.00.01.02.03.05.0 4.0
SingaporeROCIndiaUSUAE
ChinaCambodiaSri LankaMalaysiaMyanmar
KoreaBahrain
Hong KongNepal
VietnamBangladeshPhilippines
IranQatar
MongoliaKuwait
PakistanLao PDROman
FijiSaudi Arabia
BruneiJapan
IndonesiaThailand
Figure 54: Contribution of Service Sector to Eco-nomic Growth, 1995–2000
Sources: Official national accounts in each country, including our adjust-ments.
79
6344
3863
5645
3276
6576
5364
5662
3839
5348
5359
5495
4026
41
8076
contribution share0.8
5.04.64.64.54.44.4
3.93.93.83.8
3.23.13.03.02.92.92.82.72.7
2.52.32.12.01.91.81.8
1.41.31.3
contribution
0 6030 90%0.01.02.03.05.07.0 6.0 4.0
BahrainHong Kong
IndiaChina
MyanmarMongoliaKuwait
CambodiaQatar
SingaporeSri Lanka
OmanBangladeshPhilippinesPakistanMalaysia
UAEVietnam
IndonesiaIran
KoreaNepalROCUS
ThailandLao PDR
Saudi ArabiaBrunei
FijiJapan
Figure 55: Contribution of Service Sector to Eco-nomic Growth, 2000–2008
Sources: Official national accounts in each country, including our adjust-ments.
79: The computer software industry in India depends considerably on export demands. According to the India’s Input-Output Table 2006–2007, 82.0 per cent of the output in computer and related
activities is exported. This export is equivalent to 14.8 per cent of total exports in India and is the second-largest export product (among 130 products in this table).
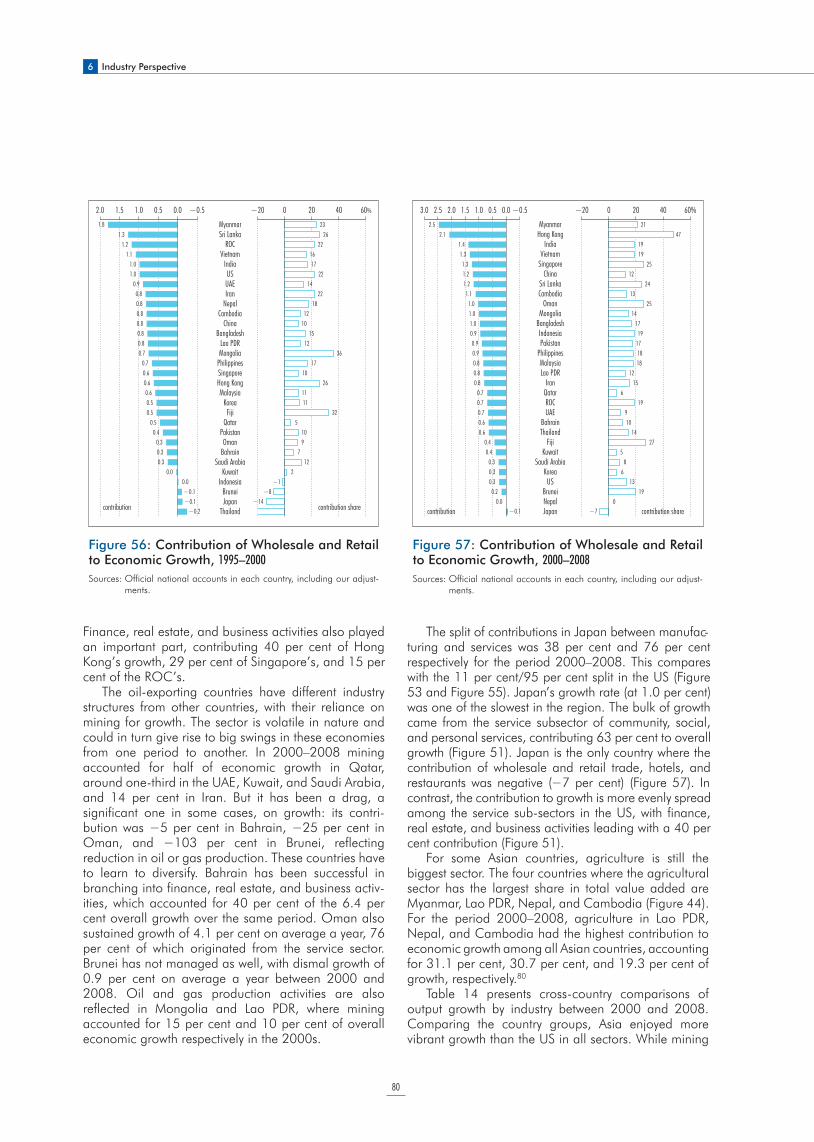
6 Industry Perspective
80
Finance, real estate, and business activities also played an important part, contributing 40 per cent of Hong Kong’s growth, 29 per cent of Singapore’s, and 15 per cent of the ROC’s.
The oil-exporting countries have different industry structures from other countries, with their reliance on mining for growth. The sector is volatile in nature and could in turn give rise to big swings in these economies from one period to another. In 2000–2008 mining accounted for half of economic growth in Qatar, around one-third in the UAE, Kuwait, and Saudi Arabia, and 14 per cent in Iran. But it has been a drag, a significant one in some cases, on growth: its contri-bution was !5 per cent in Bahrain, !25 per cent in Oman, and !103 per cent in Brunei, reflecting reduction in oil or gas production. These countries have to learn to diversify. Bahrain has been successful in branching into finance, real estate, and business activ-ities, which accounted for 40 per cent of the 6.4 per cent overall growth over the same period. Oman also sustained growth of 4.1 per cent on average a year, 76 per cent of which originated from the service sector. Brunei has not managed as well, with dismal growth of 0.9 per cent on average a year between 2000 and 2008. Oil and gas production activities are also reflected in Mongolia and Lao PDR, where mining accounted for 15 per cent and 10 per cent of overall economic growth respectively in the 2000s.
The split of contributions in Japan between manufac-turing and services was 38 per cent and 76 per cent respectively for the period 2000–2008. This compares with the 11 per cent/95 per cent split in the US (Figure 53 and Figure 55). Japan’s growth rate (at 1.0 per cent) was one of the slowest in the region. The bulk of growth came from the service subsector of community, social, and personal services, contributing 63 per cent to overall growth (Figure 51). Japan is the only country where the contribution of wholesale and retail trade, hotels, and restaurants was negative (!7 per cent) (Figure 57). In contrast, the contribution to growth is more evenly spread among the service sub-sectors in the US, with finance, real estate, and business activities leading with a 40 per cent contribution (Figure 51).
For some Asian countries, agriculture is still the biggest sector. The four countries where the agricultural sector has the largest share in total value added are Myanmar, Lao PDR, Nepal, and Cambodia (Figure 44). For the period 2000–2008, agriculture in Lao PDR, Nepal, and Cambodia had the highest contribution to economic growth among all Asian countries, accounting for 31.1 per cent, 30.7 per cent, and 19.3 per cent of growth, respectively.80
Table 14 presents cross-country comparisons of output growth by industry between 2000 and 2008. Comparing the country groups, Asia enjoyed more vibrant growth than the US in all sectors. While mining
−8−14
2326
221617
2214
2218
1210
1512
3617
1026
11 11
325
109
712
2−1
contribution share−0.2
−0.1−0.1
1.81.3
1.21.1
1.01.0
0.90.80.80.80.80.80.80.7
0.70.60.60.60.50.5
0.50.4
0.30.30.3
0.00.0
contribution
−20 0 20 40 60%−0.50.00.51.01.52.0
MyanmarSri Lanka
ROCVietnam
IndiaUSUAEIran
NepalCambodia
ChinaBangladesh
Lao PDRMongolia
PhilippinesSingaporeHong KongMalaysia
KoreaFiji
QatarPakistanOman
BahrainSaudi Arabia
KuwaitIndonesia
BruneiJapan
Thailand
Figure 56: Contribution of Wholesale and Retail to Economic Growth, 1995–2000
Sources: Official national accounts in each country, including our adjust-ments.
4721
1919
2512
2413
2514
1719
171818
1215
619
910
1427
58
613
190
−7 contribution share−0.1
2.52.1
1.41.31.31.21.21.1
1.01.01.00.90.90.90.80.80.8
0.70.70.70.60.6
0.40.4
0.30.30.30.2
0.0contribution
−20 0 20 40 60%−0.50.00.51.01.52.03.0 2.5
MyanmarHong Kong
IndiaVietnam
SingaporeChina
Sri LankaCambodia
OmanMongolia
BangladeshIndonesiaPakistan
PhilippinesMalaysiaLao PDR
IranQatarROCUAE
BahrainThailand
FijiKuwait
Saudi ArabiaKoreaUS
BruneiNepalJapan
Figure 57: Contribution of Wholesale and Retail to Economic Growth, 2000–2008
Sources: Official national accounts in each country, including our adjust-ments.
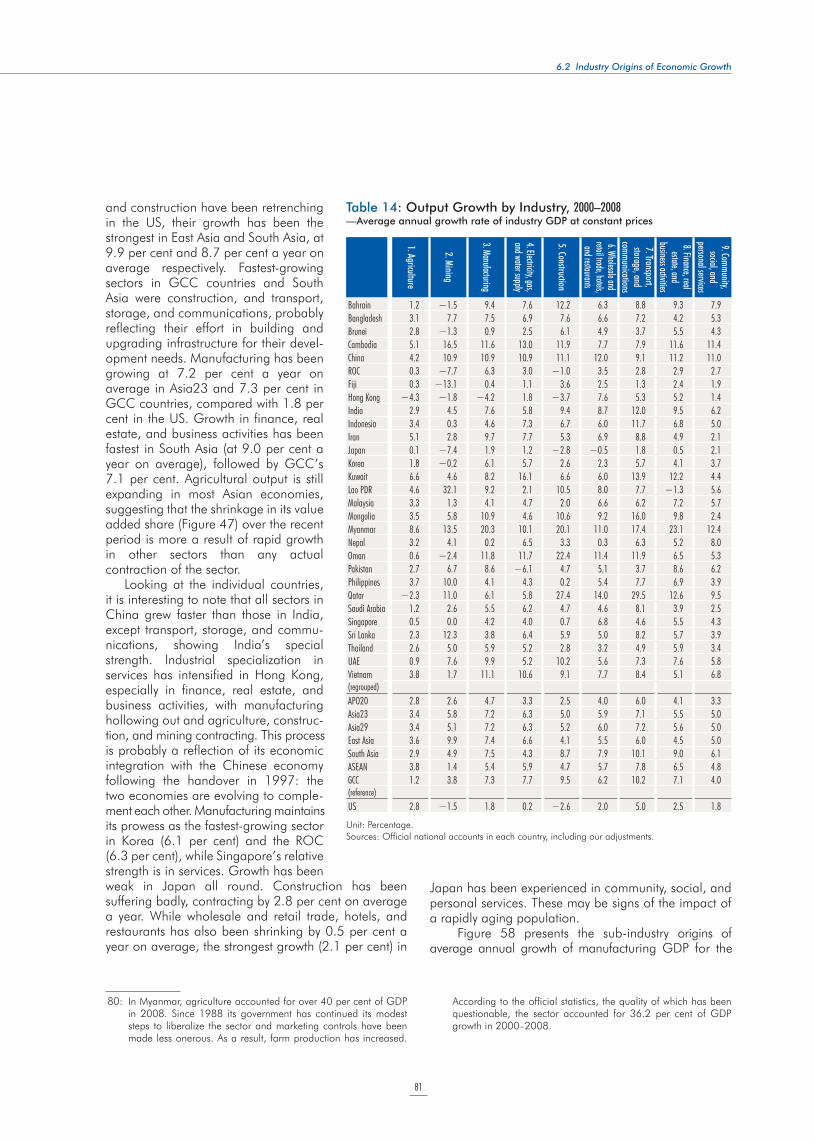
81
6.2 Industry Origins of Economic Growth
and construction have been retrenching in the US, their growth has been the strongest in East Asia and South Asia, at 9.9 per cent and 8.7 per cent a year on average respectively. Fastest-growing sectors in GCC countries and South Asia were construction, and transport, storage, and communications, probably reflecting their effort in building and upgrading infrastructure for their devel-opment needs. Manufacturing has been growing at 7.2 per cent a year on average in Asia23 and 7.3 per cent in GCC countries, compared with 1.8 per cent in the US. Growth in finance, real estate, and business activities has been fastest in South Asia (at 9.0 per cent a year on average), followed by GCC’s 7.1 per cent. Agricultural output is still expanding in most Asian economies, suggesting that the shrinkage in its value added share (Figure 47) over the recent period is more a result of rapid growth in other sectors than any actual contraction of the sector.
Looking at the individual countries, it is interesting to note that all sectors in China grew faster than those in India, except transport, storage, and commu-nications, showing India’s special strength. Industrial specialization in services has intensified in Hong Kong, especially in finance, real estate, and business activities, with manufacturing hollowing out and agriculture, construc- tion, and mining contracting. This process is probably a reflection of its economic integration with the Chinese economy following the handover in 1997: the two economies are evolving to comple- ment each other. Manufacturing maintains its prowess as the fastest-growing sector in Korea (6.1 per cent) and the ROC (6.3 per cent), while Singapore’s relative strength is in services. Growth has been weak in Japan all round. Construction has been suffering badly, contracting by 2.8 per cent on average a year. While wholesale and retail trade, hotels, and restaurants has also been shrinking by 0.5 per cent a year on average, the strongest growth (2.1 per cent) in
Japan has been experienced in community, social, and personal services. These may be signs of the impact of a rapidly aging population.
Figure 58 presents the sub-industry origins of average annual growth of manufacturing GDP for the
80: In Myanmar, agriculture accounted for over 40 per cent of GDP in 2008. Since 1988 its government has continued its modest steps to liberalize the sector and marketing controls have been made less onerous. As a result, farm production has increased.
According to the official statistics, the quality of which has been questionable, the sector accounted for 36.2 per cent of GDP growth in 2000–2008.
1. Agriculture
2. Mining
3. Manufacturing
4. Electricity, gas,and water supply
5. Construction
6. Wholesale and
retail trade, hotels, and restaurants
7. Transport, storage, and
comm
unications
8. Finance, realestate, and
business activities
9. Comm
unity,social, and
personal services
Bahrain 1.2 !1.5 9.4 7.6 12.2 6.3 8.8 9.3 7.9
Bangladesh 3.1 7.7 7.5 6.9 7.6 6.6 7.2 4.2 5.3
Brunei 2.8 !1.3 0.9 2.5 6.1 4.9 3.7 5.5 4.3
Cambodia 5.1 16.5 11.6 13.0 11.9 7.7 7.9 11.6 11.4
China 4.2 10.9 10.9 10.9 11.1 12.0 9.1 11.2 11.0
ROC 0.3 !7.7 6.3 3.0 !1.0 3.5 2.8 2.9 2.7
Fiji 0.3 !13.1 0.4 1.1 3.6 2.5 1.3 2.4 1.9
Hong Kong !4.3 !1.8 !4.2 1.8 !3.7 7.6 5.3 5.2 1.4
India 2.9 4.5 7.6 5.8 9.4 8.7 12.0 9.5 6.2
Indonesia 3.4 0.3 4.6 7.3 6.7 6.0 11.7 6.8 5.0
Iran 5.1 2.8 9.7 7.7 5.3 6.9 8.8 4.9 2.1
Japan 0.1 !7.4 1.9 1.2 !2.8 !0.5 1.8 0.5 2.1
Korea 1.8 !0.2 6.1 5.7 2.6 2.3 5.7 4.1 3.7
Kuwait 6.6 4.6 8.2 16.1 6.6 6.0 13.9 12.2 4.4
Lao PDR 4.6 32.1 9.2 2.1 10.5 8.0 7.7 !1.3 5.6
Malaysia 3.3 1.3 4.1 4.7 2.0 6.6 6.2 7.2 5.7
Mongolia 3.5 5.8 10.9 4.6 10.6 9.2 16.0 9.8 2.4
Myanmar 8.6 13.5 20.3 10.1 20.1 11.0 17.4 23.1 12.4
Nepal 3.2 4.1 0.2 6.5 3.3 0.3 6.3 5.2 8.0
Oman 0.6 !2.4 11.8 11.7 22.4 11.4 11.9 6.5 5.3
Pakistan 2.7 6.7 8.6 !6.1 4.7 5.1 3.7 8.6 6.2
Philippines 3.7 10.0 4.1 4.3 0.2 5.4 7.7 6.9 3.9
Qatar !2.3 11.0 6.1 5.8 27.4 14.0 29.5 12.6 9.5
Saudi Arabia 1.2 2.6 5.5 6.2 4.7 4.6 8.1 3.9 2.5
Singapore 0.5 0.0 4.2 4.0 0.7 6.8 4.6 5.5 4.3
Sri Lanka 2.3 12.3 3.8 6.4 5.9 5.0 8.2 5.7 3.9
Thailand 2.6 5.0 5.9 5.2 2.8 3.2 4.9 5.9 3.4
UAE 0.9 7.6 9.9 5.2 10.2 5.6 7.3 7.6 5.8
Vietnam 3.8 1.7 11.1 10.6 9.1 7.7 8.4 5.1 6.8(regrouped)
APO20 2.8 2.6 4.7 3.3 2.5 4.0 6.0 4.1 3.3
Asia23 3.4 5.8 7.2 6.3 5.0 5.9 7.1 5.5 5.0
Asia29 3.4 5.1 7.2 6.3 5.2 6.0 7.2 5.6 5.0
East Asia 3.6 9.9 7.4 6.6 4.1 5.5 6.0 4.5 5.0
South Asia 2.9 4.9 7.5 4.3 8.7 7.9 10.1 9.0 6.1
ASEAN 3.8 1.4 5.4 5.9 4.7 5.7 7.8 6.5 4.8
GCC 1.2 3.8 7.3 7.7 9.5 6.2 10.2 7.1 4.0(reference)
US 2.8 !1.5 1.8 0.2 !2.6 2.0 5.0 2.5 1.8
Unit: Percentage.
Sources: Official national accounts in each country, including our adjustments.
Table 14: Output Growth by Industry, 2000–2008—Average annual growth rate of industry GDP at constant prices
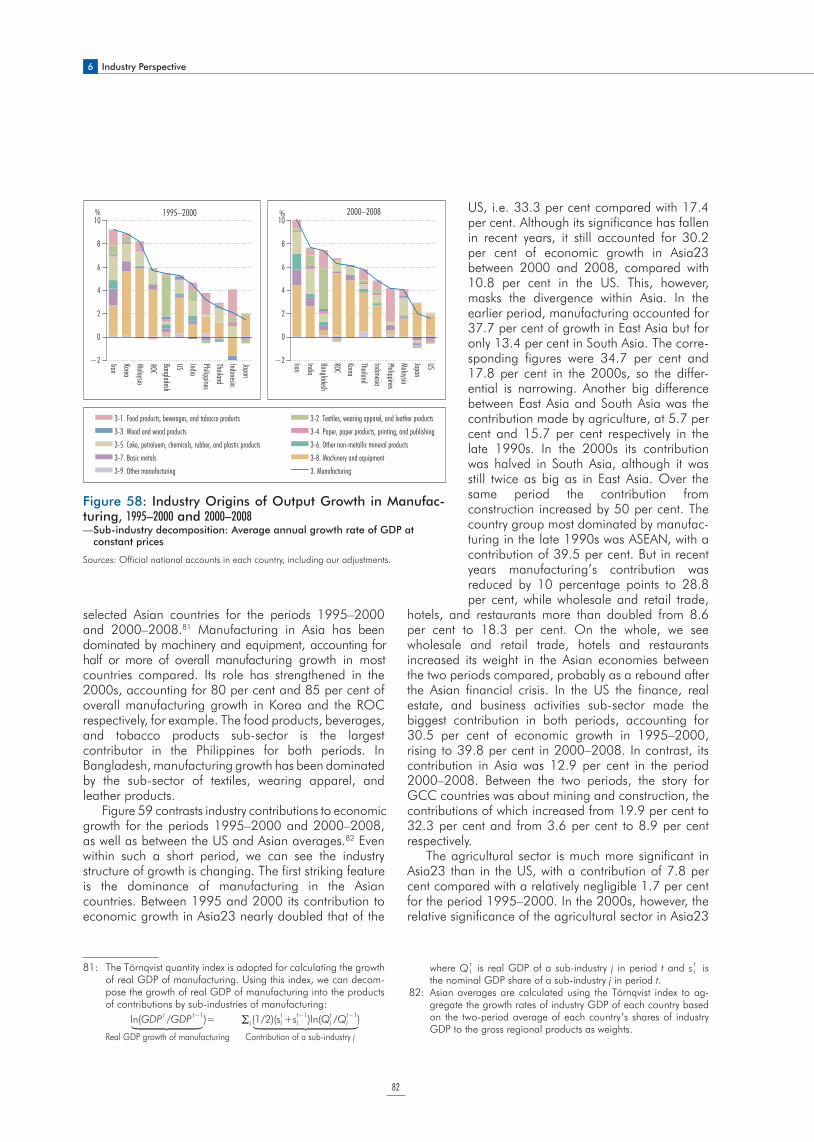
6 Industry Perspective
82
selected Asian countries for the periods 1995–2000 and 2000–2008.81 Manufacturing in Asia has been dominated by machinery and equipment, accounting for half or more of overall manufacturing growth in most countries compared. Its role has strengthened in the 2000s, accounting for 80 per cent and 85 per cent of overall manufacturing growth in Korea and the ROC respectively, for example. The food products, beverages, and tobacco products sub-sector is the largest contributor in the Philippines for both periods. In Bangladesh, manufacturing growth has been dominated by the sub-sector of textiles, wearing apparel, and leather products.
Figure 59 contrasts industry contributions to economic growth for the periods 1995–2000 and 2000–2008, as well as between the US and Asian averages.82 Even within such a short period, we can see the industry structure of growth is changing. The first striking feature is the dominance of manufacturing in the Asian countries. Between 1995 and 2000 its contribution to economic growth in Asia23 nearly doubled that of the
US, i.e. 33.3 per cent compared with 17.4 per cent. Although its significance has fallen in recent years, it still accounted for 30.2 per cent of economic growth in Asia23 between 2000 and 2008, compared with 10.8 per cent in the US. This, however, masks the divergence within Asia. In the earlier period, manufacturing accounted for 37.7 per cent of growth in East Asia but for only 13.4 per cent in South Asia. The corre-sponding figures were 34.7 per cent and 17.8 per cent in the 2000s, so the differ-ential is narrowing. Another big difference between East Asia and South Asia was the contribution made by agriculture, at 5.7 per cent and 15.7 per cent respectively in the late 1990s. In the 2000s its contribution was halved in South Asia, although it was still twice as big as in East Asia. Over the same period the contribution from construction increased by 50 per cent. The country group most dominated by manufac-turing in the late 1990s was ASEAN, with a contribution of 39.5 per cent. But in recent years manufacturing’s contribution was reduced by 10 percentage points to 28.8 per cent, while wholesale and retail trade,
hotels, and restaurants more than doubled from 8.6 per cent to 18.3 per cent. On the whole, we see wholesale and retail trade, hotels and restaurants increased its weight in the Asian economies between the two periods compared, probably as a rebound after the Asian financial crisis. In the US the finance, real estate, and business activities sub-sector made the biggest contribution in both periods, accounting for 30.5 per cent of economic growth in 1995–2000, rising to 39.8 per cent in 2000–2008. In contrast, its contribution in Asia was 12.9 per cent in the period 2000–2008. Between the two periods, the story for GCC countries was about mining and construction, the contributions of which increased from 19.9 per cent to 32.3 per cent and from 3.6 per cent to 8.9 per cent respectively.
The agricultural sector is much more significant in Asia23 than in the US, with a contribution of 7.8 per cent compared with a relatively negligible 1.7 per cent for the period 1995–2000. In the 2000s, however, the relative significance of the agricultural sector in Asia23
Sources: Official national accounts in each country, including our adjustments.
3-1. Food products, beverages, and tabacco products 3-2. Textiles, wearing apparel, and leather products3-3. Wood and wood products 3-4. Paper, paper products, printing, and publishing3-5. Coke, petroluem, chemicals, rubber, and plastic products 3-6. Other non-metallic mineral products3-7. Basic metals 3-8. Machinery and equipment3-9. Other manufacturing 3. Manufacturing
0
2
4
6
8
−2
10% %
IranKoreaMalaysiaROCBangladeshUS IndiaPhilippinesThailandIndonesiaJapan
1995–2000
−2
0
2
4
6
8
10
Iran
India
BangladeshROCKoreaThailand
IndonesiaPhilippinesMalaysia
JapanUS
2000–2008
Figure 58: Industry Origins of Output Growth in Manufac-turing, 1995–2000 and 2000–2008— Sub-industry decomposition: Average annual growth rate of GDP at
constant prices
81: The Törnqvist quantity index is adopted for calculating the growth of real GDP of manufacturing. Using this index, we can decom-pose the growth of real GDP of manufacturing into the products of contributions by sub-industries of manufacturing:
ln(GDP tx/GDP t−1
x )= j(1/2)(stj +st−1
j )ln(Qtj /Qt−1
j )
Real GDP growth of manufacturing Contribution of a sub-industry j
where Q tj is real GDP of a sub-industry j in period t and s t
j is the nominal GDP share of a sub-industry j in period t.
82: Asian averages are calculated using the Törnqvist index to ag-gregate the growth rates of industry GDP of each country based on the two-period average of each country’s shares of industry GDP to the gross regional products as weights.
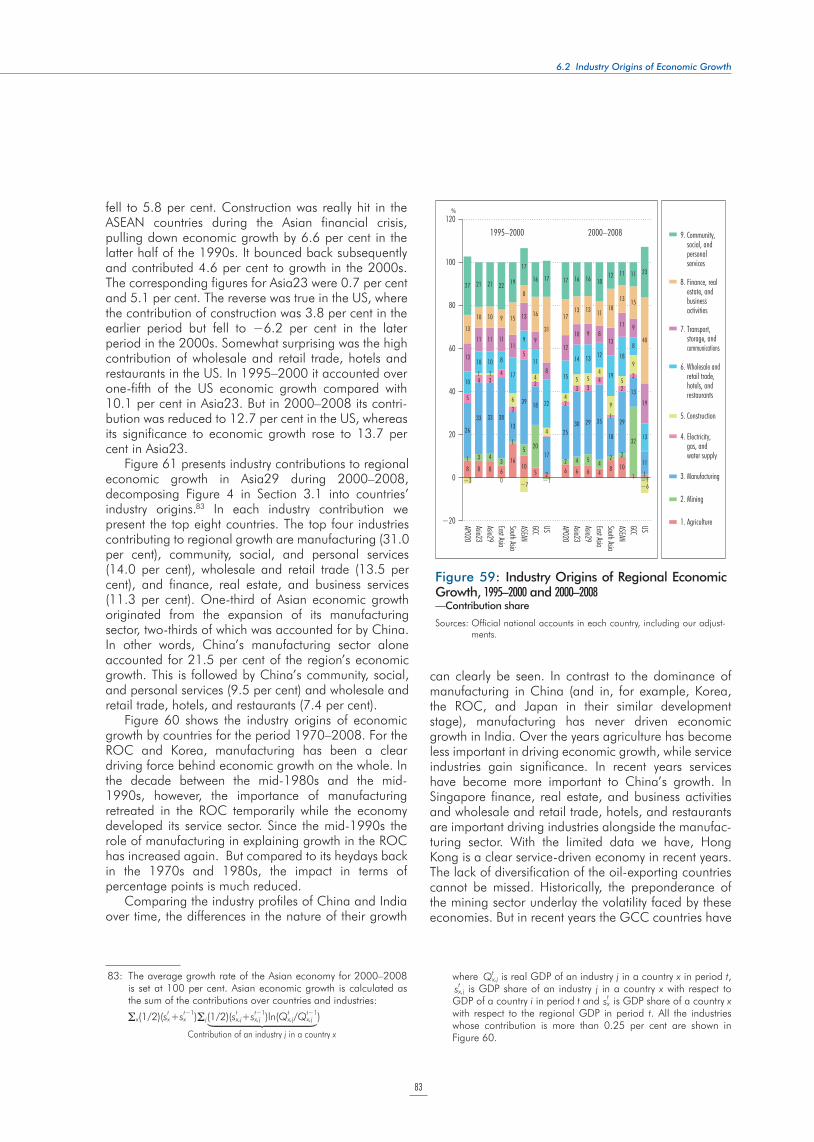
83
6.2 Industry Origins of Economic Growth
fell to 5.8 per cent. Construction was really hit in the ASEAN countries during the Asian financial crisis, pulling down economic growth by 6.6 per cent in the latter half of the 1990s. It bounced back subsequently and contributed 4.6 per cent to growth in the 2000s. The corresponding figures for Asia23 were 0.7 per cent and 5.1 per cent. The reverse was true in the US, where the contribution of construction was 3.8 per cent in the earlier period but fell to !6.2 per cent in the later period in the 2000s. Somewhat surprising was the high contribution of wholesale and retail trade, hotels and restaurants in the US. In 1995–2000 it accounted over one-fifth of the US economic growth compared with 10.1 per cent in Asia23. But in 2000–2008 its contri-bution was reduced to 12.7 per cent in the US, whereas its significance to economic growth rose to 13.7 per cent in Asia23.
Figure 61 presents industry contributions to regional economic growth in Asia29 during 2000–2008, decomposing Figure 4 in Section 3.1 into countries’ industry origins.83 In each industry contribution we present the top eight countries. The top four industries contributing to regional growth are manufacturing (31.0 per cent), community, social, and personal services (14.0 per cent), wholesale and retail trade (13.5 per cent), and finance, real estate, and business services (11.3 per cent). One-third of Asian economic growth originated from the expansion of its manufacturing sector, two-thirds of which was accounted for by China. In other words, China’s manufacturing sector alone accounted for 21.5 per cent of the region’s economic growth. This is followed by China’s community, social, and personal services (9.5 per cent) and wholesale and retail trade, hotels, and restaurants (7.4 per cent).
Figure 60 shows the industry origins of economic growth by countries for the period 1970–2008. For the ROC and Korea, manufacturing has been a clear driving force behind economic growth on the whole. In the decade between the mid-1980s and the mid-1990s, however, the importance of manufacturing retreated in the ROC temporarily while the economy developed its service sector. Since the mid-1990s the role of manufacturing in explaining growth in the ROC has increased again. But compared to its heydays back in the 1970s and 1980s, the impact in terms of percentage points is much reduced.
Comparing the industry profiles of China and India over time, the differences in the nature of their growth
can clearly be seen. In contrast to the dominance of manufacturing in China (and in, for example, Korea, the ROC, and Japan in their similar development stage), manufacturing has never driven economic growth in India. Over the years agriculture has become less important in driving economic growth, while service industries gain significance. In recent years services have become more important to China’s growth. In Singapore finance, real estate, and business activities and wholesale and retail trade, hotels, and restaurants are important driving industries alongside the manufac-turing sector. With the limited data we have, Hong Kong is a clear service-driven economy in recent years. The lack of diversification of the oil-exporting countries cannot be missed. Historically, the preponderance of the mining sector underlay the volatility faced by these economies. But in recent years the GCC countries have
9. Community, social, and personal services
8. Finance, real estate, and business activities
7. Transport, storage, and communications
6. Wholesale and retail trade, hotels, and restaurants
5. Construction
4. Electricity, gas, and water supply
3. Manufacturing
2. Mining
1. Agriculture
8 8 8 6
1610
5 2 6 6 6 48 10
1 1
1 3 43
15 20
−1
2 4 5 42 2
32
−1
26
33 33 3813
39 18
17
2530 29 35
18
29
13
11
−3
1 1
0
6
−7
4
4
4
5 544
1
9
5
9
−6
10
5
5
44
3
3
3 32
2
2
2
10 10 8
17
9
11
22
15
14 13 12
19
188
13
13
11 11 1111
13
9
8
12
10 9 813
11 9
19
13
10 10 9 15
8
16
31
1713 13 11
1813 15
40
27 21 21 22 19
17
16 17 17 16 16 1812 11 11 23
120
100
80
60
40
20
0
−20 APO20Asia23Asia29East AsiaSouth AsiaASEANGCCUS APO20Asia23Asia29East AsiaSouth AsiaASEANGCCUS
1995–2000 2000–2008
%
Figure 59: Industry Origins of Regional Economic Growth, 1995–2000 and 2000–2008 —Contribution share
Sources: Official national accounts in each country, including our adjust-ments.
83: The average growth rate of the Asian economy for 2000–2008 is set at 100 per cent. Asian economic growth is calculated as the sum of the contributions over countries and industries:
x(1/2)(stx+st−1
x ) j(1/2)(stx,j+st−1
x,j )ln(Qtx,j/Qt−1
x,j )
Contribution of an industry j in a country x
where Qtx,j is real GDP of an industry j in a country x in period t,
stx,j is GDP share of an industry j in a country x with respect to
GDP of a country i in period t and stx is GDP share of a country x
with respect to the regional GDP in period t. All the industries whose contribution is more than 0.25 per cent are shown in Figure 60.
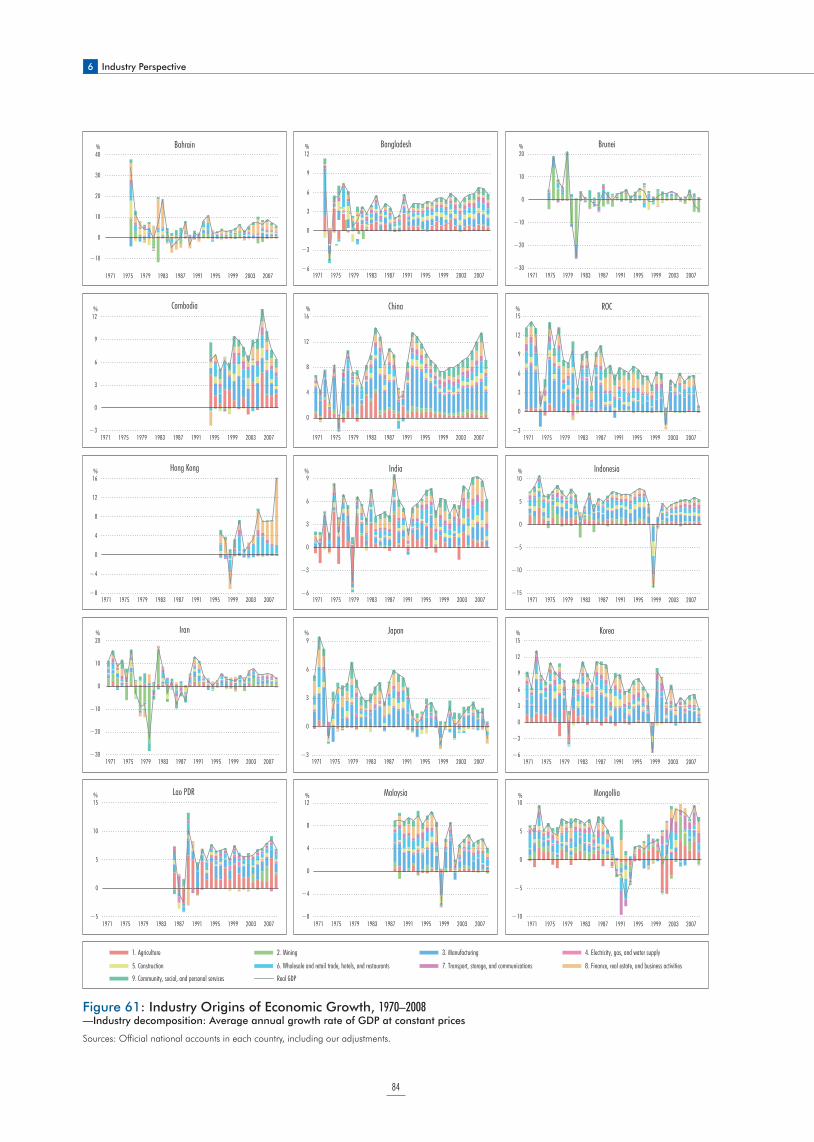
6 Industry Perspective
84
12
9
6
3
0
−3
−6
9
6
3
0
−3
−6
12
9
6
3
0
−3
40
30
20
10
0
−10
20
10
0
−10
−20
−30
16
12
8
4
0
15
12
9
6
3
0
−3
16
12
8
4
0
−4
−8
10
5
0
−5
−10
−15
20
10
0
−10
−20
−30
9
6
3
0
−3
15
12
9
6
3
0
−3
−6
15
10
5
0
−5
12
8
4
0
−4
−8
10
5
0
−5
−10
1971 1975 1979 1983 1987 1991 1995 1999 2003 2007
1971 1975 1979 1983 1987 1991 1995 1999 2003 2007
1971 1975 1979 1983 1987 1991 1995 1999 2003 2007 1971 1975 1979 1983 1987 1991 1995 1999 2003 2007
Bangladesh
Cambodia
Bahrain
1971 1975 1979 1983 1987 1991 1995 1999 2003 2007
China
Brunei
1971 1975 1979 1983 1987 1991 1995 1999 2003 2007
ROC
1971 1975 1979 1983 1987 1991 1995 1999 2003 2007
Hong Kong
1971 1975 1979 1983 1987 1991 1995 1999 2003 2007
India
1971 1975 1979 1983 1987 1991 1995 1999 2003 2007
Indonesia
1971 1975 1979 1983 1987 1991 1995 1999 2003 2007
Iran
1971 1975 1979 1983 1987 1991 1995 1999 2003 2007
Japan
1971 1975 1979 1983 1987 1991 1995 1999 2003 2007
Korea
1971 1975 1979 1983 1987 1991 1995 1999 2003 2007
Lao PDR
1971 1975 1979 1983 1987 1991 1995 1999 2003 2007
Malaysia
1971 1975 1979 1983 1987 1991 1995 1999 2003 2007
Mongollia
%% %
% % %
% % %
% % %
% % %
9. Community, social, and personal services
8. Finance, real estate, and business activities7. Transport, storage, and communications6. Wholesale and retail trade, hotels, and restaurants5. Construction
4. Electricity, gas, and water supply3. Manufacturing2. Mining1. Agriculture
Real GDP
Figure 61: Industry Origins of Economic Growth, 1970–2008—Industry decomposition: Average annual growth rate of GDP at constant prices
Sources: Official national accounts in each country, including our adjustments.
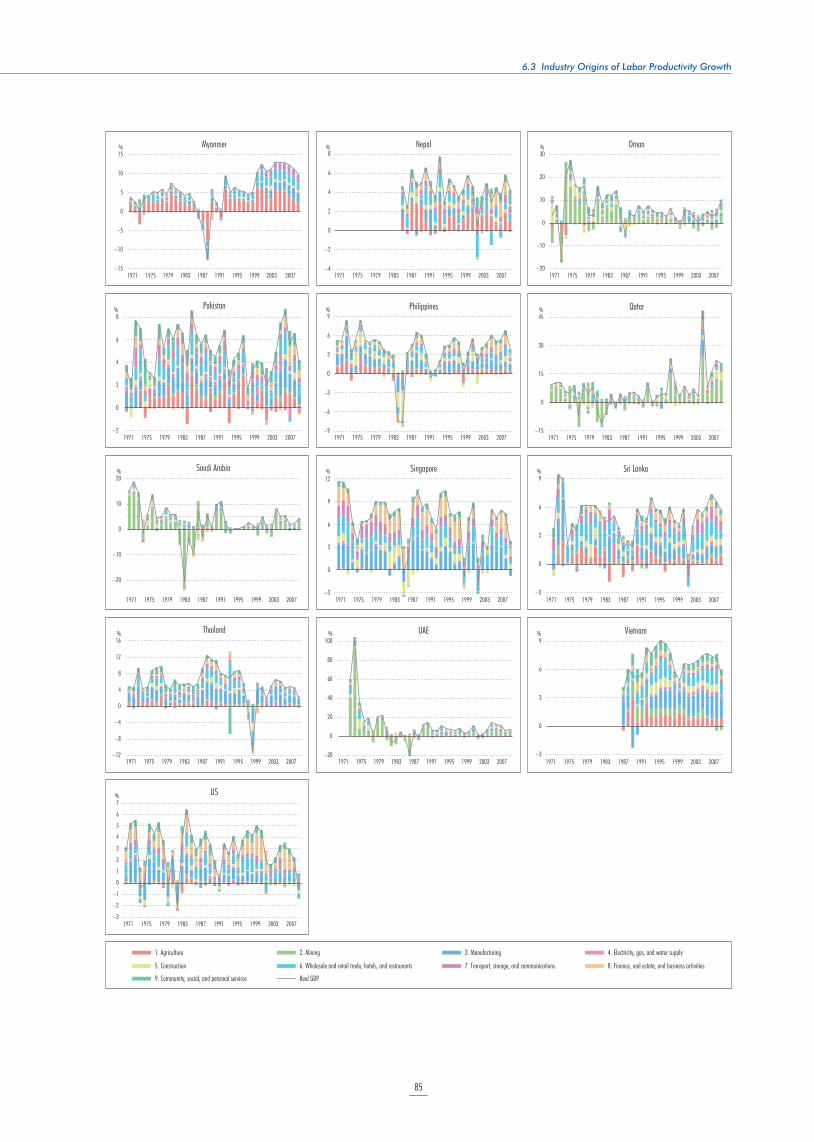
85
6.3 Industry Origins of Labor Productivity Growth
8
6
4
2
0
–2
–4
30
20
10
0
–10
–20
8
6
4
2
0
–2
9
6
3
0
–3
–6
–9
45
30
15
0
–15
20
10
0
–10
–20
12
9
6
3
0
–3
9
6
3
0
–3
16
12
8
4
0
–4
–8
–12
100
80
60
40
20
0
–20
9
6
3
0
–3
7
6
5
4
3
2
1
0
–1
–2
–3
15
10
5
0
–5
–10
–151971 1975 1979 1983 1987 1991 1995 1999 2003 2007
1971 1975 1979 1983 1987 1991 1995 1999 2003 2007
1971 1975 1979 1983 1987 1991 1995 1999 2003 2007 1971 1975 1979 1983 1987 1991 1995 1999 2003 2007
Myanmer
Pakistan
Nepal
1971 1975 1979 1983 1987 1991 1995 1999 2003 2007
Philippines
Oman
1971 1975 1979 1983 1987 1991 1995 1999 2003 2007
Qatar
1971 1975 1979 1983 1987 1991 1995 1999 2003 2007
Saudi Arabia
1971 1975 1979 1983 1987 1991 1995 1999 2003 2007
Singapore
1971 1975 1979 1983 1987 1991 1995 1999 2003 2007
Sri Lanka
1971 1975 1979 1983 1987 1991 1995 1999 2003 2007
Thailand
1971 1975 1979 1983 1987 1991 1995 1999 2003 2007
UAE
1971 1975 1979 1983 1987 1991 1995 1999 2003 2007
Vietnam
1971 1975 1979 1983 1987 1991 1995 1999 2003 2007
US
% % %
% % %
%
%
% %
% % %
9. Community, social, and personal services
8. Finance, real estate, and business activities7. Transport, storage, and communications6. Wholesale and retail trade, hotels, and restaurants5. Construction
4. Electricity, gas, and water supply3. Manufacturing2. Mining1. Agriculture
Real GDP
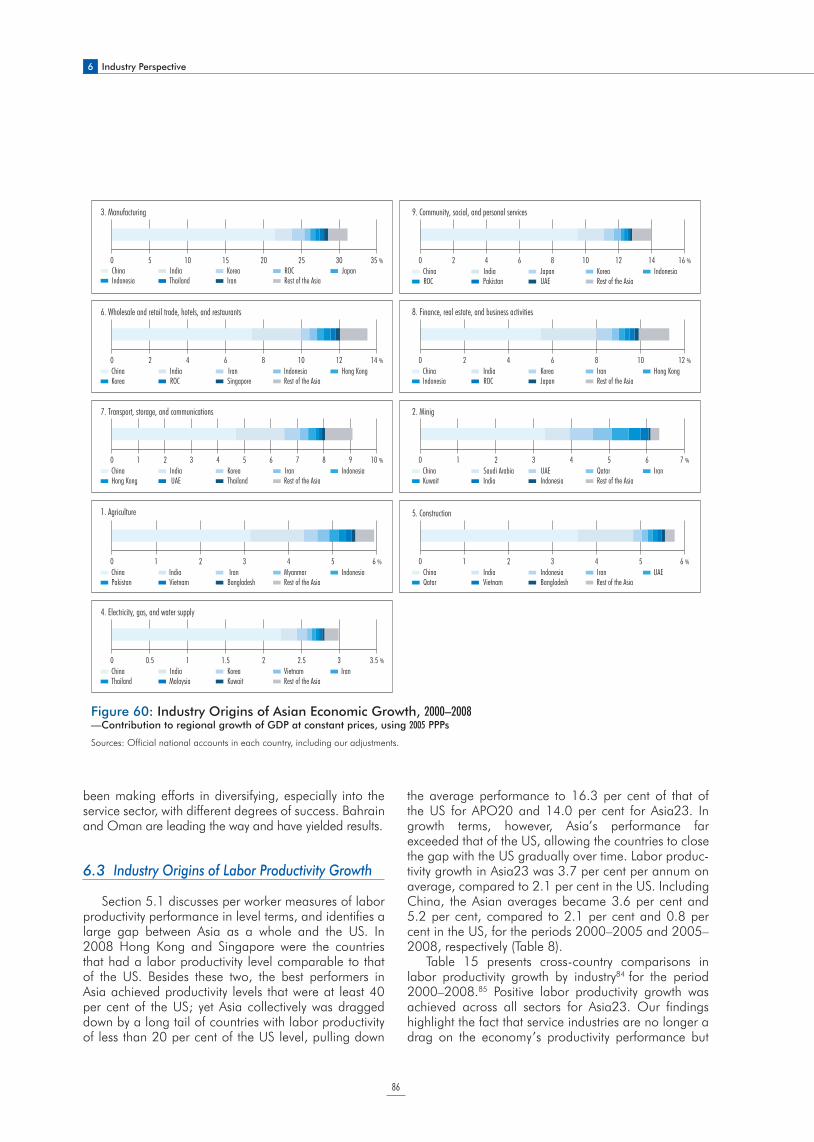
6 Industry Perspective
86
been making efforts in diversifying, especially into the service sector, with different degrees of success. Bahrain and Oman are leading the way and have yielded results.
6.3 Industry Origins of Labor Productivity Growth
Section 5.1 discusses per worker measures of labor productivity performance in level terms, and identifies a large gap between Asia as a whole and the US. In 2008 Hong Kong and Singapore were the countries that had a labor productivity level comparable to that of the US. Besides these two, the best performers in Asia achieved productivity levels that were at least 40 per cent of the US; yet Asia collectively was dragged down by a long tail of countries with labor productivity of less than 20 per cent of the US level, pulling down
the average performance to 16.3 per cent of that of the US for APO20 and 14.0 per cent for Asia23. In growth terms, however, Asia’s performance far exceeded that of the US, allowing the countries to close the gap with the US gradually over time. Labor produc-tivity growth in Asia23 was 3.7 per cent per annum on average, compared to 2.1 per cent in the US. Including China, the Asian averages became 3.6 per cent and 5.2 per cent, compared to 2.1 per cent and 0.8 per cent in the US, for the periods 2000–2005 and 2005–2008, respectively (Table 8).
Table 15 presents cross-country comparisons in labor productivity growth by industry84 for the period 2000–2008.85 Positive labor productivity growth was achieved across all sectors for Asia23. Our findings highlight the fact that service industries are no longer a drag on the economy’s productivity performance but
0 5 10 15 20 25 30 35 % China India Korea ROC Japan Indonesia Thailand Iran Rest of the Asia
3. Manufacturing
0 2 4 6 8 10 12 14 % China India Iran Indonesia Hong Kong Korea ROC Singapore Rest of the Asia
6. Wholesale and retail trade, hotels, and restaurants
0 1 2 3 4 5 6 7 8 9 10 % China India Korea Iran Indonesia Hong Kong UAE Thailand Rest of the Asia
7. Transport, storage, and communications
0 1 2 3 4 5 6 % China India Iran Myanmar Indonesia Pakistan Vietnam Bangladesh Rest of the Asia
1. Agriculture
0 0.5 1 1.5 2 2.5 3 3.5 % China India Korea Vietnam Iran Thailand Malaysia Kuwait Rest of the Asia
4. Electricity, gas, and water supply
0 2 4 6 8 10 12 14 16 % China India Japan Korea Indonesia ROC Pakistan UAE Rest of the Asia
9. Community, social, and personal services
0 2 4 6 8 10 12 %China India Korea Iran Hong KongIndonesia ROC Japan Rest of the Asia
8. Finance, real estate, and business activities
0 1 2 3 4 5 6 %China India Indonesia Iran UAEQatar Vietnam Bangladesh Rest of the Asia
5. Construction
0 1 2 3 4 5 6 7 %China Saudi Arabia UAE Qatar IranKuwait India Indonesia Rest of the Asia
2. Minig
Figure 60: Industry Origins of Asian Economic Growth, 2000–2008—Contribution to regional growth of GDP at constant prices, using 2005 PPPs
Sources: Official national accounts in each country, including our adjustments.
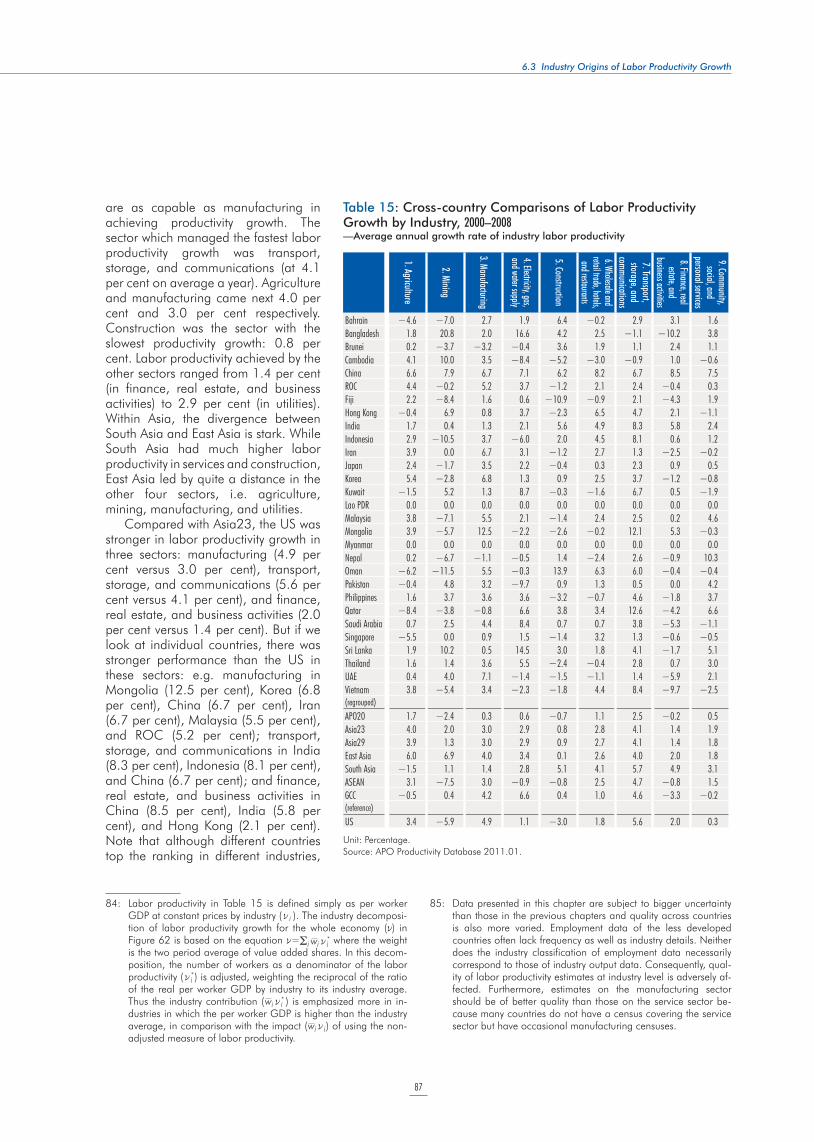
87
6.3 Industry Origins of Labor Productivity Growth
are as capable as manufacturing in achieving productivity growth. The sector which managed the fastest labor productivity growth was transport, storage, and communications (at 4.1 per cent on average a year). Agriculture and manufacturing came next 4.0 per cent and 3.0 per cent respectively. Construction was the sector with the slowest productivity growth: 0.8 per cent. Labor productivity achieved by the other sectors ranged from 1.4 per cent (in finance, real estate, and business activities) to 2.9 per cent (in utilities). Within Asia, the divergence between South Asia and East Asia is stark. While South Asia had much higher labor productivity in services and construction, East Asia led by quite a distance in the other four sectors, i.e. agriculture, mining, manufacturing, and utilities.
Compared with Asia23, the US was stronger in labor productivity growth in three sectors: manufacturing (4.9 per cent versus 3.0 per cent), transport, storage, and communications (5.6 per cent versus 4.1 per cent), and finance, real estate, and business activities (2.0 per cent versus 1.4 per cent). But if we look at individual countries, there was stronger performance than the US in these sectors: e.g. manufacturing in Mongolia (12.5 per cent), Korea (6.8 per cent), China (6.7 per cent), Iran (6.7 per cent), Malaysia (5.5 per cent), and ROC (5.2 per cent); transport, storage, and communications in India (8.3 per cent), Indonesia (8.1 per cent), and China (6.7 per cent); and finance, real estate, and business activities in China (8.5 per cent), India (5.8 per cent), and Hong Kong (2.1 per cent). Note that although different countries top the ranking in different industries,
1. Agriculture
2. Mining
3. Manufacturing
4. Electricity, gas, and water supply
5. Construction
6. Wholesale and
retail trade, hotels,and restaurants
7. Transport, storage, and
comm
unications
8. Finance, real estate, and
business activities
9. Comm
unity, social, and
personal services
Bahrain !4.6 !7.0 2.7 1.9 6.4 !0.2 2.9 3.1 1.6
Bangladesh 1.8 20.8 2.0 16.6 4.2 2.5 !1.1 !10.2 3.8
Brunei 0.2 !3.7 !3.2 !0.4 3.6 1.9 1.1 2.4 1.1
Cambodia 4.1 10.0 3.5 !8.4 !5.2 !3.0 !0.9 1.0 !0.6
China 6.6 7.9 6.7 7.1 6.2 8.2 6.7 8.5 7.5
ROC 4.4 !0.2 5.2 3.7 !1.2 2.1 2.4 !0.4 0.3
Fiji 2.2 !8.4 1.6 0.6 !10.9 !0.9 2.1 !4.3 1.9
Hong Kong !0.4 6.9 0.8 3.7 !2.3 6.5 4.7 2.1 !1.1
India 1.7 0.4 1.3 2.1 5.6 4.9 8.3 5.8 2.4
Indonesia 2.9 !10.5 3.7 !6.0 2.0 4.5 8.1 0.6 1.2
Iran 3.9 0.0 6.7 3.1 !1.2 2.7 1.3 !2.5 !0.2
Japan 2.4 !1.7 3.5 2.2 !0.4 0.3 2.3 0.9 0.5
Korea 5.4 !2.8 6.8 1.3 0.9 2.5 3.7 !1.2 !0.8
Kuwait !1.5 5.2 1.3 8.7 !0.3 !1.6 6.7 0.5 !1.9
Lao PDR 0.0 0.0 0.0 0.0 0.0 0.0 0.0 0.0 0.0
Malaysia 3.8 !7.1 5.5 2.1 !1.4 2.4 2.5 0.2 4.6
Mongolia 3.9 !5.7 12.5 !2.2 !2.6 !0.2 12.1 5.3 !0.3
Myanmar 0.0 0.0 0.0 0.0 0.0 0.0 0.0 0.0 0.0
Nepal 0.2 !6.7 !1.1 !0.5 1.4 !2.4 2.6 !0.9 10.3
Oman !6.2 !11.5 5.5 !0.3 13.9 6.3 6.0 !0.4 !0.4
Pakistan !0.4 4.8 3.2 !9.7 0.9 1.3 0.5 0.0 4.2
Philippines 1.6 3.7 3.6 3.6 !3.2 !0.7 4.6 !1.8 3.7
Qatar !8.4 !3.8 !0.8 6.6 3.8 3.4 12.6 !4.2 6.6
Saudi Arabia 0.7 2.5 4.4 8.4 0.7 0.7 3.8 !5.3 !1.1
Singapore !5.5 0.0 0.9 1.5 !1.4 3.2 1.3 !0.6 !0.5
Sri Lanka 1.9 10.2 0.5 14.5 3.0 1.8 4.1 !1.7 5.1
Thailand 1.6 1.4 3.6 5.5 !2.4 !0.4 2.8 0.7 3.0
UAE 0.4 4.0 7.1 !1.4 !1.5 !1.1 1.4 !5.9 2.1
Vietnam 3.8 !5.4 3.4 !2.3 !1.8 4.4 8.4 !9.7 !2.5(regrouped)
APO20 1.7 !2.4 0.3 0.6 !0.7 1.1 2.5 !0.2 0.5
Asia23 4.0 2.0 3.0 2.9 0.8 2.8 4.1 1.4 1.9
Asia29 3.9 1.3 3.0 2.9 0.9 2.7 4.1 1.4 1.8
East Asia 6.0 6.9 4.0 3.4 0.1 2.6 4.0 2.0 1.8
South Asia !1.5 1.1 1.4 2.8 5.1 4.1 5.7 4.9 3.1
ASEAN 3.1 !7.5 3.0 !0.9 !0.8 2.5 4.7 !0.8 1.5
GCC !0.5 0.4 4.2 6.6 0.4 1.0 4.6 !3.3 !0.2(reference)
US 3.4 !5.9 4.9 1.1 !3.0 1.8 5.6 2.0 0.3
Unit: Percentage.
Source: APO Productivity Database 2011.01.
Table 15: Cross-country Comparisons of Labor Productivity Growth by Industry, 2000–2008—Average annual growth rate of industry labor productivity
84: Labor productivity in Table 15 is defined simply as per worker GDP at constant prices by industry (o j ). The industry decomposi-tion of labor productivity growth for the whole economy (o) in Figure 62 is based on the equation o= j wj o *
j where the weight is the two period average of value added shares. In this decom-position, the number of workers as a denominator of the labor productivity (o *
j ) is adjusted, weighting the reciprocal of the ratio of the real per worker GDP by industry to its industry average. Thus the industry contribution (wj o *
j ) is emphasized more in in-dustries in which the per worker GDP is higher than the industry average, in comparison with the impact (wj o j) of using the non-adjusted measure of labor productivity.
85: Data presented in this chapter are subject to bigger uncertainty than those in the previous chapters and quality across countries is also more varied. Employment data of the less developed countries often lack frequency as well as industry details. Neither does the industry classification of employment data necessarily correspond to those of industry output data. Consequently, qual-ity of labor productivity estimates at industry level is adversely af-fected. Furthermore, estimates on the manufacturing sector should be of better quality than those on the service sector be-cause many countries do not have a census covering the service sector but have occasional manufacturing censuses.
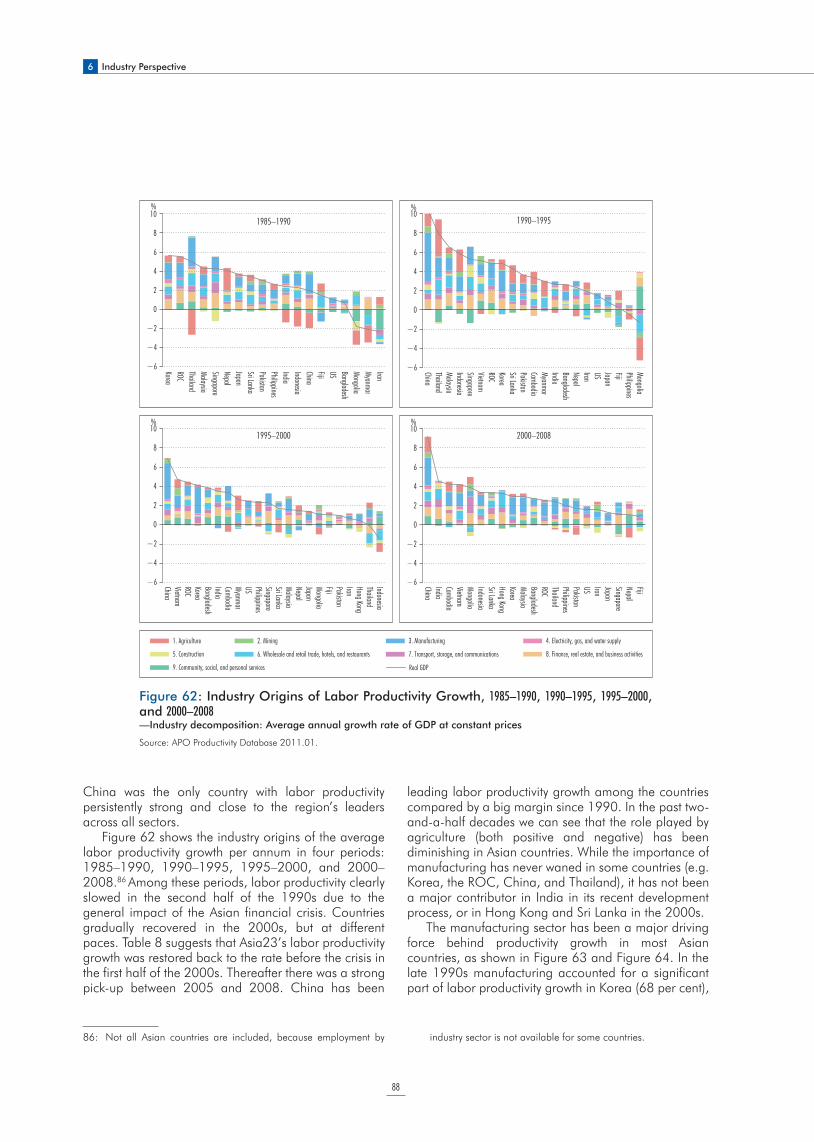
6 Industry Perspective
88
China was the only country with labor productivity persistently strong and close to the region’s leaders across all sectors.
Figure 62 shows the industry origins of the average labor productivity growth per annum in four periods: 1985–1990, 1990–1995, 1995–2000, and 2000–2008.86 Among these periods, labor productivity clearly slowed in the second half of the 1990s due to the general impact of the Asian financial crisis. Countries gradually recovered in the 2000s, but at different paces. Table 8 suggests that Asia23’s labor productivity growth was restored back to the rate before the crisis in the first half of the 2000s. Thereafter there was a strong pick-up between 2005 and 2008. China has been
leading labor productivity growth among the countries compared by a big margin since 1990. In the past two-and-a-half decades we can see that the role played by agriculture (both positive and negative) has been diminishing in Asian countries. While the importance of manufacturing has never waned in some countries (e.g. Korea, the ROC, China, and Thailand), it has not been a major contributor in India in its recent development process, or in Hong Kong and Sri Lanka in the 2000s.
The manufacturing sector has been a major driving force behind productivity growth in most Asian countries, as shown in Figure 63 and Figure 64. In the late 1990s manufacturing accounted for a significant part of labor productivity growth in Korea (68 per cent),
Figure 62: Industry Origins of Labor Productivity Growth, 1985–1990, 1990–1995, 1995–2000, and 2000–2008— Industry decomposition: Average annual growth rate of GDP at constant prices
Source: APO Productivity Database 2011.01.
−6
−4
−2
0
2
4
6
8
10%
−6
%
−6
%
−6
%
KoreaROCThailandMalaysiaSingaporeNepalJapanSri LankaPakistanPhilippinesIndiaIndonesiaChinaFijiUS BangladeshMongoliaMyanmarIran
1985–1990
−4
−2
0
2
4
6
8
10
ChinaThailandMalaysiaIndonesiaSingaporeVietnamROCKoreaSri LankaPakistanCambodiaMyanmarIndiaBangladeshNepalIranUS JapanFijiPhilippinesMongolia
1990–1995
−4
−2
0
2
4
6
8
10
ChinaVietnamROCKoreaBangladeshIndiaCambodiaMyanmarUS PhilippinesSingaporeSri LankaMalaysiaNepalJapanMongoliaFijiPakistanIranHong KongThailandIndonesia
1995–2000
−4
−2
0
2
4
6
8
10
ChinaIndiaCambodiaVietnamMongoliaIndonesiaSri LankaHong KongKoreaMalaysiaBangladeshROCThailandPhilippinesPakistanUS IranJapanSingaporeNepalFiji
2000–2008
9. Community, social, and personal services
8. Finance, real estate, and business activities7. Transport, storage, and communications6. Wholesale and retail trade, hotels, and restaurants5. Construction
4. Electricity, gas, and water supply3. Manufacturing2. Mining1. Agriculture
Real GDP
86: Not all Asian countries are included, because employment by industry sector is not available for some countries.
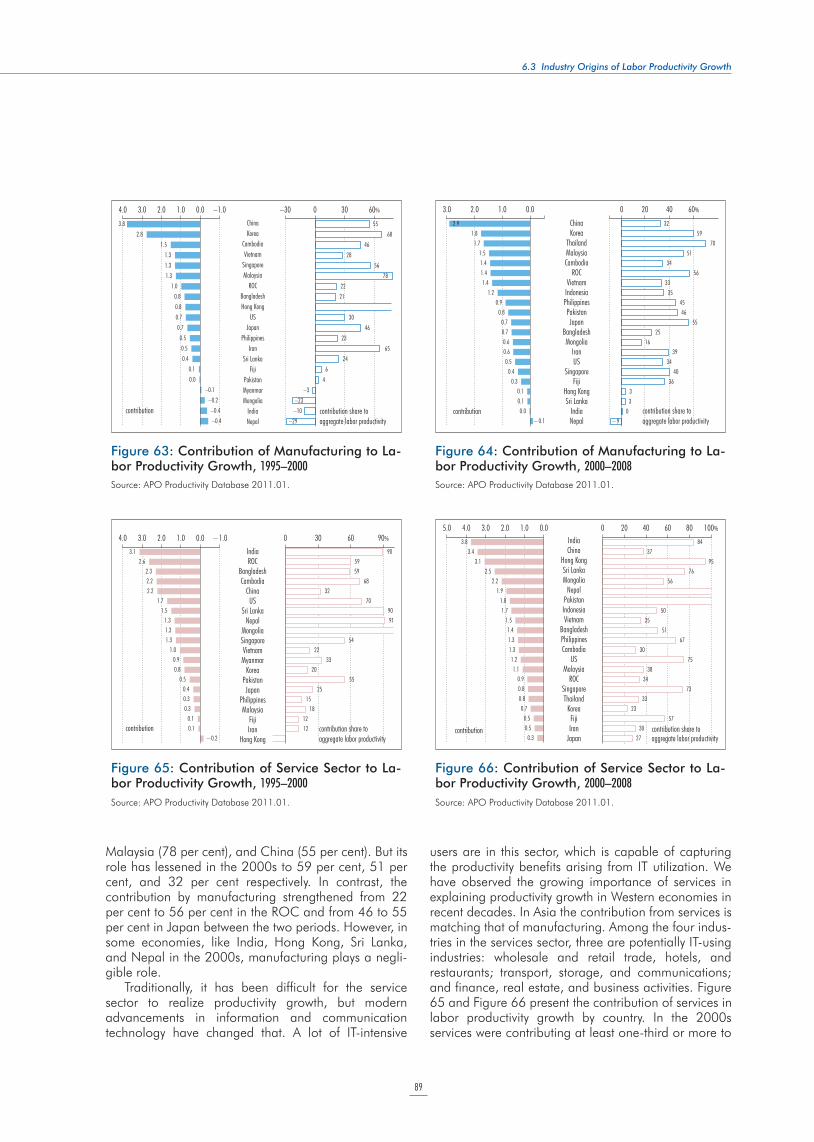
89
6.3 Industry Origins of Labor Productivity Growth
Malaysia (78 per cent), and China (55 per cent). But its role has lessened in the 2000s to 59 per cent, 51 per cent, and 32 per cent respectively. In contrast, the contribution by manufacturing strengthened from 22 per cent to 56 per cent in the ROC and from 46 to 55 per cent in Japan between the two periods. However, in some economies, like India, Hong Kong, Sri Lanka, and Nepal in the 2000s, manufacturing plays a negli-gible role.
Traditionally, it has been difficult for the service sector to realize productivity growth, but modern advancements in information and communication technology have changed that. A lot of IT-intensive
users are in this sector, which is capable of capturing the productivity benefits arising from IT utilization. We have observed the growing importance of services in explaining productivity growth in Western economies in recent decades. In Asia the contribution from services is matching that of manufacturing. Among the four indus-tries in the services sector, three are potentially IT-using industries: wholesale and retail trade, hotels, and restaurants; transport, storage, and communications; and finance, real estate, and business activities. Figure 65 and Figure 66 present the contribution of services in labor productivity growth by country. In the 2000s services were contributing at least one-third or more to
–30 0 30 60%–1.00.01.02.03.04.0
3.8
68
78
65
55
4628
56
2221
3046
23
246
4–3
–23–10
–29contribution share toaggregate labor productivity
2.81.5
1.31.31.3
1.00.80.80.70.70.50.50.4
0.10.0
–0.1–0.2–0.4–0.4
contribution
ChinaKorea
CambodiaVietnam
SingaporeMalaysia
ROCBangladeshHong Kong
USJapan
PhilippinesIran
Sri LankaFiji
PakistanMyanmarMongolia
IndiaNepal
Figure 63: Contribution of Manufacturing to La-bor Productivity Growth, 1995–2000
Source: APO Productivity Database 2011.01.
0 20 60%400.01.02.03.0
2.9
70
3259
5134
5633
354546
5525
1639
3440
3633
0−9
1.81.7
1.51.41.41.4
1.20.9
0.80.70.70.60.60.5
0.40.3
0.10.10.0
−0.1contribution contribution share to
aggregate labor productivity
ChinaKorea
ThailandMalaysiaCambodia
ROCVietnam
IndonesiaPhilippinesPakistanJapan
BangladeshMongolia
IranUS
SingaporeFiji
Hong KongSri Lanka
IndiaNepal
Figure 64: Contribution of Manufacturing to La-bor Productivity Growth, 2000–2008
Source: APO Productivity Database 2011.01.
0 30 60 90%−1.00.01.02.03.04.090
5959
6832
709091
5422
3320
5525
1518
1212 contribution share to
aggregate labor productivity
3.12.6
2.32.22.2
1.71.5
1.31.31.3
1.00.90.8
0.50.40.30.3
0.10.1
−0.2contribution
IndiaROC
BangladeshCambodia
ChinaUS
Sri LankaNepal
MongoliaSingaporeVietnamMyanmar
KoreaPakistanJapan
PhilippinesMalaysia
FijiIran
Hong Kong
Figure 65: Contribution of Service Sector to La-bor Productivity Growth, 1995–2000
Source: APO Productivity Database 2011.01.
8437
9576
56
5035
5167
3075
3834
7333
2357
3027
3.83.4
3.12.5
2.21.9
1.81.7
1.51.41.31.31.21.1
0.90.80.80.7
0.50.5
0.3contribution share toaggregate labor productivity
contribution
IndiaChina
Hong KongSri LankaMongolia
NepalPakistanIndonesiaVietnam
BangladeshPhilippinesCambodia
USMalaysia
ROCSingaporeThailand
KoreaFijiIran
Japan
0 4020 8060 100%0.01.02.03.05.0 4.0
Figure 66: Contribution of Service Sector to La-bor Productivity Growth, 2000–2008
Source: APO Productivity Database 2011.01.
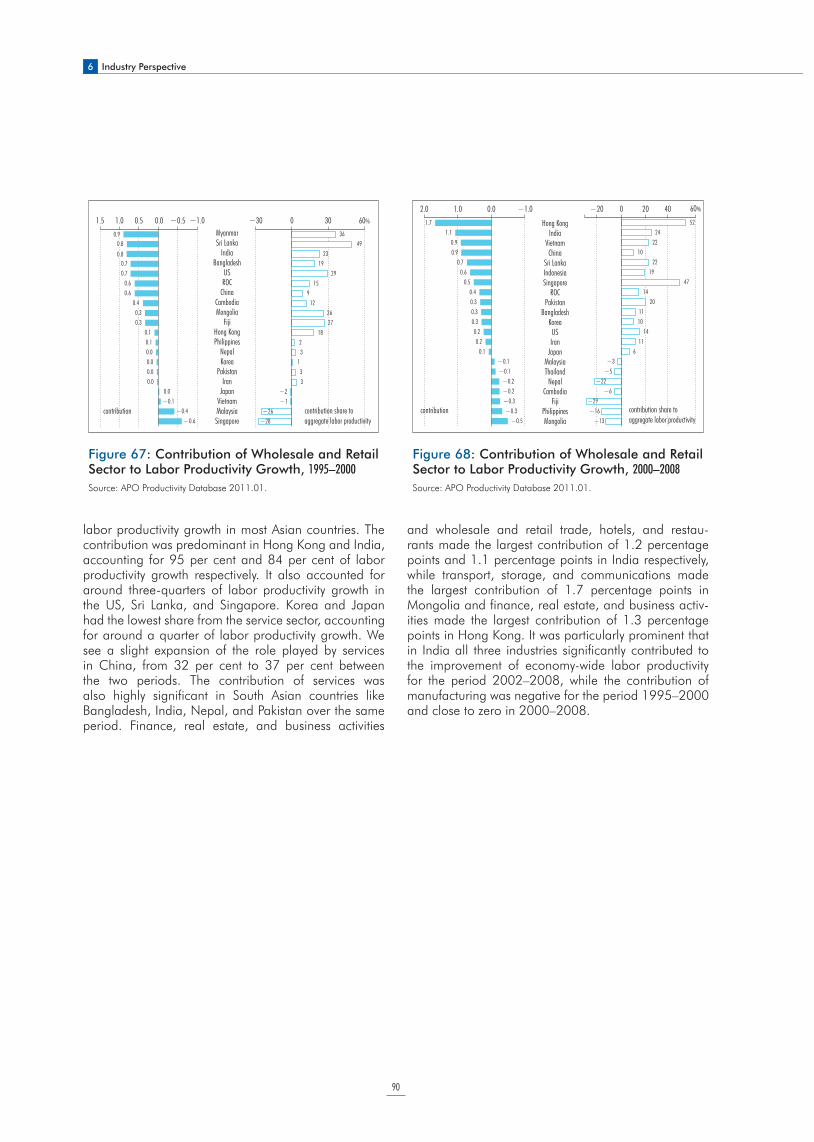
6 Industry Perspective
90
labor productivity growth in most Asian countries. The contribution was predominant in Hong Kong and India, accounting for 95 per cent and 84 per cent of labor productivity growth respectively. It also accounted for around three-quarters of labor productivity growth in the US, Sri Lanka, and Singapore. Korea and Japan had the lowest share from the service sector, accounting for around a quarter of labor productivity growth. We see a slight expansion of the role played by services in China, from 32 per cent to 37 per cent between the two periods. The contribution of services was also highly significant in South Asian countries like Bangladesh, India, Nepal, and Pakistan over the same period. Finance, real estate, and business activities
and wholesale and retail trade, hotels, and restau- rants made the largest contribution of 1.2 percentage points and 1.1 percentage points in India respectively, while transport, storage, and communications made the largest contribution of 1.7 percentage points in Mongolia and finance, real estate, and business activ-ities made the largest contribution of 1.3 percentage points in Hong Kong. It was particularly prominent that in India all three industries significantly contributed to the improvement of economy-wide labor productivity for the period 2002–2008, while the contribution of manufacturing was negative for the period 1995–2000 and close to zero in 2000–2008.
−30 0 30 60%−1.0−0.50.00.51.01.50.90.9
4936
2319
2915
912
2627
1823
133
−2−1
−26−28
contribution share toaggregate labor productivity
0.80.8
0.80.80.70.7
0.60.6
0.40.40.30.30.30.3
0.10.10.00.00.00.0
0.0−0.1
−0.4−0.6
contribution
MyanmarSri Lanka
IndiaBangladesh
USROC
ChinaCambodiaMongolia
FijiHong KongPhilippines
NepalKorea
PakistanIran
JapanVietnamMalaysiaSingapore
Figure 67: Contribution of Wholesale and Retail Sector to Labor Productivity Growth, 1995–2000
Source: APO Productivity Database 2011.01.
5224
2210
2219
4714
2011 10
1411
6−3
−5−22
−6−29−16
−13
−20 200 40 60%
1.71.1
0.90.9
0.70.6
0.50.40.30.30.30.20.2
0.1−0.1−0.1
−0.2−0.2−0.3−0.3
−0.5
−1.00.01.02.0
contribution contribution share toaggregate labor productivity
Hong KongIndia
VietnamChina
Sri LankaIndonesiaSingapore
ROCPakistan
BangladeshKoreaUSIran
JapanMalaysiaThailand
NepalCambodia
FijiPhilippinesMongolia
Figure 68: Contribution of Wholesale and Retail Sector to Labor Productivity Growth, 2000–2008
Source: APO Productivity Database 2011.01.
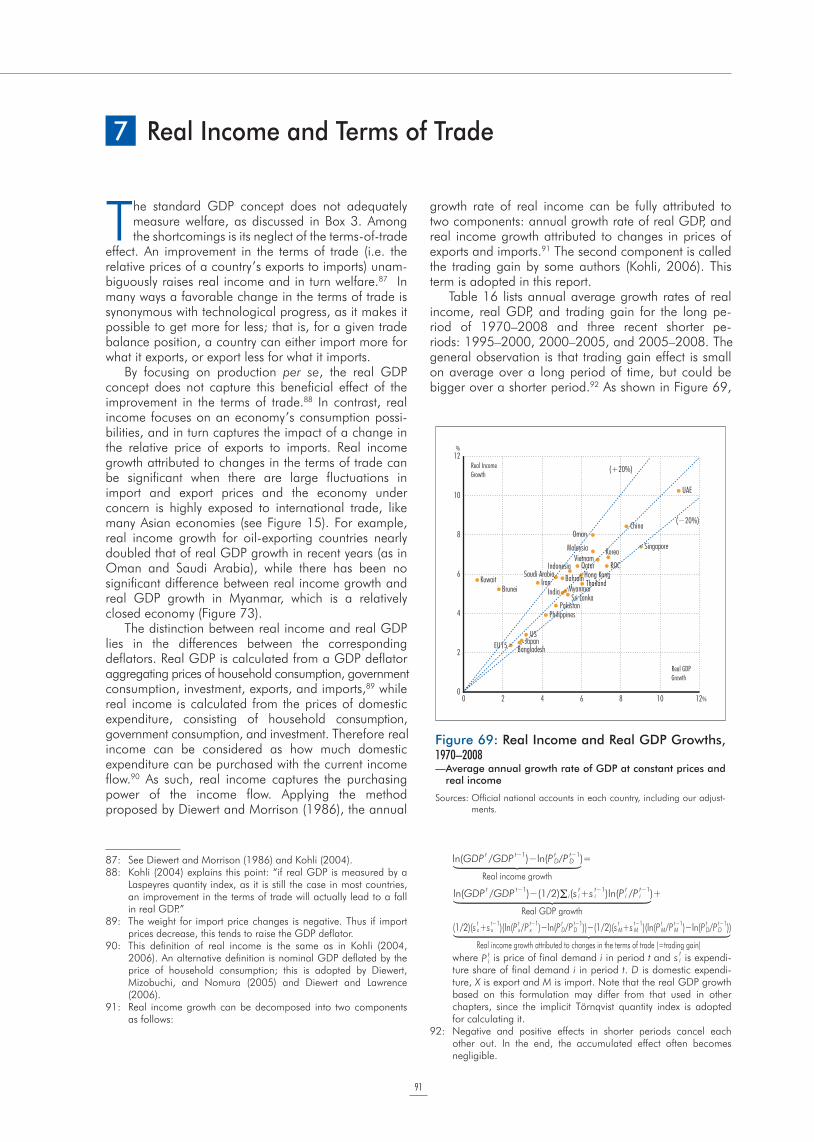
91
The standard GDP concept does not adequately measure welfare, as discussed in Box 3. Among the shortcomings is its neglect of the terms-of-trade
effect. An improvement in the terms of trade (i.e. the relative prices of a country’s exports to imports) unam-biguously raises real income and in turn welfare.87 In many ways a favorable change in the terms of trade is synonymous with technological progress, as it makes it possible to get more for less; that is, for a given trade balance position, a country can either import more for what it exports, or export less for what it imports.
By focusing on production per se, the real GDP concept does not capture this beneficial effect of the improvement in the terms of trade.88 In contrast, real income focuses on an economy’s consumption possi-bilities, and in turn captures the impact of a change in the relative price of exports to imports. Real income growth attributed to changes in the terms of trade can be significant when there are large fluctuations in import and export prices and the economy under concern is highly exposed to international trade, like many Asian economies (see Figure 15). For example, real income growth for oil-exporting countries nearly doubled that of real GDP growth in recent years (as in Oman and Saudi Arabia), while there has been no significant difference between real income growth and real GDP growth in Myanmar, which is a relatively closed economy (Figure 73).
The distinction between real income and real GDP lies in the differences between the corresponding deflators. Real GDP is calculated from a GDP deflator aggregating prices of household consumption, government consumption, investment, exports, and imports,89 while real income is calculated from the prices of domestic expenditure, consisting of household consumption, government consumption, and investment. Therefore real income can be considered as how much domestic expenditure can be purchased with the current income flow.90 As such, real income captures the purchasing power of the income flow. Applying the method proposed by Diewert and Morrison (1986), the annual
growth rate of real income can be fully attributed to two components: annual growth rate of real GDP, and real income growth attributed to changes in prices of exports and imports.91 The second component is called the trading gain by some authors (Kohli, 2006). This term is adopted in this report.
Table 16 lists annual average growth rates of real income, real GDP, and trading gain for the long pe- riod of 1970–2008 and three recent shorter pe- riods: 1995–2000, 2000–2005, and 2005–2008. The general observation is that trading gain effect is small on average over a long period of time, but could be bigger over a shorter period.92 As shown in Figure 69,
7 Real Income and Terms of Trade
87: See Diewert and Morrison (1986) and Kohli (2004).88: Kohli (2004) explains this point: “if real GDP is measured by a
Laspeyres quantity index, as it is still the case in most countries, an improvement in the terms of trade will actually lead to a fall in real GDP.”
89: The weight for import price changes is negative. Thus if import prices decrease, this tends to raise the GDP deflator.
90: This definition of real income is the same as in Kohli (2004, 2006). An alternative definition is nominal GDP deflated by the price of household consumption; this is adopted by Diewert, Mizobuchi, and Nomura (2005) and Diewert and Lawrence (2006).
91: Real income growth can be decomposed into two components as follows:
ln(GDP tx/GDP t−1
x )−ln(P tD/P t−1
D )=ln(GDP tx/GDP t−1
x )−(1/2) i(s ti+s t−1
i )ln(P ti /P t−1
i )+(1/2)(s tx+s t−1
x )(ln(P tx/P t−1
x )−ln(P tD/P t−1
D ))−(1/2)(s tM+s t−1
M )(ln(P tM/P t−1
M )−ln(P tD/P t−1
D ))
Real income growth Real GDP growth Real income growth attributed to changes in the terms of trade (=trading gain)
ln(GDP tx/GDP t−1
x )−ln(P tD/P t−1
D )=ln(GDP tx/GDP t−1
x )−(1/2) i(s ti+s t−1
i )ln(P ti /P t−1
i )+(1/2)(s tx+s t−1
x )(ln(P tx/P t−1
x )−ln(P tD/P t−1
D ))−(1/2)(s tM+s t−1
M )(ln(P tM/P t−1
M )−ln(P tD/P t−1
D ))
Real income growth Real GDP growth Real income growth attributed to changes in the terms of trade (=trading gain)where P t
i is price of final demand i in period t and s ti is expendi-
ture share of final demand i in period t. D is domestic expendi-ture, X is export and M is import. Note that the real GDP growth based on this formulation may differ from that used in other chapters, since the implicit Törnqvist quantity index is adopted for calculating it.
92: Negative and positive effects in shorter periods cancel each other out. In the end, the accumulated effect often becomes negligible.
Bangladesh
ROCHong Kong
India
Indonesia
Iran
Japan
KoreaMalaysia
PakistanPhilippines
Singapore
Sri Lanka
Thailand
Vietnam
China
Brunei MyanmarBahrainKuwait
Oman
QatarSaudi Arabia
UAE
USEU15
12
10
8
6
4
2
0
%
20 4 6 8 10 12%
Real GDP Growth
Real Income Growth
(+20%)
(−20%)
Figure 69: Real Income and Real GDP Growths, 1970–2008— Average annual growth rate of GDP at constant prices and
real income
Sources: Official national accounts in each country, including our adjust-ments.
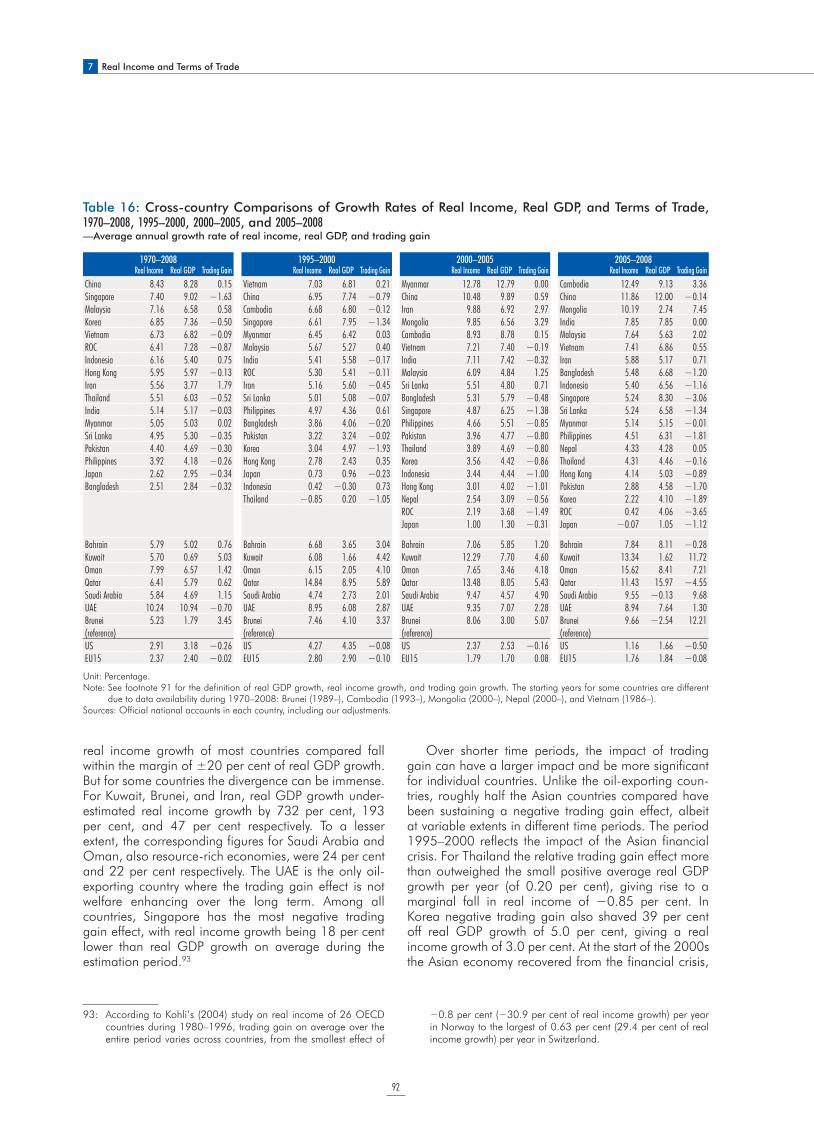
7 Real Income and Terms of Trade
92
real income growth of most countries compared fall within the margin of ±20 per cent of real GDP growth. But for some countries the divergence can be immense. For Kuwait, Brunei, and Iran, real GDP growth under-estimated real income growth by 732 per cent, 193 per cent, and 47 per cent respectively. To a lesser extent, the corresponding figures for Saudi Arabia and Oman, also resource-rich economies, were 24 per cent and 22 per cent respectively. The UAE is the only oil-exporting country where the trading gain effect is not welfare enhancing over the long term. Among all countries, Singapore has the most negative trading gain effect, with real income growth being 18 per cent lower than real GDP growth on average during the estimation period.93
Over shorter time periods, the impact of trading gain can have a larger impact and be more significant for individual countries. Unlike the oil-exporting coun- tries, roughly half the Asian countries compared have been sustaining a negative trading gain effect, albeit at variable extents in different time periods. The period 1995–2000 reflects the impact of the Asian financial crisis. For Thailand the relative trading gain effect more than outweighed the small positive average real GDP growth per year (of 0.20 per cent), giving rise to a marginal fall in real income of !0.85 per cent. In Korea negative trading gain also shaved 39 per cent off real GDP growth of 5.0 per cent, giving a real income growth of 3.0 per cent. At the start of the 2000s the Asian economy recovered from the financial crisis,
1970–2008 1995–2000 2000–2005 2005–2008Real Income Real GDP Trading Gain Real Income Real GDP Trading Gain Real Income Real GDP Trading Gain Real Income Real GDP Trading Gain
China 8.43 8.28 0.15 Vietnam 7.03 6.81 0.21 Myanmar 12.78 12.79 0.00 Cambodia 12.49 9.13 3.36
Singapore 7.40 9.02 !1.63 China 6.95 7.74 !0.79 China 10.48 9.89 0.59 China 11.86 12.00 !0.14
Malaysia 7.16 6.58 0.58 Cambodia 6.68 6.80 !0.12 Iran 9.88 6.92 2.97 Mongolia 10.19 2.74 7.45
Korea 6.85 7.36 !0.50 Singapore 6.61 7.95 !1.34 Mongolia 9.85 6.56 3.29 India 7.85 7.85 0.00
Vietnam 6.73 6.82 !0.09 Myanmar 6.45 6.42 0.03 Cambodia 8.93 8.78 0.15 Malaysia 7.64 5.63 2.02
ROC 6.41 7.28 !0.87 Malaysia 5.67 5.27 0.40 Vietnam 7.21 7.40 !0.19 Vietnam 7.41 6.86 0.55
Indonesia 6.16 5.40 0.75 India 5.41 5.58 !0.17 India 7.11 7.42 !0.32 Iran 5.88 5.17 0.71
Hong Kong 5.95 5.97 !0.13 ROC 5.30 5.41 !0.11 Malaysia 6.09 4.84 1.25 Bangladesh 5.48 6.68 !1.20
Iran 5.56 3.77 1.79 Iran 5.16 5.60 !0.45 Sri Lanka 5.51 4.80 0.71 Indonesia 5.40 6.56 !1.16
Thailand 5.51 6.03 !0.52 Sri Lanka 5.01 5.08 !0.07 Bangladesh 5.31 5.79 !0.48 Singapore 5.24 8.30 !3.06
India 5.14 5.17 !0.03 Philippines 4.97 4.36 0.61 Singapore 4.87 6.25 !1.38 Sri Lanka 5.24 6.58 !1.34
Myanmar 5.05 5.03 0.02 Bangladesh 3.86 4.06 !0.20 Philippines 4.66 5.51 !0.85 Myanmar 5.14 5.15 !0.01
Sri Lanka 4.95 5.30 !0.35 Pakistan 3.22 3.24 !0.02 Pakistan 3.96 4.77 !0.80 Philippines 4.51 6.31 !1.81
Pakistan 4.40 4.69 !0.30 Korea 3.04 4.97 !1.93 Thailand 3.89 4.69 !0.80 Nepal 4.33 4.28 0.05
Philippines 3.92 4.18 !0.26 Hong Kong 2.78 2.43 0.35 Korea 3.56 4.42 !0.86 Thailand 4.31 4.46 !0.16
Japan 2.62 2.95 !0.34 Japan 0.73 0.96 !0.23 Indonesia 3.44 4.44 !1.00 Hong Kong 4.14 5.03 !0.89
Bangladesh 2.51 2.84 !0.32 Indonesia 0.42 !0.30 0.73 Hong Kong 3.01 4.02 !1.01 Pakistan 2.88 4.58 !1.70
Thailand !0.85 0.20 !1.05 Nepal 2.54 3.09 !0.56 Korea 2.22 4.10 !1.89
ROC 2.19 3.68 !1.49 ROC 0.42 4.06 !3.65
Japan 1.00 1.30 !0.31 Japan !0.07 1.05 !1.12
Bahrain 5.79 5.02 0.76 Bahrain 6.68 3.65 3.04 Bahrain 7.06 5.85 1.20 Bahrain 7.84 8.11 !0.28
Kuwait 5.70 0.69 5.03 Kuwait 6.08 1.66 4.42 Kuwait 12.29 7.70 4.60 Kuwait 13.34 1.62 11.72
Oman 7.99 6.57 1.42 Oman 6.15 2.05 4.10 Oman 7.65 3.46 4.18 Oman 15.62 8.41 7.21
Qatar 6.41 5.79 0.62 Qatar 14.84 8.95 5.89 Qatar 13.48 8.05 5.43 Qatar 11.43 15.97 !4.55
Saudi Arabia 5.84 4.69 1.15 Saudi Arabia 4.74 2.73 2.01 Saudi Arabia 9.47 4.57 4.90 Saudi Arabia 9.55 !0.13 9.68
UAE 10.24 10.94 !0.70 UAE 8.95 6.08 2.87 UAE 9.35 7.07 2.28 UAE 8.94 7.64 1.30
Brunei 5.23 1.79 3.45 Brunei 7.46 4.10 3.37 Brunei 8.06 3.00 5.07 Brunei 9.66 !2.54 12.21
(reference) (reference) (reference) (reference)
US 2.91 3.18 !0.26 US 4.27 4.35 !0.08 US 2.37 2.53 !0.16 US 1.16 1.66 !0.50
EU15 2.37 2.40 !0.02 EU15 2.80 2.90 !0.10 EU15 1.79 1.70 0.08 EU15 1.76 1.84 !0.08
Unit: Percentage.Note: See footnote 91 for the definition of real GDP growth, real income growth, and trading gain growth. The starting years for some countries are different
due to data availability during 1970–2008: Brunei (1989–), Cambodia (1993–), Mongolia (2000–), Nepal (2000–), and Vietnam (1986–).Sources: Official national accounts in each country, including our adjustments.
Table 16: Cross-country Comparisons of Growth Rates of Real Income, Real GDP, and Terms of Trade, 1970–2008, 1995–2000, 2000–2005, and 2005–2008—Average annual growth rate of real income, real GDP, and trading gain
93: According to Kohli’s (2004) study on real income of 26 OECD countries during 1980–1996, trading gain on average over the entire period varies across countries, from the smallest effect of
!0.8 per cent (!30.9 per cent of real income growth) per year in Norway to the largest of 0.63 per cent (29.4 per cent of real income growth) per year in Switzerland.
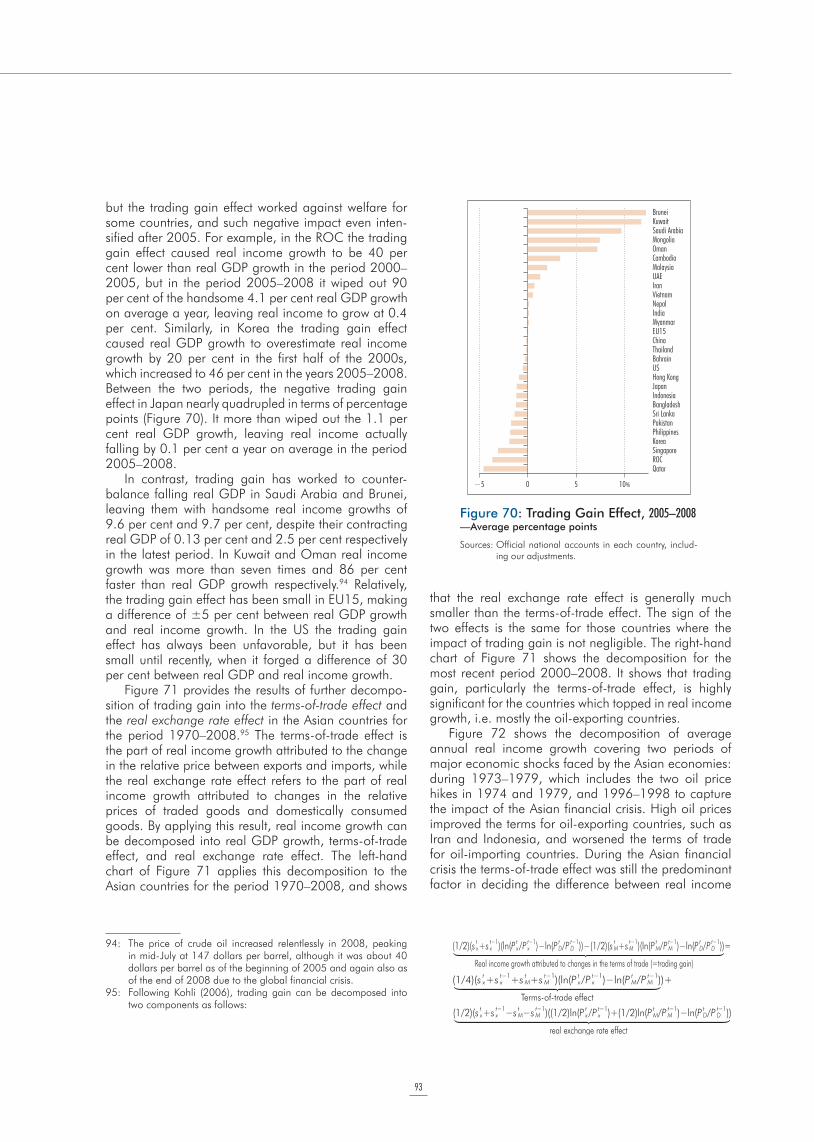
93
but the trading gain effect worked against welfare for some countries, and such negative impact even inten-sified after 2005. For example, in the ROC the trading gain effect caused real income growth to be 40 per cent lower than real GDP growth in the period 2000–2005, but in the period 2005–2008 it wiped out 90 per cent of the handsome 4.1 per cent real GDP growth on average a year, leaving real income to grow at 0.4 per cent. Similarly, in Korea the trading gain effect caused real GDP growth to overestimate real income growth by 20 per cent in the first half of the 2000s, which increased to 46 per cent in the years 2005–2008. Between the two periods, the negative trading gain effect in Japan nearly quadrupled in terms of percentage points (Figure 70). It more than wiped out the 1.1 per cent real GDP growth, leaving real income actually falling by 0.1 per cent a year on average in the period 2005–2008.
In contrast, trading gain has worked to counter-balance falling real GDP in Saudi Arabia and Brunei, leaving them with handsome real income growths of 9.6 per cent and 9.7 per cent, despite their contracting real GDP of 0.13 per cent and 2.5 per cent respectively in the latest period. In Kuwait and Oman real income growth was more than seven times and 86 per cent faster than real GDP growth respectively.94 Relatively, the trading gain effect has been small in EU15, making a difference of ±5 per cent between real GDP growth and real income growth. In the US the trading gain effect has always been unfavorable, but it has been small until recently, when it forged a difference of 30 per cent between real GDP and real income growth.
Figure 71 provides the results of further decompo-sition of trading gain into the terms-of-trade effect and the real exchange rate effect in the Asian countries for the period 1970–2008.95 The terms-of-trade effect is the part of real income growth attributed to the change in the relative price between exports and imports, while the real exchange rate effect refers to the part of real income growth attributed to changes in the relative prices of traded goods and domestically consumed goods. By applying this result, real income growth can be decomposed into real GDP growth, terms-of-trade effect, and real exchange rate effect. The left-hand chart of Figure 71 applies this decomposition to the Asian countries for the period 1970–2008, and shows
that the real exchange rate effect is generally much smaller than the terms-of-trade effect. The sign of the two effects is the same for those countries where the impact of trading gain is not negligible. The right-hand chart of Figure 71 shows the decomposition for the most recent period 2000–2008. It shows that trading gain, particularly the terms-of-trade effect, is highly significant for the countries which topped in real income growth, i.e. mostly the oil-exporting countries.
Figure 72 shows the decomposition of average annual real income growth covering two periods of major economic shocks faced by the Asian economies: during 1973–1979, which includes the two oil price hikes in 1974 and 1979, and 1996–1998 to capture the impact of the Asian financial crisis. High oil prices improved the terms for oil-exporting countries, such as Iran and Indonesia, and worsened the terms of trade for oil-importing countries. During the Asian financial crisis the terms-of-trade effect was still the predominant factor in deciding the difference between real income
−5 0 5 10%
BruneiKuwaitSaudi ArabiaMongoliaOmanCambodiaMalaysiaUAEIranVietnamNepalIndiaMyanmarEU15ChinaThailandBahrainUSHong KongJapanIndonesiaBangladeshSri LankaPakistanPhilippinesKoreaSingaporeROCQatar
Figure 70: Trading Gain Effect, 2005–2008—Average percentage points
Sources: Official national accounts in each country, includ-ing our adjustments.
94: The price of crude oil increased relentlessly in 2008, peaking in mid-July at 147 dollars per barrel, although it was about 40 dollars per barrel as of the beginning of 2005 and again also as of the end of 2008 due to the global financial crisis.
95: Following Kohli (2006), trading gain can be decomposed into two components as follows:
(1/2)(s tx+s t−1
x )(ln(P tx/P t−1
x )−ln(P tD/P t−1
D ))−(1/2)(s tM+s t−1
M )(ln(P tM/P t−1
M )−ln(P tD/P t−1
D ))=
Real income growth attributed to changes in the terms of trade (=trading gain)
(1/4)(s tx+s t−1
x +s tM+s t−1
M )(ln(P tx/P t−1
x )−ln(P tM/P t−1
M ))+(1/2)(s tx+s t−1
x −s tM−s t−1
M )((1/2)ln(P tx/P t−1
x )+(1/2)ln(P tM/P t−1
M )−ln(P tD/P t−1
D ))
Terms-of-trade effect real exchange rate effect
(1/4)(s tx+s t−1
x +s tM+s t−1
M )(ln(P tx/P t−1
x )−ln(P tM/P t−1
M ))+(1/2)(s tx+s t−1
x −s tM−s t−1
M )((1/2)ln(P tx/P t−1
x )+(1/2)ln(P tM/P t−1
M )−ln(P tD/P t−1
D ))
Terms-of-trade effect real exchange rate effect
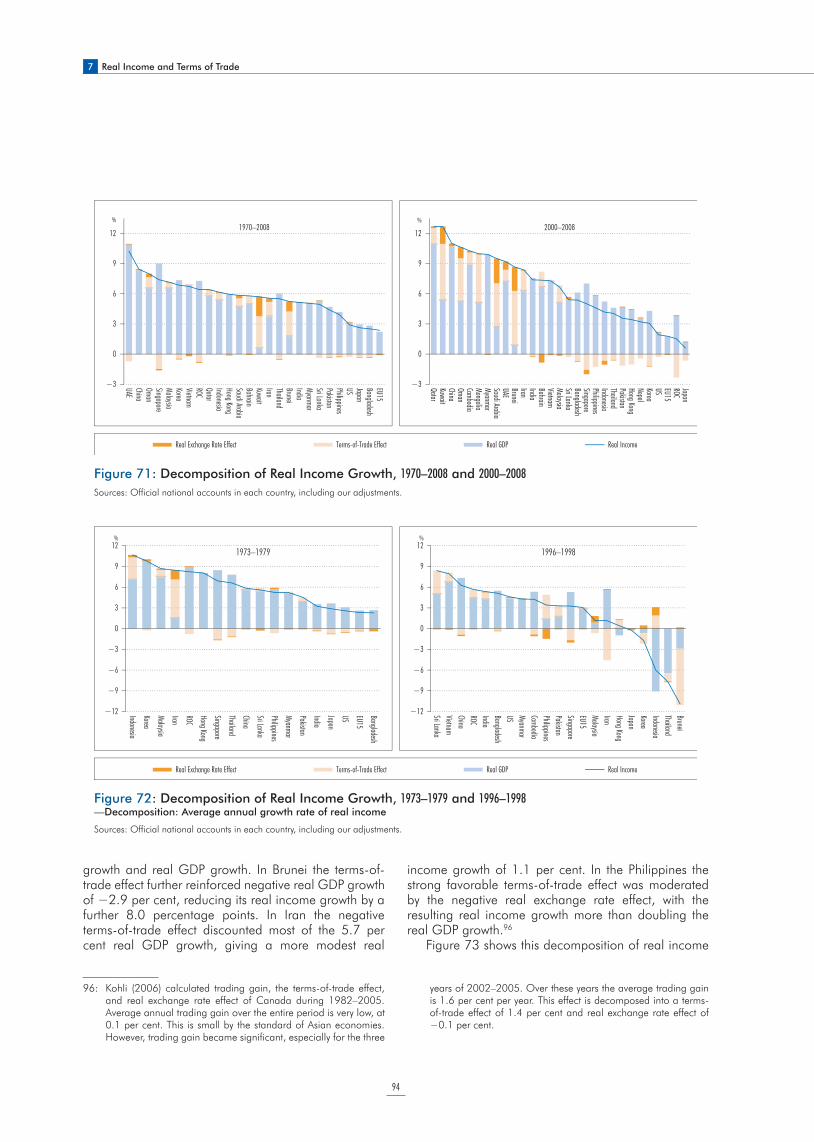
7 Real Income and Terms of Trade
94
growth and real GDP growth. In Brunei the terms-of-trade effect further reinforced negative real GDP growth of !2.9 per cent, reducing its real income growth by a further 8.0 percentage points. In Iran the negative terms-of-trade effect discounted most of the 5.7 per cent real GDP growth, giving a more modest real
income growth of 1.1 per cent. In the Philippines the strong favorable terms-of-trade effect was moderated by the negative real exchange rate effect, with the resulting real income growth more than doubling the real GDP growth.96
Figure 73 shows this decomposition of real income
96: Kohli (2006) calculated trading gain, the terms-of-trade effect, and real exchange rate effect of Canada during 1982–2005. Average annual trading gain over the entire period is very low, at 0.1 per cent. This is small by the standard of Asian economies. However, trading gain became significant, especially for the three
years of 2002–2005. Over these years the average trading gain is 1.6 per cent per year. This effect is decomposed into a terms-of-trade effect of 1.4 per cent and real exchange rate effect of !0.1 per cent.
12
9
6
3
0
−3
−6
−9
−12
%
Real Exchange Rate Effect Terms-of-Trade Effect Real GDP Real Income
Indonesia
Korea
Malaysia
Iran
ROC
Hong Kong
Singapore
Thailand
China
Sri Lanka
Philippines
Myanmar
Pakistan
India
Japan
US EU15
Bangladesh
1973–1979
Sri LankaVietnam ChinaROCIndiaBangladeshUS MyanmarCambodiaPhilippinesPakistanSingaporeEU15MalaysiaIranHong KongJapanKoreaIndonesiaThailandBrunei
1996–199812
9
6
3
0
−3
−6
−9
−12
%
Figure 72: Decomposition of Real Income Growth, 1973–1979 and 1996–1998— Decomposition: Average annual growth rate of real income
Sources: Official national accounts in each country, including our adjustments.
12
9
6
3
0
−3
%
UAEChinaOmanSingaporeMalaysiaKoreaVietnamROCQatarIndonesiaHong KongSaudi ArabiaBahrainKuwaitIranThailandBruneiIndiaMyanmarSri LankaPakistanPhilippinesUS JapanBangladeshEU15
1970–2008
QatarKuwaitChinaOmanCambodiaMongoliaMyanmarSaudi ArabiaUAEBruneiIranIndiaBahrainVietnamMalaysiaSri LankaBangladeshSingaporePhilippinesIndonesiaThailandPakistanHong KongNepalKoreaUS EU15ROCJapan
2000–2008
Real Exchange Rate Effect Terms-of-Trade Effect Real GDP Real Income
12
9
6
3
0
−3
%
Figure 71: Decomposition of Real Income Growth, 1970–2008 and 2000–2008
Sources: Official national accounts in each country, including our adjustments.
95
in each Asian country, along with the US and EU15,97 from 1970 or whichever year a country’s time series starts. Trading gain can be positive or negative, depending on the direction of change in the terms of trade. Its impact is modest for most countries, adding less than ±1 percentage point to annual real GDP growth for most of the time. However, historically trading gain has been significant in oil-rich countries, e.g. annual real income growth being 5.0 percentage points higher than annual real GDP growth on average in Kuwait. In 1974, as a consequence of the first oil price shock, the improvement in the terms of trade was
responsible for over 80 per cent of the 41.4 per cent increase in real income in Iran from 1973 to 1974. The opposite was true in EU15, where the negative trading gain effect counterbalanced real GDP growth leaving virtually no growth in real income in the period 1973–1974. The effect of the second oil spike can be seen in the late 1970s. Sri Lanka, Malaysia, and Indonesia also experienced volatile variations in trading gains in the 1970s. Trading gain has been working against Singapore’s welfare for most of the period covered.
97: There are several studies on the decomposition of real income growth for other countries: Kohli (2004) for 26 OECD countries during 1980–1996, Kohli (2006) for Canada during 1981–
2005, and Diewert and Lawrence (2006) for Australia during 1960–2004.
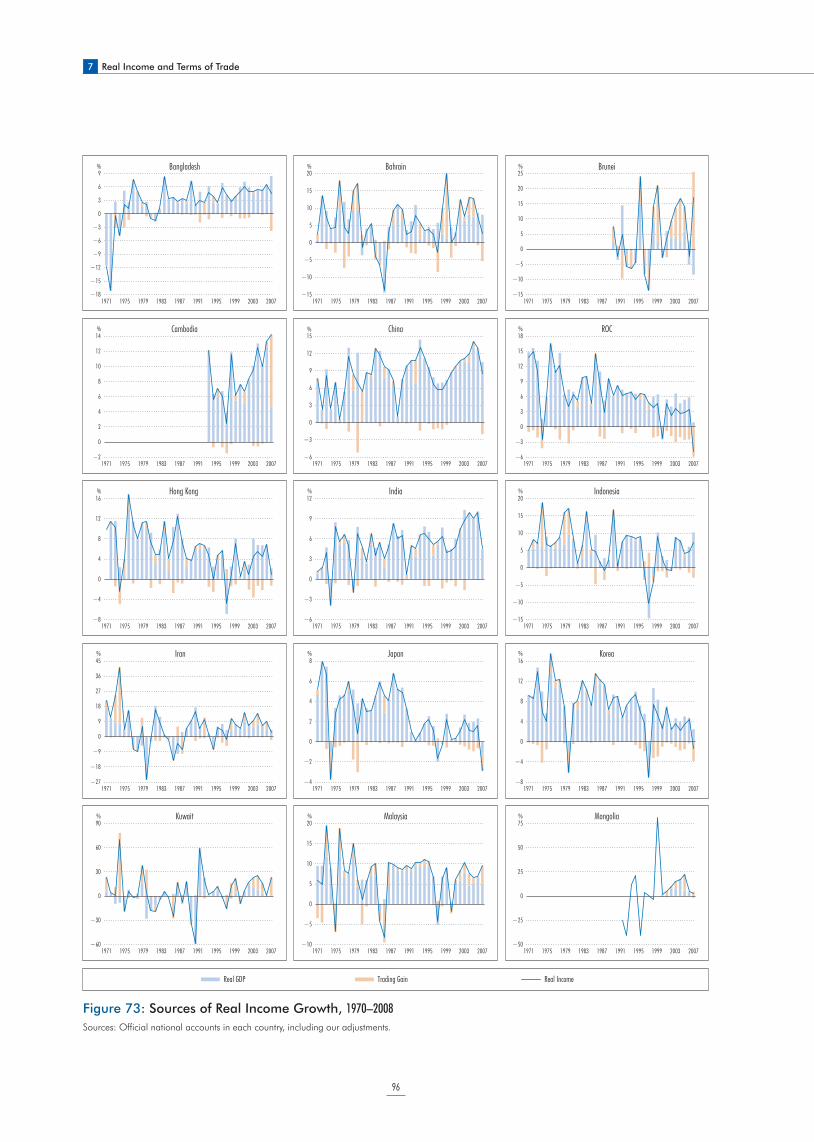
7 Real Income and Terms of Trade
96
Figure 73: Sources of Real Income Growth, 1970–2008
Sources: Official national accounts in each country, including our adjustments.
1971 1975 1979 1983 1987 1991 1995 1999 2003 2007
Bangladesh Bahrain Brunei
Cambodia China ROC
Hong Kong India Indonesia
Iran Japan Korea
Kuwait Malaysia Mongolia
1971 1975 1979 1983 1987 1991 1995 1999 2003 2007
9
6
3
0
−3
−6
−9
−12
−15
−18
%
14
12
10
8
6
4
2
0
−2
%
1971 1975 1979 1983 1987 1991 1995 1999 2003 2007
15
12
9
6
3
0
−3
−6
%
1971 1975 1979 1983 1987 1991 1995 1999 2003 2007
18
15
12
9
6
3
0
−3
−6
%
1971 1975 1979 1983 1987 1991 1995 1999 2003 2007
20
15
10
5
0
−5
−10
−15
%
1971 1975 1979 1983 1987 1991 1995 1999 2003 2007
25
20
15
10
5
0
−5
−10
−15
%
1971 1975 1979 1983 1987 1991 1995 1999 2003 2007
16
12
8
4
0
−4
−8
%
1971 1975 1979 1983 1987 1991 1995 1999 2003 2007
12
9
6
3
0
−3
−6
%
1971 1975 1979 1983 1987 1991 1995 1999 2003 2007
20
15
10
5
0
−5
−10
−15
%
1971 1975 1979 1983 1987 1991 1995 1999 2003 2007
45
36
27
18
9
0
−9
−18
−27
%
1971 1975 1979 1983 1987 1991 1995 1999 2003 2007
8
6
4
2
0
−2
−4
%
1971 1975 1979 1983 1987 1991 1995 1999 2003 2007
16
12
8
4
0
−4
−8
%
1971 1975 1979 1983 1987 1991 1995 1999 2003 2007
90
60
30
0
−30
−60
%
1971 1975 1979 1983 1987 1991 1995 1999 2003 2007
20
15
10
5
0
−5
−10
%
1971 1975 1979 1983 1987 1991 1995 1999 2003 2007
75
50
25
0
−25
−50
%
Trading Gain Real GDP Real Income
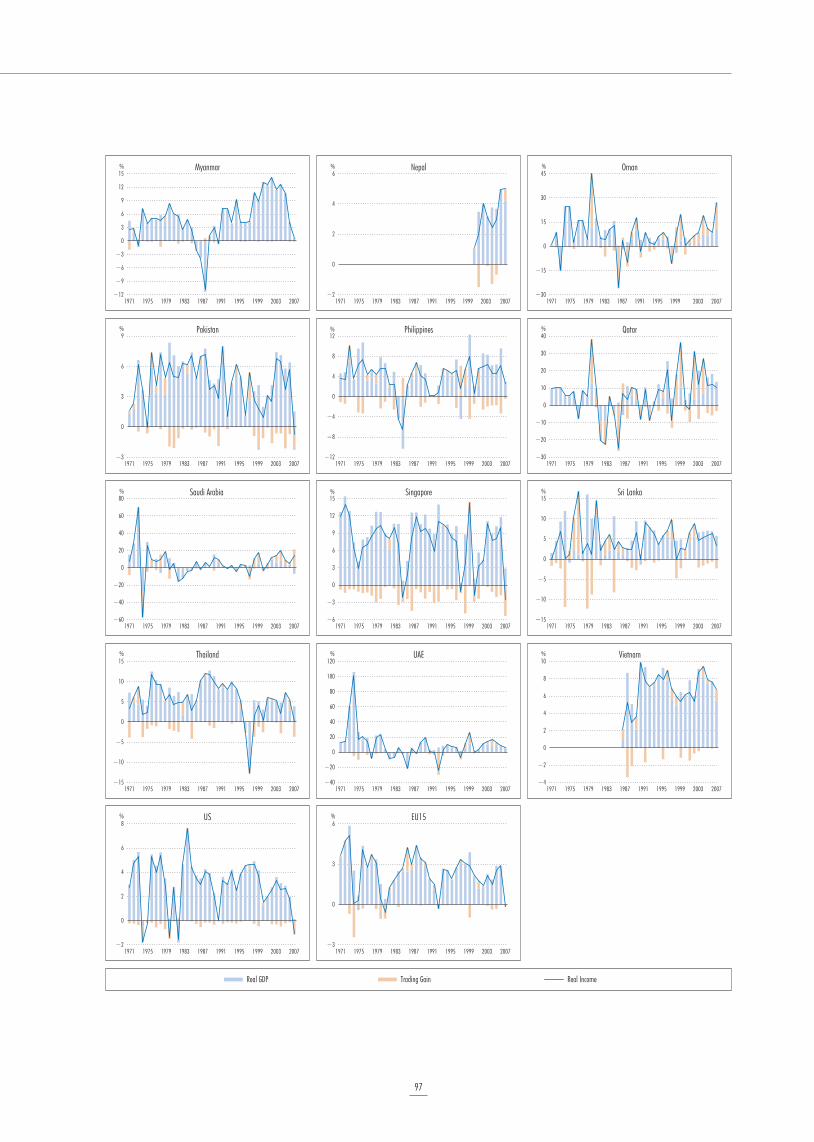
97
Trading Gain Real GDP Real Income
1971 1975 1979 1983 1987 1991 1995 1999 2003 2007
15
12
9
6
3
0
−3
−6
−9
−12
%
1971 1975 1979 1983 1987 1991 1995 1999 2003 2007
6
4
2
0
−2
%
1971 1975 1979 1983 1987 1991 1995 1999 2003 2007
45
30
15
0
−15
−30
%
1971 1975 1979 1983 1987 1991 1995 1999 2003 2007
9
6
3
0
−3
%
1971 1975 1979 1983 1987 1991 1995 1999 2003 2007
12
8
4
0
−4
−8
−12
%
1971 1975 1979 1983 1987 1991 1995 1999 2003 2007
40
30
20
10
0
−10
−20
−30
%
1971 1975 1979 1983 1987 1991 1995 1999 2003 2007
80
60
40
20
0
−20
−40
−60
%
1971 1975 1979 1983 1987 1991 1995 1999 2003 2007
15
12
9
6
3
0
−3
−6
%
1971 1975 1979 1983 1987 1991 1995 1999 2003 2007
15
10
5
0
−5
−10
−15
%
1971 1975 1979 1983 1987 1991 1995 1999 2003 2007
15
10
5
0
−5
−10
−15
%
1971 1975 1979 1983 1987 1991 1995 1999 2003 2007
120
100
80
60
40
20
0
−20
−40
%
1971 1975 1979 1983 1987 1991 1995 1999 2003 2007
10
8
6
4
2
0
−2
−4
%
1971 1975 1979 1983 1987 1991 1995 1999 2003 2007
8
6
4
2
0
−2
%
1971 1975 1979 1983 1987 1991 1995 1999 2003 2007
6
3
0
−3
%
Myanmar Nepal Oman
Pakistan Philippines Qatar
Saudi Arabia Singapore Sri Lanka
Thailand UAE Vietnam
US EU15
99
References
ADB (2007) Purchasing Power Parities and Real Expenditure, December, Manila: ADB.
ADB (2009) Asian Development Outlook 2009, March, Ma-nila: ADB.
Ahn, Kil-hyo (2008) “Practical Issues on the Calculation and Allocation of FISIM in Korea”, IFC Bulletin 28, pp. 101–106.
APO (2010) APO Productivity Databook 2010, March, To-kyo: APO.
Askari, Hossein, Vahid Nowshirvani and Mohamed Jaber (1997), Economic Development in the GCC: The Blessing and the Curse of Oil, Contemporary Studies in Economic and Financial Analysis, vol. 81, JAI Press Inc.
Baier, Scott L., Gerald P. Dwyer and Robert Tamura (2006) “How Important Are Capital and Total Factor Pro-ductivity for Economic Growth?”, Economic Inquiry 44(1), pp. 23–49.
Bloom, David E., David Canning and Pia N. Malaney (2000) “Population Dynamics and Economic Growth in Asia”, Population and Development Review 26, pp. 257–290.
Bosworth, Barry P. (2005) “Economic Growth in Thailand: The Macroeconomic Context”, paper presented to World Bank project on investment climate, firm competitiveness and growth in Thailand.
Bosworth, Barry P. and Susan M. Collins (2008) “Account-ing for Growth: Comparing China and India”, Journal of Economic Perspective 22(1), pp. 45–66.
Caner, Mehmet, Thomas Grennes and Fritzi Koehler-Geib (2010) “Finding the Tipping Point When Sovereign Debt Turns Bad”, paper submitted to Conference Volume: World Bank Conference on Debt Management.
Caselli, Francesco (2005) “Accounting for Cross-Country Income Differences”, in P. Aghion and S. N. Durlauf (eds) Handbook of Economic Growth, Amsterdam: North Hol-land, pp. 679–741.
Cho, Young-gil (2000) “A Note on the Calculation of FISIM in Korea”, paper presented at OECD National Accounts Experts Meeting, Paris, 26–29 September.
Cororaton, Caesar B. (2002) “Total Factor Productivity in the Philippines”, Discussion Paper Series 2002–01, Philippine Institute for Development Studies, Makati.
Crafts, Nicholas (1999) “East Asian Growth Before and Af-ter the Crisis”, IMF Staff Papers 46(2), pp. 136–166.
Diewert, W. Erwin and Denis Lawrence (2006) “Measur-ing the Contributions of Productivity and Terms of Trade to Australia’s Economic Welfare”, report by Meyrick and Associates to Australian Government Productivity Com-mission, Canberra.
Diewert, W. Erwin and Catherine J. Morrison (1986) “Ad-justing Outputs and Productivity Indexes for Changes in the Terms of Trade”, Economic Journal 96(3), pp. 659–679.
Diewert, W. Erwin and Alice O. Nakamura (2007) “The Measurement of Productivity for Nations”, in J. Heckman and E. Leamer (eds) Handbook of Econometrics, Vol. 6A, Amsterdam: North Holland, pp. 4501–4586.
Diewert, W. Erwin, Hideyuki Mizobuchi and Koji Nomura (2005) “On Measuring Japan’s Productivity, 1995–2003”, Department of Economics Discussion Pa-per Series No. 05–22, December, Vancouver: University of British Columbia.
Economist Intelligence Unit (2010) “Country Report: Myanmar, January 2010”, available at http://www.eiu.com/.
Gollin, Douglas, Stephen L. Parente and Richard Rogerson (2004) “Farm Work, Home Work and Inter-national Productivity Differences”, Review of Economic Dynamics 7, pp. 827–850.
Holz, Carsten A. (2006) “Measuring Chinese Productivity Growth, 1952–2005”, mimeo, Social Science Division, Hong Kong University of Science and Technology.
Jorgenson, Dale W. (2009) The Economics of Productivity, Cheltenham: Edward Elgar Publishing.
Jorgenson, Dale W. and Zvi Griliches (1967) “The Expla-nation of Productivity Change”, Review of Economic Stud-ies 34(3), pp. 249–283.
Jorgenson, Dale W. and Koji Nomura (2005) “The In- dustry Origins of Japanese Economic Growth”, Journal of Japanese and International Economies 19 (December), pp. 482–542.
Jorgenson, Dale W. and Koji Nomura (2007) “The Indus-try Origins of the U.S.-Japan Productivity Gap”, Economic Systems Research 19 (September), pp. 315–341.
Jorgenson, Dale W., Mun S. Ho and Kevin J. Stiroh (2005) Information Technology and the American Growth Resurgence, Cambridge, MA: MIT Press.
Kohli, Ulrich (2004) “Real GDP, Real Domestic Income and Terms of Trade Changes”, Journal of International Eco-nomics 62(1), pp. 83–106.
Kohli, Ulrich (2006) “Real GDP, Real GDI, and Trading Gains: Canada, 1981–2005”, International Productivity Monitor 13, pp. 46–56.
Kuroda, Masahiro, Kazushige Shimpo, Koji Nomura and Nobuyuki Kobayashi (1997), KEO Database – The Measurement of Output, Capital, and Labor, KEO Mono-graph Series No. 8, Tokyo: Keio University (in Japanese).
Lau, Eunice and Prabhat Vaze (2002) “Accounting Growth: Capital, Skills and Output”, paper presented at Depart-ment of Trade and Industry National Statistics Productivity Workshop, November, London.
Leigh, Daniel, Pete Devries, Charles Freedman, Jaime Guajardo, Douglas Laxton, and Andrea Pescatori (2010) “Will It Hurt? Macroeconomic Effects of Fiscal Consolidation in World Economic Outlook”, IMF World Economic Outlook, Chapter 3.
Maddison, Angus (1995) Monitoring the World Economy 1820 –1992, Paris: OECD.
Maddison, Angus (1998) Chinese Economic Performance in the Long Run, Paris: OECD Development Centre.
Neumayer, Eric (2004) “Does the “Resource Curse” Hold for Growth in Genuine Income as Well?”, World Develop-ment 32(10), pp. 1627–1640.
Nomura, Koji (2004) Measurement of Capital and Productiv-ity in Japan, Tokyo: Keio University Press (in Japanese).
OECD (2001) Measuring Productivity - OECD Manual, Paris: OECD.
OECD (2008) OECD Compendium of Productivity Indicators, Paris: OECD.
OECD (2009) Measuring Capital - OECD Manual, 2nd edn, Paris: OECD.
Schreyer, Paul (2002) “Computer Price Indices and Interna-tional Growth and Productivity Comparisons”, Review of Income and Wealth 48(1), pp. 15–33.
Schreyer, Paul, Pierre-Emmanuel Bignon and Julien Dupont (2003) “OECD Capital Services Estimates: Methodology and a First Set of Results”, OECD Statistics Working Paper 2003/6, Paris: OECD.
100
Stiglitz, Joseph (2006), Making Globalization Work: The Next Steps to Global Justice, Penguin Allen Lane.
Stiglitz, Joseph E., Amartya Sen and Jean-Paul Fitoussi (2009) Report by the Commission on the Measurement of Economic Performance and Social Progress.
Solow, Robert (1957), “Technical Change and the Aggregate Production Function”, Review of Economics and Statistics 39(3), pp. 312–320.
Timmer, Marcel P. and Bart van Ark (2000) “Capital For-mation and Productivity Growth in South Korea and Taiwan: Realising the Catch-up Potential in a World of Di-minishing Returns”, Groningen Growth and Development Centre, University of Groningen.
The Economist (2010a) “Cutting Edge”, The Economist, 2 October.
The Economist (2010b) “How to Grow”, The Economist, 9 October.
The Economist (2010c) “Repent at Leisure”, The Economist, 26 June.
The Economist (2010d) “The Global Monetary System”, The Economist, 6 November.
The Economist (2010e) “China’s Labour Market”, The Econ-omist, 31 July.
The Economist (2010f) “Nominally Cheap or Really Dear?”, The Economist, 6 November.
Turner, Adair (2009) “Population Priorities: The Challenge of Continued Rapid Population Growth”, Philosophical Transactions of the Royal Society 364, pp. 2977–2984.
United Nations (1993) System of National Accounts 1993, New York: United Nations.
United Nations (2009) System of National Accounts 2008, New York: United Nations.
United Nations (2009) “World Population Prospects: The 2008 Revision”.
Van der Eng, Pierre (2008) “Capital Formation and Capi-tal Stock in Indonesia, 1950–2007”, Working Papers in Trade and Development 2008/24, Australian National University, Canberra.
Van der Eng, Pierre (2009) “Total Factor Productivity and Economic Growth in Indonesia”, Working Papers in Trade and Development 2009/01, Australian National University, Canberra.
Warr, Peter (2006) “Productivity Growth in Thailand and Indonesia: How Agriculture Contributes to Economic Growth”, Working Paper in Economics and Development Studies 2006/06, Padjadjaran University, Bandung.
World Bank (2008) Global Purchasing Power Parities and Real Expenditures: 2005 International Comparison Pro-gram, Washington, DC: World Bank.
World Bank (2011) The Changing Wealth of Nations: Mea-suring Sustainable Development in the New Millennium, Washington, DC: World Bank.
Young, Alwyn (1995) “The Tyranny of Numbers: Confront-ing the Statistical Realities of the East Asian Growth Ex-perience”, Quarterly Journal of Economics 110(3), pp. 641–680.
Young, Alwyn (2003) “Gold into Base Metals: Productiv-ity Growth in the People’s Republic of China during the Reform Period”, Journal of Political Economy 111(6), pp. 1220–1261.
GDP at Constant PricesGrowth Rate of GDP at Constant PricesGrowth Rate of Per Capita GDP at Constant PricesGrowth Rate of Household Consumption at Constant PricesGrowth Rate of Government Consumption at Constant PricesGrowth Rate of Investment at Constant PricesGrowth Rate of Export at Constant PricesGrowth Rate of Import at Constant PricesGDP at Current PricesHousehold Consumption at Current PricesGovernment Consumption at Current PricesInvestment at Current PricesExport at Current PricesImport at Current PricesCPI (Consumer Price Index)PopulationTotal EmploymentLabor Productivity
Appendix
Data 1:
Data 2:
Data 3:
Data 4:
Data 5:
Data 6:
Data 7:
Data 8:
Data 9:
Data 10:
Data 11:
Data 12:
Data 13:
Data 14:
Data 15:
Data 16:
Data 17:
Data 18:
102
104
106
108
110
112
114
116
118
120
122
124
126
128
130
132
134
136
A.1 Data List 101
A.2 Data Sources 138
A.3 Industry Classification 139
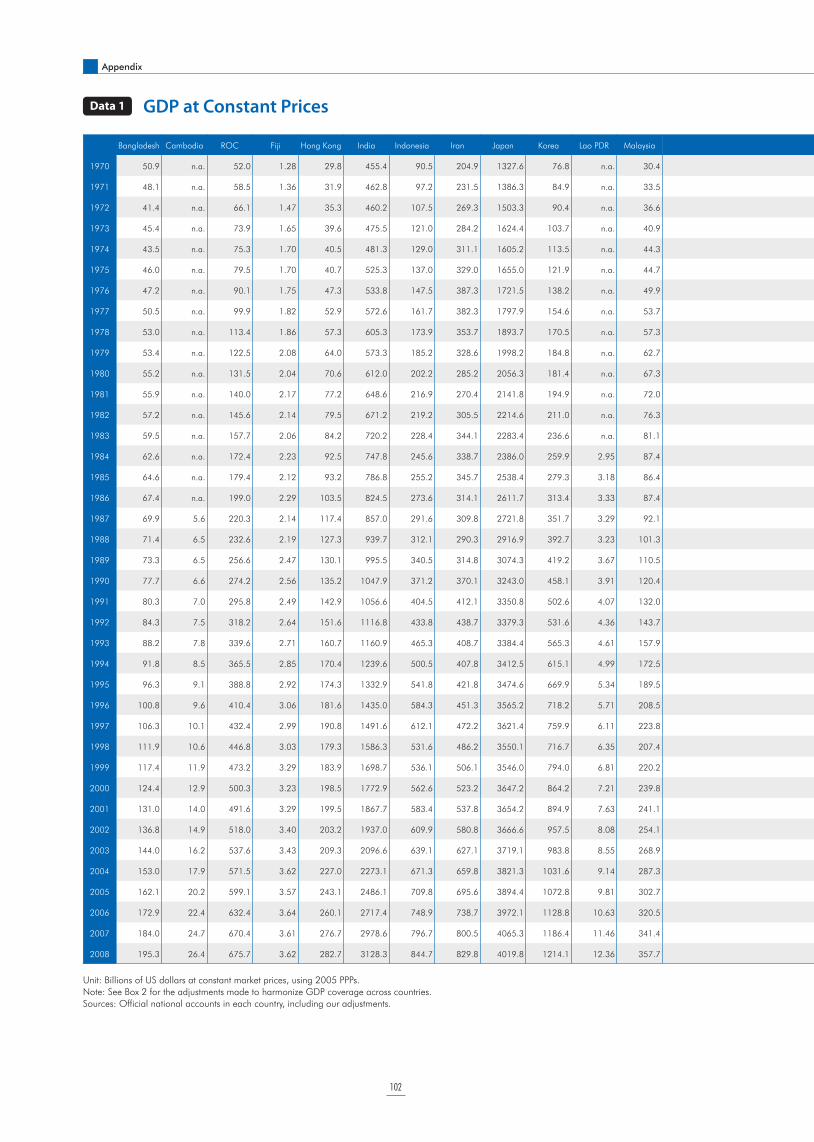
Appendix
102
Unit: Billions of US dollars at constant market prices, using 2005 PPPs.
Note: See Box 2 for the adjustments made to harmonize GDP coverage across countries.
Sources: Official national accounts in each country, including our adjustments.
Data 1 GDP at Constant Prices
Bangladesh Cambodia ROC Fiji Hong Kong India Indonesia Iran Japan Korea Lao PDR Malaysia Mongolia Nepal Pakistan Philippines Singapore Sri Lanka Thailand Vietnam Brunei China Myanmar US EU15
1970 50.9 n.a. 52.0 1.28 29.8 455.4 90.5 204.9 1327.6 76.8 n.a. 30.4 1.46 n.a. 62.5 69.5 15.3 13.9 55.3 n.a. 6.8 284.6 8.4 4224.3 4939.2 1970
1971 48.1 n.a. 58.5 1.36 31.9 462.8 97.2 231.5 1386.3 84.9 n.a. 33.5 1.54 n.a. 63.4 72.9 17.1 13.9 58.0 n.a. 7.5 304.5 8.8 4366.2 5106.7 1971
1972 41.4 n.a. 66.1 1.47 35.3 460.2 107.5 269.3 1503.3 90.4 n.a. 36.6 1.61 n.a. 64.4 76.4 19.4 14.4 60.4 n.a. 8.3 316.1 9.0 4597.4 5344.0 1972
1973 45.4 n.a. 73.9 1.65 39.6 475.5 121.0 284.2 1624.4 103.7 n.a. 40.9 1.78 n.a. 68.6 83.0 21.5 15.7 66.4 n.a. 9.1 341.0 8.9 4862.6 5682.0 1973
1974 43.5 n.a. 75.3 1.70 40.5 481.3 129.0 311.1 1605.2 113.5 n.a. 44.3 1.89 8.1 72.2 87.4 22.9 16.8 69.4 n.a. 10.2 348.9 9.3 4830.7 5817.8 1974
1975 46.0 n.a. 79.5 1.70 40.7 525.3 137.0 329.0 1655.0 121.9 n.a. 44.7 2.02 8.4 74.6 93.1 23.8 17.1 72.8 n.a. 10.2 379.2 9.6 4809.6 5784.2 1975
1976 47.2 n.a. 90.1 1.75 47.3 533.8 147.5 387.3 1721.5 138.2 n.a. 49.9 2.12 8.7 78.0 100.6 25.6 18.0 79.5 34.7 12.3 373.2 10.2 5074.1 6051.8 1976
1977 50.5 n.a. 99.9 1.82 52.9 572.6 161.7 382.3 1797.9 154.6 n.a. 53.7 2.17 9.1 81.0 106.8 27.5 18.9 87.4 36.0 13.7 401.5 10.7 5307.7 6221.9 1977
1978 53.0 n.a. 113.4 1.86 57.3 605.3 173.9 353.7 1893.7 170.5 n.a. 57.3 2.35 9.3 87.5 112.7 29.8 20.2 96.0 36.3 14.6 448.5 11.4 5598.1 6415.3 1978
1979 53.4 n.a. 122.5 2.08 64.0 573.3 185.2 328.6 1998.2 184.8 n.a. 62.7 2.56 9.1 91.7 119.7 32.6 21.5 101.1 36.5 17.9 482.6 11.9 5777.0 6651.4 1979
1980 55.2 n.a. 131.5 2.04 70.6 612.0 202.2 285.2 2056.3 181.4 n.a. 67.3 2.64 9.8 99.6 126.0 35.8 22.7 105.7 35.5 16.6 520.2 12.9 5767.4 6753.4 1980
1981 55.9 n.a. 140.0 2.17 77.2 648.6 216.9 270.4 2141.8 194.9 n.a. 72.0 2.87 10.2 106.5 130.3 39.6 24.0 112.0 36.7 13.3 547.3 13.7 5921.9 6768.0 1981
1982 57.2 n.a. 145.6 2.14 79.5 671.2 219.2 305.5 2214.6 211.0 n.a. 76.3 3.10 10.2 113.5 135.0 42.4 25.2 118.0 39.5 13.9 597.1 14.4 5803.5 6834.6 1982
1983 59.5 n.a. 157.7 2.06 84.2 720.2 228.4 344.1 2283.4 236.6 n.a. 81.1 3.28 10.9 121.2 137.6 46.1 26.4 124.6 42.3 14.0 662.1 15.0 6037.8 6954.4 1983
1984 62.6 n.a. 172.4 2.23 92.5 747.8 245.6 338.7 2386.0 259.9 2.95 87.4 3.48 11.5 127.4 127.5 50.1 27.7 131.8 45.6 14.0 762.8 15.8 6481.7 7130.3 1984
1985 64.6 n.a. 179.4 2.12 93.2 786.8 255.2 345.7 2538.4 279.3 3.18 86.4 3.68 12.0 137.1 118.2 49.6 29.1 137.9 49.4 13.8 865.8 16.2 6740.1 7313.5 1985
1986 67.4 n.a. 199.0 2.29 103.5 824.5 273.6 314.1 2611.7 313.4 3.33 87.4 4.02 12.3 144.6 122.2 50.2 30.4 145.5 49.6 12.3 942.0 16.1 6968.4 7523.0 1986
1987 69.9 5.6 220.3 2.14 117.4 857.0 291.6 309.8 2721.8 351.7 3.29 92.1 4.17 13.2 154.0 127.5 55.4 30.9 159.4 51.4 12.3 1051.2 15.4 7189.0 7739.2 1987
1988 71.4 6.5 232.6 2.19 127.3 939.7 312.1 290.3 2916.9 392.7 3.23 101.3 4.38 13.8 165.7 136.1 61.7 31.7 180.6 54.5 12.3 1170.0 13.7 7494.3 8073.1 1988
1989 73.3 6.5 256.6 2.47 130.1 995.5 340.5 314.8 3074.3 419.2 3.67 110.5 4.56 14.4 173.9 144.6 67.9 32.4 202.7 57.0 12.6 1218.0 14.2 7774.5 8374.5 1989
1990 77.7 6.6 274.2 2.56 135.2 1047.9 371.2 370.1 3243.0 458.1 3.91 120.4 4.45 15.3 181.7 148.4 74.3 34.4 225.3 59.9 12.7 1264.3 14.6 7920.0 8628.4 1990
1991 80.3 7.0 295.8 2.49 142.9 1056.6 404.5 412.1 3350.8 502.6 4.07 132.0 4.20 16.0 190.9 147.2 79.4 36.0 244.7 63.4 13.1 1380.6 14.5 7889.5 8800.2 1991
1992 84.3 7.5 318.2 2.64 151.6 1116.8 433.8 438.7 3379.3 531.6 4.36 143.7 3.97 16.6 205.6 146.9 85.1 37.6 264.5 68.9 13.7 1576.6 15.9 8146.9 8906.3 1992
1993 88.2 7.8 339.6 2.71 160.7 1160.9 465.3 408.7 3384.4 565.3 4.61 157.9 3.80 17.9 209.3 151.8 95.1 40.2 286.4 74.5 13.8 1797.4 16.9 8384.4 8881.1 1993
1994 91.8 8.5 365.5 2.85 170.4 1239.6 500.5 407.8 3412.5 615.1 4.99 172.5 3.91 18.6 217.1 158.4 105.4 42.5 312.2 81.1 14.2 2032.8 18.1 8730.5 9135.2 1994
1995 96.3 9.1 388.8 2.92 174.3 1332.9 541.8 421.8 3474.6 669.9 5.34 189.5 4.08 19.5 228.0 165.9 113.3 44.8 341.1 88.8 14.8 2254.4 19.4 8957.1 9378.2 1995
1996 100.8 9.6 410.4 3.06 181.6 1435.0 584.3 451.3 3565.2 718.2 5.71 208.5 4.19 20.6 239.1 175.6 122.3 46.5 361.4 97.1 15.3 2479.8 20.6 9288.9 9550.1 1996
1997 106.3 10.1 432.4 2.99 190.8 1491.6 612.1 472.2 3621.4 759.9 6.11 223.8 4.37 21.2 241.5 184.7 132.3 49.5 356.5 105.1 15.0 2710.4 21.8 9698.5 9815.6 1997
1998 111.9 10.6 446.8 3.03 179.3 1586.3 531.6 486.2 3550.1 716.7 6.35 207.4 4.58 22.1 247.8 183.7 129.8 51.9 319.0 111.2 15.0 2921.9 22.9 10117.3 10112.9 1998
1999 117.4 11.9 473.2 3.29 183.9 1698.7 536.1 506.1 3546.0 794.0 6.81 220.2 4.81 23.5 256.9 189.9 138.3 54.1 333.3 116.5 15.5 3143.9 24.1 10603.3 10429.1 1999
2000 124.4 12.9 500.3 3.23 198.5 1772.9 562.6 523.2 3647.2 864.2 7.21 239.8 4.87 24.8 267.9 201.3 151.7 57.4 349.1 124.4 16.0 3408.0 26.9 11043.2 10842.9 2000
2001 131.0 14.0 491.6 3.29 199.5 1867.7 583.4 537.8 3654.2 894.9 7.63 241.1 5.02 24.8 273.3 204.9 149.3 56.6 356.7 133.0 16.5 3690.9 30.0 11166.7 11051.4 2001
2002 136.8 14.9 518.0 3.40 203.2 1937.0 609.9 580.8 3666.6 957.5 8.08 254.1 5.25 25.8 282.1 214.0 155.5 58.9 375.8 142.4 17.1 4026.7 33.6 11369.1 11175.8 2002
2003 144.0 16.2 537.6 3.43 209.3 2096.6 639.1 627.1 3719.1 983.8 8.55 268.9 5.62 27.0 295.9 224.6 162.4 62.4 402.8 152.9 17.6 4429.4 38.3 11665.5 11305.1 2003
2004 153.0 17.9 571.5 3.62 227.0 2273.1 671.3 659.8 3821.3 1031.6 9.14 287.3 6.22 28.0 317.6 239.0 177.5 65.8 428.5 164.9 17.8 4876.8 43.5 12076.0 11561.3 2004
2005 162.1 20.2 599.1 3.57 243.1 2486.1 709.8 695.6 3894.4 1072.8 9.81 302.7 6.67 28.9 341.9 250.8 189.6 69.9 448.2 178.9 17.9 5427.9 49.4 12450.4 11766.2 2005
2006 172.9 22.4 632.4 3.64 260.1 2717.4 748.9 738.7 3972.1 1128.8 10.63 320.5 7.24 29.9 363.1 264.4 206.1 75.3 471.6 193.7 18.7 6117.2 55.7 12792.3 12104.7 2006
2007 184.0 24.7 670.4 3.61 276.7 2978.6 796.7 800.5 4065.3 1186.4 11.46 341.4 7.99 31.7 383.9 283.2 223.1 80.4 495.2 210.1 18.7 6985.9 58.8 13027.9 12433.4 2007
2008 195.3 26.4 675.7 3.62 282.7 3128.3 844.7 829.8 4019.8 1214.1 12.36 357.7 8.70 33.3 390.4 294.1 227.7 85.2 507.4 223.2 18.4 7656.5 60.0 13007.7 12466.3 2008

103
Bangladesh Cambodia ROC Fiji Hong Kong India Indonesia Iran Japan Korea Lao PDR Malaysia Mongolia Nepal Pakistan Philippines Singapore Sri Lanka Thailand Vietnam Brunei China Myanmar US EU15
1970 50.9 n.a. 52.0 1.28 29.8 455.4 90.5 204.9 1327.6 76.8 n.a. 30.4 1.46 n.a. 62.5 69.5 15.3 13.9 55.3 n.a. 6.8 284.6 8.4 4224.3 4939.2 1970
1971 48.1 n.a. 58.5 1.36 31.9 462.8 97.2 231.5 1386.3 84.9 n.a. 33.5 1.54 n.a. 63.4 72.9 17.1 13.9 58.0 n.a. 7.5 304.5 8.8 4366.2 5106.7 1971
1972 41.4 n.a. 66.1 1.47 35.3 460.2 107.5 269.3 1503.3 90.4 n.a. 36.6 1.61 n.a. 64.4 76.4 19.4 14.4 60.4 n.a. 8.3 316.1 9.0 4597.4 5344.0 1972
1973 45.4 n.a. 73.9 1.65 39.6 475.5 121.0 284.2 1624.4 103.7 n.a. 40.9 1.78 n.a. 68.6 83.0 21.5 15.7 66.4 n.a. 9.1 341.0 8.9 4862.6 5682.0 1973
1974 43.5 n.a. 75.3 1.70 40.5 481.3 129.0 311.1 1605.2 113.5 n.a. 44.3 1.89 8.1 72.2 87.4 22.9 16.8 69.4 n.a. 10.2 348.9 9.3 4830.7 5817.8 1974
1975 46.0 n.a. 79.5 1.70 40.7 525.3 137.0 329.0 1655.0 121.9 n.a. 44.7 2.02 8.4 74.6 93.1 23.8 17.1 72.8 n.a. 10.2 379.2 9.6 4809.6 5784.2 1975
1976 47.2 n.a. 90.1 1.75 47.3 533.8 147.5 387.3 1721.5 138.2 n.a. 49.9 2.12 8.7 78.0 100.6 25.6 18.0 79.5 34.7 12.3 373.2 10.2 5074.1 6051.8 1976
1977 50.5 n.a. 99.9 1.82 52.9 572.6 161.7 382.3 1797.9 154.6 n.a. 53.7 2.17 9.1 81.0 106.8 27.5 18.9 87.4 36.0 13.7 401.5 10.7 5307.7 6221.9 1977
1978 53.0 n.a. 113.4 1.86 57.3 605.3 173.9 353.7 1893.7 170.5 n.a. 57.3 2.35 9.3 87.5 112.7 29.8 20.2 96.0 36.3 14.6 448.5 11.4 5598.1 6415.3 1978
1979 53.4 n.a. 122.5 2.08 64.0 573.3 185.2 328.6 1998.2 184.8 n.a. 62.7 2.56 9.1 91.7 119.7 32.6 21.5 101.1 36.5 17.9 482.6 11.9 5777.0 6651.4 1979
1980 55.2 n.a. 131.5 2.04 70.6 612.0 202.2 285.2 2056.3 181.4 n.a. 67.3 2.64 9.8 99.6 126.0 35.8 22.7 105.7 35.5 16.6 520.2 12.9 5767.4 6753.4 1980
1981 55.9 n.a. 140.0 2.17 77.2 648.6 216.9 270.4 2141.8 194.9 n.a. 72.0 2.87 10.2 106.5 130.3 39.6 24.0 112.0 36.7 13.3 547.3 13.7 5921.9 6768.0 1981
1982 57.2 n.a. 145.6 2.14 79.5 671.2 219.2 305.5 2214.6 211.0 n.a. 76.3 3.10 10.2 113.5 135.0 42.4 25.2 118.0 39.5 13.9 597.1 14.4 5803.5 6834.6 1982
1983 59.5 n.a. 157.7 2.06 84.2 720.2 228.4 344.1 2283.4 236.6 n.a. 81.1 3.28 10.9 121.2 137.6 46.1 26.4 124.6 42.3 14.0 662.1 15.0 6037.8 6954.4 1983
1984 62.6 n.a. 172.4 2.23 92.5 747.8 245.6 338.7 2386.0 259.9 2.95 87.4 3.48 11.5 127.4 127.5 50.1 27.7 131.8 45.6 14.0 762.8 15.8 6481.7 7130.3 1984
1985 64.6 n.a. 179.4 2.12 93.2 786.8 255.2 345.7 2538.4 279.3 3.18 86.4 3.68 12.0 137.1 118.2 49.6 29.1 137.9 49.4 13.8 865.8 16.2 6740.1 7313.5 1985
1986 67.4 n.a. 199.0 2.29 103.5 824.5 273.6 314.1 2611.7 313.4 3.33 87.4 4.02 12.3 144.6 122.2 50.2 30.4 145.5 49.6 12.3 942.0 16.1 6968.4 7523.0 1986
1987 69.9 5.6 220.3 2.14 117.4 857.0 291.6 309.8 2721.8 351.7 3.29 92.1 4.17 13.2 154.0 127.5 55.4 30.9 159.4 51.4 12.3 1051.2 15.4 7189.0 7739.2 1987
1988 71.4 6.5 232.6 2.19 127.3 939.7 312.1 290.3 2916.9 392.7 3.23 101.3 4.38 13.8 165.7 136.1 61.7 31.7 180.6 54.5 12.3 1170.0 13.7 7494.3 8073.1 1988
1989 73.3 6.5 256.6 2.47 130.1 995.5 340.5 314.8 3074.3 419.2 3.67 110.5 4.56 14.4 173.9 144.6 67.9 32.4 202.7 57.0 12.6 1218.0 14.2 7774.5 8374.5 1989
1990 77.7 6.6 274.2 2.56 135.2 1047.9 371.2 370.1 3243.0 458.1 3.91 120.4 4.45 15.3 181.7 148.4 74.3 34.4 225.3 59.9 12.7 1264.3 14.6 7920.0 8628.4 1990
1991 80.3 7.0 295.8 2.49 142.9 1056.6 404.5 412.1 3350.8 502.6 4.07 132.0 4.20 16.0 190.9 147.2 79.4 36.0 244.7 63.4 13.1 1380.6 14.5 7889.5 8800.2 1991
1992 84.3 7.5 318.2 2.64 151.6 1116.8 433.8 438.7 3379.3 531.6 4.36 143.7 3.97 16.6 205.6 146.9 85.1 37.6 264.5 68.9 13.7 1576.6 15.9 8146.9 8906.3 1992
1993 88.2 7.8 339.6 2.71 160.7 1160.9 465.3 408.7 3384.4 565.3 4.61 157.9 3.80 17.9 209.3 151.8 95.1 40.2 286.4 74.5 13.8 1797.4 16.9 8384.4 8881.1 1993
1994 91.8 8.5 365.5 2.85 170.4 1239.6 500.5 407.8 3412.5 615.1 4.99 172.5 3.91 18.6 217.1 158.4 105.4 42.5 312.2 81.1 14.2 2032.8 18.1 8730.5 9135.2 1994
1995 96.3 9.1 388.8 2.92 174.3 1332.9 541.8 421.8 3474.6 669.9 5.34 189.5 4.08 19.5 228.0 165.9 113.3 44.8 341.1 88.8 14.8 2254.4 19.4 8957.1 9378.2 1995
1996 100.8 9.6 410.4 3.06 181.6 1435.0 584.3 451.3 3565.2 718.2 5.71 208.5 4.19 20.6 239.1 175.6 122.3 46.5 361.4 97.1 15.3 2479.8 20.6 9288.9 9550.1 1996
1997 106.3 10.1 432.4 2.99 190.8 1491.6 612.1 472.2 3621.4 759.9 6.11 223.8 4.37 21.2 241.5 184.7 132.3 49.5 356.5 105.1 15.0 2710.4 21.8 9698.5 9815.6 1997
1998 111.9 10.6 446.8 3.03 179.3 1586.3 531.6 486.2 3550.1 716.7 6.35 207.4 4.58 22.1 247.8 183.7 129.8 51.9 319.0 111.2 15.0 2921.9 22.9 10117.3 10112.9 1998
1999 117.4 11.9 473.2 3.29 183.9 1698.7 536.1 506.1 3546.0 794.0 6.81 220.2 4.81 23.5 256.9 189.9 138.3 54.1 333.3 116.5 15.5 3143.9 24.1 10603.3 10429.1 1999
2000 124.4 12.9 500.3 3.23 198.5 1772.9 562.6 523.2 3647.2 864.2 7.21 239.8 4.87 24.8 267.9 201.3 151.7 57.4 349.1 124.4 16.0 3408.0 26.9 11043.2 10842.9 2000
2001 131.0 14.0 491.6 3.29 199.5 1867.7 583.4 537.8 3654.2 894.9 7.63 241.1 5.02 24.8 273.3 204.9 149.3 56.6 356.7 133.0 16.5 3690.9 30.0 11166.7 11051.4 2001
2002 136.8 14.9 518.0 3.40 203.2 1937.0 609.9 580.8 3666.6 957.5 8.08 254.1 5.25 25.8 282.1 214.0 155.5 58.9 375.8 142.4 17.1 4026.7 33.6 11369.1 11175.8 2002
2003 144.0 16.2 537.6 3.43 209.3 2096.6 639.1 627.1 3719.1 983.8 8.55 268.9 5.62 27.0 295.9 224.6 162.4 62.4 402.8 152.9 17.6 4429.4 38.3 11665.5 11305.1 2003
2004 153.0 17.9 571.5 3.62 227.0 2273.1 671.3 659.8 3821.3 1031.6 9.14 287.3 6.22 28.0 317.6 239.0 177.5 65.8 428.5 164.9 17.8 4876.8 43.5 12076.0 11561.3 2004
2005 162.1 20.2 599.1 3.57 243.1 2486.1 709.8 695.6 3894.4 1072.8 9.81 302.7 6.67 28.9 341.9 250.8 189.6 69.9 448.2 178.9 17.9 5427.9 49.4 12450.4 11766.2 2005
2006 172.9 22.4 632.4 3.64 260.1 2717.4 748.9 738.7 3972.1 1128.8 10.63 320.5 7.24 29.9 363.1 264.4 206.1 75.3 471.6 193.7 18.7 6117.2 55.7 12792.3 12104.7 2006
2007 184.0 24.7 670.4 3.61 276.7 2978.6 796.7 800.5 4065.3 1186.4 11.46 341.4 7.99 31.7 383.9 283.2 223.1 80.4 495.2 210.1 18.7 6985.9 58.8 13027.9 12433.4 2007
2008 195.3 26.4 675.7 3.62 282.7 3128.3 844.7 829.8 4019.8 1214.1 12.36 357.7 8.70 33.3 390.4 294.1 227.7 85.2 507.4 223.2 18.4 7656.5 60.0 13007.7 12466.3 2008

Appendix
104
Unit: Percentage (average annual growth rate of GDP at constant market prices).
Note: See Box 2 for the adjustments made to harmonize GDP coverage across countries.
Sources: Official national accounts in each country, including our adjustments.
Data 2 Growth Rate of GDP at Constant Prices
Bangladesh Cambodia ROC Fiji Hong Kong India Indonesia Iran Japan Korea Lao PDR Malaysia Mongolia Nepal Pakistan Philippines Singapore Sri Lanka Thailand Vietnam Brunei China Myanmar US EU15
1970 ! ! ! ! ! ! ! ! ! ! ! ! ! ! ! ! ! ! ! ! ! ! ! ! ! 1970
1971 !5.6 n.a. 11.7 5.8 6.9 1.6 7.1 12.2 4.3 10.0 n.a. 9.6 5.4 n.a. 1.5 4.8 11.3 0.5 4.7 n.a. 9.9 6.8 4.2 3.3 3.3 1971
1972 !15.1 n.a. 12.3 7.6 10.0 !0.6 10.1 15.1 8.1 6.3 n.a. 9.0 4.2 n.a. 1.5 4.7 12.6 3.1 4.1 n.a. 10.0 3.7 2.2 5.2 4.5 1972
1973 9.2 n.a. 11.1 12.0 11.6 3.3 11.9 5.4 7.8 13.8 n.a. 11.1 10.4 n.a. 6.4 8.3 10.5 8.7 9.5 n.a. 9.4 7.6 !1.3 5.6 6.1 1973
1974 !4.2 n.a. 1.9 2.6 2.3 1.2 6.4 9.0 !1.2 9.0 n.a. 8.0 5.8 n.a. 5.2 5.1 6.0 7.1 4.4 n.a. 11.2 2.3 4.3 !0.7 2.4 1974
1975 5.5 n.a. 5.4 0.2 0.4 8.7 6.0 5.6 3.1 7.1 n.a. 0.8 6.8 4.3 3.2 6.4 4.1 1.8 4.8 n.a. 0.4 8.3 4.0 !0.4 !0.6 1975
1976 2.6 n.a. 12.5 2.6 15.0 1.6 7.4 16.3 3.9 12.6 n.a. 11.0 5.0 3.0 4.5 7.7 7.0 4.8 8.8 n.a. 18.4 !1.6 5.4 5.4 4.5 1976
1977 6.8 n.a. 10.4 4.4 11.2 7.0 9.2 !1.3 4.3 11.2 n.a. 7.5 2.0 4.3 3.7 6.0 7.5 4.7 9.4 3.6 10.4 7.3 5.1 4.5 2.8 1977
1978 4.7 n.a. 12.7 1.8 8.1 5.6 7.3 !7.8 5.2 9.8 n.a. 6.4 8.3 2.3 7.7 5.4 7.9 7.1 9.4 0.7 6.6 11.1 6.0 5.3 3.1 1978
1979 0.8 n.a. 7.7 11.4 11.0 !5.4 6.3 !7.4 5.4 8.1 n.a. 9.0 8.4 !2.3 4.7 6.1 8.9 5.9 5.1 0.6 20.4 7.3 4.6 3.2 3.6 1979
1980 3.3 n.a. 7.1 !1.7 9.8 6.5 8.8 !14.2 2.9 !1.9 n.a. 7.2 3.4 7.9 8.3 5.1 9.6 5.5 4.5 !2.9 !7.2 7.5 7.6 !0.2 1.5 1980
1981 1.2 n.a. 6.3 5.8 9.0 5.8 7.0 !5.3 4.1 7.2 n.a. 6.7 8.1 3.8 6.7 3.4 10.1 5.4 5.8 3.5 !22.0 5.1 6.1 2.6 0.2 1981
1982 2.4 n.a. 3.9 !1.1 2.9 3.4 1.1 12.2 3.3 8.0 n.a. 5.8 8.0 0.4 6.4 3.6 6.7 5.1 5.2 7.5 3.9 8.7 5.3 !2.0 1.0 1982
1983 4.0 n.a. 8.0 !4.1 5.8 7.1 4.1 11.9 3.1 11.5 n.a. 6.1 5.6 5.9 6.6 1.9 8.4 4.7 5.5 6.7 0.6 10.4 4.3 4.0 1.7 1983
1984 5.0 n.a. 8.9 8.1 9.4 3.8 7.3 !1.6 4.4 9.4 n.a. 7.5 5.8 6.0 5.0 !7.6 8.3 4.9 5.6 7.6 0.7 14.2 4.8 7.1 2.5 1984
1985 3.2 n.a. 4.0 !5.2 0.7 5.1 3.8 2.1 6.2 7.2 7.3 !1.1 5.5 4.5 7.3 !7.6 !1.0 4.9 4.6 7.8 !1.4 12.7 2.8 3.9 2.5 1985
1986 4.1 n.a. 10.4 7.8 10.5 4.7 7.0 !9.6 2.9 11.5 4.7 1.1 9.0 1.7 5.4 3.4 1.3 4.2 5.4 0.4 !12.0 8.4 !1.1 3.3 2.8 1986
1987 3.7 n.a. 10.2 !6.7 12.6 3.9 6.4 !1.4 4.1 11.6 !1.1 5.3 3.5 7.4 6.3 4.2 9.8 1.6 9.1 3.6 0.4 11.0 !4.1 3.1 2.8 1987
1988 2.2 14.9 5.4 2.1 8.1 9.2 6.8 !6.5 6.9 11.0 !1.8 9.5 5.0 4.2 7.4 6.5 10.7 2.7 12.5 5.9 !0.2 10.7 !12.0 4.2 4.2 1988
1989 2.6 !0.4 9.8 12.0 2.2 5.8 8.7 8.1 5.3 6.5 12.6 8.7 4.1 4.5 4.9 6.0 9.6 2.0 11.5 4.6 2.3 4.0 3.7 3.7 3.7 1989
1990 5.8 1.0 6.6 3.6 3.8 5.1 8.6 16.2 5.3 8.9 6.5 8.6 !2.5 6.2 4.4 2.6 9.0 6.1 10.6 5.0 1.0 3.7 2.8 1.9 3.0 1990
1991 3.2 7.1 7.6 !2.7 5.5 0.8 8.6 10.8 3.3 9.3 3.9 9.1 !5.8 4.0 4.9 !0.8 6.7 4.7 8.2 5.7 3.2 8.8 !0.6 !0.4 2.0 1991
1992 4.9 6.6 7.3 6.0 5.9 5.6 7.0 6.3 0.9 5.6 6.8 8.5 !5.6 3.8 7.4 !0.3 6.9 4.3 7.8 8.3 4.7 13.3 9.3 3.2 1.2 1992
1993 4.5 3.8 6.5 2.6 5.9 3.9 7.0 !7.1 0.2 6.1 5.7 9.5 !4.4 7.9 1.8 3.3 11.2 6.7 8.0 7.8 0.2 13.1 5.9 2.9 !0.3 1993
1994 4.0 8.7 7.3 5.0 5.8 6.6 7.3 !0.2 0.8 8.4 7.9 8.8 2.9 3.4 3.7 4.3 10.2 5.5 8.6 8.5 2.9 12.3 7.2 4.1 2.8 1994
1995 4.8 6.3 6.2 2.5 2.3 7.3 7.9 3.4 1.8 8.5 6.9 9.4 4.1 5.2 4.9 4.6 7.2 5.4 8.9 9.1 4.2 10.4 6.7 2.6 2.6 1995
1996 4.6 5.3 5.4 4.7 4.1 7.4 7.6 6.8 2.6 7.0 6.7 9.6 2.8 5.1 4.8 5.7 7.7 3.7 5.8 9.0 3.5 9.5 6.3 3.6 1.8 1996
1997 5.3 5.5 5.2 !2.4 4.9 3.9 4.7 4.5 1.6 5.7 6.7 7.1 4.2 2.9 1.0 5.1 7.8 6.3 !1.4 7.9 !1.7 8.9 5.6 4.3 2.7 1997
1998 5.1 4.9 3.3 1.3 !6.2 6.2 !14.1 2.9 !2.0 !5.9 3.9 !7.6 4.7 4.4 2.5 !0.6 !1.9 4.7 !11.1 5.6 !0.5 7.5 4.9 4.2 3.0 1998
1999 4.8 11.3 5.7 8.4 2.5 6.8 0.8 4.0 !0.1 10.2 7.0 6.0 4.9 5.9 3.6 3.4 6.3 4.2 4.4 4.7 3.5 7.3 4.9 4.7 3.1 1999
2000 5.8 8.4 5.6 !1.7 7.7 4.3 4.8 3.3 2.8 8.5 5.7 8.5 1.3 5.5 4.2 5.8 9.2 5.8 4.7 6.6 3.3 8.1 11.3 4.1 3.9 2000
2001 5.2 7.9 !1.7 1.9 0.5 5.2 3.6 2.7 0.2 3.5 5.6 0.5 2.9 0.1 2.0 1.7 !1.6 !1.4 2.2 6.7 2.8 8.0 10.8 1.1 1.9 2001
2002 4.3 6.4 5.2 3.2 1.8 3.7 4.4 7.7 0.3 6.8 5.8 5.3 4.6 3.9 3.2 4.4 4.0 4.0 5.2 6.9 3.8 8.7 11.4 1.8 1.1 2002
2003 5.1 8.2 3.7 0.9 3.0 7.9 4.7 7.7 1.4 2.7 5.6 5.7 6.8 4.6 4.8 4.8 4.3 5.8 6.9 7.1 3.0 9.5 13.0 2.6 1.2 2003
2004 6.1 9.9 6.1 5.3 8.1 8.1 4.9 5.1 2.7 4.8 6.7 6.6 10.1 3.4 7.1 6.2 8.9 5.3 6.2 7.5 0.8 9.6 12.7 3.5 2.2 2004
2005 5.8 12.5 4.7 !1.3 6.8 9.0 5.6 5.3 1.9 3.9 7.1 5.2 7.0 3.3 7.4 4.9 6.6 6.1 4.5 8.1 0.7 10.7 12.8 3.1 1.8 2005
2006 6.4 10.3 5.4 1.9 6.8 8.9 5.4 6.0 2.0 5.1 8.0 5.7 8.2 3.4 6.0 5.3 8.4 7.4 5.1 7.9 4.4 12.0 12.0 2.7 2.8 2006
2007 6.2 9.8 5.8 !0.8 6.2 9.2 6.2 8.0 2.3 5.0 7.5 6.3 9.7 5.9 5.6 6.9 7.9 6.6 4.9 8.2 0.2 13.3 5.4 1.8 2.7 2007
2008 6.0 6.6 0.8 0.2 2.1 4.9 5.8 3.6 !1.1 2.3 7.5 4.7 8.6 4.8 1.7 3.8 2.1 5.8 2.4 6.1 !1.7 9.2 2.0 !0.2 0.3 2008

105
Bangladesh Cambodia ROC Fiji Hong Kong India Indonesia Iran Japan Korea Lao PDR Malaysia Mongolia Nepal Pakistan Philippines Singapore Sri Lanka Thailand Vietnam Brunei China Myanmar US EU15
1970 ! ! ! ! ! ! ! ! ! ! ! ! ! ! ! ! ! ! ! ! ! ! ! ! ! 1970
1971 !5.6 n.a. 11.7 5.8 6.9 1.6 7.1 12.2 4.3 10.0 n.a. 9.6 5.4 n.a. 1.5 4.8 11.3 0.5 4.7 n.a. 9.9 6.8 4.2 3.3 3.3 1971
1972 !15.1 n.a. 12.3 7.6 10.0 !0.6 10.1 15.1 8.1 6.3 n.a. 9.0 4.2 n.a. 1.5 4.7 12.6 3.1 4.1 n.a. 10.0 3.7 2.2 5.2 4.5 1972
1973 9.2 n.a. 11.1 12.0 11.6 3.3 11.9 5.4 7.8 13.8 n.a. 11.1 10.4 n.a. 6.4 8.3 10.5 8.7 9.5 n.a. 9.4 7.6 !1.3 5.6 6.1 1973
1974 !4.2 n.a. 1.9 2.6 2.3 1.2 6.4 9.0 !1.2 9.0 n.a. 8.0 5.8 n.a. 5.2 5.1 6.0 7.1 4.4 n.a. 11.2 2.3 4.3 !0.7 2.4 1974
1975 5.5 n.a. 5.4 0.2 0.4 8.7 6.0 5.6 3.1 7.1 n.a. 0.8 6.8 4.3 3.2 6.4 4.1 1.8 4.8 n.a. 0.4 8.3 4.0 !0.4 !0.6 1975
1976 2.6 n.a. 12.5 2.6 15.0 1.6 7.4 16.3 3.9 12.6 n.a. 11.0 5.0 3.0 4.5 7.7 7.0 4.8 8.8 n.a. 18.4 !1.6 5.4 5.4 4.5 1976
1977 6.8 n.a. 10.4 4.4 11.2 7.0 9.2 !1.3 4.3 11.2 n.a. 7.5 2.0 4.3 3.7 6.0 7.5 4.7 9.4 3.6 10.4 7.3 5.1 4.5 2.8 1977
1978 4.7 n.a. 12.7 1.8 8.1 5.6 7.3 !7.8 5.2 9.8 n.a. 6.4 8.3 2.3 7.7 5.4 7.9 7.1 9.4 0.7 6.6 11.1 6.0 5.3 3.1 1978
1979 0.8 n.a. 7.7 11.4 11.0 !5.4 6.3 !7.4 5.4 8.1 n.a. 9.0 8.4 !2.3 4.7 6.1 8.9 5.9 5.1 0.6 20.4 7.3 4.6 3.2 3.6 1979
1980 3.3 n.a. 7.1 !1.7 9.8 6.5 8.8 !14.2 2.9 !1.9 n.a. 7.2 3.4 7.9 8.3 5.1 9.6 5.5 4.5 !2.9 !7.2 7.5 7.6 !0.2 1.5 1980
1981 1.2 n.a. 6.3 5.8 9.0 5.8 7.0 !5.3 4.1 7.2 n.a. 6.7 8.1 3.8 6.7 3.4 10.1 5.4 5.8 3.5 !22.0 5.1 6.1 2.6 0.2 1981
1982 2.4 n.a. 3.9 !1.1 2.9 3.4 1.1 12.2 3.3 8.0 n.a. 5.8 8.0 0.4 6.4 3.6 6.7 5.1 5.2 7.5 3.9 8.7 5.3 !2.0 1.0 1982
1983 4.0 n.a. 8.0 !4.1 5.8 7.1 4.1 11.9 3.1 11.5 n.a. 6.1 5.6 5.9 6.6 1.9 8.4 4.7 5.5 6.7 0.6 10.4 4.3 4.0 1.7 1983
1984 5.0 n.a. 8.9 8.1 9.4 3.8 7.3 !1.6 4.4 9.4 n.a. 7.5 5.8 6.0 5.0 !7.6 8.3 4.9 5.6 7.6 0.7 14.2 4.8 7.1 2.5 1984
1985 3.2 n.a. 4.0 !5.2 0.7 5.1 3.8 2.1 6.2 7.2 7.3 !1.1 5.5 4.5 7.3 !7.6 !1.0 4.9 4.6 7.8 !1.4 12.7 2.8 3.9 2.5 1985
1986 4.1 n.a. 10.4 7.8 10.5 4.7 7.0 !9.6 2.9 11.5 4.7 1.1 9.0 1.7 5.4 3.4 1.3 4.2 5.4 0.4 !12.0 8.4 !1.1 3.3 2.8 1986
1987 3.7 n.a. 10.2 !6.7 12.6 3.9 6.4 !1.4 4.1 11.6 !1.1 5.3 3.5 7.4 6.3 4.2 9.8 1.6 9.1 3.6 0.4 11.0 !4.1 3.1 2.8 1987
1988 2.2 14.9 5.4 2.1 8.1 9.2 6.8 !6.5 6.9 11.0 !1.8 9.5 5.0 4.2 7.4 6.5 10.7 2.7 12.5 5.9 !0.2 10.7 !12.0 4.2 4.2 1988
1989 2.6 !0.4 9.8 12.0 2.2 5.8 8.7 8.1 5.3 6.5 12.6 8.7 4.1 4.5 4.9 6.0 9.6 2.0 11.5 4.6 2.3 4.0 3.7 3.7 3.7 1989
1990 5.8 1.0 6.6 3.6 3.8 5.1 8.6 16.2 5.3 8.9 6.5 8.6 !2.5 6.2 4.4 2.6 9.0 6.1 10.6 5.0 1.0 3.7 2.8 1.9 3.0 1990
1991 3.2 7.1 7.6 !2.7 5.5 0.8 8.6 10.8 3.3 9.3 3.9 9.1 !5.8 4.0 4.9 !0.8 6.7 4.7 8.2 5.7 3.2 8.8 !0.6 !0.4 2.0 1991
1992 4.9 6.6 7.3 6.0 5.9 5.6 7.0 6.3 0.9 5.6 6.8 8.5 !5.6 3.8 7.4 !0.3 6.9 4.3 7.8 8.3 4.7 13.3 9.3 3.2 1.2 1992
1993 4.5 3.8 6.5 2.6 5.9 3.9 7.0 !7.1 0.2 6.1 5.7 9.5 !4.4 7.9 1.8 3.3 11.2 6.7 8.0 7.8 0.2 13.1 5.9 2.9 !0.3 1993
1994 4.0 8.7 7.3 5.0 5.8 6.6 7.3 !0.2 0.8 8.4 7.9 8.8 2.9 3.4 3.7 4.3 10.2 5.5 8.6 8.5 2.9 12.3 7.2 4.1 2.8 1994
1995 4.8 6.3 6.2 2.5 2.3 7.3 7.9 3.4 1.8 8.5 6.9 9.4 4.1 5.2 4.9 4.6 7.2 5.4 8.9 9.1 4.2 10.4 6.7 2.6 2.6 1995
1996 4.6 5.3 5.4 4.7 4.1 7.4 7.6 6.8 2.6 7.0 6.7 9.6 2.8 5.1 4.8 5.7 7.7 3.7 5.8 9.0 3.5 9.5 6.3 3.6 1.8 1996
1997 5.3 5.5 5.2 !2.4 4.9 3.9 4.7 4.5 1.6 5.7 6.7 7.1 4.2 2.9 1.0 5.1 7.8 6.3 !1.4 7.9 !1.7 8.9 5.6 4.3 2.7 1997
1998 5.1 4.9 3.3 1.3 !6.2 6.2 !14.1 2.9 !2.0 !5.9 3.9 !7.6 4.7 4.4 2.5 !0.6 !1.9 4.7 !11.1 5.6 !0.5 7.5 4.9 4.2 3.0 1998
1999 4.8 11.3 5.7 8.4 2.5 6.8 0.8 4.0 !0.1 10.2 7.0 6.0 4.9 5.9 3.6 3.4 6.3 4.2 4.4 4.7 3.5 7.3 4.9 4.7 3.1 1999
2000 5.8 8.4 5.6 !1.7 7.7 4.3 4.8 3.3 2.8 8.5 5.7 8.5 1.3 5.5 4.2 5.8 9.2 5.8 4.7 6.6 3.3 8.1 11.3 4.1 3.9 2000
2001 5.2 7.9 !1.7 1.9 0.5 5.2 3.6 2.7 0.2 3.5 5.6 0.5 2.9 0.1 2.0 1.7 !1.6 !1.4 2.2 6.7 2.8 8.0 10.8 1.1 1.9 2001
2002 4.3 6.4 5.2 3.2 1.8 3.7 4.4 7.7 0.3 6.8 5.8 5.3 4.6 3.9 3.2 4.4 4.0 4.0 5.2 6.9 3.8 8.7 11.4 1.8 1.1 2002
2003 5.1 8.2 3.7 0.9 3.0 7.9 4.7 7.7 1.4 2.7 5.6 5.7 6.8 4.6 4.8 4.8 4.3 5.8 6.9 7.1 3.0 9.5 13.0 2.6 1.2 2003
2004 6.1 9.9 6.1 5.3 8.1 8.1 4.9 5.1 2.7 4.8 6.7 6.6 10.1 3.4 7.1 6.2 8.9 5.3 6.2 7.5 0.8 9.6 12.7 3.5 2.2 2004
2005 5.8 12.5 4.7 !1.3 6.8 9.0 5.6 5.3 1.9 3.9 7.1 5.2 7.0 3.3 7.4 4.9 6.6 6.1 4.5 8.1 0.7 10.7 12.8 3.1 1.8 2005
2006 6.4 10.3 5.4 1.9 6.8 8.9 5.4 6.0 2.0 5.1 8.0 5.7 8.2 3.4 6.0 5.3 8.4 7.4 5.1 7.9 4.4 12.0 12.0 2.7 2.8 2006
2007 6.2 9.8 5.8 !0.8 6.2 9.2 6.2 8.0 2.3 5.0 7.5 6.3 9.7 5.9 5.6 6.9 7.9 6.6 4.9 8.2 0.2 13.3 5.4 1.8 2.7 2007
2008 6.0 6.6 0.8 0.2 2.1 4.9 5.8 3.6 !1.1 2.3 7.5 4.7 8.6 4.8 1.7 3.8 2.1 5.8 2.4 6.1 !1.7 9.2 2.0 !0.2 0.3 2008
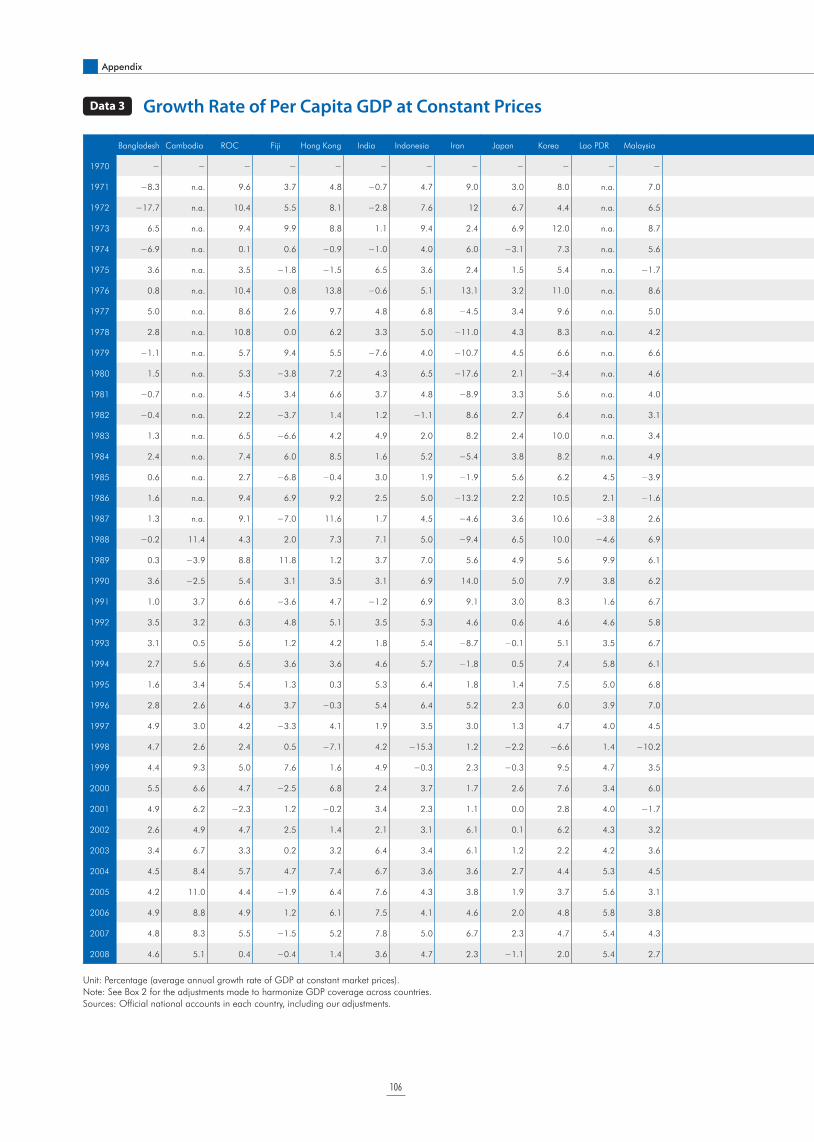
Appendix
106
Unit: Percentage (average annual growth rate of GDP at constant market prices).
Note: See Box 2 for the adjustments made to harmonize GDP coverage across countries.
Sources: Official national accounts in each country, including our adjustments.
Data 3 Growth Rate of Per Capita GDP at Constant Prices
Bangladesh Cambodia ROC Fiji Hong Kong India Indonesia Iran Japan Korea Lao PDR Malaysia Mongolia Nepal Pakistan Philippines Singapore Sri Lanka Thailand Vietnam Brunei China Myanmar US EU15
1970 ! ! ! ! ! ! ! ! ! ! ! ! ! ! ! ! ! ! ! ! ! ! ! ! ! 1970
1971 !8.3 n.a. 9.6 3.7 4.8 !0.7 4.7 9.0 3.0 8.0 n.a. 7.0 2.2 n.a. !1.6 2.0 9.5 !1.7 2.1 n.a. 5.3 4.1 1.7 2.0 2.7 1971
1972 !17.7 n.a. 10.4 5.5 8.1 !2.8 7.6 12 6.7 4.4 n.a. 6.5 1.3 n.a. !1.7 1.9 10.8 1.3 1.5 n.a. 5.6 1.5 !0.3 4.1 4.0 1972
1973 6.5 n.a. 9.4 9.9 8.8 1.1 9.4 2.4 6.9 12.0 n.a. 8.7 7.6 n.a. 3.4 5.6 8.7 6.9 7.0 n.a. 5.1 5.3 !3.9 4.7 5.6 1973
1974 !6.9 n.a. 0.1 0.6 !0.9 !1.0 4.0 6.0 !3.1 7.3 n.a. 5.6 3.0 n.a. 2.2 2.4 4.3 5.4 1.9 n.a. 7.0 0.4 1.8 !1.6 1.9 1974
1975 3.6 n.a. 3.5 !1.8 !1.5 6.5 3.6 2.4 1.5 5.4 n.a. !1.7 4.1 1.7 0.2 3.7 2.7 0.1 2.4 n.a. !3.7 6.6 1.6 !1.4 !1.0 1975
1976 0.8 n.a. 10.4 0.8 13.8 !0.6 5.1 13.1 3.2 11.0 n.a. 8.6 2.2 0.3 1.6 5.0 5.6 3.2 6.5 n.a. 14.5 !3.0 3.0 4.4 4.2 1976
1977 5.0 n.a. 8.6 2.6 9.7 4.8 6.8 !4.5 3.4 9.6 n.a. 5.0 !0.9 1.7 0.9 3.2 6.1 3.1 7.2 1.3 6.6 6.0 2.8 3.5 2.4 1977
1978 2.8 n.a. 10.8 0.0 6.2 3.3 5.0 !11.0 4.3 8.3 n.a. 4.2 5.4 !0.3 4.9 2.7 6.7 5.6 7.2 !1.6 2.9 9.7 3.7 4.3 2.7 1978
1979 !1.1 n.a. 5.7 9.4 5.5 !7.6 4.0 !10.7 4.5 6.6 n.a. 6.6 5.5 !5.0 1.9 3.4 7.6 4.5 2.9 !1.6 16.9 6.0 2.3 2.0 3.3 1979
1980 1.5 n.a. 5.3 !3.8 7.2 4.3 6.5 !17.6 2.1 !3.4 n.a. 4.6 0.5 5.3 5.7 2.5 8.3 4.2 2.3 !5.0 !10.5 6.3 5.3 !1.1 1.1 1980
1981 !0.7 n.a. 4.5 3.4 6.6 3.7 4.8 !8.9 3.3 5.6 n.a. 4.0 5.4 1.1 4.1 0.9 5.2 4.2 3.5 1.6 !25.1 3.7 3.8 1.7 !0.1 1981
1982 !0.4 n.a. 2.2 !3.7 1.4 1.2 !1.1 8.6 2.7 6.4 n.a. 3.1 5.4 !1.7 3.5 1.2 2.3 3.4 3.0 5.7 1.0 7.1 3.0 !3.0 0.8 1982
1983 1.3 n.a. 6.5 !6.6 4.2 4.9 2.0 8.2 2.4 10.0 n.a. 3.4 3.2 3.8 3.8 !0.5 7.1 3.1 3.3 5.0 !2.3 9.0 2.1 3.0 1.6 1983
1984 2.4 n.a. 7.4 6.0 8.5 1.6 5.2 !5.4 3.8 8.2 n.a. 4.9 3.4 3.9 2.2 !9.9 6.4 3.4 3.6 5.8 !2.1 12.9 2.7 6.2 2.4 1984
1985 0.6 n.a. 2.7 !6.8 !0.4 3.0 1.9 !1.9 5.6 6.2 4.5 !3.9 3.4 2.4 4.6 !9.9 !1.2 3.3 2.6 5.8 !4.2 11.2 0.8 3.0 2.4 1985
1986 1.6 n.a. 9.4 6.9 9.2 2.5 5.0 !13.2 2.2 10.5 2.1 !1.6 6.7 !0.4 2.6 1.0 1.4 2.6 3.7 !1.9 !14.9 6.9 !3.0 2.4 2.6 1986
1987 1.3 n.a. 9.1 !7.0 11.6 1.7 4.5 !4.6 3.6 10.6 !3.8 2.6 1.4 5.4 3.5 1.9 8.3 0.0 7.5 1.1 !2.5 9.3 !5.9 2.2 2.6 1987
1988 !0.2 11.4 4.3 2.0 7.3 7.1 5.0 !9.4 6.5 10.0 !4.6 6.9 3.1 2.2 4.6 4.2 8.2 1.2 11.0 3.4 !3.1 9.1 !13.8 3.3 3.9 1988
1989 0.3 !3.9 8.8 11.8 1.2 3.7 7.0 5.6 4.9 5.6 9.9 6.1 2.3 2.5 2.2 3.7 6.7 0.4 10.1 2.2 !0.5 2.5 2.0 2.7 3.3 1989
1990 3.6 !2.5 5.4 3.1 3.5 3.1 6.9 14.0 5.0 7.9 3.8 6.2 !4.3 4.1 1.7 0.4 5.1 4.5 9.2 3.1 !1.8 2.3 1.2 0.7 2.6 1990
1991 1.0 3.7 6.6 !3.6 4.7 !1.2 6.9 9.1 3.0 8.3 1.6 6.7 !7.5 1.9 2.3 !3.3 3.8 3.2 6.9 3.8 0.4 7.5 !2.2 !1.7 1.6 1991
1992 3.5 3.2 6.3 4.8 5.1 3.5 5.3 4.6 0.6 4.6 4.6 5.8 !7.2 1.5 4.8 !2.8 3.9 2.9 6.5 6.6 1.9 12.1 7.8 1.8 0.8 1992
1993 3.1 0.5 5.6 1.2 4.2 1.8 5.4 !8.7 !0.1 5.1 3.5 6.7 !5.9 5.6 !0.8 0.8 8.7 5.3 6.7 6.1 !2.6 12.0 4.5 1.6 !0.7 1993
1994 2.7 5.6 6.5 3.6 3.6 4.6 5.7 !1.8 0.5 7.4 5.8 6.1 1.5 1.1 1.1 1.9 7.1 4.2 7.5 6.8 0.2 11.2 5.9 2.8 2.5 1994
1995 1.6 3.4 5.4 1.3 0.3 5.3 6.4 1.8 1.4 7.5 5.0 6.8 2.7 2.9 2.3 2.2 4.2 4.2 7.9 7.5 1.5 9.3 5.4 1.4 2.3 1995
1996 2.8 2.6 4.6 3.7 !0.3 5.4 6.4 5.2 2.3 6.0 3.9 7.0 1.3 2.8 2.2 3.5 3.7 2.6 5.0 7.4 0.9 8.5 4.9 2.5 1.6 1996
1997 4.9 3.0 4.2 !3.3 4.1 1.9 3.5 3.0 1.3 4.7 4.0 4.5 2.8 0.6 !1.5 2.9 4.5 5.3 !2.0 6.3 !4.3 7.9 4.2 3.1 2.5 1997
1998 4.7 2.6 2.4 0.5 !7.1 4.2 !15.3 1.2 !2.2 !6.6 1.4 !10.2 3.4 2.1 0.1 !2.7 !5.3 3.7 !11.7 4.1 !3.0 6.6 3.7 3.1 2.8 1998
1999 4.4 9.3 5.0 7.6 1.6 4.9 !0.3 2.3 !0.3 9.5 4.7 3.5 3.7 3.7 1.7 1.2 5.5 3.3 3.7 3.2 1.1 6.5 3.7 3.5 2.8 1999
2000 5.5 6.6 4.7 !2.5 6.8 2.4 3.7 1.7 2.6 7.6 3.4 6.0 0.0 3.3 2.3 3.7 7.5 5.5 3.8 5.2 1.0 7.3 10.3 3.0 3.5 2000
2001 4.9 6.2 !2.3 1.2 !0.2 3.4 2.3 1.1 0.0 2.8 4.0 !1.7 1.5 !2.0 0.0 !0.4 !4.3 0.3 1.1 5.4 0.6 7.3 9.9 0.1 1.5 2001
2002 2.6 4.9 4.7 2.5 1.4 2.1 3.1 6.1 0.1 6.2 4.3 3.2 3.2 1.5 1.2 2.2 3.1 2.9 4.1 5.7 1.7 8.1 10.7 0.9 0.6 2002
2003 3.4 6.7 3.3 0.2 3.2 6.4 3.4 6.1 1.2 2.2 4.2 3.6 5.5 2.3 2.8 2.7 5.8 4.5 5.7 5.9 0.9 8.9 12.3 1.7 0.6 2003
2004 4.5 8.4 5.7 4.7 7.4 6.7 3.6 3.6 2.7 4.4 5.3 4.5 9.0 1.2 5.2 4.1 7.6 4.2 5.0 6.3 !1.3 9.0 12.1 2.5 1.6 2004
2005 4.2 11.0 4.4 !1.9 6.4 7.6 4.3 3.8 1.9 3.7 5.6 3.1 5.9 1.2 5.5 2.8 4.2 5.0 3.5 7.0 !1.3 10.1 12.1 2.2 1.1 2005
2006 4.9 8.8 4.9 1.2 6.1 7.5 4.1 4.6 2.0 4.8 5.8 3.8 7.0 1.2 3.5 3.2 5.2 6.3 4.2 6.8 2.4 11.4 11.2 1.8 2.3 2006
2007 4.8 8.3 5.5 !1.5 5.2 7.8 5.0 6.7 2.3 4.7 5.4 4.3 8.3 4.0 3.8 4.9 3.7 6.0 4.2 7.1 !1.8 12.8 4.5 0.9 2.1 2007
2008 4.6 5.1 0.4 !0.4 1.4 3.6 4.7 2.3 !1.1 2.0 5.4 2.7 6.9 2.9 !0.1 2.0 !3.3 4.8 1.8 5.0 !3.6 8.7 1.1 !1.1 !0.3 2008

107
Bangladesh Cambodia ROC Fiji Hong Kong India Indonesia Iran Japan Korea Lao PDR Malaysia Mongolia Nepal Pakistan Philippines Singapore Sri Lanka Thailand Vietnam Brunei China Myanmar US EU15
1970 ! ! ! ! ! ! ! ! ! ! ! ! ! ! ! ! ! ! ! ! ! ! ! ! ! 1970
1971 !8.3 n.a. 9.6 3.7 4.8 !0.7 4.7 9.0 3.0 8.0 n.a. 7.0 2.2 n.a. !1.6 2.0 9.5 !1.7 2.1 n.a. 5.3 4.1 1.7 2.0 2.7 1971
1972 !17.7 n.a. 10.4 5.5 8.1 !2.8 7.6 12 6.7 4.4 n.a. 6.5 1.3 n.a. !1.7 1.9 10.8 1.3 1.5 n.a. 5.6 1.5 !0.3 4.1 4.0 1972
1973 6.5 n.a. 9.4 9.9 8.8 1.1 9.4 2.4 6.9 12.0 n.a. 8.7 7.6 n.a. 3.4 5.6 8.7 6.9 7.0 n.a. 5.1 5.3 !3.9 4.7 5.6 1973
1974 !6.9 n.a. 0.1 0.6 !0.9 !1.0 4.0 6.0 !3.1 7.3 n.a. 5.6 3.0 n.a. 2.2 2.4 4.3 5.4 1.9 n.a. 7.0 0.4 1.8 !1.6 1.9 1974
1975 3.6 n.a. 3.5 !1.8 !1.5 6.5 3.6 2.4 1.5 5.4 n.a. !1.7 4.1 1.7 0.2 3.7 2.7 0.1 2.4 n.a. !3.7 6.6 1.6 !1.4 !1.0 1975
1976 0.8 n.a. 10.4 0.8 13.8 !0.6 5.1 13.1 3.2 11.0 n.a. 8.6 2.2 0.3 1.6 5.0 5.6 3.2 6.5 n.a. 14.5 !3.0 3.0 4.4 4.2 1976
1977 5.0 n.a. 8.6 2.6 9.7 4.8 6.8 !4.5 3.4 9.6 n.a. 5.0 !0.9 1.7 0.9 3.2 6.1 3.1 7.2 1.3 6.6 6.0 2.8 3.5 2.4 1977
1978 2.8 n.a. 10.8 0.0 6.2 3.3 5.0 !11.0 4.3 8.3 n.a. 4.2 5.4 !0.3 4.9 2.7 6.7 5.6 7.2 !1.6 2.9 9.7 3.7 4.3 2.7 1978
1979 !1.1 n.a. 5.7 9.4 5.5 !7.6 4.0 !10.7 4.5 6.6 n.a. 6.6 5.5 !5.0 1.9 3.4 7.6 4.5 2.9 !1.6 16.9 6.0 2.3 2.0 3.3 1979
1980 1.5 n.a. 5.3 !3.8 7.2 4.3 6.5 !17.6 2.1 !3.4 n.a. 4.6 0.5 5.3 5.7 2.5 8.3 4.2 2.3 !5.0 !10.5 6.3 5.3 !1.1 1.1 1980
1981 !0.7 n.a. 4.5 3.4 6.6 3.7 4.8 !8.9 3.3 5.6 n.a. 4.0 5.4 1.1 4.1 0.9 5.2 4.2 3.5 1.6 !25.1 3.7 3.8 1.7 !0.1 1981
1982 !0.4 n.a. 2.2 !3.7 1.4 1.2 !1.1 8.6 2.7 6.4 n.a. 3.1 5.4 !1.7 3.5 1.2 2.3 3.4 3.0 5.7 1.0 7.1 3.0 !3.0 0.8 1982
1983 1.3 n.a. 6.5 !6.6 4.2 4.9 2.0 8.2 2.4 10.0 n.a. 3.4 3.2 3.8 3.8 !0.5 7.1 3.1 3.3 5.0 !2.3 9.0 2.1 3.0 1.6 1983
1984 2.4 n.a. 7.4 6.0 8.5 1.6 5.2 !5.4 3.8 8.2 n.a. 4.9 3.4 3.9 2.2 !9.9 6.4 3.4 3.6 5.8 !2.1 12.9 2.7 6.2 2.4 1984
1985 0.6 n.a. 2.7 !6.8 !0.4 3.0 1.9 !1.9 5.6 6.2 4.5 !3.9 3.4 2.4 4.6 !9.9 !1.2 3.3 2.6 5.8 !4.2 11.2 0.8 3.0 2.4 1985
1986 1.6 n.a. 9.4 6.9 9.2 2.5 5.0 !13.2 2.2 10.5 2.1 !1.6 6.7 !0.4 2.6 1.0 1.4 2.6 3.7 !1.9 !14.9 6.9 !3.0 2.4 2.6 1986
1987 1.3 n.a. 9.1 !7.0 11.6 1.7 4.5 !4.6 3.6 10.6 !3.8 2.6 1.4 5.4 3.5 1.9 8.3 0.0 7.5 1.1 !2.5 9.3 !5.9 2.2 2.6 1987
1988 !0.2 11.4 4.3 2.0 7.3 7.1 5.0 !9.4 6.5 10.0 !4.6 6.9 3.1 2.2 4.6 4.2 8.2 1.2 11.0 3.4 !3.1 9.1 !13.8 3.3 3.9 1988
1989 0.3 !3.9 8.8 11.8 1.2 3.7 7.0 5.6 4.9 5.6 9.9 6.1 2.3 2.5 2.2 3.7 6.7 0.4 10.1 2.2 !0.5 2.5 2.0 2.7 3.3 1989
1990 3.6 !2.5 5.4 3.1 3.5 3.1 6.9 14.0 5.0 7.9 3.8 6.2 !4.3 4.1 1.7 0.4 5.1 4.5 9.2 3.1 !1.8 2.3 1.2 0.7 2.6 1990
1991 1.0 3.7 6.6 !3.6 4.7 !1.2 6.9 9.1 3.0 8.3 1.6 6.7 !7.5 1.9 2.3 !3.3 3.8 3.2 6.9 3.8 0.4 7.5 !2.2 !1.7 1.6 1991
1992 3.5 3.2 6.3 4.8 5.1 3.5 5.3 4.6 0.6 4.6 4.6 5.8 !7.2 1.5 4.8 !2.8 3.9 2.9 6.5 6.6 1.9 12.1 7.8 1.8 0.8 1992
1993 3.1 0.5 5.6 1.2 4.2 1.8 5.4 !8.7 !0.1 5.1 3.5 6.7 !5.9 5.6 !0.8 0.8 8.7 5.3 6.7 6.1 !2.6 12.0 4.5 1.6 !0.7 1993
1994 2.7 5.6 6.5 3.6 3.6 4.6 5.7 !1.8 0.5 7.4 5.8 6.1 1.5 1.1 1.1 1.9 7.1 4.2 7.5 6.8 0.2 11.2 5.9 2.8 2.5 1994
1995 1.6 3.4 5.4 1.3 0.3 5.3 6.4 1.8 1.4 7.5 5.0 6.8 2.7 2.9 2.3 2.2 4.2 4.2 7.9 7.5 1.5 9.3 5.4 1.4 2.3 1995
1996 2.8 2.6 4.6 3.7 !0.3 5.4 6.4 5.2 2.3 6.0 3.9 7.0 1.3 2.8 2.2 3.5 3.7 2.6 5.0 7.4 0.9 8.5 4.9 2.5 1.6 1996
1997 4.9 3.0 4.2 !3.3 4.1 1.9 3.5 3.0 1.3 4.7 4.0 4.5 2.8 0.6 !1.5 2.9 4.5 5.3 !2.0 6.3 !4.3 7.9 4.2 3.1 2.5 1997
1998 4.7 2.6 2.4 0.5 !7.1 4.2 !15.3 1.2 !2.2 !6.6 1.4 !10.2 3.4 2.1 0.1 !2.7 !5.3 3.7 !11.7 4.1 !3.0 6.6 3.7 3.1 2.8 1998
1999 4.4 9.3 5.0 7.6 1.6 4.9 !0.3 2.3 !0.3 9.5 4.7 3.5 3.7 3.7 1.7 1.2 5.5 3.3 3.7 3.2 1.1 6.5 3.7 3.5 2.8 1999
2000 5.5 6.6 4.7 !2.5 6.8 2.4 3.7 1.7 2.6 7.6 3.4 6.0 0.0 3.3 2.3 3.7 7.5 5.5 3.8 5.2 1.0 7.3 10.3 3.0 3.5 2000
2001 4.9 6.2 !2.3 1.2 !0.2 3.4 2.3 1.1 0.0 2.8 4.0 !1.7 1.5 !2.0 0.0 !0.4 !4.3 0.3 1.1 5.4 0.6 7.3 9.9 0.1 1.5 2001
2002 2.6 4.9 4.7 2.5 1.4 2.1 3.1 6.1 0.1 6.2 4.3 3.2 3.2 1.5 1.2 2.2 3.1 2.9 4.1 5.7 1.7 8.1 10.7 0.9 0.6 2002
2003 3.4 6.7 3.3 0.2 3.2 6.4 3.4 6.1 1.2 2.2 4.2 3.6 5.5 2.3 2.8 2.7 5.8 4.5 5.7 5.9 0.9 8.9 12.3 1.7 0.6 2003
2004 4.5 8.4 5.7 4.7 7.4 6.7 3.6 3.6 2.7 4.4 5.3 4.5 9.0 1.2 5.2 4.1 7.6 4.2 5.0 6.3 !1.3 9.0 12.1 2.5 1.6 2004
2005 4.2 11.0 4.4 !1.9 6.4 7.6 4.3 3.8 1.9 3.7 5.6 3.1 5.9 1.2 5.5 2.8 4.2 5.0 3.5 7.0 !1.3 10.1 12.1 2.2 1.1 2005
2006 4.9 8.8 4.9 1.2 6.1 7.5 4.1 4.6 2.0 4.8 5.8 3.8 7.0 1.2 3.5 3.2 5.2 6.3 4.2 6.8 2.4 11.4 11.2 1.8 2.3 2006
2007 4.8 8.3 5.5 !1.5 5.2 7.8 5.0 6.7 2.3 4.7 5.4 4.3 8.3 4.0 3.8 4.9 3.7 6.0 4.2 7.1 !1.8 12.8 4.5 0.9 2.1 2007
2008 4.6 5.1 0.4 !0.4 1.4 3.6 4.7 2.3 !1.1 2.0 5.4 2.7 6.9 2.9 !0.1 2.0 !3.3 4.8 1.8 5.0 !3.6 8.7 1.1 !1.1 !0.3 2008

Appendix
108
Unit: Percentage (average annual growth rate).
Note: Household consumption includes consumption of NPISHs. For Myanmar, it also includes government consumption due to data limitations.
Sources: Official national accounts in each country, including our adjustments.
Data 4 Growth Rate of Household Consumption at Constant Prices
Bangladesh Cambodia ROC Fiji Hong Kong India Indonesia Iran Japan Korea Lao PDR Malaysia Mongolia Nepal Pakistan Philippines Singapore Sri Lanka Thailand Vietnam Brunei China Myanmar US EU15
1970 ! ! ! ! ! ! ! ! ! ! ! ! ! ! ! ! ! ! ! ! ! ! ! ! ! 1970
1971 !9.8 n.a. 10.4 n.a. 12.2 !1.3 2.9 15.2 5.1 7.4 n.a. 12.7 n.a. n.a. 2.6 2.7 11.2 0.4 2.3 n.a. n.a. 4.0 4.3 3.7 4.2 1971
1972 !12.1 n.a. 11.9 n.a. 7.2 1.9 5.8 !1.1 8.5 6.8 n.a. 5.0 n.a. n.a. 2.2 2.4 7.6 3.0 6.4 n.a. n.a. 5.3 3.2 6.0 5.4 1972
1973 !5.0 n.a. 11.7 n.a. 12.5 4.4 2.2 16.2 8.2 8.8 n.a. 9.8 n.a. n.a. 6.2 4.0 3.9 5.8 7.3 n.a. n.a. 6.9 2.3 4.8 5.1 1973
1974 !4.1 n.a. 5.9 n.a. !2.2 !4.9 13.9 21.4 !0.7 7.2 n.a. 8.4 n.a. n.a. 8.3 6.3 10.6 6.5 4.9 n.a. n.a. 2.0 1.0 !1.1 1.6 1974
1975 2.8 n.a. 4.7 n.a. 3.5 8.4 12.5 26.2 3.9 4.3 n.a. !1.2 n.a. n.a. 3.9 6.2 3.0 2.0 5.0 n.a. n.a. 3.9 4.2 1.9 1.8 1975
1976 !8.5 n.a. 9.6 n.a. 7.3 3.1 5.7 0.8 3.1 8.4 n.a. 7.5 n.a. n.a. !1.4 4.9 2.6 5.3 8.2 n.a. n.a. 3.6 4.6 5.6 3.8 1976
1977 10.2 n.a. 7.3 n.a. 15.6 8.5 1.9 14.9 4.0 4.1 n.a. 9.0 n.a. n.a. 4.0 1.8 4.4 12.9 8.9 n.a. n.a. 2.7 3.1 4.1 2.8 1977
1978 3.5 n.a. 10.3 n.a. 16.0 2.0 9.6 !2.3 5.2 10.4 n.a. 9.4 n.a. n.a. 10.1 6.8 7.5 3.7 6.1 n.a. n.a. 4.0 3.4 4.1 3.4 1978
1979 1.9 n.a. 10.7 n.a. 9.1 !1.4 15.6 8.3 6.3 6.8 n.a. 10.6 n.a. n.a. 8.5 2.5 7.5 10.0 9.1 n.a. n.a. 6.7 3.4 2.4 3.6 1979
1980 1.3 n.a. 5.1 n.a. 11.5 14.8 16.6 !1.7 1.0 0.4 n.a. 11.3 n.a. n.a. 7.6 5.4 8.9 9.2 4.1 n.a. n.a. 8.6 7.9 !0.2 1.8 1980
1981 3.4 n.a. 3.8 n.a. 7.4 !0.7 15.1 0.8 1.7 6.0 n.a. 4.4 n.a. n.a. 4.6 3.0 4.2 11.8 1.1 n.a. n.a. 8.0 6.0 1.8 0.4 1981
1982 !1.8 n.a. 4.7 n.a. 5.2 2.6 4.3 9.1 4.5 5.2 n.a. 3.2 n.a. n.a. 4.4 4.1 !0.4 5.7 2.1 n.a. n.a. 6.6 7.4 1.6 1.1 1982
1983 !1.2 n.a. 5.6 n.a. 7.4 9.9 !10.9 10.5 3.2 9.3 n.a. 3.4 n.a. n.a. 4.2 2.3 4.4 3.8 8.2 n.a. n.a. 7.8 4.7 5.1 1.3 1983
1984 6.3 n.a. 8.0 n.a. 5.6 !0.3 6.6 1.6 2.9 7.4 n.a. 6.7 n.a. n.a. 6.2 !1.9 6.9 1.3 2.6 n.a. n.a. 11.3 8.6 5.5 1.7 1984
1985 3.2 n.a. 4.6 n.a. 4.2 3.9 2.0 4.3 4.0 6.8 n.a. 0.4 n.a. n.a. 8.0 !3.7 2.7 6.2 2.4 n.a. n.a. 12.7 1.7 5.0 2.5 1985
1986 2.1 n.a. 6.4 n.a. 8.1 2.0 4.4 !8.1 3.6 8.3 n.a. !10.3 n.a. n.a. !0.1 0.1 7.5 4.8 2.2 n.a. n.a. 4.6 !1.0 4.0 3.9 1986
1987 1.9 n.a. 9.9 n.a. 10.1 5.8 5.8 !17.3 4.3 8.1 n.a. 2.3 n.a. n.a. 4.2 8.6 10.8 0.5 11.7 !0.3 n.a. 5.8 !1.5 3.1 3.7 1987
1988 3.2 n.a. 12.3 n.a. 8.9 6.0 6.9 7.3 5.0 8.5 n.a. 10.9 n.a. n.a. 10.4 3.9 9.2 5.5 11.6 8.3 n.a. 7.5 !18.7 4.2 4.1 1988
1989 2.8 n.a. 12.5 n.a. 3.7 7.3 7.2 5.7 4.7 9.1 n.a. 12.2 n.a. n.a. 0.9 3.5 5.6 2.7 11.7 1.9 n.a. !0.2 3.1 3.2 3.6 1989
1990 7.7 n.a. 8.1 n.a. 6.1 6.1 16.0 2.4 5.1 9.7 n.a. 10.9 n.a. n.a. 4.1 4.7 9.9 7.2 7.9 1.5 18.3 3.6 0.1 2.3 2.7 1990
1991 !0.2 n.a. 6.6 n.a. 8.9 3.4 7.7 13.3 2.2 8.1 n.a. 8.5 n.a. n.a. !0.7 2.0 4.4 !0.1 3.8 5.9 !16.8 8.3 !1.7 0.2 2.0 1991
1992 1.4 n.a. 9.2 n.a. 8.0 2.8 5.9 3.7 2.1 6.3 n.a. 4.7 n.a. n.a. 11.2 2.0 6.0 9.9 8.0 3.9 42.2 12.5 9.8 3.4 1.8 1992
1993 1.0 n.a. 7.9 n.a. 7.5 6.7 7.9 !1.7 1.0 6.4 n.a. 6.2 n.a. n.a. 1.4 2.7 10.2 7.2 8.5 4.9 !10.8 8.1 6.9 3.8 !0.2 1993
1994 3.7 7.3 8.4 n.a. 6.2 3.2 7.5 !3.4 2.3 8.2 n.a. 8.9 n.a. n.a. 4.1 2.0 4.7 8.2 10.4 5.5 !8.5 4.5 3.1 3.9 2.0 1994
1995 4.8 6.8 5.8 n.a. 1.7 3.4 11.9 1.7 1.9 10.0 n.a. 10.9 n.a. n.a. 6.8 7.6 3.7 3.4 9.5 5.8 !23.3 7.5 7.7 2.8 1.8 1995
1996 2.2 10.0 6.7 n.a. 3.6 14.6 9.3 1.6 2.4 7.1 n.a. 6.9 n.a. n.a. 6.7 3.8 3.1 3.3 2.9 8.6 9.8 9.0 1.9 3.4 2.1 1996
1997 3.0 !1.6 6.6 n.a. 5.3 !0.2 7.4 9.8 0.7 3.8 n.a. 4.3 n.a. n.a. 4.0 5.4 6.2 4.8 !2.2 5.3 27.9 4.4 2.7 3.5 2.2 1997
1998 0.4 8.5 6.0 n.a. !5.7 6.8 !8.2 3.7 !0.9 !13.9 n.a. !9.3 n.a. n.a. 2.7 1.9 !4.3 8.6 !17.7 4.3 !6.6 5.7 2.3 5.0 3.4 1998
1999 1.6 6.4 4.8 n.a. 1.2 !0.9 3.4 3.4 1.0 11.2 n.a. 3.1 n.a. n.a. 6.7 !2.2 10.7 0.8 7.6 2.6 11.0 8.0 10.6 5.3 3.6 1999
2000 2.9 3.2 4.5 n.a. 4.9 7.3 3.4 8.4 0.7 9.1 n.a. 12.2 n.a. n.a. 0.5 2.5 14.1 3.9 9.9 3.3 !10.7 8.3 9.0 4.9 3.4 2000
2001 5.8 2.5 0.9 n.a. 1.8 5.5 3.6 7.7 1.6 4.9 n.a. 3.0 4.8 3.5 0.5 12.8 7.2 1.8 3.2 3.9 !15.4 5.5 15.4 2.7 2.1 2001
2002 3.1 4.6 3.3 n.a. !0.9 3.4 1.2 14.1 1.1 8.4 n.a. 3.8 7.9 3.1 1.4 4.9 5.2 8.3 6.5 8.1 4.4 6.3 13.8 2.7 1.5 2002
2003 5.1 7.5 3.0 n.a. !1.3 6.3 !6.8 7.3 0.4 !0.6 n.a. 7.8 !2.6 0.9 0.4 14.4 !3.3 8.0 3.6 6.9 13.7 6.3 13.0 3.0 1.6 2003
2004 2.8 11.9 5.2 n.a. 6.8 5.5 13.5 10.5 1.6 0.5 n.a. 9.4 1.7 4.6 9.7 4.9 7.5 3.5 5.3 6.9 14.0 7.1 10.1 3.4 1.9 2004
2005 5.2 11.6 3.0 n.a. 3.0 9.2 7.1 7.0 1.3 4.6 n.a. 8.7 5.9 5.3 12.1 7.8 3.7 2.1 6.1 4.0 15.8 7.6 11.1 3.3 1.9 2005
2006 4.1 6.4 1.6 n.a. 5.8 7.0 2.4 8.5 1.5 4.8 n.a. 6.6 6.0 3.1 1.0 !0.3 3.3 6.5 3.7 6.8 7.2 9.2 9.9 3.0 2.1 2006
2007 6.9 12.5 2.0 n.a. 8.2 9.3 7.0 8.7 1.6 4.9 n.a. 10.0 !1.1 1.3 4.6 4.1 6.8 4.1 !2.2 15.7 !2.0 9.7 4.7 2.2 1.9 2007
2008 7.5 7.8 !0.5 n.a. 2.3 9.0 10 5.5 !0.7 1.3 n.a. 8.2 11.4 5.5 !2.7 5.2 0.7 7.1 7.7 8.7 !12.9 8.6 1.2 !0.4 0.2 2008
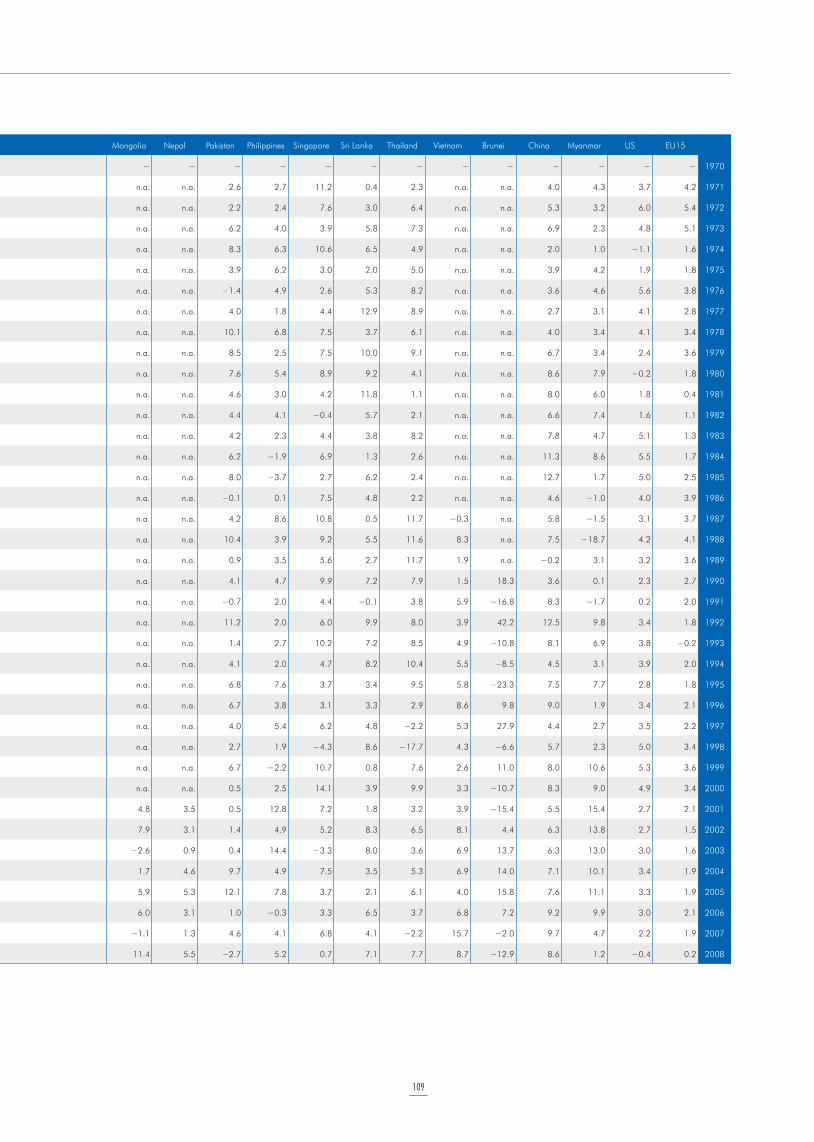
109
Bangladesh Cambodia ROC Fiji Hong Kong India Indonesia Iran Japan Korea Lao PDR Malaysia Mongolia Nepal Pakistan Philippines Singapore Sri Lanka Thailand Vietnam Brunei China Myanmar US EU15
1970 ! ! ! ! ! ! ! ! ! ! ! ! ! ! ! ! ! ! ! ! ! ! ! ! ! 1970
1971 !9.8 n.a. 10.4 n.a. 12.2 !1.3 2.9 15.2 5.1 7.4 n.a. 12.7 n.a. n.a. 2.6 2.7 11.2 0.4 2.3 n.a. n.a. 4.0 4.3 3.7 4.2 1971
1972 !12.1 n.a. 11.9 n.a. 7.2 1.9 5.8 !1.1 8.5 6.8 n.a. 5.0 n.a. n.a. 2.2 2.4 7.6 3.0 6.4 n.a. n.a. 5.3 3.2 6.0 5.4 1972
1973 !5.0 n.a. 11.7 n.a. 12.5 4.4 2.2 16.2 8.2 8.8 n.a. 9.8 n.a. n.a. 6.2 4.0 3.9 5.8 7.3 n.a. n.a. 6.9 2.3 4.8 5.1 1973
1974 !4.1 n.a. 5.9 n.a. !2.2 !4.9 13.9 21.4 !0.7 7.2 n.a. 8.4 n.a. n.a. 8.3 6.3 10.6 6.5 4.9 n.a. n.a. 2.0 1.0 !1.1 1.6 1974
1975 2.8 n.a. 4.7 n.a. 3.5 8.4 12.5 26.2 3.9 4.3 n.a. !1.2 n.a. n.a. 3.9 6.2 3.0 2.0 5.0 n.a. n.a. 3.9 4.2 1.9 1.8 1975
1976 !8.5 n.a. 9.6 n.a. 7.3 3.1 5.7 0.8 3.1 8.4 n.a. 7.5 n.a. n.a. !1.4 4.9 2.6 5.3 8.2 n.a. n.a. 3.6 4.6 5.6 3.8 1976
1977 10.2 n.a. 7.3 n.a. 15.6 8.5 1.9 14.9 4.0 4.1 n.a. 9.0 n.a. n.a. 4.0 1.8 4.4 12.9 8.9 n.a. n.a. 2.7 3.1 4.1 2.8 1977
1978 3.5 n.a. 10.3 n.a. 16.0 2.0 9.6 !2.3 5.2 10.4 n.a. 9.4 n.a. n.a. 10.1 6.8 7.5 3.7 6.1 n.a. n.a. 4.0 3.4 4.1 3.4 1978
1979 1.9 n.a. 10.7 n.a. 9.1 !1.4 15.6 8.3 6.3 6.8 n.a. 10.6 n.a. n.a. 8.5 2.5 7.5 10.0 9.1 n.a. n.a. 6.7 3.4 2.4 3.6 1979
1980 1.3 n.a. 5.1 n.a. 11.5 14.8 16.6 !1.7 1.0 0.4 n.a. 11.3 n.a. n.a. 7.6 5.4 8.9 9.2 4.1 n.a. n.a. 8.6 7.9 !0.2 1.8 1980
1981 3.4 n.a. 3.8 n.a. 7.4 !0.7 15.1 0.8 1.7 6.0 n.a. 4.4 n.a. n.a. 4.6 3.0 4.2 11.8 1.1 n.a. n.a. 8.0 6.0 1.8 0.4 1981
1982 !1.8 n.a. 4.7 n.a. 5.2 2.6 4.3 9.1 4.5 5.2 n.a. 3.2 n.a. n.a. 4.4 4.1 !0.4 5.7 2.1 n.a. n.a. 6.6 7.4 1.6 1.1 1982
1983 !1.2 n.a. 5.6 n.a. 7.4 9.9 !10.9 10.5 3.2 9.3 n.a. 3.4 n.a. n.a. 4.2 2.3 4.4 3.8 8.2 n.a. n.a. 7.8 4.7 5.1 1.3 1983
1984 6.3 n.a. 8.0 n.a. 5.6 !0.3 6.6 1.6 2.9 7.4 n.a. 6.7 n.a. n.a. 6.2 !1.9 6.9 1.3 2.6 n.a. n.a. 11.3 8.6 5.5 1.7 1984
1985 3.2 n.a. 4.6 n.a. 4.2 3.9 2.0 4.3 4.0 6.8 n.a. 0.4 n.a. n.a. 8.0 !3.7 2.7 6.2 2.4 n.a. n.a. 12.7 1.7 5.0 2.5 1985
1986 2.1 n.a. 6.4 n.a. 8.1 2.0 4.4 !8.1 3.6 8.3 n.a. !10.3 n.a. n.a. !0.1 0.1 7.5 4.8 2.2 n.a. n.a. 4.6 !1.0 4.0 3.9 1986
1987 1.9 n.a. 9.9 n.a. 10.1 5.8 5.8 !17.3 4.3 8.1 n.a. 2.3 n.a. n.a. 4.2 8.6 10.8 0.5 11.7 !0.3 n.a. 5.8 !1.5 3.1 3.7 1987
1988 3.2 n.a. 12.3 n.a. 8.9 6.0 6.9 7.3 5.0 8.5 n.a. 10.9 n.a. n.a. 10.4 3.9 9.2 5.5 11.6 8.3 n.a. 7.5 !18.7 4.2 4.1 1988
1989 2.8 n.a. 12.5 n.a. 3.7 7.3 7.2 5.7 4.7 9.1 n.a. 12.2 n.a. n.a. 0.9 3.5 5.6 2.7 11.7 1.9 n.a. !0.2 3.1 3.2 3.6 1989
1990 7.7 n.a. 8.1 n.a. 6.1 6.1 16.0 2.4 5.1 9.7 n.a. 10.9 n.a. n.a. 4.1 4.7 9.9 7.2 7.9 1.5 18.3 3.6 0.1 2.3 2.7 1990
1991 !0.2 n.a. 6.6 n.a. 8.9 3.4 7.7 13.3 2.2 8.1 n.a. 8.5 n.a. n.a. !0.7 2.0 4.4 !0.1 3.8 5.9 !16.8 8.3 !1.7 0.2 2.0 1991
1992 1.4 n.a. 9.2 n.a. 8.0 2.8 5.9 3.7 2.1 6.3 n.a. 4.7 n.a. n.a. 11.2 2.0 6.0 9.9 8.0 3.9 42.2 12.5 9.8 3.4 1.8 1992
1993 1.0 n.a. 7.9 n.a. 7.5 6.7 7.9 !1.7 1.0 6.4 n.a. 6.2 n.a. n.a. 1.4 2.7 10.2 7.2 8.5 4.9 !10.8 8.1 6.9 3.8 !0.2 1993
1994 3.7 7.3 8.4 n.a. 6.2 3.2 7.5 !3.4 2.3 8.2 n.a. 8.9 n.a. n.a. 4.1 2.0 4.7 8.2 10.4 5.5 !8.5 4.5 3.1 3.9 2.0 1994
1995 4.8 6.8 5.8 n.a. 1.7 3.4 11.9 1.7 1.9 10.0 n.a. 10.9 n.a. n.a. 6.8 7.6 3.7 3.4 9.5 5.8 !23.3 7.5 7.7 2.8 1.8 1995
1996 2.2 10.0 6.7 n.a. 3.6 14.6 9.3 1.6 2.4 7.1 n.a. 6.9 n.a. n.a. 6.7 3.8 3.1 3.3 2.9 8.6 9.8 9.0 1.9 3.4 2.1 1996
1997 3.0 !1.6 6.6 n.a. 5.3 !0.2 7.4 9.8 0.7 3.8 n.a. 4.3 n.a. n.a. 4.0 5.4 6.2 4.8 !2.2 5.3 27.9 4.4 2.7 3.5 2.2 1997
1998 0.4 8.5 6.0 n.a. !5.7 6.8 !8.2 3.7 !0.9 !13.9 n.a. !9.3 n.a. n.a. 2.7 1.9 !4.3 8.6 !17.7 4.3 !6.6 5.7 2.3 5.0 3.4 1998
1999 1.6 6.4 4.8 n.a. 1.2 !0.9 3.4 3.4 1.0 11.2 n.a. 3.1 n.a. n.a. 6.7 !2.2 10.7 0.8 7.6 2.6 11.0 8.0 10.6 5.3 3.6 1999
2000 2.9 3.2 4.5 n.a. 4.9 7.3 3.4 8.4 0.7 9.1 n.a. 12.2 n.a. n.a. 0.5 2.5 14.1 3.9 9.9 3.3 !10.7 8.3 9.0 4.9 3.4 2000
2001 5.8 2.5 0.9 n.a. 1.8 5.5 3.6 7.7 1.6 4.9 n.a. 3.0 4.8 3.5 0.5 12.8 7.2 1.8 3.2 3.9 !15.4 5.5 15.4 2.7 2.1 2001
2002 3.1 4.6 3.3 n.a. !0.9 3.4 1.2 14.1 1.1 8.4 n.a. 3.8 7.9 3.1 1.4 4.9 5.2 8.3 6.5 8.1 4.4 6.3 13.8 2.7 1.5 2002
2003 5.1 7.5 3.0 n.a. !1.3 6.3 !6.8 7.3 0.4 !0.6 n.a. 7.8 !2.6 0.9 0.4 14.4 !3.3 8.0 3.6 6.9 13.7 6.3 13.0 3.0 1.6 2003
2004 2.8 11.9 5.2 n.a. 6.8 5.5 13.5 10.5 1.6 0.5 n.a. 9.4 1.7 4.6 9.7 4.9 7.5 3.5 5.3 6.9 14.0 7.1 10.1 3.4 1.9 2004
2005 5.2 11.6 3.0 n.a. 3.0 9.2 7.1 7.0 1.3 4.6 n.a. 8.7 5.9 5.3 12.1 7.8 3.7 2.1 6.1 4.0 15.8 7.6 11.1 3.3 1.9 2005
2006 4.1 6.4 1.6 n.a. 5.8 7.0 2.4 8.5 1.5 4.8 n.a. 6.6 6.0 3.1 1.0 !0.3 3.3 6.5 3.7 6.8 7.2 9.2 9.9 3.0 2.1 2006
2007 6.9 12.5 2.0 n.a. 8.2 9.3 7.0 8.7 1.6 4.9 n.a. 10.0 !1.1 1.3 4.6 4.1 6.8 4.1 !2.2 15.7 !2.0 9.7 4.7 2.2 1.9 2007
2008 7.5 7.8 !0.5 n.a. 2.3 9.0 10 5.5 !0.7 1.3 n.a. 8.2 11.4 5.5 !2.7 5.2 0.7 7.1 7.7 8.7 !12.9 8.6 1.2 !0.4 0.2 2008
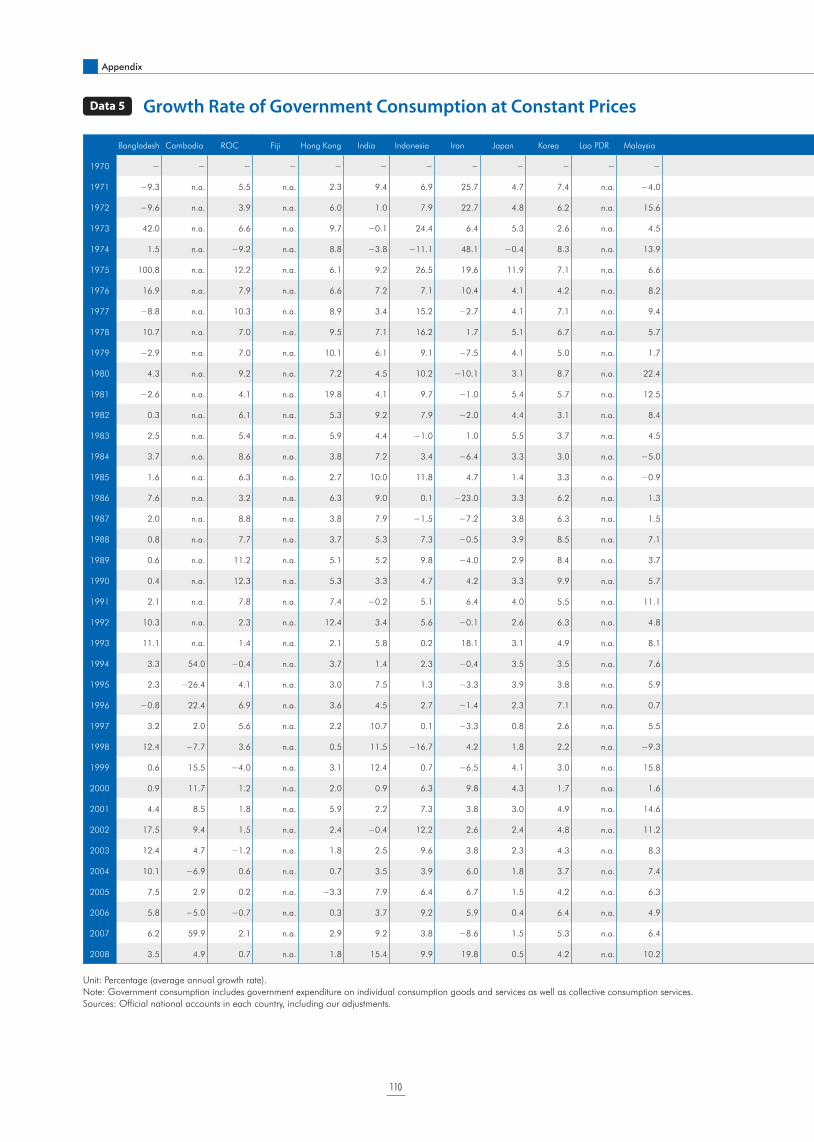
Appendix
110
Unit: Percentage (average annual growth rate).
Note: Government consumption includes government expenditure on individual consumption goods and services as well as collective consumption services.
Sources: Official national accounts in each country, including our adjustments.
Data 5 Growth Rate of Government Consumption at Constant Prices
Bangladesh Cambodia ROC Fiji Hong Kong India Indonesia Iran Japan Korea Lao PDR Malaysia Mongolia Nepal Pakistan Philippines Singapore Sri Lanka Thailand Vietnam Brunei China Myanmar US EU15
1970 ! ! ! ! ! ! ! ! ! ! ! ! ! ! ! ! ! ! ! ! ! ! ! ! ! 1970
1971 !9.3 n.a. 5.5 n.a. 2.3 9.4 6.9 25.7 4.7 7.4 n.a. !4.0 n.a. n.a. 4.6 7.4 15.7 5.1 4.4 n.a. n.a. 16.0 4.5 !2.6 4.9 1971
1972 !9.6 n.a. 3.9 n.a. 6.0 1.0 7.9 22.7 4.8 6.2 n.a. 15.6 n.a. n.a. 7.5 14.4 12.5 3.8 3.1 n.a. n.a. 4.9 1.3 !0.9 4.7 1972
1973 42.0 n.a. 6.6 n.a. 9.7 !0.1 24.4 6.4 5.3 2.6 n.a. 4.5 n.a. n.a. !4.2 10.4 5.3 18.8 7.6 n.a. n.a. 2.4 !2.7 !0.5 4.7 1973
1974 1.5 n.a. !9.2 n.a. 8.8 !3.8 !11.1 48.1 !0.4 8.3 n.a. 13.9 n.a. n.a. !6.0 13.2 0.1 1.9 !0.7 n.a. n.a. 7.1 6.0 2.5 4.4 1974
1975 100.8 n.a. 12.2 n.a. 6.1 9.2 26.5 19.6 11.9 7.1 n.a. 6.6 n.a. n.a. 10.2 5.4 2.7 !10.7 13.2 n.a. n.a. 4.3 4.0 2.0 4.7 1975
1976 16.9 n.a. 7.9 n.a. 6.6 7.2 7.1 10.4 4.1 4.2 n.a. 8.2 n.a. n.a. 26.6 2.1 4.9 2.5 17.9 n.a. n.a. 6.3 4.3 0.6 3.3 1976
1977 !8.8 n.a. 10.3 n.a. 8.9 3.4 15.2 !2.7 4.1 7.1 n.a. 9.4 n.a. n.a. 4.1 0.9 8.8 7.9 9.8 n.a. n.a. 7.0 4.7 1.1 2.3 1977
1978 10.7 n.a. 7.0 n.a. 9.5 7.1 16.2 1.7 5.1 6.7 n.a. 5.7 n.a. n.a. 4.8 3.0 10.9 24.8 12.2 n.a. n.a. 15.6 2.8 3.2 4.1 1978
1979 !2.9 n.a. 7.0 n.a. 10.1 6.1 9.1 !7.5 4.1 5.0 n.a. 1.7 n.a. n.a. 3.9 3.6 !0.5 0.9 14.4 n.a. n.a. 25.1 2.0 2.1 3.3 1979
1980 4.3 n.a. 9.2 n.a. 7.2 4.5 10.2 !10.1 3.1 8.7 n.a. 22.4 n.a. n.a. 4.4 3.7 9.0 !1.7 6.2 n.a. n.a. 3.9 7.3 2.2 2.8 1980
1981 !2.6 n.a. 4.1 n.a. 19.8 4.1 9.7 !1.0 5.4 5.7 n.a. 12.5 n.a. n.a. 11.4 !3.0 5.1 !0.9 13.9 n.a. n.a. 7.5 5.7 1.1 3.0 1981
1982 0.3 n.a. 6.1 n.a. 5.3 9.2 7.9 !2.0 4.4 3.1 n.a. 8.4 n.a. n.a. 8.4 7.2 12.4 15.8 1.2 n.a. n.a. 10.5 18.1 1.5 1.7 1982
1983 2.5 n.a. 5.4 n.a. 5.9 4.4 !1.0 1.0 5.5 3.7 n.a. 4.5 n.a. n.a. 16.4 !4.8 9.2 !7.1 5.1 n.a. n.a. 9.8 !6.6 3.5 1.7 1983
1984 3.7 n.a. 8.6 n.a. 3.8 7.2 3.4 !6.4 3.3 3.0 n.a. !5.0 n.a. n.a. 11.7 !12.6 5.1 0.9 7.8 n.a. n.a. 20.3 2.0 3.4 1.3 1984
1985 1.6 n.a. 6.3 n.a. 2.7 10.0 11.8 4.7 1.4 3.3 n.a. !0.9 n.a. n.a. 6.5 !1.0 21.9 21.0 6.6 n.a. n.a. 13.2 5.5 6.1 2.1 1985
1986 7.6 n.a. 3.2 n.a. 6.3 9.0 0.1 !23.0 3.3 6.2 n.a. 1.3 n.a. n.a. 9.6 0.3 1.1 15.9 !0.7 n.a. n.a. 12.7 0.6 5.0 2.2 1986
1987 2.0 n.a. 8.8 n.a. 3.8 7.9 !1.5 !7.2 3.8 6.3 n.a. 1.5 n.a. n.a. 12.4 4.7 0.8 2.3 0.3 7.6 n.a. 7.1 !13.1 3.1 2.4 1987
1988 0.8 n.a. 7.7 n.a. 3.7 5.3 7.3 !0.5 3.9 8.5 n.a. 7.1 n.a. n.a. 4.3 8.7 !6.3 0.1 4.0 8.8 n.a. 5.4 16.7 1.3 1.9 1988
1989 0.6 n.a. 11.2 n.a. 5.1 5.2 9.8 !4.0 2.9 8.4 n.a. 3.7 n.a. n.a. 18.6 6.8 5.4 !5.7 2.6 10.9 n.a. 4.6 !14.8 2.9 0.9 1989
1990 0.4 n.a. 12.3 n.a. 5.3 3.3 4.7 4.2 3.3 9.9 n.a. 5.7 n.a. n.a. !3.2 6.5 10.3 4.3 6.7 10.5 2.3 10.1 11.3 3.2 2.5 1990
1991 2.1 n.a. 7.8 n.a. 7.4 !0.2 5.1 6.4 4.0 5.5 n.a. 11.1 n.a. n.a. !0.5 0.7 7.5 8.9 6.0 8.1 !0.2 19.0 !16.8 1.1 3.1 1991
1992 10.3 n.a. 2.3 n.a. 12.4 3.4 5.6 !0.1 2.6 6.3 n.a. 4.8 n.a. n.a. !8.2 !3.7 0.4 0.4 6.2 7.2 5.9 14.1 !7.9 0.4 2.5 1992
1993 11.1 n.a. 1.4 n.a. 2.1 5.8 0.2 18.1 3.1 4.9 n.a. 8.1 n.a. n.a. 16.3 6.0 13.7 2.8 5.0 12.1 4.2 10.0 10.8 !0.9 0.7 1993
1994 3.3 54.0 !0.4 n.a. 3.7 1.4 2.3 !0.4 3.5 3.5 n.a. 7.6 n.a. n.a. !10.8 5.9 !1.7 3.6 7.9 9.9 2.6 10.0 !15.5 0.1 0.9 1994
1995 2.3 !26.4 4.1 n.a. 3.0 7.5 1.3 !3.3 3.9 3.8 n.a. 5.9 n.a. n.a. 5.3 5.4 11.1 8.5 5.1 8.1 2.3 7.0 1.8 0.6 0.7 1995
1996 !0.8 22.4 6.9 n.a. 3.6 4.5 2.7 !1.4 2.3 7.1 n.a. 0.7 n.a. n.a. 6.6 4.0 18.0 8.2 11.4 7.2 1.6 10.4 12.8 1.0 1.5 1996
1997 3.2 2.0 5.6 n.a. 2.2 10.7 0.1 !3.3 0.8 2.6 n.a. 5.5 n.a. n.a. !8.7 4.5 7.1 6.9 !2.9 3.9 1.6 7.3 6.6 1.8 0.9 1997
1998 12.4 !7.7 3.6 n.a. 0.5 11.5 !16.7 4.2 1.8 2.2 n.a. !9.3 n.a. n.a. 6.6 !2.0 8.0 5.0 3.8 3.2 !4.0 9.3 8.2 2.0 1.4 1998
1999 0.6 15.5 !4.0 n.a. 3.1 12.4 0.7 !6.5 4.1 3.0 n.a. 15.8 n.a. n.a. !7.2 6.5 6.4 3.8 3.0 !5.9 2.0 8.6 !2.1 3.4 2.2 1999
2000 0.9 11.7 1.2 n.a. 2.0 0.9 6.3 9.8 4.3 1.7 n.a. 1.6 n.a. n.a. 7.3 6.0 16.9 5.2 2.2 4.9 7.4 11.2 2.3 2.0 2.4 2000
2001 4.4 8.5 1.8 n.a. 5.9 2.2 7.3 3.8 3.0 4.9 n.a. 14.6 7.8 7.5 !5.8 !5.5 4.0 !1.7 2.5 6.4 8.9 11.1 1.1 4.0 2.1 2001
2002 17.5 9.4 1.5 n.a. 2.4 !0.4 12.2 2.6 2.4 4.8 n.a. 11.2 6.0 10.0 14.0 !3.9 6.3 !1.8 0.7 5.2 !2.0 8.4 1.0 4.5 2.6 2002
2003 12.4 4.7 !1.2 n.a. 1.8 2.5 9.6 3.8 2.3 4.3 n.a. 8.3 3.3 8.4 7.0 2.6 1.0 4.7 2.4 6.9 !2.6 6.6 11.8 2.3 2.0 2003
2004 10.1 !6.9 0.6 n.a. 0.7 3.5 3.9 6.0 1.8 3.7 n.a. 7.4 13.6 1.2 1.4 1.4 0.4 8.9 5.6 7.5 4.1 8.2 11.4 1.5 1.9 2004
2005 7.5 2.9 0.2 n.a. !3.3 7.9 6.4 6.7 1.5 4.2 n.a. 6.3 0.6 0.8 1.7 2.3 5.0 11.3 10.7 7.9 !1.1 9.3 11.1 0.4 1.6 2005
2006 5.8 !5.0 !0.7 n.a. 0.3 3.7 9.2 5.9 0.4 6.4 n.a. 4.9 15.1 6.9 39.4 9.9 7.0 9.2 2.2 8.2 12.1 8.5 !26.4 1.4 1.8 2006
2007 6.2 59.9 2.1 n.a. 2.9 9.2 3.8 !8.6 1.5 5.3 n.a. 6.4 17.8 3.2 !10.1 6.4 2.9 7.1 9.2 8.5 14.6 9.5 !3.8 1.3 2.1 2007
2008 3.5 4.9 0.7 n.a. 1.8 15.4 9.9 19.8 0.5 4.2 n.a. 10.2 24.1 9.3 32.8 3.2 8.1 9.3 4.5 7.3 !0.8 8.8 !1.5 2.9 2.1 2008

111
Bangladesh Cambodia ROC Fiji Hong Kong India Indonesia Iran Japan Korea Lao PDR Malaysia Mongolia Nepal Pakistan Philippines Singapore Sri Lanka Thailand Vietnam Brunei China Myanmar US EU15
1970 ! ! ! ! ! ! ! ! ! ! ! ! ! ! ! ! ! ! ! ! ! ! ! ! ! 1970
1971 !9.3 n.a. 5.5 n.a. 2.3 9.4 6.9 25.7 4.7 7.4 n.a. !4.0 n.a. n.a. 4.6 7.4 15.7 5.1 4.4 n.a. n.a. 16.0 4.5 !2.6 4.9 1971
1972 !9.6 n.a. 3.9 n.a. 6.0 1.0 7.9 22.7 4.8 6.2 n.a. 15.6 n.a. n.a. 7.5 14.4 12.5 3.8 3.1 n.a. n.a. 4.9 1.3 !0.9 4.7 1972
1973 42.0 n.a. 6.6 n.a. 9.7 !0.1 24.4 6.4 5.3 2.6 n.a. 4.5 n.a. n.a. !4.2 10.4 5.3 18.8 7.6 n.a. n.a. 2.4 !2.7 !0.5 4.7 1973
1974 1.5 n.a. !9.2 n.a. 8.8 !3.8 !11.1 48.1 !0.4 8.3 n.a. 13.9 n.a. n.a. !6.0 13.2 0.1 1.9 !0.7 n.a. n.a. 7.1 6.0 2.5 4.4 1974
1975 100.8 n.a. 12.2 n.a. 6.1 9.2 26.5 19.6 11.9 7.1 n.a. 6.6 n.a. n.a. 10.2 5.4 2.7 !10.7 13.2 n.a. n.a. 4.3 4.0 2.0 4.7 1975
1976 16.9 n.a. 7.9 n.a. 6.6 7.2 7.1 10.4 4.1 4.2 n.a. 8.2 n.a. n.a. 26.6 2.1 4.9 2.5 17.9 n.a. n.a. 6.3 4.3 0.6 3.3 1976
1977 !8.8 n.a. 10.3 n.a. 8.9 3.4 15.2 !2.7 4.1 7.1 n.a. 9.4 n.a. n.a. 4.1 0.9 8.8 7.9 9.8 n.a. n.a. 7.0 4.7 1.1 2.3 1977
1978 10.7 n.a. 7.0 n.a. 9.5 7.1 16.2 1.7 5.1 6.7 n.a. 5.7 n.a. n.a. 4.8 3.0 10.9 24.8 12.2 n.a. n.a. 15.6 2.8 3.2 4.1 1978
1979 !2.9 n.a. 7.0 n.a. 10.1 6.1 9.1 !7.5 4.1 5.0 n.a. 1.7 n.a. n.a. 3.9 3.6 !0.5 0.9 14.4 n.a. n.a. 25.1 2.0 2.1 3.3 1979
1980 4.3 n.a. 9.2 n.a. 7.2 4.5 10.2 !10.1 3.1 8.7 n.a. 22.4 n.a. n.a. 4.4 3.7 9.0 !1.7 6.2 n.a. n.a. 3.9 7.3 2.2 2.8 1980
1981 !2.6 n.a. 4.1 n.a. 19.8 4.1 9.7 !1.0 5.4 5.7 n.a. 12.5 n.a. n.a. 11.4 !3.0 5.1 !0.9 13.9 n.a. n.a. 7.5 5.7 1.1 3.0 1981
1982 0.3 n.a. 6.1 n.a. 5.3 9.2 7.9 !2.0 4.4 3.1 n.a. 8.4 n.a. n.a. 8.4 7.2 12.4 15.8 1.2 n.a. n.a. 10.5 18.1 1.5 1.7 1982
1983 2.5 n.a. 5.4 n.a. 5.9 4.4 !1.0 1.0 5.5 3.7 n.a. 4.5 n.a. n.a. 16.4 !4.8 9.2 !7.1 5.1 n.a. n.a. 9.8 !6.6 3.5 1.7 1983
1984 3.7 n.a. 8.6 n.a. 3.8 7.2 3.4 !6.4 3.3 3.0 n.a. !5.0 n.a. n.a. 11.7 !12.6 5.1 0.9 7.8 n.a. n.a. 20.3 2.0 3.4 1.3 1984
1985 1.6 n.a. 6.3 n.a. 2.7 10.0 11.8 4.7 1.4 3.3 n.a. !0.9 n.a. n.a. 6.5 !1.0 21.9 21.0 6.6 n.a. n.a. 13.2 5.5 6.1 2.1 1985
1986 7.6 n.a. 3.2 n.a. 6.3 9.0 0.1 !23.0 3.3 6.2 n.a. 1.3 n.a. n.a. 9.6 0.3 1.1 15.9 !0.7 n.a. n.a. 12.7 0.6 5.0 2.2 1986
1987 2.0 n.a. 8.8 n.a. 3.8 7.9 !1.5 !7.2 3.8 6.3 n.a. 1.5 n.a. n.a. 12.4 4.7 0.8 2.3 0.3 7.6 n.a. 7.1 !13.1 3.1 2.4 1987
1988 0.8 n.a. 7.7 n.a. 3.7 5.3 7.3 !0.5 3.9 8.5 n.a. 7.1 n.a. n.a. 4.3 8.7 !6.3 0.1 4.0 8.8 n.a. 5.4 16.7 1.3 1.9 1988
1989 0.6 n.a. 11.2 n.a. 5.1 5.2 9.8 !4.0 2.9 8.4 n.a. 3.7 n.a. n.a. 18.6 6.8 5.4 !5.7 2.6 10.9 n.a. 4.6 !14.8 2.9 0.9 1989
1990 0.4 n.a. 12.3 n.a. 5.3 3.3 4.7 4.2 3.3 9.9 n.a. 5.7 n.a. n.a. !3.2 6.5 10.3 4.3 6.7 10.5 2.3 10.1 11.3 3.2 2.5 1990
1991 2.1 n.a. 7.8 n.a. 7.4 !0.2 5.1 6.4 4.0 5.5 n.a. 11.1 n.a. n.a. !0.5 0.7 7.5 8.9 6.0 8.1 !0.2 19.0 !16.8 1.1 3.1 1991
1992 10.3 n.a. 2.3 n.a. 12.4 3.4 5.6 !0.1 2.6 6.3 n.a. 4.8 n.a. n.a. !8.2 !3.7 0.4 0.4 6.2 7.2 5.9 14.1 !7.9 0.4 2.5 1992
1993 11.1 n.a. 1.4 n.a. 2.1 5.8 0.2 18.1 3.1 4.9 n.a. 8.1 n.a. n.a. 16.3 6.0 13.7 2.8 5.0 12.1 4.2 10.0 10.8 !0.9 0.7 1993
1994 3.3 54.0 !0.4 n.a. 3.7 1.4 2.3 !0.4 3.5 3.5 n.a. 7.6 n.a. n.a. !10.8 5.9 !1.7 3.6 7.9 9.9 2.6 10.0 !15.5 0.1 0.9 1994
1995 2.3 !26.4 4.1 n.a. 3.0 7.5 1.3 !3.3 3.9 3.8 n.a. 5.9 n.a. n.a. 5.3 5.4 11.1 8.5 5.1 8.1 2.3 7.0 1.8 0.6 0.7 1995
1996 !0.8 22.4 6.9 n.a. 3.6 4.5 2.7 !1.4 2.3 7.1 n.a. 0.7 n.a. n.a. 6.6 4.0 18.0 8.2 11.4 7.2 1.6 10.4 12.8 1.0 1.5 1996
1997 3.2 2.0 5.6 n.a. 2.2 10.7 0.1 !3.3 0.8 2.6 n.a. 5.5 n.a. n.a. !8.7 4.5 7.1 6.9 !2.9 3.9 1.6 7.3 6.6 1.8 0.9 1997
1998 12.4 !7.7 3.6 n.a. 0.5 11.5 !16.7 4.2 1.8 2.2 n.a. !9.3 n.a. n.a. 6.6 !2.0 8.0 5.0 3.8 3.2 !4.0 9.3 8.2 2.0 1.4 1998
1999 0.6 15.5 !4.0 n.a. 3.1 12.4 0.7 !6.5 4.1 3.0 n.a. 15.8 n.a. n.a. !7.2 6.5 6.4 3.8 3.0 !5.9 2.0 8.6 !2.1 3.4 2.2 1999
2000 0.9 11.7 1.2 n.a. 2.0 0.9 6.3 9.8 4.3 1.7 n.a. 1.6 n.a. n.a. 7.3 6.0 16.9 5.2 2.2 4.9 7.4 11.2 2.3 2.0 2.4 2000
2001 4.4 8.5 1.8 n.a. 5.9 2.2 7.3 3.8 3.0 4.9 n.a. 14.6 7.8 7.5 !5.8 !5.5 4.0 !1.7 2.5 6.4 8.9 11.1 1.1 4.0 2.1 2001
2002 17.5 9.4 1.5 n.a. 2.4 !0.4 12.2 2.6 2.4 4.8 n.a. 11.2 6.0 10.0 14.0 !3.9 6.3 !1.8 0.7 5.2 !2.0 8.4 1.0 4.5 2.6 2002
2003 12.4 4.7 !1.2 n.a. 1.8 2.5 9.6 3.8 2.3 4.3 n.a. 8.3 3.3 8.4 7.0 2.6 1.0 4.7 2.4 6.9 !2.6 6.6 11.8 2.3 2.0 2003
2004 10.1 !6.9 0.6 n.a. 0.7 3.5 3.9 6.0 1.8 3.7 n.a. 7.4 13.6 1.2 1.4 1.4 0.4 8.9 5.6 7.5 4.1 8.2 11.4 1.5 1.9 2004
2005 7.5 2.9 0.2 n.a. !3.3 7.9 6.4 6.7 1.5 4.2 n.a. 6.3 0.6 0.8 1.7 2.3 5.0 11.3 10.7 7.9 !1.1 9.3 11.1 0.4 1.6 2005
2006 5.8 !5.0 !0.7 n.a. 0.3 3.7 9.2 5.9 0.4 6.4 n.a. 4.9 15.1 6.9 39.4 9.9 7.0 9.2 2.2 8.2 12.1 8.5 !26.4 1.4 1.8 2006
2007 6.2 59.9 2.1 n.a. 2.9 9.2 3.8 !8.6 1.5 5.3 n.a. 6.4 17.8 3.2 !10.1 6.4 2.9 7.1 9.2 8.5 14.6 9.5 !3.8 1.3 2.1 2007
2008 3.5 4.9 0.7 n.a. 1.8 15.4 9.9 19.8 0.5 4.2 n.a. 10.2 24.1 9.3 32.8 3.2 8.1 9.3 4.5 7.3 !0.8 8.8 !1.5 2.9 2.1 2008
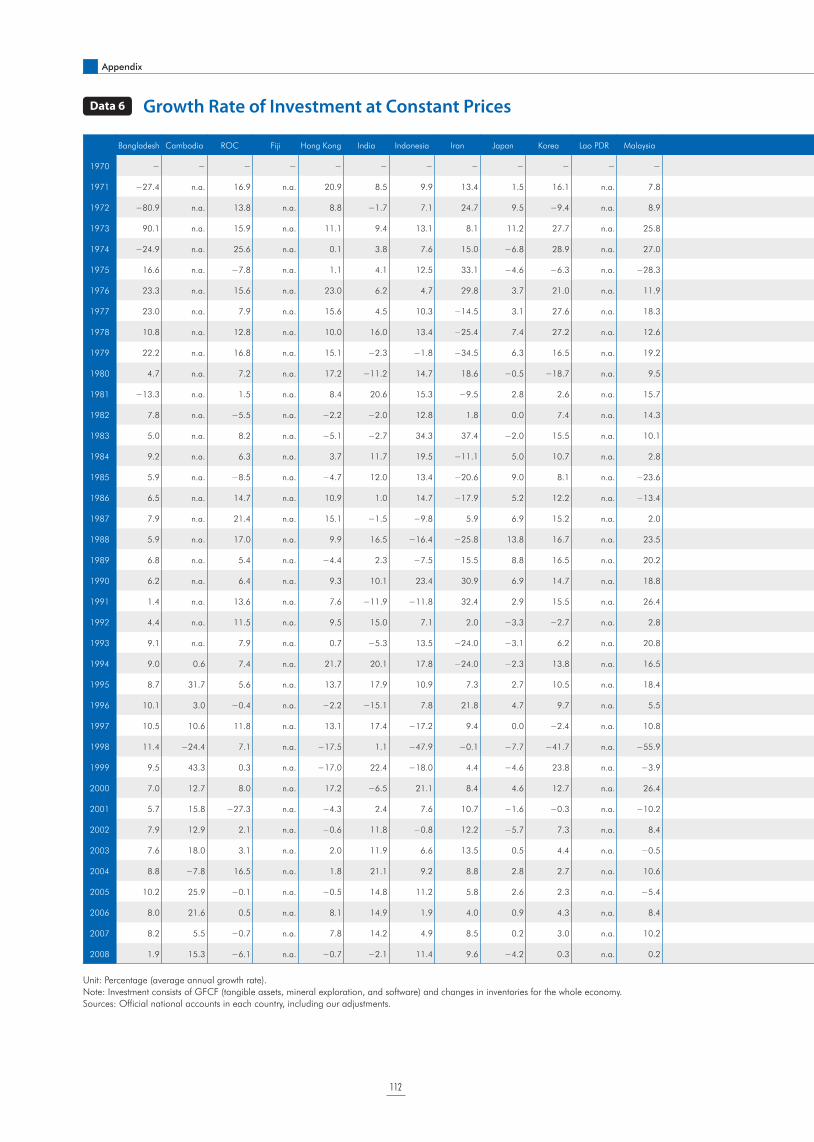
Appendix
112
Unit: Percentage (average annual growth rate).
Note: Investment consists of GFCF (tangible assets, mineral exploration, and software) and changes in inventories for the whole economy.
Sources: Official national accounts in each country, including our adjustments.
Data 6 Growth Rate of Investment at Constant Prices
Bangladesh Cambodia ROC Fiji Hong Kong India Indonesia Iran Japan Korea Lao PDR Malaysia Mongolia Nepal Pakistan Philippines Singapore Sri Lanka Thailand Vietnam Brunei China Myanmar US EU15
1970 ! ! ! ! ! ! ! ! ! ! ! ! ! ! ! ! ! ! ! ! ! ! ! ! ! 1970
1971 !27.4 n.a. 16.9 n.a. 20.9 8.5 9.9 13.4 1.5 16.1 n.a. 7.8 n.a. n.a. !3.5 7.9 15.4 !6.8 !0.3 n.a. n.a. 8.8 !16.2 6.3 !0.2 1971
1972 !80.9 n.a. 13.8 n.a. 8.8 !1.7 7.1 24.7 9.5 !9.4 n.a. 8.9 n.a. n.a. !6.0 2.2 12.9 2.9 !1.3 n.a. n.a. !4.0 5.3 7.8 3.5 1972
1973 90.1 n.a. 15.9 n.a. 11.1 9.4 13.1 8.1 11.2 27.7 n.a. 25.8 n.a. n.a. 1.1 5.1 9.8 1.8 15.1 n.a. n.a. 13.0 !10.6 9.2 8.7 1973
1974 !24.9 n.a. 25.6 n.a. 0.1 3.8 7.6 15.0 !6.8 28.9 n.a. 27.0 n.a. n.a. 7.8 24.8 16.9 3.6 !1.5 n.a. n.a. 3.7 !5.3 !5.6 !0.5 1974
1975 16.6 n.a. !7.8 n.a. 1.1 4.1 12.5 33.1 !4.6 !6.3 n.a. !28.3 n.a. n.a. 2.2 23.8 !9.9 4.8 !0.1 n.a. n.a. 11.7 7.1 !14.6 !11.8 1975
1976 23.3 n.a. 15.6 n.a. 23.0 6.2 4.7 29.8 3.7 21.0 n.a. 11.9 n.a. n.a. 27.6 14.2 6.7 11.0 9.9 n.a. n.a. !6.8 6.1 14.5 8.3 1976
1977 23.0 n.a. 7.9 n.a. 15.6 4.5 10.3 !14.5 3.1 27.6 n.a. 18.3 n.a. n.a. 8.0 0.9 !4.4 4.2 21.7 13.1 n.a. 8.7 22.2 11.1 !0.4 1977
1978 10.8 n.a. 12.8 n.a. 10.0 16.0 13.4 !25.4 7.4 27.2 n.a. 12.6 n.a. n.a. !0.4 8.1 15.9 24.3 11.8 !2.9 n.a. 22.0 31.5 10.6 0.3 1978
1979 22.2 n.a. 16.8 n.a. 15.1 !2.3 !1.8 !34.5 6.3 16.5 n.a. 19.2 n.a. n.a. !1.8 11.2 19.9 13.5 1.4 !3.9 n.a. 4.6 16.9 3.4 5.5 1979
1980 4.7 n.a. 7.2 n.a. 17.2 !11.2 14.7 18.6 !0.5 !18.7 n.a. 9.5 n.a. n.a. 2.3 6.6 14.9 15.0 11.5 !11.1 n.a. 5.4 6.5 !9.1 0.9 1980
1981 !13.3 n.a. 1.5 n.a. 8.4 20.6 15.3 !9.5 2.8 2.6 n.a. 15.7 n.a. n.a. !0.4 9.1 7.3 7.8 7.2 !19.5 n.a. !1.3 12.2 6.6 !9.5 1981
1982 7.8 n.a. !5.5 n.a. !2.2 !2.0 12.8 1.8 0.0 7.4 n.a. 14.3 n.a. n.a. 11.3 5.8 13.2 !2.0 !3.3 7.3 n.a. 7.1 1.0 !12.9 0.4 1982
1983 5.0 n.a. 8.2 n.a. !5.1 !2.7 34.3 37.4 !2.0 15.5 n.a. 10.1 n.a. n.a. 7.8 7.2 10.0 !2.4 16.4 9.8 n.a. 11.2 !15.9 8.7 0.0 1983
1984 9.2 n.a. 6.3 n.a. 3.7 11.7 19.5 !11.1 5.0 10.7 n.a. 2.8 n.a. n.a. 4.9 !31.2 9.8 !10.3 5.5 19.9 n.a. 14.6 !10.5 23.1 3.4 1984
1985 5.9 n.a. !8.5 n.a. !4.7 12.0 13.4 !20.6 9.0 8.1 n.a. !23.6 n.a. n.a. 9.8 !37.0 !13.6 4.8 !3.6 31.7 n.a. 21.3 7.1 1.5 2.6 1985
1986 6.5 n.a. 14.7 n.a. 10.9 1.0 14.7 !17.9 5.2 12.2 n.a. !13.4 n.a. n.a. 4.5 1.9 !10.2 !5.0 !2.2 14.6 n.a. 11.1 !21.2 1.0 4.1 1986
1987 7.9 n.a. 21.4 n.a. 15.1 !1.5 !9.8 5.9 6.9 15.2 n.a. 2.0 n.a. n.a. 4.3 8.2 7.8 4.6 17.1 19.2 n.a. 8.0 !1.8 3.6 4.2 1987
1988 5.9 n.a. 17.0 n.a. 9.9 16.5 !16.4 !25.8 13.8 16.7 n.a. 23.5 n.a. n.a. !1.2 12.1 2.0 !5.9 22.3 0.7 n.a. 10.6 !4.5 1.5 10.2 1988
1989 6.8 n.a. 5.4 n.a. !4.4 2.3 !7.5 15.5 8.8 16.5 n.a. 20.2 n.a. n.a. 7.2 21.1 12.3 0.9 18.2 1.8 n.a. 1.7 !2.9 3.8 6.9 1989
1990 6.2 n.a. 6.4 n.a. 9.3 10.1 23.4 30.9 6.9 14.7 n.a. 18.8 n.a. n.a. 5.1 14.5 14.6 !1.8 26.4 3.7 5.4 1.6 24.2 !1.6 3.1 1990
1991 1.4 n.a. 13.6 n.a. 7.6 !11.9 !11.8 32.4 2.9 15.5 n.a. 26.4 n.a. n.a. 1.2 !17.0 3.6 4.4 12.2 5.9 8.2 7.9 16.4 !6.7 !0.4 1991
1992 4.4 n.a. 11.5 n.a. 9.5 15.0 7.1 2.0 !3.3 !2.7 n.a. 2.8 n.a. n.a. 11.8 4.5 9.4 7.5 5.9 20.4 16.2 12.1 1.6 6.3 !1.3 1992
1993 9.1 n.a. 7.9 n.a. 0.7 !5.3 13.5 !24.0 !3.1 6.2 n.a. 20.8 n.a. n.a. 4.0 8.1 16.1 13.5 8.7 36.0 18.4 21.6 8.2 6.1 !7.7 1993
1994 9.0 0.6 7.4 n.a. 21.7 20.1 17.8 !24.0 !2.3 13.8 n.a. 16.5 n.a. n.a. !0.7 7.5 0.8 10.7 10.5 15.9 !10.7 15.6 21.9 10.2 5.2 1994
1995 8.7 31.7 5.6 n.a. 13.7 17.9 10.9 7.3 2.7 10.5 n.a. 18.4 n.a. n.a. 4.1 4.3 14.1 !7.4 11.9 14.8 7.5 15.9 24.9 2.7 5.0 1995
1996 10.1 3.0 !0.4 n.a. !2.2 !15.1 7.8 21.8 4.7 9.7 n.a. 5.5 n.a. n.a. 5.5 11.5 12.5 8.4 6.1 13.2 62.1 8.6 11.0 7.5 0.2 1996
1997 10.5 10.6 11.8 n.a. 13.1 17.4 !17.2 9.4 0.0 !2.4 n.a. 10.8 n.a. n.a. !3.8 10.9 16.3 6.7 !23.5 9.4 !47.4 2.9 10.9 10.2 4.5 1997
1998 11.4 !24.4 7.1 n.a. !17.5 1.1 !47.9 !0.1 !7.7 !41.7 n.a. !55.9 n.a. n.a. !0.3 !13.3 !22.7 11.3 !63.0 11.8 !13.3 5.0 14.7 8.6 8.1 1998
1999 9.5 43.3 0.3 n.a. !17.0 22.4 !18.0 4.4 !4.6 23.8 n.a. !3.9 n.a. n.a. !6.8 !2.1 6.9 2.0 1.7 1.5 !19.6 5.8 16.7 8.2 5.0 1999
2000 7.0 12.7 8.0 n.a. 17.2 !6.5 21.1 8.4 4.6 12.7 n.a. 26.4 n.a. n.a. 5.0 19.1 21.4 7.6 7.7 9.7 !28.1 4.7 10.8 6.0 5.0 2000
2001 5.7 15.8 !27.3 n.a. !4.3 2.4 7.6 10.7 !1.6 !0.3 n.a. !10.2 !4.0 !10.1 4.4 !12.1 !20.8 !10.5 1.8 10.2 6.6 12.7 6.4 !5.5 !0.3 2001
2002 7.9 12.9 2.1 n.a. !0.6 11.8 !0.8 12.2 !5.7 7.3 n.a. 8.4 2.5 4.3 !0.1 0.4 !8.2 7.7 6.3 12.0 34.4 13.2 8.3 !0.2 !1.8 2002
2003 7.6 18.0 3.1 n.a. 2.0 11.9 6.6 13.5 0.5 4.4 n.a. !0.5 38.1 13.0 5.5 3.6 !29.6 11.1 12.0 11.2 !20.2 18.3 23.7 3.2 2.0 2003
2004 8.8 !7.8 16.5 n.a. 1.8 21.1 9.2 8.8 2.8 2.7 n.a. 10.6 16.2 7.2 !5.5 2.9 35.4 17.4 12.2 10.1 4.0 15.3 20.2 8.0 3.2 2004
2005 10.2 25.9 !0.1 n.a. !0.5 14.8 11.2 5.8 2.6 2.3 n.a. !5.4 29.0 5.7 12.1 !7.2 !0.4 11.2 10.8 10.0 2.7 10.1 23.0 4.4 2.8 2005
2006 8.0 21.6 0.5 n.a. 8.1 14.9 1.9 4.0 0.9 4.3 n.a. 8.4 20.3 5.0 17.1 4.2 14.1 10.9 0.7 10.4 2.7 15.6 24.8 2.7 6.0 2006
2007 8.2 5.5 !0.7 n.a. 7.8 14.2 4.9 8.5 0.2 3.0 n.a. 10.2 21.4 21.0 12.4 10.7 11.7 8.9 1.6 22.6 20.4 13.9 3.8 !2.4 5.2 2007
2008 1.9 15.3 !6.1 n.a. !0.7 !2.1 11.4 9.6 !4.2 0.3 n.a. 0.2 25.0 7.7 7.0 2.6 32.2 3.0 3.7 5.1 12.4 10.9 !1.5 !7.3 !2.4 2008

113
Bangladesh Cambodia ROC Fiji Hong Kong India Indonesia Iran Japan Korea Lao PDR Malaysia Mongolia Nepal Pakistan Philippines Singapore Sri Lanka Thailand Vietnam Brunei China Myanmar US EU15
1970 ! ! ! ! ! ! ! ! ! ! ! ! ! ! ! ! ! ! ! ! ! ! ! ! ! 1970
1971 !27.4 n.a. 16.9 n.a. 20.9 8.5 9.9 13.4 1.5 16.1 n.a. 7.8 n.a. n.a. !3.5 7.9 15.4 !6.8 !0.3 n.a. n.a. 8.8 !16.2 6.3 !0.2 1971
1972 !80.9 n.a. 13.8 n.a. 8.8 !1.7 7.1 24.7 9.5 !9.4 n.a. 8.9 n.a. n.a. !6.0 2.2 12.9 2.9 !1.3 n.a. n.a. !4.0 5.3 7.8 3.5 1972
1973 90.1 n.a. 15.9 n.a. 11.1 9.4 13.1 8.1 11.2 27.7 n.a. 25.8 n.a. n.a. 1.1 5.1 9.8 1.8 15.1 n.a. n.a. 13.0 !10.6 9.2 8.7 1973
1974 !24.9 n.a. 25.6 n.a. 0.1 3.8 7.6 15.0 !6.8 28.9 n.a. 27.0 n.a. n.a. 7.8 24.8 16.9 3.6 !1.5 n.a. n.a. 3.7 !5.3 !5.6 !0.5 1974
1975 16.6 n.a. !7.8 n.a. 1.1 4.1 12.5 33.1 !4.6 !6.3 n.a. !28.3 n.a. n.a. 2.2 23.8 !9.9 4.8 !0.1 n.a. n.a. 11.7 7.1 !14.6 !11.8 1975
1976 23.3 n.a. 15.6 n.a. 23.0 6.2 4.7 29.8 3.7 21.0 n.a. 11.9 n.a. n.a. 27.6 14.2 6.7 11.0 9.9 n.a. n.a. !6.8 6.1 14.5 8.3 1976
1977 23.0 n.a. 7.9 n.a. 15.6 4.5 10.3 !14.5 3.1 27.6 n.a. 18.3 n.a. n.a. 8.0 0.9 !4.4 4.2 21.7 13.1 n.a. 8.7 22.2 11.1 !0.4 1977
1978 10.8 n.a. 12.8 n.a. 10.0 16.0 13.4 !25.4 7.4 27.2 n.a. 12.6 n.a. n.a. !0.4 8.1 15.9 24.3 11.8 !2.9 n.a. 22.0 31.5 10.6 0.3 1978
1979 22.2 n.a. 16.8 n.a. 15.1 !2.3 !1.8 !34.5 6.3 16.5 n.a. 19.2 n.a. n.a. !1.8 11.2 19.9 13.5 1.4 !3.9 n.a. 4.6 16.9 3.4 5.5 1979
1980 4.7 n.a. 7.2 n.a. 17.2 !11.2 14.7 18.6 !0.5 !18.7 n.a. 9.5 n.a. n.a. 2.3 6.6 14.9 15.0 11.5 !11.1 n.a. 5.4 6.5 !9.1 0.9 1980
1981 !13.3 n.a. 1.5 n.a. 8.4 20.6 15.3 !9.5 2.8 2.6 n.a. 15.7 n.a. n.a. !0.4 9.1 7.3 7.8 7.2 !19.5 n.a. !1.3 12.2 6.6 !9.5 1981
1982 7.8 n.a. !5.5 n.a. !2.2 !2.0 12.8 1.8 0.0 7.4 n.a. 14.3 n.a. n.a. 11.3 5.8 13.2 !2.0 !3.3 7.3 n.a. 7.1 1.0 !12.9 0.4 1982
1983 5.0 n.a. 8.2 n.a. !5.1 !2.7 34.3 37.4 !2.0 15.5 n.a. 10.1 n.a. n.a. 7.8 7.2 10.0 !2.4 16.4 9.8 n.a. 11.2 !15.9 8.7 0.0 1983
1984 9.2 n.a. 6.3 n.a. 3.7 11.7 19.5 !11.1 5.0 10.7 n.a. 2.8 n.a. n.a. 4.9 !31.2 9.8 !10.3 5.5 19.9 n.a. 14.6 !10.5 23.1 3.4 1984
1985 5.9 n.a. !8.5 n.a. !4.7 12.0 13.4 !20.6 9.0 8.1 n.a. !23.6 n.a. n.a. 9.8 !37.0 !13.6 4.8 !3.6 31.7 n.a. 21.3 7.1 1.5 2.6 1985
1986 6.5 n.a. 14.7 n.a. 10.9 1.0 14.7 !17.9 5.2 12.2 n.a. !13.4 n.a. n.a. 4.5 1.9 !10.2 !5.0 !2.2 14.6 n.a. 11.1 !21.2 1.0 4.1 1986
1987 7.9 n.a. 21.4 n.a. 15.1 !1.5 !9.8 5.9 6.9 15.2 n.a. 2.0 n.a. n.a. 4.3 8.2 7.8 4.6 17.1 19.2 n.a. 8.0 !1.8 3.6 4.2 1987
1988 5.9 n.a. 17.0 n.a. 9.9 16.5 !16.4 !25.8 13.8 16.7 n.a. 23.5 n.a. n.a. !1.2 12.1 2.0 !5.9 22.3 0.7 n.a. 10.6 !4.5 1.5 10.2 1988
1989 6.8 n.a. 5.4 n.a. !4.4 2.3 !7.5 15.5 8.8 16.5 n.a. 20.2 n.a. n.a. 7.2 21.1 12.3 0.9 18.2 1.8 n.a. 1.7 !2.9 3.8 6.9 1989
1990 6.2 n.a. 6.4 n.a. 9.3 10.1 23.4 30.9 6.9 14.7 n.a. 18.8 n.a. n.a. 5.1 14.5 14.6 !1.8 26.4 3.7 5.4 1.6 24.2 !1.6 3.1 1990
1991 1.4 n.a. 13.6 n.a. 7.6 !11.9 !11.8 32.4 2.9 15.5 n.a. 26.4 n.a. n.a. 1.2 !17.0 3.6 4.4 12.2 5.9 8.2 7.9 16.4 !6.7 !0.4 1991
1992 4.4 n.a. 11.5 n.a. 9.5 15.0 7.1 2.0 !3.3 !2.7 n.a. 2.8 n.a. n.a. 11.8 4.5 9.4 7.5 5.9 20.4 16.2 12.1 1.6 6.3 !1.3 1992
1993 9.1 n.a. 7.9 n.a. 0.7 !5.3 13.5 !24.0 !3.1 6.2 n.a. 20.8 n.a. n.a. 4.0 8.1 16.1 13.5 8.7 36.0 18.4 21.6 8.2 6.1 !7.7 1993
1994 9.0 0.6 7.4 n.a. 21.7 20.1 17.8 !24.0 !2.3 13.8 n.a. 16.5 n.a. n.a. !0.7 7.5 0.8 10.7 10.5 15.9 !10.7 15.6 21.9 10.2 5.2 1994
1995 8.7 31.7 5.6 n.a. 13.7 17.9 10.9 7.3 2.7 10.5 n.a. 18.4 n.a. n.a. 4.1 4.3 14.1 !7.4 11.9 14.8 7.5 15.9 24.9 2.7 5.0 1995
1996 10.1 3.0 !0.4 n.a. !2.2 !15.1 7.8 21.8 4.7 9.7 n.a. 5.5 n.a. n.a. 5.5 11.5 12.5 8.4 6.1 13.2 62.1 8.6 11.0 7.5 0.2 1996
1997 10.5 10.6 11.8 n.a. 13.1 17.4 !17.2 9.4 0.0 !2.4 n.a. 10.8 n.a. n.a. !3.8 10.9 16.3 6.7 !23.5 9.4 !47.4 2.9 10.9 10.2 4.5 1997
1998 11.4 !24.4 7.1 n.a. !17.5 1.1 !47.9 !0.1 !7.7 !41.7 n.a. !55.9 n.a. n.a. !0.3 !13.3 !22.7 11.3 !63.0 11.8 !13.3 5.0 14.7 8.6 8.1 1998
1999 9.5 43.3 0.3 n.a. !17.0 22.4 !18.0 4.4 !4.6 23.8 n.a. !3.9 n.a. n.a. !6.8 !2.1 6.9 2.0 1.7 1.5 !19.6 5.8 16.7 8.2 5.0 1999
2000 7.0 12.7 8.0 n.a. 17.2 !6.5 21.1 8.4 4.6 12.7 n.a. 26.4 n.a. n.a. 5.0 19.1 21.4 7.6 7.7 9.7 !28.1 4.7 10.8 6.0 5.0 2000
2001 5.7 15.8 !27.3 n.a. !4.3 2.4 7.6 10.7 !1.6 !0.3 n.a. !10.2 !4.0 !10.1 4.4 !12.1 !20.8 !10.5 1.8 10.2 6.6 12.7 6.4 !5.5 !0.3 2001
2002 7.9 12.9 2.1 n.a. !0.6 11.8 !0.8 12.2 !5.7 7.3 n.a. 8.4 2.5 4.3 !0.1 0.4 !8.2 7.7 6.3 12.0 34.4 13.2 8.3 !0.2 !1.8 2002
2003 7.6 18.0 3.1 n.a. 2.0 11.9 6.6 13.5 0.5 4.4 n.a. !0.5 38.1 13.0 5.5 3.6 !29.6 11.1 12.0 11.2 !20.2 18.3 23.7 3.2 2.0 2003
2004 8.8 !7.8 16.5 n.a. 1.8 21.1 9.2 8.8 2.8 2.7 n.a. 10.6 16.2 7.2 !5.5 2.9 35.4 17.4 12.2 10.1 4.0 15.3 20.2 8.0 3.2 2004
2005 10.2 25.9 !0.1 n.a. !0.5 14.8 11.2 5.8 2.6 2.3 n.a. !5.4 29.0 5.7 12.1 !7.2 !0.4 11.2 10.8 10.0 2.7 10.1 23.0 4.4 2.8 2005
2006 8.0 21.6 0.5 n.a. 8.1 14.9 1.9 4.0 0.9 4.3 n.a. 8.4 20.3 5.0 17.1 4.2 14.1 10.9 0.7 10.4 2.7 15.6 24.8 2.7 6.0 2006
2007 8.2 5.5 !0.7 n.a. 7.8 14.2 4.9 8.5 0.2 3.0 n.a. 10.2 21.4 21.0 12.4 10.7 11.7 8.9 1.6 22.6 20.4 13.9 3.8 !2.4 5.2 2007
2008 1.9 15.3 !6.1 n.a. !0.7 !2.1 11.4 9.6 !4.2 0.3 n.a. 0.2 25.0 7.7 7.0 2.6 32.2 3.0 3.7 5.1 12.4 10.9 !1.5 !7.3 !2.4 2008
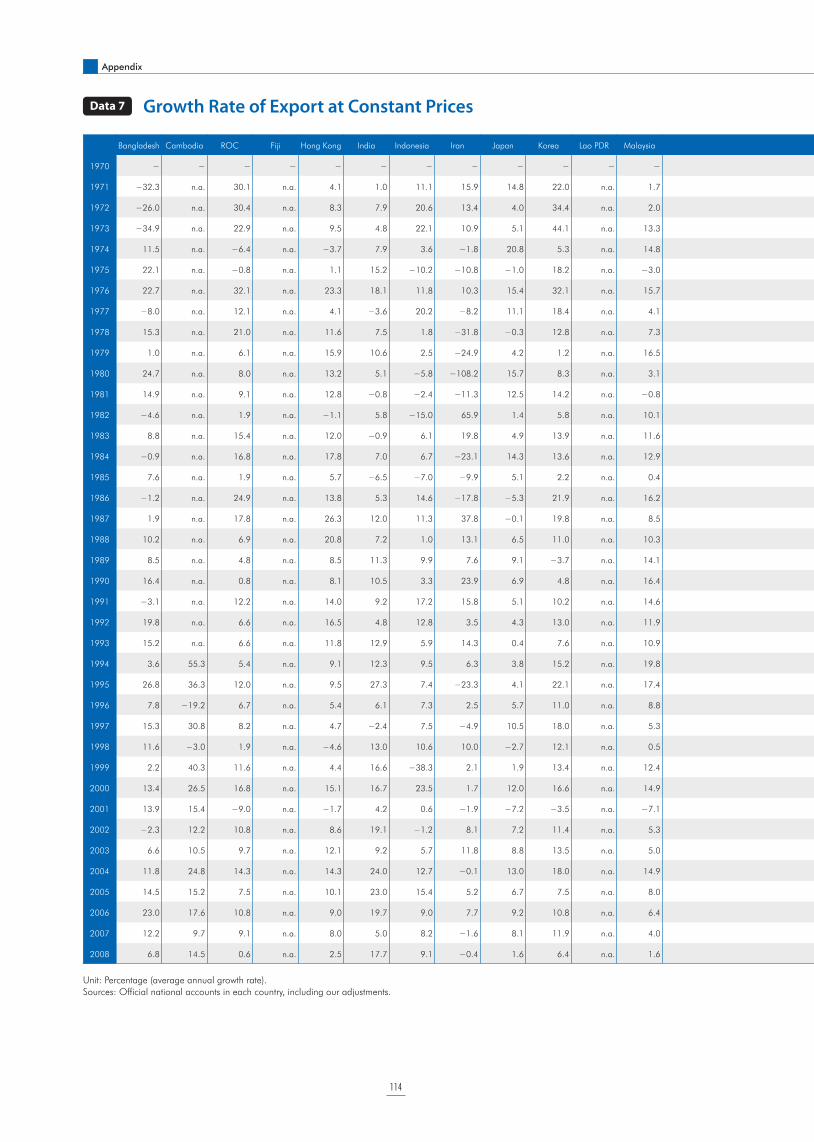
Appendix
114
Unit: Percentage (average annual growth rate).
Sources: Official national accounts in each country, including our adjustments.
Data 7 Growth Rate of Export at Constant Prices
Bangladesh Cambodia ROC Fiji Hong Kong India Indonesia Iran Japan Korea Lao PDR Malaysia Mongolia Nepal Pakistan Philippines Singapore Sri Lanka Thailand Vietnam Brunei China Myanmar US EU15
1970 ! ! ! ! ! ! ! ! ! ! ! ! ! ! ! ! ! ! ! ! ! ! ! ! ! 1970
1971 !32.3 n.a. 30.1 n.a. 4.1 1.0 11.1 15.9 14.8 22.0 n.a. 1.7 n.a. n.a. 2.2 2.9 15.1 !3.2 16.4 n.a. n.a. 12.4 15.2 3.6 6.6 1971
1972 !26.0 n.a. 30.4 n.a. 8.3 7.9 20.6 13.4 4.0 34.4 n.a. 2.0 n.a. n.a. !15.2 9.3 !8.8 !2.1 15.6 n.a. n.a. 18.0 4.3 9.2 7.6 1972
1973 !34.9 n.a. 22.9 n.a. 9.5 4.8 22.1 10.9 5.1 44.1 n.a. 13.3 n.a. n.a. 24.7 13.6 21.7 1.0 !4.6 n.a. n.a. 38.3 !9.0 19.2 10.3 1973
1974 11.5 n.a. !6.4 n.a. !3.7 7.9 3.6 !1.8 20.8 5.3 n.a. 14.8 n.a. n.a. !10.2 !12.5 31.1 !14.2 7.5 n.a. n.a. 16.2 !29.1 9.6 6.6 1974
1975 22.1 n.a. !0.8 n.a. 1.1 15.2 !10.2 !10.8 !1.0 18.2 n.a. !3.0 n.a. n.a. !16.3 !0.3 !3.8 18.3 !4.9 n.a. n.a. 0.3 11.5 1.7 !3.7 1975
1976 22.7 n.a. 32.1 n.a. 23.3 18.1 11.8 10.3 15.4 32.1 n.a. 15.7 n.a. n.a. 6.3 17.1 12.5 !5.1 21.6 n.a. n.a. 3.1 7.8 6.6 9.1 1976
1977 !8.0 n.a. 12.1 n.a. 4.1 !3.6 20.2 !8.2 11.1 18.4 n.a. 4.1 n.a. n.a. !15.1 15.3 15.3 !8.6 10.6 n.a. n.a. 4.8 12.7 4.7 5.7 1977
1978 15.3 n.a. 21.0 n.a. 11.6 7.5 1.8 !31.8 !0.3 12.8 n.a. 7.3 n.a. n.a. 12.0 3.7 12.5 9.0 11.7 n.a. n.a. 46.3 12.8 12.5 5.2 1978
1979 1.0 n.a. 6.1 n.a. 15.9 10.6 2.5 !24.9 4.2 1.2 n.a. 16.5 n.a. n.a. 3.9 6.6 21.9 8.8 9.9 n.a. n.a. 20.3 19.2 12.1 6.6 1979
1980 24.7 n.a. 8.0 n.a. 13.2 5.1 !5.8 !108.2 15.7 8.3 n.a. 3.1 n.a. n.a. 23.7 12.5 22.2 4.9 7.5 n.a. n.a. 7.7 5.2 12.8 1.0 1980
1981 14.9 n.a. 9.1 n.a. 12.8 !0.8 !2.4 !11.3 12.5 14.2 n.a. !0.8 n.a. n.a. 13.4 9.0 9.3 3.0 8.8 n.a. n.a. 15.4 3.1 3.8 4.7 1981
1982 !4.6 n.a. 1.9 n.a. !1.1 5.8 !15.0 65.9 1.4 5.8 n.a. 10.1 n.a. n.a. !6.2 !11.1 5.6 9.5 11.0 n.a. n.a. 1.8 !5.7 !5.6 1.0 1982
1983 8.8 n.a. 15.4 n.a. 12.0 !0.9 6.1 19.8 4.9 13.9 n.a. 11.6 n.a. n.a. 22.0 4.4 5.8 !3.0 !6.2 n.a. n.a. !0.7 14.4 !0.2 3.1 1983
1984 !0.9 n.a. 16.8 n.a. 17.8 7.0 6.7 !23.1 14.3 13.6 n.a. 12.9 n.a. n.a. !3.8 3.8 6.8 14.3 15.9 n.a. n.a. 13.3 !11.2 10.6 7.6 1984
1985 7.6 n.a. 1.9 n.a. 5.7 !6.5 !7.0 !9.9 5.1 2.2 n.a. 0.4 n.a. n.a. !0.4 !18.2 !1.6 4.9 9.3 n.a. n.a. 2.0 !9.4 6.0 4.2 1985
1986 !1.2 n.a. 24.9 n.a. 13.8 5.3 14.6 !17.8 !5.3 21.9 n.a. 16.2 n.a. n.a. 28.4 15.8 12.1 6.5 14.3 n.a. n.a. 0.7 17.9 10.6 1.5 1986
1987 1.9 n.a. 17.8 n.a. 26.3 12.0 11.3 37.8 !0.1 19.8 n.a. 8.5 n.a. n.a. 11.6 6.3 12.9 1.6 19.7 8.1 n.a. 7.7 !20.7 13.1 3.8 1987
1988 10.2 n.a. 6.9 n.a. 20.8 7.2 1.0 13.1 6.5 11.0 n.a. 10.3 n.a. n.a. !4.7 13.7 26.5 3.1 24.0 !10.6 n.a. 7.3 10.2 17.2 5.5 1988
1989 8.5 n.a. 4.8 n.a. 8.5 11.3 9.9 7.6 9.1 !3.7 n.a. 14.1 n.a. n.a. 12.9 10.2 10.0 7.9 19.2 102.5 n.a. 2.5 24.5 12.6 7.5 1989
1990 16.4 n.a. 0.8 n.a. 8.1 10.5 3.3 23.9 6.9 4.8 n.a. 16.4 n.a. n.a. 1.1 1.2 13.2 10.5 12.9 12.4 1.3 5.1 13.5 10.2 6.4 1990
1991 !3.1 n.a. 12.2 n.a. 14.0 9.2 17.2 15.8 5.1 10.2 n.a. 14.6 n.a. n.a. 28.9 6.4 10.5 4.1 14.1 22.9 8.4 !10.9 !2.8 8.2 4.5 1991
1992 19.8 n.a. 6.6 n.a. 16.5 4.8 12.8 3.5 4.3 13.0 n.a. 11.9 n.a. n.a. 12.9 3.0 8.4 14.0 12.9 17.3 5.9 14.7 31.6 8.7 3.5 1992
1993 15.2 n.a. 6.6 n.a. 11.8 12.9 5.9 14.3 0.4 7.6 n.a. 10.9 n.a. n.a. 1.3 6.0 17.3 12.8 12.2 3.9 !2.8 14.6 14.6 5.5 1.7 1993
1994 3.6 55.3 5.4 n.a. 9.1 12.3 9.5 6.3 3.8 15.2 n.a. 19.8 n.a. n.a. 3.1 18.1 19.9 10.4 13.3 22.3 2.8 27.6 4.7 10.5 8.9 1994
1995 26.8 36.3 12.0 n.a. 9.5 27.3 7.4 !23.3 4.1 22.1 n.a. 17.4 n.a. n.a. !3.1 11.4 14.2 7.4 14.4 16.1 15.5 11.0 !24.9 11.5 8.3 1995
1996 7.8 !19.2 6.7 n.a. 5.4 6.1 7.3 2.5 5.7 11.0 n.a. 8.8 n.a. n.a. 2.0 14.3 10.1 3.8 !5.7 25.3 !3.5 18.5 9.7 9.6 5.2 1996
1997 15.3 30.8 8.2 n.a. 4.7 !2.4 7.5 !4.9 10.5 18.0 n.a. 5.3 n.a. n.a. !6.8 15.8 10.6 11.0 7.0 10.8 !5.2 26.8 19.2 12.8 9.8 1997
1998 11.6 !3.0 1.9 n.a. !4.6 13.0 10.6 10.0 !2.7 12.1 n.a. 0.5 n.a. n.a. !5.9 !23.6 !2.9 0.1 7.9 7.5 !10.5 5.5 16.0 3.8 6.5 1998
1999 2.2 40.3 11.6 n.a. 4.4 16.6 !38.3 2.1 1.9 13.4 n.a. 12.4 n.a. n.a. !2.9 3.6 8.7 5.6 8.6 12.5 13.1 8.7 !8.0 5.7 5.5 1999
2000 13.4 26.5 16.8 n.a. 15.1 16.7 23.5 1.7 12.0 16.6 n.a. 14.9 n.a. n.a. 14.9 15.7 14.8 15.8 16.1 12.7 11.2 27.1 58.4 9.6 11.4 2000
2001 13.9 15.4 !9.0 n.a. !1.7 4.2 0.6 !1.9 !7.2 !3.5 n.a. !7.1 8.8 !26.4 11.5 !3.5 !3.5 !8.3 !4.3 15.3 1.3 10.8 15.3 !4.5 3.5 2001
2002 !2.3 12.2 10.8 n.a. 8.6 19.1 !1.2 8.1 7.2 11.4 n.a. 5.3 3.3 !4.9 9.5 4.0 7.8 3.3 11.3 8.3 5.6 18.0 18.7 !0.7 1.6 2002
2003 6.6 10.5 9.7 n.a. 12.1 9.2 5.7 11.8 8.8 13.5 n.a. 5.0 7.9 11.6 25.0 4.8 13.9 3.3 6.8 11.4 2.2 15.4 !28.8 2.8 1.3 2003
2004 11.8 24.8 14.3 n.a. 14.3 24.0 12.7 !0.1 13.0 18.0 n.a. 14.9 20.9 !3.1 !1.5 14.0 18.5 7.5 9.2 17.8 !0.7 19.9 11.1 10.2 6.8 2004
2005 14.5 15.2 7.5 n.a. 10.1 23.0 15.4 5.2 6.7 7.5 n.a. 8.0 5.2 !1.3 9.2 4.7 12.5 6.4 4.1 13.5 !1.3 19.7 11.6 7.5 5.3 2005
2006 23.0 17.6 10.8 n.a. 9.0 19.7 9.0 7.7 9.2 10.8 n.a. 6.4 !4.2 0.3 9.4 12.6 11.5 3.8 8.8 13.8 3.6 17.1 !39.4 9.5 8.3 2006
2007 12.2 9.7 9.1 n.a. 8.0 5.0 8.2 !1.6 8.1 11.9 n.a. 4.0 10.9 !0.6 2.3 5.3 9.4 7.1 7.5 12.4 !10.1 14.6 38.5 9.8 4.4 2007
2008 6.8 14.5 0.6 n.a. 2.5 17.7 9.1 !0.4 1.6 6.4 n.a. 1.6 !4.5 3.8 !5.5 !1.9 4.9 0.4 5.0 1.2 !6.4 9.2 1.9 6.9 1.0 2008

115
Bangladesh Cambodia ROC Fiji Hong Kong India Indonesia Iran Japan Korea Lao PDR Malaysia Mongolia Nepal Pakistan Philippines Singapore Sri Lanka Thailand Vietnam Brunei China Myanmar US EU15
1970 ! ! ! ! ! ! ! ! ! ! ! ! ! ! ! ! ! ! ! ! ! ! ! ! ! 1970
1971 !32.3 n.a. 30.1 n.a. 4.1 1.0 11.1 15.9 14.8 22.0 n.a. 1.7 n.a. n.a. 2.2 2.9 15.1 !3.2 16.4 n.a. n.a. 12.4 15.2 3.6 6.6 1971
1972 !26.0 n.a. 30.4 n.a. 8.3 7.9 20.6 13.4 4.0 34.4 n.a. 2.0 n.a. n.a. !15.2 9.3 !8.8 !2.1 15.6 n.a. n.a. 18.0 4.3 9.2 7.6 1972
1973 !34.9 n.a. 22.9 n.a. 9.5 4.8 22.1 10.9 5.1 44.1 n.a. 13.3 n.a. n.a. 24.7 13.6 21.7 1.0 !4.6 n.a. n.a. 38.3 !9.0 19.2 10.3 1973
1974 11.5 n.a. !6.4 n.a. !3.7 7.9 3.6 !1.8 20.8 5.3 n.a. 14.8 n.a. n.a. !10.2 !12.5 31.1 !14.2 7.5 n.a. n.a. 16.2 !29.1 9.6 6.6 1974
1975 22.1 n.a. !0.8 n.a. 1.1 15.2 !10.2 !10.8 !1.0 18.2 n.a. !3.0 n.a. n.a. !16.3 !0.3 !3.8 18.3 !4.9 n.a. n.a. 0.3 11.5 1.7 !3.7 1975
1976 22.7 n.a. 32.1 n.a. 23.3 18.1 11.8 10.3 15.4 32.1 n.a. 15.7 n.a. n.a. 6.3 17.1 12.5 !5.1 21.6 n.a. n.a. 3.1 7.8 6.6 9.1 1976
1977 !8.0 n.a. 12.1 n.a. 4.1 !3.6 20.2 !8.2 11.1 18.4 n.a. 4.1 n.a. n.a. !15.1 15.3 15.3 !8.6 10.6 n.a. n.a. 4.8 12.7 4.7 5.7 1977
1978 15.3 n.a. 21.0 n.a. 11.6 7.5 1.8 !31.8 !0.3 12.8 n.a. 7.3 n.a. n.a. 12.0 3.7 12.5 9.0 11.7 n.a. n.a. 46.3 12.8 12.5 5.2 1978
1979 1.0 n.a. 6.1 n.a. 15.9 10.6 2.5 !24.9 4.2 1.2 n.a. 16.5 n.a. n.a. 3.9 6.6 21.9 8.8 9.9 n.a. n.a. 20.3 19.2 12.1 6.6 1979
1980 24.7 n.a. 8.0 n.a. 13.2 5.1 !5.8 !108.2 15.7 8.3 n.a. 3.1 n.a. n.a. 23.7 12.5 22.2 4.9 7.5 n.a. n.a. 7.7 5.2 12.8 1.0 1980
1981 14.9 n.a. 9.1 n.a. 12.8 !0.8 !2.4 !11.3 12.5 14.2 n.a. !0.8 n.a. n.a. 13.4 9.0 9.3 3.0 8.8 n.a. n.a. 15.4 3.1 3.8 4.7 1981
1982 !4.6 n.a. 1.9 n.a. !1.1 5.8 !15.0 65.9 1.4 5.8 n.a. 10.1 n.a. n.a. !6.2 !11.1 5.6 9.5 11.0 n.a. n.a. 1.8 !5.7 !5.6 1.0 1982
1983 8.8 n.a. 15.4 n.a. 12.0 !0.9 6.1 19.8 4.9 13.9 n.a. 11.6 n.a. n.a. 22.0 4.4 5.8 !3.0 !6.2 n.a. n.a. !0.7 14.4 !0.2 3.1 1983
1984 !0.9 n.a. 16.8 n.a. 17.8 7.0 6.7 !23.1 14.3 13.6 n.a. 12.9 n.a. n.a. !3.8 3.8 6.8 14.3 15.9 n.a. n.a. 13.3 !11.2 10.6 7.6 1984
1985 7.6 n.a. 1.9 n.a. 5.7 !6.5 !7.0 !9.9 5.1 2.2 n.a. 0.4 n.a. n.a. !0.4 !18.2 !1.6 4.9 9.3 n.a. n.a. 2.0 !9.4 6.0 4.2 1985
1986 !1.2 n.a. 24.9 n.a. 13.8 5.3 14.6 !17.8 !5.3 21.9 n.a. 16.2 n.a. n.a. 28.4 15.8 12.1 6.5 14.3 n.a. n.a. 0.7 17.9 10.6 1.5 1986
1987 1.9 n.a. 17.8 n.a. 26.3 12.0 11.3 37.8 !0.1 19.8 n.a. 8.5 n.a. n.a. 11.6 6.3 12.9 1.6 19.7 8.1 n.a. 7.7 !20.7 13.1 3.8 1987
1988 10.2 n.a. 6.9 n.a. 20.8 7.2 1.0 13.1 6.5 11.0 n.a. 10.3 n.a. n.a. !4.7 13.7 26.5 3.1 24.0 !10.6 n.a. 7.3 10.2 17.2 5.5 1988
1989 8.5 n.a. 4.8 n.a. 8.5 11.3 9.9 7.6 9.1 !3.7 n.a. 14.1 n.a. n.a. 12.9 10.2 10.0 7.9 19.2 102.5 n.a. 2.5 24.5 12.6 7.5 1989
1990 16.4 n.a. 0.8 n.a. 8.1 10.5 3.3 23.9 6.9 4.8 n.a. 16.4 n.a. n.a. 1.1 1.2 13.2 10.5 12.9 12.4 1.3 5.1 13.5 10.2 6.4 1990
1991 !3.1 n.a. 12.2 n.a. 14.0 9.2 17.2 15.8 5.1 10.2 n.a. 14.6 n.a. n.a. 28.9 6.4 10.5 4.1 14.1 22.9 8.4 !10.9 !2.8 8.2 4.5 1991
1992 19.8 n.a. 6.6 n.a. 16.5 4.8 12.8 3.5 4.3 13.0 n.a. 11.9 n.a. n.a. 12.9 3.0 8.4 14.0 12.9 17.3 5.9 14.7 31.6 8.7 3.5 1992
1993 15.2 n.a. 6.6 n.a. 11.8 12.9 5.9 14.3 0.4 7.6 n.a. 10.9 n.a. n.a. 1.3 6.0 17.3 12.8 12.2 3.9 !2.8 14.6 14.6 5.5 1.7 1993
1994 3.6 55.3 5.4 n.a. 9.1 12.3 9.5 6.3 3.8 15.2 n.a. 19.8 n.a. n.a. 3.1 18.1 19.9 10.4 13.3 22.3 2.8 27.6 4.7 10.5 8.9 1994
1995 26.8 36.3 12.0 n.a. 9.5 27.3 7.4 !23.3 4.1 22.1 n.a. 17.4 n.a. n.a. !3.1 11.4 14.2 7.4 14.4 16.1 15.5 11.0 !24.9 11.5 8.3 1995
1996 7.8 !19.2 6.7 n.a. 5.4 6.1 7.3 2.5 5.7 11.0 n.a. 8.8 n.a. n.a. 2.0 14.3 10.1 3.8 !5.7 25.3 !3.5 18.5 9.7 9.6 5.2 1996
1997 15.3 30.8 8.2 n.a. 4.7 !2.4 7.5 !4.9 10.5 18.0 n.a. 5.3 n.a. n.a. !6.8 15.8 10.6 11.0 7.0 10.8 !5.2 26.8 19.2 12.8 9.8 1997
1998 11.6 !3.0 1.9 n.a. !4.6 13.0 10.6 10.0 !2.7 12.1 n.a. 0.5 n.a. n.a. !5.9 !23.6 !2.9 0.1 7.9 7.5 !10.5 5.5 16.0 3.8 6.5 1998
1999 2.2 40.3 11.6 n.a. 4.4 16.6 !38.3 2.1 1.9 13.4 n.a. 12.4 n.a. n.a. !2.9 3.6 8.7 5.6 8.6 12.5 13.1 8.7 !8.0 5.7 5.5 1999
2000 13.4 26.5 16.8 n.a. 15.1 16.7 23.5 1.7 12.0 16.6 n.a. 14.9 n.a. n.a. 14.9 15.7 14.8 15.8 16.1 12.7 11.2 27.1 58.4 9.6 11.4 2000
2001 13.9 15.4 !9.0 n.a. !1.7 4.2 0.6 !1.9 !7.2 !3.5 n.a. !7.1 8.8 !26.4 11.5 !3.5 !3.5 !8.3 !4.3 15.3 1.3 10.8 15.3 !4.5 3.5 2001
2002 !2.3 12.2 10.8 n.a. 8.6 19.1 !1.2 8.1 7.2 11.4 n.a. 5.3 3.3 !4.9 9.5 4.0 7.8 3.3 11.3 8.3 5.6 18.0 18.7 !0.7 1.6 2002
2003 6.6 10.5 9.7 n.a. 12.1 9.2 5.7 11.8 8.8 13.5 n.a. 5.0 7.9 11.6 25.0 4.8 13.9 3.3 6.8 11.4 2.2 15.4 !28.8 2.8 1.3 2003
2004 11.8 24.8 14.3 n.a. 14.3 24.0 12.7 !0.1 13.0 18.0 n.a. 14.9 20.9 !3.1 !1.5 14.0 18.5 7.5 9.2 17.8 !0.7 19.9 11.1 10.2 6.8 2004
2005 14.5 15.2 7.5 n.a. 10.1 23.0 15.4 5.2 6.7 7.5 n.a. 8.0 5.2 !1.3 9.2 4.7 12.5 6.4 4.1 13.5 !1.3 19.7 11.6 7.5 5.3 2005
2006 23.0 17.6 10.8 n.a. 9.0 19.7 9.0 7.7 9.2 10.8 n.a. 6.4 !4.2 0.3 9.4 12.6 11.5 3.8 8.8 13.8 3.6 17.1 !39.4 9.5 8.3 2006
2007 12.2 9.7 9.1 n.a. 8.0 5.0 8.2 !1.6 8.1 11.9 n.a. 4.0 10.9 !0.6 2.3 5.3 9.4 7.1 7.5 12.4 !10.1 14.6 38.5 9.8 4.4 2007
2008 6.8 14.5 0.6 n.a. 2.5 17.7 9.1 !0.4 1.6 6.4 n.a. 1.6 !4.5 3.8 !5.5 !1.9 4.9 0.4 5.0 1.2 !6.4 9.2 1.9 6.9 1.0 2008

Appendix
116
Unit: Percentage (average annual growth rate).
Sources: Official national accounts in each country, including our adjustments.
Data 8 Growth Rate of Import at Constant Prices
Bangladesh Cambodia ROC Fiji Hong Kong India Indonesia Iran Japan Korea Lao PDR Malaysia Mongolia Nepal Pakistan Philippines Singapore Sri Lanka Thailand Vietnam Brunei China Myanmar US EU15
1970 ! ! ! ! ! ! ! ! ! ! ! ! ! ! ! ! ! ! ! ! ! ! ! ! ! 1970
1971 !24.3 n.a. 19.5 n.a. 12.0 16.6 9.5 17.8 6.8 17.9 n.a. !0.7 n.a. n.a. 5.4 0.2 15.1 !10.3 !14.3 n.a. n.a. 17.7 !12.7 5.2 5.0 1971
1972 !0.1 n.a. 19.3 n.a. 4.8 !1.9 24.0 15.1 10.0 0.9 n.a. !3.1 n.a. n.a. !19.2 3.1 !10.2 !8.1 12.2 n.a. n.a. 16.5 !4.1 10.6 9.1 1972
1973 !46.7 n.a. 21.7 n.a. 9.8 7.8 19.4 23.9 21.8 31.2 n.a. 15.4 n.a. n.a. !0.5 4.4 14.8 !10.8 21.1 n.a. n.a. 17.5 !42.7 4.5 10.7 1973
1974 !11.5 n.a. 12.7 n.a. !8.0 !13.6 23.8 58.6 4.1 16.2 n.a. 31.4 n.a. n.a. 19.0 17.6 32.5 !34.4 !5.9 n.a. n.a. 35.3 !40.2 !2.3 2.3 1974
1975 31.9 n.a. !5.4 n.a. 3.7 1.3 7.6 41.3 !10.9 2.8 n.a. !18.7 n.a. n.a. 13.2 4.7 !7.4 20.9 !1.7 n.a. n.a. !5.8 18.4 !11.8 !5.9 1975
1976 !59.2 n.a. 21.5 n.a. 21.2 1.9 7.8 !2.2 6.5 22.3 n.a. 8.8 n.a. n.a. 8.9 1.0 9.7 8.3 7.1 n.a. n.a. !3.7 0.0 17.9 10.4 1976
1977 46.2 n.a. 5.1 n.a. 7.7 24.2 20.0 12.5 4.0 18.8 n.a. 14.7 n.a. n.a. 4.0 6.2 10.7 25.8 18.1 n.a. n.a. 3.8 22.4 10.4 2.4 1977
1978 10.4 n.a. 13.0 n.a. 18.8 0.0 14.5 !36.1 6.7 24.5 n.a. 12.1 n.a. n.a. 11.2 12.1 12.8 31.4 6.4 n.a. n.a. 61.4 32.0 8.3 3.8 1978
1979 28.8 n.a. 17.1 n.a. 16.1 17.7 18.4 !28.3 12.1 11.4 n.a. 18.6 n.a. n.a. 22.7 15.2 21.0 !6.7 19.0 n.a. n.a. 27.5 26.6 1.6 9.2 1979
1980 5.8 n.a. 6.1 n.a. 16.8 13.4 14.1 2.0 !8.1 !4.1 n.a. 18.7 n.a. n.a. 4.8 3.2 21.2 6.3 !0.2 n.a. n.a. 0.9 4.8 !6.9 2.0 1980
1981 10.1 n.a. 1.6 n.a. 12.0 9.6 23.9 !5.4 2.1 5.3 n.a. 5.4 n.a. n.a. !6.6 !0.8 7.6 3.5 0.6 n.a. n.a. 9.6 14.8 2.6 !1.8 1981
1982 9.0 n.a. !2.2 n.a. !1.5 3.4 7.9 !11.4 !0.7 3.9 n.a. 12.9 n.a. n.a. !0.5 2.4 6.1 9.8 !15.8 n.a. n.a. !10.7 9.9 !1.3 1.4 1982
1983 !4.2 n.a. 9.9 n.a. 9.6 19.9 11.6 32.7 !3.5 9.7 n.a. 8.6 n.a. n.a. 10.5 !3.1 4.2 !0.6 28.3 n.a. n.a. 11.5 !20.7 11.9 1.0 1983
1984 !6.7 n.a. 13.6 n.a. 13.7 !15.5 !7.8 !37.5 10.0 8.5 n.a. 6.3 n.a. n.a. 7.0 !19.2 5.3 0.9 7.4 n.a. n.a. 26.1 !3.1 21.8 5.8 1984
1985 7.0 n.a. !3.8 n.a. 6.3 13.0 5.1 !7.2 !2.7 0.1 n.a. !10.5 n.a. n.a. 8.5 !15.3 !3.6 !3.3 !13.5 n.a. n.a. 39.3 !5.4 6.3 4.2 1985
1986 !4.2 n.a. 19.3 n.a. 12.6 15.8 4.1 !13.8 3.7 17.2 n.a. !2.7 n.a. n.a. !2.5 9.7 9.0 11.2 !0.9 n.a. n.a. !2.4 !20.5 8.2 5.7 1986
1987 5.5 n.a. 24.2 n.a. 25.8 !1.7 2.0 9.5 8.6 17.6 n.a. 4.3 n.a. n.a. 2.0 25.2 10.3 2.4 28.9 16.2 n.a. !8.6 0.3 5.8 7.5 1987
1988 7.2 n.a. 22.2 n.a. 22.5 8.8 !19.4 !16.1 17.1 12.7 n.a. 18.0 n.a. n.a. !3.5 17.9 22.3 2.4 33.3 !8.0 n.a. 20.2 !23.3 3.8 8.5 1988
1989 14.0 n.a. 6.6 n.a. 8.2 2.1 10.9 18.8 16.5 14.8 n.a. 22.9 n.a. n.a. 8.0 14.1 8.6 !3.1 19.5 45.1 n.a. 2.8 !8.8 4.3 8.5 1989
1990 8.9 n.a. 5.3 n.a. 10.8 3.3 20.8 27.5 7.8 12.5 n.a. 23.3 n.a. n.a. !3.6 9.6 13.0 !2.4 21.3 10.5 16.5 !17.5 39.2 3.5 6.3 1990
1991 !16.3 n.a. 13.8 n.a. 16.6 0.0 14.6 28.6 !1.1 17.0 n.a. 22.5 n.a. n.a. !7.7 !2.0 7.5 12.3 12.2 9.2 13.4 !15.6 !9.1 !0.1 4.0 1991
1992 !9.2 n.a. 9.3 n.a. 18.9 19.2 8.3 !9.5 !1.1 5.3 n.a. 6.2 n.a. n.a. 26.9 9.2 7.1 9.4 8.6 8.9 21.6 25.3 !0.5 6.8 3.9 1992
1993 31.8 n.a. 7.1 n.a. 11.4 17.6 4.1 !21.9 !1.3 4.7 n.a. 14.0 n.a. n.a. 13.8 10.9 16.8 13.7 12.4 17.2 3.4 45.8 34.9 8.3 !2.9 1993
1994 !6.3 28.7 4.4 n.a. 12.3 20.4 18.5 !49.5 7.9 20.5 n.a. 22.8 n.a. n.a. !11.4 13.5 16.2 12.6 13.5 21.4 !7.6 8.0 !6.2 11.3 8.1 1994
1995 39.5 30.4 9.7 n.a. 11.7 24.8 19.0 !0.9 13.3 20.3 n.a. 21.3 n.a. n.a. 3.9 14.9 13.6 0.8 18.2 14.0 14.7 11.1 18.1 7.7 7.2 1995
1996 13.2 !0.1 5.4 n.a. 4.3 !2.5 6.6 15.5 12.6 13.7 n.a. 4.8 n.a. n.a. 12.7 15.5 10.0 2.4 !0.6 22.8 19.2 16.1 !7.7 8.3 4.5 1996
1997 !1.8 5.6 12.8 n.a. 6.7 12.4 13.7 !6.7 0.5 4.1 n.a. 5.7 n.a. n.a. !3.9 12.7 10.9 9.9 !12.0 6.9 !18.2 9.7 3.4 12.6 9.1 1997
1998 4.4 !1.6 7.1 n.a. !6.0 18.9 !5.4 0.4 !7.1 !24.9 n.a. !20.8 n.a. n.a. !5.8 !15.9 !9.1 11.7 !24.4 8.6 !14.4 0.3 15.4 11.0 9.8 1998
1999 2.3 31.9 4.0 n.a. !0.5 6.8 !48.3 !5.4 3.5 23.4 n.a. 10.0 n.a. n.a. !5.6 !2.8 8.6 !2.6 10.0 5.5 !3.7 10.8 !0.8 10.9 7.6 1999
2000 9.7 21.3 14.3 n.a. 15.2 4.4 19.1 8.0 8.8 20.3 n.a. 21.8 n.a. n.a. !2.3 4.2 18.0 13.8 24.0 9.5 !6.4 29.7 !8.3 12.2 10.6 2000
2001 10.6 9.8 !16.0 n.a. !1.5 2.7 4.1 15.9 0.6 !5.0 n.a. !8.6 12.1 !16.3 2.1 3.5 !5.9 !11.3 !5.7 15.2 3.1 13.3 10.4 !2.9 2.4 2001
2002 !11.9 13.6 6.0 n.a. 7.2 11.6 !4.3 20.9 0.9 13.5 n.a. 6.0 14.0 0.1 3.0 5.5 5.9 10.3 12.8 10.5 12.5 19.2 !19.2 3.3 1.1 2002
2003 7.1 12.2 7.4 n.a. 10.8 12.9 1.6 18.7 3.8 10.5 n.a. 4.4 9.4 8.1 10.6 10.3 9.1 10.7 8.1 14.7 !8.4 18.0 !17.2 4.3 2.9 2003
2004 10.1 18.1 16.1 n.a. 13.0 20.1 23.6 12.2 7.8 11.1 n.a. 17.9 18.2 6.7 !9.0 5.6 20.5 8.6 12.6 15.1 3.7 21.4 !17.7 10.5 6.7 2004
2005 17.4 16.0 3.1 n.a. 7.7 28.1 16.4 2.2 5.7 7.3 n.a. 8.5 !0.2 6.3 34.0 2.3 10.7 2.7 8.6 10.1 2.8 16.2 2.2 5.9 5.8 2005
2006 16.7 14.8 4.5 n.a. 8.7 19.9 8.2 6.9 4.1 10.7 n.a. 7.8 5.9 2.9 17.1 1.9 10.6 6.7 3.3 14.5 4.0 14.9 !38.9 5.9 8.1 2006
2007 14.8 11.4 2.9 n.a. 8.8 9.5 8.7 3.1 1.6 11.0 n.a. 5.8 21.1 7.9 !3.6 !4.2 7.6 3.7 4.3 25.0 12.4 12.1 36.9 2.7 4.3 2007
2008 !2.1 20.4 !3.2 n.a. 2.3 20.7 9.5 17.1 0.4 4.3 n.a. 2.2 28.0 11.9 3.5 2.4 8.8 3.9 8.1 4.3 10.4 6.8 2.5 !2.6 1.3 2008

117
Bangladesh Cambodia ROC Fiji Hong Kong India Indonesia Iran Japan Korea Lao PDR Malaysia Mongolia Nepal Pakistan Philippines Singapore Sri Lanka Thailand Vietnam Brunei China Myanmar US EU15
1970 ! ! ! ! ! ! ! ! ! ! ! ! ! ! ! ! ! ! ! ! ! ! ! ! ! 1970
1971 !24.3 n.a. 19.5 n.a. 12.0 16.6 9.5 17.8 6.8 17.9 n.a. !0.7 n.a. n.a. 5.4 0.2 15.1 !10.3 !14.3 n.a. n.a. 17.7 !12.7 5.2 5.0 1971
1972 !0.1 n.a. 19.3 n.a. 4.8 !1.9 24.0 15.1 10.0 0.9 n.a. !3.1 n.a. n.a. !19.2 3.1 !10.2 !8.1 12.2 n.a. n.a. 16.5 !4.1 10.6 9.1 1972
1973 !46.7 n.a. 21.7 n.a. 9.8 7.8 19.4 23.9 21.8 31.2 n.a. 15.4 n.a. n.a. !0.5 4.4 14.8 !10.8 21.1 n.a. n.a. 17.5 !42.7 4.5 10.7 1973
1974 !11.5 n.a. 12.7 n.a. !8.0 !13.6 23.8 58.6 4.1 16.2 n.a. 31.4 n.a. n.a. 19.0 17.6 32.5 !34.4 !5.9 n.a. n.a. 35.3 !40.2 !2.3 2.3 1974
1975 31.9 n.a. !5.4 n.a. 3.7 1.3 7.6 41.3 !10.9 2.8 n.a. !18.7 n.a. n.a. 13.2 4.7 !7.4 20.9 !1.7 n.a. n.a. !5.8 18.4 !11.8 !5.9 1975
1976 !59.2 n.a. 21.5 n.a. 21.2 1.9 7.8 !2.2 6.5 22.3 n.a. 8.8 n.a. n.a. 8.9 1.0 9.7 8.3 7.1 n.a. n.a. !3.7 0.0 17.9 10.4 1976
1977 46.2 n.a. 5.1 n.a. 7.7 24.2 20.0 12.5 4.0 18.8 n.a. 14.7 n.a. n.a. 4.0 6.2 10.7 25.8 18.1 n.a. n.a. 3.8 22.4 10.4 2.4 1977
1978 10.4 n.a. 13.0 n.a. 18.8 0.0 14.5 !36.1 6.7 24.5 n.a. 12.1 n.a. n.a. 11.2 12.1 12.8 31.4 6.4 n.a. n.a. 61.4 32.0 8.3 3.8 1978
1979 28.8 n.a. 17.1 n.a. 16.1 17.7 18.4 !28.3 12.1 11.4 n.a. 18.6 n.a. n.a. 22.7 15.2 21.0 !6.7 19.0 n.a. n.a. 27.5 26.6 1.6 9.2 1979
1980 5.8 n.a. 6.1 n.a. 16.8 13.4 14.1 2.0 !8.1 !4.1 n.a. 18.7 n.a. n.a. 4.8 3.2 21.2 6.3 !0.2 n.a. n.a. 0.9 4.8 !6.9 2.0 1980
1981 10.1 n.a. 1.6 n.a. 12.0 9.6 23.9 !5.4 2.1 5.3 n.a. 5.4 n.a. n.a. !6.6 !0.8 7.6 3.5 0.6 n.a. n.a. 9.6 14.8 2.6 !1.8 1981
1982 9.0 n.a. !2.2 n.a. !1.5 3.4 7.9 !11.4 !0.7 3.9 n.a. 12.9 n.a. n.a. !0.5 2.4 6.1 9.8 !15.8 n.a. n.a. !10.7 9.9 !1.3 1.4 1982
1983 !4.2 n.a. 9.9 n.a. 9.6 19.9 11.6 32.7 !3.5 9.7 n.a. 8.6 n.a. n.a. 10.5 !3.1 4.2 !0.6 28.3 n.a. n.a. 11.5 !20.7 11.9 1.0 1983
1984 !6.7 n.a. 13.6 n.a. 13.7 !15.5 !7.8 !37.5 10.0 8.5 n.a. 6.3 n.a. n.a. 7.0 !19.2 5.3 0.9 7.4 n.a. n.a. 26.1 !3.1 21.8 5.8 1984
1985 7.0 n.a. !3.8 n.a. 6.3 13.0 5.1 !7.2 !2.7 0.1 n.a. !10.5 n.a. n.a. 8.5 !15.3 !3.6 !3.3 !13.5 n.a. n.a. 39.3 !5.4 6.3 4.2 1985
1986 !4.2 n.a. 19.3 n.a. 12.6 15.8 4.1 !13.8 3.7 17.2 n.a. !2.7 n.a. n.a. !2.5 9.7 9.0 11.2 !0.9 n.a. n.a. !2.4 !20.5 8.2 5.7 1986
1987 5.5 n.a. 24.2 n.a. 25.8 !1.7 2.0 9.5 8.6 17.6 n.a. 4.3 n.a. n.a. 2.0 25.2 10.3 2.4 28.9 16.2 n.a. !8.6 0.3 5.8 7.5 1987
1988 7.2 n.a. 22.2 n.a. 22.5 8.8 !19.4 !16.1 17.1 12.7 n.a. 18.0 n.a. n.a. !3.5 17.9 22.3 2.4 33.3 !8.0 n.a. 20.2 !23.3 3.8 8.5 1988
1989 14.0 n.a. 6.6 n.a. 8.2 2.1 10.9 18.8 16.5 14.8 n.a. 22.9 n.a. n.a. 8.0 14.1 8.6 !3.1 19.5 45.1 n.a. 2.8 !8.8 4.3 8.5 1989
1990 8.9 n.a. 5.3 n.a. 10.8 3.3 20.8 27.5 7.8 12.5 n.a. 23.3 n.a. n.a. !3.6 9.6 13.0 !2.4 21.3 10.5 16.5 !17.5 39.2 3.5 6.3 1990
1991 !16.3 n.a. 13.8 n.a. 16.6 0.0 14.6 28.6 !1.1 17.0 n.a. 22.5 n.a. n.a. !7.7 !2.0 7.5 12.3 12.2 9.2 13.4 !15.6 !9.1 !0.1 4.0 1991
1992 !9.2 n.a. 9.3 n.a. 18.9 19.2 8.3 !9.5 !1.1 5.3 n.a. 6.2 n.a. n.a. 26.9 9.2 7.1 9.4 8.6 8.9 21.6 25.3 !0.5 6.8 3.9 1992
1993 31.8 n.a. 7.1 n.a. 11.4 17.6 4.1 !21.9 !1.3 4.7 n.a. 14.0 n.a. n.a. 13.8 10.9 16.8 13.7 12.4 17.2 3.4 45.8 34.9 8.3 !2.9 1993
1994 !6.3 28.7 4.4 n.a. 12.3 20.4 18.5 !49.5 7.9 20.5 n.a. 22.8 n.a. n.a. !11.4 13.5 16.2 12.6 13.5 21.4 !7.6 8.0 !6.2 11.3 8.1 1994
1995 39.5 30.4 9.7 n.a. 11.7 24.8 19.0 !0.9 13.3 20.3 n.a. 21.3 n.a. n.a. 3.9 14.9 13.6 0.8 18.2 14.0 14.7 11.1 18.1 7.7 7.2 1995
1996 13.2 !0.1 5.4 n.a. 4.3 !2.5 6.6 15.5 12.6 13.7 n.a. 4.8 n.a. n.a. 12.7 15.5 10.0 2.4 !0.6 22.8 19.2 16.1 !7.7 8.3 4.5 1996
1997 !1.8 5.6 12.8 n.a. 6.7 12.4 13.7 !6.7 0.5 4.1 n.a. 5.7 n.a. n.a. !3.9 12.7 10.9 9.9 !12.0 6.9 !18.2 9.7 3.4 12.6 9.1 1997
1998 4.4 !1.6 7.1 n.a. !6.0 18.9 !5.4 0.4 !7.1 !24.9 n.a. !20.8 n.a. n.a. !5.8 !15.9 !9.1 11.7 !24.4 8.6 !14.4 0.3 15.4 11.0 9.8 1998
1999 2.3 31.9 4.0 n.a. !0.5 6.8 !48.3 !5.4 3.5 23.4 n.a. 10.0 n.a. n.a. !5.6 !2.8 8.6 !2.6 10.0 5.5 !3.7 10.8 !0.8 10.9 7.6 1999
2000 9.7 21.3 14.3 n.a. 15.2 4.4 19.1 8.0 8.8 20.3 n.a. 21.8 n.a. n.a. !2.3 4.2 18.0 13.8 24.0 9.5 !6.4 29.7 !8.3 12.2 10.6 2000
2001 10.6 9.8 !16.0 n.a. !1.5 2.7 4.1 15.9 0.6 !5.0 n.a. !8.6 12.1 !16.3 2.1 3.5 !5.9 !11.3 !5.7 15.2 3.1 13.3 10.4 !2.9 2.4 2001
2002 !11.9 13.6 6.0 n.a. 7.2 11.6 !4.3 20.9 0.9 13.5 n.a. 6.0 14.0 0.1 3.0 5.5 5.9 10.3 12.8 10.5 12.5 19.2 !19.2 3.3 1.1 2002
2003 7.1 12.2 7.4 n.a. 10.8 12.9 1.6 18.7 3.8 10.5 n.a. 4.4 9.4 8.1 10.6 10.3 9.1 10.7 8.1 14.7 !8.4 18.0 !17.2 4.3 2.9 2003
2004 10.1 18.1 16.1 n.a. 13.0 20.1 23.6 12.2 7.8 11.1 n.a. 17.9 18.2 6.7 !9.0 5.6 20.5 8.6 12.6 15.1 3.7 21.4 !17.7 10.5 6.7 2004
2005 17.4 16.0 3.1 n.a. 7.7 28.1 16.4 2.2 5.7 7.3 n.a. 8.5 !0.2 6.3 34.0 2.3 10.7 2.7 8.6 10.1 2.8 16.2 2.2 5.9 5.8 2005
2006 16.7 14.8 4.5 n.a. 8.7 19.9 8.2 6.9 4.1 10.7 n.a. 7.8 5.9 2.9 17.1 1.9 10.6 6.7 3.3 14.5 4.0 14.9 !38.9 5.9 8.1 2006
2007 14.8 11.4 2.9 n.a. 8.8 9.5 8.7 3.1 1.6 11.0 n.a. 5.8 21.1 7.9 !3.6 !4.2 7.6 3.7 4.3 25.0 12.4 12.1 36.9 2.7 4.3 2007
2008 !2.1 20.4 !3.2 n.a. 2.3 20.7 9.5 17.1 0.4 4.3 n.a. 2.2 28.0 11.9 3.5 2.4 8.8 3.9 8.1 4.3 10.4 6.8 2.5 !2.6 1.3 2008
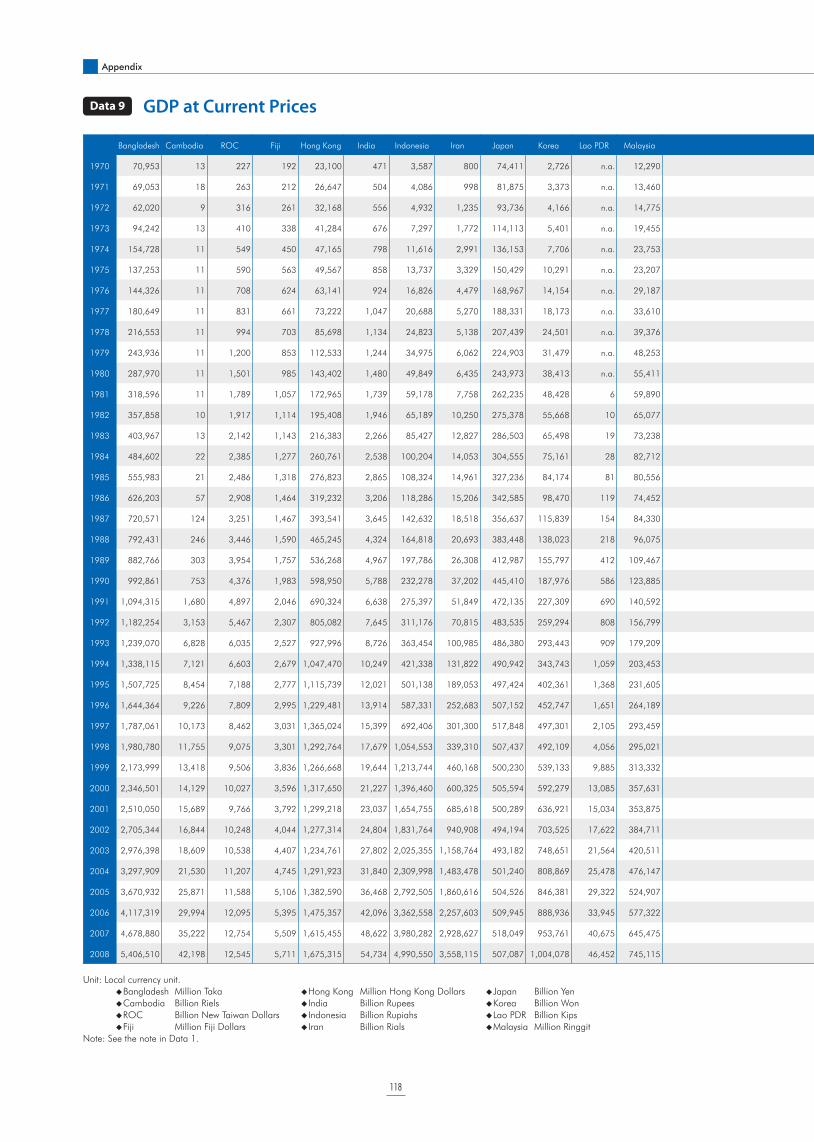
Appendix
118
Data 9 GDP at Current Prices
Bangladesh Cambodia ROC Fiji Hong Kong India Indonesia Iran Japan Korea Lao PDR Malaysia Mongolia Nepal Pakistan Philippines Singapore Sri Lanka Thailand Vietnam Brunei China Myanmar US EU15
1970 70,953 13 227 192 23,100 471 3,587 800 74,411 2,726 n.a. 12,290 4,132 n.a. 57,702 39,138 5,835 15,441 147,500 n.a. 622 221 13 1,028 1,199 1970
1971 69,053 18 263 212 26,647 504 4,086 998 81,875 3,373 n.a. 13,460 4,483 n.a. 61,378 46,213 6,877 15,758 153,544 n.a. 684 239 13 1,115 1,302 1971
1972 62,020 9 316 261 32,168 556 4,932 1,235 93,736 4,166 n.a. 14,775 4,722 n.a. 66,071 51,704 8,238 17,708 170,226 n.a. 867 245 14 1,225 1,419 1972
1973 94,242 13 410 338 41,284 676 7,297 1,772 114,113 5,401 n.a. 19,455 5,422 n.a. 81,566 66,192 10,313 21,047 222,318 n.a. 1,208 267 16 1,368 1,593 1973
1974 154,728 11 549 450 47,165 798 11,616 2,991 136,153 7,706 n.a. 23,753 5,835 18,663 106,479 91,876 12,699 25,814 279,485 n.a. 2,969 274 19 1,482 1,778 1974
1975 137,253 11 590 563 49,567 858 13,737 3,329 150,429 10,291 n.a. 23,207 6,236 19,590 134,380 105,677 13,563 29,016 303,641 n.a. 3,145 295 23 1,615 1,934 1975
1976 144,326 11 708 624 63,141 924 16,826 4,479 168,967 14,154 n.a. 29,187 6,762 19,462 157,570 124,637 14,798 32,264 346,908 2 3,993 297 27 1,802 2,140 1976
1977 180,649 11 831 661 73,222 1,047 20,688 5,270 188,331 18,173 n.a. 33,610 7,321 22,225 181,009 142,104 16,168 38,725 404,014 2 4,801 317 30 2,005 2,339 1977
1978 216,553 11 994 703 85,698 1,134 24,823 5,138 207,439 24,501 n.a. 39,376 8,158 25,021 213,157 163,709 18,037 46,751 488,851 2 5,015 361 32 2,263 2,581 1978
1979 243,936 11 1,200 853 112,533 1,244 34,975 6,062 224,903 31,479 n.a. 48,253 7,624 26,301 235,631 200,456 20,777 57,620 559,622 3 6,928 409 35 2,530 2,897 1979
1980 287,970 11 1,501 985 143,402 1,480 49,849 6,435 243,973 38,413 n.a. 55,411 8,093 30,735 283,115 243,870 25,403 71,700 663,442 3 11,994 459 39 2,755 3,208 1980
1981 318,596 11 1,789 1,057 172,965 1,739 59,178 7,758 262,235 48,428 6 59,890 8,897 34,904 335,382 281,745 29,750 88,688 761,529 8 10,490 501 43 3,094 3,516 1981
1982 357,858 10 1,917 1,114 195,408 1,946 65,189 10,250 275,378 55,668 10 65,077 9,831 38,028 390,821 317,355 33,198 102,332 842,950 16 10,385 559 47 3,218 3,765 1982
1983 403,967 13 2,142 1,143 216,383 2,266 85,427 12,827 286,503 65,498 19 73,238 10,499 44,370 439,354 369,298 37,263 125,078 922,597 21 9,249 622 50 3,480 3,981 1983
1984 484,602 22 2,385 1,277 260,761 2,538 100,204 14,053 304,555 75,161 28 82,712 10,779 50,033 506,210 524,815 40,716 154,613 989,906 34 9,190 736 54 3,876 4,233 1984
1985 555,983 21 2,486 1,318 276,823 2,865 108,324 14,961 327,236 84,174 81 80,556 11,230 59,859 569,388 572,271 39,708 165,553 1,058,585 119 8,835 908 56 4,152 4,474 1985
1986 626,203 57 2,908 1,464 319,232 3,206 118,286 15,206 342,585 98,470 119 74,452 11,156 68,592 620,545 609,326 39,878 180,963 1,135,782 600 5,340 1,051 59 4,388 4,703 1986
1987 720,571 124 3,251 1,467 393,541 3,645 142,632 18,518 356,637 115,839 154 84,330 11,635 82,602 690,497 683,288 44,197 198,162 1,302,824 2,874 5,935 1,228 69 4,657 4,969 1987
1988 792,431 246 3,446 1,590 465,245 4,324 164,818 20,693 383,448 138,023 218 96,075 12,344 95,885 814,704 799,835 52,059 229,607 1,563,521 15,444 5,403 1,539 76 5,021 5,360 1988
1989 882,766 303 3,954 1,757 536,268 4,967 197,786 26,308 412,987 155,797 412 109,467 12,860 111,083 928,623 926,248 59,800 260,535 1,861,701 28,140 5,881 1,731 125 5,405 5,768 1989
1990 992,861 753 4,376 1,983 598,950 5,788 232,278 37,202 445,410 187,976 586 123,885 12,153 129,299 1,033,570 1,078,233 68,309 333,680 2,189,438 42,030 6,439 1,935 152 5,718 6,170 1990
1991 1,094,315 1,680 4,897 2,046 690,324 6,638 275,397 51,849 472,135 227,309 690 140,592 21,960 160,582 1,226,869 1,249,239 76,048 388,090 2,513,833 76,853 6,460 2,258 187 5,898 6,510 1991
1992 1,182,254 3,153 5,467 2,307 805,082 7,645 311,176 70,815 483,535 259,294 808 156,799 53,354 184,208 1,454,495 1,352,975 82,569 442,736 2,839,565 110,756 6,890 2,757 250 6,235 6,738 1992
1993 1,239,070 6,828 6,035 2,527 927,996 8,726 363,454 100,985 486,380 293,443 909 179,209 211,835 214,079 1,608,754 1,476,100 95,556 524,601 3,175,515 140,560 6,698 3,694 361 6,558 6,870 1993
1994 1,338,115 7,121 6,603 2,679 1,047,470 10,249 421,338 131,822 490,942 343,743 1,059 203,453 354,089 235,472 1,884,547 1,694,940 109,611 608,051 3,641,900 178,943 6,299 5,022 474 6,973 7,212 1994
1995 1,507,725 8,454 7,188 2,777 1,115,739 12,021 501,138 189,053 497,424 402,361 1,368 231,605 593,998 267,435 2,252,871 1,908,357 121,135 695,478 4,201,628 229,450 6,769 6,322 606 7,303 7,552 1995
1996 1,644,364 9,226 7,809 2,995 1,229,481 13,914 587,331 252,683 507,152 452,747 1,651 264,189 706,514 301,402 2,560,272 2,174,839 132,072 810,017 4,629,110 272,743 7,281 7,416 794 7,717 7,849 1996
1997 1,787,061 10,173 8,462 3,031 1,365,024 15,399 692,406 301,300 517,848 497,301 2,105 293,459 890,286 323,265 2,932,891 2,430,211 144,500 935,734 4,752,345 314,490 7,791 8,166 1,113 8,199 8,214 1997
1998 1,980,780 11,755 9,075 3,301 1,292,764 17,679 1,054,553 339,310 507,437 492,109 4,056 295,021 918,037 367,548 3,234,654 2,669,113 139,756 1,062,138 4,646,977 362,078 6,854 8,653 1,565 8,650 8,590 1998
1999 2,173,999 13,418 9,506 3,836 1,266,668 19,644 1,213,744 460,168 500,230 539,133 9,885 313,332 1,041,813 407,819 3,550,322 2,981,723 141,651 1,156,290 4,658,976 401,192 7,896 9,113 2,197 9,199 8,943 1999
2000 2,346,501 14,129 10,027 3,596 1,317,650 21,227 1,396,460 600,325 505,594 592,279 13,085 357,631 1,174,100 442,009 3,839,656 3,321,490 161,003 1,307,816 4,947,468 443,115 10,510 9,875 2,561 9,788 9,530 2000
2001 2,510,050 15,689 9,766 3,792 1,299,218 23,037 1,654,755 685,618 500,289 636,921 15,034 353,875 1,284,778 459,985 4,225,731 3,638,130 155,023 1,457,284 5,160,953 482,999 10,212 10,903 3,561 10,121 10,045 2001
2002 2,705,344 16,844 10,248 4,044 1,277,314 24,804 1,831,764 940,908 494,194 703,525 17,622 384,711 1,414,944 492,849 4,470,502 3,971,603 159,916 1,639,066 5,481,659 537,780 10,658 12,048 5,646 10,472 10,448 2002
2003 2,976,398 18,609 10,538 4,407 1,234,761 27,802 2,025,355 1,158,764 493,182 748,651 21,564 420,511 1,662,755 537,466 4,896,445 4,325,360 164,412 1,826,059 5,953,201 615,902 11,635 13,663 7,748 10,976 10,709 2003
2004 3,297,909 21,530 11,207 4,745 1,291,923 31,840 2,309,998 1,483,478 501,240 808,869 25,478 476,147 2,155,392 590,250 5,666,184 4,882,314 187,534 2,095,225 6,531,293 718,358 13,549 16,080 9,118 11,686 11,235 2004
2005 3,670,932 25,871 11,588 5,106 1,382,590 36,468 2,792,505 1,860,616 504,526 846,381 29,322 524,907 2,784,110 655,074 6,531,178 5,456,834 204,470 2,458,254 7,141,530 843,021 16,154 18,713 12,343 12,450 11,766 2005
2006 4,117,319 29,994 12,095 5,395 1,475,357 42,096 3,362,558 2,257,603 509,945 888,936 33,945 577,322 3,721,399 728,999 7,662,390 6,046,248 225,989 2,945,657 7,907,476 978,972 18,561 22,224 16,796 13,210 12,438 2006
2007 4,678,880 35,222 12,754 5,509 1,615,455 48,622 3,980,282 2,928,627 518,049 953,761 40,675 645,475 4,608,034 817,061 8,720,447 6,665,029 260,670 3,587,730 8,596,070 1,149,594 18,794 26,583 23,727 13,850 13,144 2007
2008 5,406,510 42,198 12,545 5,711 1,675,315 54,734 4,990,550 3,558,115 507,087 1,004,078 46,452 745,115 6,031,666 993,124 10,302,420 7,444,237 268,174 4,422,540 9,150,485 1,485,800 20,789 31,490 32,563 14,128 13,159 2008
Unit: Local currency unit.
Bangladesh Million Taka Hong Kong Million Hong Kong Dollars Japan Billion Yen
Cambodia Billion Riels India Billion Rupees Korea Billion Won
ROC Billion New Taiwan Dollars Indonesia Billion Rupiahs Lao PDR Billion Kips
Fiji Million Fiji Dollars Iran Billion Rials Malaysia Million Ringgit
Note: See the note in Data 1.

119
Bangladesh Cambodia ROC Fiji Hong Kong India Indonesia Iran Japan Korea Lao PDR Malaysia Mongolia Nepal Pakistan Philippines Singapore Sri Lanka Thailand Vietnam Brunei China Myanmar US EU15
1970 70,953 13 227 192 23,100 471 3,587 800 74,411 2,726 n.a. 12,290 4,132 n.a. 57,702 39,138 5,835 15,441 147,500 n.a. 622 221 13 1,028 1,199 1970
1971 69,053 18 263 212 26,647 504 4,086 998 81,875 3,373 n.a. 13,460 4,483 n.a. 61,378 46,213 6,877 15,758 153,544 n.a. 684 239 13 1,115 1,302 1971
1972 62,020 9 316 261 32,168 556 4,932 1,235 93,736 4,166 n.a. 14,775 4,722 n.a. 66,071 51,704 8,238 17,708 170,226 n.a. 867 245 14 1,225 1,419 1972
1973 94,242 13 410 338 41,284 676 7,297 1,772 114,113 5,401 n.a. 19,455 5,422 n.a. 81,566 66,192 10,313 21,047 222,318 n.a. 1,208 267 16 1,368 1,593 1973
1974 154,728 11 549 450 47,165 798 11,616 2,991 136,153 7,706 n.a. 23,753 5,835 18,663 106,479 91,876 12,699 25,814 279,485 n.a. 2,969 274 19 1,482 1,778 1974
1975 137,253 11 590 563 49,567 858 13,737 3,329 150,429 10,291 n.a. 23,207 6,236 19,590 134,380 105,677 13,563 29,016 303,641 n.a. 3,145 295 23 1,615 1,934 1975
1976 144,326 11 708 624 63,141 924 16,826 4,479 168,967 14,154 n.a. 29,187 6,762 19,462 157,570 124,637 14,798 32,264 346,908 2 3,993 297 27 1,802 2,140 1976
1977 180,649 11 831 661 73,222 1,047 20,688 5,270 188,331 18,173 n.a. 33,610 7,321 22,225 181,009 142,104 16,168 38,725 404,014 2 4,801 317 30 2,005 2,339 1977
1978 216,553 11 994 703 85,698 1,134 24,823 5,138 207,439 24,501 n.a. 39,376 8,158 25,021 213,157 163,709 18,037 46,751 488,851 2 5,015 361 32 2,263 2,581 1978
1979 243,936 11 1,200 853 112,533 1,244 34,975 6,062 224,903 31,479 n.a. 48,253 7,624 26,301 235,631 200,456 20,777 57,620 559,622 3 6,928 409 35 2,530 2,897 1979
1980 287,970 11 1,501 985 143,402 1,480 49,849 6,435 243,973 38,413 n.a. 55,411 8,093 30,735 283,115 243,870 25,403 71,700 663,442 3 11,994 459 39 2,755 3,208 1980
1981 318,596 11 1,789 1,057 172,965 1,739 59,178 7,758 262,235 48,428 6 59,890 8,897 34,904 335,382 281,745 29,750 88,688 761,529 8 10,490 501 43 3,094 3,516 1981
1982 357,858 10 1,917 1,114 195,408 1,946 65,189 10,250 275,378 55,668 10 65,077 9,831 38,028 390,821 317,355 33,198 102,332 842,950 16 10,385 559 47 3,218 3,765 1982
1983 403,967 13 2,142 1,143 216,383 2,266 85,427 12,827 286,503 65,498 19 73,238 10,499 44,370 439,354 369,298 37,263 125,078 922,597 21 9,249 622 50 3,480 3,981 1983
1984 484,602 22 2,385 1,277 260,761 2,538 100,204 14,053 304,555 75,161 28 82,712 10,779 50,033 506,210 524,815 40,716 154,613 989,906 34 9,190 736 54 3,876 4,233 1984
1985 555,983 21 2,486 1,318 276,823 2,865 108,324 14,961 327,236 84,174 81 80,556 11,230 59,859 569,388 572,271 39,708 165,553 1,058,585 119 8,835 908 56 4,152 4,474 1985
1986 626,203 57 2,908 1,464 319,232 3,206 118,286 15,206 342,585 98,470 119 74,452 11,156 68,592 620,545 609,326 39,878 180,963 1,135,782 600 5,340 1,051 59 4,388 4,703 1986
1987 720,571 124 3,251 1,467 393,541 3,645 142,632 18,518 356,637 115,839 154 84,330 11,635 82,602 690,497 683,288 44,197 198,162 1,302,824 2,874 5,935 1,228 69 4,657 4,969 1987
1988 792,431 246 3,446 1,590 465,245 4,324 164,818 20,693 383,448 138,023 218 96,075 12,344 95,885 814,704 799,835 52,059 229,607 1,563,521 15,444 5,403 1,539 76 5,021 5,360 1988
1989 882,766 303 3,954 1,757 536,268 4,967 197,786 26,308 412,987 155,797 412 109,467 12,860 111,083 928,623 926,248 59,800 260,535 1,861,701 28,140 5,881 1,731 125 5,405 5,768 1989
1990 992,861 753 4,376 1,983 598,950 5,788 232,278 37,202 445,410 187,976 586 123,885 12,153 129,299 1,033,570 1,078,233 68,309 333,680 2,189,438 42,030 6,439 1,935 152 5,718 6,170 1990
1991 1,094,315 1,680 4,897 2,046 690,324 6,638 275,397 51,849 472,135 227,309 690 140,592 21,960 160,582 1,226,869 1,249,239 76,048 388,090 2,513,833 76,853 6,460 2,258 187 5,898 6,510 1991
1992 1,182,254 3,153 5,467 2,307 805,082 7,645 311,176 70,815 483,535 259,294 808 156,799 53,354 184,208 1,454,495 1,352,975 82,569 442,736 2,839,565 110,756 6,890 2,757 250 6,235 6,738 1992
1993 1,239,070 6,828 6,035 2,527 927,996 8,726 363,454 100,985 486,380 293,443 909 179,209 211,835 214,079 1,608,754 1,476,100 95,556 524,601 3,175,515 140,560 6,698 3,694 361 6,558 6,870 1993
1994 1,338,115 7,121 6,603 2,679 1,047,470 10,249 421,338 131,822 490,942 343,743 1,059 203,453 354,089 235,472 1,884,547 1,694,940 109,611 608,051 3,641,900 178,943 6,299 5,022 474 6,973 7,212 1994
1995 1,507,725 8,454 7,188 2,777 1,115,739 12,021 501,138 189,053 497,424 402,361 1,368 231,605 593,998 267,435 2,252,871 1,908,357 121,135 695,478 4,201,628 229,450 6,769 6,322 606 7,303 7,552 1995
1996 1,644,364 9,226 7,809 2,995 1,229,481 13,914 587,331 252,683 507,152 452,747 1,651 264,189 706,514 301,402 2,560,272 2,174,839 132,072 810,017 4,629,110 272,743 7,281 7,416 794 7,717 7,849 1996
1997 1,787,061 10,173 8,462 3,031 1,365,024 15,399 692,406 301,300 517,848 497,301 2,105 293,459 890,286 323,265 2,932,891 2,430,211 144,500 935,734 4,752,345 314,490 7,791 8,166 1,113 8,199 8,214 1997
1998 1,980,780 11,755 9,075 3,301 1,292,764 17,679 1,054,553 339,310 507,437 492,109 4,056 295,021 918,037 367,548 3,234,654 2,669,113 139,756 1,062,138 4,646,977 362,078 6,854 8,653 1,565 8,650 8,590 1998
1999 2,173,999 13,418 9,506 3,836 1,266,668 19,644 1,213,744 460,168 500,230 539,133 9,885 313,332 1,041,813 407,819 3,550,322 2,981,723 141,651 1,156,290 4,658,976 401,192 7,896 9,113 2,197 9,199 8,943 1999
2000 2,346,501 14,129 10,027 3,596 1,317,650 21,227 1,396,460 600,325 505,594 592,279 13,085 357,631 1,174,100 442,009 3,839,656 3,321,490 161,003 1,307,816 4,947,468 443,115 10,510 9,875 2,561 9,788 9,530 2000
2001 2,510,050 15,689 9,766 3,792 1,299,218 23,037 1,654,755 685,618 500,289 636,921 15,034 353,875 1,284,778 459,985 4,225,731 3,638,130 155,023 1,457,284 5,160,953 482,999 10,212 10,903 3,561 10,121 10,045 2001
2002 2,705,344 16,844 10,248 4,044 1,277,314 24,804 1,831,764 940,908 494,194 703,525 17,622 384,711 1,414,944 492,849 4,470,502 3,971,603 159,916 1,639,066 5,481,659 537,780 10,658 12,048 5,646 10,472 10,448 2002
2003 2,976,398 18,609 10,538 4,407 1,234,761 27,802 2,025,355 1,158,764 493,182 748,651 21,564 420,511 1,662,755 537,466 4,896,445 4,325,360 164,412 1,826,059 5,953,201 615,902 11,635 13,663 7,748 10,976 10,709 2003
2004 3,297,909 21,530 11,207 4,745 1,291,923 31,840 2,309,998 1,483,478 501,240 808,869 25,478 476,147 2,155,392 590,250 5,666,184 4,882,314 187,534 2,095,225 6,531,293 718,358 13,549 16,080 9,118 11,686 11,235 2004
2005 3,670,932 25,871 11,588 5,106 1,382,590 36,468 2,792,505 1,860,616 504,526 846,381 29,322 524,907 2,784,110 655,074 6,531,178 5,456,834 204,470 2,458,254 7,141,530 843,021 16,154 18,713 12,343 12,450 11,766 2005
2006 4,117,319 29,994 12,095 5,395 1,475,357 42,096 3,362,558 2,257,603 509,945 888,936 33,945 577,322 3,721,399 728,999 7,662,390 6,046,248 225,989 2,945,657 7,907,476 978,972 18,561 22,224 16,796 13,210 12,438 2006
2007 4,678,880 35,222 12,754 5,509 1,615,455 48,622 3,980,282 2,928,627 518,049 953,761 40,675 645,475 4,608,034 817,061 8,720,447 6,665,029 260,670 3,587,730 8,596,070 1,149,594 18,794 26,583 23,727 13,850 13,144 2007
2008 5,406,510 42,198 12,545 5,711 1,675,315 54,734 4,990,550 3,558,115 507,087 1,004,078 46,452 745,115 6,031,666 993,124 10,302,420 7,444,237 268,174 4,422,540 9,150,485 1,485,800 20,789 31,490 32,563 14,128 13,159 2008
Mongolia Million Tugriks Singapore Million Singapore Dollars Brunei Million Brunei Dollars EU15 Billion US Dollars
Nepal Million Rupees Sri Lanka Million Rupees China Billion Yuan
Pakistan Million Rupees Thailand Million Baht Myanmar Billion Kyats
Philippines Million Pesos Vietnam Billion Dong US Billion US Dollars
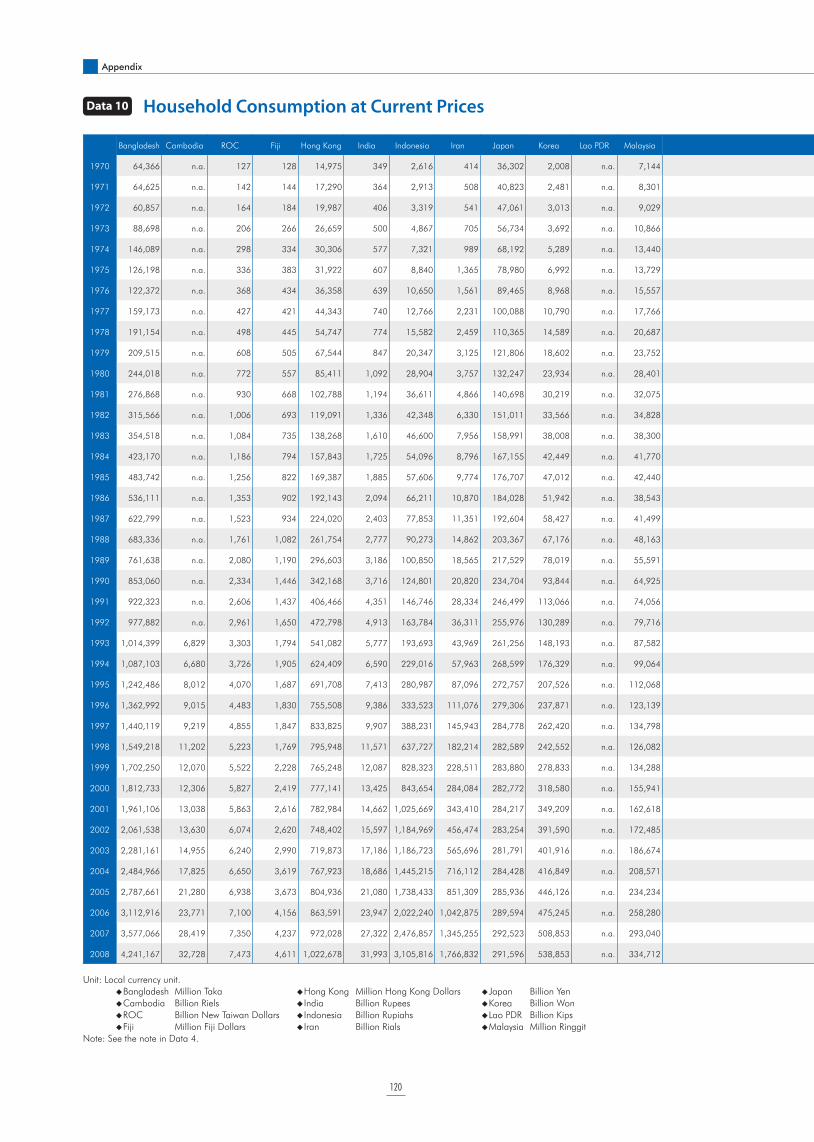
120
Appendix
Data 10 Household Consumption at Current Prices
Unit: Local currency unit.
Bangladesh Million Taka Hong Kong Million Hong Kong Dollars Japan Billion Yen
Cambodia Billion Riels India Billion Rupees Korea Billion Won
ROC Billion New Taiwan Dollars Indonesia Billion Rupiahs Lao PDR Billion Kips
Fiji Million Fiji Dollars Iran Billion Rials Malaysia Million Ringgit
Note: See the note in Data 4.
Bangladesh Cambodia ROC Fiji Hong Kong India Indonesia Iran Japan Korea Lao PDR Malaysia Mongolia Nepal Pakistan Philippines Singapore Sri Lanka Thailand Vietnam Brunei China Myanmar US EU15
1970 64,366 n.a. 127 128 14,975 349 2,616 414 36,302 2,008 n.a. 7,144 n.a. n.a. 43,607 27,956 3,995 11,237 99,505 n.a. n.a. 121 10 638 689 1970
1971 64,625 n.a. 142 144 17,290 364 2,913 508 40,823 2,481 n.a. 8,301 n.a. n.a. 46,530 33,297 4,620 11,699 102,937 n.a. n.a. 126 10 690 748 1971
1972 60,857 n.a. 164 184 19,987 406 3,319 541 47,061 3,013 n.a. 9,029 n.a. n.a. 49,860 36,906 5,115 13,493 116,324 n.a. n.a. 133 11 758 819 1972
1973 88,698 n.a. 206 266 26,659 500 4,867 705 56,734 3,692 n.a. 10,866 n.a. n.a. 61,612 43,775 6,048 16,031 143,723 n.a. n.a. 143 14 838 912 1973
1974 146,089 n.a. 298 334 30,306 577 7,321 989 68,192 5,289 n.a. 13,440 n.a. 15,862 84,905 61,893 7,548 21,641 185,363 n.a. n.a. 147 15 916 1,025 1974
1975 126,198 n.a. 336 383 31,922 607 8,840 1,365 78,980 6,992 n.a. 13,729 n.a. 16,359 107,033 71,755 8,012 24,470 204,883 n.a. n.a. 153 18 1,011 1,131 1975
1976 122,372 n.a. 368 434 36,358 639 10,650 1,561 89,465 8,968 n.a. 15,557 n.a. 17,142 120,182 82,061 8,280 25,208 233,956 n.a. n.a. 159 21 1,129 1,244 1976
1977 159,173 n.a. 427 421 44,343 740 12,766 2,231 100,088 10,790 n.a. 17,766 n.a. 18,324 137,735 93,536 8,835 28,858 273,993 n.a. n.a. 165 22 1,253 1,361 1977
1978 191,154 n.a. 498 445 54,747 774 15,582 2,459 110,365 14,589 n.a. 20,687 n.a. 20,726 167,043 110,212 9,772 33,949 316,786 n.a. n.a. 176 23 1,397 1,488 1978
1979 209,515 n.a. 608 505 67,544 847 20,347 3,125 121,806 18,602 n.a. 23,752 n.a. 22,374 188,642 132,929 11,002 42,813 377,603 n.a. n.a. 201 25 1,559 1,676 1979
1980 244,018 n.a. 772 557 85,411 1,092 28,904 3,757 132,247 23,934 n.a. 28,401 4,826 26,076 225,321 163,222 13,025 56,625 429,435 n.a. n.a. 233 27 1,723 1,873 1980
1981 276,868 n.a. 930 668 102,788 1,194 36,611 4,866 140,698 30,219 n.a. 32,075 4,746 29,483 265,927 189,648 14,414 68,747 485,415 n.a. n.a. 263 30 1,907 2,080 1981
1982 315,566 n.a. 1,006 693 119,091 1,336 42,348 6,330 151,011 33,566 n.a. 34,828 4,761 32,207 312,753 218,905 14,747 81,702 522,659 n.a. n.a. 290 34 2,040 2,234 1982
1983 354,518 n.a. 1,084 735 138,268 1,610 46,600 7,956 158,991 38,008 n.a. 38,300 5,900 37,316 347,200 254,010 15,596 98,350 592,305 n.a. n.a. 323 37 2,234 2,357 1983
1984 423,170 n.a. 1,186 794 157,843 1,725 54,096 8,796 167,155 42,449 n.a. 41,770 6,008 39,888 401,253 379,152 17,238 114,747 608,911 n.a. n.a. 374 41 2,446 2,498 1984
1985 483,742 n.a. 1,256 822 169,387 1,885 57,606 9,774 176,707 47,012 n.a. 42,440 6,238 49,601 457,855 429,636 17,846 125,608 643,990 n.a. n.a. 469 43 2,652 2,637 1985
1986 536,111 n.a. 1,353 902 192,143 2,094 66,211 10,870 184,028 51,942 n.a. 38,543 6,567 56,231 470,926 439,878 19,310 138,578 672,558 544 n.a. 530 46 2,824 2,756 1986
1987 622,799 n.a. 1,523 934 224,020 2,403 77,853 11,351 192,604 58,427 n.a. 41,499 7,228 69,153 502,292 500,010 22,075 146,983 783,062 2,529 n.a. 613 55 3,018 2,922 1987
1988 683,336 n.a. 1,761 1,082 261,754 2,777 90,273 14,862 203,367 67,176 n.a. 48,163 7,703 78,079 591,852 566,837 25,149 172,974 916,414 13,932 n.a. 787 57 3,271 3,131 1988
1989 761,638 n.a. 2,080 1,190 296,603 3,186 100,850 18,565 217,529 78,019 n.a. 55,591 7,351 95,489 661,656 649,922 27,809 196,188 1,076,630 24,732 1,777 881 97 3,518 3,372 1989
1990 853,060 n.a. 2,334 1,446 342,168 3,716 124,801 20,820 234,704 93,844 n.a. 64,925 7,602 108,457 742,634 763,837 31,889 251,596 1,239,383 36,642 2,218 945 113 3,753 3,583 1990
1991 922,323 n.a. 2,606 1,437 406,466 4,351 146,746 28,334 246,499 113,066 n.a. 74,056 11,855 134,488 848,717 911,070 34,093 291,314 1,365,628 64,071 1,936 1,073 139 3,886 3,792 1991
1992 977,882 n.a. 2,961 1,650 472,798 4,913 163,784 36,311 255,976 130,289 n.a. 79,716 28,780 148,281 1,020,746 1,001,039 37,195 331,476 1,532,877 87,897 2,963 1,300 193 4,129 3,951 1992
1993 1,014,399 6,829 3,303 1,794 541,082 5,777 193,693 43,969 261,256 148,193 n.a. 87,582 112,797 171,089 1,155,429 1,099,071 42,898 384,911 1,717,018 108,255 2,754 1,641 282 4,374 4,050 1993
1994 1,087,103 6,680 3,726 1,905 624,409 6,590 229,016 57,963 268,599 176,329 n.a. 99,064 188,259 186,467 1,342,216 1,212,683 47,373 446,848 1,989,792 135,179 2,600 2,184 371 4,638 4,236 1994
1995 1,242,486 8,012 4,070 1,687 691,708 7,413 280,987 87,096 272,757 207,526 n.a. 112,068 353,837 215,215 1,634,497 1,413,362 49,977 495,641 2,291,871 168,839 2,194 2,837 473 4,875 4,402 1995
1996 1,362,992 9,015 4,483 1,830 755,508 9,386 333,523 111,076 279,306 237,871 n.a. 123,139 450,174 242,671 1,865,333 1,585,518 52,273 563,188 2,502,686 202,704 2,465 3,396 631 5,152 4,594 1996
1997 1,440,119 9,219 4,855 1,847 833,825 9,907 388,231 145,943 284,778 262,420 n.a. 134,798 462,990 259,049 2,192,455 1,760,853 56,648 635,906 2,595,745 224,325 3,136 3,692 887 5,438 4,793 1997
1998 1,549,218 11,202 5,223 1,769 795,948 11,571 637,727 182,214 282,589 242,552 n.a. 126,082 597,511 295,064 2,353,795 1,949,470 52,987 709,643 2,433,737 254,991 2,931 3,923 1,263 5,775 5,014 1998
1999 1,702,250 12,070 5,522 2,228 765,248 12,087 828,323 228,511 283,880 278,833 n.a. 134,288 648,489 322,562 2,699,113 2,028,912 57,840 793,975 2,570,473 273,720 3,320 4,192 1,763 6,188 5,234 1999
2000 1,812,733 12,306 5,827 2,419 777,141 13,425 843,654 284,084 282,772 318,580 n.a. 155,941 822,041 354,231 2,884,021 2,171,250 66,255 929,917 2,815,781 294,426 3,062 4,585 1,991 6,667 5,599 2000
2001 1,961,106 13,038 5,863 2,616 782,984 14,662 1,025,669 343,410 284,217 349,209 n.a. 162,618 954,299 377,257 3,211,093 2,616,530 71,064 1,031,799 2,982,120 312,897 2,593 4,944 2,896 6,984 5,906 2001
2002 2,061,538 13,630 6,074 2,620 748,402 15,597 1,184,969 456,474 283,254 391,590 n.a. 172,485 1,073,536 407,438 3,329,860 2,831,058 74,755 1,172,089 3,184,679 353,361 2,727 5,306 4,773 7,269 6,109 2002
2003 2,281,161 14,955 6,240 2,990 719,873 17,186 1,186,723 565,696 281,791 401,916 n.a. 186,674 1,109,827 427,289 3,600,963 3,373,950 72,427 1,314,607 3,402,598 409,937 3,147 5,765 6,569 7,638 6,268 2003
2004 2,484,966 17,825 6,650 3,619 767,923 18,686 1,445,215 716,112 284,428 416,849 n.a. 208,571 1,280,788 468,848 4,184,717 3,747,133 78,006 1,491,840 3,715,136 471,487 3,653 6,522 7,523 8,103 6,550 2004
2005 2,787,661 21,280 6,938 3,673 804,936 21,080 1,738,433 851,309 285,936 446,126 n.a. 234,234 1,511,023 538,533 5,001,499 4,355,067 81,619 1,706,267 4,098,472 525,858 4,338 7,265 10,220 8,631 6,874 2005
2006 3,112,916 23,771 7,100 4,156 863,591 23,947 2,022,240 1,042,875 289,594 475,245 n.a. 258,280 1,745,857 589,425 5,720,225 4,616,041 86,532 2,003,618 4,430,518 601,871 4,555 8,210 13,300 9,134 7,214 2006
2007 3,577,066 28,419 7,350 4,237 972,028 27,322 2,476,857 1,345,255 292,523 508,853 n.a. 293,040 2,083,382 654,807 6,543,843 4,954,729 96,611 2,422,535 4,521,926 763,113 4,511 9,561 18,826 9,594 7,549 2007
2008 4,241,167 32,728 7,473 4,611 1,022,678 31,993 3,105,816 1,766,832 291,596 538,853 n.a. 334,712 2,894,847 788,515 7,835,309 5,711,441 103,101 3,099,700 5,078,299 1,024,348 3,776 11,059 25,690 9,863 7,570 2008

121
Mongolia Million Tugriks Singapore Million Singapore Dollars Brunei Million Brunei Dollars EU15 Billion US Dollars
Nepal Million Rupees Sri Lanka Million Rupees China Billion Yuan
Pakistan Million Rupees Thailand Million Baht Myanmar Billion Kyats
Philippines Million Pesos Vietnam Billion Dong US Billion US Dollars
Bangladesh Cambodia ROC Fiji Hong Kong India Indonesia Iran Japan Korea Lao PDR Malaysia Mongolia Nepal Pakistan Philippines Singapore Sri Lanka Thailand Vietnam Brunei China Myanmar US EU15
1970 64,366 n.a. 127 128 14,975 349 2,616 414 36,302 2,008 n.a. 7,144 n.a. n.a. 43,607 27,956 3,995 11,237 99,505 n.a. n.a. 121 10 638 689 1970
1971 64,625 n.a. 142 144 17,290 364 2,913 508 40,823 2,481 n.a. 8,301 n.a. n.a. 46,530 33,297 4,620 11,699 102,937 n.a. n.a. 126 10 690 748 1971
1972 60,857 n.a. 164 184 19,987 406 3,319 541 47,061 3,013 n.a. 9,029 n.a. n.a. 49,860 36,906 5,115 13,493 116,324 n.a. n.a. 133 11 758 819 1972
1973 88,698 n.a. 206 266 26,659 500 4,867 705 56,734 3,692 n.a. 10,866 n.a. n.a. 61,612 43,775 6,048 16,031 143,723 n.a. n.a. 143 14 838 912 1973
1974 146,089 n.a. 298 334 30,306 577 7,321 989 68,192 5,289 n.a. 13,440 n.a. 15,862 84,905 61,893 7,548 21,641 185,363 n.a. n.a. 147 15 916 1,025 1974
1975 126,198 n.a. 336 383 31,922 607 8,840 1,365 78,980 6,992 n.a. 13,729 n.a. 16,359 107,033 71,755 8,012 24,470 204,883 n.a. n.a. 153 18 1,011 1,131 1975
1976 122,372 n.a. 368 434 36,358 639 10,650 1,561 89,465 8,968 n.a. 15,557 n.a. 17,142 120,182 82,061 8,280 25,208 233,956 n.a. n.a. 159 21 1,129 1,244 1976
1977 159,173 n.a. 427 421 44,343 740 12,766 2,231 100,088 10,790 n.a. 17,766 n.a. 18,324 137,735 93,536 8,835 28,858 273,993 n.a. n.a. 165 22 1,253 1,361 1977
1978 191,154 n.a. 498 445 54,747 774 15,582 2,459 110,365 14,589 n.a. 20,687 n.a. 20,726 167,043 110,212 9,772 33,949 316,786 n.a. n.a. 176 23 1,397 1,488 1978
1979 209,515 n.a. 608 505 67,544 847 20,347 3,125 121,806 18,602 n.a. 23,752 n.a. 22,374 188,642 132,929 11,002 42,813 377,603 n.a. n.a. 201 25 1,559 1,676 1979
1980 244,018 n.a. 772 557 85,411 1,092 28,904 3,757 132,247 23,934 n.a. 28,401 4,826 26,076 225,321 163,222 13,025 56,625 429,435 n.a. n.a. 233 27 1,723 1,873 1980
1981 276,868 n.a. 930 668 102,788 1,194 36,611 4,866 140,698 30,219 n.a. 32,075 4,746 29,483 265,927 189,648 14,414 68,747 485,415 n.a. n.a. 263 30 1,907 2,080 1981
1982 315,566 n.a. 1,006 693 119,091 1,336 42,348 6,330 151,011 33,566 n.a. 34,828 4,761 32,207 312,753 218,905 14,747 81,702 522,659 n.a. n.a. 290 34 2,040 2,234 1982
1983 354,518 n.a. 1,084 735 138,268 1,610 46,600 7,956 158,991 38,008 n.a. 38,300 5,900 37,316 347,200 254,010 15,596 98,350 592,305 n.a. n.a. 323 37 2,234 2,357 1983
1984 423,170 n.a. 1,186 794 157,843 1,725 54,096 8,796 167,155 42,449 n.a. 41,770 6,008 39,888 401,253 379,152 17,238 114,747 608,911 n.a. n.a. 374 41 2,446 2,498 1984
1985 483,742 n.a. 1,256 822 169,387 1,885 57,606 9,774 176,707 47,012 n.a. 42,440 6,238 49,601 457,855 429,636 17,846 125,608 643,990 n.a. n.a. 469 43 2,652 2,637 1985
1986 536,111 n.a. 1,353 902 192,143 2,094 66,211 10,870 184,028 51,942 n.a. 38,543 6,567 56,231 470,926 439,878 19,310 138,578 672,558 544 n.a. 530 46 2,824 2,756 1986
1987 622,799 n.a. 1,523 934 224,020 2,403 77,853 11,351 192,604 58,427 n.a. 41,499 7,228 69,153 502,292 500,010 22,075 146,983 783,062 2,529 n.a. 613 55 3,018 2,922 1987
1988 683,336 n.a. 1,761 1,082 261,754 2,777 90,273 14,862 203,367 67,176 n.a. 48,163 7,703 78,079 591,852 566,837 25,149 172,974 916,414 13,932 n.a. 787 57 3,271 3,131 1988
1989 761,638 n.a. 2,080 1,190 296,603 3,186 100,850 18,565 217,529 78,019 n.a. 55,591 7,351 95,489 661,656 649,922 27,809 196,188 1,076,630 24,732 1,777 881 97 3,518 3,372 1989
1990 853,060 n.a. 2,334 1,446 342,168 3,716 124,801 20,820 234,704 93,844 n.a. 64,925 7,602 108,457 742,634 763,837 31,889 251,596 1,239,383 36,642 2,218 945 113 3,753 3,583 1990
1991 922,323 n.a. 2,606 1,437 406,466 4,351 146,746 28,334 246,499 113,066 n.a. 74,056 11,855 134,488 848,717 911,070 34,093 291,314 1,365,628 64,071 1,936 1,073 139 3,886 3,792 1991
1992 977,882 n.a. 2,961 1,650 472,798 4,913 163,784 36,311 255,976 130,289 n.a. 79,716 28,780 148,281 1,020,746 1,001,039 37,195 331,476 1,532,877 87,897 2,963 1,300 193 4,129 3,951 1992
1993 1,014,399 6,829 3,303 1,794 541,082 5,777 193,693 43,969 261,256 148,193 n.a. 87,582 112,797 171,089 1,155,429 1,099,071 42,898 384,911 1,717,018 108,255 2,754 1,641 282 4,374 4,050 1993
1994 1,087,103 6,680 3,726 1,905 624,409 6,590 229,016 57,963 268,599 176,329 n.a. 99,064 188,259 186,467 1,342,216 1,212,683 47,373 446,848 1,989,792 135,179 2,600 2,184 371 4,638 4,236 1994
1995 1,242,486 8,012 4,070 1,687 691,708 7,413 280,987 87,096 272,757 207,526 n.a. 112,068 353,837 215,215 1,634,497 1,413,362 49,977 495,641 2,291,871 168,839 2,194 2,837 473 4,875 4,402 1995
1996 1,362,992 9,015 4,483 1,830 755,508 9,386 333,523 111,076 279,306 237,871 n.a. 123,139 450,174 242,671 1,865,333 1,585,518 52,273 563,188 2,502,686 202,704 2,465 3,396 631 5,152 4,594 1996
1997 1,440,119 9,219 4,855 1,847 833,825 9,907 388,231 145,943 284,778 262,420 n.a. 134,798 462,990 259,049 2,192,455 1,760,853 56,648 635,906 2,595,745 224,325 3,136 3,692 887 5,438 4,793 1997
1998 1,549,218 11,202 5,223 1,769 795,948 11,571 637,727 182,214 282,589 242,552 n.a. 126,082 597,511 295,064 2,353,795 1,949,470 52,987 709,643 2,433,737 254,991 2,931 3,923 1,263 5,775 5,014 1998
1999 1,702,250 12,070 5,522 2,228 765,248 12,087 828,323 228,511 283,880 278,833 n.a. 134,288 648,489 322,562 2,699,113 2,028,912 57,840 793,975 2,570,473 273,720 3,320 4,192 1,763 6,188 5,234 1999
2000 1,812,733 12,306 5,827 2,419 777,141 13,425 843,654 284,084 282,772 318,580 n.a. 155,941 822,041 354,231 2,884,021 2,171,250 66,255 929,917 2,815,781 294,426 3,062 4,585 1,991 6,667 5,599 2000
2001 1,961,106 13,038 5,863 2,616 782,984 14,662 1,025,669 343,410 284,217 349,209 n.a. 162,618 954,299 377,257 3,211,093 2,616,530 71,064 1,031,799 2,982,120 312,897 2,593 4,944 2,896 6,984 5,906 2001
2002 2,061,538 13,630 6,074 2,620 748,402 15,597 1,184,969 456,474 283,254 391,590 n.a. 172,485 1,073,536 407,438 3,329,860 2,831,058 74,755 1,172,089 3,184,679 353,361 2,727 5,306 4,773 7,269 6,109 2002
2003 2,281,161 14,955 6,240 2,990 719,873 17,186 1,186,723 565,696 281,791 401,916 n.a. 186,674 1,109,827 427,289 3,600,963 3,373,950 72,427 1,314,607 3,402,598 409,937 3,147 5,765 6,569 7,638 6,268 2003
2004 2,484,966 17,825 6,650 3,619 767,923 18,686 1,445,215 716,112 284,428 416,849 n.a. 208,571 1,280,788 468,848 4,184,717 3,747,133 78,006 1,491,840 3,715,136 471,487 3,653 6,522 7,523 8,103 6,550 2004
2005 2,787,661 21,280 6,938 3,673 804,936 21,080 1,738,433 851,309 285,936 446,126 n.a. 234,234 1,511,023 538,533 5,001,499 4,355,067 81,619 1,706,267 4,098,472 525,858 4,338 7,265 10,220 8,631 6,874 2005
2006 3,112,916 23,771 7,100 4,156 863,591 23,947 2,022,240 1,042,875 289,594 475,245 n.a. 258,280 1,745,857 589,425 5,720,225 4,616,041 86,532 2,003,618 4,430,518 601,871 4,555 8,210 13,300 9,134 7,214 2006
2007 3,577,066 28,419 7,350 4,237 972,028 27,322 2,476,857 1,345,255 292,523 508,853 n.a. 293,040 2,083,382 654,807 6,543,843 4,954,729 96,611 2,422,535 4,521,926 763,113 4,511 9,561 18,826 9,594 7,549 2007
2008 4,241,167 32,728 7,473 4,611 1,022,678 31,993 3,105,816 1,766,832 291,596 538,853 n.a. 334,712 2,894,847 788,515 7,835,309 5,711,441 103,101 3,099,700 5,078,299 1,024,348 3,776 11,059 25,690 9,863 7,570 2008

122
Appendix
Data 11 Government Consumption at Current Prices
Unit: Local currency unit.
Bangladesh Million Taka Hong Kong Million Hong Kong Dollars Japan Billion Yen
Cambodia Billion Riels India Billion Rupees Korea Billion Won
ROC Billion New Taiwan Dollars Indonesia Billion Rupiahs Lao PDR Billion Kips
Fiji Million Fiji Dollars Iran Billion Rials Malaysia Million Ringgit
Note: See the note in Data 5.
Bangladesh Cambodia ROC Fiji Hong Kong India Indonesia Iran Japan Korea Lao PDR Malaysia Mongolia Nepal Pakistan Philippines Singapore Sri Lanka Thailand Vietnam Brunei China Myanmar US EU15
1970 757 n.a. 42 27 1,630 45 293 150 7,940 282 n.a. 2,196 n.a. n.a. 4,444 3,721 716 1,709 16,578 n.a. n.a. 25 2 188 196 1970
1971 763 n.a. 46 31 1,741 52 341 201 9,347 357 n.a. 2,204 n.a. n.a. 4,833 4,525 891 1,811 17,676 n.a. n.a. 30 2 202 222 1971
1972 736 n.a. 51 38 2,078 55 414 259 10,970 454 n.a. 2,780 n.a. n.a. 5,941 5,571 1,024 1,902 18,572 n.a. n.a. 31 2 218 245 1972
1973 1,559 n.a. 63 42 2,559 61 716 334 13,589 501 n.a. 2,980 n.a. n.a. 7,083 6,599 1,156 2,406 21,635 n.a. n.a. 32 2 233 276 1973
1974 2,556 n.a. 77 54 3,171 74 841 683 17,816 782 n.a. 3,571 n.a. 1,120 7,831 9,527 1,343 2,762 26,085 n.a. n.a. 34 3 259 321 1974
1975 6,533 n.a. 93 68 3,493 87 1,254 872 21,673 1,208 n.a. 3,985 n.a. 1,153 10,959 11,591 1,471 2,744 31,290 n.a. n.a. 36 3 291 373 1975
1976 7,780 n.a. 107 85 4,008 96 1,591 1,066 23,896 1,660 n.a. 4,368 n.a. 1,123 13,153 13,729 1,594 2,976 38,009 n.a. n.a. 38 4 314 410 1976
1977 8,209 n.a. 128 102 4,655 103 2,077 1,200 26,554 2,118 n.a. 5,472 n.a. 1,311 15,328 14,963 1,775 3,489 42,923 n.a. n.a. 41 4 343 449 1977
1978 10,073 n.a. 151 115 5,436 114 2,659 1,329 28,750 2,685 n.a. 6,185 n.a. 1,684 17,530 16,818 2,031 4,935 54,583 n.a. n.a. 48 4 374 501 1978
1979 11,298 n.a. 184 144 6,755 131 3,733 1,305 31,274 3,411 n.a. 6,575 n.a. 1,395 18,652 19,041 2,101 5,542 66,798 n.a. n.a. 62 4 411 564 1979
1980 13,204 n.a. 241 157 8,706 152 4,688 1,472 34,304 4,968 n.a. 8,948 1,821 1,713 21,583 22,099 2,528 6,784 81,433 n.a. n.a. 68 5 465 643 1980
1981 14,530 n.a. 290 173 12,211 179 5,788 1,788 36,876 6,255 n.a. 10,587 2,126 2,351 26,593 24,661 2,880 7,586 97,007 n.a. n.a. 73 5 520 733 1981
1982 16,455 n.a. 324 204 14,547 211 6,832 2,038 39,158 7,101 n.a. 11,647 2,204 3,045 31,526 28,929 3,686 10,589 110,167 n.a. n.a. 81 6 566 786 1982
1983 18,029 n.a. 346 232 16,336 244 8,077 2,295 41,501 7,975 n.a. 11,186 2,330 3,248 39,129 30,552 4,126 12,949 118,577 n.a. n.a. 90 6 607 832 1983
1984 20,551 n.a. 383 245 18,027 281 9,122 2,336 43,455 8,599 n.a. 11,923 2,442 3,896 47,720 36,880 4,472 15,712 130,100 n.a. n.a. 110 6 655 875 1984
1985 23,347 n.a. 411 252 19,751 334 11,400 2,606 45,371 9,698 n.a. 12,028 2,587 4,514 53,725 43,520 5,729 19,505 142,923 n.a. n.a. 130 7 713 922 1985
1986 27,443 n.a. 430 253 22,843 395 11,529 2,529 47,468 11,072 n.a. 12,315 2,809 5,167 61,753 48,431 5,441 23,391 144,564 30 n.a. 152 7 761 960 1986
1987 31,208 n.a. 477 255 25,672 464 11,764 2,888 49,506 12,660 n.a. 12,247 2,921 6,145 72,869 57,333 5,483 26,661 147,224 173 n.a. 168 8 806 1,020 1987
1988 34,542 n.a. 539 263 29,943 535 12,756 3,413 51,707 15,121 n.a. 13,352 3,137 7,974 98,518 72,183 5,501 30,861 156,710 980 n.a. 197 11 844 1,082 1988
1989 38,378 n.a. 638 304 36,168 613 15,698 3,428 55,046 18,245 n.a. 15,027 3,219 7,985 121,509 88,186 6,195 33,154 176,798 2,204 1,415 235 17 895 1,142 1989
1990 42,137 n.a. 769 346 43,141 698 18,649 4,385 59,025 22,527 n.a. 16,680 3,118 9,880 121,849 108,843 6,977 42,567 205,354 3,164 1,405 264 21 959 1,233 1990
1991 45,714 n.a. 873 357 51,294 788 20,785 5,982 63,074 26,874 n.a. 18,791 4,753 10,613 136,909 123,885 7,566 51,654 231,127 5,055 1,444 336 21 1,008 1,323 1991
1992 53,211 n.a. 931 415 63,795 893 24,731 7,574 66,550 31,699 n.a. 19,908 8,896 13,280 146,306 130,524 7,678 54,908 280,203 7,653 1,590 420 25 1,042 1,397 1992
1993 62,106 306 972 467 72,283 1,035 29,757 16,127 69,350 35,225 n.a. 22,087 44,152 14,249 164,281 149,057 8,979 66,894 315,982 10,279 1,714 549 37 1,066 1,439 1993
1994 66,124 493 997 437 83,148 1,152 31,014 21,558 71,985 39,895 n.a. 24,345 80,139 18,064 177,844 182,776 9,273 76,748 354,387 14,738 1,687 740 46 1,101 1,482 1994
1995 70,614 493 1,065 446 93,624 1,365 35,584 30,360 75,121 45,715 n.a. 27,954 71,397 20,516 206,080 217,045 10,432 98,944 414,403 18,741 1,795 838 51 1,133 1,530 1995
1996 73,245 529 1,172 474 103,541 1,548 40,299 36,022 77,348 53,292 n.a. 28,615 91,657 22,270 252,137 259,501 12,575 113,757 469,516 22,722 1,819 996 70 1,169 1,593 1996
1997 78,864 590 1,280 508 112,751 1,831 42,952 39,301 78,967 57,978 n.a. 30,812 112,048 24,969 271,619 319,935 13,564 128,711 476,705 25,500 1,942 1,122 90 1,214 1,637 1997
1998 94,671 672 1,364 573 116,550 2,267 54,416 48,513 80,305 63,101 n.a. 28,099 144,566 27,210 283,658 354,406 14,280 145,803 511,691 27,523 2,025 1,236 132 1,255 1,686 1998
1999 100,825 786 1,332 608 119,993 2,663 72,631 57,912 82,207 66,309 n.a. 33,556 157,128 30,272 286,294 389,238 14,406 155,632 533,041 27,137 2,231 1,372 139 1,334 1,767 1999
2000 108,386 986 1,363 632 120,172 2,793 90,780 82,109 84,942 72,101 n.a. 36,229 180,330 35,785 330,691 438,858 17,932 179,948 557,807 28,346 2,671 1,566 246 1,416 1,882 2000
2001 114,251 1,082 1,391 672 128,866 2,969 113,416 96,739 87,122 83,010 n.a. 42,448 210,538 38,586 327,562 444,834 19,016 191,646 581,117 30,463 2,950 1,750 244 1,516 2,000 2001
2002 136,641 1,276 1,412 699 131,291 3,065 132,219 123,148 88,306 90,930 n.a. 49,656 227,446 42,652 388,446 456,904 20,083 208,085 603,891 33,390 2,843 1,876 278 1,629 2,128 2002
2003 160,709 1,350 1,416 749 130,151 3,269 163,701 146,446 88,503 100,057 n.a. 54,306 246,082 46,397 428,689 477,411 20,095 221,622 636,002 38,770 2,750 2,004 297 1,745 2,212 2003
2004 184,067 1,356 1,445 794 127,327 3,561 191,056 200,022 89,468 110,128 n.a. 59,635 312,843 52,453 462,462 492,110 20,663 264,069 720,595 45,715 2,934 2,233 442 1,848 2,323 2004
2005 205,302 1,494 1,463 817 121,435 4,038 224,981 262,986 90,602 120,010 n.a. 64,516 344,488 56,794 509,864 527,045 21,867 321,037 843,649 51,652 2,920 2,640 437 1,965 2,445 2005
2006 230,323 1,575 1,469 978 123,033 4,452 288,080 325,071 90,703 131,901 n.a. 68,609 425,279 66,949 824,300 589,930 24,188 451,438 925,987 58,734 3,292 3,053 762 2,081 2,568 2006
2007 261,056 2,008 1,521 926 130,404 5,153 329,760 324,323 92,218 143,262 n.a. 78,396 598,566 80,663 796,204 653,760 25,794 546,545 1,038,765 69,247 4,175 3,590 950 2,205 2,680 2007
2008 288,310 2,365 1,564 845 139,374 6,531 416,867 404,000 93,243 156,944 n.a. 92,531 929,743 106,503 1,278,431 716,544 29,155 713,788 1,128,229 90,904 3,496 4,175 1,233 2,368 2,749 2008

123
Mongolia Million Tugriks Singapore Million Singapore Dollars Brunei Million Brunei Dollars EU15 Billion US Dollars
Nepal Million Rupees Sri Lanka Million Rupees China Billion Yuan
Pakistan Million Rupees Thailand Million Baht Myanmar Billion Kyats
Philippines Million Pesos Vietnam Billion Dong US Billion US Dollars
Bangladesh Cambodia ROC Fiji Hong Kong India Indonesia Iran Japan Korea Lao PDR Malaysia Mongolia Nepal Pakistan Philippines Singapore Sri Lanka Thailand Vietnam Brunei China Myanmar US EU15
1970 757 n.a. 42 27 1,630 45 293 150 7,940 282 n.a. 2,196 n.a. n.a. 4,444 3,721 716 1,709 16,578 n.a. n.a. 25 2 188 196 1970
1971 763 n.a. 46 31 1,741 52 341 201 9,347 357 n.a. 2,204 n.a. n.a. 4,833 4,525 891 1,811 17,676 n.a. n.a. 30 2 202 222 1971
1972 736 n.a. 51 38 2,078 55 414 259 10,970 454 n.a. 2,780 n.a. n.a. 5,941 5,571 1,024 1,902 18,572 n.a. n.a. 31 2 218 245 1972
1973 1,559 n.a. 63 42 2,559 61 716 334 13,589 501 n.a. 2,980 n.a. n.a. 7,083 6,599 1,156 2,406 21,635 n.a. n.a. 32 2 233 276 1973
1974 2,556 n.a. 77 54 3,171 74 841 683 17,816 782 n.a. 3,571 n.a. 1,120 7,831 9,527 1,343 2,762 26,085 n.a. n.a. 34 3 259 321 1974
1975 6,533 n.a. 93 68 3,493 87 1,254 872 21,673 1,208 n.a. 3,985 n.a. 1,153 10,959 11,591 1,471 2,744 31,290 n.a. n.a. 36 3 291 373 1975
1976 7,780 n.a. 107 85 4,008 96 1,591 1,066 23,896 1,660 n.a. 4,368 n.a. 1,123 13,153 13,729 1,594 2,976 38,009 n.a. n.a. 38 4 314 410 1976
1977 8,209 n.a. 128 102 4,655 103 2,077 1,200 26,554 2,118 n.a. 5,472 n.a. 1,311 15,328 14,963 1,775 3,489 42,923 n.a. n.a. 41 4 343 449 1977
1978 10,073 n.a. 151 115 5,436 114 2,659 1,329 28,750 2,685 n.a. 6,185 n.a. 1,684 17,530 16,818 2,031 4,935 54,583 n.a. n.a. 48 4 374 501 1978
1979 11,298 n.a. 184 144 6,755 131 3,733 1,305 31,274 3,411 n.a. 6,575 n.a. 1,395 18,652 19,041 2,101 5,542 66,798 n.a. n.a. 62 4 411 564 1979
1980 13,204 n.a. 241 157 8,706 152 4,688 1,472 34,304 4,968 n.a. 8,948 1,821 1,713 21,583 22,099 2,528 6,784 81,433 n.a. n.a. 68 5 465 643 1980
1981 14,530 n.a. 290 173 12,211 179 5,788 1,788 36,876 6,255 n.a. 10,587 2,126 2,351 26,593 24,661 2,880 7,586 97,007 n.a. n.a. 73 5 520 733 1981
1982 16,455 n.a. 324 204 14,547 211 6,832 2,038 39,158 7,101 n.a. 11,647 2,204 3,045 31,526 28,929 3,686 10,589 110,167 n.a. n.a. 81 6 566 786 1982
1983 18,029 n.a. 346 232 16,336 244 8,077 2,295 41,501 7,975 n.a. 11,186 2,330 3,248 39,129 30,552 4,126 12,949 118,577 n.a. n.a. 90 6 607 832 1983
1984 20,551 n.a. 383 245 18,027 281 9,122 2,336 43,455 8,599 n.a. 11,923 2,442 3,896 47,720 36,880 4,472 15,712 130,100 n.a. n.a. 110 6 655 875 1984
1985 23,347 n.a. 411 252 19,751 334 11,400 2,606 45,371 9,698 n.a. 12,028 2,587 4,514 53,725 43,520 5,729 19,505 142,923 n.a. n.a. 130 7 713 922 1985
1986 27,443 n.a. 430 253 22,843 395 11,529 2,529 47,468 11,072 n.a. 12,315 2,809 5,167 61,753 48,431 5,441 23,391 144,564 30 n.a. 152 7 761 960 1986
1987 31,208 n.a. 477 255 25,672 464 11,764 2,888 49,506 12,660 n.a. 12,247 2,921 6,145 72,869 57,333 5,483 26,661 147,224 173 n.a. 168 8 806 1,020 1987
1988 34,542 n.a. 539 263 29,943 535 12,756 3,413 51,707 15,121 n.a. 13,352 3,137 7,974 98,518 72,183 5,501 30,861 156,710 980 n.a. 197 11 844 1,082 1988
1989 38,378 n.a. 638 304 36,168 613 15,698 3,428 55,046 18,245 n.a. 15,027 3,219 7,985 121,509 88,186 6,195 33,154 176,798 2,204 1,415 235 17 895 1,142 1989
1990 42,137 n.a. 769 346 43,141 698 18,649 4,385 59,025 22,527 n.a. 16,680 3,118 9,880 121,849 108,843 6,977 42,567 205,354 3,164 1,405 264 21 959 1,233 1990
1991 45,714 n.a. 873 357 51,294 788 20,785 5,982 63,074 26,874 n.a. 18,791 4,753 10,613 136,909 123,885 7,566 51,654 231,127 5,055 1,444 336 21 1,008 1,323 1991
1992 53,211 n.a. 931 415 63,795 893 24,731 7,574 66,550 31,699 n.a. 19,908 8,896 13,280 146,306 130,524 7,678 54,908 280,203 7,653 1,590 420 25 1,042 1,397 1992
1993 62,106 306 972 467 72,283 1,035 29,757 16,127 69,350 35,225 n.a. 22,087 44,152 14,249 164,281 149,057 8,979 66,894 315,982 10,279 1,714 549 37 1,066 1,439 1993
1994 66,124 493 997 437 83,148 1,152 31,014 21,558 71,985 39,895 n.a. 24,345 80,139 18,064 177,844 182,776 9,273 76,748 354,387 14,738 1,687 740 46 1,101 1,482 1994
1995 70,614 493 1,065 446 93,624 1,365 35,584 30,360 75,121 45,715 n.a. 27,954 71,397 20,516 206,080 217,045 10,432 98,944 414,403 18,741 1,795 838 51 1,133 1,530 1995
1996 73,245 529 1,172 474 103,541 1,548 40,299 36,022 77,348 53,292 n.a. 28,615 91,657 22,270 252,137 259,501 12,575 113,757 469,516 22,722 1,819 996 70 1,169 1,593 1996
1997 78,864 590 1,280 508 112,751 1,831 42,952 39,301 78,967 57,978 n.a. 30,812 112,048 24,969 271,619 319,935 13,564 128,711 476,705 25,500 1,942 1,122 90 1,214 1,637 1997
1998 94,671 672 1,364 573 116,550 2,267 54,416 48,513 80,305 63,101 n.a. 28,099 144,566 27,210 283,658 354,406 14,280 145,803 511,691 27,523 2,025 1,236 132 1,255 1,686 1998
1999 100,825 786 1,332 608 119,993 2,663 72,631 57,912 82,207 66,309 n.a. 33,556 157,128 30,272 286,294 389,238 14,406 155,632 533,041 27,137 2,231 1,372 139 1,334 1,767 1999
2000 108,386 986 1,363 632 120,172 2,793 90,780 82,109 84,942 72,101 n.a. 36,229 180,330 35,785 330,691 438,858 17,932 179,948 557,807 28,346 2,671 1,566 246 1,416 1,882 2000
2001 114,251 1,082 1,391 672 128,866 2,969 113,416 96,739 87,122 83,010 n.a. 42,448 210,538 38,586 327,562 444,834 19,016 191,646 581,117 30,463 2,950 1,750 244 1,516 2,000 2001
2002 136,641 1,276 1,412 699 131,291 3,065 132,219 123,148 88,306 90,930 n.a. 49,656 227,446 42,652 388,446 456,904 20,083 208,085 603,891 33,390 2,843 1,876 278 1,629 2,128 2002
2003 160,709 1,350 1,416 749 130,151 3,269 163,701 146,446 88,503 100,057 n.a. 54,306 246,082 46,397 428,689 477,411 20,095 221,622 636,002 38,770 2,750 2,004 297 1,745 2,212 2003
2004 184,067 1,356 1,445 794 127,327 3,561 191,056 200,022 89,468 110,128 n.a. 59,635 312,843 52,453 462,462 492,110 20,663 264,069 720,595 45,715 2,934 2,233 442 1,848 2,323 2004
2005 205,302 1,494 1,463 817 121,435 4,038 224,981 262,986 90,602 120,010 n.a. 64,516 344,488 56,794 509,864 527,045 21,867 321,037 843,649 51,652 2,920 2,640 437 1,965 2,445 2005
2006 230,323 1,575 1,469 978 123,033 4,452 288,080 325,071 90,703 131,901 n.a. 68,609 425,279 66,949 824,300 589,930 24,188 451,438 925,987 58,734 3,292 3,053 762 2,081 2,568 2006
2007 261,056 2,008 1,521 926 130,404 5,153 329,760 324,323 92,218 143,262 n.a. 78,396 598,566 80,663 796,204 653,760 25,794 546,545 1,038,765 69,247 4,175 3,590 950 2,205 2,680 2007
2008 288,310 2,365 1,564 845 139,374 6,531 416,867 404,000 93,243 156,944 n.a. 92,531 929,743 106,503 1,278,431 716,544 29,155 713,788 1,128,229 90,904 3,496 4,175 1,233 2,368 2,749 2008
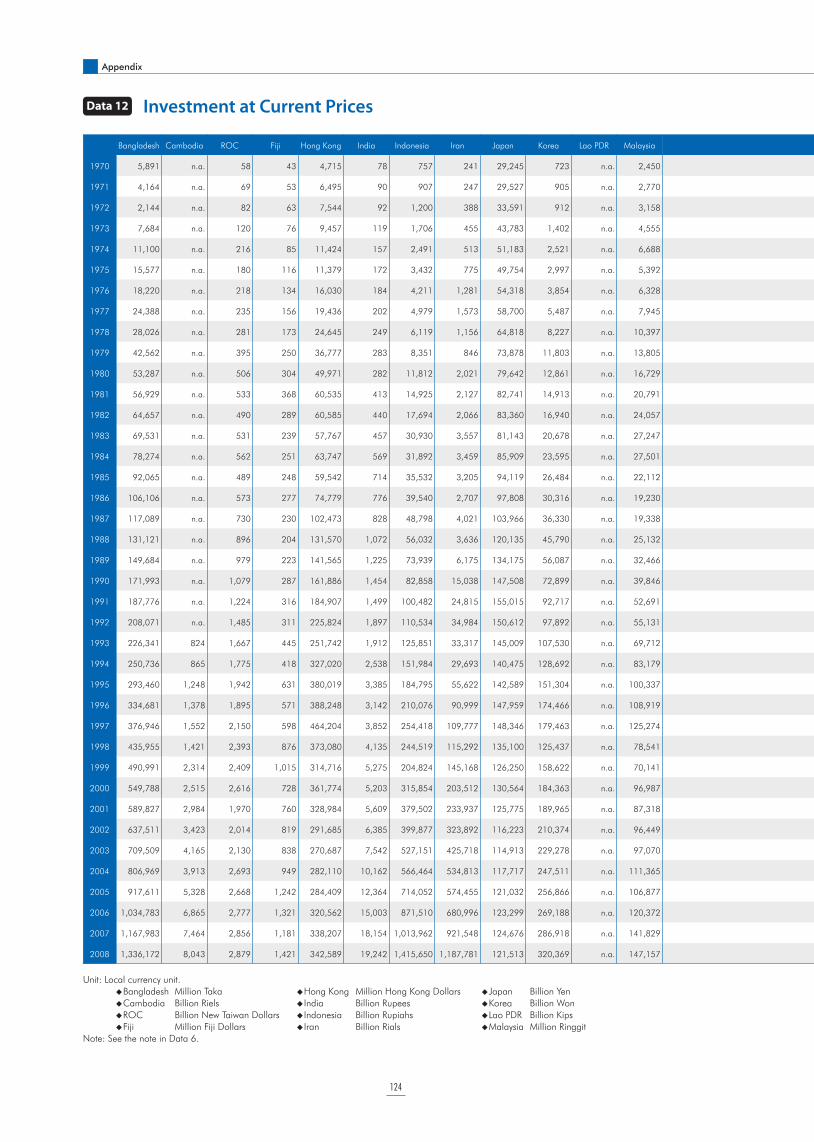
124
Appendix
Data 12 Investment at Current Prices
Unit: Local currency unit.
Bangladesh Million Taka Hong Kong Million Hong Kong Dollars Japan Billion Yen
Cambodia Billion Riels India Billion Rupees Korea Billion Won
ROC Billion New Taiwan Dollars Indonesia Billion Rupiahs Lao PDR Billion Kips
Fiji Million Fiji Dollars Iran Billion Rials Malaysia Million Ringgit
Note: See the note in Data 6.
Bangladesh Cambodia ROC Fiji Hong Kong India Indonesia Iran Japan Korea Lao PDR Malaysia Mongolia Nepal Pakistan Philippines Singapore Sri Lanka Thailand Vietnam Brunei China Myanmar US EU15
1970 5,891 n.a. 58 43 4,715 78 757 241 29,245 723 n.a. 2,450 1,143 n.a. 10,928 7,097 2,290 2,788 37,846 n.a. n.a. 74 2 196 320 1970
1971 4,164 n.a. 69 53 6,495 90 907 247 29,527 905 n.a. 2,770 1,202 n.a. 11,386 8,204 2,838 2,529 37,263 n.a. n.a. 82 2 220 333 1971
1972 2,144 n.a. 82 63 7,544 92 1,200 388 33,591 912 n.a. 3,158 1,260 n.a. 11,049 9,073 3,467 2,553 37,022 n.a. n.a. 79 2 250 358 1972
1973 7,684 n.a. 120 76 9,457 119 1,706 455 43,783 1,402 n.a. 4,555 1,319 n.a. 12,455 12,259 4,132 2,832 60,166 n.a. n.a. 90 2 291 420 1973
1974 11,100 n.a. 216 85 11,424 157 2,491 513 51,183 2,521 n.a. 6,688 1,377 2,598 16,900 22,229 5,825 3,185 74,644 n.a. n.a. 94 2 306 475 1974
1975 15,577 n.a. 180 116 11,379 172 3,432 775 49,754 2,997 n.a. 5,392 1,436 2,847 26,281 28,863 5,490 3,788 81,456 n.a. n.a. 106 2 293 452 1975
1976 18,220 n.a. 218 134 16,030 184 4,211 1,281 54,318 3,854 n.a. 6,328 1,494 2,253 34,074 36,072 6,116 4,785 83,501 0.4 n.a. 99 3 358 525 1976
1977 24,388 n.a. 235 156 19,436 202 4,979 1,573 58,700 5,487 n.a. 7,945 1,553 3,797 40,545 37,685 5,941 5,045 108,965 0.5 n.a. 110 4 429 554 1977
1978 28,026 n.a. 281 173 24,645 249 6,119 1,156 64,818 8,227 n.a. 10,397 2,127 3,802 44,370 43,642 7,125 9,904 138,121 0.5 n.a. 138 6 515 594 1978
1979 42,562 n.a. 395 250 36,777 283 8,351 846 73,878 11,803 n.a. 13,805 2,701 4,595 49,097 58,112 9,100 15,574 152,811 0.5 n.a. 148 8 581 688 1979
1980 53,287 n.a. 506 304 49,971 282 11,812 2,021 79,642 12,861 n.a. 16,729 3,276 5,188 60,996 70,463 11,902 23,313 194,020 0.5 n.a. 160 8 580 769 1980
1981 56,929 n.a. 533 368 60,535 413 14,925 2,127 82,741 14,913 n.a. 20,791 4,673 5,797 68,934 76,828 13,934 26,021 226,811 0.9 n.a. 163 10 679 766 1981
1982 64,657 n.a. 490 289 60,585 440 17,694 2,066 83,360 16,940 n.a. 24,057 5,184 7,208 81,622 87,861 16,095 28,798 224,536 2.0 n.a. 178 10 630 805 1982
1983 69,531 n.a. 531 239 57,767 457 30,930 3,557 81,143 20,678 n.a. 27,247 4,574 7,963 90,186 108,525 18,087 32,144 277,677 2.8 n.a. 204 9 687 827 1983
1984 78,274 n.a. 562 251 63,747 569 31,892 3,459 85,909 23,595 n.a. 27,501 4,679 11,013 101,102 113,559 19,994 34,338 293,051 4.8 n.a. 252 8 875 883 1984
1985 92,065 n.a. 489 248 59,542 714 35,532 3,205 94,119 26,484 n.a. 22,112 5,295 11,437 114,045 87,248 17,070 40,442 300,493 17 n.a. 346 9 895 928 1985
1986 106,106 n.a. 573 277 74,779 776 39,540 2,707 97,808 30,316 n.a. 19,230 5,350 13,926 127,491 97,022 15,167 40,129 295,621 76 n.a. 394 8 920 972 1986
1987 117,089 n.a. 730 230 102,473 828 48,798 4,021 103,966 36,330 n.a. 19,338 4,444 16,433 144,941 122,735 16,804 44,449 365,258 425 n.a. 446 8 969 1,038 1987
1988 131,121 n.a. 896 204 131,570 1,072 56,032 3,636 120,135 45,790 n.a. 25,132 4,341 20,877 161,195 149,604 17,954 49,658 512,071 2,238 n.a. 570 10 1,008 1,188 1988
1989 149,684 n.a. 979 223 141,565 1,225 73,939 6,175 134,175 56,087 n.a. 32,466 4,949 20,602 192,903 204,279 21,140 55,114 655,884 4,161 1,140 633 12 1,073 1,321 1989
1990 171,993 n.a. 1,079 287 161,886 1,454 82,858 15,038 147,508 72,899 n.a. 39,846 4,626 27,113 214,826 264,757 25,301 64,881 908,871 6,100 1,250 675 21 1,077 1,404 1990
1991 187,776 n.a. 1,224 316 184,907 1,499 100,482 24,815 155,015 92,717 n.a. 52,691 8,697 34,241 256,064 251,459 26,846 82,779 1,081,075 11,652 1,385 787 29 1,023 1,432 1991
1992 208,071 n.a. 1,485 311 225,824 1,897 110,534 34,984 150,612 97,892 n.a. 55,131 17,906 42,988 324,259 287,447 30,242 95,746 1,139,996 19,722 1,658 1,009 34 1,088 1,414 1992
1993 226,341 824 1,667 445 251,742 1,912 125,851 33,317 145,009 107,530 n.a. 69,712 59,673 48,417 369,142 352,301 36,662 120,481 1,276,691 34,322 2,031 1,572 46 1,173 1,322 1993
1994 250,736 865 1,775 418 327,020 2,538 151,984 29,693 140,475 128,692 n.a. 83,179 90,686 59,576 405,947 406,022 37,174 153,252 1,473,496 45,892 1,845 2,034 60 1,318 1,415 1994
1995 293,460 1,248 1,942 631 380,019 3,385 184,795 55,622 142,589 151,304 n.a. 100,337 174,485 72,764 460,893 426,755 42,162 164,701 1,777,574 62,689 2,519 2,547 88 1,377 1,512 1995
1996 334,681 1,378 1,895 571 388,248 3,142 210,076 90,999 147,959 174,466 n.a. 108,919 215,793 76,580 536,178 520,259 47,366 200,076 1,946,232 77,156 3,048 2,878 99 1,484 1,526 1996
1997 376,946 1,552 2,150 598 464,204 3,852 254,418 109,777 148,346 179,463 n.a. 125,274 265,418 80,655 579,845 599,746 56,416 233,563 1,612,899 89,620 2,814 2,997 143 1,641 1,615 1997
1998 435,955 1,421 2,393 876 373,080 4,135 244,519 115,292 135,100 125,437 n.a. 78,541 286,241 76,042 622,499 541,429 44,091 267,133 966,503 105,936 2,368 3,131 178 1,774 1,759 1998
1999 490,991 2,314 2,409 1,015 314,716 5,275 204,824 145,168 126,250 158,622 n.a. 70,141 365,044 99,011 609,535 558,307 46,208 293,043 972,502 111,753 1,767 3,295 301 1,929 1,857 1999
2000 549,788 2,515 2,616 728 361,774 5,203 315,854 203,512 130,564 184,363 n.a. 96,987 341,790 99,140 672,654 646,916 54,394 329,221 1,148,901 132,240 1,515 3,484 326 2,077 2,019 2000
2001 589,827 2,984 1,970 760 328,984 5,609 379,502 233,937 125,775 189,965 n.a. 87,318 331,252 93,562 731,383 690,246 41,558 320,740 1,264,540 151,737 1,625 3,977 423 1,984 2,055 2001
2002 637,511 3,423 2,014 819 291,685 6,385 399,877 323,892 116,223 210,374 n.a. 96,449 378,559 106,001 756,221 702,098 38,321 363,435 1,328,350 180,001 2,420 4,557 592 1,990 2,048 2002
2003 709,509 4,165 2,130 838 270,687 7,542 527,151 425,718 114,913 229,278 n.a. 97,070 592,096 132,387 837,859 729,478 26,916 397,682 1,513,307 219,893 1,931 5,596 881 2,086 2,096 2003
2004 806,969 3,913 2,693 949 282,110 10,162 566,464 534,813 117,717 247,511 n.a. 111,365 745,746 156,745 960,700 820,169 41,426 521,461 1,780,407 256,737 2,038 6,917 1,147 2,341 2,225 2004
2005 917,611 5,328 2,668 1,242 284,409 12,364 714,052 574,455 121,032 256,866 n.a. 106,877 1,032,140 176,623 1,271,636 800,218 41,700 646,540 2,278,804 302,353 2,093 7,786 1,677 2,564 2,363 2005
2006 1,034,783 6,865 2,777 1,321 320,562 15,003 871,510 680,996 123,299 269,188 n.a. 120,372 1,310,359 209,951 1,726,994 882,578 47,928 810,951 2,277,189 363,335 2,238 9,295 2,726 2,752 2,596 2006
2007 1,167,983 7,464 2,856 1,181 338,207 18,154 1,013,962 921,548 124,676 286,918 n.a. 141,829 1,859,247 248,675 2,000,828 1,040,137 56,379 986,235 2,320,286 499,179 2,733 11,094 3,943 2,752 2,821 2007
2008 1,336,172 8,043 2,879 1,421 342,589 19,242 1,415,650 1,187,781 121,513 320,369 n.a. 147,157 3,147,238 317,905 2,318,249 1,152,514 81,919 1,207,118 2,695,348 615,830 3,179 13,833 5,632 2,592 2,771 2008

125
Mongolia Million Tugriks Singapore Million Singapore Dollars Brunei Million Brunei Dollars EU15 Billion US Dollars
Nepal Million Rupees Sri Lanka Million Rupees China Billion Yuan
Pakistan Million Rupees Thailand Million Baht Myanmar Billion Kyats
Philippines Million Pesos Vietnam Billion Dong US Billion US Dollars
Bangladesh Cambodia ROC Fiji Hong Kong India Indonesia Iran Japan Korea Lao PDR Malaysia Mongolia Nepal Pakistan Philippines Singapore Sri Lanka Thailand Vietnam Brunei China Myanmar US EU15
1970 5,891 n.a. 58 43 4,715 78 757 241 29,245 723 n.a. 2,450 1,143 n.a. 10,928 7,097 2,290 2,788 37,846 n.a. n.a. 74 2 196 320 1970
1971 4,164 n.a. 69 53 6,495 90 907 247 29,527 905 n.a. 2,770 1,202 n.a. 11,386 8,204 2,838 2,529 37,263 n.a. n.a. 82 2 220 333 1971
1972 2,144 n.a. 82 63 7,544 92 1,200 388 33,591 912 n.a. 3,158 1,260 n.a. 11,049 9,073 3,467 2,553 37,022 n.a. n.a. 79 2 250 358 1972
1973 7,684 n.a. 120 76 9,457 119 1,706 455 43,783 1,402 n.a. 4,555 1,319 n.a. 12,455 12,259 4,132 2,832 60,166 n.a. n.a. 90 2 291 420 1973
1974 11,100 n.a. 216 85 11,424 157 2,491 513 51,183 2,521 n.a. 6,688 1,377 2,598 16,900 22,229 5,825 3,185 74,644 n.a. n.a. 94 2 306 475 1974
1975 15,577 n.a. 180 116 11,379 172 3,432 775 49,754 2,997 n.a. 5,392 1,436 2,847 26,281 28,863 5,490 3,788 81,456 n.a. n.a. 106 2 293 452 1975
1976 18,220 n.a. 218 134 16,030 184 4,211 1,281 54,318 3,854 n.a. 6,328 1,494 2,253 34,074 36,072 6,116 4,785 83,501 0.4 n.a. 99 3 358 525 1976
1977 24,388 n.a. 235 156 19,436 202 4,979 1,573 58,700 5,487 n.a. 7,945 1,553 3,797 40,545 37,685 5,941 5,045 108,965 0.5 n.a. 110 4 429 554 1977
1978 28,026 n.a. 281 173 24,645 249 6,119 1,156 64,818 8,227 n.a. 10,397 2,127 3,802 44,370 43,642 7,125 9,904 138,121 0.5 n.a. 138 6 515 594 1978
1979 42,562 n.a. 395 250 36,777 283 8,351 846 73,878 11,803 n.a. 13,805 2,701 4,595 49,097 58,112 9,100 15,574 152,811 0.5 n.a. 148 8 581 688 1979
1980 53,287 n.a. 506 304 49,971 282 11,812 2,021 79,642 12,861 n.a. 16,729 3,276 5,188 60,996 70,463 11,902 23,313 194,020 0.5 n.a. 160 8 580 769 1980
1981 56,929 n.a. 533 368 60,535 413 14,925 2,127 82,741 14,913 n.a. 20,791 4,673 5,797 68,934 76,828 13,934 26,021 226,811 0.9 n.a. 163 10 679 766 1981
1982 64,657 n.a. 490 289 60,585 440 17,694 2,066 83,360 16,940 n.a. 24,057 5,184 7,208 81,622 87,861 16,095 28,798 224,536 2.0 n.a. 178 10 630 805 1982
1983 69,531 n.a. 531 239 57,767 457 30,930 3,557 81,143 20,678 n.a. 27,247 4,574 7,963 90,186 108,525 18,087 32,144 277,677 2.8 n.a. 204 9 687 827 1983
1984 78,274 n.a. 562 251 63,747 569 31,892 3,459 85,909 23,595 n.a. 27,501 4,679 11,013 101,102 113,559 19,994 34,338 293,051 4.8 n.a. 252 8 875 883 1984
1985 92,065 n.a. 489 248 59,542 714 35,532 3,205 94,119 26,484 n.a. 22,112 5,295 11,437 114,045 87,248 17,070 40,442 300,493 17 n.a. 346 9 895 928 1985
1986 106,106 n.a. 573 277 74,779 776 39,540 2,707 97,808 30,316 n.a. 19,230 5,350 13,926 127,491 97,022 15,167 40,129 295,621 76 n.a. 394 8 920 972 1986
1987 117,089 n.a. 730 230 102,473 828 48,798 4,021 103,966 36,330 n.a. 19,338 4,444 16,433 144,941 122,735 16,804 44,449 365,258 425 n.a. 446 8 969 1,038 1987
1988 131,121 n.a. 896 204 131,570 1,072 56,032 3,636 120,135 45,790 n.a. 25,132 4,341 20,877 161,195 149,604 17,954 49,658 512,071 2,238 n.a. 570 10 1,008 1,188 1988
1989 149,684 n.a. 979 223 141,565 1,225 73,939 6,175 134,175 56,087 n.a. 32,466 4,949 20,602 192,903 204,279 21,140 55,114 655,884 4,161 1,140 633 12 1,073 1,321 1989
1990 171,993 n.a. 1,079 287 161,886 1,454 82,858 15,038 147,508 72,899 n.a. 39,846 4,626 27,113 214,826 264,757 25,301 64,881 908,871 6,100 1,250 675 21 1,077 1,404 1990
1991 187,776 n.a. 1,224 316 184,907 1,499 100,482 24,815 155,015 92,717 n.a. 52,691 8,697 34,241 256,064 251,459 26,846 82,779 1,081,075 11,652 1,385 787 29 1,023 1,432 1991
1992 208,071 n.a. 1,485 311 225,824 1,897 110,534 34,984 150,612 97,892 n.a. 55,131 17,906 42,988 324,259 287,447 30,242 95,746 1,139,996 19,722 1,658 1,009 34 1,088 1,414 1992
1993 226,341 824 1,667 445 251,742 1,912 125,851 33,317 145,009 107,530 n.a. 69,712 59,673 48,417 369,142 352,301 36,662 120,481 1,276,691 34,322 2,031 1,572 46 1,173 1,322 1993
1994 250,736 865 1,775 418 327,020 2,538 151,984 29,693 140,475 128,692 n.a. 83,179 90,686 59,576 405,947 406,022 37,174 153,252 1,473,496 45,892 1,845 2,034 60 1,318 1,415 1994
1995 293,460 1,248 1,942 631 380,019 3,385 184,795 55,622 142,589 151,304 n.a. 100,337 174,485 72,764 460,893 426,755 42,162 164,701 1,777,574 62,689 2,519 2,547 88 1,377 1,512 1995
1996 334,681 1,378 1,895 571 388,248 3,142 210,076 90,999 147,959 174,466 n.a. 108,919 215,793 76,580 536,178 520,259 47,366 200,076 1,946,232 77,156 3,048 2,878 99 1,484 1,526 1996
1997 376,946 1,552 2,150 598 464,204 3,852 254,418 109,777 148,346 179,463 n.a. 125,274 265,418 80,655 579,845 599,746 56,416 233,563 1,612,899 89,620 2,814 2,997 143 1,641 1,615 1997
1998 435,955 1,421 2,393 876 373,080 4,135 244,519 115,292 135,100 125,437 n.a. 78,541 286,241 76,042 622,499 541,429 44,091 267,133 966,503 105,936 2,368 3,131 178 1,774 1,759 1998
1999 490,991 2,314 2,409 1,015 314,716 5,275 204,824 145,168 126,250 158,622 n.a. 70,141 365,044 99,011 609,535 558,307 46,208 293,043 972,502 111,753 1,767 3,295 301 1,929 1,857 1999
2000 549,788 2,515 2,616 728 361,774 5,203 315,854 203,512 130,564 184,363 n.a. 96,987 341,790 99,140 672,654 646,916 54,394 329,221 1,148,901 132,240 1,515 3,484 326 2,077 2,019 2000
2001 589,827 2,984 1,970 760 328,984 5,609 379,502 233,937 125,775 189,965 n.a. 87,318 331,252 93,562 731,383 690,246 41,558 320,740 1,264,540 151,737 1,625 3,977 423 1,984 2,055 2001
2002 637,511 3,423 2,014 819 291,685 6,385 399,877 323,892 116,223 210,374 n.a. 96,449 378,559 106,001 756,221 702,098 38,321 363,435 1,328,350 180,001 2,420 4,557 592 1,990 2,048 2002
2003 709,509 4,165 2,130 838 270,687 7,542 527,151 425,718 114,913 229,278 n.a. 97,070 592,096 132,387 837,859 729,478 26,916 397,682 1,513,307 219,893 1,931 5,596 881 2,086 2,096 2003
2004 806,969 3,913 2,693 949 282,110 10,162 566,464 534,813 117,717 247,511 n.a. 111,365 745,746 156,745 960,700 820,169 41,426 521,461 1,780,407 256,737 2,038 6,917 1,147 2,341 2,225 2004
2005 917,611 5,328 2,668 1,242 284,409 12,364 714,052 574,455 121,032 256,866 n.a. 106,877 1,032,140 176,623 1,271,636 800,218 41,700 646,540 2,278,804 302,353 2,093 7,786 1,677 2,564 2,363 2005
2006 1,034,783 6,865 2,777 1,321 320,562 15,003 871,510 680,996 123,299 269,188 n.a. 120,372 1,310,359 209,951 1,726,994 882,578 47,928 810,951 2,277,189 363,335 2,238 9,295 2,726 2,752 2,596 2006
2007 1,167,983 7,464 2,856 1,181 338,207 18,154 1,013,962 921,548 124,676 286,918 n.a. 141,829 1,859,247 248,675 2,000,828 1,040,137 56,379 986,235 2,320,286 499,179 2,733 11,094 3,943 2,752 2,821 2007
2008 1,336,172 8,043 2,879 1,421 342,589 19,242 1,415,650 1,187,781 121,513 320,369 n.a. 147,157 3,147,238 317,905 2,318,249 1,152,514 81,919 1,207,118 2,695,348 615,830 3,179 13,833 5,632 2,592 2,771 2008

126
Appendix
Data 13 Export at Current Prices
Unit: Local currency unit.
Bangladesh Million Taka Hong Kong Million Hong Kong Dollars Japan Billion Yen
Cambodia Billion Riels India Billion Rupees Korea Billion Won
ROC Billion New Taiwan Dollars Indonesia Billion Rupiahs Lao PDR Billion Kips
Fiji Million Fiji Dollars Iran Billion Rials Malaysia Million Ringgit
Bangladesh Cambodia ROC Fiji Hong Kong India Indonesia Iran Japan Korea Lao PDR Malaysia Mongolia Nepal Pakistan Philippines Singapore Sri Lanka Thailand Vietnam Brunei China Myanmar US EU15
1970 4,568 n.a. 69 93 21,532 18 450 154 7,909 366 n.a. 5,389 n.a. n.a. 3,636 8,678 7,364 3,614 22,140 n.a. n.a. 6 0.5 59 241 1970
1971 3,365 n.a. 94 106 23,841 18 532 241 9,432 499 n.a. 5,242 n.a. n.a. 3,921 9,927 8,222 3,458 24,527 n.a. n.a. 8 1 62 263 1971
1972 2,726 n.a. 134 120 27,184 22 765 299 9,759 801 n.a. 5,121 n.a. n.a. 3,922 10,588 8,791 3,404 30,940 n.a. n.a. 9 1 70 286 1972
1973 2,444 n.a. 194 153 35,302 28 1,247 624 11,267 1,535 n.a. 7,767 n.a. n.a. 9,959 17,079 12,225 4,481 41,317 n.a. n.a. 12 1 94 338 1973
1974 3,310 n.a. 241 221 40,926 38 3,257 1,482 18,219 2,051 n.a. 11,043 n.a. 1,601 11,957 23,869 19,099 6,283 60,277 n.a. n.a. 14 1 125 433 1974
1975 4,723 n.a. 234 242 41,357 48 2,990 1,439 18,942 2,755 n.a. 10,172 n.a. 2,034 12,991 22,803 18,704 7,306 55,695 n.a. n.a. 14 1 137 439 1975
1976 6,963 n.a. 336 235 56,488 61 3,597 1,788 22,534 4,236 n.a. 14,554 n.a. 2,211 13,878 24,922 22,286 8,773 70,115 n.a. n.a. 14 1 148 508 1976
1977 7,393 n.a. 406 290 61,091 66 4,684 1,754 24,256 5,486 n.a. 16,216 n.a. 2,264 13,988 31,007 26,484 12,311 80,532 n.a. n.a. 15 2 158 567 1977
1978 9,587 n.a. 519 299 73,416 71 5,021 1,292 22,680 6,918 n.a. 18,585 n.a. 2,841 16,625 34,754 30,144 14,835 97,082 n.a. n.a. 17 2 185 618 1978
1979 12,629 n.a. 638 386 101,007 83 10,099 1,706 25,573 8,287 n.a. 26,004 n.a. 2,911 21,524 44,445 38,831 17,660 126,150 n.a. n.a. 35 3 227 717 1979
1980 15,297 n.a. 783 477 127,481 90 14,525 929 32,817 12,215 n.a. 30,676 1,343 3,824 29,479 57,448 52,024 21,434 159,734 n.a. n.a. 27 3 277 799 1980
1981 16,977 n.a. 921 454 157,818 103 15,656 996 37,846 16,376 n.a. 30,154 1,583 3,898 35,699 67,083 59,733 25,892 181,325 n.a. n.a. 61 3 301 925 1981
1982 18,842 n.a. 952 481 168,121 116 13,996 1,820 39,191 18,014 n.a. 31,846 1,924 3,749 33,026 64,515 62,301 27,148 192,870 n.a. n.a. 64 3 280 991 1982
1983 23,446 n.a. 1,119 498 208,026 131 21,446 1,985 39,125 21,168 n.a. 36,298 2,082 4,553 44,386 79,799 62,759 32,016 185,222 n.a. n.a. 64 3 273 1,058 1983
1984 26,065 n.a. 1,324 546 278,837 158 24,939 1,689 44,902 25,940 n.a. 43,171 2,344 5,828 47,825 126,660 64,402 44,285 216,401 n.a. n.a. 82 3 298 1,201 1984
1985 31,189 n.a. 1,346 584 297,716 150 23,622 1,406 46,177 27,403 n.a. 42,537 2,237 7,058 49,878 137,007 61,219 42,394 245,252 n.a. n.a. 81 3 297 1,281 1985
1986 33,856 n.a. 1,662 609 350,012 165 22,043 598 38,058 35,151 n.a. 40,305 2,509 8,196 63,255 160,160 59,784 42,602 290,170 40 n.a. 122 2 315 1,210 1986
1987 37,587 n.a. 1,853 664 472,358 203 32,173 1,780 36,180 44,316 n.a. 50,998 2,671 9,456 79,039 182,148 73,282 50,763 375,597 172 n.a. 196 2 359 1,249 1987
1988 45,015 n.a. 1,920 862 604,374 259 37,322 1,597 37,431 50,081 n.a. 61,348 2,617 10,737 93,581 226,392 97,040 57,885 514,922 1,050 n.a. 257 2 440 1,346 1988
1989 51,185 n.a. 1,960 1,099 697,718 346 45,743 2,616 42,273 47,956 n.a. 75,112 2,309 11,811 108,295 263,835 107,820 68,666 648,490 6,700 3,599 282 3 499 1,514 1989
1990 61,422 n.a. 2,025 1,234 782,379 406 56,016 5,129 45,863 52,907 n.a. 88,675 2,701 15,433 126,556 299,160 121,949 97,117 745,286 11,084 3,944 348 3 548 1,611 1990
1991 73,634 n.a. 2,305 1,170 926,992 563 67,632 7,449 46,668 60,093 n.a. 105,161 9,512 25,937 172,775 369,314 129,532 107,016 901,494 23,714 4,264 444 3 591 1,690 1991
1992 90,693 n.a. 2,350 1,195 1,110,860 673 82,608 9,645 47,288 70,726 n.a. 114,494 15,624 33,573 209,171 393,639 134,473 135,114 1,046,659 38,405 3,944 590 4 628 1,723 1992
1993 113,049 1,094 2,639 1,321 1,255,826 861 92,537 27,420 44,109 77,423 n.a. 135,896 153,746 51,907 217,326 462,305 155,613 168,858 1,201,505 40,286 3,633 826 4 648 1,787 1993
1994 121,892 1,833 2,864 1,508 1,404,297 1,016 106,277 39,632 44,270 91,778 n.a. 174,255 168,857 57,587 254,133 572,548 184,630 195,805 1,410,786 60,725 3,189 1,171 5 713 1,977 1994
1995 165,705 2,630 3,422 1,643 1,597,770 1,307 125,429 40,362 45,230 116,564 n.a. 209,323 227,190 60,105 311,729 692,833 223,423 237,735 1,751,674 75,106 4,007 1,385 5 805 2,196 1995
1996 184,359 2,334 3,700 1,878 1,683,302 1,449 144,245 51,746 49,561 127,462 n.a. 232,358 262,168 80,118 358,299 879,622 237,234 269,765 1,809,910 111,177 4,323 1,427 5 861 2,322 1996
1997 216,723 3,411 4,087 1,845 1,742,544 1,652 183,405 51,007 56,074 160,290 n.a. 262,885 491,338 74,481 390,437 1,187,845 249,255 325,886 2,272,115 135,180 4,413 1,718 6 947 2,585 1997
1998 266,809 3,661 4,360 2,002 1,609,748 1,953 530,949 44,857 55,051 222,027 n.a. 327,836 452,342 84,779 441,312 1,389,622 238,160 369,485 2,723,953 161,910 3,422 1,717 8 947 2,723 1998
1999 289,861 5,423 4,562 2,334 1,625,385 2,277 409,619 93,509 51,144 204,289 n.a. 364,861 541,978 95,855 451,048 1,531,898 257,701 393,303 2,703,308 199,836 4,352 1,829 9 982 2,860 1999
2000 331,446 7,020 5,392 2,173 1,887,701 2,781 569,490 131,811 55,256 232,633 n.a. 427,003 660,953 99,610 514,280 1,858,258 313,585 492,301 3,287,284 243,049 6,968 2,314 13 1,086 3,376 2000
2001 390,000 8,214 4,962 2,190 1,801,786 2,908 642,595 137,732 52,567 232,820 n.a. 389,256 700,370 81,492 617,148 1,784,926 294,279 551,309 3,380,750 262,846 6,977 2,478 16 1,021 3,550 2001
2002 390,021 9,300 5,437 2,289 1,909,957 3,556 595,514 247,965 55,829 238,684 n.a. 415,040 786,572 77,280 677,855 1,990,991 305,108 571,195 3,499,004 304,262 7,023 3,024 19 996 3,609 2002
2003 427,239 10,476 5,936 2,599 2,111,509 4,174 613,721 306,096 58,882 271,321 n.a. 447,846 957,557 89,544 815,158 2,141,675 345,390 631,549 3,886,566 363,735 7,916 4,014 14 1,035 3,594 2003
2004 514,938 13,636 6,981 2,453 2,456,615 5,691 739,639 411,607 66,286 338,059 n.a. 546,925 1,466,595 85,958 883,704 2,480,541 416,782 738,713 4,587,868 470,216 9,154 5,428 16 1,174 3,905 2004
2005 614,681 16,505 7,342 2,695 2,747,138 7,121 945,122 613,102 71,913 339,757 n.a. 613,694 1,784,441 87,952 1,019,783 2,589,296 478,024 793,153 5,218,079 582,069 11,132 6,856 20 1,299 4,244 2005
2006 788,788 20,475 8,326 2,671 3,032,411 9,134 1,036,316 738,427 81,756 360,625 n.a. 669,505 2,394,112 93,567 1,161,257 2,850,902 539,648 885,381 5,777,554 717,109 13,072 8,464 22 1,464 4,765 2006
2007 934,403 22,892 9,304 2,640 3,359,578 10,189 1,162,974 944,164 90,830 408,754 n.a. 706,382 2,954,878 104,207 1,230,660 2,826,574 580,889 1,041,935 6,259,581 879,461 12,525 10,206 22 1,654 5,093 2007
2008 1,110,181 27,507 9,226 3,057 3,561,247 13,108 1,475,119 979,522 88,494 544,111 n.a. 765,370 3,507,053 122,737 1,316,439 2,736,310 623,437 1,095,679 6,941,526 1,155,686 15,971 15,218 22 1,833 5,253 2008
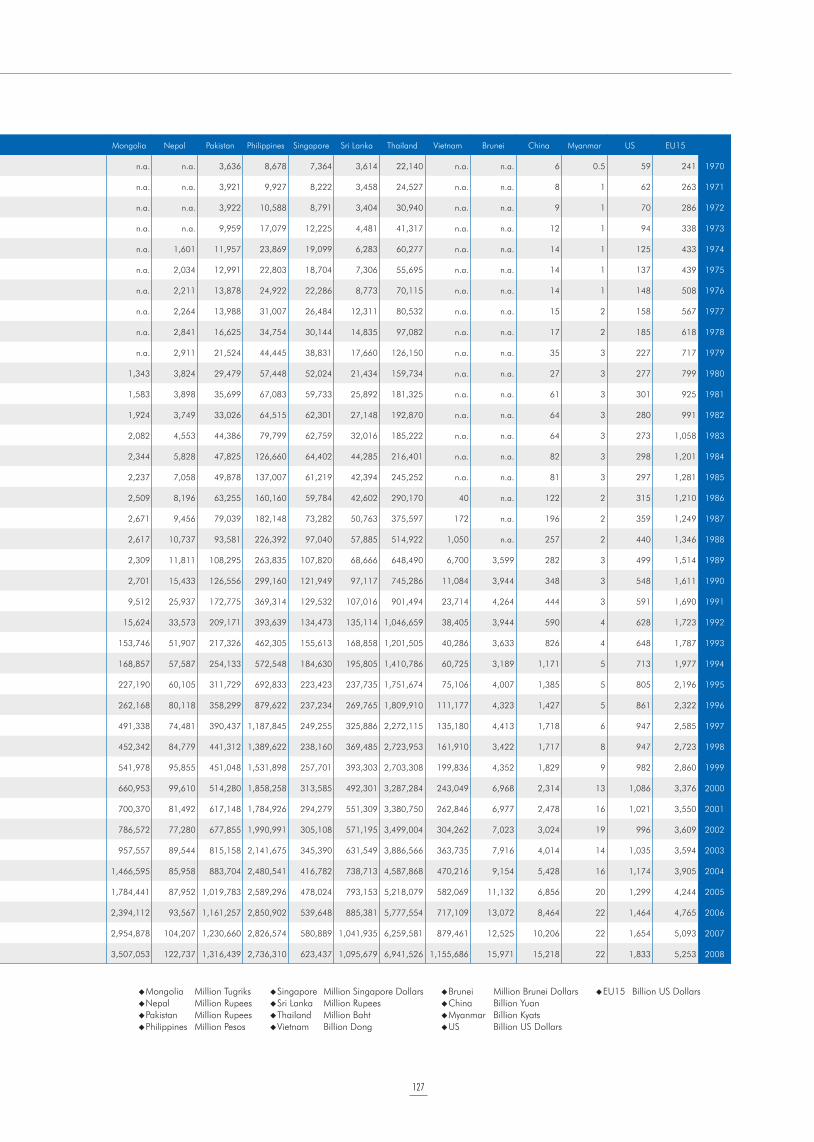
127
Mongolia Million Tugriks Singapore Million Singapore Dollars Brunei Million Brunei Dollars EU15 Billion US Dollars
Nepal Million Rupees Sri Lanka Million Rupees China Billion Yuan
Pakistan Million Rupees Thailand Million Baht Myanmar Billion Kyats
Philippines Million Pesos Vietnam Billion Dong US Billion US Dollars
Bangladesh Cambodia ROC Fiji Hong Kong India Indonesia Iran Japan Korea Lao PDR Malaysia Mongolia Nepal Pakistan Philippines Singapore Sri Lanka Thailand Vietnam Brunei China Myanmar US EU15
1970 4,568 n.a. 69 93 21,532 18 450 154 7,909 366 n.a. 5,389 n.a. n.a. 3,636 8,678 7,364 3,614 22,140 n.a. n.a. 6 0.5 59 241 1970
1971 3,365 n.a. 94 106 23,841 18 532 241 9,432 499 n.a. 5,242 n.a. n.a. 3,921 9,927 8,222 3,458 24,527 n.a. n.a. 8 1 62 263 1971
1972 2,726 n.a. 134 120 27,184 22 765 299 9,759 801 n.a. 5,121 n.a. n.a. 3,922 10,588 8,791 3,404 30,940 n.a. n.a. 9 1 70 286 1972
1973 2,444 n.a. 194 153 35,302 28 1,247 624 11,267 1,535 n.a. 7,767 n.a. n.a. 9,959 17,079 12,225 4,481 41,317 n.a. n.a. 12 1 94 338 1973
1974 3,310 n.a. 241 221 40,926 38 3,257 1,482 18,219 2,051 n.a. 11,043 n.a. 1,601 11,957 23,869 19,099 6,283 60,277 n.a. n.a. 14 1 125 433 1974
1975 4,723 n.a. 234 242 41,357 48 2,990 1,439 18,942 2,755 n.a. 10,172 n.a. 2,034 12,991 22,803 18,704 7,306 55,695 n.a. n.a. 14 1 137 439 1975
1976 6,963 n.a. 336 235 56,488 61 3,597 1,788 22,534 4,236 n.a. 14,554 n.a. 2,211 13,878 24,922 22,286 8,773 70,115 n.a. n.a. 14 1 148 508 1976
1977 7,393 n.a. 406 290 61,091 66 4,684 1,754 24,256 5,486 n.a. 16,216 n.a. 2,264 13,988 31,007 26,484 12,311 80,532 n.a. n.a. 15 2 158 567 1977
1978 9,587 n.a. 519 299 73,416 71 5,021 1,292 22,680 6,918 n.a. 18,585 n.a. 2,841 16,625 34,754 30,144 14,835 97,082 n.a. n.a. 17 2 185 618 1978
1979 12,629 n.a. 638 386 101,007 83 10,099 1,706 25,573 8,287 n.a. 26,004 n.a. 2,911 21,524 44,445 38,831 17,660 126,150 n.a. n.a. 35 3 227 717 1979
1980 15,297 n.a. 783 477 127,481 90 14,525 929 32,817 12,215 n.a. 30,676 1,343 3,824 29,479 57,448 52,024 21,434 159,734 n.a. n.a. 27 3 277 799 1980
1981 16,977 n.a. 921 454 157,818 103 15,656 996 37,846 16,376 n.a. 30,154 1,583 3,898 35,699 67,083 59,733 25,892 181,325 n.a. n.a. 61 3 301 925 1981
1982 18,842 n.a. 952 481 168,121 116 13,996 1,820 39,191 18,014 n.a. 31,846 1,924 3,749 33,026 64,515 62,301 27,148 192,870 n.a. n.a. 64 3 280 991 1982
1983 23,446 n.a. 1,119 498 208,026 131 21,446 1,985 39,125 21,168 n.a. 36,298 2,082 4,553 44,386 79,799 62,759 32,016 185,222 n.a. n.a. 64 3 273 1,058 1983
1984 26,065 n.a. 1,324 546 278,837 158 24,939 1,689 44,902 25,940 n.a. 43,171 2,344 5,828 47,825 126,660 64,402 44,285 216,401 n.a. n.a. 82 3 298 1,201 1984
1985 31,189 n.a. 1,346 584 297,716 150 23,622 1,406 46,177 27,403 n.a. 42,537 2,237 7,058 49,878 137,007 61,219 42,394 245,252 n.a. n.a. 81 3 297 1,281 1985
1986 33,856 n.a. 1,662 609 350,012 165 22,043 598 38,058 35,151 n.a. 40,305 2,509 8,196 63,255 160,160 59,784 42,602 290,170 40 n.a. 122 2 315 1,210 1986
1987 37,587 n.a. 1,853 664 472,358 203 32,173 1,780 36,180 44,316 n.a. 50,998 2,671 9,456 79,039 182,148 73,282 50,763 375,597 172 n.a. 196 2 359 1,249 1987
1988 45,015 n.a. 1,920 862 604,374 259 37,322 1,597 37,431 50,081 n.a. 61,348 2,617 10,737 93,581 226,392 97,040 57,885 514,922 1,050 n.a. 257 2 440 1,346 1988
1989 51,185 n.a. 1,960 1,099 697,718 346 45,743 2,616 42,273 47,956 n.a. 75,112 2,309 11,811 108,295 263,835 107,820 68,666 648,490 6,700 3,599 282 3 499 1,514 1989
1990 61,422 n.a. 2,025 1,234 782,379 406 56,016 5,129 45,863 52,907 n.a. 88,675 2,701 15,433 126,556 299,160 121,949 97,117 745,286 11,084 3,944 348 3 548 1,611 1990
1991 73,634 n.a. 2,305 1,170 926,992 563 67,632 7,449 46,668 60,093 n.a. 105,161 9,512 25,937 172,775 369,314 129,532 107,016 901,494 23,714 4,264 444 3 591 1,690 1991
1992 90,693 n.a. 2,350 1,195 1,110,860 673 82,608 9,645 47,288 70,726 n.a. 114,494 15,624 33,573 209,171 393,639 134,473 135,114 1,046,659 38,405 3,944 590 4 628 1,723 1992
1993 113,049 1,094 2,639 1,321 1,255,826 861 92,537 27,420 44,109 77,423 n.a. 135,896 153,746 51,907 217,326 462,305 155,613 168,858 1,201,505 40,286 3,633 826 4 648 1,787 1993
1994 121,892 1,833 2,864 1,508 1,404,297 1,016 106,277 39,632 44,270 91,778 n.a. 174,255 168,857 57,587 254,133 572,548 184,630 195,805 1,410,786 60,725 3,189 1,171 5 713 1,977 1994
1995 165,705 2,630 3,422 1,643 1,597,770 1,307 125,429 40,362 45,230 116,564 n.a. 209,323 227,190 60,105 311,729 692,833 223,423 237,735 1,751,674 75,106 4,007 1,385 5 805 2,196 1995
1996 184,359 2,334 3,700 1,878 1,683,302 1,449 144,245 51,746 49,561 127,462 n.a. 232,358 262,168 80,118 358,299 879,622 237,234 269,765 1,809,910 111,177 4,323 1,427 5 861 2,322 1996
1997 216,723 3,411 4,087 1,845 1,742,544 1,652 183,405 51,007 56,074 160,290 n.a. 262,885 491,338 74,481 390,437 1,187,845 249,255 325,886 2,272,115 135,180 4,413 1,718 6 947 2,585 1997
1998 266,809 3,661 4,360 2,002 1,609,748 1,953 530,949 44,857 55,051 222,027 n.a. 327,836 452,342 84,779 441,312 1,389,622 238,160 369,485 2,723,953 161,910 3,422 1,717 8 947 2,723 1998
1999 289,861 5,423 4,562 2,334 1,625,385 2,277 409,619 93,509 51,144 204,289 n.a. 364,861 541,978 95,855 451,048 1,531,898 257,701 393,303 2,703,308 199,836 4,352 1,829 9 982 2,860 1999
2000 331,446 7,020 5,392 2,173 1,887,701 2,781 569,490 131,811 55,256 232,633 n.a. 427,003 660,953 99,610 514,280 1,858,258 313,585 492,301 3,287,284 243,049 6,968 2,314 13 1,086 3,376 2000
2001 390,000 8,214 4,962 2,190 1,801,786 2,908 642,595 137,732 52,567 232,820 n.a. 389,256 700,370 81,492 617,148 1,784,926 294,279 551,309 3,380,750 262,846 6,977 2,478 16 1,021 3,550 2001
2002 390,021 9,300 5,437 2,289 1,909,957 3,556 595,514 247,965 55,829 238,684 n.a. 415,040 786,572 77,280 677,855 1,990,991 305,108 571,195 3,499,004 304,262 7,023 3,024 19 996 3,609 2002
2003 427,239 10,476 5,936 2,599 2,111,509 4,174 613,721 306,096 58,882 271,321 n.a. 447,846 957,557 89,544 815,158 2,141,675 345,390 631,549 3,886,566 363,735 7,916 4,014 14 1,035 3,594 2003
2004 514,938 13,636 6,981 2,453 2,456,615 5,691 739,639 411,607 66,286 338,059 n.a. 546,925 1,466,595 85,958 883,704 2,480,541 416,782 738,713 4,587,868 470,216 9,154 5,428 16 1,174 3,905 2004
2005 614,681 16,505 7,342 2,695 2,747,138 7,121 945,122 613,102 71,913 339,757 n.a. 613,694 1,784,441 87,952 1,019,783 2,589,296 478,024 793,153 5,218,079 582,069 11,132 6,856 20 1,299 4,244 2005
2006 788,788 20,475 8,326 2,671 3,032,411 9,134 1,036,316 738,427 81,756 360,625 n.a. 669,505 2,394,112 93,567 1,161,257 2,850,902 539,648 885,381 5,777,554 717,109 13,072 8,464 22 1,464 4,765 2006
2007 934,403 22,892 9,304 2,640 3,359,578 10,189 1,162,974 944,164 90,830 408,754 n.a. 706,382 2,954,878 104,207 1,230,660 2,826,574 580,889 1,041,935 6,259,581 879,461 12,525 10,206 22 1,654 5,093 2007
2008 1,110,181 27,507 9,226 3,057 3,561,247 13,108 1,475,119 979,522 88,494 544,111 n.a. 765,370 3,507,053 122,737 1,316,439 2,736,310 623,437 1,095,679 6,941,526 1,155,686 15,971 15,218 22 1,833 5,253 2008
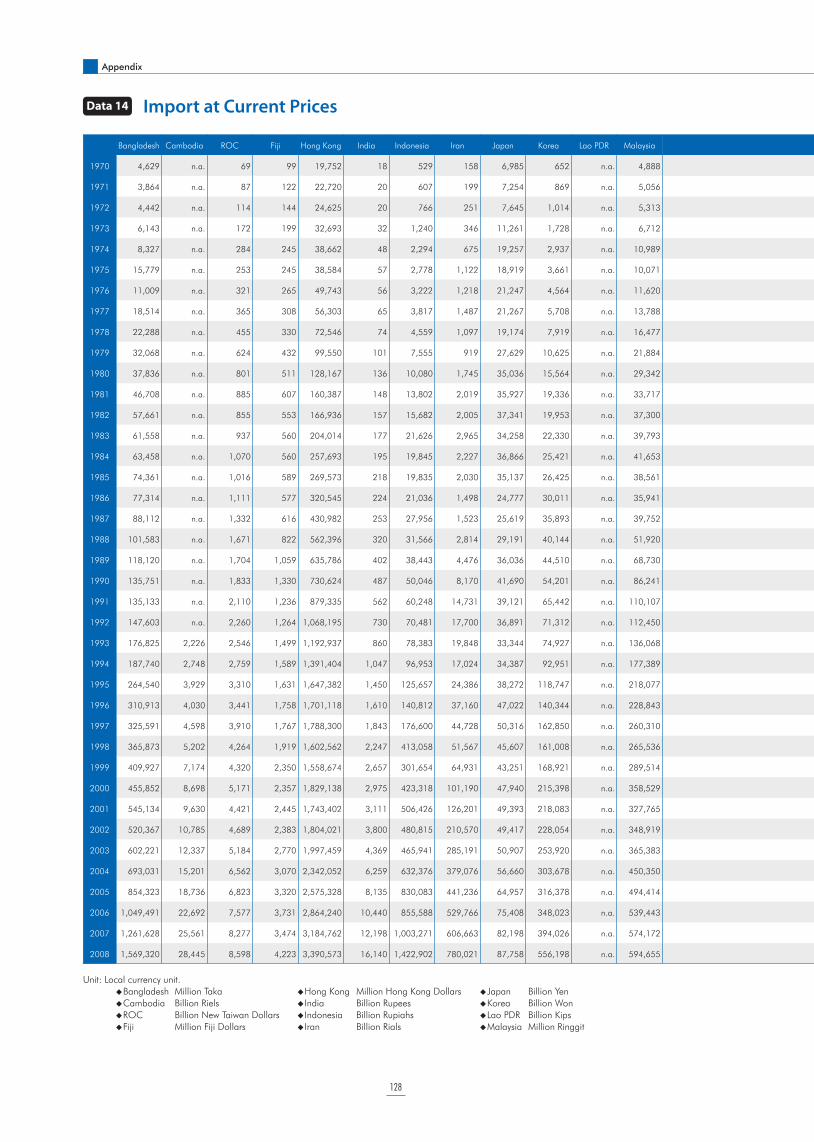
128
Appendix
Data 14 Import at Current Prices
Unit: Local currency unit.
Bangladesh Million Taka Hong Kong Million Hong Kong Dollars Japan Billion Yen
Cambodia Billion Riels India Billion Rupees Korea Billion Won
ROC Billion New Taiwan Dollars Indonesia Billion Rupiahs Lao PDR Billion Kips
Fiji Million Fiji Dollars Iran Billion Rials Malaysia Million Ringgit
Bangladesh Cambodia ROC Fiji Hong Kong India Indonesia Iran Japan Korea Lao PDR Malaysia Mongolia Nepal Pakistan Philippines Singapore Sri Lanka Thailand Vietnam Brunei China Myanmar US EU15
1970 4,629 n.a. 69 99 19,752 18 529 158 6,985 652 n.a. 4,888 n.a. n.a. 4,914 8,315 8,530 3,908 28,569 n.a. n.a. 6 2 56 248 1970
1971 3,864 n.a. 87 122 22,720 20 607 199 7,254 869 n.a. 5,056 n.a. n.a. 5,292 9,740 9,694 3,739 28,859 n.a. n.a. 6 2 62 264 1971
1972 4,442 n.a. 114 144 24,625 20 766 251 7,645 1,014 n.a. 5,313 n.a. n.a. 4,700 10,433 10,159 3,644 32,632 n.a. n.a. 7 2 74 288 1972
1973 6,143 n.a. 172 199 32,693 32 1,240 346 11,261 1,728 n.a. 6,712 n.a. n.a. 9,543 13,520 13,249 4,704 44,523 n.a. n.a. 10 1 91 353 1973
1974 8,327 n.a. 284 245 38,662 48 2,294 675 19,257 2,937 n.a. 10,989 n.a. 2,518 15,115 25,643 21,117 8,058 66,884 n.a. n.a. 15 1 128 476 1974
1975 15,779 n.a. 253 245 38,584 57 2,778 1,122 18,919 3,661 n.a. 10,071 n.a. 2,803 22,884 29,335 20,114 9,291 69,683 n.a. n.a. 14 1 123 460 1975
1976 11,009 n.a. 321 265 49,743 56 3,222 1,218 21,247 4,564 n.a. 11,620 n.a. 3,267 23,717 32,146 23,478 9,478 78,673 n.a. n.a. 13 2 151 547 1976
1977 18,514 n.a. 365 308 56,303 65 3,817 1,487 21,267 5,708 n.a. 13,788 n.a. 3,470 26,587 35,087 26,868 10,979 102,399 n.a. n.a. 14 2 182 591 1977
1978 22,288 n.a. 455 330 72,546 74 4,559 1,097 19,174 7,919 n.a. 16,477 n.a. 4,032 32,412 41,717 31,033 16,872 117,721 n.a. n.a. 25 3 212 621 1978
1979 32,068 n.a. 624 432 99,550 101 7,555 919 27,629 10,625 n.a. 21,884 n.a. 4,973 42,284 54,071 40,257 23,969 163,740 n.a. n.a. 37 4 253 748 1979
1980 37,836 n.a. 801 511 128,167 136 10,080 1,745 35,036 15,564 n.a. 29,342 3,173 6,067 54,264 69,362 54,075 36,456 201,180 n.a. n.a. 50 5 294 877 1980
1981 46,708 n.a. 885 607 160,387 148 13,802 2,019 35,927 19,336 n.a. 33,717 4,231 6,625 61,771 76,475 61,210 39,558 229,029 n.a. n.a. 59 6 318 988 1981
1982 57,661 n.a. 855 553 166,936 157 15,682 2,005 37,341 19,953 n.a. 37,300 4,242 8,181 68,107 82,854 63,631 45,905 207,282 n.a. n.a. 55 6 303 1,050 1982
1983 61,558 n.a. 937 560 204,014 177 21,626 2,965 34,258 22,330 n.a. 39,793 4,387 8,710 81,546 103,588 63,305 50,381 251,184 n.a. n.a. 59 5 329 1,093 1983
1984 63,458 n.a. 1,070 560 257,693 195 19,845 2,227 36,866 25,421 n.a. 41,653 4,695 10,591 91,691 131,436 65,390 54,469 258,557 n.a. n.a. 81 5 405 1,224 1984
1985 74,361 n.a. 1,016 589 269,573 218 19,835 2,030 35,137 26,425 n.a. 38,561 5,127 12,752 106,115 125,141 62,156 62,396 274,073 n.a. n.a. 126 5 417 1,294 1985
1986 77,314 n.a. 1,111 577 320,545 224 21,036 1,498 24,777 30,011 n.a. 35,941 6,078 14,928 102,879 136,165 59,824 63,737 267,131 90 n.a. 148 4 453 1,194 1986
1987 88,112 n.a. 1,332 616 430,982 253 27,956 1,523 25,619 35,893 n.a. 39,752 5,628 18,586 108,644 178,938 73,446 70,694 368,317 425 n.a. 195 4 509 1,259 1987
1988 101,583 n.a. 1,671 822 562,396 320 31,566 2,814 29,191 40,144 n.a. 51,920 5,455 21,782 130,442 215,181 93,585 81,771 536,596 2,756 n.a. 272 3 554 1,388 1988
1989 118,120 n.a. 1,704 1,059 635,786 402 38,443 4,476 36,036 44,510 n.a. 68,730 4,969 24,804 155,740 279,974 103,163 92,587 696,101 9,657 2,050 300 3 591 1,581 1989
1990 135,751 n.a. 1,833 1,330 730,624 487 50,046 8,170 41,690 54,201 n.a. 86,241 5,895 31,584 172,296 358,363 117,807 122,481 909,456 14,960 2,378 297 6 630 1,661 1990
1991 135,133 n.a. 2,110 1,236 879,335 562 60,248 14,731 39,121 65,442 n.a. 110,107 12,857 44,698 187,595 406,489 121,989 144,674 1,065,491 27,639 2,569 382 5 624 1,727 1991
1992 147,603 n.a. 2,260 1,264 1,068,195 730 70,481 17,700 36,891 71,312 n.a. 112,450 17,852 53,914 245,987 459,674 127,020 174,508 1,160,170 42,921 3,265 562 5 668 1,747 1992
1993 176,825 2,226 2,546 1,499 1,192,937 860 78,383 19,848 33,344 74,927 n.a. 136,068 158,534 71,582 297,424 586,633 148,595 216,544 1,335,681 52,582 3,434 894 8 720 1,727 1993
1994 187,740 2,748 2,759 1,589 1,391,404 1,047 96,953 17,024 34,387 92,951 n.a. 177,389 173,853 86,221 295,594 679,089 168,839 264,602 1,586,561 77,591 3,022 1,108 8 813 1,898 1994
1995 264,540 3,929 3,310 1,631 1,647,382 1,450 125,657 24,386 38,272 118,747 n.a. 218,077 232,911 101,165 360,328 841,639 204,859 301,543 2,033,894 95,925 3,746 1,285 10 903 2,088 1995
1996 310,913 4,030 3,441 1,758 1,701,118 1,610 140,812 37,160 47,022 140,344 n.a. 228,843 313,278 120,238 451,676 1,070,061 217,375 336,769 2,099,234 141,016 4,374 1,281 12 964 2,187 1996
1997 325,591 4,598 3,910 1,767 1,788,300 1,843 176,600 44,728 50,316 162,850 n.a. 260,310 441,508 115,889 501,465 1,438,168 231,383 388,332 2,205,119 160,135 4,514 1,363 14 1,056 2,415 1997
1998 365,873 5,202 4,264 1,919 1,602,562 2,247 413,058 51,567 45,607 161,008 n.a. 265,536 562,622 115,547 466,610 1,565,814 209,761 429,925 1,988,907 188,282 3,892 1,354 16 1,116 2,593 1998
1999 409,927 7,174 4,320 2,350 1,558,674 2,657 301,654 64,931 43,251 168,921 n.a. 289,514 670,826 139,881 495,670 1,526,631 234,504 479,664 2,120,348 211,254 3,774 1,576 16 1,251 2,775 1999
2000 455,852 8,698 5,171 2,357 1,829,138 2,975 423,318 101,190 47,940 215,398 n.a. 358,529 831,015 146,757 561,990 1,793,793 291,164 623,570 2,862,305 253,927 3,706 2,075 15 1,475 3,347 2000
2001 545,134 9,630 4,421 2,445 1,743,402 3,111 506,426 126,201 49,393 218,083 n.a. 327,765 911,680 130,912 661,455 1,898,407 270,895 638,209 3,047,574 273,828 3,933 2,246 18 1,399 3,467 2001
2002 520,367 10,785 4,689 2,383 1,804,021 3,800 480,815 210,570 49,417 228,054 n.a. 348,919 1,051,168 140,522 681,880 2,009,448 278,351 677,676 3,134,265 331,946 4,355 2,715 15 1,430 3,447 2002
2003 602,221 12,337 5,184 2,770 1,997,459 4,369 465,941 285,191 50,907 253,920 n.a. 365,383 1,242,806 158,151 786,224 2,397,154 300,415 741,430 3,485,272 415,023 4,109 3,716 13 1,545 3,461 2003
2004 693,031 15,201 6,562 3,070 2,342,052 6,259 632,376 379,076 56,660 303,678 n.a. 450,350 1,650,580 173,754 825,399 2,657,639 369,343 923,149 4,272,713 524,216 4,230 5,020 11 1,799 3,767 2004
2005 854,323 18,736 6,823 3,320 2,575,328 8,135 830,083 441,236 64,957 316,378 n.a. 494,414 1,887,980 204,828 1,271,604 2,814,792 418,739 1,012,192 5,297,474 617,157 4,329 5,833 12 2,028 4,159 2005
2006 1,049,491 22,692 7,577 3,731 2,864,240 10,440 855,588 529,766 75,408 348,023 n.a. 539,443 2,154,209 230,893 1,770,386 2,893,203 472,307 1,208,757 5,503,772 761,547 4,596 6,798 13 2,240 4,705 2006
2007 1,261,628 25,561 8,277 3,474 3,184,762 12,198 1,003,271 606,663 82,198 394,026 n.a. 574,172 2,888,039 271,291 1,851,088 2,810,171 499,003 1,413,278 5,544,488 1,060,763 5,149 7,868 13 2,376 5,000 2007
2008 1,569,320 28,445 8,598 4,223 3,390,573 16,140 1,422,902 780,021 87,758 556,198 n.a. 594,655 4,447,215 342,536 2,446,008 2,872,572 569,439 1,699,328 6,692,917 1,400,134 5,633 12,795 14 2,554 5,184 2008

129
Mongolia Million Tugriks Singapore Million Singapore Dollars Brunei Million Brunei Dollars EU15 Billion US Dollars
Nepal Million Rupees Sri Lanka Million Rupees China Billion Yuan
Pakistan Million Rupees Thailand Million Baht Myanmar Billion Kyats
Philippines Million Pesos Vietnam Billion Dong US Billion US Dollars
Bangladesh Cambodia ROC Fiji Hong Kong India Indonesia Iran Japan Korea Lao PDR Malaysia Mongolia Nepal Pakistan Philippines Singapore Sri Lanka Thailand Vietnam Brunei China Myanmar US EU15
1970 4,629 n.a. 69 99 19,752 18 529 158 6,985 652 n.a. 4,888 n.a. n.a. 4,914 8,315 8,530 3,908 28,569 n.a. n.a. 6 2 56 248 1970
1971 3,864 n.a. 87 122 22,720 20 607 199 7,254 869 n.a. 5,056 n.a. n.a. 5,292 9,740 9,694 3,739 28,859 n.a. n.a. 6 2 62 264 1971
1972 4,442 n.a. 114 144 24,625 20 766 251 7,645 1,014 n.a. 5,313 n.a. n.a. 4,700 10,433 10,159 3,644 32,632 n.a. n.a. 7 2 74 288 1972
1973 6,143 n.a. 172 199 32,693 32 1,240 346 11,261 1,728 n.a. 6,712 n.a. n.a. 9,543 13,520 13,249 4,704 44,523 n.a. n.a. 10 1 91 353 1973
1974 8,327 n.a. 284 245 38,662 48 2,294 675 19,257 2,937 n.a. 10,989 n.a. 2,518 15,115 25,643 21,117 8,058 66,884 n.a. n.a. 15 1 128 476 1974
1975 15,779 n.a. 253 245 38,584 57 2,778 1,122 18,919 3,661 n.a. 10,071 n.a. 2,803 22,884 29,335 20,114 9,291 69,683 n.a. n.a. 14 1 123 460 1975
1976 11,009 n.a. 321 265 49,743 56 3,222 1,218 21,247 4,564 n.a. 11,620 n.a. 3,267 23,717 32,146 23,478 9,478 78,673 n.a. n.a. 13 2 151 547 1976
1977 18,514 n.a. 365 308 56,303 65 3,817 1,487 21,267 5,708 n.a. 13,788 n.a. 3,470 26,587 35,087 26,868 10,979 102,399 n.a. n.a. 14 2 182 591 1977
1978 22,288 n.a. 455 330 72,546 74 4,559 1,097 19,174 7,919 n.a. 16,477 n.a. 4,032 32,412 41,717 31,033 16,872 117,721 n.a. n.a. 25 3 212 621 1978
1979 32,068 n.a. 624 432 99,550 101 7,555 919 27,629 10,625 n.a. 21,884 n.a. 4,973 42,284 54,071 40,257 23,969 163,740 n.a. n.a. 37 4 253 748 1979
1980 37,836 n.a. 801 511 128,167 136 10,080 1,745 35,036 15,564 n.a. 29,342 3,173 6,067 54,264 69,362 54,075 36,456 201,180 n.a. n.a. 50 5 294 877 1980
1981 46,708 n.a. 885 607 160,387 148 13,802 2,019 35,927 19,336 n.a. 33,717 4,231 6,625 61,771 76,475 61,210 39,558 229,029 n.a. n.a. 59 6 318 988 1981
1982 57,661 n.a. 855 553 166,936 157 15,682 2,005 37,341 19,953 n.a. 37,300 4,242 8,181 68,107 82,854 63,631 45,905 207,282 n.a. n.a. 55 6 303 1,050 1982
1983 61,558 n.a. 937 560 204,014 177 21,626 2,965 34,258 22,330 n.a. 39,793 4,387 8,710 81,546 103,588 63,305 50,381 251,184 n.a. n.a. 59 5 329 1,093 1983
1984 63,458 n.a. 1,070 560 257,693 195 19,845 2,227 36,866 25,421 n.a. 41,653 4,695 10,591 91,691 131,436 65,390 54,469 258,557 n.a. n.a. 81 5 405 1,224 1984
1985 74,361 n.a. 1,016 589 269,573 218 19,835 2,030 35,137 26,425 n.a. 38,561 5,127 12,752 106,115 125,141 62,156 62,396 274,073 n.a. n.a. 126 5 417 1,294 1985
1986 77,314 n.a. 1,111 577 320,545 224 21,036 1,498 24,777 30,011 n.a. 35,941 6,078 14,928 102,879 136,165 59,824 63,737 267,131 90 n.a. 148 4 453 1,194 1986
1987 88,112 n.a. 1,332 616 430,982 253 27,956 1,523 25,619 35,893 n.a. 39,752 5,628 18,586 108,644 178,938 73,446 70,694 368,317 425 n.a. 195 4 509 1,259 1987
1988 101,583 n.a. 1,671 822 562,396 320 31,566 2,814 29,191 40,144 n.a. 51,920 5,455 21,782 130,442 215,181 93,585 81,771 536,596 2,756 n.a. 272 3 554 1,388 1988
1989 118,120 n.a. 1,704 1,059 635,786 402 38,443 4,476 36,036 44,510 n.a. 68,730 4,969 24,804 155,740 279,974 103,163 92,587 696,101 9,657 2,050 300 3 591 1,581 1989
1990 135,751 n.a. 1,833 1,330 730,624 487 50,046 8,170 41,690 54,201 n.a. 86,241 5,895 31,584 172,296 358,363 117,807 122,481 909,456 14,960 2,378 297 6 630 1,661 1990
1991 135,133 n.a. 2,110 1,236 879,335 562 60,248 14,731 39,121 65,442 n.a. 110,107 12,857 44,698 187,595 406,489 121,989 144,674 1,065,491 27,639 2,569 382 5 624 1,727 1991
1992 147,603 n.a. 2,260 1,264 1,068,195 730 70,481 17,700 36,891 71,312 n.a. 112,450 17,852 53,914 245,987 459,674 127,020 174,508 1,160,170 42,921 3,265 562 5 668 1,747 1992
1993 176,825 2,226 2,546 1,499 1,192,937 860 78,383 19,848 33,344 74,927 n.a. 136,068 158,534 71,582 297,424 586,633 148,595 216,544 1,335,681 52,582 3,434 894 8 720 1,727 1993
1994 187,740 2,748 2,759 1,589 1,391,404 1,047 96,953 17,024 34,387 92,951 n.a. 177,389 173,853 86,221 295,594 679,089 168,839 264,602 1,586,561 77,591 3,022 1,108 8 813 1,898 1994
1995 264,540 3,929 3,310 1,631 1,647,382 1,450 125,657 24,386 38,272 118,747 n.a. 218,077 232,911 101,165 360,328 841,639 204,859 301,543 2,033,894 95,925 3,746 1,285 10 903 2,088 1995
1996 310,913 4,030 3,441 1,758 1,701,118 1,610 140,812 37,160 47,022 140,344 n.a. 228,843 313,278 120,238 451,676 1,070,061 217,375 336,769 2,099,234 141,016 4,374 1,281 12 964 2,187 1996
1997 325,591 4,598 3,910 1,767 1,788,300 1,843 176,600 44,728 50,316 162,850 n.a. 260,310 441,508 115,889 501,465 1,438,168 231,383 388,332 2,205,119 160,135 4,514 1,363 14 1,056 2,415 1997
1998 365,873 5,202 4,264 1,919 1,602,562 2,247 413,058 51,567 45,607 161,008 n.a. 265,536 562,622 115,547 466,610 1,565,814 209,761 429,925 1,988,907 188,282 3,892 1,354 16 1,116 2,593 1998
1999 409,927 7,174 4,320 2,350 1,558,674 2,657 301,654 64,931 43,251 168,921 n.a. 289,514 670,826 139,881 495,670 1,526,631 234,504 479,664 2,120,348 211,254 3,774 1,576 16 1,251 2,775 1999
2000 455,852 8,698 5,171 2,357 1,829,138 2,975 423,318 101,190 47,940 215,398 n.a. 358,529 831,015 146,757 561,990 1,793,793 291,164 623,570 2,862,305 253,927 3,706 2,075 15 1,475 3,347 2000
2001 545,134 9,630 4,421 2,445 1,743,402 3,111 506,426 126,201 49,393 218,083 n.a. 327,765 911,680 130,912 661,455 1,898,407 270,895 638,209 3,047,574 273,828 3,933 2,246 18 1,399 3,467 2001
2002 520,367 10,785 4,689 2,383 1,804,021 3,800 480,815 210,570 49,417 228,054 n.a. 348,919 1,051,168 140,522 681,880 2,009,448 278,351 677,676 3,134,265 331,946 4,355 2,715 15 1,430 3,447 2002
2003 602,221 12,337 5,184 2,770 1,997,459 4,369 465,941 285,191 50,907 253,920 n.a. 365,383 1,242,806 158,151 786,224 2,397,154 300,415 741,430 3,485,272 415,023 4,109 3,716 13 1,545 3,461 2003
2004 693,031 15,201 6,562 3,070 2,342,052 6,259 632,376 379,076 56,660 303,678 n.a. 450,350 1,650,580 173,754 825,399 2,657,639 369,343 923,149 4,272,713 524,216 4,230 5,020 11 1,799 3,767 2004
2005 854,323 18,736 6,823 3,320 2,575,328 8,135 830,083 441,236 64,957 316,378 n.a. 494,414 1,887,980 204,828 1,271,604 2,814,792 418,739 1,012,192 5,297,474 617,157 4,329 5,833 12 2,028 4,159 2005
2006 1,049,491 22,692 7,577 3,731 2,864,240 10,440 855,588 529,766 75,408 348,023 n.a. 539,443 2,154,209 230,893 1,770,386 2,893,203 472,307 1,208,757 5,503,772 761,547 4,596 6,798 13 2,240 4,705 2006
2007 1,261,628 25,561 8,277 3,474 3,184,762 12,198 1,003,271 606,663 82,198 394,026 n.a. 574,172 2,888,039 271,291 1,851,088 2,810,171 499,003 1,413,278 5,544,488 1,060,763 5,149 7,868 13 2,376 5,000 2007
2008 1,569,320 28,445 8,598 4,223 3,390,573 16,140 1,422,902 780,021 87,758 556,198 n.a. 594,655 4,447,215 342,536 2,446,008 2,872,572 569,439 1,699,328 6,692,917 1,400,134 5,633 12,795 14 2,554 5,184 2008
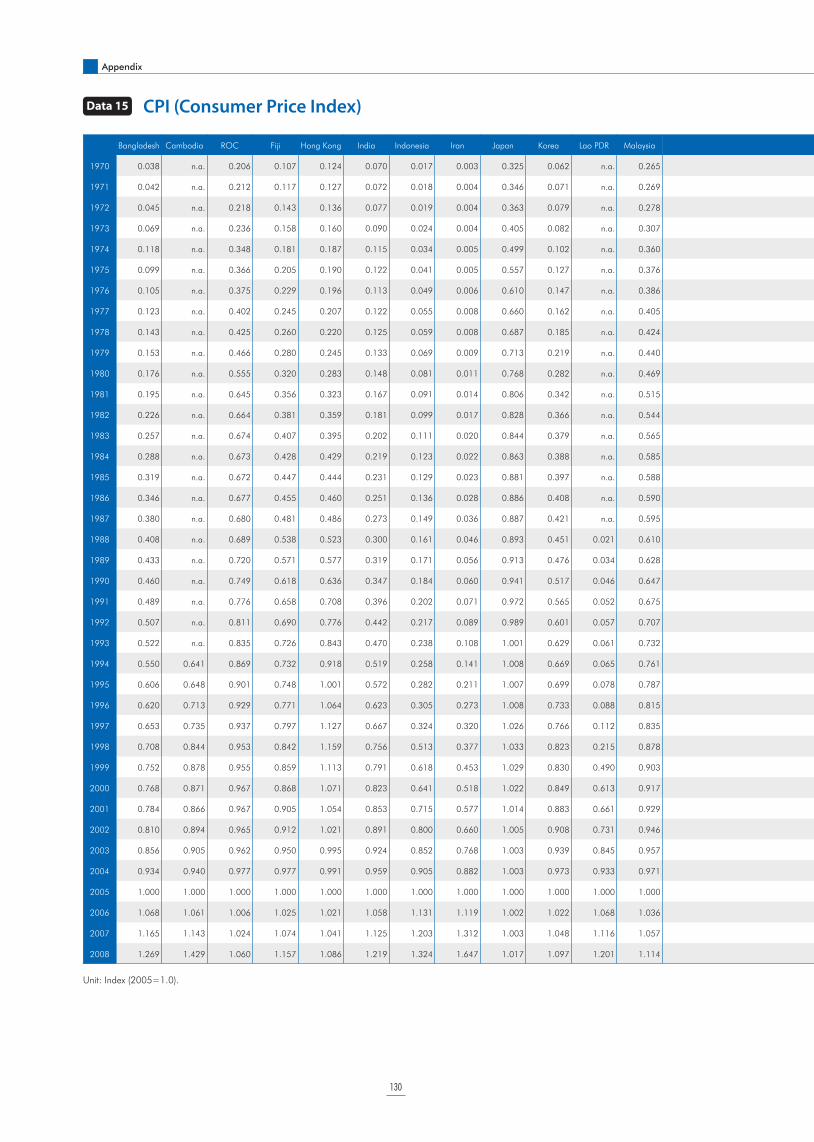
130
Appendix
Unit: Index (2005=1.0).
Data 15 CPI (Consumer Price Index)
Bangladesh Cambodia ROC Fiji Hong Kong India Indonesia Iran Japan Korea Lao PDR Malaysia Mongolia Nepal Pakistan Philippines Singapore Sri Lanka Thailand Vietnam Brunei China Myanmar US EU15
1970 0.038 n.a. 0.206 0.107 0.124 0.070 0.017 0.003 0.325 0.062 n.a. 0.265 n.a. 0.063 0.052 0.025 0.350 0.034 0.148 n.a. n.a. 0.184 0.005 0.199 n.a. 1970
1971 0.042 n.a. 0.212 0.117 0.127 0.072 0.018 0.004 0.346 0.071 n.a. 0.269 n.a. 0.062 0.055 0.030 0.356 0.035 0.148 n.a. n.a. 0.185 0.005 0.207 n.a. 1971
1972 0.045 n.a. 0.218 0.143 0.136 0.077 0.019 0.004 0.363 0.079 n.a. 0.278 n.a. 0.067 0.058 0.033 0.363 0.037 0.156 n.a. n.a. 0.186 0.005 0.214 n.a. 1972
1973 0.069 n.a. 0.236 0.158 0.160 0.090 0.024 0.004 0.405 0.082 n.a. 0.307 n.a. 0.075 0.071 0.038 0.435 0.041 0.180 n.a. n.a. 0.186 0.006 0.227 n.a. 1973
1974 0.118 n.a. 0.348 0.181 0.187 0.115 0.034 0.005 0.499 0.102 n.a. 0.360 n.a. 0.090 0.090 0.052 0.532 0.046 0.223 n.a. n.a. 0.187 0.008 0.253 n.a. 1974
1975 0.099 n.a. 0.366 0.205 0.190 0.122 0.041 0.005 0.557 0.127 n.a. 0.376 n.a. 0.097 0.109 0.055 0.546 0.049 0.235 n.a. n.a. 0.187 0.011 0.276 n.a. 1975
1976 0.105 n.a. 0.375 0.229 0.196 0.113 0.049 0.006 0.610 0.147 n.a. 0.386 n.a. 0.094 0.116 0.060 0.536 0.049 0.245 n.a. n.a. 0.188 0.013 0.291 n.a. 1976
1977 0.123 n.a. 0.402 0.245 0.207 0.122 0.055 0.008 0.660 0.162 n.a. 0.405 n.a. 0.103 0.128 0.066 0.553 0.050 0.264 n.a. 0.517 0.189 0.013 0.310 n.a. 1977
1978 0.143 n.a. 0.425 0.260 0.220 0.125 0.059 0.008 0.687 0.185 n.a. 0.424 n.a. 0.111 0.136 0.071 0.579 0.056 0.284 n.a. 0.547 0.194 0.012 0.334 n.a. 1978
1979 0.153 n.a. 0.466 0.280 0.245 0.133 0.069 0.009 0.713 0.219 n.a. 0.440 n.a. 0.115 0.147 0.083 0.603 0.062 0.313 n.a. 0.578 0.208 0.013 0.372 n.a. 1979
1980 0.176 n.a. 0.555 0.320 0.283 0.148 0.081 0.011 0.768 0.282 n.a. 0.469 n.a. 0.131 0.165 0.099 0.654 0.078 0.374 n.a. 0.611 0.221 0.013 0.422 n.a. 1980
1981 0.195 n.a. 0.645 0.356 0.323 0.167 0.091 0.014 0.806 0.342 n.a. 0.515 n.a. 0.146 0.184 0.111 0.708 0.093 0.422 n.a. 0.667 0.230 0.013 0.465 n.a. 1981
1982 0.226 n.a. 0.664 0.381 0.359 0.181 0.099 0.017 0.828 0.366 n.a. 0.544 n.a. 0.163 0.195 0.123 0.736 0.103 0.444 n.a. 0.709 0.238 0.013 0.494 n.a. 1982
1983 0.257 n.a. 0.674 0.407 0.395 0.202 0.111 0.020 0.844 0.379 n.a. 0.565 n.a. 0.183 0.208 0.135 0.743 0.117 0.460 n.a. 0.718 0.245 0.014 0.510 n.a. 1983
1984 0.288 n.a. 0.673 0.428 0.429 0.219 0.123 0.022 0.863 0.388 n.a. 0.585 n.a. 0.188 0.220 0.203 0.763 0.136 0.464 n.a. 0.740 0.253 0.015 0.532 n.a. 1984
1985 0.319 n.a. 0.672 0.447 0.444 0.231 0.129 0.023 0.881 0.397 n.a. 0.588 n.a. 0.204 0.233 0.250 0.767 0.138 0.476 n.a. 0.757 0.279 0.016 0.551 n.a. 1985
1986 0.346 n.a. 0.677 0.455 0.460 0.251 0.136 0.028 0.886 0.408 n.a. 0.590 n.a. 0.242 0.241 0.252 0.756 0.149 0.484 0.003 0.771 0.302 0.017 0.561 n.a. 1986
1987 0.380 n.a. 0.680 0.481 0.486 0.273 0.149 0.036 0.887 0.421 n.a. 0.595 n.a. 0.268 0.252 0.262 0.760 0.161 0.496 0.015 0.780 0.324 0.022 0.582 n.a. 1987
1988 0.408 n.a. 0.689 0.538 0.523 0.300 0.161 0.046 0.893 0.451 0.021 0.610 n.a. 0.292 0.274 0.285 0.771 0.183 0.515 0.076 0.790 0.384 0.025 0.606 n.a. 1988
1989 0.433 n.a. 0.720 0.571 0.577 0.319 0.171 0.056 0.913 0.476 0.034 0.628 n.a. 0.318 0.296 0.315 0.789 0.205 0.543 0.132 0.800 0.455 0.032 0.635 n.a. 1989
1990 0.460 n.a. 0.749 0.618 0.636 0.347 0.184 0.060 0.941 0.517 0.046 0.647 n.a. 0.345 0.323 0.355 0.816 0.249 0.575 0.193 0.817 0.469 0.038 0.669 n.a. 1990
1991 0.489 n.a. 0.776 0.658 0.708 0.396 0.202 0.071 0.972 0.565 0.052 0.675 0.011 0.398 0.361 0.420 0.844 0.279 0.608 0.351 0.830 0.485 0.050 0.697 n.a. 1991
1992 0.507 n.a. 0.811 0.690 0.776 0.442 0.217 0.089 0.989 0.601 0.057 0.707 0.045 0.467 0.395 0.456 0.863 0.311 0.633 0.484 0.841 0.516 0.061 0.718 n.a. 1992
1993 0.522 n.a. 0.835 0.726 0.843 0.470 0.238 0.108 1.001 0.629 0.061 0.732 0.128 0.502 0.434 0.488 0.883 0.347 0.654 0.524 0.876 0.591 0.080 0.740 n.a. 1993
1994 0.550 0.641 0.869 0.732 0.918 0.519 0.258 0.141 1.008 0.669 0.065 0.761 0.213 0.543 0.488 0.529 0.910 0.377 0.687 0.574 0.898 0.735 0.100 0.759 n.a. 1994
1995 0.606 0.648 0.901 0.748 1.001 0.572 0.282 0.211 1.007 0.699 0.078 0.787 0.326 0.585 0.548 0.564 0.926 0.406 0.727 0.671 0.952 0.859 0.125 0.780 n.a. 1995
1996 0.620 0.713 0.929 0.771 1.064 0.623 0.305 0.273 1.008 0.733 0.088 0.815 0.471 0.639 0.605 0.606 0.939 0.470 0.769 0.709 0.971 0.930 0.145 0.803 n.a. 1996
1997 0.653 0.735 0.937 0.797 1.127 0.667 0.324 0.320 1.026 0.766 0.112 0.835 0.568 0.664 0.674 0.640 0.958 0.515 0.812 0.732 0.987 0.956 0.188 0.822 n.a. 1997
1998 0.708 0.844 0.953 0.842 1.159 0.756 0.513 0.377 1.033 0.823 0.215 0.878 0.602 0.739 0.716 0.700 0.955 0.563 0.877 0.785 0.983 0.948 0.285 0.835 n.a. 1998
1999 0.752 0.878 0.955 0.859 1.113 0.791 0.618 0.453 1.029 0.830 0.490 0.903 0.662 0.794 0.746 0.741 0.955 0.590 0.880 0.817 0.979 0.935 0.337 0.853 n.a. 1999
2000 0.768 0.871 0.967 0.868 1.071 0.823 0.641 0.518 1.022 0.849 0.613 0.917 0.716 0.814 0.778 0.770 0.968 0.626 0.894 0.803 0.994 0.937 0.337 0.882 n.a. 2000
2001 0.784 0.866 0.967 0.905 1.054 0.853 0.715 0.577 1.014 0.883 0.661 0.929 0.773 0.836 0.803 0.823 0.978 0.715 0.908 0.800 1.000 0.942 0.408 0.907 n.a. 2001
2002 0.810 0.894 0.965 0.912 1.021 0.891 0.800 0.660 1.005 0.908 0.731 0.946 0.786 0.861 0.829 0.847 0.974 0.783 0.914 0.830 0.977 0.935 0.640 0.921 n.a. 2002
2003 0.856 0.905 0.962 0.950 0.995 0.924 0.852 0.768 1.003 0.939 0.845 0.957 0.823 0.910 0.853 0.877 0.979 0.833 0.931 0.857 0.980 0.945 0.875 0.942 n.a. 2003
2004 0.934 0.940 0.977 0.977 0.991 0.959 0.905 0.882 1.003 0.973 0.933 0.971 0.914 0.936 0.917 0.929 0.995 0.896 0.957 0.924 0.988 0.982 0.914 0.967 n.a. 2004
2005 1.000 1.000 1.000 1.000 1.000 1.000 1.000 1.000 1.000 1.000 1.000 1.000 1.000 1.000 1.000 1.000 1.000 1.000 1.000 1.000 1.000 1.000 1.000 1.000 n.a. 2005
2006 1.068 1.061 1.006 1.025 1.021 1.058 1.131 1.119 1.002 1.022 1.068 1.036 1.062 1.076 1.079 1.062 1.010 1.137 1.046 1.074 1.001 1.015 1.200 1.032 n.a. 2006
2007 1.165 1.143 1.024 1.074 1.041 1.125 1.203 1.312 1.003 1.048 1.116 1.057 1.250 1.141 1.161 1.092 1.031 1.335 1.070 1.163 1.012 1.063 1.620 1.062 n.a. 2007
2008 1.269 1.429 1.060 1.157 1.086 1.219 1.324 1.647 1.017 1.097 1.201 1.114 1.526 1.266 1.397 1.194 1.099 1.637 1.128 1.432 0.964 1.125 2.054 1.102 n.a. 2008
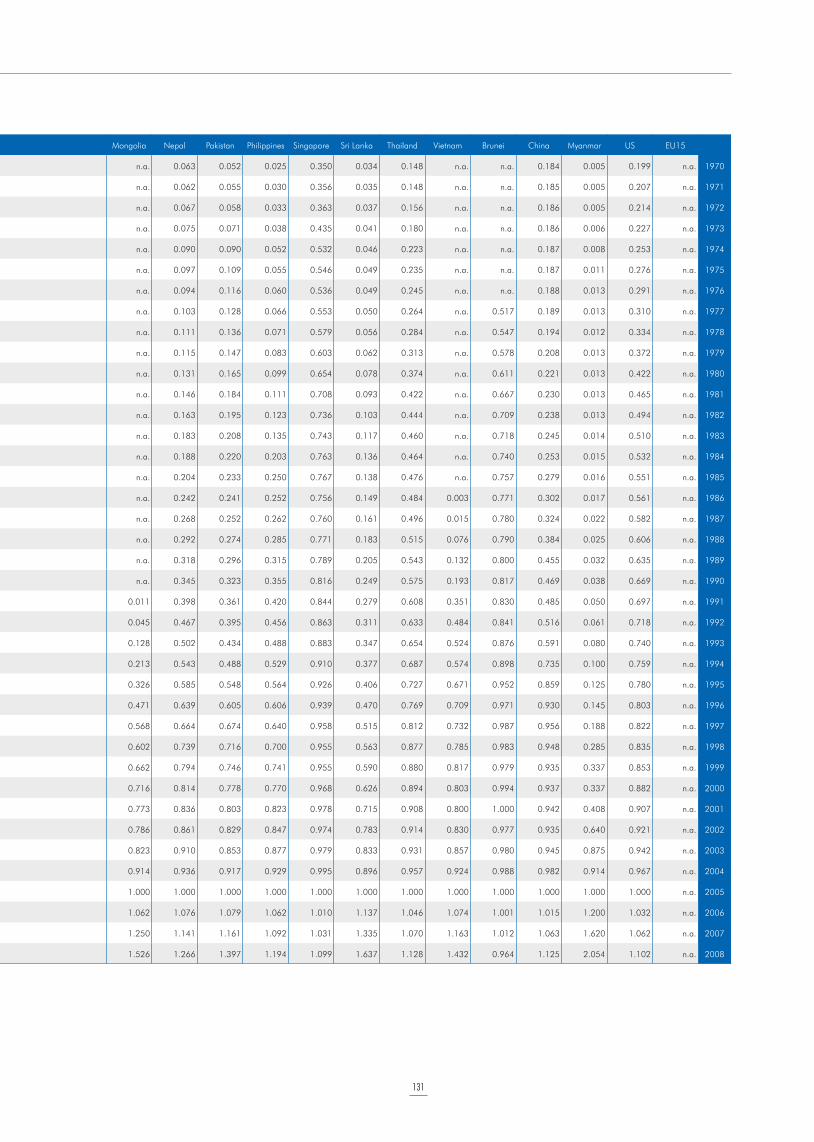
131
Bangladesh Cambodia ROC Fiji Hong Kong India Indonesia Iran Japan Korea Lao PDR Malaysia Mongolia Nepal Pakistan Philippines Singapore Sri Lanka Thailand Vietnam Brunei China Myanmar US EU15
1970 0.038 n.a. 0.206 0.107 0.124 0.070 0.017 0.003 0.325 0.062 n.a. 0.265 n.a. 0.063 0.052 0.025 0.350 0.034 0.148 n.a. n.a. 0.184 0.005 0.199 n.a. 1970
1971 0.042 n.a. 0.212 0.117 0.127 0.072 0.018 0.004 0.346 0.071 n.a. 0.269 n.a. 0.062 0.055 0.030 0.356 0.035 0.148 n.a. n.a. 0.185 0.005 0.207 n.a. 1971
1972 0.045 n.a. 0.218 0.143 0.136 0.077 0.019 0.004 0.363 0.079 n.a. 0.278 n.a. 0.067 0.058 0.033 0.363 0.037 0.156 n.a. n.a. 0.186 0.005 0.214 n.a. 1972
1973 0.069 n.a. 0.236 0.158 0.160 0.090 0.024 0.004 0.405 0.082 n.a. 0.307 n.a. 0.075 0.071 0.038 0.435 0.041 0.180 n.a. n.a. 0.186 0.006 0.227 n.a. 1973
1974 0.118 n.a. 0.348 0.181 0.187 0.115 0.034 0.005 0.499 0.102 n.a. 0.360 n.a. 0.090 0.090 0.052 0.532 0.046 0.223 n.a. n.a. 0.187 0.008 0.253 n.a. 1974
1975 0.099 n.a. 0.366 0.205 0.190 0.122 0.041 0.005 0.557 0.127 n.a. 0.376 n.a. 0.097 0.109 0.055 0.546 0.049 0.235 n.a. n.a. 0.187 0.011 0.276 n.a. 1975
1976 0.105 n.a. 0.375 0.229 0.196 0.113 0.049 0.006 0.610 0.147 n.a. 0.386 n.a. 0.094 0.116 0.060 0.536 0.049 0.245 n.a. n.a. 0.188 0.013 0.291 n.a. 1976
1977 0.123 n.a. 0.402 0.245 0.207 0.122 0.055 0.008 0.660 0.162 n.a. 0.405 n.a. 0.103 0.128 0.066 0.553 0.050 0.264 n.a. 0.517 0.189 0.013 0.310 n.a. 1977
1978 0.143 n.a. 0.425 0.260 0.220 0.125 0.059 0.008 0.687 0.185 n.a. 0.424 n.a. 0.111 0.136 0.071 0.579 0.056 0.284 n.a. 0.547 0.194 0.012 0.334 n.a. 1978
1979 0.153 n.a. 0.466 0.280 0.245 0.133 0.069 0.009 0.713 0.219 n.a. 0.440 n.a. 0.115 0.147 0.083 0.603 0.062 0.313 n.a. 0.578 0.208 0.013 0.372 n.a. 1979
1980 0.176 n.a. 0.555 0.320 0.283 0.148 0.081 0.011 0.768 0.282 n.a. 0.469 n.a. 0.131 0.165 0.099 0.654 0.078 0.374 n.a. 0.611 0.221 0.013 0.422 n.a. 1980
1981 0.195 n.a. 0.645 0.356 0.323 0.167 0.091 0.014 0.806 0.342 n.a. 0.515 n.a. 0.146 0.184 0.111 0.708 0.093 0.422 n.a. 0.667 0.230 0.013 0.465 n.a. 1981
1982 0.226 n.a. 0.664 0.381 0.359 0.181 0.099 0.017 0.828 0.366 n.a. 0.544 n.a. 0.163 0.195 0.123 0.736 0.103 0.444 n.a. 0.709 0.238 0.013 0.494 n.a. 1982
1983 0.257 n.a. 0.674 0.407 0.395 0.202 0.111 0.020 0.844 0.379 n.a. 0.565 n.a. 0.183 0.208 0.135 0.743 0.117 0.460 n.a. 0.718 0.245 0.014 0.510 n.a. 1983
1984 0.288 n.a. 0.673 0.428 0.429 0.219 0.123 0.022 0.863 0.388 n.a. 0.585 n.a. 0.188 0.220 0.203 0.763 0.136 0.464 n.a. 0.740 0.253 0.015 0.532 n.a. 1984
1985 0.319 n.a. 0.672 0.447 0.444 0.231 0.129 0.023 0.881 0.397 n.a. 0.588 n.a. 0.204 0.233 0.250 0.767 0.138 0.476 n.a. 0.757 0.279 0.016 0.551 n.a. 1985
1986 0.346 n.a. 0.677 0.455 0.460 0.251 0.136 0.028 0.886 0.408 n.a. 0.590 n.a. 0.242 0.241 0.252 0.756 0.149 0.484 0.003 0.771 0.302 0.017 0.561 n.a. 1986
1987 0.380 n.a. 0.680 0.481 0.486 0.273 0.149 0.036 0.887 0.421 n.a. 0.595 n.a. 0.268 0.252 0.262 0.760 0.161 0.496 0.015 0.780 0.324 0.022 0.582 n.a. 1987
1988 0.408 n.a. 0.689 0.538 0.523 0.300 0.161 0.046 0.893 0.451 0.021 0.610 n.a. 0.292 0.274 0.285 0.771 0.183 0.515 0.076 0.790 0.384 0.025 0.606 n.a. 1988
1989 0.433 n.a. 0.720 0.571 0.577 0.319 0.171 0.056 0.913 0.476 0.034 0.628 n.a. 0.318 0.296 0.315 0.789 0.205 0.543 0.132 0.800 0.455 0.032 0.635 n.a. 1989
1990 0.460 n.a. 0.749 0.618 0.636 0.347 0.184 0.060 0.941 0.517 0.046 0.647 n.a. 0.345 0.323 0.355 0.816 0.249 0.575 0.193 0.817 0.469 0.038 0.669 n.a. 1990
1991 0.489 n.a. 0.776 0.658 0.708 0.396 0.202 0.071 0.972 0.565 0.052 0.675 0.011 0.398 0.361 0.420 0.844 0.279 0.608 0.351 0.830 0.485 0.050 0.697 n.a. 1991
1992 0.507 n.a. 0.811 0.690 0.776 0.442 0.217 0.089 0.989 0.601 0.057 0.707 0.045 0.467 0.395 0.456 0.863 0.311 0.633 0.484 0.841 0.516 0.061 0.718 n.a. 1992
1993 0.522 n.a. 0.835 0.726 0.843 0.470 0.238 0.108 1.001 0.629 0.061 0.732 0.128 0.502 0.434 0.488 0.883 0.347 0.654 0.524 0.876 0.591 0.080 0.740 n.a. 1993
1994 0.550 0.641 0.869 0.732 0.918 0.519 0.258 0.141 1.008 0.669 0.065 0.761 0.213 0.543 0.488 0.529 0.910 0.377 0.687 0.574 0.898 0.735 0.100 0.759 n.a. 1994
1995 0.606 0.648 0.901 0.748 1.001 0.572 0.282 0.211 1.007 0.699 0.078 0.787 0.326 0.585 0.548 0.564 0.926 0.406 0.727 0.671 0.952 0.859 0.125 0.780 n.a. 1995
1996 0.620 0.713 0.929 0.771 1.064 0.623 0.305 0.273 1.008 0.733 0.088 0.815 0.471 0.639 0.605 0.606 0.939 0.470 0.769 0.709 0.971 0.930 0.145 0.803 n.a. 1996
1997 0.653 0.735 0.937 0.797 1.127 0.667 0.324 0.320 1.026 0.766 0.112 0.835 0.568 0.664 0.674 0.640 0.958 0.515 0.812 0.732 0.987 0.956 0.188 0.822 n.a. 1997
1998 0.708 0.844 0.953 0.842 1.159 0.756 0.513 0.377 1.033 0.823 0.215 0.878 0.602 0.739 0.716 0.700 0.955 0.563 0.877 0.785 0.983 0.948 0.285 0.835 n.a. 1998
1999 0.752 0.878 0.955 0.859 1.113 0.791 0.618 0.453 1.029 0.830 0.490 0.903 0.662 0.794 0.746 0.741 0.955 0.590 0.880 0.817 0.979 0.935 0.337 0.853 n.a. 1999
2000 0.768 0.871 0.967 0.868 1.071 0.823 0.641 0.518 1.022 0.849 0.613 0.917 0.716 0.814 0.778 0.770 0.968 0.626 0.894 0.803 0.994 0.937 0.337 0.882 n.a. 2000
2001 0.784 0.866 0.967 0.905 1.054 0.853 0.715 0.577 1.014 0.883 0.661 0.929 0.773 0.836 0.803 0.823 0.978 0.715 0.908 0.800 1.000 0.942 0.408 0.907 n.a. 2001
2002 0.810 0.894 0.965 0.912 1.021 0.891 0.800 0.660 1.005 0.908 0.731 0.946 0.786 0.861 0.829 0.847 0.974 0.783 0.914 0.830 0.977 0.935 0.640 0.921 n.a. 2002
2003 0.856 0.905 0.962 0.950 0.995 0.924 0.852 0.768 1.003 0.939 0.845 0.957 0.823 0.910 0.853 0.877 0.979 0.833 0.931 0.857 0.980 0.945 0.875 0.942 n.a. 2003
2004 0.934 0.940 0.977 0.977 0.991 0.959 0.905 0.882 1.003 0.973 0.933 0.971 0.914 0.936 0.917 0.929 0.995 0.896 0.957 0.924 0.988 0.982 0.914 0.967 n.a. 2004
2005 1.000 1.000 1.000 1.000 1.000 1.000 1.000 1.000 1.000 1.000 1.000 1.000 1.000 1.000 1.000 1.000 1.000 1.000 1.000 1.000 1.000 1.000 1.000 1.000 n.a. 2005
2006 1.068 1.061 1.006 1.025 1.021 1.058 1.131 1.119 1.002 1.022 1.068 1.036 1.062 1.076 1.079 1.062 1.010 1.137 1.046 1.074 1.001 1.015 1.200 1.032 n.a. 2006
2007 1.165 1.143 1.024 1.074 1.041 1.125 1.203 1.312 1.003 1.048 1.116 1.057 1.250 1.141 1.161 1.092 1.031 1.335 1.070 1.163 1.012 1.063 1.620 1.062 n.a. 2007
2008 1.269 1.429 1.060 1.157 1.086 1.219 1.324 1.647 1.017 1.097 1.201 1.114 1.526 1.266 1.397 1.194 1.099 1.637 1.128 1.432 0.964 1.125 2.054 1.102 n.a. 2008
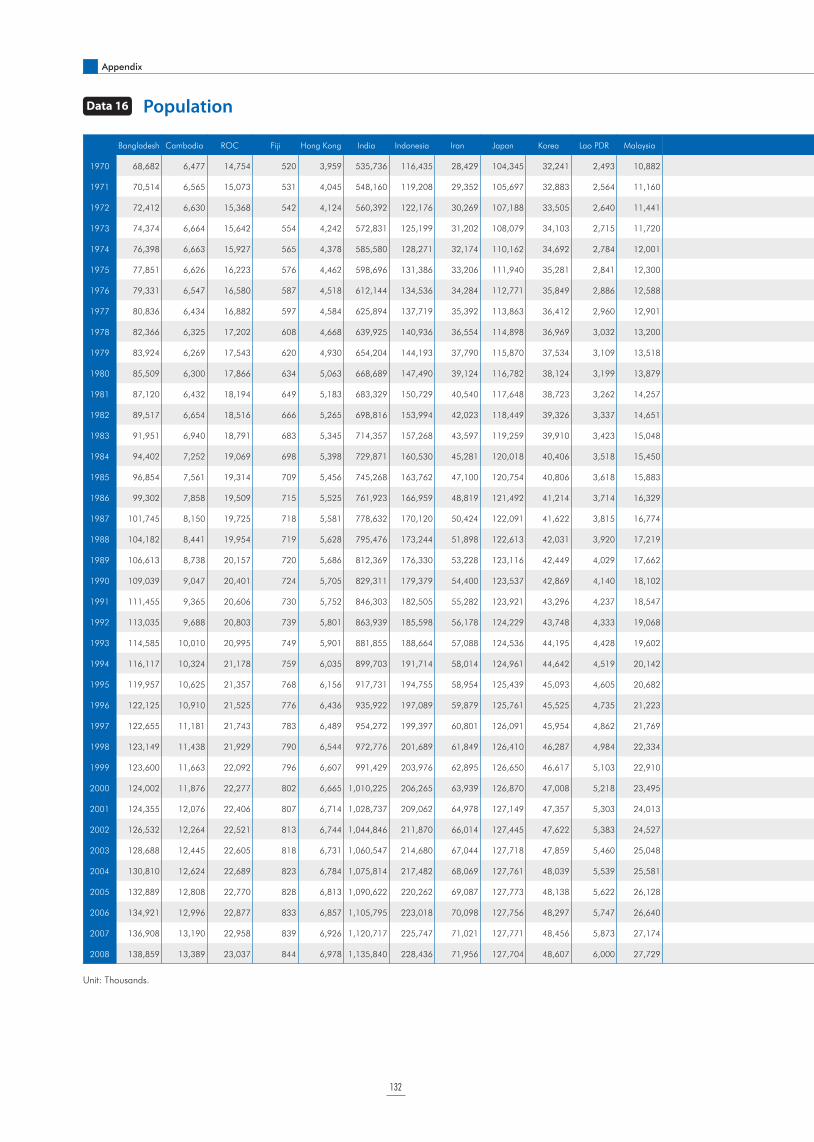
132
Appendix
Unit: Thousands.
Data 16 Population
Bangladesh Cambodia ROC Fiji Hong Kong India Indonesia Iran Japan Korea Lao PDR Malaysia Mongolia Nepal Pakistan Philippines Singapore Sri Lanka Thailand Vietnam Brunei China Myanmar US EU15
1970 68,682 6,477 14,754 520 3,959 535,736 116,435 28,429 104,345 32,241 2,493 10,882 1,248 11,297 61,313 36,684 2,075 12,417 37,186 42,729 130 829,920 26,403 205,052 341,844 1970
1971 70,514 6,565 15,073 531 4,045 548,160 119,208 29,352 105,697 32,883 2,564 11,160 1,288 11,556 63,268 37,721 2,113 12,690 38,199 43,725 136 852,290 27,060 207,661 344,147 1971
1972 72,412 6,630 15,368 542 4,124 560,392 122,176 30,269 107,188 33,505 2,640 11,441 1,326 11,854 65,309 38,774 2,152 12,924 39,211 44,758 142 871,770 27,744 209,896 346,162 1972
1973 74,374 6,664 15,642 554 4,242 572,831 125,199 31,202 108,079 34,103 2,715 11,720 1,364 12,164 67,267 39,847 2,193 13,153 40,222 45,825 148 892,110 28,449 211,909 347,983 1973
1974 76,398 6,663 15,927 565 4,378 585,580 128,271 32,174 110,162 34,692 2,784 12,001 1,402 12,484 69,282 40,945 2,230 13,380 41,230 46,918 154 908,590 29,165 213,854 349,496 1974
1975 77,851 6,626 16,223 576 4,462 598,696 131,386 33,206 111,940 35,281 2,841 12,300 1,441 12,815 71,346 42,071 2,263 13,605 42,236 48,030 161 924,200 29,886 215,973 350,809 1975
1976 79,331 6,547 16,580 587 4,518 612,144 134,536 34,284 112,771 35,849 2,886 12,588 1,482 13,157 73,453 43,239 2,293 13,828 43,234 49,158 167 937,170 30,608 218,035 351,968 1976
1977 80,836 6,434 16,882 597 4,584 625,894 137,719 35,392 113,863 36,412 2,960 12,901 1,524 13,511 75,598 44,436 2,325 14,049 44,225 50,295 174 949,740 31,332 220,239 353,147 1977
1978 82,366 6,325 17,202 608 4,668 639,925 140,936 36,554 114,898 36,969 3,032 13,200 1,568 13,874 77,766 45,653 2,354 14,265 45,218 51,436 180 962,590 32,061 222,585 354,311 1978
1979 83,924 6,269 17,543 620 4,930 654,204 144,193 37,790 115,870 37,534 3,109 13,518 1,613 14,248 79,940 46,876 2,384 14,471 46,228 52,574 187 975,420 32,803 225,055 355,538 1979
1980 85,509 6,300 17,866 634 5,063 668,689 147,490 39,124 116,782 38,124 3,199 13,879 1,661 14,631 82,108 48,098 2,414 14,666 47,264 53,700 193 987,050 33,561 227,225 357,051 1980
1981 87,120 6,432 18,194 649 5,183 683,329 150,729 40,540 117,648 38,723 3,262 14,257 1,706 15,023 84,254 49,282 2,533 14,847 48,330 54,722 199 1,000,720 34,337 229,466 358,172 1981
1982 89,517 6,654 18,516 666 5,265 698,816 153,994 42,023 118,449 39,326 3,337 14,651 1,751 15,338 86,651 50,462 2,647 15,094 49,418 55,687 205 1,016,540 35,125 231,664 358,849 1982
1983 91,951 6,940 18,791 683 5,345 714,357 157,268 43,597 119,259 39,910 3,423 15,048 1,795 15,660 89,108 51,649 2,681 15,337 50,503 56,655 211 1,030,080 35,914 233,792 359,357 1983
1984 94,402 7,252 19,069 698 5,398 729,871 160,530 45,281 120,018 40,406 3,518 15,450 1,837 15,987 91,626 52,856 2,732 15,580 51,553 57,692 217 1,043,570 36,690 235,825 359,810 1984
1985 96,854 7,561 19,314 709 5,456 745,268 163,762 47,100 120,754 40,806 3,618 15,883 1,876 16,320 94,205 54,095 2,736 15,829 52,545 58,868 223 1,058,510 37,443 237,924 360,393 1985
1986 99,302 7,858 19,509 715 5,525 761,923 166,959 48,819 121,492 41,214 3,714 16,329 1,920 16,659 96,839 55,366 2,733 16,085 53,466 60,249 229 1,075,070 38,168 240,133 361,117 1986
1987 101,745 8,150 19,725 718 5,581 778,632 170,120 50,424 122,091 41,622 3,815 16,774 1,960 17,004 99,517 56,667 2,775 16,345 54,323 61,750 236 1,093,000 38,867 242,289 361,854 1987
1988 104,182 8,441 19,954 719 5,628 795,476 173,244 51,898 122,613 42,031 3,920 17,219 1,998 17,357 102,269 57,995 2,846 16,608 55,130 63,263 243 1,110,260 39,542 244,499 363,000 1988
1989 106,613 8,738 20,157 720 5,686 812,369 176,330 53,228 123,116 42,449 4,029 17,662 2,034 17,722 105,005 59,342 2,931 16,869 55,908 64,774 250 1,127,040 40,200 246,819 364,418 1989
1990 109,039 9,047 20,401 724 5,705 829,311 179,379 54,400 123,537 42,869 4,140 18,102 2,071 18,100 107,803 60,703 3,047 17,127 56,673 66,017 257 1,143,330 40,844 249,623 366,003 1990
1991 111,455 9,365 20,606 730 5,752 846,303 182,505 55,282 123,921 43,296 4,237 18,547 2,106 18,491 110,677 62,247 3,135 17,381 57,434 67,242 264 1,158,230 41,473 252,981 367,477 1991
1992 113,035 9,688 20,803 739 5,801 863,939 185,598 56,178 124,229 43,748 4,333 19,068 2,139 18,916 113,592 63,814 3,231 17,630 58,186 68,450 272 1,171,710 42,085 256,514 369,074 1992
1993 114,585 10,010 20,995 749 5,901 881,855 188,664 57,088 124,536 44,195 4,428 19,602 2,172 19,354 116,583 65,401 3,314 17,872 58,906 69,645 280 1,185,170 42,683 259,919 370,552 1993
1994 116,117 10,324 21,178 759 6,035 899,703 191,714 58,014 124,961 44,642 4,519 20,142 2,204 19,804 119,656 67,003 3,419 18,102 59,563 70,825 287 1,198,500 43,275 263,126 371,578 1994
1995 119,957 10,625 21,357 768 6,156 917,731 194,755 58,954 125,439 45,093 4,605 20,682 2,235 20,264 122,749 68,617 3,525 18,319 60,140 71,996 295 1,211,210 43,864 266,278 372,722 1995
1996 122,125 10,910 21,525 776 6,436 935,922 197,089 59,879 125,761 45,525 4,735 21,223 2,269 20,735 125,910 70,158 3,671 18,520 60,621 73,157 303 1,223,890 44,454 269,394 373,699 1996
1997 122,655 11,181 21,743 783 6,489 954,272 199,397 60,801 126,091 45,954 4,862 21,769 2,301 21,215 129,089 71,707 3,796 18,707 61,023 74,307 310 1,236,260 45,043 272,657 374,645 1997
1998 123,149 11,438 21,929 790 6,544 972,776 201,689 61,849 126,410 46,287 4,984 22,334 2,331 21,701 132,352 73,272 3,927 18,881 61,399 75,456 318 1,247,610 45,614 275,854 375,473 1998
1999 123,600 11,663 22,092 796 6,607 991,429 203,976 62,895 126,650 46,617 5,103 22,910 2,359 22,187 134,914 74,868 3,959 19,043 61,824 76,597 326 1,257,860 46,141 279,040 376,555 1999
2000 124,002 11,876 22,277 802 6,665 1,010,225 206,265 63,939 126,870 47,008 5,218 23,495 2,391 22,671 137,530 76,504 4,028 19,102 62,347 77,631 333 1,267,430 46,610 282,172 377,955 2000
2001 124,355 12,076 22,406 807 6,714 1,028,737 209,062 64,978 127,149 47,357 5,303 24,013 2,425 23,151 140,360 78,175 4,138 18,797 62,991 78,621 341 1,276,270 47,014 285,082 379,670 2001
2002 126,532 12,264 22,521 813 6,744 1,044,846 211,870 66,014 127,445 47,622 5,383 24,527 2,459 23,701 143,170 79,883 4,176 19,007 63,734 79,539 348 1,284,530 47,363 287,804 381,676 2002
2003 128,688 12,445 22,605 818 6,731 1,060,547 214,680 67,044 127,718 47,859 5,460 25,048 2,490 24,250 145,950 81,619 4,115 19,252 64,523 80,468 356 1,292,270 47,681 290,326 383,912 2003
2004 130,810 12,624 22,689 823 6,784 1,075,814 217,482 68,069 127,761 48,039 5,539 25,581 2,519 24,797 148,720 83,371 4,167 19,462 65,279 81,438 363 1,299,880 48,000 293,046 386,281 2004
2005 132,889 12,808 22,770 828 6,813 1,090,622 220,262 69,087 127,773 48,138 5,622 26,128 2,548 25,343 151,550 85,127 4,266 19,668 65,946 82,394 370 1,307,560 48,345 295,561 388,655 2005
2006 134,921 12,996 22,877 833 6,857 1,105,795 223,018 70,098 127,756 48,297 5,747 26,640 2,579 25,887 155,360 86,885 4,401 19,886 66,507 83,313 377 1,314,480 48,723 298,363 390,756 2006
2007 136,908 13,190 22,958 839 6,926 1,120,717 225,747 71,021 127,771 48,456 5,873 27,174 2,615 26,380 158,170 88,575 4,589 20,010 66,979 84,221 385 1,321,290 49,129 301,290 393,123 2007
2008 138,859 13,389 23,037 844 6,978 1,135,840 228,436 71,956 127,704 48,607 6,000 27,729 2,659 26,867 160,970 90,202 4,839 20,217 67,386 85,122 392 1,328,020 49,563 304,060 395,421 2008

133
Bangladesh Cambodia ROC Fiji Hong Kong India Indonesia Iran Japan Korea Lao PDR Malaysia Mongolia Nepal Pakistan Philippines Singapore Sri Lanka Thailand Vietnam Brunei China Myanmar US EU15
1970 68,682 6,477 14,754 520 3,959 535,736 116,435 28,429 104,345 32,241 2,493 10,882 1,248 11,297 61,313 36,684 2,075 12,417 37,186 42,729 130 829,920 26,403 205,052 341,844 1970
1971 70,514 6,565 15,073 531 4,045 548,160 119,208 29,352 105,697 32,883 2,564 11,160 1,288 11,556 63,268 37,721 2,113 12,690 38,199 43,725 136 852,290 27,060 207,661 344,147 1971
1972 72,412 6,630 15,368 542 4,124 560,392 122,176 30,269 107,188 33,505 2,640 11,441 1,326 11,854 65,309 38,774 2,152 12,924 39,211 44,758 142 871,770 27,744 209,896 346,162 1972
1973 74,374 6,664 15,642 554 4,242 572,831 125,199 31,202 108,079 34,103 2,715 11,720 1,364 12,164 67,267 39,847 2,193 13,153 40,222 45,825 148 892,110 28,449 211,909 347,983 1973
1974 76,398 6,663 15,927 565 4,378 585,580 128,271 32,174 110,162 34,692 2,784 12,001 1,402 12,484 69,282 40,945 2,230 13,380 41,230 46,918 154 908,590 29,165 213,854 349,496 1974
1975 77,851 6,626 16,223 576 4,462 598,696 131,386 33,206 111,940 35,281 2,841 12,300 1,441 12,815 71,346 42,071 2,263 13,605 42,236 48,030 161 924,200 29,886 215,973 350,809 1975
1976 79,331 6,547 16,580 587 4,518 612,144 134,536 34,284 112,771 35,849 2,886 12,588 1,482 13,157 73,453 43,239 2,293 13,828 43,234 49,158 167 937,170 30,608 218,035 351,968 1976
1977 80,836 6,434 16,882 597 4,584 625,894 137,719 35,392 113,863 36,412 2,960 12,901 1,524 13,511 75,598 44,436 2,325 14,049 44,225 50,295 174 949,740 31,332 220,239 353,147 1977
1978 82,366 6,325 17,202 608 4,668 639,925 140,936 36,554 114,898 36,969 3,032 13,200 1,568 13,874 77,766 45,653 2,354 14,265 45,218 51,436 180 962,590 32,061 222,585 354,311 1978
1979 83,924 6,269 17,543 620 4,930 654,204 144,193 37,790 115,870 37,534 3,109 13,518 1,613 14,248 79,940 46,876 2,384 14,471 46,228 52,574 187 975,420 32,803 225,055 355,538 1979
1980 85,509 6,300 17,866 634 5,063 668,689 147,490 39,124 116,782 38,124 3,199 13,879 1,661 14,631 82,108 48,098 2,414 14,666 47,264 53,700 193 987,050 33,561 227,225 357,051 1980
1981 87,120 6,432 18,194 649 5,183 683,329 150,729 40,540 117,648 38,723 3,262 14,257 1,706 15,023 84,254 49,282 2,533 14,847 48,330 54,722 199 1,000,720 34,337 229,466 358,172 1981
1982 89,517 6,654 18,516 666 5,265 698,816 153,994 42,023 118,449 39,326 3,337 14,651 1,751 15,338 86,651 50,462 2,647 15,094 49,418 55,687 205 1,016,540 35,125 231,664 358,849 1982
1983 91,951 6,940 18,791 683 5,345 714,357 157,268 43,597 119,259 39,910 3,423 15,048 1,795 15,660 89,108 51,649 2,681 15,337 50,503 56,655 211 1,030,080 35,914 233,792 359,357 1983
1984 94,402 7,252 19,069 698 5,398 729,871 160,530 45,281 120,018 40,406 3,518 15,450 1,837 15,987 91,626 52,856 2,732 15,580 51,553 57,692 217 1,043,570 36,690 235,825 359,810 1984
1985 96,854 7,561 19,314 709 5,456 745,268 163,762 47,100 120,754 40,806 3,618 15,883 1,876 16,320 94,205 54,095 2,736 15,829 52,545 58,868 223 1,058,510 37,443 237,924 360,393 1985
1986 99,302 7,858 19,509 715 5,525 761,923 166,959 48,819 121,492 41,214 3,714 16,329 1,920 16,659 96,839 55,366 2,733 16,085 53,466 60,249 229 1,075,070 38,168 240,133 361,117 1986
1987 101,745 8,150 19,725 718 5,581 778,632 170,120 50,424 122,091 41,622 3,815 16,774 1,960 17,004 99,517 56,667 2,775 16,345 54,323 61,750 236 1,093,000 38,867 242,289 361,854 1987
1988 104,182 8,441 19,954 719 5,628 795,476 173,244 51,898 122,613 42,031 3,920 17,219 1,998 17,357 102,269 57,995 2,846 16,608 55,130 63,263 243 1,110,260 39,542 244,499 363,000 1988
1989 106,613 8,738 20,157 720 5,686 812,369 176,330 53,228 123,116 42,449 4,029 17,662 2,034 17,722 105,005 59,342 2,931 16,869 55,908 64,774 250 1,127,040 40,200 246,819 364,418 1989
1990 109,039 9,047 20,401 724 5,705 829,311 179,379 54,400 123,537 42,869 4,140 18,102 2,071 18,100 107,803 60,703 3,047 17,127 56,673 66,017 257 1,143,330 40,844 249,623 366,003 1990
1991 111,455 9,365 20,606 730 5,752 846,303 182,505 55,282 123,921 43,296 4,237 18,547 2,106 18,491 110,677 62,247 3,135 17,381 57,434 67,242 264 1,158,230 41,473 252,981 367,477 1991
1992 113,035 9,688 20,803 739 5,801 863,939 185,598 56,178 124,229 43,748 4,333 19,068 2,139 18,916 113,592 63,814 3,231 17,630 58,186 68,450 272 1,171,710 42,085 256,514 369,074 1992
1993 114,585 10,010 20,995 749 5,901 881,855 188,664 57,088 124,536 44,195 4,428 19,602 2,172 19,354 116,583 65,401 3,314 17,872 58,906 69,645 280 1,185,170 42,683 259,919 370,552 1993
1994 116,117 10,324 21,178 759 6,035 899,703 191,714 58,014 124,961 44,642 4,519 20,142 2,204 19,804 119,656 67,003 3,419 18,102 59,563 70,825 287 1,198,500 43,275 263,126 371,578 1994
1995 119,957 10,625 21,357 768 6,156 917,731 194,755 58,954 125,439 45,093 4,605 20,682 2,235 20,264 122,749 68,617 3,525 18,319 60,140 71,996 295 1,211,210 43,864 266,278 372,722 1995
1996 122,125 10,910 21,525 776 6,436 935,922 197,089 59,879 125,761 45,525 4,735 21,223 2,269 20,735 125,910 70,158 3,671 18,520 60,621 73,157 303 1,223,890 44,454 269,394 373,699 1996
1997 122,655 11,181 21,743 783 6,489 954,272 199,397 60,801 126,091 45,954 4,862 21,769 2,301 21,215 129,089 71,707 3,796 18,707 61,023 74,307 310 1,236,260 45,043 272,657 374,645 1997
1998 123,149 11,438 21,929 790 6,544 972,776 201,689 61,849 126,410 46,287 4,984 22,334 2,331 21,701 132,352 73,272 3,927 18,881 61,399 75,456 318 1,247,610 45,614 275,854 375,473 1998
1999 123,600 11,663 22,092 796 6,607 991,429 203,976 62,895 126,650 46,617 5,103 22,910 2,359 22,187 134,914 74,868 3,959 19,043 61,824 76,597 326 1,257,860 46,141 279,040 376,555 1999
2000 124,002 11,876 22,277 802 6,665 1,010,225 206,265 63,939 126,870 47,008 5,218 23,495 2,391 22,671 137,530 76,504 4,028 19,102 62,347 77,631 333 1,267,430 46,610 282,172 377,955 2000
2001 124,355 12,076 22,406 807 6,714 1,028,737 209,062 64,978 127,149 47,357 5,303 24,013 2,425 23,151 140,360 78,175 4,138 18,797 62,991 78,621 341 1,276,270 47,014 285,082 379,670 2001
2002 126,532 12,264 22,521 813 6,744 1,044,846 211,870 66,014 127,445 47,622 5,383 24,527 2,459 23,701 143,170 79,883 4,176 19,007 63,734 79,539 348 1,284,530 47,363 287,804 381,676 2002
2003 128,688 12,445 22,605 818 6,731 1,060,547 214,680 67,044 127,718 47,859 5,460 25,048 2,490 24,250 145,950 81,619 4,115 19,252 64,523 80,468 356 1,292,270 47,681 290,326 383,912 2003
2004 130,810 12,624 22,689 823 6,784 1,075,814 217,482 68,069 127,761 48,039 5,539 25,581 2,519 24,797 148,720 83,371 4,167 19,462 65,279 81,438 363 1,299,880 48,000 293,046 386,281 2004
2005 132,889 12,808 22,770 828 6,813 1,090,622 220,262 69,087 127,773 48,138 5,622 26,128 2,548 25,343 151,550 85,127 4,266 19,668 65,946 82,394 370 1,307,560 48,345 295,561 388,655 2005
2006 134,921 12,996 22,877 833 6,857 1,105,795 223,018 70,098 127,756 48,297 5,747 26,640 2,579 25,887 155,360 86,885 4,401 19,886 66,507 83,313 377 1,314,480 48,723 298,363 390,756 2006
2007 136,908 13,190 22,958 839 6,926 1,120,717 225,747 71,021 127,771 48,456 5,873 27,174 2,615 26,380 158,170 88,575 4,589 20,010 66,979 84,221 385 1,321,290 49,129 301,290 393,123 2007
2008 138,859 13,389 23,037 844 6,978 1,135,840 228,436 71,956 127,704 48,607 6,000 27,729 2,659 26,867 160,970 90,202 4,839 20,217 67,386 85,122 392 1,328,020 49,563 304,060 395,421 2008
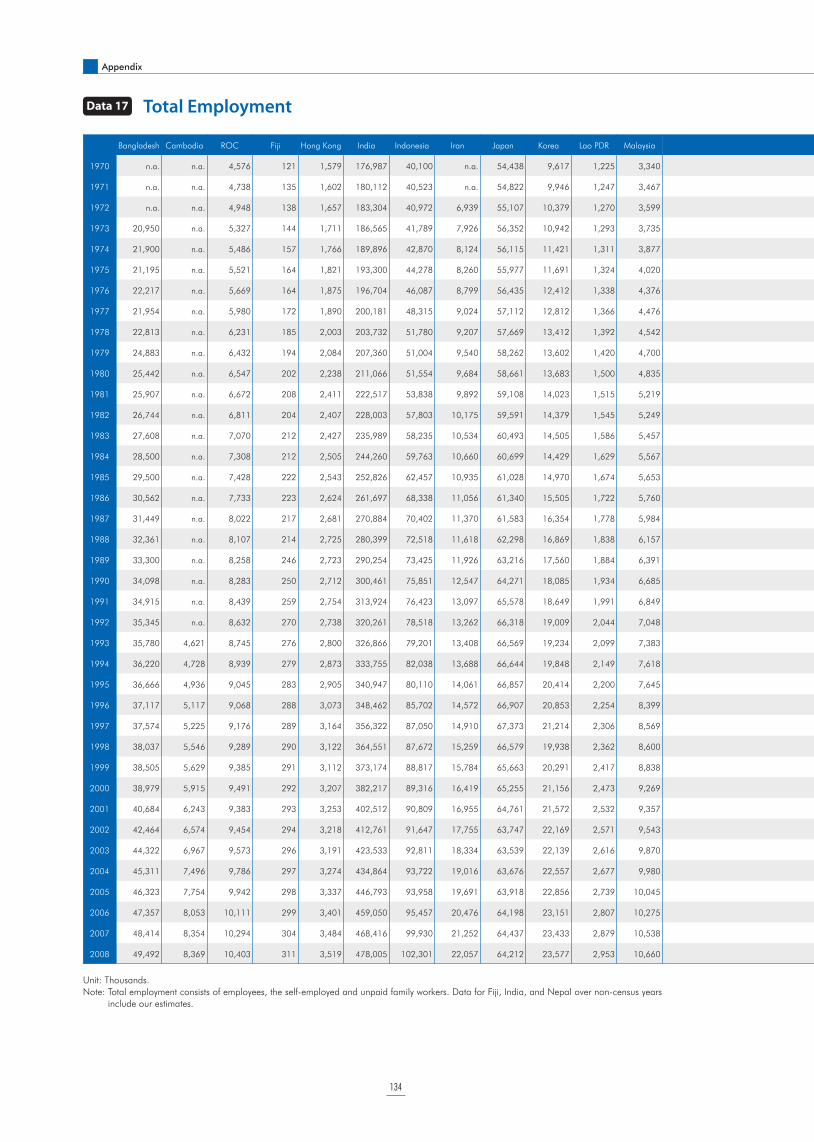
134
Appendix
Unit: Thousands.
Note: Total employment consists of employees, the self-employed and unpaid family workers. Data for Fiji, India, and Nepal over non-census years
include our estimates.
Data 17 Total Employment
Bangladesh Cambodia ROC Fiji Hong Kong India Indonesia Iran Japan Korea Lao PDR Malaysia Mongolia Nepal Pakistan Philippines Singapore Sri Lanka Thailand Vietnam Brunei China Myanmar US EU15
1970 n.a. n.a. 4,576 121 1,579 176,987 40,100 n.a. 54,438 9,617 1,225 3,340 429 4,692 17,750 11,358 666 3,610 16,493 n.a. n.a. 344,320 n.a. 86,847 141,692 1970
1971 n.a. n.a. 4,738 135 1,602 180,112 40,523 n.a. 54,822 9,946 1,247 3,467 440 4,853 18,370 12,543 717 3,649 16,605 n.a. 40 351,792 n.a. 86,696 141,735 1971
1972 n.a. n.a. 4,948 138 1,657 183,304 40,972 6,939 55,107 10,379 1,270 3,599 445 5,019 18,550 12,581 767 3,965 16,058 n.a. 42 359,264 n.a. 88,817 142,374 1972
1973 20,950 n.a. 5,327 144 1,711 186,565 41,789 7,926 56,352 10,942 1,293 3,735 454 5,192 19,240 13,865 818 4,087 16,754 n.a. 44 366,736 n.a. 92,518 146,552 1973
1974 21,900 n.a. 5,486 157 1,766 189,896 42,870 8,124 56,115 11,421 1,311 3,877 460 5,372 19,760 13,824 843 4,164 15,401 n.a. 46 374,208 n.a. 94,100 147,724 1974
1975 21,195 n.a. 5,521 164 1,821 193,300 44,278 8,260 55,977 11,691 1,324 4,020 461 5,559 20,300 14,517 853 4,243 16,176 n.a. 49 381,680 n.a. 92,550 147,289 1975
1976 22,217 n.a. 5,669 164 1,875 196,704 46,087 8,799 56,435 12,412 1,338 4,376 464 5,754 21,080 15,427 890 4,358 16,113 18,358 52 388,293 n.a. 94,897 146,634 1976
1977 21,954 n.a. 5,980 172 1,890 200,181 48,315 9,024 57,112 12,812 1,366 4,476 476 5,956 21,890 14,323 925 4,476 18,138 19,056 54 394,907 12,640 98,179 147,104 1977
1978 22,813 n.a. 6,231 185 2,003 203,732 51,780 9,207 57,669 13,412 1,392 4,542 486 6,167 22,730 16,668 978 4,598 19,215 19,194 58 401,520 12,935 102,895 147,571 1978
1979 24,883 n.a. 6,432 194 2,084 207,360 51,004 9,540 58,262 13,602 1,420 4,700 502 6,386 23,620 16,267 1,023 4,723 19,022 19,377 61 410,240 13,208 106,433 148,990 1979
1980 25,442 n.a. 6,547 202 2,238 211,066 51,554 9,684 58,661 13,683 1,500 4,835 516 6,614 24,150 17,154 1,093 4,851 22,524 19,999 64 423,610 13,515 107,028 149,644 1980
1981 25,907 n.a. 6,672 208 2,411 222,517 53,838 9,892 59,108 14,023 1,515 5,219 525 6,851 24,700 17,810 1,180 4,738 20,874 20,363 68 437,250 13,790 107,978 148,455 1981
1982 26,744 n.a. 6,811 204 2,407 228,003 57,803 10,175 59,591 14,379 1,545 5,249 535 6,865 25,270 18,614 1,249 4,828 24,831 21,284 71 452,950 14,185 106,228 147,758 1982
1983 27,608 n.a. 7,070 212 2,427 235,989 58,235 10,534 60,493 14,505 1,586 5,457 548 6,884 25,850 19,366 1,280 4,919 22,912 22,075 74 464,360 14,500 107,254 147,760 1983
1984 28,500 n.a. 7,308 212 2,505 244,260 59,763 10,660 60,699 14,429 1,629 5,567 552 6,909 26,400 19,368 1,298 5,014 24,159 23,149 77 481,970 14,790 111,870 148,243 1984
1985 29,500 n.a. 7,428 222 2,543 252,826 62,457 10,935 61,028 14,970 1,674 5,653 590 6,942 26,960 20,327 1,263 5,132 24,227 26,025 81 498,730 15,130 114,314 148,814 1985
1986 30,562 n.a. 7,733 223 2,624 261,697 68,338 11,056 61,340 15,505 1,722 5,760 643 6,982 27,020 20,926 1,242 5,175 25,086 27,399 84 512,820 15,410 116,242 150,009 1986
1987 31,449 n.a. 8,022 217 2,681 270,884 70,402 11,370 61,583 16,354 1,778 5,984 665 7,031 28,700 20,795 1,296 5,199 26,414 27,968 88 527,830 15,400 119,419 151,913 1987
1988 32,361 n.a. 8,107 214 2,725 280,399 72,518 11,618 62,298 16,869 1,838 6,157 743 7,089 28,990 21,497 1,362 5,214 27,726 28,477 92 543,340 15,140 122,820 154,509 1988
1989 33,300 n.a. 8,258 246 2,723 290,254 73,425 11,926 63,216 17,560 1,884 6,391 764 7,159 29,900 21,849 1,426 5,235 28,456 28,940 97 553,290 15,220 125,571 157,081 1989
1990 34,098 n.a. 8,283 250 2,712 300,461 75,851 12,547 64,271 18,085 1,934 6,685 784 7,242 30,650 22,532 1,520 5,047 30,844 30,286 102 647,490 15,740 127,096 159,744 1990
1991 34,915 n.a. 8,439 259 2,754 313,924 76,423 13,097 65,578 18,649 1,991 6,849 796 7,340 29,520 22,979 1,559 5,016 29,220 30,974 107 654,910 16,010 125,898 160,608 1991
1992 35,345 n.a. 8,632 270 2,738 320,261 78,518 13,262 66,318 19,009 2,044 7,048 806 7,526 30,580 23,917 1,604 4,962 30,794 31,815 110 661,520 16,379 126,008 158,464 1992
1993 35,780 4,621 8,745 276 2,800 326,866 79,201 13,408 66,569 19,234 2,099 7,383 765 7,728 31,450 24,443 1,631 5,201 30,679 32,718 113 668,080 16,744 128,109 156,048 1993
1994 36,220 4,728 8,939 279 2,873 333,755 82,038 13,688 66,644 19,848 2,149 7,618 760 7,949 32,230 25,166 1,707 5,281 30,164 33,664 116 674,550 17,114 130,943 156,070 1994
1995 36,666 4,936 9,045 283 2,905 340,947 80,110 14,061 66,857 20,414 2,200 7,645 768 8,191 32,350 25,698 1,793 5,357 30,815 34,590 120 680,650 17,503 133,750 157,226 1995
1996 37,117 5,117 9,068 288 3,073 348,462 85,702 14,572 66,907 20,853 2,254 8,399 770 8,458 33,130 27,442 1,873 5,537 31,166 35,386 124 689,500 17,915 135,985 158,116 1996
1997 37,574 5,225 9,176 289 3,164 356,322 87,050 14,910 67,373 21,214 2,306 8,569 765 8,754 35,160 27,888 1,968 5,608 31,714 35,603 128 689,200 18,357 138,860 159,732 1997
1998 38,037 5,546 9,289 290 3,122 364,551 87,672 15,259 66,579 19,938 2,362 8,600 793 9,087 36,940 28,262 2,023 6,049 30,105 36,954 132 706,370 18,856 141,904 162,516 1998
1999 38,505 5,629 9,385 291 3,112 373,174 88,817 15,784 65,663 20,291 2,417 8,838 814 9,464 37,780 29,003 2,063 6,083 30,686 38,120 134 713,940 19,267 144,471 165,401 1999
2000 38,979 5,915 9,491 292 3,207 382,217 89,316 16,419 65,255 21,156 2,473 9,269 809 9,582 37,320 27,775 2,171 6,310 31,335 38,368 141 720,850 19,623 147,461 169,020 2000
2001 40,684 6,243 9,383 293 3,253 402,512 90,809 16,955 64,761 21,572 2,532 9,357 832 9,900 38,140 30,085 2,171 6,236 32,104 39,000 146 730,250 19,975 147,023 171,483 2001
2002 42,464 6,574 9,454 294 3,218 412,761 91,647 17,755 63,747 22,169 2,571 9,543 871 10,121 39,640 30,251 2,148 6,519 33,061 40,162 153 737,400 20,258 145,900 172,624 2002
2003 44,322 6,967 9,573 296 3,191 423,533 92,811 18,334 63,539 22,139 2,616 9,870 927 10,356 40,470 31,553 2,135 6,609 33,841 41,176 156 744,320 20,514 145,899 173,449 2003
2004 45,311 7,496 9,786 297 3,274 434,864 93,722 19,016 63,676 22,557 2,677 9,980 950 10,607 42,240 31,741 2,207 6,704 34,729 42,316 161 752,000 20,757 147,496 174,798 2004
2005 46,323 7,754 9,942 298 3,337 446,793 93,958 19,691 63,918 22,856 2,739 10,045 968 10,873 43,220 32,875 2,320 6,788 35,257 43,452 167 758,250 21,021 149,459 176,537 2005
2006 47,357 8,053 10,111 299 3,401 459,050 95,457 20,476 64,198 23,151 2,807 10,275 1,010 11,155 46,940 32,886 2,496 7,105 35,686 44,760 174 764,000 21,250 152,029 179,134 2006
2007 48,414 8,354 10,294 304 3,484 468,416 99,930 21,252 64,437 23,433 2,879 10,538 1,024 11,454 47,650 33,672 2,731 7,042 36,249 46,114 179 769,900 21,612 153,347 182,006 2007
2008 49,492 8,369 10,403 311 3,519 478,005 102,301 22,057 64,212 23,577 2,953 10,660 1,042 11,770 49,090 34,533 2,952 7,175 37,017 47,673 182 774,800 21,928 152,478 183,532 2008

135
Bangladesh Cambodia ROC Fiji Hong Kong India Indonesia Iran Japan Korea Lao PDR Malaysia Mongolia Nepal Pakistan Philippines Singapore Sri Lanka Thailand Vietnam Brunei China Myanmar US EU15
1970 n.a. n.a. 4,576 121 1,579 176,987 40,100 n.a. 54,438 9,617 1,225 3,340 429 4,692 17,750 11,358 666 3,610 16,493 n.a. n.a. 344,320 n.a. 86,847 141,692 1970
1971 n.a. n.a. 4,738 135 1,602 180,112 40,523 n.a. 54,822 9,946 1,247 3,467 440 4,853 18,370 12,543 717 3,649 16,605 n.a. 40 351,792 n.a. 86,696 141,735 1971
1972 n.a. n.a. 4,948 138 1,657 183,304 40,972 6,939 55,107 10,379 1,270 3,599 445 5,019 18,550 12,581 767 3,965 16,058 n.a. 42 359,264 n.a. 88,817 142,374 1972
1973 20,950 n.a. 5,327 144 1,711 186,565 41,789 7,926 56,352 10,942 1,293 3,735 454 5,192 19,240 13,865 818 4,087 16,754 n.a. 44 366,736 n.a. 92,518 146,552 1973
1974 21,900 n.a. 5,486 157 1,766 189,896 42,870 8,124 56,115 11,421 1,311 3,877 460 5,372 19,760 13,824 843 4,164 15,401 n.a. 46 374,208 n.a. 94,100 147,724 1974
1975 21,195 n.a. 5,521 164 1,821 193,300 44,278 8,260 55,977 11,691 1,324 4,020 461 5,559 20,300 14,517 853 4,243 16,176 n.a. 49 381,680 n.a. 92,550 147,289 1975
1976 22,217 n.a. 5,669 164 1,875 196,704 46,087 8,799 56,435 12,412 1,338 4,376 464 5,754 21,080 15,427 890 4,358 16,113 18,358 52 388,293 n.a. 94,897 146,634 1976
1977 21,954 n.a. 5,980 172 1,890 200,181 48,315 9,024 57,112 12,812 1,366 4,476 476 5,956 21,890 14,323 925 4,476 18,138 19,056 54 394,907 12,640 98,179 147,104 1977
1978 22,813 n.a. 6,231 185 2,003 203,732 51,780 9,207 57,669 13,412 1,392 4,542 486 6,167 22,730 16,668 978 4,598 19,215 19,194 58 401,520 12,935 102,895 147,571 1978
1979 24,883 n.a. 6,432 194 2,084 207,360 51,004 9,540 58,262 13,602 1,420 4,700 502 6,386 23,620 16,267 1,023 4,723 19,022 19,377 61 410,240 13,208 106,433 148,990 1979
1980 25,442 n.a. 6,547 202 2,238 211,066 51,554 9,684 58,661 13,683 1,500 4,835 516 6,614 24,150 17,154 1,093 4,851 22,524 19,999 64 423,610 13,515 107,028 149,644 1980
1981 25,907 n.a. 6,672 208 2,411 222,517 53,838 9,892 59,108 14,023 1,515 5,219 525 6,851 24,700 17,810 1,180 4,738 20,874 20,363 68 437,250 13,790 107,978 148,455 1981
1982 26,744 n.a. 6,811 204 2,407 228,003 57,803 10,175 59,591 14,379 1,545 5,249 535 6,865 25,270 18,614 1,249 4,828 24,831 21,284 71 452,950 14,185 106,228 147,758 1982
1983 27,608 n.a. 7,070 212 2,427 235,989 58,235 10,534 60,493 14,505 1,586 5,457 548 6,884 25,850 19,366 1,280 4,919 22,912 22,075 74 464,360 14,500 107,254 147,760 1983
1984 28,500 n.a. 7,308 212 2,505 244,260 59,763 10,660 60,699 14,429 1,629 5,567 552 6,909 26,400 19,368 1,298 5,014 24,159 23,149 77 481,970 14,790 111,870 148,243 1984
1985 29,500 n.a. 7,428 222 2,543 252,826 62,457 10,935 61,028 14,970 1,674 5,653 590 6,942 26,960 20,327 1,263 5,132 24,227 26,025 81 498,730 15,130 114,314 148,814 1985
1986 30,562 n.a. 7,733 223 2,624 261,697 68,338 11,056 61,340 15,505 1,722 5,760 643 6,982 27,020 20,926 1,242 5,175 25,086 27,399 84 512,820 15,410 116,242 150,009 1986
1987 31,449 n.a. 8,022 217 2,681 270,884 70,402 11,370 61,583 16,354 1,778 5,984 665 7,031 28,700 20,795 1,296 5,199 26,414 27,968 88 527,830 15,400 119,419 151,913 1987
1988 32,361 n.a. 8,107 214 2,725 280,399 72,518 11,618 62,298 16,869 1,838 6,157 743 7,089 28,990 21,497 1,362 5,214 27,726 28,477 92 543,340 15,140 122,820 154,509 1988
1989 33,300 n.a. 8,258 246 2,723 290,254 73,425 11,926 63,216 17,560 1,884 6,391 764 7,159 29,900 21,849 1,426 5,235 28,456 28,940 97 553,290 15,220 125,571 157,081 1989
1990 34,098 n.a. 8,283 250 2,712 300,461 75,851 12,547 64,271 18,085 1,934 6,685 784 7,242 30,650 22,532 1,520 5,047 30,844 30,286 102 647,490 15,740 127,096 159,744 1990
1991 34,915 n.a. 8,439 259 2,754 313,924 76,423 13,097 65,578 18,649 1,991 6,849 796 7,340 29,520 22,979 1,559 5,016 29,220 30,974 107 654,910 16,010 125,898 160,608 1991
1992 35,345 n.a. 8,632 270 2,738 320,261 78,518 13,262 66,318 19,009 2,044 7,048 806 7,526 30,580 23,917 1,604 4,962 30,794 31,815 110 661,520 16,379 126,008 158,464 1992
1993 35,780 4,621 8,745 276 2,800 326,866 79,201 13,408 66,569 19,234 2,099 7,383 765 7,728 31,450 24,443 1,631 5,201 30,679 32,718 113 668,080 16,744 128,109 156,048 1993
1994 36,220 4,728 8,939 279 2,873 333,755 82,038 13,688 66,644 19,848 2,149 7,618 760 7,949 32,230 25,166 1,707 5,281 30,164 33,664 116 674,550 17,114 130,943 156,070 1994
1995 36,666 4,936 9,045 283 2,905 340,947 80,110 14,061 66,857 20,414 2,200 7,645 768 8,191 32,350 25,698 1,793 5,357 30,815 34,590 120 680,650 17,503 133,750 157,226 1995
1996 37,117 5,117 9,068 288 3,073 348,462 85,702 14,572 66,907 20,853 2,254 8,399 770 8,458 33,130 27,442 1,873 5,537 31,166 35,386 124 689,500 17,915 135,985 158,116 1996
1997 37,574 5,225 9,176 289 3,164 356,322 87,050 14,910 67,373 21,214 2,306 8,569 765 8,754 35,160 27,888 1,968 5,608 31,714 35,603 128 689,200 18,357 138,860 159,732 1997
1998 38,037 5,546 9,289 290 3,122 364,551 87,672 15,259 66,579 19,938 2,362 8,600 793 9,087 36,940 28,262 2,023 6,049 30,105 36,954 132 706,370 18,856 141,904 162,516 1998
1999 38,505 5,629 9,385 291 3,112 373,174 88,817 15,784 65,663 20,291 2,417 8,838 814 9,464 37,780 29,003 2,063 6,083 30,686 38,120 134 713,940 19,267 144,471 165,401 1999
2000 38,979 5,915 9,491 292 3,207 382,217 89,316 16,419 65,255 21,156 2,473 9,269 809 9,582 37,320 27,775 2,171 6,310 31,335 38,368 141 720,850 19,623 147,461 169,020 2000
2001 40,684 6,243 9,383 293 3,253 402,512 90,809 16,955 64,761 21,572 2,532 9,357 832 9,900 38,140 30,085 2,171 6,236 32,104 39,000 146 730,250 19,975 147,023 171,483 2001
2002 42,464 6,574 9,454 294 3,218 412,761 91,647 17,755 63,747 22,169 2,571 9,543 871 10,121 39,640 30,251 2,148 6,519 33,061 40,162 153 737,400 20,258 145,900 172,624 2002
2003 44,322 6,967 9,573 296 3,191 423,533 92,811 18,334 63,539 22,139 2,616 9,870 927 10,356 40,470 31,553 2,135 6,609 33,841 41,176 156 744,320 20,514 145,899 173,449 2003
2004 45,311 7,496 9,786 297 3,274 434,864 93,722 19,016 63,676 22,557 2,677 9,980 950 10,607 42,240 31,741 2,207 6,704 34,729 42,316 161 752,000 20,757 147,496 174,798 2004
2005 46,323 7,754 9,942 298 3,337 446,793 93,958 19,691 63,918 22,856 2,739 10,045 968 10,873 43,220 32,875 2,320 6,788 35,257 43,452 167 758,250 21,021 149,459 176,537 2005
2006 47,357 8,053 10,111 299 3,401 459,050 95,457 20,476 64,198 23,151 2,807 10,275 1,010 11,155 46,940 32,886 2,496 7,105 35,686 44,760 174 764,000 21,250 152,029 179,134 2006
2007 48,414 8,354 10,294 304 3,484 468,416 99,930 21,252 64,437 23,433 2,879 10,538 1,024 11,454 47,650 33,672 2,731 7,042 36,249 46,114 179 769,900 21,612 153,347 182,006 2007
2008 49,492 8,369 10,403 311 3,519 478,005 102,301 22,057 64,212 23,577 2,953 10,660 1,042 11,770 49,090 34,533 2,952 7,175 37,017 47,673 182 774,800 21,928 152,478 183,532 2008
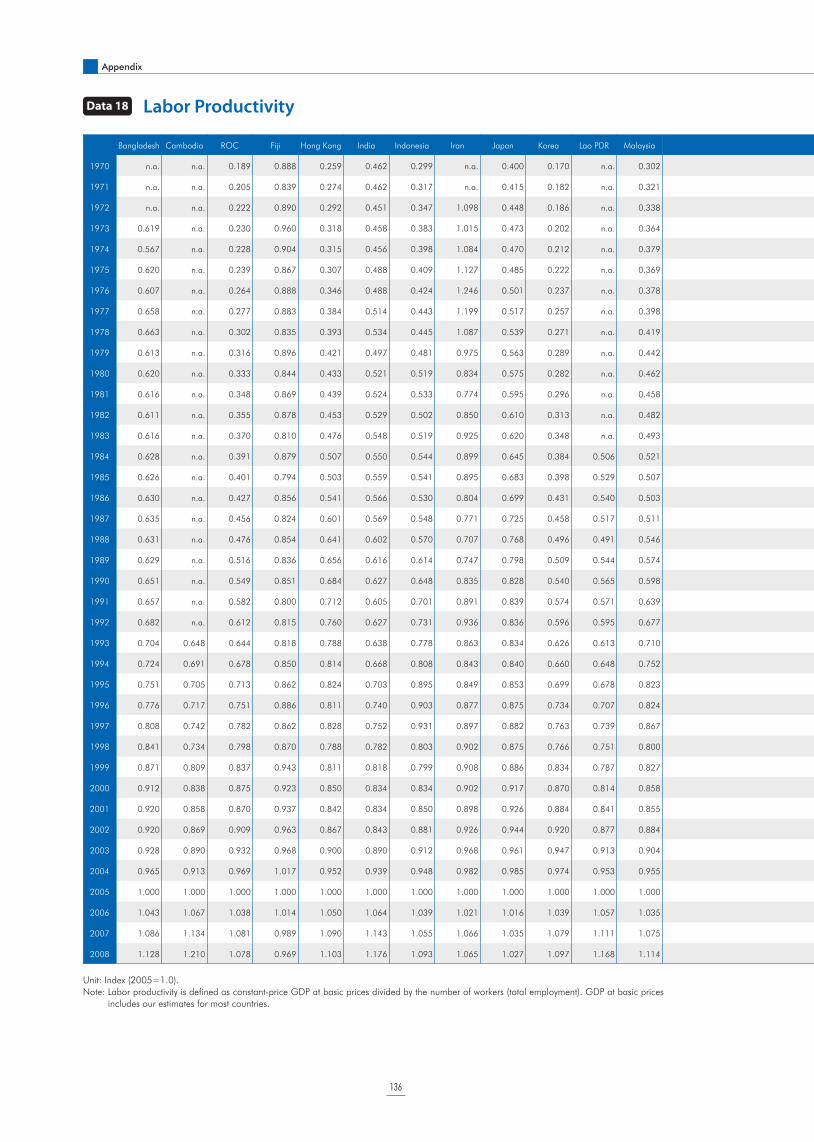
136
Appendix
Unit: Index (2005=1.0).
Note: Labor productivity is defined as constant-price GDP at basic prices divided by the number of workers (total employment). GDP at basic prices
includes our estimates for most countries.
Data 18 Labor Productivity
Bangladesh Cambodia ROC Fiji Hong Kong India Indonesia Iran Japan Korea Lao PDR Malaysia Mongolia Nepal Pakistan Philippines Singapore Sri Lanka Thailand Vietnam Brunei China Myanmar US EU15
1970 n.a. n.a. 0.189 0.888 0.259 0.462 0.299 n.a. 0.400 0.170 n.a. 0.302 0.494 n.a. 0.445 0.802 0.281 0.373 0.264 n.a. n.a. 0.115 n.a. 0.584 0.523 1970
1971 n.a. n.a. 0.205 0.839 0.274 0.462 0.317 n.a. 0.415 0.182 n.a. 0.321 0.507 n.a. 0.437 0.762 0.292 0.371 0.275 n.a. 1.757 0.121 n.a. 0.605 0.541 1971
1972 n.a. n.a. 0.222 0.890 0.292 0.451 0.347 1.098 0.448 0.186 n.a. 0.338 0.524 n.a. 0.439 0.796 0.309 0.352 0.296 n.a. 1.848 0.123 n.a. 0.621 0.563 1972
1973 0.619 n.a. 0.230 0.960 0.318 0.458 0.383 1.015 0.473 0.202 n.a. 0.364 0.570 n.a. 0.451 0.785 0.322 0.373 0.312 n.a. 1.931 0.130 n.a. 0.631 0.582 1973
1974 0.567 n.a. 0.228 0.904 0.315 0.456 0.398 1.084 0.470 0.212 n.a. 0.379 0.595 0.565 0.462 0.828 0.332 0.393 0.354 n.a. 2.052 0.130 n.a. 0.616 0.591 1974
1975 0.620 n.a. 0.239 0.867 0.307 0.488 0.409 1.127 0.485 0.222 n.a. 0.369 0.636 0.570 0.464 0.841 0.342 0.393 0.354 n.a. 1.955 0.139 n.a. 0.624 0.589 1975
1976 0.607 n.a. 0.264 0.888 0.346 0.488 0.424 1.246 0.501 0.237 n.a. 0.378 0.664 0.568 0.468 0.855 0.351 0.401 0.388 0.460 2.229 0.134 n.a. 0.642 0.619 1976
1977 0.658 n.a. 0.277 0.883 0.384 0.514 0.443 1.199 0.517 0.257 n.a. 0.398 0.660 0.573 0.468 0.977 0.365 0.409 0.379 0.459 2.343 0.142 0.360 0.649 0.635 1977
1978 0.663 n.a. 0.302 0.835 0.393 0.534 0.445 1.087 0.539 0.271 n.a. 0.419 0.702 0.566 0.486 0.886 0.373 0.428 0.393 0.459 2.369 0.156 0.374 0.653 0.652 1978
1979 0.613 n.a. 0.316 0.896 0.421 0.497 0.481 0.975 0.563 0.289 n.a. 0.442 0.739 0.534 0.491 0.964 0.390 0.442 0.418 0.458 2.748 0.164 0.383 0.652 0.670 1979
1980 0.620 n.a. 0.333 0.844 0.433 0.521 0.519 0.834 0.575 0.282 n.a. 0.462 0.744 0.558 0.522 0.962 0.401 0.454 0.369 0.431 2.416 0.172 0.404 0.647 0.677 1980
1981 0.616 n.a. 0.348 0.869 0.439 0.524 0.533 0.774 0.595 0.296 n.a. 0.458 0.793 0.560 0.545 0.959 0.411 0.491 0.422 0.438 1.831 0.175 0.421 0.658 0.684 1981
1982 0.611 n.a. 0.355 0.878 0.453 0.529 0.502 0.850 0.610 0.313 n.a. 0.482 0.843 0.561 0.568 0.951 0.415 0.507 0.374 0.451 1.828 0.184 0.432 0.656 0.694 1982
1983 0.616 n.a. 0.370 0.810 0.476 0.548 0.519 0.925 0.620 0.348 n.a. 0.493 0.869 0.593 0.593 0.931 0.441 0.521 0.428 0.465 1.763 0.199 0.441 0.676 0.706 1983
1984 0.628 n.a. 0.391 0.879 0.507 0.550 0.544 0.899 0.645 0.384 0.506 0.521 0.914 0.627 0.610 0.863 0.472 0.537 0.429 0.479 1.700 0.221 0.454 0.696 0.722 1984
1985 0.626 n.a. 0.401 0.794 0.503 0.559 0.541 0.895 0.683 0.398 0.529 0.507 0.905 0.652 0.643 0.762 0.480 0.551 0.448 0.461 1.604 0.243 0.456 0.708 0.737 1985
1986 0.630 n.a. 0.427 0.856 0.541 0.566 0.530 0.804 0.699 0.431 0.540 0.503 0.908 0.660 0.677 0.765 0.495 0.570 0.456 0.439 1.360 0.257 0.443 0.720 0.752 1986
1987 0.635 n.a. 0.456 0.824 0.601 0.569 0.548 0.771 0.725 0.458 0.517 0.511 0.908 0.706 0.678 0.804 0.523 0.577 0.475 0.446 1.305 0.278 0.426 0.723 0.764 1987
1988 0.631 n.a. 0.476 0.854 0.641 0.602 0.570 0.707 0.768 0.496 0.491 0.546 0.855 0.730 0.723 0.830 0.554 0.591 0.512 0.464 1.243 0.301 0.384 0.732 0.784 1988
1989 0.629 n.a. 0.516 0.836 0.656 0.616 0.614 0.747 0.798 0.509 0.544 0.574 0.867 0.757 0.735 0.867 0.583 0.600 0.560 0.478 1.213 0.308 0.396 0.743 0.800 1989
1990 0.651 n.a. 0.549 0.851 0.684 0.627 0.648 0.835 0.828 0.540 0.565 0.598 0.824 0.796 0.749 0.863 0.598 0.661 0.575 0.480 1.168 0.273 0.394 0.748 0.810 1990
1991 0.657 n.a. 0.582 0.800 0.712 0.605 0.701 0.891 0.839 0.574 0.571 0.639 0.766 0.817 0.818 0.840 0.623 0.698 0.659 0.497 1.149 0.294 0.385 0.752 0.822 1991
1992 0.682 n.a. 0.612 0.815 0.760 0.627 0.731 0.936 0.836 0.596 0.595 0.677 0.715 0.828 0.850 0.805 0.649 0.736 0.676 0.526 1.171 0.333 0.413 0.776 0.843 1992
1993 0.704 0.648 0.644 0.818 0.788 0.638 0.778 0.863 0.834 0.626 0.613 0.710 0.720 0.872 0.841 0.814 0.714 0.751 0.734 0.553 1.140 0.376 0.428 0.786 0.854 1993
1994 0.724 0.691 0.678 0.850 0.814 0.668 0.808 0.843 0.840 0.660 0.648 0.752 0.747 0.878 0.852 0.825 0.756 0.781 0.814 0.585 1.141 0.421 0.450 0.800 0.878 1994
1995 0.751 0.705 0.713 0.862 0.824 0.703 0.895 0.849 0.853 0.699 0.678 0.823 0.771 0.897 0.891 0.846 0.773 0.813 0.871 0.624 1.154 0.463 0.471 0.804 0.895 1995
1996 0.776 0.717 0.751 0.886 0.811 0.740 0.903 0.877 0.875 0.734 0.707 0.824 0.790 0.915 0.912 0.839 0.799 0.816 0.912 0.667 1.159 0.502 0.490 0.820 0.906 1996
1997 0.808 0.742 0.782 0.862 0.828 0.752 0.931 0.897 0.882 0.763 0.739 0.867 0.829 0.910 0.868 0.868 0.823 0.858 0.884 0.717 1.103 0.549 0.506 0.838 0.922 1997
1998 0.841 0.734 0.798 0.870 0.788 0.782 0.803 0.902 0.875 0.766 0.751 0.800 0.839 0.916 0.848 0.852 0.785 0.833 0.833 0.731 1.062 0.578 0.517 0.856 0.934 1998
1999 0.871 0.809 0.837 0.943 0.811 0.818 0.799 0.908 0.886 0.834 0.787 0.827 0.858 0.933 0.859 0.858 0.821 0.864 0.854 0.742 1.085 0.615 0.531 0.881 0.946 1999
2000 0.912 0.838 0.875 0.923 0.850 0.834 0.834 0.902 0.917 0.870 0.814 0.858 0.874 0.973 0.907 0.950 0.855 0.883 0.876 0.788 1.060 0.660 0.584 0.899 0.963 2000
2001 0.920 0.858 0.870 0.937 0.842 0.834 0.850 0.898 0.926 0.884 0.841 0.855 0.875 0.943 0.906 0.893 0.842 0.881 0.874 0.828 1.058 0.706 0.639 0.912 0.967 2001
2002 0.920 0.869 0.909 0.963 0.867 0.843 0.881 0.926 0.944 0.920 0.877 0.884 0.876 0.959 0.900 0.927 0.886 0.877 0.894 0.862 1.044 0.763 0.706 0.935 0.971 2002
2003 0.928 0.890 0.932 0.968 0.900 0.890 0.912 0.968 0.961 0.947 0.913 0.904 0.881 0.981 0.924 0.933 0.931 0.917 0.936 0.902 1.060 0.831 0.794 0.960 0.978 2003
2004 0.965 0.913 0.969 1.017 0.952 0.939 0.948 0.982 0.985 0.974 0.953 0.955 0.950 0.992 0.950 0.987 0.984 0.953 0.970 0.947 1.029 0.906 0.891 0.983 0.992 2004
2005 1.000 1.000 1.000 1.000 1.000 1.000 1.000 1.000 1.000 1.000 1.000 1.000 1.000 1.000 1.000 1.000 1.000 1.000 1.000 1.000 1.000 1.000 1.000 1.000 1.000 2005
2006 1.043 1.067 1.038 1.014 1.050 1.064 1.039 1.021 1.016 1.039 1.057 1.035 1.041 1.008 0.978 1.054 1.011 1.029 1.039 1.051 1.003 1.119 1.115 1.010 1.014 2006
2007 1.086 1.134 1.081 0.989 1.090 1.143 1.055 1.066 1.035 1.079 1.111 1.075 1.132 1.042 1.019 1.102 1.000 1.109 1.074 1.107 0.981 1.268 1.157 1.020 1.025 2007
2008 1.128 1.210 1.078 0.969 1.103 1.176 1.093 1.065 1.027 1.097 1.168 1.114 1.212 1.063 1.005 1.116 0.944 1.153 1.078 1.137 0.947 1.380 1.163 1.024 1.019 2008

137
Bangladesh Cambodia ROC Fiji Hong Kong India Indonesia Iran Japan Korea Lao PDR Malaysia Mongolia Nepal Pakistan Philippines Singapore Sri Lanka Thailand Vietnam Brunei China Myanmar US EU15
1970 n.a. n.a. 0.189 0.888 0.259 0.462 0.299 n.a. 0.400 0.170 n.a. 0.302 0.494 n.a. 0.445 0.802 0.281 0.373 0.264 n.a. n.a. 0.115 n.a. 0.584 0.523 1970
1971 n.a. n.a. 0.205 0.839 0.274 0.462 0.317 n.a. 0.415 0.182 n.a. 0.321 0.507 n.a. 0.437 0.762 0.292 0.371 0.275 n.a. 1.757 0.121 n.a. 0.605 0.541 1971
1972 n.a. n.a. 0.222 0.890 0.292 0.451 0.347 1.098 0.448 0.186 n.a. 0.338 0.524 n.a. 0.439 0.796 0.309 0.352 0.296 n.a. 1.848 0.123 n.a. 0.621 0.563 1972
1973 0.619 n.a. 0.230 0.960 0.318 0.458 0.383 1.015 0.473 0.202 n.a. 0.364 0.570 n.a. 0.451 0.785 0.322 0.373 0.312 n.a. 1.931 0.130 n.a. 0.631 0.582 1973
1974 0.567 n.a. 0.228 0.904 0.315 0.456 0.398 1.084 0.470 0.212 n.a. 0.379 0.595 0.565 0.462 0.828 0.332 0.393 0.354 n.a. 2.052 0.130 n.a. 0.616 0.591 1974
1975 0.620 n.a. 0.239 0.867 0.307 0.488 0.409 1.127 0.485 0.222 n.a. 0.369 0.636 0.570 0.464 0.841 0.342 0.393 0.354 n.a. 1.955 0.139 n.a. 0.624 0.589 1975
1976 0.607 n.a. 0.264 0.888 0.346 0.488 0.424 1.246 0.501 0.237 n.a. 0.378 0.664 0.568 0.468 0.855 0.351 0.401 0.388 0.460 2.229 0.134 n.a. 0.642 0.619 1976
1977 0.658 n.a. 0.277 0.883 0.384 0.514 0.443 1.199 0.517 0.257 n.a. 0.398 0.660 0.573 0.468 0.977 0.365 0.409 0.379 0.459 2.343 0.142 0.360 0.649 0.635 1977
1978 0.663 n.a. 0.302 0.835 0.393 0.534 0.445 1.087 0.539 0.271 n.a. 0.419 0.702 0.566 0.486 0.886 0.373 0.428 0.393 0.459 2.369 0.156 0.374 0.653 0.652 1978
1979 0.613 n.a. 0.316 0.896 0.421 0.497 0.481 0.975 0.563 0.289 n.a. 0.442 0.739 0.534 0.491 0.964 0.390 0.442 0.418 0.458 2.748 0.164 0.383 0.652 0.670 1979
1980 0.620 n.a. 0.333 0.844 0.433 0.521 0.519 0.834 0.575 0.282 n.a. 0.462 0.744 0.558 0.522 0.962 0.401 0.454 0.369 0.431 2.416 0.172 0.404 0.647 0.677 1980
1981 0.616 n.a. 0.348 0.869 0.439 0.524 0.533 0.774 0.595 0.296 n.a. 0.458 0.793 0.560 0.545 0.959 0.411 0.491 0.422 0.438 1.831 0.175 0.421 0.658 0.684 1981
1982 0.611 n.a. 0.355 0.878 0.453 0.529 0.502 0.850 0.610 0.313 n.a. 0.482 0.843 0.561 0.568 0.951 0.415 0.507 0.374 0.451 1.828 0.184 0.432 0.656 0.694 1982
1983 0.616 n.a. 0.370 0.810 0.476 0.548 0.519 0.925 0.620 0.348 n.a. 0.493 0.869 0.593 0.593 0.931 0.441 0.521 0.428 0.465 1.763 0.199 0.441 0.676 0.706 1983
1984 0.628 n.a. 0.391 0.879 0.507 0.550 0.544 0.899 0.645 0.384 0.506 0.521 0.914 0.627 0.610 0.863 0.472 0.537 0.429 0.479 1.700 0.221 0.454 0.696 0.722 1984
1985 0.626 n.a. 0.401 0.794 0.503 0.559 0.541 0.895 0.683 0.398 0.529 0.507 0.905 0.652 0.643 0.762 0.480 0.551 0.448 0.461 1.604 0.243 0.456 0.708 0.737 1985
1986 0.630 n.a. 0.427 0.856 0.541 0.566 0.530 0.804 0.699 0.431 0.540 0.503 0.908 0.660 0.677 0.765 0.495 0.570 0.456 0.439 1.360 0.257 0.443 0.720 0.752 1986
1987 0.635 n.a. 0.456 0.824 0.601 0.569 0.548 0.771 0.725 0.458 0.517 0.511 0.908 0.706 0.678 0.804 0.523 0.577 0.475 0.446 1.305 0.278 0.426 0.723 0.764 1987
1988 0.631 n.a. 0.476 0.854 0.641 0.602 0.570 0.707 0.768 0.496 0.491 0.546 0.855 0.730 0.723 0.830 0.554 0.591 0.512 0.464 1.243 0.301 0.384 0.732 0.784 1988
1989 0.629 n.a. 0.516 0.836 0.656 0.616 0.614 0.747 0.798 0.509 0.544 0.574 0.867 0.757 0.735 0.867 0.583 0.600 0.560 0.478 1.213 0.308 0.396 0.743 0.800 1989
1990 0.651 n.a. 0.549 0.851 0.684 0.627 0.648 0.835 0.828 0.540 0.565 0.598 0.824 0.796 0.749 0.863 0.598 0.661 0.575 0.480 1.168 0.273 0.394 0.748 0.810 1990
1991 0.657 n.a. 0.582 0.800 0.712 0.605 0.701 0.891 0.839 0.574 0.571 0.639 0.766 0.817 0.818 0.840 0.623 0.698 0.659 0.497 1.149 0.294 0.385 0.752 0.822 1991
1992 0.682 n.a. 0.612 0.815 0.760 0.627 0.731 0.936 0.836 0.596 0.595 0.677 0.715 0.828 0.850 0.805 0.649 0.736 0.676 0.526 1.171 0.333 0.413 0.776 0.843 1992
1993 0.704 0.648 0.644 0.818 0.788 0.638 0.778 0.863 0.834 0.626 0.613 0.710 0.720 0.872 0.841 0.814 0.714 0.751 0.734 0.553 1.140 0.376 0.428 0.786 0.854 1993
1994 0.724 0.691 0.678 0.850 0.814 0.668 0.808 0.843 0.840 0.660 0.648 0.752 0.747 0.878 0.852 0.825 0.756 0.781 0.814 0.585 1.141 0.421 0.450 0.800 0.878 1994
1995 0.751 0.705 0.713 0.862 0.824 0.703 0.895 0.849 0.853 0.699 0.678 0.823 0.771 0.897 0.891 0.846 0.773 0.813 0.871 0.624 1.154 0.463 0.471 0.804 0.895 1995
1996 0.776 0.717 0.751 0.886 0.811 0.740 0.903 0.877 0.875 0.734 0.707 0.824 0.790 0.915 0.912 0.839 0.799 0.816 0.912 0.667 1.159 0.502 0.490 0.820 0.906 1996
1997 0.808 0.742 0.782 0.862 0.828 0.752 0.931 0.897 0.882 0.763 0.739 0.867 0.829 0.910 0.868 0.868 0.823 0.858 0.884 0.717 1.103 0.549 0.506 0.838 0.922 1997
1998 0.841 0.734 0.798 0.870 0.788 0.782 0.803 0.902 0.875 0.766 0.751 0.800 0.839 0.916 0.848 0.852 0.785 0.833 0.833 0.731 1.062 0.578 0.517 0.856 0.934 1998
1999 0.871 0.809 0.837 0.943 0.811 0.818 0.799 0.908 0.886 0.834 0.787 0.827 0.858 0.933 0.859 0.858 0.821 0.864 0.854 0.742 1.085 0.615 0.531 0.881 0.946 1999
2000 0.912 0.838 0.875 0.923 0.850 0.834 0.834 0.902 0.917 0.870 0.814 0.858 0.874 0.973 0.907 0.950 0.855 0.883 0.876 0.788 1.060 0.660 0.584 0.899 0.963 2000
2001 0.920 0.858 0.870 0.937 0.842 0.834 0.850 0.898 0.926 0.884 0.841 0.855 0.875 0.943 0.906 0.893 0.842 0.881 0.874 0.828 1.058 0.706 0.639 0.912 0.967 2001
2002 0.920 0.869 0.909 0.963 0.867 0.843 0.881 0.926 0.944 0.920 0.877 0.884 0.876 0.959 0.900 0.927 0.886 0.877 0.894 0.862 1.044 0.763 0.706 0.935 0.971 2002
2003 0.928 0.890 0.932 0.968 0.900 0.890 0.912 0.968 0.961 0.947 0.913 0.904 0.881 0.981 0.924 0.933 0.931 0.917 0.936 0.902 1.060 0.831 0.794 0.960 0.978 2003
2004 0.965 0.913 0.969 1.017 0.952 0.939 0.948 0.982 0.985 0.974 0.953 0.955 0.950 0.992 0.950 0.987 0.984 0.953 0.970 0.947 1.029 0.906 0.891 0.983 0.992 2004
2005 1.000 1.000 1.000 1.000 1.000 1.000 1.000 1.000 1.000 1.000 1.000 1.000 1.000 1.000 1.000 1.000 1.000 1.000 1.000 1.000 1.000 1.000 1.000 1.000 1.000 2005
2006 1.043 1.067 1.038 1.014 1.050 1.064 1.039 1.021 1.016 1.039 1.057 1.035 1.041 1.008 0.978 1.054 1.011 1.029 1.039 1.051 1.003 1.119 1.115 1.010 1.014 2006
2007 1.086 1.134 1.081 0.989 1.090 1.143 1.055 1.066 1.035 1.079 1.111 1.075 1.132 1.042 1.019 1.102 1.000 1.109 1.074 1.107 0.981 1.268 1.157 1.020 1.025 2007
2008 1.128 1.210 1.078 0.969 1.103 1.176 1.093 1.065 1.027 1.097 1.168 1.114 1.212 1.063 1.005 1.116 0.944 1.153 1.078 1.137 0.947 1.380 1.163 1.024 1.019 2008
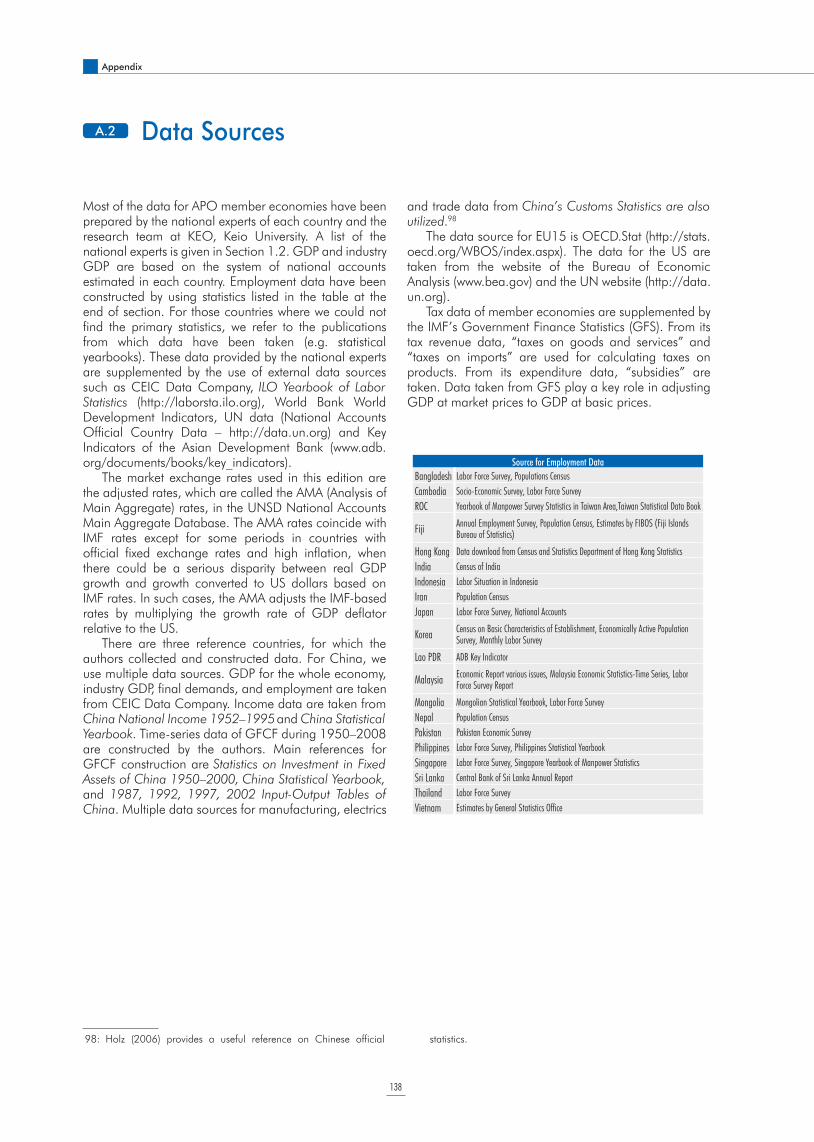
138
Appendix
Most of the data for APO member economies have been prepared by the national experts of each country and the research team at KEO, Keio University. A list of the national experts is given in Section 1.2. GDP and industry GDP are based on the system of national accounts estimated in each country. Employment data have been constructed by using statistics listed in the table at the end of section. For those countries where we could not find the primary statistics, we refer to the publications from which data have been taken (e.g. statistical yearbooks). These data provided by the national experts are supplemented by the use of external data sources such as CEIC Data Company, ILO Yearbook of Labor Statistics (http://laborsta.ilo.org), World Bank World Development Indicators, UN data (National Accounts Official Country Data – http://data.un.org) and Key Indicators of the Asian Development Bank (www.adb.org/documents/books/key_indicators).
The market exchange rates used in this edition are the adjusted rates, which are called the AMA (Analysis of Main Aggregate) rates, in the UNSD National Accounts Main Aggregate Database. The AMA rates coincide with IMF rates except for some periods in countries with official fixed exchange rates and high inflation, when there could be a serious disparity between real GDP growth and growth converted to US dollars based on IMF rates. In such cases, the AMA adjusts the IMF-based rates by multiplying the growth rate of GDP deflator relative to the US.
There are three reference countries, for which the authors collected and constructed data. For China, we use multiple data sources. GDP for the whole economy, industry GDP, final demands, and employment are taken from CEIC Data Company. Income data are taken from China National Income 1952–1995 and China Statistical Yearbook. Time-series data of GFCF during 1950–2008 are constructed by the authors. Main references for GFCF construction are Statistics on Investment in Fixed Assets of China 1950–2000, China Statistical Yearbook, and 1987, 1992, 1997, 2002 Input-Output Tables of China. Multiple data sources for manufacturing, electrics
and trade data from China’s Customs Statistics are also utilized.98
The data source for EU15 is OECD.Stat (http://stats.oecd.org/WBOS/index.aspx). The data for the US are taken from the website of the Bureau of Economic Analysis (www.bea.gov) and the UN website (http://data.un.org).
Tax data of member economies are supplemented by the IMF’s Government Finance Statistics (GFS). From its tax revenue data, “taxes on goods and services” and “taxes on imports” are used for calculating taxes on products. From its expenditure data, “subsidies” are taken. Data taken from GFS play a key role in adjusting GDP at market prices to GDP at basic prices.
A.2 Data Sources
Source for Employment Data
Bangladesh Labor Force Survey, Populations Census
Cambodia Socio-Economic Survey, Labor Force Survey
ROC Yearbook of Manpower Survey Statistics in Taiwan Area,Taiwan Statistical Data Book
FijiAnnual Employment Survey, Population Census, Estimates by FIBOS (Fiji Islands Bureau of Statistics)
Hong Kong Data download from Census and Statistics Department of Hong Kong Statistics
India Census of India
Indonesia Labor Situation in Indonesia
Iran Population Census
Japan Labor Force Survey, National Accounts
KoreaCensus on Basic Characteristics of Establishment, Economically Active Population Survey, Monthly Labor Survey
Lao PDR ADB Key Indicator
MalaysiaEconomic Report various issues, Malaysia Economic Statistics-Time Series, Labor Force Survey Report
Mongolia Mongolian Statistical Yearbook, Labor Force Survey
Nepal Population Census
Pakistan Pakistan Economic Survey
Philippines Labor Force Survey, Philippines Statistical Yearbook
Singapore Labor Force Survey, Singapore Yearbook of Manpower Statistics
Sri Lanka Central Bank of Sri Lanka Annual Report
Thailand Labor Force Survey
Vietnam Estimates by General Statistics Office
98: Holz (2006) provides a useful reference on Chinese official statistics.
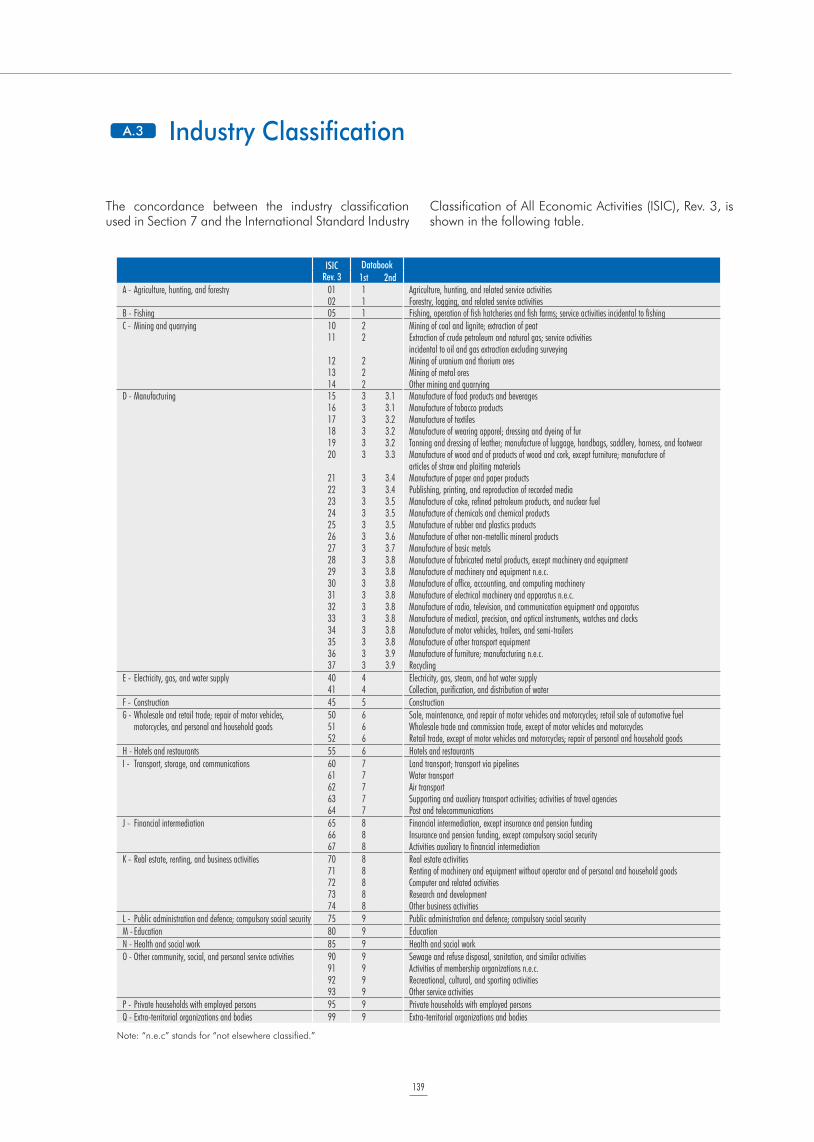
139
The concordance between the industry classification used in Section 7 and the International Standard Industry
Classification of All Economic Activities (ISIC), Rev. 3, is shown in the following table.
Industry Classification
ISICRev. 3
Databook
1st 2ndA - Agriculture, hunting, and forestry 01 1 Agriculture, hunting, and related service activities
02 1 Forestry, logging, and related service activitiesB - Fishing 05 1 Fishing, operation of fish hatcheries and fish farms; service activities incidental to fishing
C - Mining and quarrying 10 2 Mining of coal and lignite; extraction of peat11 2 Extraction of crude petroleum and natural gas; service activities
incidental to oil and gas extraction excluding surveying12 2 Mining of uranium and thorium ores13 2 Mining of metal ores14 2 Other mining and quarrying
D - Manufacturing 15 3 3.1 Manufacture of food products and beverages16 3 3.1 Manufacture of tobacco products17 3 3.2 Manufacture of textiles18 3 3.2 Manufacture of wearing apparel; dressing and dyeing of fur19 3 3.2 Tanning and dressing of leather; manufacture of luggage, handbags, saddlery, harness, and footwear20 3 3.3 Manufacture of wood and of products of wood and cork, except furniture; manufacture of
articles of straw and plaiting materials21 3 3.4 Manufacture of paper and paper products22 3 3.4 Publishing, printing, and reproduction of recorded media23 3 3.5 Manufacture of coke, refined petroleum products, and nuclear fuel24 3 3.5 Manufacture of chemicals and chemical products25 3 3.5 Manufacture of rubber and plastics products26 3 3.6 Manufacture of other non-metallic mineral products27 3 3.7 Manufacture of basic metals28 3 3.8 Manufacture of fabricated metal products, except machinery and equipment29 3 3.8 Manufacture of machinery and equipment n.e.c.30 3 3.8 Manufacture of office, accounting, and computing machinery31 3 3.8 Manufacture of electrical machinery and apparatus n.e.c.32 3 3.8 Manufacture of radio, television, and communication equipment and apparatus33 3 3.8 Manufacture of medical, precision, and optical instruments, watches and clocks34 3 3.8 Manufacture of motor vehicles, trailers, and semi-trailers35 3 3.8 Manufacture of other transport equipment36 3 3.9 Manufacture of furniture; manufacturing n.e.c.37 3 3.9 Recycling
E - Electricity, gas, and water supply 40 4 Electricity, gas, steam, and hot water supply41 4 Collection, purification, and distribution of water
F - Construction 45 5 Construction
G - Wholesale and retail trade; repair of motor vehicles, 50 6 Sale, maintenance, and repair of motor vehicles and motorcycles; retail sale of automotive fuelmotorcycles, and personal and household goods 51 6 Wholesale trade and commission trade, except of motor vehicles and motorcycles
52 6 Retail trade, except of motor vehicles and motorcycles; repair of personal and household goods
H - Hotels and restaurants 55 6 Hotels and restaurants
I - Transport, storage, and communications 60 7 Land transport; transport via pipelines61 7 Water transport62 7 Air transport63 7 Supporting and auxiliary transport activities; activities of travel agencies64 7 Post and telecommunications
J - Financial intermediation 65 8 Financial intermediation, except insurance and pension funding66 8 Insurance and pension funding, except compulsory social security67 8 Activities auxiliary to financial intermediation
K - Real estate, renting, and business activities 70 8 Real estate activities71 8 Renting of machinery and equipment without operator and of personal and household goods72 8 Computer and related activities73 8 Research and development74 8 Other business activities
L - Public administration and defence; compulsory social security 75 9 Public administration and defence; compulsory social security
M - Education 80 9 Education
N - Health and social work 85 9 Health and social work
O - Other community, social, and personal service activities 90 9 Sewage and refuse disposal, sanitation, and similar activities91 9 Activities of membership organizations n.e.c.92 9 Recreational, cultural, and sporting activities93 9 Other service activities
P - Private households with employed persons 95 9 Private households with employed persons
Q - Extra-territorial organizations and bodies 99 9 Extra-territorial organizations and bodies
Note: “n.e.c” stands for “not elsewhere classified.”
A.3
140
About the APO
The Asian Productivity Organization (APO) was established on 11 May 1961 as a regional intergovernmental organization. Its mission is to contribute to the socioeconomic development of Asia and the Pacific through enhancing produc-tivity. The APO is nonpolitical, nonprofit, and nondiscriminatory.
APO members are: Bangladesh, Cambodia, Republic of China, Fiji, Hong Kong, India, Indonesia, Islamic Republic of Iran, Japan, Republic of Korea, Lao PDR, Malaysia, Mongolia, Nepal, Pakistan, Philippines, Singapore, Sri Lanka, Thai-land, and Vietnam.
The APO seeks to realize its objective by playing the roles of think tank, catalyst, regional adviser, institution builder, and clearinghouse for productivity informa-tion.
The supreme organ of the APO is the Governing Body. It comprises one Director from each member country designated by their respective governments. The Governing Body decides on policies and strategies of APO programs and ap-proves its budgets, finances, and matters relating to membership.
Each member country designates a national body to be its national productiv-ity organization (NPO). NPOs are either agencies of the government or statutory bodies entrusted with the task of spearheading the productivity movement in their respective countries. They serve as the official bodies to liaise with the APO Sec-retariat and to implement APO projects hosted by their governments.
The Secretariat, based in Tokyo, Japan, is the executive arm of the APO. It is headed by the Secretary-General. The Secretariat carries out the decisions, pol-icy directives, and annual programs approved by the Governing Body. It also facilitates cooperative relationships with other international organizations, gov-ernments, and private institutions.
The APO Secretariat has four functional departments: Administration and Finance, Research and Planning, Industry, and Agriculture.
APO’s programs cover the industry, service and agriculture sectors, with special focus on socioeconomic development, development of small and medium enter-prises, human resources management, productivity measurement and analysis, knowledge management, production and technology management, information technology, development of NPOs, green productivity, integrated community de-velopment, agribusiness, agricultural development and policies, resources and technology, and agricultural marketing and institutions.
Its activities include researches, forums, conferences, study meetings, work-shops, training courses, seminars, observational study missions, and demonstra-tion projects.
Mission
Membership
Key Roles
Organization
Programs and Activities