Embed Size (px)
Citation preview
APNIC
• Regional Internet Registry – Delega8on for in-‐addr & ip6 .arpa. Sub-‐spaces – Primary for Asia-‐Pacific Address ranges – Secondary for Europe, Africa, La8n America
• DNS loads of the order 5,000 – 12,000 q/sec – 3 points of presence – Brisbane, Hong Kong, Tokyo – Iden8cal NS deployments each loca8on
• ANS, single host (at this 8me) • One nserver for primary, one for secondary at each loca8on

APNIC/DNS
• Reverse is a very dis8nct DNS traffic class – Predictable query, response sizes (PTR record)
• PTR & NXDOMAIN close to same size (absent DNSSEC)
– Typically 1-‐2 NS listed per reverse range • All reverse listed under (some of) ~10 NS – RIRs secondary each other
• Par8al DNSSEC deployment • RIPE NCC only at this 8me • Rest of RIR system expected early in 2010
– …which we look forward to capturing in DITL 2010!
APNIC/DNS
• Also some ccTLD serve – Very minor traffic set against PTR query load
– Not discussed in this presenta8on • NS set shared with ARIN/RIPE/LacNIC/AfriNIC – So DITL measurement is only par8al – But believed to be ‘representa8ve’ – Both in-‐region and out-‐of-‐region query sources
• Clean separa8on primary/secondary load
APNIC/DNS…
• Why do people ‘do’ reverse-‐DNS? – Log processing? (cron, ‘lumpy’) – On-‐demand queries 8ed to SPAM, firewall
• Semi con8nuous. Servers – …or are they?
• We don’t actually know. IP source variance suggests it might be random hosts.
– Some ‘cultural’ overhangs/differences • Very popular in Japan (c/f drags in DNSOP) • Service disrup8ons when delega8on fails • Varying levels of delega8on across different economies
• RIR commihed to providing reverse-‐DNS – Future service models may well increase use – Con8nued rise in query load
APNIC/DNS/monitoring
• On-‐server since 2002, tcpdump based – 15 min cycle 8me, 1min samples – Relocated off box (passive-‐TAP) in 2008
• DSC since 2008 (passive-‐TAP) – Con8nuous packet capture, 3(+) day window – DITL from same host (just export dnscap files)
• Good correla8ons between measurements – Sampling will probably cease in 2010 – Useful for rapid deployment, prototyping before passive tap acquired.
– Not sensible on high query load DNS server
APNIC/DNS/DITL
• Want to understand long term traffic dynamics of our systems – Growth/trends (capacity planning)
• Differences inter-‐site emerge – v4/v6? – Query load? – IX ‘richness’ ?
• What can DNS tell us about address/resource usage? – v4/v6 deployment/uptake measurements – Informing global policy, OECD/EU measurement processes
Why unique Ips?
• Query load per IP not yet well understood – S8ll trying to define ques8ons! – High variances seen in day, between days
• Dis8nct IP’s seem a strong indicator of v4/v6 rela8vi8es – Consistent with other measurement domains web, rou8ng – Allows regional, per-‐economy, per-‐en8ty (ISP) analyses
• Ips per allocated network measurement of use in resource/policy planning
• Na8ve, Tunneling comparisons possible – Possible to see RTT differences?
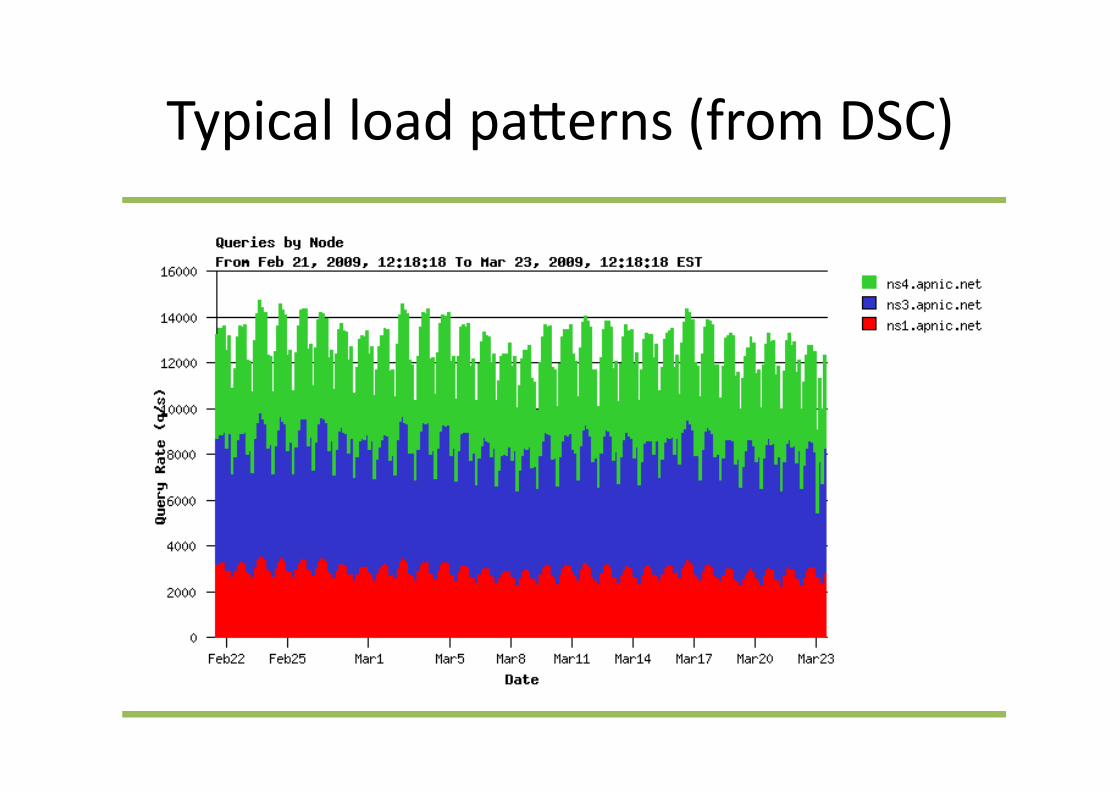
Typical load paherns (from DSC)
observa8ons
• Strong diurnal pahern • Small inter-‐day/weekend variances
• Suggests DITL samples in Mar/Apr good indicators for rest-‐of-‐year ac8vity
• Trends/Changes therefore noteworthy • First approxima8on: “this process is ra8onal” – We’re en8tled to treat DITL data as ‘indica8ve’
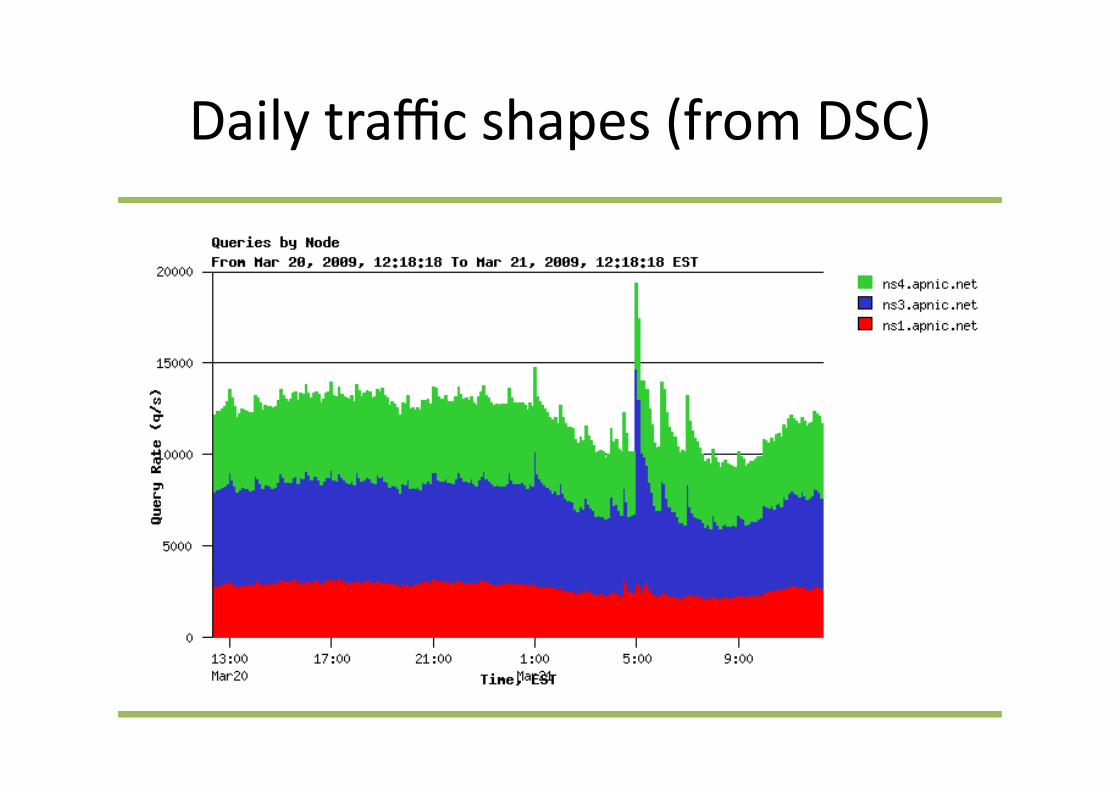
Daily traffic shapes (from DSC)
Observa8ons
• Strong single ‘ar8fact’ required some closer analysis (presented at ESNOG, RIPE) – JP ‘signal’ of DNS lookup
• Other ‘clock 8ck’ interval peaks visible – Against background of constant(ish) load – Less ‘cron’ affected than we thought.
• Inter-‐site differences – Clearly volume, but also some of the ar8facts – Strong unity of diurnal pahern for the NS (primary) server set, cross-‐site.
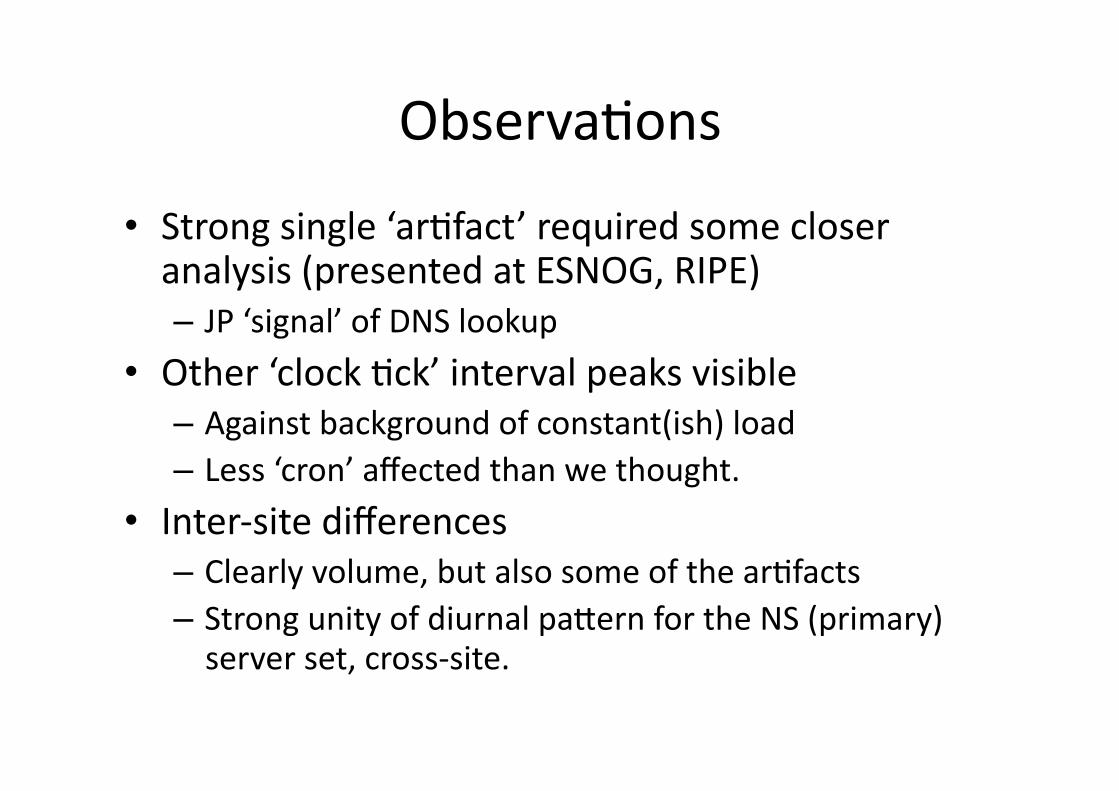
Unique IPs in 24h
414715
510442
2008
Both years
2009 384110
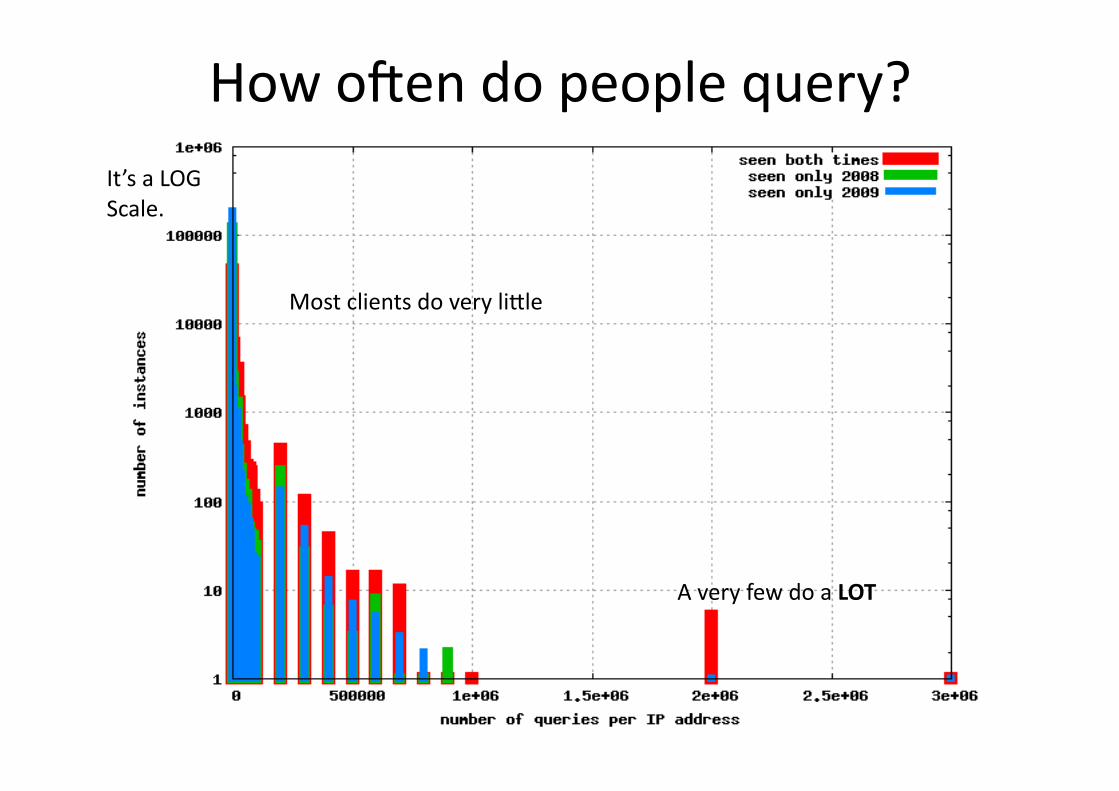
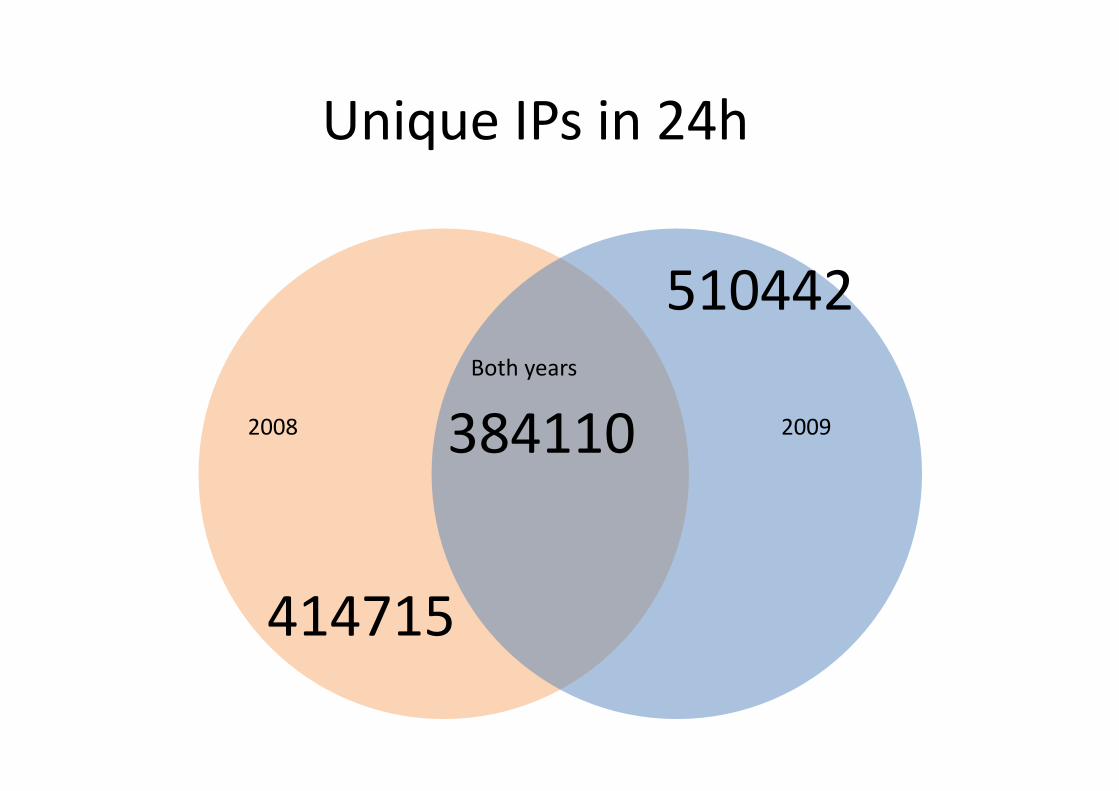
How ogen do people query?
Most clients do very lihle
A very few do a LOT
It’s a LOG Scale.
Client behaviors
• More variance in query pool than expected • Many visits from Ips that only do 1-‐2 lookups
• Lihle address persistance 2008/09 – Want to see how this maps out in DITL 2010
• Beginning to analyze by RIR alloca8on records – Up to 70% of deployed nets ‘seen’ in 2009 DITL – Also want to track this into DITL 2010
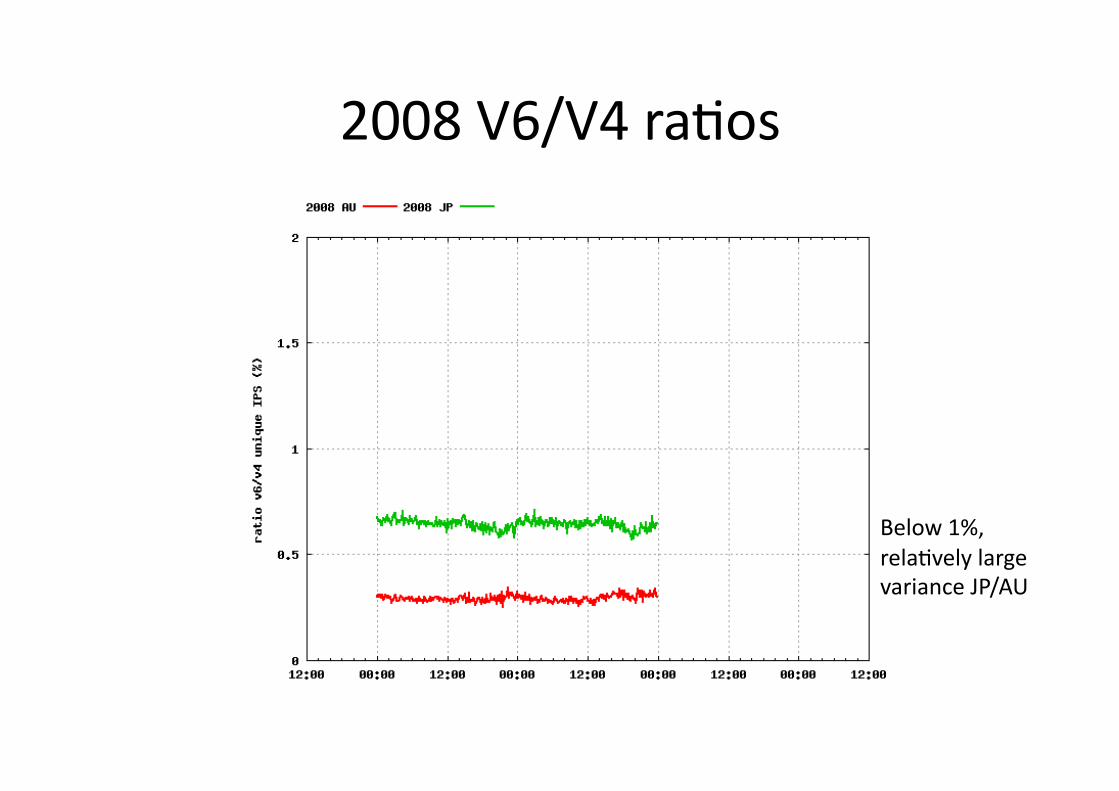
2008 V6/V4 ra8os
Below 1%, rela8vely large variance JP/AU

2009 V6/V4 ra8os
Around 1%, less variance
Observa8ons
• Weak diurnal pahern: ra8o of v4/v6 is not affected strongly by 8me-‐of-‐day
• ‘increased’ use of IPv6 transport in 2009 compared to 2008. • Also less variance in v4/v6 sugges8ng improved transit (AU
is on tunnel, added peering to HE) – Will re-‐home V6 onto na8ve feed before 2010
• 1% figure is consistent with other V6 uptake measurements for 2009 – Reverse DNS appears to be good indicator. Useful! – May be worth mapping backwards into other measurments
• Worth looking at 2010 for compari8ve/trends
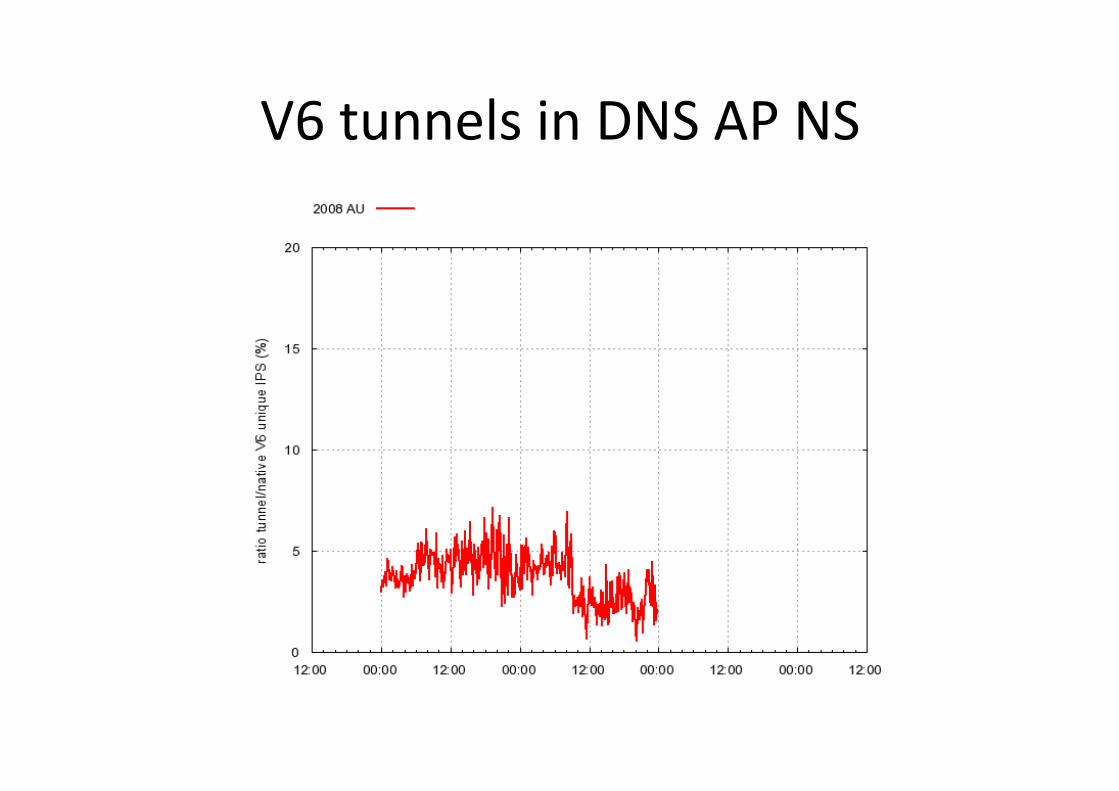
V6 tunnels in DNS AP NS
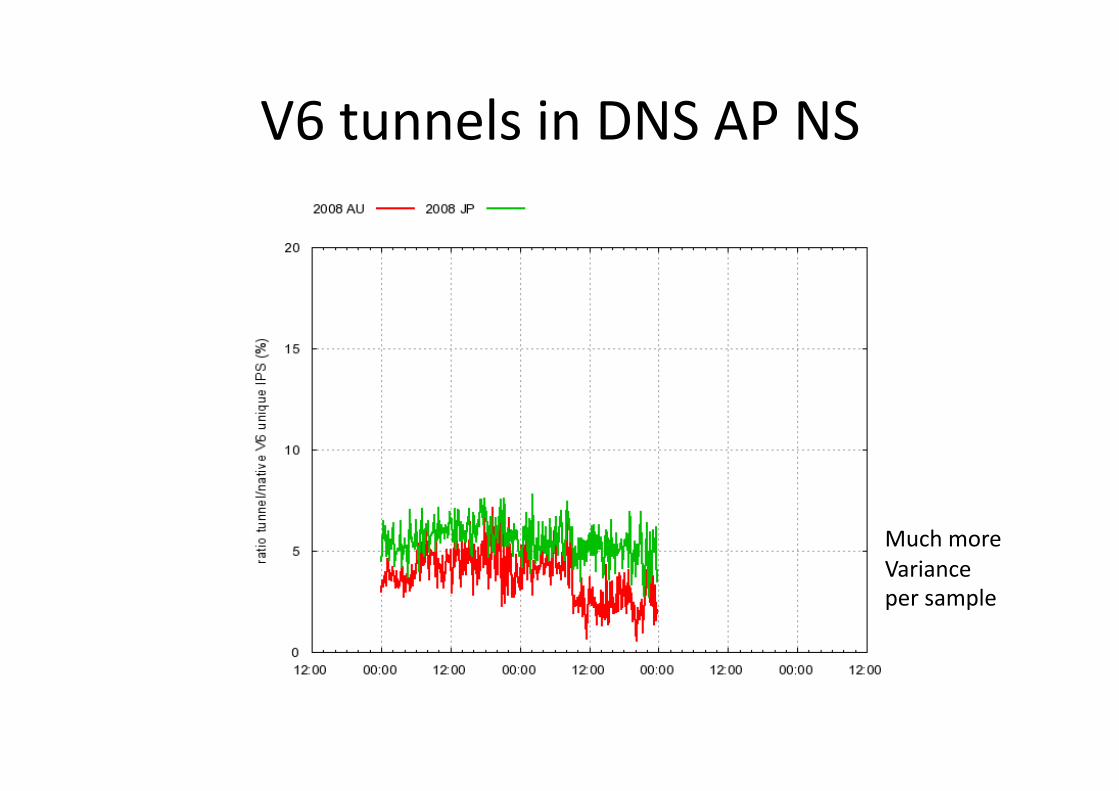
V6 tunnels in DNS AP NS
Much more Variance per sample

V6 tunnels in DNS AP NS
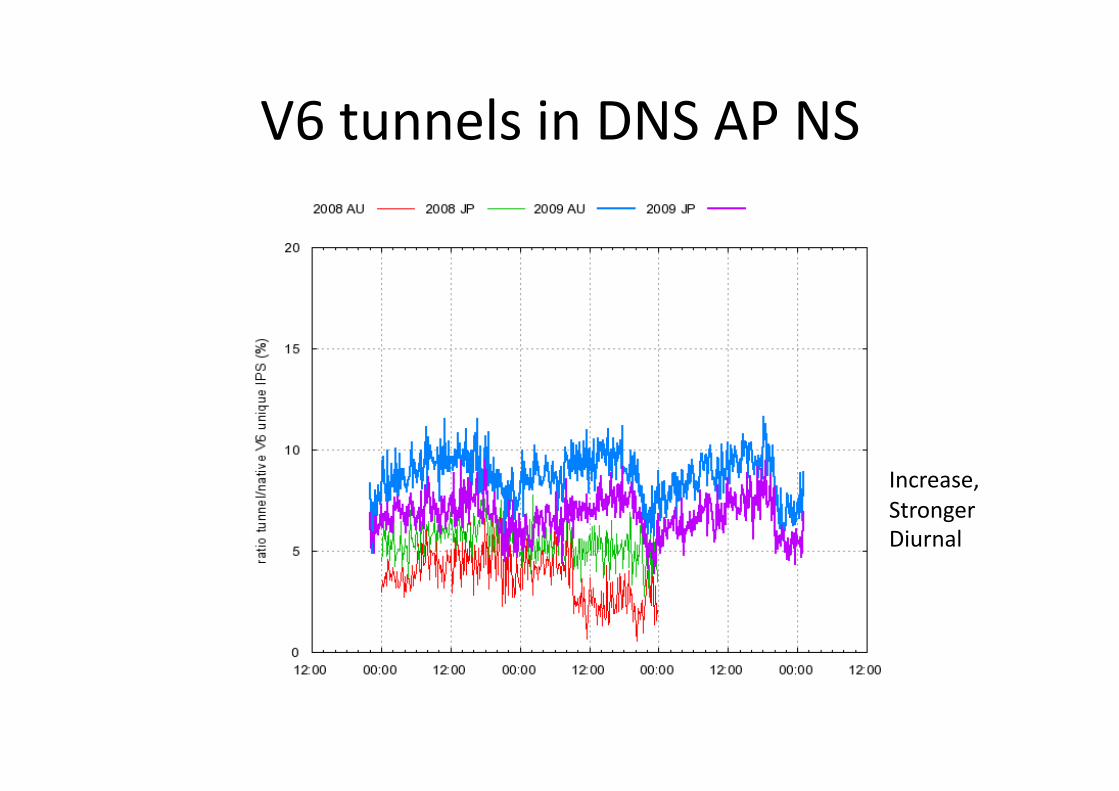
V6 tunnels in DNS AP NS
Increase, Stronger Diurnal
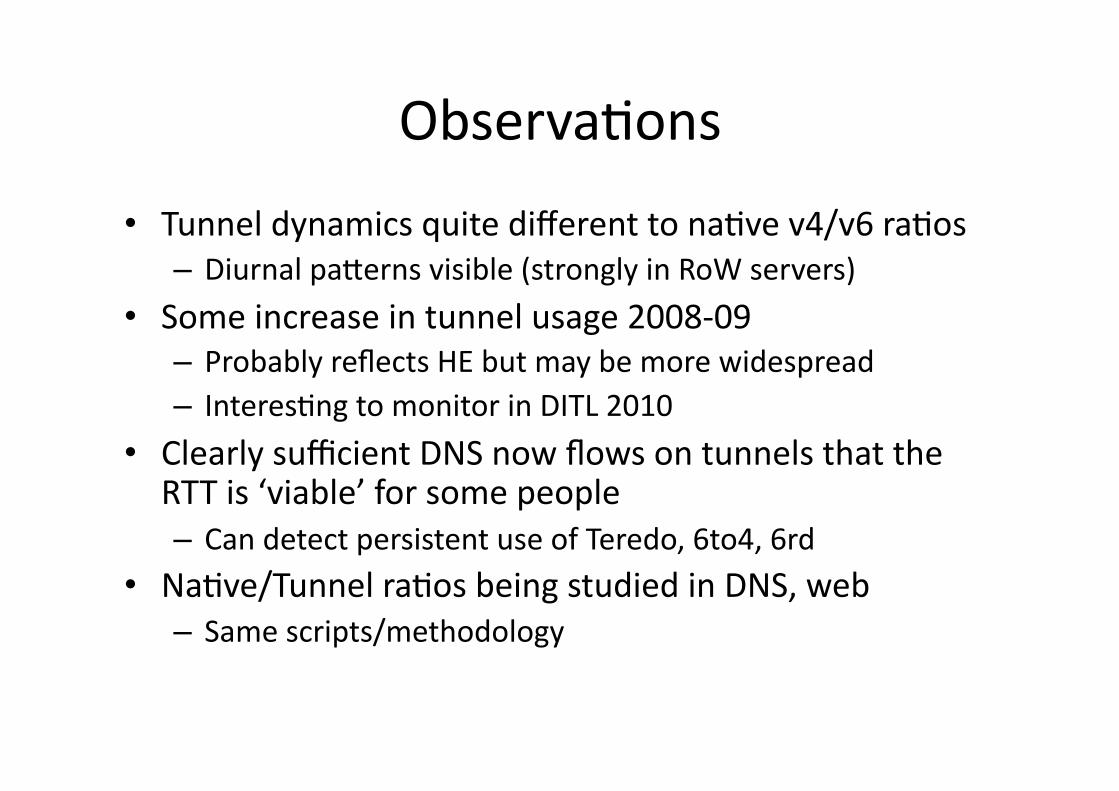
Observa8ons
• Tunnel dynamics quite different to na8ve v4/v6 ra8os – Diurnal paherns visible (strongly in RoW servers)
• Some increase in tunnel usage 2008-‐09 – Probably reflects HE but may be more widespread – Interes8ng to monitor in DITL 2010
• Clearly sufficient DNS now flows on tunnels that the RTT is ‘viable’ for some people – Can detect persistent use of Teredo, 6to4, 6rd
• Na8ve/Tunnel ra8os being studied in DNS, web – Same scripts/methodology
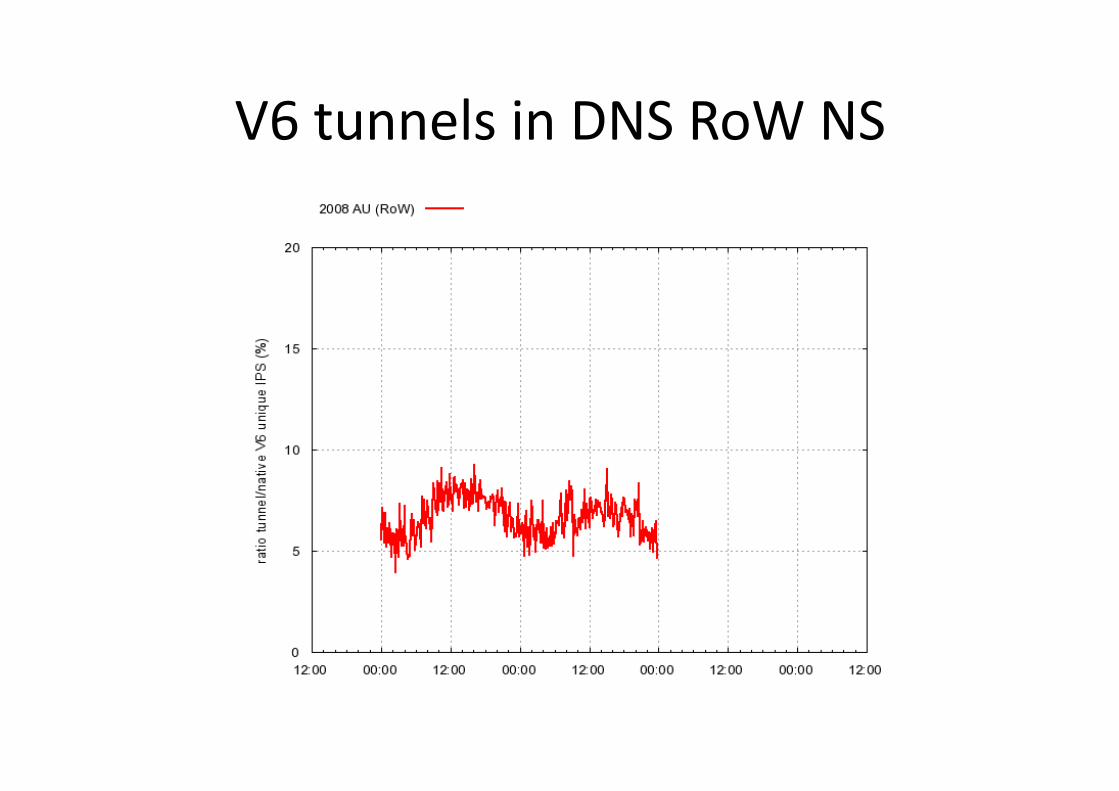
V6 tunnels in DNS RoW NS
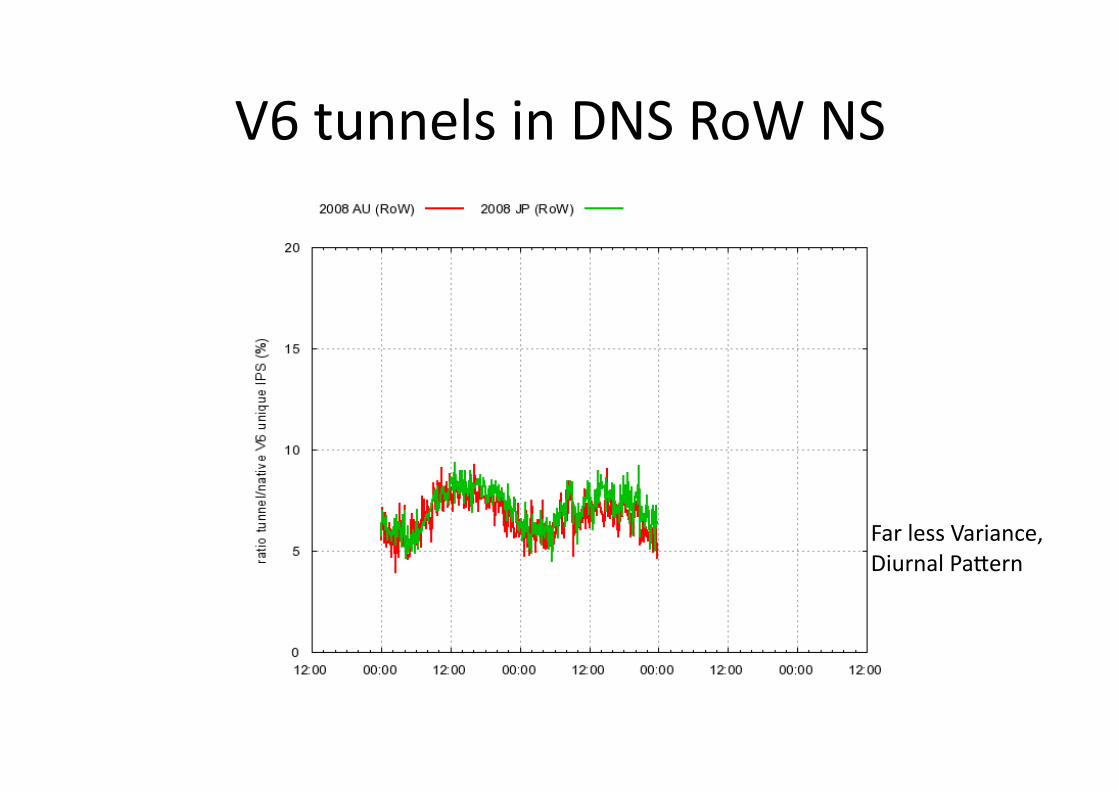
V6 tunnels in DNS RoW NS
Far less Variance, Diurnal Pahern
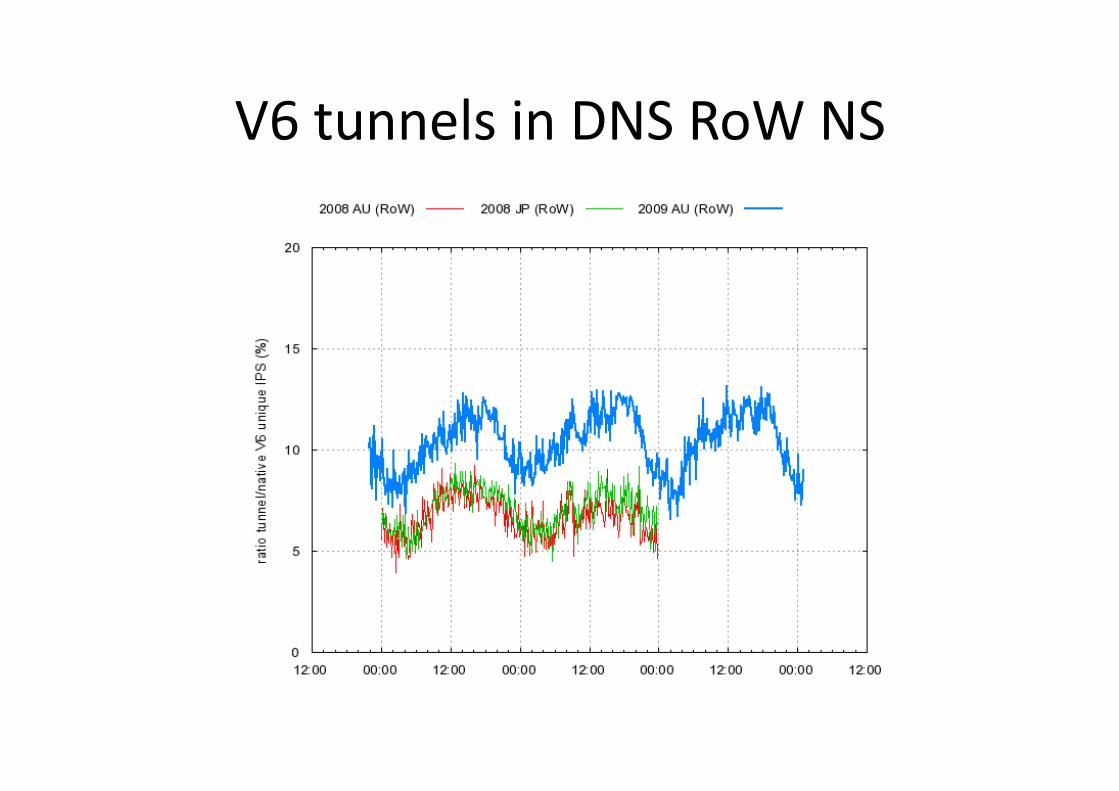
V6 tunnels in DNS RoW NS

V6 tunnels in DNS RoW NS
Marked upswing
Observa8ons
• Far ‘8ghter’ pahern of ra8o for two dis8nct loca8ons – Rest of World includes a lot of out-‐of-‐region query load • Therefore tunnel vs na8ve V6 RTT probably reduced impact: traffic equally awful (!)
– Would be interes8ng to compare with data from the RIPE/LacNIC/ARIN/AfriNIC regions
Inter-‐economy comparisons
• Take source, des8na8on (PTR) Ips • Map to economy using RIR ‘delegated’ files
• 2D matrix of {src,dst} pairs 250x250
• 3D (8me series) one 2D record per period
• What emerges?
• Animated plots of {from, to} by economy
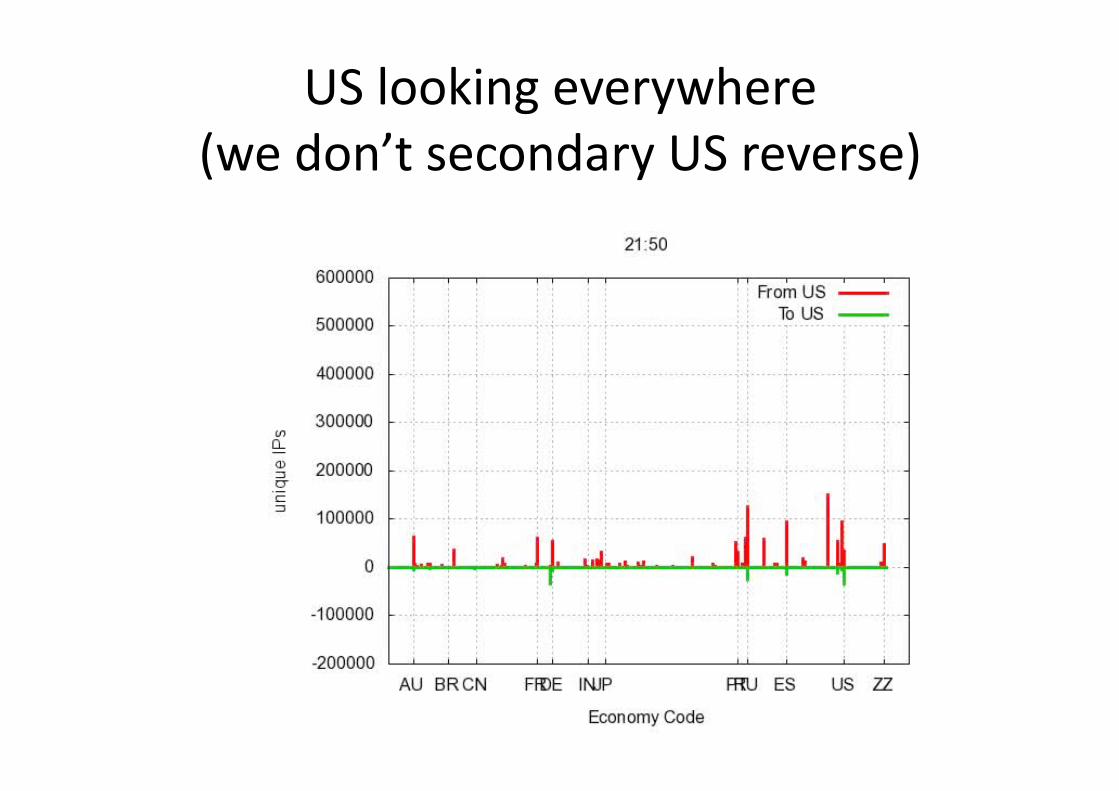
US looking everywhere (we don’t secondary US reverse)
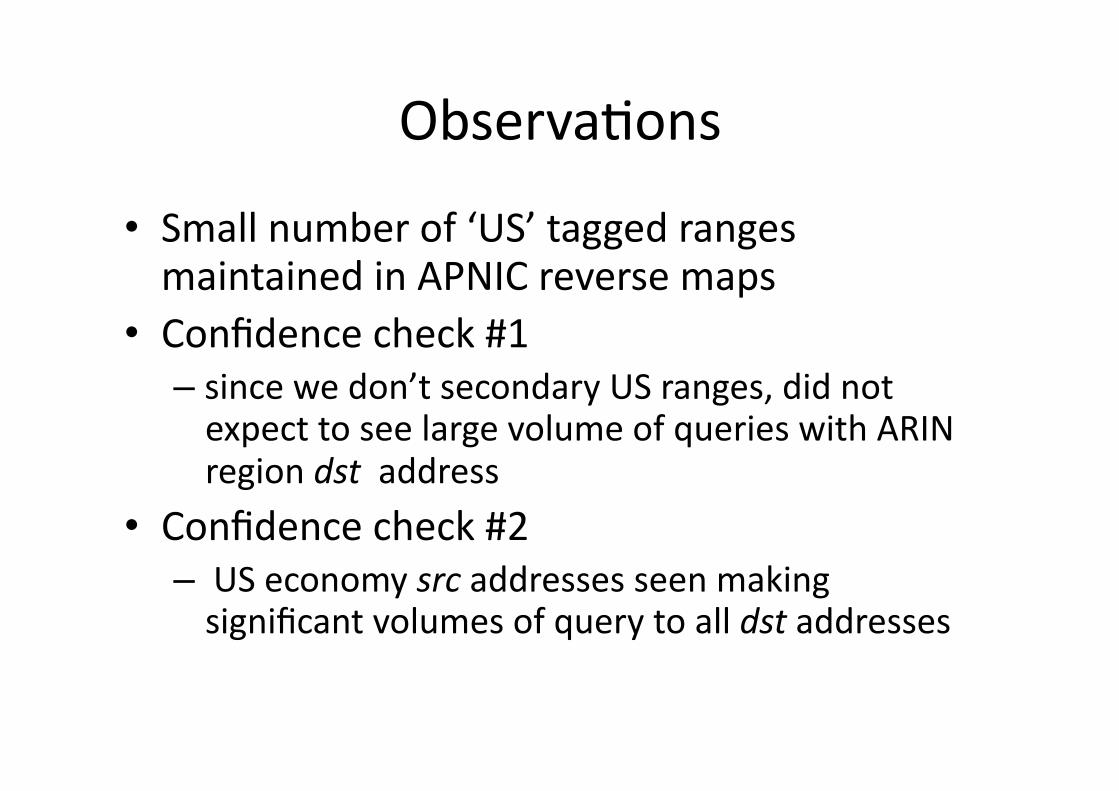
Observa8ons
• Small number of ‘US’ tagged ranges maintained in APNIC reverse maps
• Confidence check #1 – since we don’t secondary US ranges, did not expect to see large volume of queries with ARIN region dst address
• Confidence check #2 – US economy src addresses seen making significant volumes of query to all dst addresses

Japan looks at itself
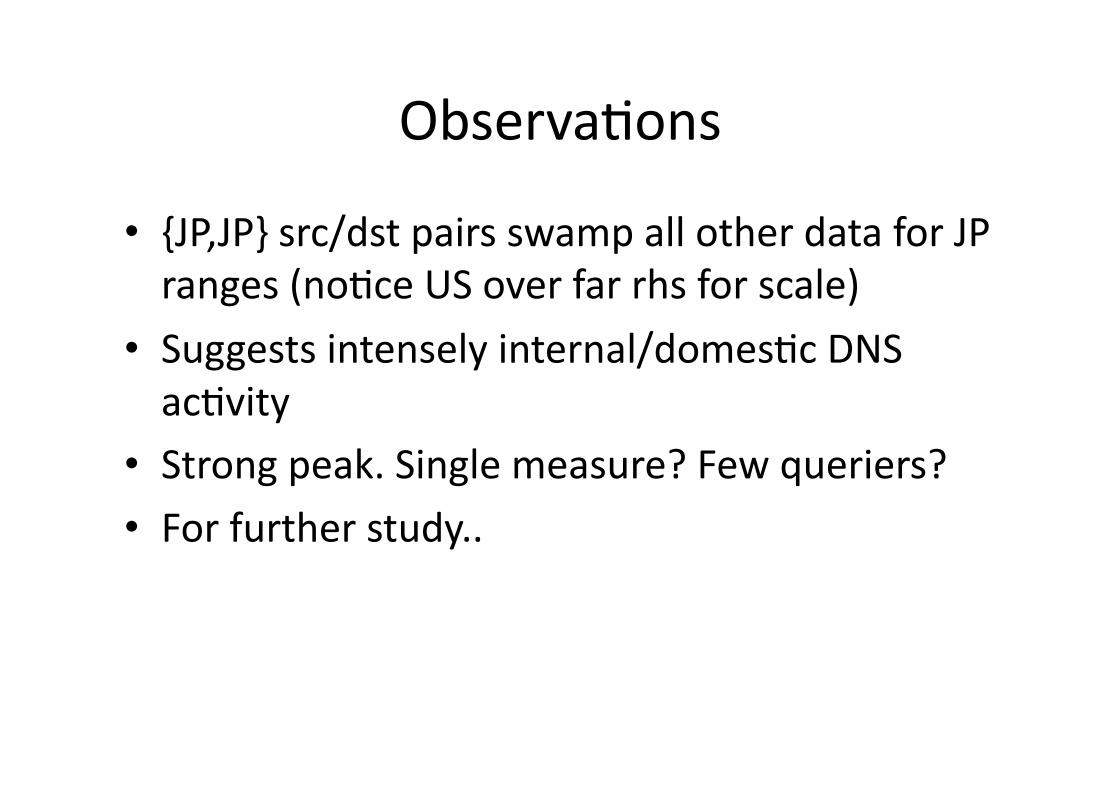
Observa8ons
• {JP,JP} src/dst pairs swamp all other data for JP ranges (no8ce US over far rhs for scale)
• Suggests intensely internal/domes8c DNS ac8vity
• Strong peak. Single measure? Few queriers?
• For further study..
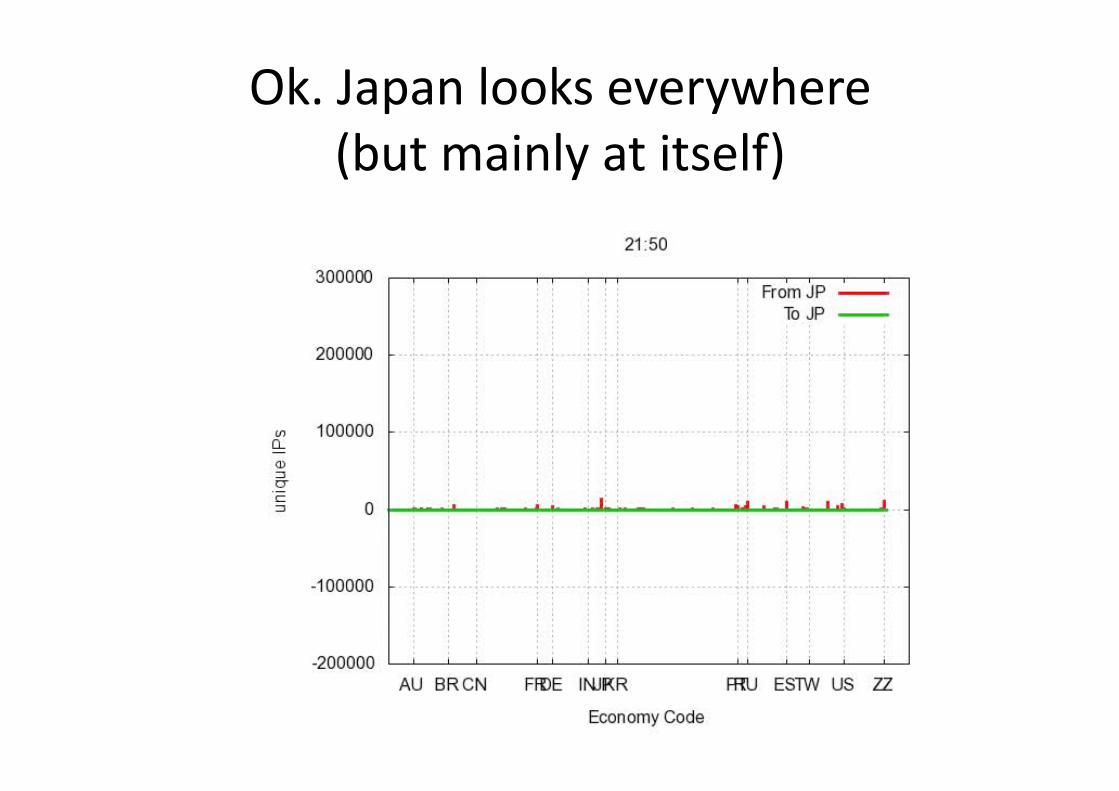
Ok. Japan looks everywhere (but mainly at itself)
Observa8ons
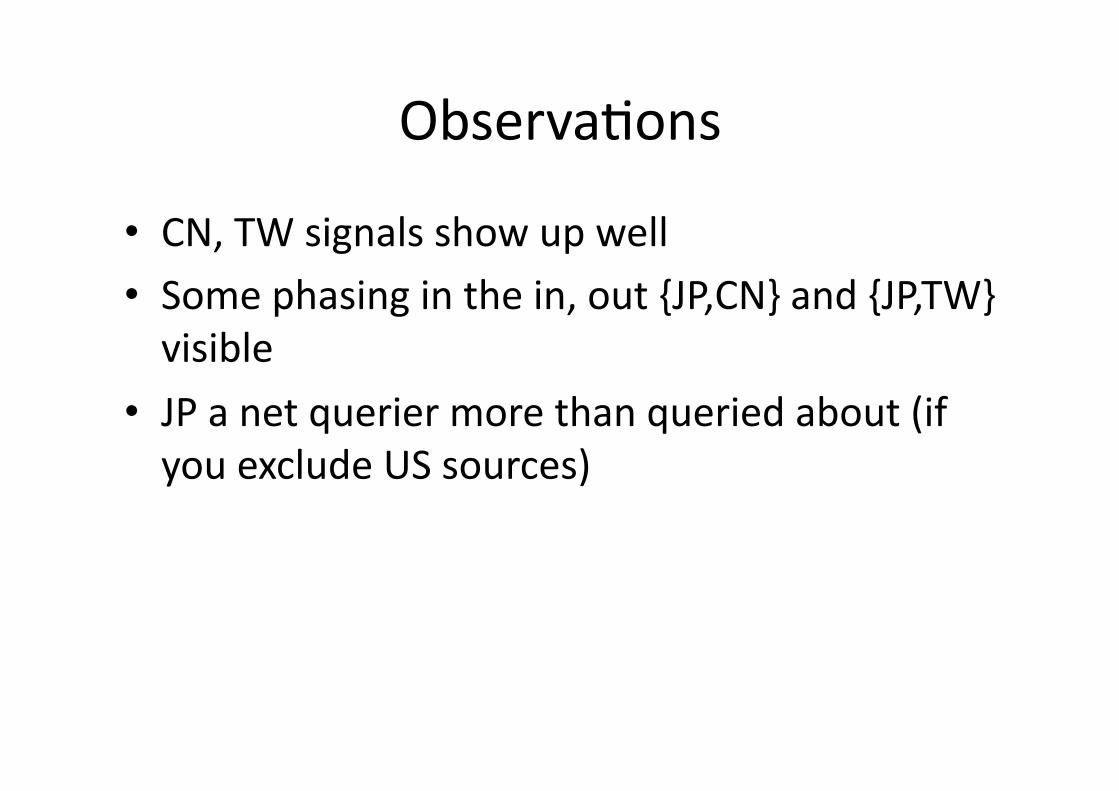
• CN, TW signals show up well • Some phasing in the in, out {JP,CN} and {JP,TW} visible
• JP a net querier more than queried about (if you exclude US sources)
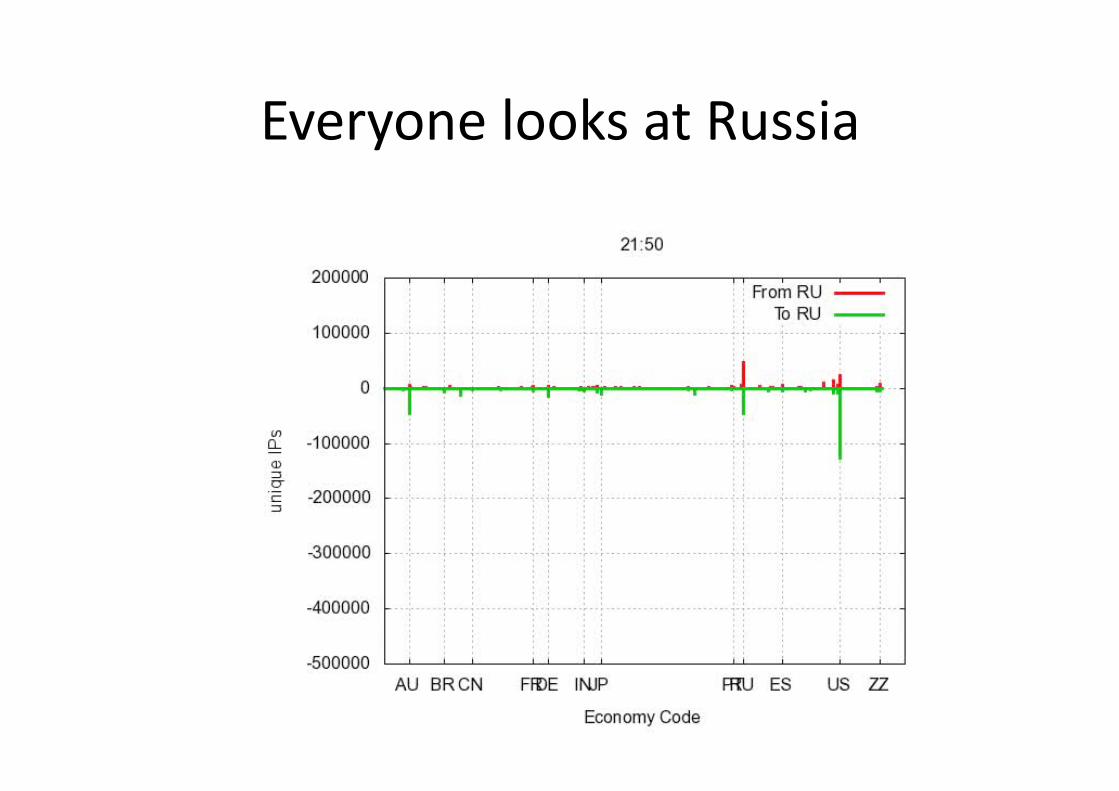
Everyone looks at Russia

China looks at Itself

Observa8ons
• Strong {CN,CN} signal • More inflows than ou{lows

Everyone looks at India
Observa8ons
• Very lihle DNS flows from src=IN • Not much interest in reverse-‐DNS in IN ISPs?
• Large inflows from range of economies
• (see Germany)
• Is this ‘outsource’ phenomena?
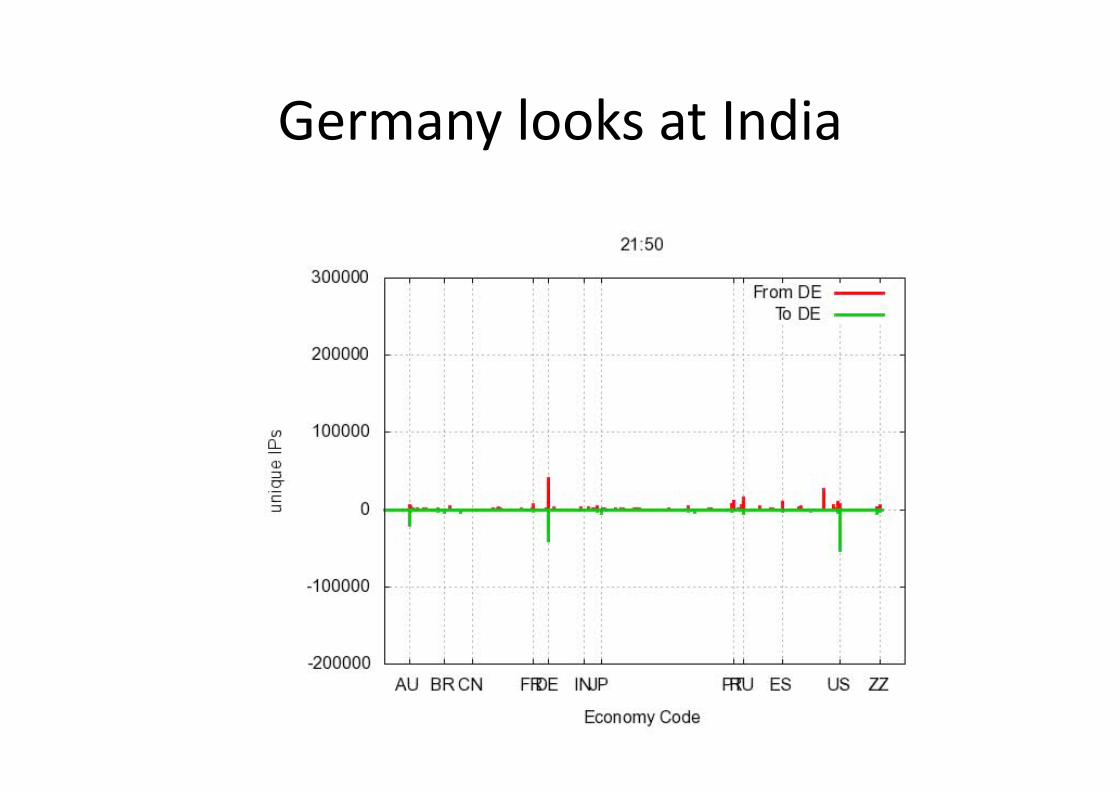
Germany looks at India
DITL 2010 goals
• Same methodology – Less mistakes (hopefully)
• Increased footprint of AP reverse NS – RIPE, ARIN may also be available (secondaries of AP in-‐addr/ip6 .arpa)
• DNSSEC deployment in reverse-‐DNS likely – Permits before/ager analysis
• Depending on 8meline, may have other NS – Changes in delega8on tree
What is DITL/APNIC telling us?
• Reverse-‐DNS has interes8ng dynamics • Reverse-‐DNS delega8on is reasonably concentrated – Small number of servers, covering large address ranges worldwide
• Therefore (arguably) reverse-‐DNS is an interes8ng viewpoint into worldwide trends in DNS – Evidence of emerging inter-‐economy differences, similari8es. Cuts across economic/developmental views
• If we can only correlate this into the real world!

Extra slides
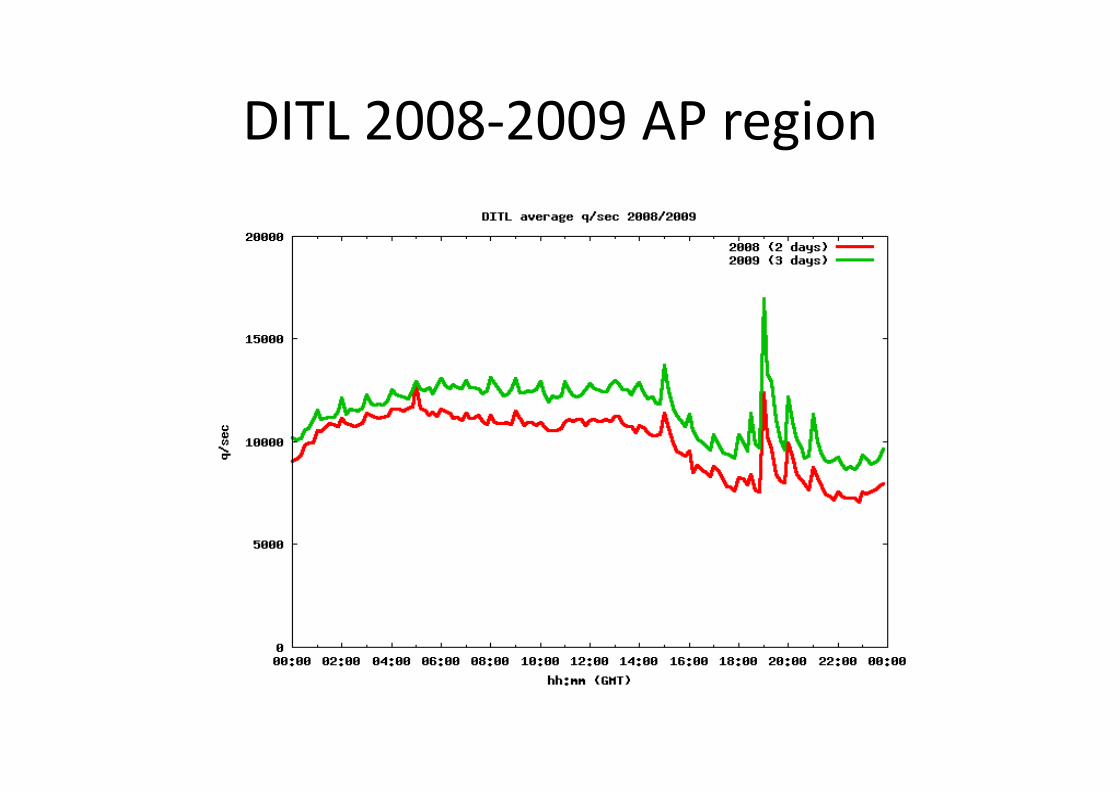
DITL 2008-‐2009 AP region
Observa8ons
• Regular 8me-‐synced peaks – Cron or other periodic processing
• That ‘mega’ spike is consistent behavior 2008-‐2009 – Whatever it is, its been happening for a long 8me

E. Asia in the World of DNS
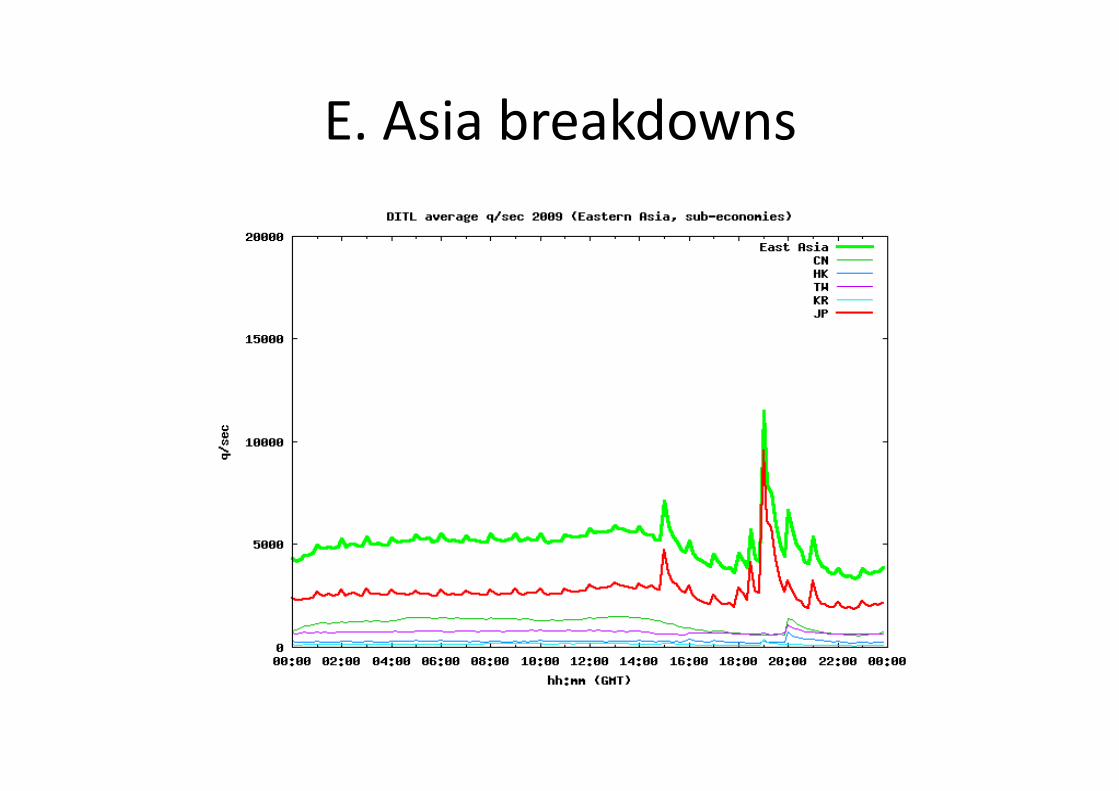
E. Asia breakdowns

Observa8ons
• Its Japan • But in the ‘decomposed’ view you can also see other Economies do their own peak-‐fetch cycle
• HK/KR
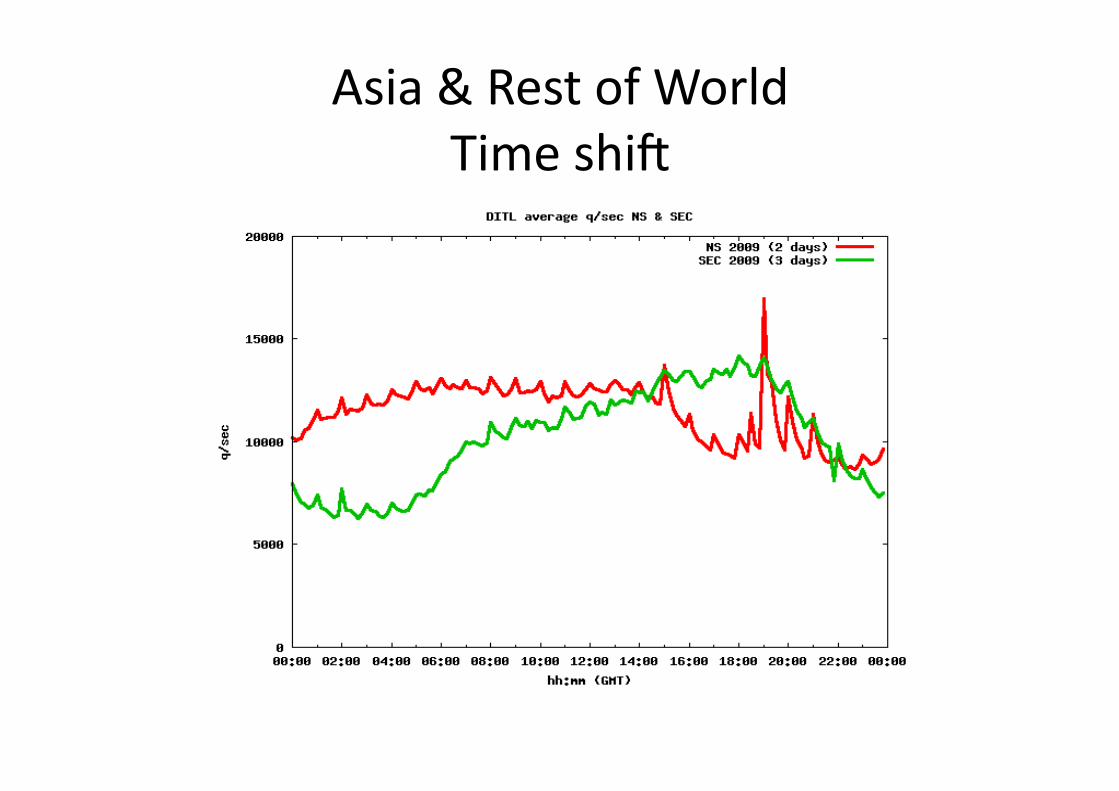
Asia & Rest of World Time shig
Observa8on
• Strong regional ‘message’ in the phasing • Time-‐sync peaks seem to line up nicely
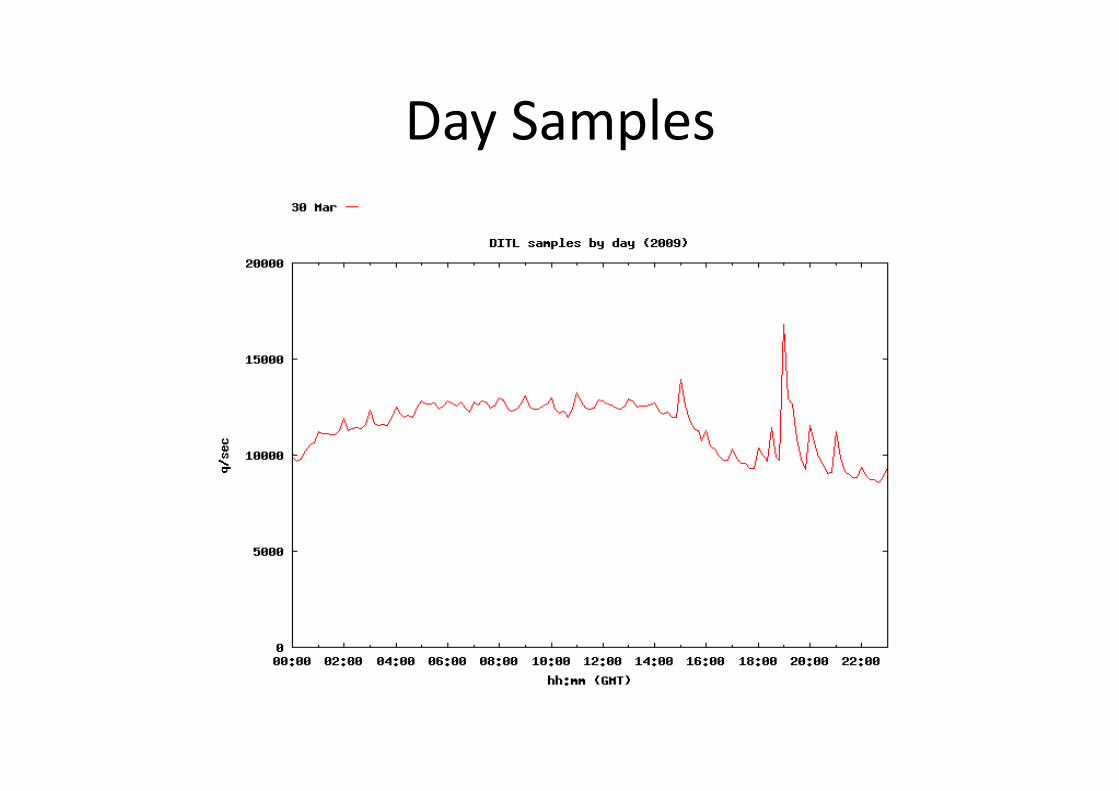
Day Samples
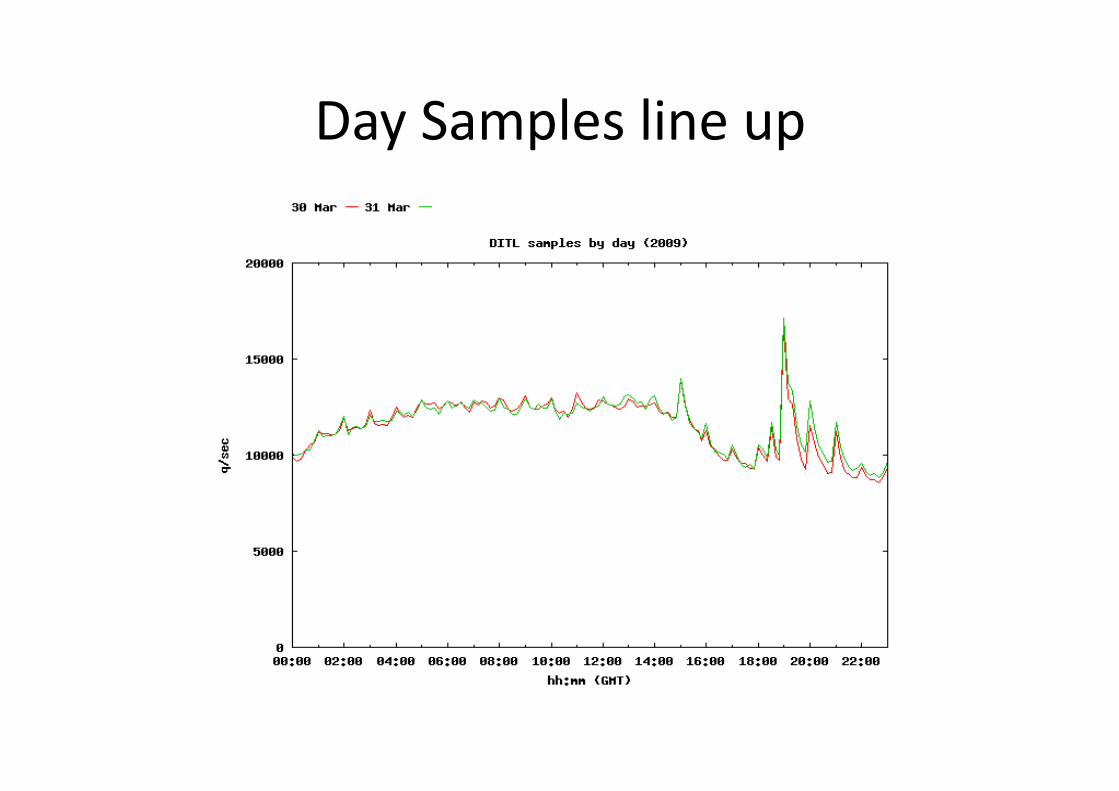
Day Samples line up
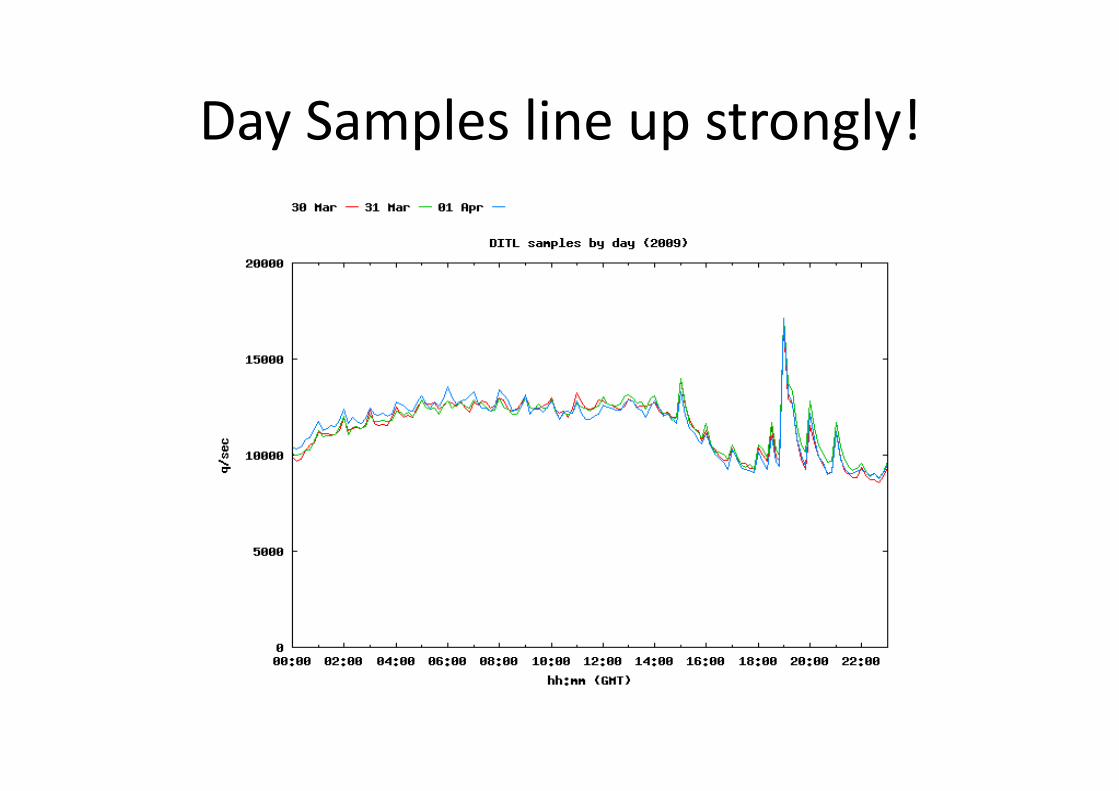
Day Samples line up strongly!
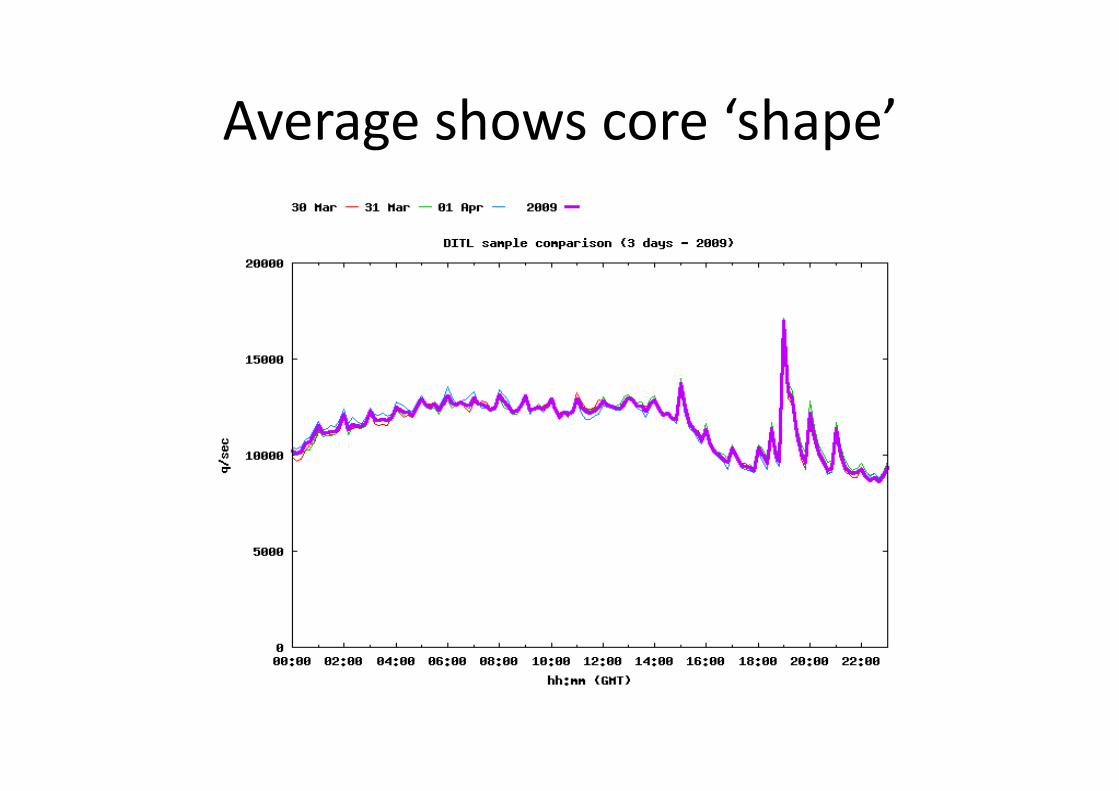
Average shows core ‘shape’
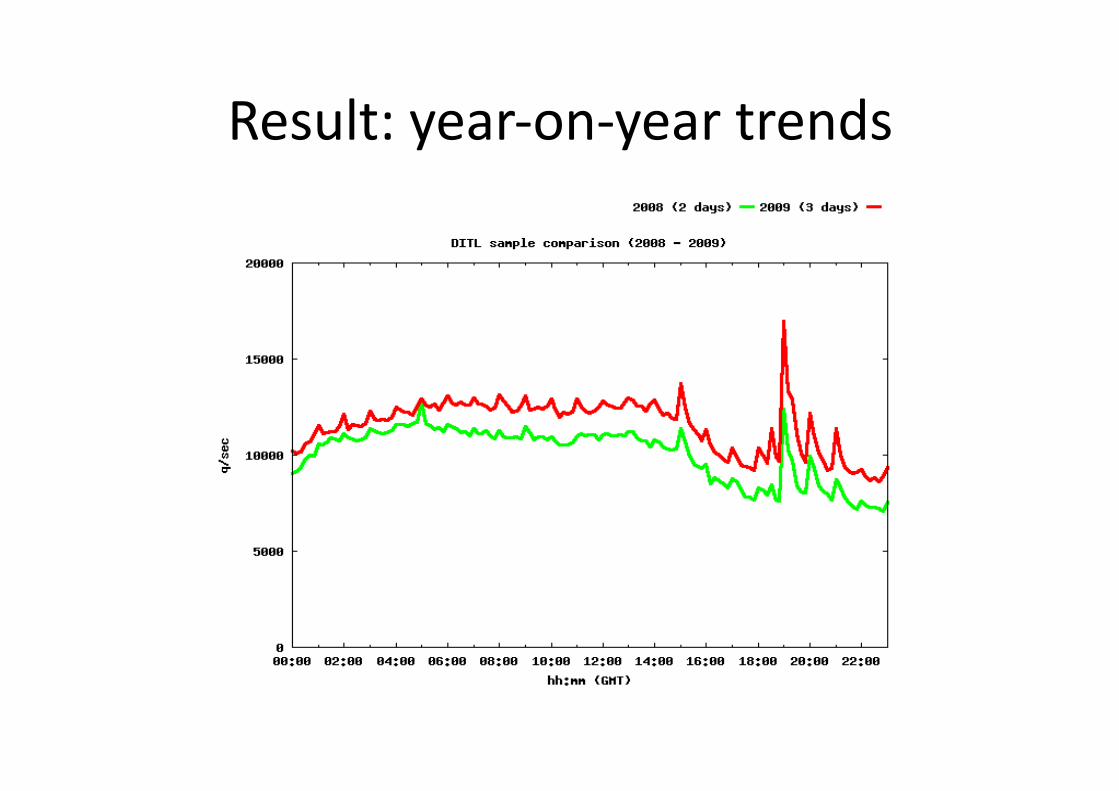
Result: year-‐on-‐year trends