Embed Size (px)
Citation preview

Final Report on Key Comparison
APMP.AUV.V-K3
Qiao SUN and Ian Veldman
2012-12-12
National Institute of Metrology, P. R. China and
National Metrology Institute of South Africa
Appendix D added and published on 3 April 2018

Table of Contents
TABLE OF CONTENTS ...................................................................................................................................................... I
1 INTRODUCTION.......................................................................................................................................................... 1
2 PARTICIPANTS ............................................................................................................................................................. 1
3 TASK AND PURPOS E OF THE COMPARISON ................................................................................................ 1
4 CONDITIONS AND INSTRUCTIONS OF MEAS UREMENT ....................................................................... 2
5 TRANSFER S TANDARDS AS ARTEFACTS........................................................................................................ 3
6 CIRCULATION OF THE ARTEFACTS ................................................................................................................. 3
7 RES ULTS OF THE MEAS UREMENTS ................................................................................................................. 4
7.1 MONITORING OF STABILITY .................................................................................................................................... 4
7.2 RESULTS OF THE PARTICIPANTS .............................................................................................................................. 6
7.2.1 Results of horizontal voltage sensitivities of the SE-1021 ............................................................................ 7
7.2.2 Results of vertical voltage sensitivities of the SE-1021 ................................................................................. 9
7.2.3 Results of horizontal voltage sensitivities of the SE-1022 ..........................................................................10
7.2.4 Results of vertical voltage sensitivities of the SE-1022 ...............................................................................12
7.3 KEY COMPARISON REFERENCE VALUE ............................................................................................................... 12
7.4 DEGREES OF EQUIVALENCE BETWEEN PARTICIPANTS ....................................................................................... 17
7.4.1 Tables of DoE between participants for horizontal voltage sensitivities of the SE-1021......................18
7.4.2 Tables of DoE between participants for vertical voltage sensitivities of the SE-1021...........................26
7.4.3 Tables of DoE between participants for horizontal voltage sensitivities of the SE-1022......................32
7.4.4 Tables of DoE between participants for vertical voltage sensitivities of the SE-1022...........................40
8 CONCLUS ION .............................................................................................................................................................45
9 BIBLIOGRAPHY ........................................................................................................................................................46
APPENDIX A: TECHNICAL PROTOCOL ...............................................................................................................47
APPENDIX B: UNCERTAINTY BUDGETS OF THE PARTICIPANTS ..........................................................53
APPENDIX C: DEGREES OF EQUIVALENCE RELATIVE TO THE KCRV ..............................................74
APPENDIX D: LINKING THE RES ULTS TO CCAUV.V-K3..............................................................................80

1/89
1 Introduction
This report presents the results of the first Asia Pacific Metrology Programme (APMP) comparison in the area of low-frequency ‘vibration’, which in this case means sinusoidal
acceleration. It is a revised version updated with the linking procedure to CCAUV.V-K3 as
in Appendix D.
The participants have reached consensus and considered the weighted mean as the most
appropriate method for this particular comparison to compute the key comparison reference
values (KCRVs) and the degrees of equivalence. Detailed analysis and application of the method for use in comparisons in the field of vibration, is documented in the CCAUV.V-K1
report [1]. The calculation of the KCRVs is also in accordance with the Guidelines for CIPM
key comparisons [2].
The Technical Protocol of December 2010 [3] specifies in detail the aim and the task of the
comparison, the conditions of measurement, the transfer standards used, measurement
instructions, time schedule and other items. A brief survey is given in the following sections.
2 Participants
Seven metrology institutes from APMP economies have participated in the comparison APMP.AUV.V-K3 (see table 1).
Table 1: List of participating institutes
Participant Economy Calibration period
NIM P. R. China August, 2011
NIMT Thailand September, 2011
CMS/ITRI Chinese Taipei September, 2011
NMIA Australia October, 2011
NMISA South Africa November, 2011
NMIJ Japan December, 2011
KRISS Korea April, 2012
3 Task and Purpose of the Comparison
Recent developments in technology and improvements at the NMIs have extended the
low-frequency vibration limit of calibration capabilities down to 0.5 Hz and even as low as

2/89
0.1 Hz. Therefore, during the meeting of APMP TCAUV in 2008, the decision was taken to
make preparations for a further comparison targeted at a low-frequency range.
In the field of vibration, this regional key comparison was organized in order to compare
measurements of sinusoidal linear accelerations in the frequency range from 0.5 Hz to 20 Hz.
Moreover, the magnitude of the complex sensitivity calibration and measurement capabilities (CMCs) of the participating laboratories for accelerometer calibration were to be
examined and compared. The phase shift was optional. It was the task of the comparison to
measure the magnitude of the complex sensitivity of two accelerometer standard sets (one set included a quartz- flexure servo accelerometer of single-ended type and a signal
conditioner) at different frequencies with acceleration amplitudes as specified in section 3 of
[3]. The results of this APMP comparison will, after approval by CCAUV, serve as empirical support for the registration of low-frequency vibration ‘calibration and
measurement capabilities’ (CMCs) in the framework of the CIPM MRA.
The voltage sensitivity is calculated as the ratio of the amplitude of the accelerometer standard set output voltage to the amplitude of the acceleration at its reference surface. The
magnitude of the complex voltage sensitivity was given in millivolts per meter per second
squared (mV/(m/s²)) for the different measurement conditions specified in section 4 of [3].
For the calibration of the accelerometer standard sets, laser interferometry in compliance
with method 1 or method 3 of the international standard ISO 16063-11:1999 [4] had to be
applied, in order to cover the entire frequency range.
The reported sensitivities and associated uncertainties of measurement were used for the
calculation of the key comparison reference value (KCRV).
4 Conditions and Instructions of Measurement
The participating laboratories observed to a large extent the conditions stated in the
Technical Protocol, i.e. • frequencies in Hz:
0.5, 0.63, 0.8, 1, 1.25, 1.6 (reference frequency), 2, 2.5, 3.15, 4, 5, 6.3, 8, 10, 12.5, 16,
20. • acceleration amplitudes:
A range of 0.1 m/s2 to 10 m/s2 was admissible.
• ambient temperature and accelerometer temperature during the calibration:

3/89
(23 ± 2) ºC (actual values to be stated within tolerances of ± 0.3 ºC).
• relative humidity: max. 75 % RH The comparison was performed in compliance with the “Guidelines for CIPM key
comparisons” [2].
5 Transfer Standards as Artefacts For the purpose of the comparison the pilot laboratory selected two accelerometers of
which monitoring data for 6 months were available and of which data were not included in any published international cooperation work. Their pictures are in Figure 1.
• One transfer standard accelerometer (single-ended), type SA704, S/N 1021
(manufacturer: NIM) referred to as SE-1021. • One transfer standard accelerometer (single-ended), type SA704, S/N 1022
(manufacturer: NIM) referred to as SE-1022 .
• One signal conditioner, type MSA-I, S/N 02011001 (manufacturer: NIM). The investigation of the long-term stability was continued throughout the circulation period.
The results of the NIM stability measurements and other individual data of the transfer
standards are given in Section 7.
Figure 1: Two transfer standard accelerometers
6 Circulation of the Artefacts
The transducer sets were circulated in a star type fashion with a measurement period of two
weeks provided for each participating laboratory and one week for the pilot laboratory. At the beginning and the end of the circulation as well as between certain subsequent
measurements of participating laboratories, the transducer sets were measured by the pilot
laboratory in order to determine reference values and to monitor the stability of the transducer sets (c.f. section 7). Due to the unexpected earthquake and tsunami which
occurred in March 2011, the circulation had to be modified to incorporate two loops. The

4/89
first loop was from NIM to NIMT, to CMS and back to NIM. The second loop was from
NIM to NMIA, to NMISA, to NMIJ, to KRISS and back to NIM.
The input range of SA-704 is 600 m/s2 and the highest environment shock 1000 m/s2.
Therefore, any violent drop could change its sensitivity or even damage it. The transducer
sets had to be hand-carried with great caution, shown in Figure 2.
Figure 2: Package of transfer standard set including two accelerometers and
one signal conditioner
7 Results of the Measurements 7.1 Monitoring of stability Starting with calibration data in February 2011, the artefacts were monitored during the preparatory period and the intervals of the comparison when they were back at the pilot
laboratory. As a representative of the overall change, the measurements at reference
frequency (1.6 Hz) are given in the following tables, with both the horizontal and vertical installation of artefacts.

5/89
Table 2: Horizontal voltage sensitivities of the SE-1021 at 1.6 Hz
during the monitoring measurements
Month rel. to 2/2011 Sva in mV/(m/s²) rel. exp. Uncertainty in %
0 124.09 0.2
2 124.11 0.2
4 124.12 0.2
6 124.11 0.2
8 124.09 0.2
16 124.07 0.2
Table 3: Vertical voltage sensitivities of the SE-1021 at 1.6 Hz
during the monitoring measurements
Month rel. to 2/2011 Sva in mV/(m/s²) rel. exp. Uncertainty in %
0 124.07 0.2
2 124.09 0.2
4 124.10 0.2
6 124.09 0.2
8 124.08 0.2
16 124.09 0.2
Table 4: Horizontal voltage sensitivities of the SE-1022 at 1.6 Hz
during the monitoring measurements
Month rel. to 2/2011 Sva in mV/(m/s²) rel. exp. Uncertainty in %
0 123.95 0.2
2 124.00 0.2
4 124.00 0.2
6 123.99 0.2
8 123.97 0.2
16 123.94 0.2

6/89
Table 5: Vertical voltage sensitivities of the SE-1022 at 1.6 Hz
during the monitoring measurements
Month rel. to 2/2011 Sva in mV/(m/s²) rel. exp. Uncertainty in %
0 123.94 0.2
2 123.98 0.2
4 123.98 0.2
6 123.97 0.2
8 123.96 0.2
16 123.95 0.2
These monitoring measurements can in the simplest way be summarized by the
following statistical properties. It indicates that the stability of the artefacts was good
considering the uncertainty claimed by the pilot laboratory in Appendix B. Table 6: Mean and standard deviation of the voltage sensitivity of the artefacts
calculated from the monitoring measurements
Artefact long term mean
in mV/(m/s²) rel. std. deviation
in %
SE-1021 (Horizontal) 124.098 0.01
SE-1021 (Vertical) 124.098 0.01
SE-1022 (Horizontal) 123.975 0.02
SE-1022 (Vertical) 123.963 0.01
7.2 Results of the Participants It should be noted that the measurement results from the pilot laboratory were sent to the CCAUV Secretary prior to the circulation of the artefacts. The results include voltage
sensitivities and phase shift of the two accelerometers in both horizontal and vertical
installation directions.

7/89
7.2.1 Results of horizontal voltage sensitivities of the SE-1021 Table 7: Reported calibration results in mV/(m/s²) of the participants for horizontal voltage
sensitivities of the SE-1021 with expanded relative uncertainty (k = 2) in %
NIM CMS NMIA
Frequency
(Hz)
Sva
(mV/ (m/s²))
Uc
(%)
Sva
(mV/ (m/s²))
Uc
(%)
Sva
(mV/ (m/s²))
Uc
(%)
0.50 124.33 0.2 124.7 2.7 124.08 0.2
0.63 124.26 0.2 125.0 2.7 124.07 0.2
0.80 124.22 0.2 124.9 2.4 124.05 0.2
1.00 124.14 0.2 125.3 2.3 124.04 0.2
1.25 124.12 0.2 125.0 2.3 124.03 0.2
1.60 124.11 0.2 125.3 2.3 124.02 0.2
2.00 124.13 0.2 124.7 2.3 124.02 0.2
2.50 124.12 0.2 124.4 2.2 124.01 0.2
3.15 124.12 0.2 124.4 0.5 124.01 0.2
4.00 124.13 0.2 124.8 0.5 124.01 0.2
5.00 124.14 0.2 124.4 0.5 124.01 0.2
6.30 124.14 0.2 124.6 0.5 124.02 0.2
8.00 124.16 0.2 124.6 0.5 124.03 0.2
10.00 124.23 0.2 124.3 0.5 124.06 0.2
12.50 124.25 0.2 124.8 0.4 124.11 0.2
16.00 124.35 0.2 125.0 0.5 124.20 0.2
20.00 124.50 0.2 124.9 0.5 124.33 0.2

8/89
Table 8: Reported calibration results in mV/(m/s²) of the participants for horizontal voltage
sensitivities of the SE-1021 with expanded relative uncertainty (k = 2) in %
NMISA NMIJ KRISS
Frequency
(Hz)
Sva
(mV/
(m/s²))
Uc (%)
Sva
(mV/
(m/s²))
Uc (%)
Sva
(mV/
(m/s²))
Uc (%)
0.50 123.9 0.3 124.81 2.0 124.27 0.5
0.63 123.9 0.3 123.93 0.8 124.23 0.5
0.80 123.9 0.3 123.85 0.8 124.13 0.3
1.00 124.0 0.3 123.91 0.9 124.13 0.5
1.25 124.0 0.3 123.76 0.7 124.06 0.3
1.60 124.0 0.3 123.79 0.5 124.07 0.4
2.00 124.0 0.3 123.88 0.7 124.16 0.3
2.50 124.0 0.3 - - 124.12 0.3
3.15 123.9 0.3 - - 124.03 0.3
4.00 124.0 0.3 - - 124.01 0.3
5.00 124.0 0.3 - - 124.05 0.3
6.30 124.0 0.3 - - 123.97 0.3
8.00 124.0 0.3 - - 123.98 0.4
10.00 124.1 0.3 - - 124.01 0.4
12.50 124.1 0.3 - - 124.05 0.4
16.00 124.1 0.3 - - 124.20 0.3
20.00 124.3 0.3 - - 124.27 0.3

9/89
7.2.2 Results of vertical voltage sensitivities of the SE-1021 Table 9: Reported calibration results in mV/(m/s²) of the participants for vertical voltage
sensitivities of the SE-1021 with expanded relative uncertainty (k = 2) in %
NIM NIMT NMIJ
Frequency
(Hz)
Sva
(mV/ (m/s²))
Uc
(%)
Sva
(mV/ (m/s²))
Uc
(%)
Sva
(mV/ (m/s²))
Uc
(%)
0.50 124.17 0.2 124.06 0.6 - -
0.63 124.16 0.2 124.06 0.6 - -
0.80 124.15 0.2 124.06 0.6 - -
1.00 124.10 0.2 124.06 0.5 - -
1.25 124.09 0.2 124.06 0.5 - -
1.60 124.09 0.2 124.06 0.5 - -
2.00 124.10 0.2 124.06 0.5 - -
2.50 124.11 0.2 124.06 0.5 123.86 0.3
3.15 124.11 0.2 124.06 0.5 123.91 0.3
4.00 124.11 0.2 124.07 0.5 123.94 0.3
5.00 124.12 0.2 124.10 0.4 123.95 0.3
6.30 124.11 0.2 124.10 0.4 123.98 0.3
8.00 124.14 0.2 124.12 0.4 124.01 0.3
10.00 124.16 0.2 124.15 0.4 124.05 0.3
12.50 124.20 0.2 124.20 0.4 124.11 0.3
16.00 124.30 0.2 124.28 0.4 124.20 0.3
20.00 124.42 0.2 124.41 0.4 124.34 0.3

10/89
7.2.3 Results of horizontal voltage sensitivities of the SE-1022 Table 10: Reported calibration results in mV/(m/s²) of the participants for horizontal voltage
sensitivities of the SE-1022 with expanded relative uncertainty (k = 2) in %
NIM CMS NMIA
Frequency
(Hz)
Sva
(mV/ (m/s²))
Uc
(%)
Sva
(mV/ (m/s²))
Uc
(%)
Sva
(mV/ (m/s²))
Uc
(%)
0.50 124.20 0.2 124.9 2.6 123.94 0.2
0.63 124.13 0.2 124.9 2.7 123.93 0.2
0.80 124.09 0.2 124.8 2.5 123.91 0.2
1.00 124.01 0.2 125.1 2.3 123.90 0.2
1.25 123.97 0.2 124.8 2.3 123.89 0.2
1.60 123.99 0.2 125.0 2.3 123.88 0.2
2.00 123.99 0.2 124.7 2.3 123.88 0.2
2.50 123.99 0.2 124.3 2.2 123.87 0.2
3.15 124.00 0.2 124.9 0.6 123.87 0.2
4.00 124.00 0.2 124.7 0.6 123.87 0.2
5.00 124.01 0.2 124.1 0.5 123.87 0.2
6.30 124.01 0.2 124.1 0.5 123.87 0.2
8.00 124.04 0.2 124.2 0.5 123.89 0.2
10.00 124.11 0.2 124.6 0.5 123.92 0.2
12.50 124.11 0.2 124.4 0.5 123.96 0.2
16.00 124.20 0.2 124.8 0.5 124.05 0.2
20.00 124.34 0.2 124.6 0.5 124.16 0.2

11/89
Table 11: Reported calibration results in mV/(m/s²) of the participants for horizontal voltage
sensitivities of the SE-1022 with expanded relative uncertainty (k = 2) in %
NMISA NMIJ KRISS
Frequency
(Hz)
Sva
(mV/
(m/s²))
Uc (%)
Sva
(mV/
(m/s²))
Uc (%)
Sva
(mV/
(m/s²))
Uc (%)
0.50 123.8 0.3 124.02 2.0 124.12 0.5
0.63 123.8 0.3 123.63 0.7 124.01 0.5
0.80 123.8 0.3 123.81 0.8 123.97 0.3
1.00 123.8 0.3 123.73 1.0 123.94 0.4
1.25 123.8 0.3 123.67 0.7 123.90 0.4
1.60 123.8 0.3 123.68 0.4 123.92 0.4
2.00 123.8 0.3 123.56 0.7 124.01 0.3
2.50 123.8 0.3 - - 123.99 0.3
3.15 123.9 0.3 - - 123.90 0.3
4.00 123.8 0.3 - - 123.86 0.3
5.00 123.9 0.3 - - 123.83 0.3
6.30 123.9 0.3 - - 123.80 0.3
8.00 123.9 0.3 - - 123.82 0.4
10.00 123.9 0.3 - - 123.86 0.4
12.50 123.9 0.3 - - 123.89 0.4
16.00 124.0 0.3 - - 124.03 0.4
20.00 124.1 0.3 - - 124.09 0.4

12/89
7.2.4 Results of vertical voltage sensitivities of the SE-1022 Table 12: Reported calibration results in mV/(m/s²) of the participants for vertical voltage
sensitivities of the SE-1022 with expanded relative uncertainty (k = 2) in %
NIM NIMT NMIJ
Frequency
(Hz)
Sva
(mV/ (m/s²))
Uc
(%)
Sva
(mV/ (m/s²))
Uc
(%)
Sva
(mV/ (m/s²))
Uc
(%)
0.50 124.02 0.2 123.92 0.6 - -
0.63 124.04 0.2 123.92 0.6 - -
0.80 124.04 0.2 123.92 0.6 - -
1.00 123.98 0.2 123.92 0.5 - -
1.25 123.97 0.2 123.93 0.5 - -
1.60 123.97 0.2 123.93 0.5 - -
2.00 123.98 0.2 123.93 0.5 - -
2.50 123.98 0.2 123.93 0.5 123.71 0.3
3.15 123.98 0.2 123.93 0.5 123.77 0.3
4.00 123.99 0.2 123.94 0.5 123.80 0.3
5.00 123.99 0.2 123.96 0.4 123.82 0.3
6.30 123.99 0.2 123.97 0.4 123.85 0.3
8.00 124.00 0.2 123.98 0.4 123.88 0.3
10.00 124.02 0.2 124.01 0.4 123.91 0.3
12.50 124.07 0.2 124.05 0.4 123.97 0.3
16.00 124.13 0.2 124.13 0.4 124.05 0.3
20.00 124.24 0.2 124.25 0.4 124.17 0.3
7.3 Key Comparison Reference Value The weighted mean was agreed upon by all laboratories to calculate the KCRVs for the
APMP.AUV.V-K3 data. KCRVs were calculated separately at each frequency point measured (17 points in total) for both accelerometers in the horizontal direction and the
vertical direction.
Calculation of KCRVs using the weighted mean method
Tables 7 to 12 contain the data for the accelerometers reported by the participating
laboratories. For each laboratory i these data are (1) xi,f : best estimate of sensitivity at

13/89
frequency f, and (2) ( ),i fu x : associated standard uncertainty of sensitivity reported at
frequency f. For the transfer standards and at each frequency f, a key comparison reference value WMx
has been determined as the weighted mean of the results of n laboratories (for this comparison, n = 7) according to
∑
∑
=
== n
i fi
n
i fi
fi
xu
xux
x
1 ,2
1 ,2
,
WM
)(1
)( (1)
∑=
= n
i fixu
xu
1 ,2
WM2
)(1
1)( (2)
These calculated KCRVs are reported in Table 13. The degree of equivalence, WMlab−D , and WMlab−U , was determined for the magnitude
measurements for the accelerometer using
WMlabWMlab XXD −=− , 2
WM2
labWMlab uukU −⋅=− (3)
where labX represents the measurement results obtained by the laboratory at each
frequency point for the magnitude and WMX represents the reference value (KCRV) calculated as the weighted mean using Eq. (1). WMlab−U is the uncertainty of measurement
associated with the calculated WMlab−D for k = 2. The calculated degrees of equivalence are
completely reported in Appendix C and partly shown in Figures 3 to 10 for SE-1021 and SE-1022 in both horizontal and vertical installation at 0.5 Hz, 1.6 Hz, 10 Hz and 16 Hz.
Application of the weighted mean is justified when the data including the stated uncertainties
are consistent with one another. To check this, the following criterion of chi-squared test has been applied:
)1(2)1()(/)(min1
,22
, −+−≤−∑=
nknxuxn
ififi ζζ (4)
where n denotes the number of laboratories concerned, cf., e.g., [1] and k = 3. All the
measurement results passed the consistency test.

14/89
Table 13: Reference values and associated expanded uncertainty (k = 2) in mV/(m/s²)
for SE-1021 and SE-1022 in horizontal and vertical directions
1021H 1021V 1022H 1022V
Frequency
(Hz)
XWM UWM XWM UWM XWM UWM XWM UWM
in mV/(m/s2) 2 in mV/(m/s2) in mV/(m/s2) in mV/(m/s2) 0.50 124.17 0.15 124.16 0.24 124.03 0.15 124.01 0.24
0.63 124.12 0.15 124.15 0.24 123.97 0.15 124.03 0.24
0.80 124.10 0.14 124.14 0.24 123.96 0.14 124.03 0.24
1.00 124.07 0.15 124.09 0.23 123.94 0.15 123.97 0.23
1.25 124.05 0.14 124.09 0.23 123.91 0.15 123.96 0.23
1.60 124.04 0.15 124.09 0.23 123.90 0.14 123.96 0.23
2.00 124.07 0.14 124.09 0.23 123.92 0.14 123.97 0.23
2.50 124.06 0.15 124.04 0.20 123.92 0.15 123.90 0.20
3.15 124.06 0.14 124.05 0.20 123.95 0.14 123.92 0.20
4.00 124.08 0.14 124.06 0.20 123.94 0.14 123.93 0.20
5.00 124.07 0.14 124.07 0.19 123.92 0.14 123.94 0.19
6.30 124.08 0.14 124.07 0.19 123.92 0.14 123.95 0.19
8.00 124.10 0.15 124.10 0.19 123.96 0.15 123.96 0.19
10.00 124.13 0.15 124.13 0.19 124.02 0.15 123.99 0.19
12.50 124.21 0.14 124.17 0.19 124.03 0.15 124.04 0.19
16.00 124.28 0.14 124.27 0.19 124.13 0.15 124.11 0.19
20.00 124.41 0.14 124.40 0.19 124.23 0.15 124.22 0.19
Figure 3: Degree of equivalence for horizontal voltage sensitivities of the SE-1021
at 0.5 Hz and 1.6 Hz with error bars representing the expanded uncertainty (k = 2)

15/89
Figure 4: Degree of equivalence for horizontal voltage sensitivities of the SE-1021
at 10 Hz and 16 Hz with error bars representing the expanded uncertainty (k = 2)
Figure 5: Degree of equivalence for vertical voltage sensitivities of the SE-1021
at 0.5 Hz and 1.6 Hz with error bars representing the expanded uncertainty (k = 2)
Figure 6: Degree of equivalence for vertical voltage sensitivities of the SE-1021
at 10 Hz and 16 Hz with error bars representing the expanded uncertainty (k = 2)

16/89
Figure 7: Degree of equivalence for horizontal voltage sensitivities of the SE-1022
at 0.5 Hz and 1.6 Hz with error bars representing the expanded uncertainty (k = 2)
Figure 8: Degree of equivalence for horizontal voltage sensitivities of the SE-1022
at 10 Hz and 16 Hz with error bars representing the expanded uncertainty (k = 2)
Figure 9: Degree of equivalence for vertical voltage sensitivities of the SE-1022
at 0.5 Hz and 1.6 Hz with error bars representing the expanded uncertainty (k = 2)

17/89
Figure 10: Degree of equivalence for vertical voltage sensitivities of the SE-1022
at 10 Hz and 16 Hz with error bars representing the expanded uncertainty (k = 2)
7.4 Degrees of Equivalence between participants In order to compare the individual results of the participating laboratories of this
comparison with one another, the Degree of Equivalence (DoE) of pairs of results with respect to a certain frequency were calculated. These DoEs are each a pair of values of the difference ijD between the respective participants i and j and the combined expanded
uncertainty ijU of this difference. These values are calculated for each frequency
according to:
jiij xxD −= (5)
)()( 22jiij xuxukU +⋅= (6)
with a coverage factor of k = 2.

18/89
7.4.1 Tables of DoE between participants for horizontal voltage sensitivities of the
SE-1021 Table 14: Degrees of equivalence between the participants for horizontal voltage sensitivities of the
SE-1021 at 0.5 Hz
0.50 Hz NIM CMS NMIA NMISA NMIJ KRISS
i→ Dij Uij Dij Uij Dij Uij Dij Uij Dij Uij Dij Uij
j↓ (mV/(m/s2)•10-2) (mV/(m/s2)•10-2) (mV/(m/s2)•10-2) (mV/(m/s2)•10-2) (mV/(m/s2)•10-2) (mV/(m/s2)•10-2)
NIM - - 37.0 336.9 -25.0 27.6 -43.0 39.1 48.0 249.9 -6.0 63.3
CMS -37.0 336.9 - - -62.0 336.9 -80.0 338.0 11.0 418.6 -43.0 341.7
NMIA 25.0 27.6 62.0 336.9 - - -18.0 39.1 73.0 249.9 19.0 63.3
NMISA 43.0 39.1 80.0 338.0 18.0 39.1 - - 91.0 251.4 37.0 69.1
NMIJ -48.0 249.9 -11.0 418.6 -73.0 249.9 -91.0 251.4 - - -54.0 256.3
KRISS 6.0 63.3 43.0 341.7 -19.0 63.3 -37.0 69.1 54.0 256.3 - -
Table 15: Degrees of equivalence between the participants for horizontal voltage sensitivities of the
SE-1021 at 0.63 Hz
0.63 Hz NIM CMS NMIA NMISA NMIJ KRISS
i→ Dij Uij Dij Uij Dij Uij Dij Uij Dij Uij Dij Uij
j↓ (mV/(m/s2)•10-2) (mV/(m/s2)•10-2) (mV/(m/s2)•10-2) (mV/(m/s2)•10-2) (mV/(m/s2)•10-2) (mV/(m/s2)•10-2)
NIM - - 74.0 337.7 -19.0 27.8 -36.0 39.2 -33.0 99.9 -3.0 63.4
CMS -74.0 337.7 - - -93.0 337.7 -110.0 338.9 -107.0 351.1 -77.0 342.5
NMIA 19.0 27.8 93.0 337.7 - - -17.0 39.2 -14.0 99.9 16.0 63.3
NMISA 36.0 39.2 110.0 338.9 17.0 39.2 - - 3.0 103.7 33.0 69.1
NMIJ 33.0 99.9 107.0 351.1 14.0 99.9 -3.0 103.7 - - 30.0 115.0
KRISS 3.0 63.4 77.0 342.5 -16.0 63.3 -33.0 69.1 -30.0 115.0 - -

19/89
Table 16 Degrees of equivalence between the participants for horizontal voltage sensitivities of the
SE-1021 at 0.8 Hz
0.8 Hz NIM CMS NMIA NMISA NMIJ KRISS
i→ Dij Uij Dij Uij Dij Uij Dij Uij Dij Uij Dij Uij
j↓ (mV/(m/s2)•10-2) (mV/(m/s2)•10-2) (mV/(m/s2)•10-2) (mV/(m/s2)•10-2) (mV/(m/s2)•10-2) (mV/(m/s2)•10-2)
NIM - - 68.0 300.1 -17.0 28.6 -32.0 39.8 -37.0 100.1 -9.0 39.8
CMS -68.0 300.1 - - -85.0 300.1 -100.0 301.4 -105.0 315.0 -77.0 301.4
NMIA 17.0 28.6 85.0 300.1 - - -15.0 39.8 -20.0 100.1 8.0 39.8
NMISA 32.0 39.8 100.0 301.4 15.0 39.8 - - -5.0 103.8 23.0 48.5
NMIJ 37.0 100.1 105.0 315.0 20.0 100.1 5.0 103.8 - - 28.0 103.9
KRISS 9.0 39.8 77.0 301.4 -8.0 39.8 -23.0 48.5 -28.0 103.9 - -
Table 17: Degrees of equivalence between the participants for horizontal voltage sensitivities of the
SE-1021 at 1 Hz
1.0 Hz NIM CMS NMIA NMISA NMIJ KRISS
i→ Dij Uij Dij Uij Dij Uij Dij Uij Dij Uij Dij Uij
j↓ (mV/(m/s2)•10-2) (mV/(m/s2)•10-2) (mV/(m/s2)•10-2) (mV/(m/s2)•10-2) (mV/(m/s2)•10-2) (mV/(m/s2)•10-2)
NIM - - 116.0 288.5 -10.0 27.7 -14.0 39.2 -23.0 112.2 -1.0 63.3
CMS -116.0 288.5 - - -126.0 288.5 -130.0 289.8 -139.0 308.3 -117.0 294.0
NMIA 10.0 27.7 126.0 288.5 - - -4.0 39.2 -13.0 112.2 9.0 63.3
NMISA 14.0 39.2 130.0 289.8 4.0 39.2 - - -9.0 115.6 13.0 69.1
NMIJ 23.0 112.2 139.0 308.3 13.0 112.2 9.0 115.6 - - 22.0 125.8
KRISS 1.0 63.3 117.0 294.0 -9.0 63.3 -13.0 69.1 -22.0 125.8 - -

20/89
Table 18: Degrees of equivalence between the participants for horizontal voltage sensitivities of the
SE-1021 at 1.25 Hz
1.25 Hz NIM CMS NMIA NMISA NMIJ KRISS
i→ Dij Uij Dij Uij Dij Uij Dij Uij Dij Uij Dij Uij
j↓ (mV/(m/s2)•10-2) (mV/(m/s2)•10-2) (mV/(m/s2)•10-2) (mV/(m/s2)•10-2) (mV/(m/s2)•10-2) (mV/(m/s2)•10-2)
NIM - - 88.0 287.9 -9.0 28.6 -12.0 39.8 -36.0 87.8 -6.0 39.9
CMS -88.0 287.9 - - -97.0 287.9 -100.0 289.2 -124.0 299.6 -94.0 289.2
NMIA 9.0 28.6 97.0 287.9 - - -3.0 39.8 -27.0 87.8 3.0 39.8
NMISA 12.0 39.8 100.0 289.2 3.0 39.8 - - -24.0 92.1 6.0 48.5
NMIJ 36.0 87.8 124.0 299.6 27.0 87.8 24.0 92.1 - - 30.0 92.1
KRISS 6.0 39.9 94.0 289.2 -3.0 39.8 -6.0 48.5 -30.0 92.1 - -
Table 19: Degrees of equivalence between the participants for horizontal voltage sensitivities of the
SE-1021 at 1.6 Hz
1.6 Hz NIM CMS NMIA NMISA NMIJ KRISS
i→ Dij Uij Dij Uij Dij Uij Dij Uij Dij Uij Dij Uij
j↓ (mV/(m/s2)•10-2) (mV/(m/s2)•10-2) (mV/(m/s2)•10-2) (mV/(m/s2)•10-2) (mV/(m/s2)•10-2) (mV/(m/s2)•10-2)
NIM - - 119.0 288.5 -9.0 28.3 -11.0 39.6 -32.0 63.4 -4.0 51.5
CMS -119.0 288.5 - - -128.0 288.5 -130.0 289.8 -151.0 294.0 -123.0 291.7
NMIA 9.0 28.3 128.0 288.5 - - -2.0 39.6 -23.0 63.4 5.0 51.5
NMISA 11.0 39.6 130.0 289.8 2.0 39.6 - - -21.0 69.2 7.0 58.5
NMIJ 32.0 63.4 151.0 294.0 23.0 63.4 21.0 69.2 - - 28.0 76.6
KRISS 4.0 51.5 123.0 291.7 -5.0 51.5 -7.0 58.5 -28.0 76.6 - -

21/89
Table 20: Degrees of equivalence between the participants for horizontal voltage sensitivities of the
SE-1021 at 2 Hz
2.0 Hz NIM CMS NMIA NMISA NMIJ KRISS
i→ Dij Uij Dij Uij Dij Uij Dij Uij Dij Uij Dij Uij
j↓ (mV/(m/s2)•10-2) (mV/(m/s2)•10-2) (mV/(m/s2)•10-2) (mV/(m/s2)•10-2) (mV/(m/s2)•10-2) (mV/(m/s2)•10-2)
NIM - - 57.0 287.2 -11.0 28.6 -13.0 39.8 -25.0 87.9 3.0 39.9
CMS -57.0 287.2 - - -68.0 287.2 -70.0 288.5 -82.0 298.9 -54.0 288.5
NMIA 11.0 28.6 68.0 287.2 - - -2.0 39.8 -14.0 87.9 14.0 39.9
NMISA 13.0 39.8 70.0 288.5 2.0 39.8 - - -12.0 92.1 16.0 48.6
NMIJ 25.0 87.9 82.0 298.9 14.0 87.9 12.0 92.1 - - 28.0 92.2
KRISS -3.0 39.9 54.0 288.5 -14.0 39.9 -16.0 48.6 -28.0 92.2 - -
Table 21: Degrees of equivalence between the participants for horizontal voltage sensitivities of the
SE-1021 at 2.5 Hz
2.5 Hz NIM CMS NMIA NMISA NMIJ KRISS
i→ Dij Uij Dij Uij Dij Uij Dij Uij Dij Uij Dij Uij
j↓ (mV/(m/s2)•10-2) (mV/(m/s2)•10-2) (mV/(m/s2)•10-2) (mV/(m/s2)•10-2) (mV/(m/s2)•10-2) (mV/(m/s2)•10-2)
NIM - - 28.0 274.0 -11.0 28.4 -12.0 39.7 - - 0.0 39.7
CMS -28.0 274.0 - - -39.0 274.0 -40.0 275.4 - - -28.0 275.4
NMIA 11.0 28.4 39.0 274.0 - - -1.0 39.7 - - 11.0 39.7
NMISA 12.0 39.7 40.0 275.4 1.0 39.7 - - - - 12.0 48.4
NMIJ - - - - - - - - - - - -
KRISS 0.0 39.7 28.0 275.4 -11.0 39.7 -12.0 48.4 - - - -

22/89
Table 22: Degrees of equivalence between the participants for horizontal voltage sensitivities of the
SE-1021 at 3.15 Hz
3.15 Hz NIM CMS NMIA NMISA NMIJ KRISS
i→ Dij Uij Dij Uij Dij Uij Dij Uij Dij Uij Dij Uij
j↓ (mV/(m/s2)•10-2) (mV/(m/s2)•10-2) (mV/(m/s2)•10-2) (mV/(m/s2)•10-2) (mV/(m/s2)•10-2) (mV/(m/s2)•10-2)
NIM - - 28.0 63.9 -11.0 28.8 -22.0 39.9 - - -9.0 40.0
CMS -28.0 63.9 - - -39.0 63.9 -50.0 69.6 - - -37.0 69.6
NMIA 11.0 28.8 39.0 63.9 - - -11.0 39.9 - - 2.0 39.9
NMISA 22.0 39.9 50.0 69.6 11.0 39.9 - - - - 13.0 48.6
NMIJ - - - - - - - - - - - -
KRISS 9.0 40.0 37.0 69.6 -2.0 39.9 -13.0 48.6 - - - -
Table 23: Degrees of equivalence between the participants for horizontal voltage sensitivities of the
SE-1021 at 4 Hz
4.0 Hz NIM CMS NMIA NMISA NMIJ KRISS
i→ Dij Uij Dij Uij Dij Uij Dij Uij Dij Uij Dij Uij
j↓ (mV/(m/s2)•10-2) (mV/(m/s2)•10-2) (mV/(m/s2)•10-2) (mV/(m/s2)•10-2) (mV/(m/s2)•10-2) (mV/(m/s2)•10-2)
NIM - - 67.0 64.1 -12.0 28.8 -13.0 40.0 - - -12.0 40.0
CMS -67.0 64.1 - - -79.0 64.1 -80.0 69.8 - - -79.0 69.8
NMIA 12.0 28.8 79.0 64.1 - - -1.0 39.9 - - 0.0 39.9
NMISA 13.0 40.0 80.0 69.8 1.0 39.9 - - - - 1.0 48.6
NMIJ - - - - - - - - - - - -
KRISS 12.0 40.0 79.0 69.8 0.0 39.9 -1.0 48.6 - - - -

23/89
Table 24: Degrees of equivalence between the participants for horizontal voltage sensitivities of the
SE-1021 at 5 Hz
5.0 Hz NIM CMS NMIA NMISA NMIJ KRISS
i→ Dij Uij Dij Uij Dij Uij Dij Uij Dij Uij Dij Uij
j↓ (mV/(m/s2)•10-2) (mV/(m/s2)•10-2) (mV/(m/s2)•10-2) (mV/(m/s2)•10-2) (mV/(m/s2)•10-2) (mV/(m/s2)•10-2)
NIM - - 26.0 63.9 -13.0 28.8 -14.0 40.0 - - -9.0 40.0
CMS -26.0 63.9 - - -39.0 63.9 -40.0 69.6 - - -35.0 69.6
NMIA 13.0 28.8 39.0 63.9 - - -1.0 39.9 - - 4.0 39.9
NMISA 14.0 40.0 40.0 69.6 1.0 39.9 - - - - 5.0 48.6
NMIJ - - - - - - - - - - - -
KRISS 9.0 40.0 35.0 69.6 -4.0 39.9 -5.0 48.6 - - - -
Table 25: Degrees of equivalence between the participants for horizontal voltage sensitivities of the
SE-1021 at 6.3 Hz
6.3 Hz NIM CMS NMIA NMISA NMIJ KRISS
i→ Dij Uij Dij Uij Dij Uij Dij Uij Dij Uij Dij Uij
j↓ (mV/(m/s2)•10-2) (mV/(m/s2)•10-2) (mV/(m/s2)•10-2) (mV/(m/s2)•10-2) (mV/(m/s2)•10-2) (mV/(m/s2)•10-2)
NIM - - 46.0 64.0 -12.0 28.8 -14.0 40.0 - - -17.0 39.9
CMS -46.0 64.0 - - -58.0 64.0 -60.0 69.7 - - -63.0 69.7
NMIA 12.0 28.8 58.0 64.0 - - -2.0 39.9 - - -5.0 39.9
NMISA 14.0 40.0 60.0 69.7 2.0 39.9 - - - - -3.0 48.6
NMIJ - - - - - - - - - - - -
KRISS 17.0 39.9 63.0 69.7 5.0 39.9 3.0 48.6 - - - -
24/89
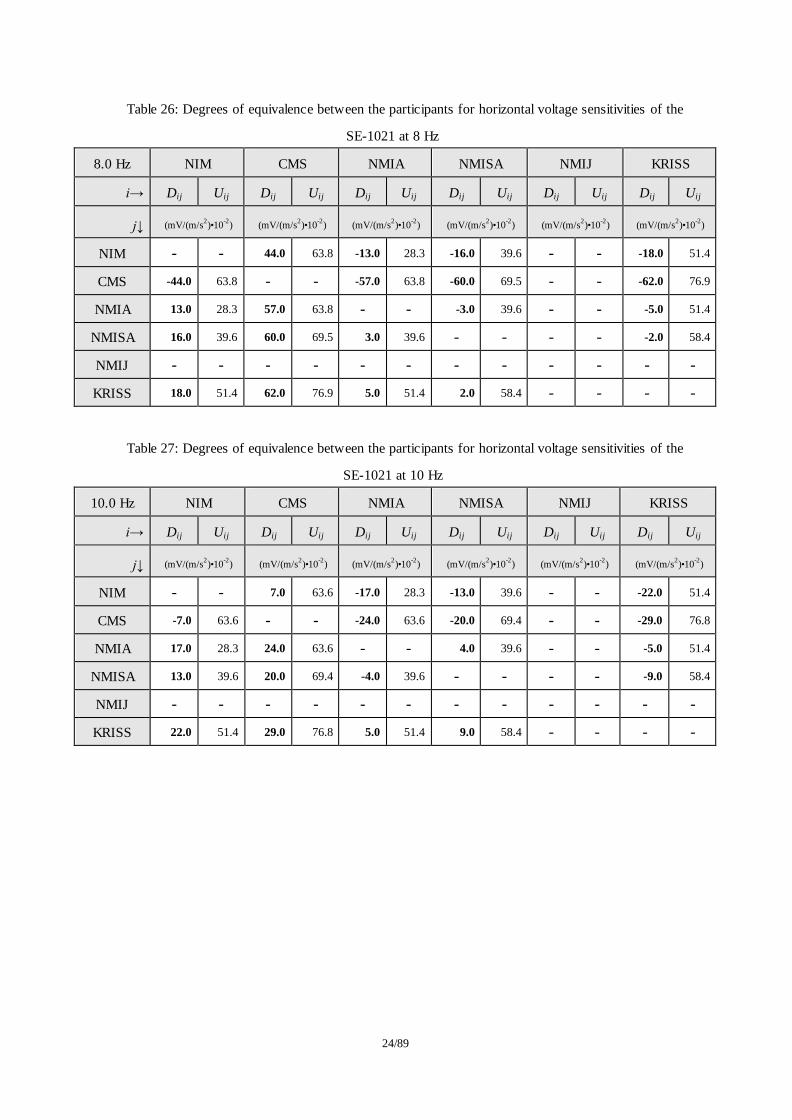
Table 26: Degrees of equivalence between the participants for horizontal voltage sensitivities of the
SE-1021 at 8 Hz
8.0 Hz NIM CMS NMIA NMISA NMIJ KRISS
i→ Dij Uij Dij Uij Dij Uij Dij Uij Dij Uij Dij Uij
j↓ (mV/(m/s2)•10-2) (mV/(m/s2)•10-2) (mV/(m/s2)•10-2) (mV/(m/s2)•10-2) (mV/(m/s2)•10-2) (mV/(m/s2)•10-2)
NIM - - 44.0 63.8 -13.0 28.3 -16.0 39.6 - - -18.0 51.4
CMS -44.0 63.8 - - -57.0 63.8 -60.0 69.5 - - -62.0 76.9
NMIA 13.0 28.3 57.0 63.8 - - -3.0 39.6 - - -5.0 51.4
NMISA 16.0 39.6 60.0 69.5 3.0 39.6 - - - - -2.0 58.4
NMIJ - - - - - - - - - - - -
KRISS 18.0 51.4 62.0 76.9 5.0 51.4 2.0 58.4 - - - -
Table 27: Degrees of equivalence between the participants for horizontal voltage sensitivities of the
SE-1021 at 10 Hz
10.0 Hz NIM CMS NMIA NMISA NMIJ KRISS
i→ Dij Uij Dij Uij Dij Uij Dij Uij Dij Uij Dij Uij
j↓ (mV/(m/s2)•10-2) (mV/(m/s2)•10-2) (mV/(m/s2)•10-2) (mV/(m/s2)•10-2) (mV/(m/s2)•10-2) (mV/(m/s2)•10-2)
NIM - - 7.0 63.6 -17.0 28.3 -13.0 39.6 - - -22.0 51.4
CMS -7.0 63.6 - - -24.0 63.6 -20.0 69.4 - - -29.0 76.8
NMIA 17.0 28.3 24.0 63.6 - - 4.0 39.6 - - -5.0 51.4
NMISA 13.0 39.6 20.0 69.4 -4.0 39.6 - - - - -9.0 58.4
NMIJ - - - - - - - - - - - -
KRISS 22.0 51.4 29.0 76.8 5.0 51.4 9.0 58.4 - - - -

25/89
Table 28: Degrees of equivalence between the participants for horizontal voltage sensitivities of the
SE-1021 at 12.5 Hz
12.5 Hz NIM CMS NMIA NMISA NMIJ KRISS
i→ Dij Uij Dij Uij Dij Uij Dij Uij Dij Uij Dij Uij
j↓ (mV/(m/s2)•10-2) (mV/(m/s2)•10-2) (mV/(m/s2)•10-2) (mV/(m/s2)•10-2) (mV/(m/s2)•10-2) (mV/(m/s2)•10-2)
NIM - - 55.0 51.9 -14.0 28.5 -15.0 39.8 - - -20.0 51.6
CMS -55.0 51.9 - - -69.0 51.8 -70.0 58.8 - - -75.0 67.3
NMIA 14.0 28.5 69.0 51.8 - - -1.0 39.8 - - -6.0 51.6
NMISA 15.0 39.8 70.0 58.8 1.0 39.8 - - - - -5.0 58.6
NMIJ - - - - - - - - - - - -
KRISS 20.0 51.6 75.0 67.3 6.0 51.6 5.0 58.6 - - - -
Table 29: Degrees of equivalence between the participants for horizontal voltage sensitivities of the
SE-1021 at 16 Hz
16.0 Hz NIM CMS NMIA NMISA NMIJ KRISS
i→ Dij Uij Dij Uij Dij Uij Dij Uij Dij Uij Dij Uij
j↓ (mV/(m/s2)•10-2) (mV/(m/s2)•10-2) (mV/(m/s2)•10-2) (mV/(m/s2)•10-2) (mV/(m/s2)•10-2) (mV/(m/s2)•10-2)
NIM - - 65.0 64.2 -15.0 28.8 -25.0 40.0 - - -15.0 40.0
CMS -65.0 64.2 - - -80.0 64.2 -90.0 69.9 - - -80.0 69.9
NMIA 15.0 28.8 80.0 64.2 - - -10.0 40.0 - - 0.0 40.0
NMISA 25.0 40.0 90.0 69.9 10.0 40.0 - - - - 10.0 48.7
NMIJ - - - - - - - - - - - -
KRISS 15.0 40.0 80.0 69.9 0.0 40.0 -10.0 48.7 - - - -

26/89
Table 30: Degrees of equivalence between the participants for horizontal voltage sensitivities of the
SE-1021 at 20 Hz
20.0 Hz NIM CMS NMIA NMISA NMIJ KRISS
i→ Dij Uij Dij Uij Dij Uij Dij Uij Dij Uij Dij Uij
j↓ (mV/(m/s2)•10-2) (mV/(m/s2)•10-2) (mV/(m/s2)•10-2) (mV/(m/s2)•10-2) (mV/(m/s2)•10-2) (mV/(m/s2)•10-2)
NIM - - 40.0 64.1 -17.0 28.8 -20.0 40.1 - - -23.0 40.0
CMS -40.0 64.1 - - -57.0 64.1 -60.0 69.9 - - -63.0 69.9
NMIA 17.0 28.8 57.0 64.1 - - -3.0 40.0 - - -6.0 40.0
NMISA 20.0 40.1 60.0 69.9 3.0 40.0 - - - - -3.0 48.7
NMIJ - - - - - - - - - - - -
KRISS 23.0 40.0 63.0 69.9 6.0 40.0 3.0 48.7 - - - -
7.4.2 Tables of DoE between participants for vertical voltage sensitivities of the
SE-1021 Table 31: Degrees of equivalence between the participants for vertical voltage sensitivities of the
SE-1021 at 0.5 Hz
0.50 Hz NIM NIMT NMIJ
i→ Dij Uij Dij Uij Dij Uij
j↓ (mV/(m/s2)•10-2) (mV/(m/s2)•10-2) (mV/(m/s2)•10-2)
NIM - - -11.0 71.0 - -
NIMT 11.0 71.0 - - - -
NMIJ - - - - - -
Table 32: Degrees of equivalence between the participants for vertical voltage sensitivities of the
SE-1021 at 0.63 Hz
0.63 Hz NIM NIMT NMIJ
i→ Dij Uij Dij Uij Dij Uij
j↓ (mV/(m/s2)•10-2) (mV/(m/s2)•10-2) (mV/(m/s2)•10-2)
NIM - - -10.0 71.0 - -
NIMT 10.0 71.0 - - - -
NMIJ - - - - - -

27/89
Table 33: Degrees of equivalence between the participants for vertical voltage sensitivities of the
SE-1021 at 0.8 Hz
0.8 Hz NIM NIMT NMIJ
i→ Dij Uij Dij Uij Dij Uij
j↓ (mV/(m/s2)•10-2) (mV/(m/s2)•10-2) (mV/(m/s2)•10-2)
NIM - - -9.0 71.0 - -
NIMT 9.0 71.0 - - - -
NMIJ - - - - - -
Table 34: Degrees of equivalence between the participants for vertical voltage sensitivities of the
SE-1021 at 1 Hz
1.0 Hz NIM NIMT NMIJ
i→ Dij Uij Dij Uij Dij Uij
j↓ (mV/(m/s2)•10-2) (mV/(m/s2)•10-2) (mV/(m/s2)•10-2)
NIM - - -4.0 58.3 - -
NIMT 4.0 58.3 - - - -
NMIJ - - - - - -
Table 35: Degrees of equivalence between the participants for vertical voltage sensitivities of the
SE-1021 at 1.25 Hz
1.25 Hz NIM NIMT NMIJ
i→ Dij Uij Dij Uij Dij Uij
j↓ (mV/(m/s2)•10-2) (mV/(m/s2)•10-2) (mV/(m/s2)•10-2)
NIM - - -3.0 58.3 - -
NIMT 3.0 58.3 - - - -
NMIJ - - - - - -

28/89
Table 36: Degrees of equivalence between the participants for vertical voltage sensitivities of the
SE-1021 at 1.6 Hz
1.6 Hz NIM NIMT NMIJ
i→ Dij Uij Dij Uij Dij Uij
j↓ (mV/(m/s2)•10-2) (mV/(m/s2)•10-2) (mV/(m/s2)•10-2)
NIM - - -3.0 58.3 - -
NIMT 3.0 58.3 - - - -
NMIJ - - - - - -
Table 37: Degrees of equivalence between the participants for vertical voltage sensitivities of the
SE-1021 at 2 Hz
2.0 Hz NIM NIMT NMIJ
i→ Dij Uij Dij Uij Dij Uij
j↓ (mV/(m/s2)•10-2) (mV/(m/s2)•10-2) (mV/(m/s2)•10-2)
NIM - - -4.0 58.3 - -
NIMT 4.0 58.3 - - - -
NMIJ - - - - - -
Table 38: Degrees of equivalence between the participants for vertical voltage sensitivities of the
SE-1021 at 2.5 Hz
2.5 Hz NIM NIMT NMIJ
i→ Dij Uij Dij Uij Dij Uij
j↓ (mV/(m/s2)•10-2) (mV/(m/s2)•10-2) (mV/(m/s2)•10-2)
NIM - - -5.0 60.8 -25.0 35.1
NIMT 5.0 60.8 - - -20.0 66.8
NMIJ 25.0 35.1 20.0 66.8 - -

29/89
Table 39: Degrees of equivalence between the participants for vertical voltage sensitivities of the
SE-1021 at 3.15 Hz
3.15 Hz NIM NIMT NMIJ
i→ Dij Uij Dij Uij Dij Uij
j↓ (mV/(m/s2)•10-2) (mV/(m/s2)•10-2) (mV/(m/s2)•10-2)
NIM - - -5.0 60.8 -20.0 35.1
NIMT 5.0 60.8 - - -15.0 66.8
NMIJ 20.0 35.1 15.0 66.8 - -
Table 40: Degrees of equivalence between the participants for vertical voltage sensitivities of the
SE-1021 at 4 Hz
4.0 Hz NIM NIMT NMIJ
i→ Dij Uij Dij Uij Dij Uij
j↓ (mV/(m/s2)•10-2) (mV/(m/s2)•10-2) (mV/(m/s2)•10-2)
NIM - - -4.0 60.8 -17.0 35.1
NIMT 4.0 60.8 - - -13.0 66.8
NMIJ 17.0 35.1 13.0 66.8 - -
Table 41: Degrees of equivalence between the participants for vertical voltage sensitivities of the
SE-1021 at 5 Hz
5.0 Hz NIM NIMT NMIJ
i→ Dij Uij Dij Uij Dij Uij
j↓ (mV/(m/s2)•10-2) (mV/(m/s2)•10-2) (mV/(m/s2)•10-2)
NIM - - -2.0 48.5 -17.0 35.7
NIMT 2.0 48.5 - - -15.0 55.9
NMIJ 17.0 35.7 15.0 55.9 - -

30/89
Table 42: Degrees of equivalence between the participants for vertical voltage sensitivities of the
SE-1021 at 6.3 Hz
6.3 Hz NIM NIMT NMIJ
i→ Dij Uij Dij Uij Dij Uij
j↓ (mV/(m/s2)•10-2) (mV/(m/s2)•10-2) (mV/(m/s2)•10-2)
NIM - - -1.0 48.5 -13.0 35.7
NIMT 1.0 48.5 - - -12.0 55.9
NMIJ 13.0 35.7 12.0 55.9 - -
Table 43: Degrees of equivalence between the participants for vertical voltage sensitivities of the
SE-1021 at 8 Hz
8.0 Hz NIM NIMT NMIJ
i→ Dij Uij Dij Uij Dij Uij
j↓ (mV/(m/s2)•10-2) (mV/(m/s2)•10-2) (mV/(m/s2)•10-2)
NIM - - -2.0 48.5 -13.0 35.7
NIMT 2.0 48.5 - - -11.0 55.9
NMIJ 13.0 35.7 11.0 55.9 - -
Table 44: Degrees of equivalence between the participants for vertical voltage sensitivities of the
SE-1021 at 10 Hz
10.0 Hz NIM NIMT NMIJ
i→ Dij Uij Dij Uij Dij Uij
j↓ (mV/(m/s2)•10-2) (mV/(m/s2)•10-2) (mV/(m/s2)•10-2)
NIM - - -1.0 48.5 -11.0 35.7
NIMT 1.0 48.5 - - -10.0 55.9
NMIJ 11.0 35.7 10.0 55.9 - -

31/89
Table 45: Degrees of equivalence between the participants for vertical voltage sensitivities of the
SE-1021 at 12.5 Hz
12.5 Hz NIM NIMT NMIJ
i→ Dij Uij Dij Uij Dij Uij
j↓ (mV/(m/s2)•10-2) (mV/(m/s2)•10-2) (mV/(m/s2)•10-2)
NIM - - 0.0 48.6 -9.0 35.7
NIMT 0.0 48.6 - - -9.0 55.9
NMIJ 9.0 35.7 9.0 55.9 - -
Table 46: Degrees of equivalence between the participants for vertical voltage sensitivities of the
SE-1021 at 16 Hz
16.0 Hz NIM NIMT NMIJ
i→ Dij Uij Dij Uij Dij Uij
j↓ (mV/(m/s2)•10-2) (mV/(m/s2)•10-2) (mV/(m/s2)•10-2)
NIM - - -2.0 48.6 -10.0 35.7
NIMT 2.0 48.6 - - -8.0 56.0
NMIJ 10.0 35.7 8.0 56.0 - -
Table 47: Degrees of equivalence between the participants for vertical voltage sensitivities of the
SE-1021 at 20 Hz
20.0 Hz NIM NIMT NMIJ
i→ Dij Uij Dij Uij Dij Uij
j↓ (mV/(m/s2)•10-2) (mV/(m/s2)•10-2) (mV/(m/s2)•10-2)
NIM - - -1.0 48.6 -8.0 35.8
NIMT 1.0 48.6 - - -7.0 56.0
NMIJ 8.0 35.8 7.0 56.0 - -

32/89
7.4.3 Tables of DoE between participants for horizontal voltage sensitivities of the
SE-1022 Table 48: Degrees of equivalence between the participants for horizontal voltage sensitivities of the
SE-1022 at 0.5 Hz
0.50 Hz NIM CMS NMIA NMISA NMIJ KRISS
i→ Dij Uij Dij Uij Dij Uij Dij Uij Dij Uij Dij Uij
j↓ (mV/(m/s2)•10-2) (mV/(m/s2)•10-2) (mV/(m/s2)•10-2) (mV/(m/s2)•10-2) (mV/(m/s2)•10-2) (mV/(m/s2)•10-2)
NIM - - 70.0 325.0 -26.0 27.6 -40.0 39.1 -18.0 248.3 -8.0 63.2
CMS -70.0 325.0 - - -96.0 325.0 -110.0 326.1 -88.0 408.1 -78.0 329.9
NMIA 26.0 27.6 96.0 325.0 - - -14.0 39.0 8.0 248.3 18.0 63.2
NMISA 40.0 39.1 110.0 326.1 14.0 39.0 - - 22.0 249.9 32.0 69.0
NMIJ 18.0 248.3 88.0 408.1 -8.0 248.3 -22.0 249.9 - - 10.0 254.8
KRISS 8.0 63.2 78.0 329.9 -18.0 63.2 -32.0 69.0 -10.0 254.8 - -
Table 49: Degrees of equivalence between the participants for horizontal voltage sensitivities of the
SE-1022 at 0.63 Hz
0.63 Hz NIM CMS NMIA NMISA NMIJ KRISS
i→ Dij Uij Dij Uij Dij Uij Dij Uij Dij Uij Dij Uij
j↓ (mV/(m/s2)•10-2) (mV/(m/s2)•10-2) (mV/(m/s2)•10-2) (mV/(m/s2)•10-2) (mV/(m/s2)•10-2) (mV/(m/s2)•10-2)
NIM - - 77.0 337.5 -20.0 27.8 -33.0 39.2 -50.0 87.5 -12.0 63.3
CMS -77.0 337.5 - - -97.0 337.5 -110.0 338.6 -127.0 347.5 -89.0 342.2
NMIA 20.0 27.8 97.0 337.5 - - -13.0 39.2 -30.0 87.4 8.0 63.3
NMISA 33.0 39.2 110.0 338.6 13.0 39.2 - - -17.0 91.7 21.0 69.0
NMIJ 50.0 87.5 127.0 347.5 30.0 87.4 17.0 91.7 - - 38.0 104.3
KRISS 12.0 63.3 89.0 342.2 -8.0 63.3 -21.0 69.0 -38.0 104.3 - -

33/89
Table 50: Degrees of equivalence between the participants for horizontal voltage sensitivities of the
SE-1022 at 0.8 Hz
0.8 Hz NIM CMS NMIA NMISA NMIJ KRISS
i→ Dij Uij Dij Uij Dij Uij Dij Uij Dij Uij Dij Uij
j↓ (mV/(m/s2)•10-2) (mV/(m/s2)•10-2) (mV/(m/s2)•10-2) (mV/(m/s2)•10-2) (mV/(m/s2)•10-2) (mV/(m/s2)•10-2)
NIM - - 71.0 312.3 -18.0 28.5 -29.0 39.7 -28.0 100.1 -12.0 39.8
CMS -71.0 312.3 - - -89.0 312.3 -100.0 313.5 -99.0 326.7 -83.0 313.5
NMIA 18.0 28.5 89.0 312.3 - - -11.0 39.7 -10.0 100.0 6.0 39.8
NMISA 29.0 39.7 100.0 313.5 11.0 39.7 - - 1.0 103.8 17.0 48.4
NMIJ 28.0 100.1 99.0 326.7 10.0 100.0 -1.0 103.8 - - 16.0 103.8
KRISS 12.0 39.8 83.0 313.5 -6.0 39.8 -17.0 48.4 -16.0 103.8 - -
Table 51: Degrees of equivalence between the participants for horizontal voltage sensitivities of the
SE-1022 at 1 Hz
1.0 Hz NIM CMS NMIA NMISA NMIJ KRISS
i→ Dij Uij Dij Uij Dij Uij Dij Uij Dij Uij Dij Uij
j↓ (mV/(m/s2)•10-2) (mV/(m/s2)•10-2) (mV/(m/s2)•10-2) (mV/(m/s2)•10-2) (mV/(m/s2)•10-2) (mV/(m/s2)•10-2)
NIM - - 109.0 288.0 -11.0 28.0 -21.0 39.3 -28.0 124.4 -7.0 51.2
CMS -109.0 288.0 - - -120.0 288.0 -130.0 289.3 -137.0 312.5 -116.0 291.2
NMIA 11.0 28.0 120.0 288.0 - - -10.0 39.3 -17.0 124.4 4.0 51.2
NMISA 21.0 39.3 130.0 289.3 10.0 39.3 - - -7.0 127.4 14.0 58.2
NMIJ 28.0 124.4 137.0 312.5 17.0 124.4 7.0 127.4 - - 21.0 131.6
KRISS 7.0 51.2 116.0 291.2 -4.0 51.2 -14.0 58.2 -21.0 131.6 - -

34/89
Table 52: Degrees of equivalence between the participants for horizontal voltage sensitivities of the
SE-1022 at 1.25 Hz
1.25 Hz NIM CMS NMIA NMISA NMIJ KRISS
i→ Dij Uij Dij Uij Dij Uij Dij Uij Dij Uij Dij Uij
j↓ (mV/(m/s2)•10-2) (mV/(m/s2)•10-2) (mV/(m/s2)•10-2) (mV/(m/s2)•10-2) (mV/(m/s2)•10-2) (mV/(m/s2)•10-2)
NIM - - 83.0 287.3 -8.0 28.1 -17.0 39.4 -30.0 87.6 -7.0 51.3
CMS -83.0 287.3 - - -91.0 287.3 -100.0 288.7 -113.0 299.1 -90.0 290.5
NMIA 8.0 28.1 91.0 287.3 - - -9.0 39.4 -22.0 87.6 1.0 51.3
NMISA 17.0 39.4 100.0 288.7 9.0 39.4 - - -13.0 91.8 10.0 58.3
NMIJ 30.0 87.6 113.0 299.1 22.0 87.6 13.0 91.8 - - 23.0 97.5
KRISS 7.0 51.3 90.0 290.5 -1.0 51.3 -10.0 58.3 -23.0 97.5 - -
Table 53: Degrees of equivalence between the participants for horizontal voltage sensitivities of the
SE-1022 at 1.6 Hz
1.6 Hz NIM CMS NMIA NMISA NMIJ KRISS
i→ Dij Uij Dij Uij Dij Uij Dij Uij Dij Uij Dij Uij
j↓ (mV/(m/s2)•10-2) (mV/(m/s2)•10-2) (mV/(m/s2)•10-2) (mV/(m/s2)•10-2) (mV/(m/s2)•10-2) (mV/(m/s2)•10-2)
NIM - - 101.0 287.8 -11.0 28.5 -19.0 39.7 -31.0 51.4 -7.0 51.5
CMS -101.0 287.8 - - -112.0 287.8 -120.0 289.2 -132.0 291.0 -108.0 291.0
NMIA 11.0 28.5 112.0 287.8 - - -8.0 39.7 -20.0 51.4 4.0 51.5
NMISA 19.0 39.7 120.0 289.2 8.0 39.7 - - -12.0 58.4 12.0 58.5
NMIJ 31.0 51.4 132.0 291.0 20.0 51.4 12.0 58.4 - - 24.0 67.0
KRISS 7.0 51.5 108.0 291.0 -4.0 51.5 -12.0 58.5 -24.0 67.0 - -

35/89
Table 54: Degrees of equivalence between the participants for horizontal voltage sensitivities of the
SE-1022 at 2 Hz
2.0 Hz NIM CMS NMIA NMISA NMIJ KRISS
i→ Dij Uij Dij Uij Dij Uij Dij Uij Dij Uij Dij Uij
j↓ (mV/(m/s2)•10-2) (mV/(m/s2)•10-2) (mV/(m/s2)•10-2) (mV/(m/s2)•10-2) (mV/(m/s2)•10-2) (mV/(m/s2)•10-2)
NIM - - 71.0 287.2 -11.0 28.6 -19.0 39.8 -43.0 87.7 2.0 39.8
CMS -71.0 287.2 - - -82.0 287.2 -90.0 288.5 -114.0 298.9 -69.0 288.5
NMIA 11.0 28.6 82.0 287.2 - - -8.0 39.8 -32.0 87.6 13.0 39.8
NMISA 19.0 39.8 90.0 288.5 8.0 39.8 - - -24.0 91.9 21.0 48.5
NMIJ 43.0 87.7 114.0 298.9 32.0 87.6 24.0 91.9 - - 45.0 91.9
KRISS -2.0 39.8 69.0 288.5 -13.0 39.8 -21.0 48.5 -45.0 91.9 - -
Table 55: Degrees of equivalence between the participants for horizontal voltage sensitivities of the
SE-1022 at 2.5 Hz
2.5 Hz NIM CMS NMIA NMISA NMIJ KRISS
i→ Dij Uij Dij Uij Dij Uij Dij Uij Dij Uij Dij Uij
j↓ (mV/(m/s2)•10-2) (mV/(m/s2)•10-2) (mV/(m/s2)•10-2) (mV/(m/s2)•10-2) (mV/(m/s2)•10-2) (mV/(m/s2)•10-2)
NIM - - 31.0 273.8 -12.0 28.4 -19.0 39.6 - - 0.0 39.7
CMS -31.0 273.8 - - -43.0 273.8 -50.0 275.2 - - -31.0 275.2
NMIA 12.0 28.4 43.0 273.8 - - -7.0 39.6 - - 12.0 39.7
NMISA 19.0 39.6 50.0 275.2 7.0 39.6 - - - - 19.0 48.4
NMIJ - - - - - - - - - - - -
KRISS 0.0 39.7 31.0 275.2 -12.0 39.7 -19.0 48.4 - - - -

36/89
Table 56: Degrees of equivalence between the participants for horizontal voltage sensitivities of the
SE-1022 at 3.15 Hz
3.15 Hz NIM CMS NMIA NMISA NMIJ KRISS
i→ Dij Uij Dij Uij Dij Uij Dij Uij Dij Uij Dij Uij
j↓ (mV/(m/s2)•10-2) (mV/(m/s2)•10-2) (mV/(m/s2)•10-2) (mV/(m/s2)•10-2) (mV/(m/s2)•10-2) (mV/(m/s2)•10-2)
NIM - - 90.0 76.3 -13.0 28.6 -10.0 39.8 - - -10.0 39.8
CMS -90.0 76.3 - - -103.0 76.3 -100.0 81.2 - - -100.0 81.2
NMIA 13.0 28.6 103.0 76.3 - - 3.0 39.8 - - 3.0 39.8
NMISA 10.0 39.8 100.0 81.2 -3.0 39.8 - - - - 0.0 48.5
NMIJ - - - - - - - - - - - -
KRISS 10.0 39.8 100.0 81.2 -3.0 39.8 0.0 48.5 - - - -
Table 57: Degrees of equivalence between the participants for horizontal voltage sensitivities of the
SE-1022 at 4 Hz
4.0 Hz NIM CMS NMIA NMISA NMIJ KRISS
i→ Dij Uij Dij Uij Dij Uij Dij Uij Dij Uij Dij Uij
j↓ (mV/(m/s2)•10-2) (mV/(m/s2)•10-2) (mV/(m/s2)•10-2) (mV/(m/s2)•10-2) (mV/(m/s2)•10-2) (mV/(m/s2)•10-2)
NIM - - 70.0 76.2 -13.0 28.6 -20.0 39.8 - - -14.0 39.8
CMS -70.0 76.2 - - -83.0 76.2 -90.0 81.0 - - -84.0 81.1
NMIA 13.0 28.6 83.0 76.2 - - -7.0 39.8 - - -1.0 39.8
NMISA 20.0 39.8 90.0 81.0 7.0 39.8 - - - - 6.0 48.5
NMIJ - - - - - - - - - - - -
KRISS 14.0 39.8 84.0 81.1 1.0 39.8 -6.0 48.5 - - - -

37/89
Table 58: Degrees of equivalence between the participants for horizontal voltage sensitivities of the
SE-1022 at 5 Hz
5.0 Hz NIM CMS NMIA NMISA NMIJ KRISS
i→ Dij Uij Dij Uij Dij Uij Dij Uij Dij Uij Dij Uij
j↓ (mV/(m/s2)•10-2) (mV/(m/s2)•10-2) (mV/(m/s2)•10-2) (mV/(m/s2)•10-2) (mV/(m/s2)•10-2) (mV/(m/s2)•10-2)
NIM - - 9.0 63.7 -14.0 28.7 -11.0 39.9 - - -18.0 39.9
CMS -9.0 63.7 - - -23.0 63.7 -20.0 69.5 - - -27.0 69.5
NMIA 14.0 28.7 23.0 63.7 - - 3.0 39.9 - - -4.0 39.9
NMISA 11.0 39.9 20.0 69.5 -3.0 39.9 - - - - -7.0 48.6
NMIJ - - - - - - - - - - - -
KRISS 18.0 39.9 27.0 69.5 4.0 39.9 7.0 48.6 - - - -
Table 59: Degrees of equivalence between the participants for horizontal voltage sensitivities of the
SE-1022 at 6.3 Hz
6.3 Hz NIM CMS NMIA NMISA NMIJ KRISS
i→ Dij Uij Dij Uij Dij Uij Dij Uij Dij Uij Dij Uij
j↓ (mV/(m/s2)•10-2) (mV/(m/s2)•10-2) (mV/(m/s2)•10-2) (mV/(m/s2)•10-2) (mV/(m/s2)•10-2) (mV/(m/s2)•10-2)
NIM - - 9.0 63.7 -14.0 28.7 -11.0 39.9 - - -21.0 39.9
CMS -9.0 63.7 - - -23.0 63.7 -20.0 69.5 - - -30.0 69.5
NMIA 14.0 28.7 23.0 63.7 - - 3.0 39.9 - - -7.0 39.9
NMISA 11.0 39.9 20.0 69.5 -3.0 39.9 - - - - -10.0 48.6
NMIJ - - - - - - - - - - - -
KRISS 21.0 39.9 30.0 69.5 7.0 39.9 10.0 48.6 - - - -

38/89
Table 60: Degrees of equivalence between the participants for horizontal voltage sensitivities of the
SE-1022 at 8 Hz
8.0 Hz NIM CMS NMIA NMISA NMIJ KRISS
i→ Dij Uij Dij Uij Dij Uij Dij Uij Dij Uij Dij Uij
j↓ (mV/(m/s2)•10-2) (mV/(m/s2)•10-2) (mV/(m/s2)•10-2) (mV/(m/s2)•10-2) (mV/(m/s2)•10-2) (mV/(m/s2)•10-2)
NIM - - 16.0 63.6 -15.0 28.3 -14.0 39.6 - - -22.0 51.4
CMS -16.0 63.6 - - -31.0 63.6 -30.0 69.3 - - -38.0 76.7
NMIA 15.0 28.3 31.0 63.6 - - 1.0 39.6 - - -7.0 51.3
NMISA 14.0 39.6 30.0 69.3 -1.0 39.6 - - - - -8.0 58.3
NMIJ - - - - - - - - - - - -
KRISS 22.0 51.4 38.0 76.7 7.0 51.3 8.0 58.3 - - - -
Table 61: Degrees of equivalence between the participants for horizontal voltage sensitivities of the
SE-1022 at 10 Hz
10.0 Hz NIM CMS NMIA NMISA NMIJ KRISS
i→ Dij Uij Dij Uij Dij Uij Dij Uij Dij Uij Dij Uij
j↓ (mV/(m/s2)•10-2) (mV/(m/s2)•10-2) (mV/(m/s2)•10-2) (mV/(m/s2)•10-2) (mV/(m/s2)•10-2) (mV/(m/s2)•10-2)
NIM - - 49.0 63.8 -19.0 28.3 -21.0 39.6 - - -25.0 51.4
CMS -49.0 63.8 - - -68.0 63.8 -70.0 69.5 - - -74.0 76.8
NMIA 19.0 28.3 68.0 63.8 - - -2.0 39.6 - - -6.0 51.4
NMISA 21.0 39.6 70.0 69.5 2.0 39.6 - - - - -4.0 58.4
NMIJ - - - - - - - - - - - -
KRISS 25.0 51.4 74.0 76.8 6.0 51.4 4.0 58.4 - - - -

39/89
Table 62: Degrees of equivalence between the participants for horizontal voltage sensitivities of the
SE-1022 at 12.5 Hz
12.5 Hz NIM CMS NMIA NMISA NMIJ KRISS
i→ Dij Uij Dij Uij Dij Uij Dij Uij Dij Uij Dij Uij
j↓ (mV/(m/s2)•10-2) (mV/(m/s2)•10-2) (mV/(m/s2)•10-2) (mV/(m/s2)•10-2) (mV/(m/s2)•10-2) (mV/(m/s2)•10-2)
NIM - - 29.0 63.7 -15.0 28.3 -21.0 39.6 - - -22.0 51.4
CMS -29.0 63.7 - - -44.0 63.7 -50.0 69.4 - - -51.0 76.8
NMIA 15.0 28.3 44.0 63.7 - - -6.0 39.6 - - -7.0 51.4
NMISA 21.0 39.6 50.0 69.4 6.0 39.6 - - - - -1.0 58.4
NMIJ - - - - - - - - - - - -
KRISS 22.0 51.4 51.0 76.8 7.0 51.4 1.0 58.4 - - - -
Table 63: Degrees of equivalence between the participants for horizontal voltage sensitivities of the
SE-1022 at 16 Hz
16.0 Hz NIM CMS NMIA NMISA NMIJ KRISS
i→ Dij Uij Dij Uij Dij Uij Dij Uij Dij Uij Dij Uij
j↓ (mV/(m/s2)•10-2) (mV/(m/s2)•10-2) (mV/(m/s2)•10-2) (mV/(m/s2)•10-2) (mV/(m/s2)•10-2) (mV/(m/s2)•10-2)
NIM - - 60.0 63.9 -15.0 28.3 -20.0 39.6 - - -17.0 51.4
CMS -60.0 63.9 - - -75.0 63.9 -80.0 69.6 - - -77.0 77.0
NMIA 15.0 28.3 75.0 63.9 - - -5.0 39.6 - - -2.0 51.4
NMISA 20.0 39.6 80.0 69.6 5.0 39.6 - - - - 3.0 58.4
NMIJ - - - - - - - - - - - -
KRISS 17.0 51.4 77.0 77.0 2.0 51.4 -3.0 58.4 - - - -

40/89
Table 64: Degrees of equivalence between the participants for horizontal voltage sensitivities of the
SE-1022 at 20 Hz
20.0 Hz NIM CMS NMIA NMISA NMIJ KRISS
i→ Dij Uij Dij Uij Dij Uij Dij Uij Dij Uij Dij Uij
j↓ (mV/(m/s2)•10-2) (mV/(m/s2)•10-2) (mV/(m/s2)•10-2) (mV/(m/s2)•10-2) (mV/(m/s2)•10-2) (mV/(m/s2)•10-2)
NIM - - 26.0 63.8 -18.0 28.3 -24.0 39.6 - - -25.0 51.5
CMS -26.0 63.8 - - -44.0 63.8 -50.0 69.5 - - -51.0 76.9
NMIA 18.0 28.3 44.0 63.8 - - -6.0 39.6 - - -7.0 51.5
NMISA 24.0 39.6 50.0 69.5 6.0 39.6 - - - - -1.0 58.5
NMIJ - - - - - - - - - - - -
KRISS 25.0 51.5 51.0 76.9 7.0 51.5 1.0 58.5 - - - -
7.4.4 Tables of DoE between participants for vertical voltage sensitivities of the
SE-1022 Table 65: Degrees of equivalence between the participants for vertical voltage sensitivities of the
SE-1022 at 0.5 Hz
0.50 Hz NIM NIMT NMIJ
i→ Dij Uij Dij Uij Dij Uij
j↓ (mV/(m/s2)•10-2) (mV/(m/s2)•10-2) (mV/(m/s2)•10-2)
NIM - - -10.0 71.0 - -
NIMT 10.0 71.0 - - - -
NMIJ - - - - - -
Table 66: Degrees of equivalence between the participants for vertical voltage sensitivities of the
SE-1022 at 0.63 Hz
0.63 Hz NIM NIMT NMIJ
i→ Dij Uij Dij Uij Dij Uij
j↓ (mV/(m/s2)•10-2) (mV/(m/s2)•10-2) (mV/(m/s2)•10-2)
NIM - - -12.0 71.0 - -
NIMT 12.0 71.0 - - - -
NMIJ - - - - - -

41/89
Table 67: Degrees of equivalence between the participants for vertical voltage sensitivities of the
SE-1022 at 0.8 Hz
0.8 Hz NIM NIMT NMIJ
i→ Dij Uij Dij Uij Dij Uij
j↓ (mV/(m/s2)•10-2) (mV/(m/s2)•10-2) (mV/(m/s2)•10-2)
NIM - - -12.0 71.0 - -
NIMT 12.0 71.0 - - - -
NMIJ - - - - - -
Table 68: Degrees of equivalence between the participants for vertical voltage sensitivities of the
SE-1022 at 1 Hz
1.0 Hz NIM NIMT NMIJ
i→ Dij Uij Dij Uij Dij Uij
j↓ (mV/(m/s2)•10-2) (mV/(m/s2)•10-2) (mV/(m/s2)•10-2)
NIM - - -6.0 58.3 - -
NIMT 6.0 58.3 - - - -
NMIJ - - - - - -
Table 69: Degrees of equivalence between the participants for vertical voltage sensitivities of the
SE-1022 at 1.25 Hz
1.25 Hz NIM NIMT NMIJ
i→ Dij Uij Dij Uij Dij Uij
j↓ (mV/(m/s2)•10-2) (mV/(m/s2)•10-2) (mV/(m/s2)•10-2)
NIM - - -4.0 58.3 - -
NIMT 4.0 58.3 - - - -
NMIJ - - - - - -

42/89
Table 70: Degrees of equivalence between the participants for vertical voltage sensitivities of the
SE-1022 at 1.6 Hz
1.6 Hz NIM NIMT NMIJ
i→ Dij Uij Dij Uij Dij Uij
j↓ (mV/(m/s2)•10-2) (mV/(m/s2)•10-2) (mV/(m/s2)•10-2)
NIM - - -4.0 58.3 - -
NIMT 4.0 58.3 - - - -
NMIJ - - - - - -
Table 71: Degrees of equivalence between the participants for vertical voltage sensitivities of the
SE-1022 at 2 Hz
2.0 Hz NIM NIMT NMIJ
i→ Dij Uij Dij Uij Dij Uij
j↓ (mV/(m/s2)•10-2) (mV/(m/s2)•10-2) (mV/(m/s2)•10-2)
NIM - - -5.0 58.3 - -
NIMT 5.0 58.3 - - - -
NMIJ - - - - - -
Table 72: Degrees of equivalence between the participants for vertical voltage sensitivities of the
SE-1022 at 2.5 Hz
2.5 Hz NIM NIMT NMIJ
i→ Dij Uij Dij Uij Dij Uij
j↓ (mV/(m/s2)•10-2) (mV/(m/s2)•10-2) (mV/(m/s2)•10-2)
NIM - - -5.0 60.7 -27.0 35.0
NIMT 5.0 60.7 - - -22.0 66.7
NMIJ 27.0 35.0 22.0 66.7 - -

43/89
Table 73: Degrees of equivalence between the participants for vertical voltage sensitivities of the
SE-1022 at 3.15 Hz
3.15 Hz NIM NIMT NMIJ
i→ Dij Uij Dij Uij Dij Uij
j↓ (mV/(m/s2)•10-2) (mV/(m/s2)•10-2) (mV/(m/s2)•10-2)
NIM - - -5.0 60.7 -21.0 35.0
NIMT 5.0 60.7 - - -16.0 66.7
NMIJ 21.0 35.0 16.0 66.7 - -
Table 74: Degrees of equivalence between the participants for vertical voltage sensitivities of the
SE-1022 at 4 Hz
4.0 Hz NIM NIMT NMIJ
i→ Dij Uij Dij Uij Dij Uij
j↓ (mV/(m/s2)•10-2) (mV/(m/s2)•10-2) (mV/(m/s2)•10-2)
NIM - - -5.0 60.7 -19.0 35.1
NIMT 5.0 60.7 - - -14.0 66.7
NMIJ 19.0 35.1 14.0 66.7 - -
Table 75: Degrees of equivalence between the participants for vertical voltage sensitivities of the
SE-1022 at 5 Hz
5.0 Hz NIM NIMT NMIJ
i→ Dij Uij Dij Uij Dij Uij
j↓ (mV/(m/s2)•10-2) (mV/(m/s2)•10-2) (mV/(m/s2)•10-2)
NIM - - -3.0 48.5 -17.0 35.6
NIMT 3.0 48.5 - - -14.0 55.8
NMIJ 17.0 35.6 14.0 55.8 - -

44/89
Table 76: Degrees of equivalence between the participants for vertical voltage sensitivities of the
SE-1022 at 6.3 Hz
6.3 Hz NIM NIMT NMIJ
i→ Dij Uij Dij Uij Dij Uij
j↓ (mV/(m/s2)•10-2) (mV/(m/s2)•10-2) (mV/(m/s2)•10-2)
NIM - - -2.0 48.5 -14.0 35.6
NIMT 2.0 48.5 - - -12.0 55.8
NMIJ 14.0 35.6 12.0 55.8 - -
Table 77: Degrees of equivalence between the participants for vertical voltage sensitivities of the
SE-1022 at 8 Hz
8.0 Hz NIM NIMT NMIJ
i→ Dij Uij Dij Uij Dij Uij
j↓ (mV/(m/s2)•10-2) (mV/(m/s2)•10-2) (mV/(m/s2)•10-2)
NIM - - -2.0 48.5 -12.0 35.6
NIMT 2.0 48.5 - - -10.0 55.8
NMIJ 12.0 35.6 10.0 55.8 - -
Table 78: Degrees of equivalence between the participants for vertical voltage sensitivities of the
SE-1022 at 10 Hz
10.0 Hz NIM NIMT NMIJ
i→ Dij Uij Dij Uij Dij Uij
j↓ (mV/(m/s2)•10-2) (mV/(m/s2)•10-2) (mV/(m/s2)•10-2)
NIM - - -1.0 48.5 -11.0 35.7
NIMT 1.0 48.5 - - -10.0 55.8
NMIJ 11.0 35.7 10.0 55.8 - -

45/89
Table 79: Degrees of equivalence between the participants for vertical voltage sensitivities of the
SE-1022 at 12.5 Hz
12.5 Hz NIM NIMT NMIJ
i→ Dij Uij Dij Uij Dij Uij
j↓ (mV/(m/s2)•10-2) (mV/(m/s2)•10-2) (mV/(m/s2)•10-2)
NIM - - -2.0 48.5 -10.0 35.7
NIMT 2.0 48.5 - - -8.0 55.8
NMIJ 10.0 35.7 8.0 55.8 - -
Table 80: Degrees of equivalence between the participants for vertical voltage sensitivities of the
SE-1022 at 16 Hz
16.0 Hz NIM NIMT NMIJ
i→ Dij Uij Dij Uij Dij Uij
j↓ (mV/(m/s2)•10-2) (mV/(m/s2)•10-2) (mV/(m/s2)•10-2)
NIM - - 0.0 48.5 -8.0 35.7
NIMT 0.0 48.5 - - -8.0 55.9
NMIJ 8.0 35.7 8.0 55.9 - -
Table 81: Degrees of equivalence between the participants for vertical voltage sensitivities of the
SE-1022 at 20 Hz
20.0 Hz NIM NIMT NMIJ
i→ Dij Uij Dij Uij Dij Uij
j↓ (mV/(m/s2)•10-2) (mV/(m/s2)•10-2) (mV/(m/s2)•10-2)
NIM - - 1.0 48.6 -7.0 35.7
NIMT -1.0 48.6 - - -8.0 55.9
NMIJ 7.0 35.7 8.0 55.9 - -
8 Conclusion Seven NMIs measured the voltage sensitivity of two accelerometer standard sets (one set included a quartz-flexure servo accelerometer of single-ended type and a signal conditioner)
at 17 frequencies from 0.5 Hz to 20 Hz, in either horizontal or vertical installation direction,
except that the pilot laboratory did both directions. The results of the APMP.AUV.V-K3 are four sets of KCRVs, their uncertainties and degrees of equivalence illustrating the
46/89
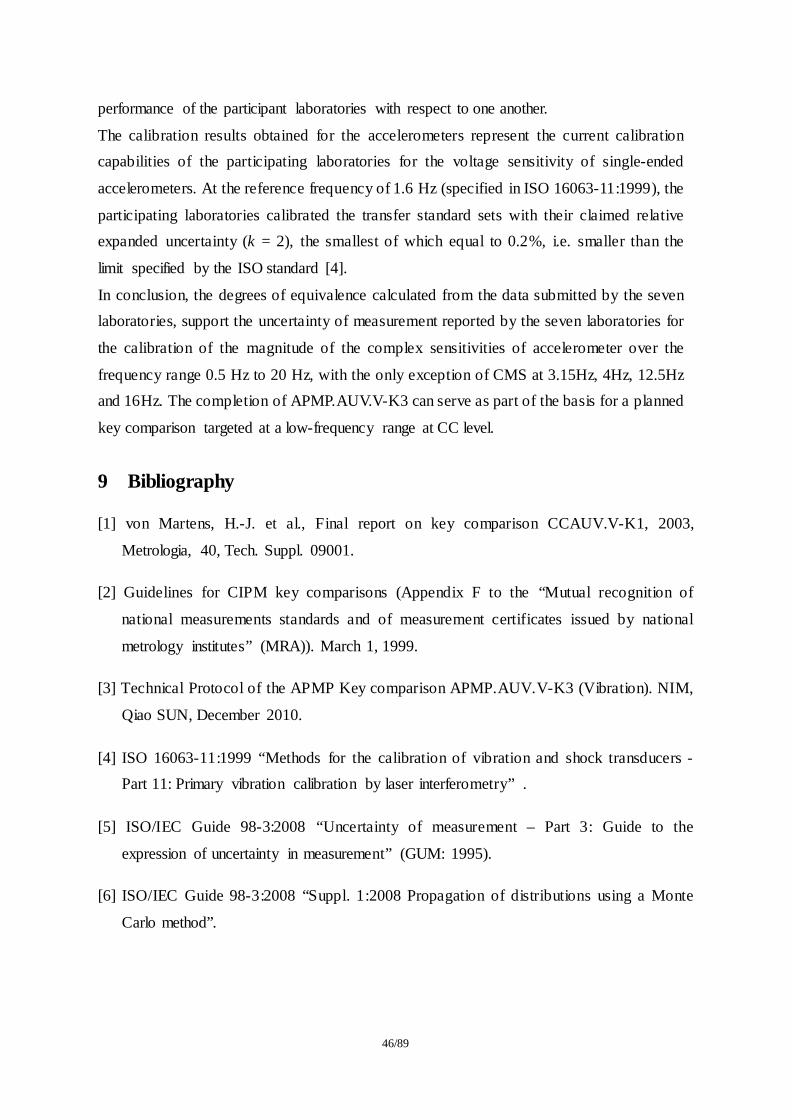
performance of the participant laboratories with respect to one another.
The calibration results obtained for the accelerometers represent the current calibration capabilities of the participating laboratories for the voltage sensitivity of single-ended
accelerometers. At the reference frequency of 1.6 Hz (specified in ISO 16063-11:1999), the
participating laboratories calibrated the transfer standard sets with their claimed relative expanded uncertainty (k = 2), the smallest of which equal to 0.2%, i.e. smaller than the
limit specified by the ISO standard [4].
In conclusion, the degrees of equivalence calculated from the data submitted by the seven laboratories, support the uncertainty of measurement reported by the seven laboratories for
the calibration of the magnitude of the complex sensitivities of accelerometer over the
frequency range 0.5 Hz to 20 Hz, with the only exception of CMS at 3.15Hz, 4Hz, 12.5Hz and 16Hz. The completion of APMP.AUV.V-K3 can serve as part of the basis for a planned
key comparison targeted at a low-frequency range at CC level.
9 Bibliography
[1] von Martens, H.-J. et al., Final report on key comparison CCAUV.V-K1, 2003,
Metrologia, 40, Tech. Suppl. 09001.
[2] Guidelines for CIPM key comparisons (Appendix F to the “Mutual recognition of
national measurements standards and of measurement certificates issued by national
metrology institutes” (MRA)). March 1, 1999.
[3] Technical Protocol of the APMP Key comparison APMP.AUV.V-K3 (Vibration). NIM,
Qiao SUN, December 2010.
[4] ISO 16063-11:1999 “Methods for the calibration of vibration and shock transducers - Part 11: Primary vibration calibration by laser interferometry” .
[5] ISO/IEC Guide 98-3:2008 “Uncertainty of measurement – Part 3: Guide to the
expression of uncertainty in measurement” (GUM: 1995).
[6] ISO/IEC Guide 98-3:2008 “Suppl. 1:2008 Propagation of distributions using a Monte
Carlo method”.

47/89
Appendix A: Technical Protocol National Institute of Metrology (NIM) December 10th, 2010 (participants revised)
Mr. Qiao SUN
Technical Protocol of the APMP Key Comparison
APMP.AUV.V-K3
1 Task and Purpose of the Comparison
According to the rules set up by the CIPM MRA the consultative committees of the CIPM
have the responsibility to establish ‘degrees of equivalence’ (DoE) between the different
measurement standards operated by the national NMIs. This is done by conducting key comparisons (KC) on different levels of the international metrological infrastructure. The
previous top level KC in the field of Vibration metrology, CCAUV.V-K1 was completed in
the year 2001 in the frequency range from 40 Hz to 5 kHz. The ongoing CCAUV.V-K2 is aimed at frequency range from 10 Hz to 10 kHz.
However, recent developments in technology and improvements at the NMIs have extended
the low-frequency vibration limit of calibration capabilities down to 0.5 Hz and even 0.1 Hz. Therefore during the meeting of APMP TCAUV in 2008, the decision was taken to make
preparations for a further comparison targeted at a low-frequency range.
In the field of vibration, this regional key comparison is organized in order to compare measurements of sinusoidal linear accelerations in the frequency range from 0.5 Hz to 20 Hz.
Moreover, the magnitude of the complex sensitivity calibration and measurement
capabilities (CMCs) of the participating laboratories for accelerometer calibration are to be examined and compared. It is the task of the comparison to measure the magnitude of the
complex sensitivity of two accelerometer standard sets (one set including a quartz- flexure
servo accelerometer of single-ended type and a signal conditioner) at different frequencies with acceleration amplitudes as specified in section 3. The results of this APMP Comparison
will, after approval by CCAUV, serve as the foundation at low vibration frequency for the
registration of ‘calibration and measurement capabilities’ (CMC) in the framework of the CIPM MRA.
The voltage sensitivity is calculated as the ratio of the amplitude of the accelerometer

48/89
standard set output voltage to the amplitude of the acceleration at its reference surface. The
magnitude of the complex voltage sensitivity shall be given in milli volt per meter per second squared (mV/(m/s²)) for the different measurement conditions specified in section 4.
For the calibration of the accelerometer standard sets, laser interferometry in compliance
with method 1 or method 3 of the international standard ISO 16063-11:1999 has to be applied, in order to cover the entire frequency range.
The reported sensitivities and associated uncertainties will be used for the calculation of the
key comparison reference value.
2 Pilot Laboratory
Pilot laboratory for this regional key comparison is
Vibration and Shock Section
Mechanics and Acoustics Metrology Division
National Institute of Metrology, P.R. China BeiSanHuanDongLu 18, ChaoYang District, 100013 Beijing, P.R. China
This is the delivery address for the set of artefacts and the written and signed reports.
Contact Persons are
SUN Qiao YANG Lifeng
Tel.: +86 10 64524623 Tel.: +86 10 64524606
e-mail: [email protected] e-mail: [email protected]
Fax: +86 10 64218628
Co-Pilot laboratory for this regional key comparison is
National Metrology Institute of South Africa Private Bag X34, Lynnwood ridge 0040, South Africa
Contact Persons are

49/89
CS Veldman ML Temba
Tel.: +27 12 841 4008 Tel.: +27 12 841 4341
e-mail: [email protected] e-mail: [email protected]
Fax: +27 86 509 0831
3 Device under Test and Measurement Conditions
For the calibration task of this comparison two quartz-flexure accelerometer sets will be
circulated between the participating laboratories. The accelerometer sets are a ‘single ended’
(SE) type, namely a SA 704 (SN: 1022) and a SA 704 (SN: 1022), with one common signal conditioner MSA-I (SN: 02011001).
The accelerometer sets are to be calibrated of their complex voltage sensitivity according to
those procedures and conditions implemented by the laboratory in conformance with ISO 16063-11 which provides magnitude information of the artefact. The sensitivities reported
shall be for the accelerometer sets, including all effects from the signal conditioner.
The frequency range of the measurements was agreed to be from 0.5 Hz to 20 Hz. Specifically the laboratories are supposed to measure at the following frequencies (all values
in Hz).
0.5, 0.63, 0.8, 1, 1.25, 1.6, 2, 2.5, 3.15, 4, 5, 6.3, 8, 10, 12.5, 16, 20.
The measurement conditions should be kept according to the laboratory's standard conditions
for calibration of customers’ accelerometers for claiming their best measurement capability
or CMC where applicable. This presumes that these conditions comply with those defined by the applicable ISO documentary standards [1,2,3], simultaneously.
Specific conditions for the measurements of this comparison are:
• acceleration amplitudes: a range of 0.1 m/s2 to 10 m/s2 is admissible. • ambient temperature and accelerometer temperature during the calibration:
(23 ± 2) ºC (actual values to be stated within tolerances of ± 0.3 ºC). • relative humidity: max. 75 % RH

50/89
4 Circulation Type, Schedule and Transportation
The transducer sets are circulated in a star type fashion with a measurement period of two weeks provided for each participating laboratory and one week for the pilot laboratory. At
the beginning and the end of the circulation as well as between certain subsequent
measurements of participating laboratories, the transducer sets are measured at the pilot laboratory in order to fix reference values and to monitor the stability of the transducer sets.
The schedule is planned as follows:
Participant Measurement (calendar week)
Transportation to next
Participant (calendar week)
NIM 23/2011 24/2011
NMIJ 25-26/2011 27/2011
KRISS 28-29/2011 30/2011
NIM 31/2011 32/2011
NIMT 33-34/2011 35/2011
CMS 36-37/2011 38/2011
NIM 39/2011 40/2011
NMIA 41-42/2011 43/2011
NMISA 44-45/2011 46/2011
NIM 47/2011
The cost of transportation to the next participating laboratory shall be covered by the
participating laboratory. The transducer sets have to be sent hand-carried with great caution. In case the transducer sets get damaged or lost during transportation, the participating
laboratory for delivery should pay 4 000,- € to pilot laboratory for each set.
5 Measurement and Analysis Instructions
The participating laboratories have to observe the following instructions:
• The motion of the quartz- flexure accelerometer should be measured on the moving part
of the vertical (preferably) or horizontal vibration exciter, close to the accelerometer's mounting surface, since the mounting (reference) surface is usually not directly

51/89
accessible.
• The mounting surface of the accelerometer and the moving part of the exciter must be slightly lubricated before mounting.
• The cable between accelerometer and signal conditioner should be taken from the set
delivered to the laboratory. • In order to reduce the influence of non-rectilinear motion, the measurements should be
performed for at least three different laser positions which are symmetrically distributed
over the respective measurement surface. • It is advised that the measurement results should be compiled from complete
measurement series carried out at different days under nominally the same conditions,
except that the accelerometer is remounted and the cable re-attached. The standard deviation of the subsequent measurements should be included in the report.
6 Communication of the Results to Pilot Laboratory
Each participating laboratory will submit one printed and signed calibration report for each accelerometer set to the pilot laboratory including the following:
• a description of the calibration systems used for the comparison and the mounting
techniques for the accelerometer • a description of the calibration methods used
• documented record of the ambient conditions during measurements
• the calibration results, including the relative expanded measurement uncertainty, and the applied coverage factor for each value
• a detailed uncertainty budget for the system covering all components of measurement
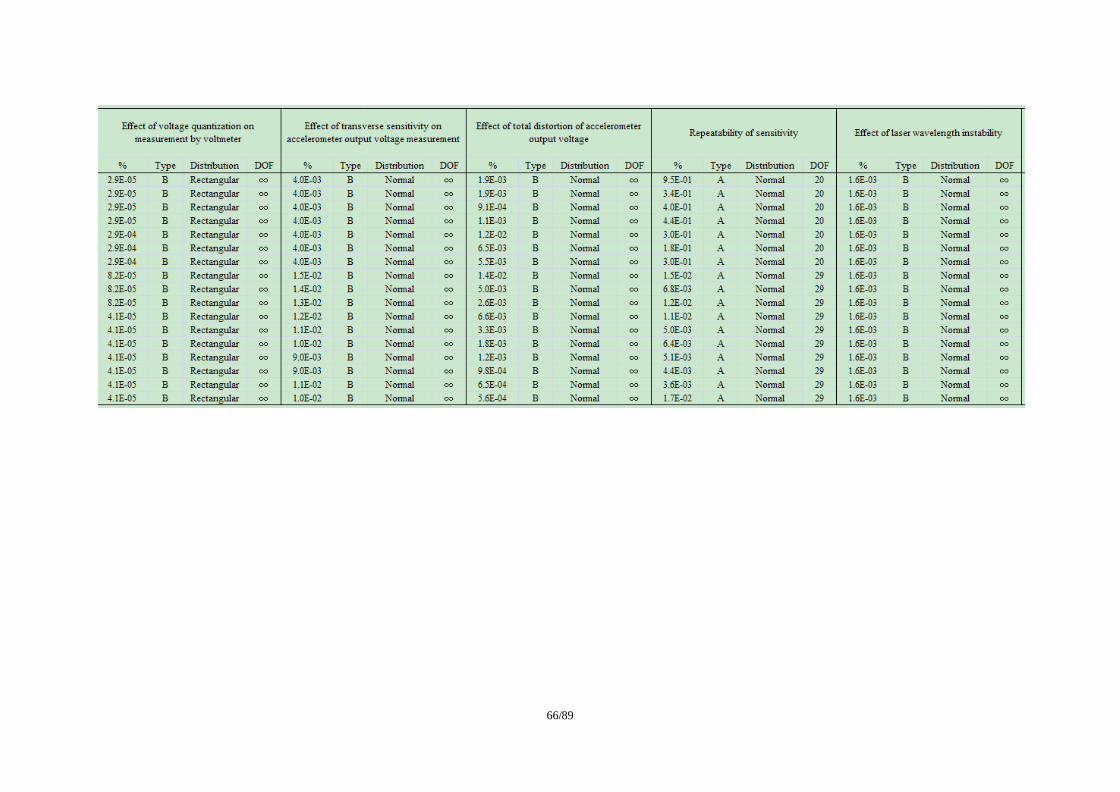
uncertainty (calculated according to GUM [4,5]). Including, among others, information on the type of uncertainty (A or B), assumed distribution function and repeatability
component.
In addition, the use of the electronic spreadsheets for reporting is mandatory. The consistency between the results in electronic form and the printed and signed calibration
report is the responsibility of the participating laboratory. The data submitted in the
electronic spreadsheet shall be deemed the official results submitted for the comparison.
The results have to be submitted to the pilot laboratory within six weeks after the
measurements have been completed.

52/89
The pilot laboratory will submit its set of results to the executive secretary of CCAUV in
advance to the first measurement of the participating laboratory.
7 Remarks on post processing
Presuming consistency of the results, the comparison reference value will be calculated
according to the established methods agreed upon already for CCAUV.V-K1. The results of this APMP comparison will serve as the foundation of the registration of ‘calibration and
measurement capabilities’ (CMC) for low-frequency vibration by the participating NMIs in
the framework of the CIPM MRA.
References
[1] ISO 16063-1:1998 ‘Methods for the calibration of vibration and shock transducers -- Part
1: Basic concepts
[2] ISO 16063-11:1999 ‘Methods for the calibration of vibration and shock transducers--
Part 11: Primary vibration calibration by laser interferometry’
[3] ISO/IEC 17025:2005 ‘General requirements for the competence of testing and calibration laboratories’
[4] ISO/IEC Guide 98-3:2008 ‘Uncertainty of measurement -- Part 3: Guide to the
expression of uncertainty in measurement (GUM:1995)
[5] ISO/IEC Guide 98-3:2008/Suppl 1:2008 ‘Propagation of distributions using a Monte
Carlo method’

53/89
Appendix B: Uncertainty Budgets of the participants NIM (self-developed shakers):

54/89
NIMT (APS 113 shaker):
55/89

56/89
DETAIL OF UNCERTAINTY BUDGET FOR MAGNITUDE CALIBRATION
Type Source of Uncertainty
Symbol
Probability
Distribution Divisor Ci u(xi) ϒeff
B Vibration velocity
(uncertainty of tracing back) 1U normal 2 1
21U ∞
B Voltage xU 2U normal 2 1 2
2U ∞
B Angular frequency of v
signal 3U square 3 1
33U
∞
B Amplifier gain 4U normal 2 1 2
4U ∞
B Frequency response 5U normal 2 1 2
5U ∞
B Transverse motion 6U square 3 1 36U
∞
B Harmonics 7U square 3 1 37U
∞
B Hum 8U normal 2 1 2
8U ∞
B Noise 9U normal 2 1 2
9U ∞
B Effect of geometric location 10U square 3 1 310U
∞
B Sensor attachment 11U square 3 1 311U
∞
B Cable routing and fixing 12U square 3 1 312U
∞
B Relative motion 13U square 3 1 313U
∞
B Temperature change 14U square 3 1 314U
∞

57/89
B Linearity 15U square 3 1 315U
∞
B Temporal instability of v
signal 16U square 3 1
316U
∞
B Residual effects 17U square 3 1 317U
∞
A Repeatability U18 normal 1 1 n
U17 n
Combined Uncertainty cU normal
Expanded Uncertainty eU normal
( )2=k
Approved Uncertainty U

58/89
CMS (APS 113 shaker):

59/89

60/89

61/89

62/89
NMIA (APS 113 shaker):

63/89

64/89
NMISA (APS 113 shaker):

65/89
NMIJ (self-developed shakers):
66/89

67/89

68/89

69/89

70/89

71/89
KRISS (APS 129 shaker): Uncertainty budget of the modulus of the voltage sensitivity of standard accelerometer (SA-704 S/N1021).
Freq. Accel. Relative standard uncertainty % uc(S) U(S)
Hz m/s2 u1 u2 u3 u4 u5 u6 u7 u8 u9 u10 u11 u12 % % (k=2)
0.5 0.4 0.12 0.06 0.12 0.00 0.00 0.00 0.01 0.12 0.00 0.00 0.00 0.10 0.24 0.47
0.63 0.6 0.09 0.03 0.12 0.00 0.00 0.00 0.01 0.10 0.00 0.00 0.00 0.09 0.20 0.40
0.8 0.8 0.06 0.02 0.08 0.00 0.00 0.00 0.01 0.05 0.00 0.00 0.00 0.09 0.14 0.28
1 1.6 0.02 0.01 0.07 0.00 0.00 0.00 0.01 0.07 0.00 0.00 0.00 0.18 0.21 0.42
1.25 2.0 0.02 0.00 0.06 0.00 0.00 0.00 0.01 0.04 0.00 0.00 0.00 0.12 0.14 0.28
1.6 2.5 0.01 0.00 0.05 0.00 0.00 0.00 0.01 0.04 0.00 0.00 0.00 0.19 0.20 0.40
2 6.0 0.03 0.01 0.06 0.00 0.00 0.00 0.00 0.10 0.00 0.00 0.00 0.08 0.15 0.29
2.5 6.0 0.03 0.00 0.06 0.00 0.00 0.00 0.00 0.07 0.00 0.00 0.00 0.08 0.13 0.26
3.15 7.1 0.02 0.00 0.05 0.00 0.00 0.00 0.00 0.09 0.00 0.00 0.00 0.08 0.14 0.27
4 6.1 0.02 0.00 0.05 0.00 0.00 0.00 0.01 0.09 0.00 0.00 0.00 0.09 0.14 0.28
5 5.4 0.01 0.01 0.05 0.00 0.00 0.00 0.01 0.09 0.00 0.00 0.00 0.10 0.15 0.29
6.3 5.0 0.01 0.01 0.05 0.00 0.00 0.00 0.01 0.09 0.00 0.00 0.00 0.09 0.14 0.29
8 5.0 0.01 0.01 0.06 0.00 0.00 0.00 0.02 0.10 0.00 0.00 0.00 0.09 0.15 0.30
10 5.0 0.01 0.01 0.05 0.00 0.00 0.00 0.02 0.11 0.00 0.00 0.00 0.09 0.16 0.31
12.5 5.0 0.01 0.01 0.05 0.01 0.00 0.00 0.03 0.11 0.00 0.00 0.00 0.08 0.15 0.31
16 4.0 0.01 0.01 0.05 0.01 0.00 0.00 0.04 0.09 0.00 0.00 0.00 0.08 0.14 0.29
20 5.0 0.01 0.01 0.05 0.01 0.00 0.00 0.04 0.12 0.00 0.00 0.00 0.06 0.15 0.30

72/89
Uncertainty budget of the modulus of the voltage sensitivity of standard accelerometer (SA-704 S/N1022).
Freq. Accel. Relative standard uncertainty % uc(S) U(S)
Hz m/s2 u1 u2 u3 u4 u5 u6 u7 u8 u9 u10 u11 u12 % % (k=2)
0.5 0.4 0.12 0.07 0.12 0.00 0.00 0.00 0.01 0.14 0.00 0.00 0.00 0.11 0.25 0.50
0.63 0.6 0.10 0.03 0.12 0.00 0.00 0.00 0.01 0.10 0.00 0.00 0.00 0.09 0.20 0.40
0.8 0.8 0.06 0.02 0.08 0.00 0.00 0.00 0.01 0.05 0.00 0.00 0.00 0.08 0.14 0.28
1 1.6 0.02 0.01 0.07 0.00 0.00 0.00 0.01 0.07 0.00 0.00 0.00 0.11 0.15 0.30
1.25 2.0 0.02 0.00 0.06 0.00 0.00 0.00 0.01 0.04 0.00 0.00 0.00 0.15 0.17 0.33
1.6 2.5 0.01 0.00 0.05 0.00 0.00 0.00 0.01 0.04 0.00 0.00 0.00 0.14 0.15 0.30
2 6.0 0.03 0.01 0.06 0.00 0.00 0.00 0.00 0.11 0.00 0.00 0.00 0.08 0.15 0.30
2.5 6.0 0.03 0.00 0.05 0.00 0.00 0.00 0.00 0.08 0.00 0.00 0.00 0.08 0.13 0.26
3.15 7.1 0.02 0.00 0.05 0.00 0.00 0.00 0.00 0.10 0.00 0.00 0.00 0.08 0.14 0.28
4 6.1 0.02 0.00 0.05 0.00 0.00 0.00 0.01 0.09 0.00 0.00 0.00 0.09 0.15 0.29
5 5.4 0.01 0.01 0.05 0.00 0.00 0.00 0.01 0.10 0.00 0.00 0.00 0.10 0.15 0.30
6.3 5.0 0.01 0.01 0.05 0.00 0.00 0.00 0.01 0.10 0.00 0.00 0.00 0.09 0.15 0.29
8 5.0 0.01 0.01 0.06 0.00 0.00 0.00 0.02 0.11 0.00 0.00 0.00 0.09 0.15 0.31
10 5.0 0.01 0.01 0.05 0.00 0.00 0.00 0.02 0.11 0.00 0.00 0.00 0.09 0.16 0.31
12.5 5.0 0.01 0.01 0.05 0.00 0.00 0.00 0.03 0.12 0.00 0.00 0.00 0.10 0.16 0.33
16 4.0 0.01 0.01 0.05 0.00 0.00 0.00 0.04 0.10 0.00 0.00 0.00 0.10 0.16 0.31
20 5.0 0.01 0.01 0.05 0.00 0.00 0.00 0.04 0.12 0.00 0.00 0.00 0.08 0.16 0.32

73/89
Uncertainty components and descriptions for the calibration of standard accelerometers (SA-704).
Symbol Uncertainty source and description Type Distribution
function
u1 Voltage: accelerometer output voltage measurement(voltmeter) B rectangular
u2 Voltage: effect of total distortion and noise on accelerometer output voltage measurement B rectangular
u3 Voltage: transverse motion measurement, etc. B rectangular
u4 Displacement: quantization error of laser interferometer, quantization error of ratio counter B triangular
Displacement: counter calibration B normal
u5 Displacement: trigger hysteresis B rectangular
u6 Displacement: filtering effect B rectangular
u7 Displacement: voltage disturbance B rectangular
u8 Displacement: vibration distortion B rectangular
u9 Displacement: phase disturbance B rectangular
u10 Displacement: He-Ne laser stability, misalignment B triangular
u11 Frequency: function generator stability B rectangular
Frequency: function generator calibration B normal
u12 Sensitivity: repeatability A normal
Sensitivity: deviation of the subsequent measurements, excitation direction etc. B rectangular

74/89
Appendix C: Degrees of equivalence relative to the KCRV Results of horizontal voltage sensitivities of the SE-1021: Frequency→ 0.5 Hz 0.63 Hz 0.8 Hz 1 Hz 1.25 Hz 1.6 Hz
Di Ui Di Ui Di Ui Di Ui Di Ui Di Ui Lab i↓ in mV/(m/s2)•10-2 in mV/(m/s2)•10-2 in mV/(m/s2)•10-2 in mV/(m/s2)•10-2 in mV/(m/s2)•10-2 in mV/(m/s2)•10-2
NIM 16.9 19.6 13.9 19.7 12.5 20.2 6.3 19.6 6.5 20.2 6.7 20.0 CMS 53.9 336.3 87.9 337.2 80.5 299.4 122.3 287.8 94.5 287.1 125.7 287.8 NMIA -8.1 19.5 -5.1 19.6 -4.5 20.2 -3.7 19.6 -2.5 20.2 -2.3 20.0
NMISA -26.1 33.9 -22.1 33.9 -19.5 34.3 -7.7 33.9 -5.5 34.3 -4.3 34.2 NMIJ 64.9 249.1 -19.1 98.0 -24.5 98.0 -16.7 110.5 -29.5 85.4 -25.3 60.1
KRISS 10.9 60.2 10.9 60.2 3.5 34.3 5.3 60.2 0.5 34.3 2.7 47.4

75/89
Results of horizontal voltage sensitivities of the SE-1021 (continued): Frequency→ 2 Hz 2.5 Hz 3.15 Hz 4 Hz 5 Hz 6.3 Hz
Di Ui Di Ui Di Ui Di Ui Di Ui Di Ui Lab i↓ in mV/(m/s2)•10-2 in mV/(m/s2)•10-2 in mV/(m/s2)•10-2 in mV/(m/s2)•10-2 in mV/(m/s2)•10-2 in mV/(m/s2)•10-2
NIM 5.7 20.2 5.6 20.1 6.7 20.4 4.1 20.4 6.3 20.4 6.0 20.4 CMS 62.7 286.4 33.6 273.3 34.7 60.6 71.1 60.8 32.3 60.6 52.0 60.7 NMIA -5.3 20.2 -5.4 20.1 -4.3 20.3 -7.9 20.3 -6.7 20.3 -6.0 20.3
NMISA -7.3 34.3 -6.4 34.2 -15.3 34.3 -8.9 34.4 -7.7 34.4 -8.0 34.4 NMIJ -19.3 85.5
KRISS 8.7 34.4 5.6 34.3 -2.3 34.4 -7.9 34.4 -2.7 34.4 -11.0 34.4
Frequency→ 8 Hz 10 Hz 12.5 Hz 16 Hz 20 Hz Di Ui Di Ui Di Ui Di Ui Di Ui
Lab i↓ in mV/(m/s2)•10-2 in mV/(m/s2)•10-2 in mV/(m/s2)•10-2 in mV/(m/s2)•10-2 in mV/(m/s2)•10-2
NIM 6.2 20.0 9.5 20.0 4.0 20.2 7.3 20.4 9.7 20.4 CMS 50.2 60.5 16.5 60.4 59.0 47.8 72.3 60.9 49.7 60.8 NMIA -6.8 20.0 -7.5 20.0 -10.0 20.2 -7.7 20.4 -7.3 20.4
NMISA -9.8 34.2 -3.5 34.2 -11.0 34.3 -17.7 34.4 -10.3 34.5 NMIJ
KRISS -11.8 47.4 -12.5 47.4 -16.0 47.5 -7.7 34.4 -13.3 34.5

76/89
Results of vertical voltage sensitivities of the SE-1021: Frequency→ 0.5 Hz 0.63 Hz 0.8 Hz 1 Hz 1.25 Hz 1.6 Hz
Di Ui Di Ui Di Ui Di Ui Di Ui Di Ui Lab i↓ in mV/(m/s2)•10-2 in mV/(m/s2)•10-2 in mV/(m/s2)•10-2 in mV/(m/s2)•10-2 in mV/(m/s2)•10-2 in mV/(m/s2)•10-2
NIM 1.1 7.9 1.0 7.9 0.9 7.9 0.6 9.2 0.4 9.2 0.4 9.2 NIMT -9.9 70.6 -9.0 70.6 -8.1 70.6 -3.4 57.6 -2.6 57.6 -2.6 57.6
Frequency→ 2 Hz 2.5 Hz 3.15 Hz 4 Hz 5 Hz 6.3 Hz Di Ui Di Ui Di Ui Di Ui Di Ui Di Ui
Lab i↓ in mV/(m/s2)•10-2 in mV/(m/s2)•10-2 in mV/(m/s2)•10-2 in mV/(m/s2)•10-2 in mV/(m/s2)•10-2 in mV/(m/s2)•10-2
NIM 0.6 9.2 7.4 15.3 6.0 15.2 5.1 15.2 4.8 15.9 3.6 15.9 NIMT -3.4 57.6 2.4 58.9 1.0 58.9 1.1 58.9 2.8 45.8 2.6 45.8 NMIJ -17.6 31.6 -14.0 31.6 -11.9 31.6 -12.2 31.9 -9.4 31.9
Frequency→ 8 Hz 10 Hz 12.5 Hz 16 Hz 20 Hz Di Ui Di Ui Di Ui Di Ui Di Ui
Lab i↓ in mV/(m/s2)•10-2 in mV/(m/s2)•10-2 in mV/(m/s2)•10-2 in mV/(m/s2)•10-2 in mV/(m/s2)•10-2
NIM 3.7 15.9 3.0 15.9 2.4 15.9 2.9 15.9 2.2 15.9 NIMT 1.7 45.8 2.0 45.9 2.4 45.9 0.9 45.9 1.2 45.9 NMIJ -9.3 31.9 -8.0 32.0 -6.6 32.0 -7.1 32.0 -5.8 32.0

77/89
Results of horizontal voltage sensitivities of the SE-1022: Frequency→ 0.5 Hz 0.63 Hz 0.8 Hz 1 Hz 1.25 Hz 1.6 Hz
Di Ui Di Ui Di Ui Di Ui Di Ui Di Ui Lab i↓ in mV/(m/s2)•10-2 in mV/(m/s2)•10-2 in mV/(m/s2)•10-2 in mV/(m/s2)•10-2 in mV/(m/s2)•10-2 in mV/(m/s2)•10-2
NIM 17.1 19.5 15.0 19.7 12.7 20.2 8.2 19.8 6.9 19.9 9.5 20.2 CMS 87.1 324.4 92.0 336.9 83.7 311.7 117.2 287.3 89.9 286.7 110.5 287.1 NMIA -8.9 19.5 -5.0 19.6 -5.3 20.2 -2.8 19.7 -1.1 19.8 -1.5 20.1
NMISA -22.9 33.8 -18.0 33.9 -16.3 34.2 -12.8 34.0 -10.1 34.0 -9.5 34.2 NMIJ -0.9 247.6 -35.0 85.2 -15.3 98.0 -19.8 122.8 -23.1 85.3 -21.5 47.3
KRISS 9.1 60.1 3.0 60.1 0.7 34.3 1.2 47.3 -0.1 47.3 2.5 47.4

78/89
Results of horizontal voltage sensitivities of the SE-1022 (continued): Frequency→ 2 Hz 2.5 Hz 3.15 Hz 4 Hz 5 Hz 6.3 Hz
Di Ui Di Ui Di Ui Di Ui Di Ui Di Ui Lab i↓ in mV/(m/s2)•10-2 in mV/(m/s2)•10-2 in mV/(m/s2)•10-2 in mV/(m/s2)•10-2 in mV/(m/s2)•10-2 in mV/(m/s2)•10-2
NIM 7.2 20.2 7.0 20.1 4.0 20.3 6.8 20.3 8.3 20.3 8.8 20.3 CMS 78.2 286.5 38.0 273.1 94.0 73.6 76.8 73.4 17.3 60.4 17.8 60.4 NMIA -3.8 20.2 -5.0 20.0 -9.0 20.2 -6.2 20.2 -5.7 20.3 -5.2 20.3
NMISA -11.8 34.3 -12.0 34.2 -6.0 34.3 -13.2 34.3 -2.7 34.4 -2.2 34.4 NMIJ -35.8 85.3
KRISS 9.2 34.3 7.0 34.2 -6.0 34.3 -7.2 34.3 -9.7 34.3 -12.2 34.3
Frequency→ 8 Hz 10 Hz 12.5 Hz 16 Hz 20 Hz Di Ui Di Ui Di Ui Di Ui Di Ui
Lab i↓ in mV/(m/s2)•10-2 in mV/(m/s2)•10-2 in mV/(m/s2)•10-2 in mV/(m/s2)•10-2 in mV/(m/s2)•10-2
NIM 8.5 20.0 9.4 20.0 8.8 20.0 6.5 20.0 10.8 20.1 CMS 24.5 60.3 58.4 60.5 37.8 60.4 66.5 60.6 36.8 60.5 NMIA -6.5 20.0 -9.6 20.0 -6.2 20.0 -8.5 20.0 -7.2 20.0
NMISA -5.5 34.2 -11.6 34.1 -12.2 34.1 -13.5 34.2 -13.2 34.2 NMIJ
KRISS -13.5 47.3 -15.6 47.3 -13.2 47.3 -10.5 47.4 -14.2 47.4

79/89
Results of vertical voltage sensitivities of the SE-1022: Frequency→ 0.5 Hz 0.63 Hz 0.8 Hz 1 Hz 1.25 Hz 1.6 Hz
Di Ui Di Ui Di Ui Di Ui Di Ui Di Ui Lab i↓ in mV/(m/s2)•10-2 in mV/(m/s2)•10-2 in mV/(m/s2)•10-2 in mV/(m/s2)•10-2 in mV/(m/s2)•10-2 in mV/(m/s2)•10-2
NIM 1.0 7.8 1.2 7.9 1.2 7.9 0.8 9.2 0.6 9.2 0.6 9.2 NIMT -9.0 70.5 -10.8 70.5 -10.8 70.5 -5.2 57.5 -3.4 57.5 -3.4 57.5
Frequency→ 2 Hz 2.5 Hz 3.15 Hz 4 Hz 5 Hz 6.3 Hz Di Ui Di Ui Di Ui Di Ui Di Ui Di Ui
Lab i↓ in mV/(m/s2)•10-2 in mV/(m/s2)•10-2 in mV/(m/s2)•10-2 in mV/(m/s2)•10-2 in mV/(m/s2)•10-2 in mV/(m/s2)•10-2
NIM 0.7 9.2 8.0 15.2 6.3 15.2 5.8 15.2 4.9 15.9 4.0 15.9 NIMT -4.3 57.5 3.0 58.8 1.3 58.8 0.8 58.8 1.9 45.8 2.0 45.8 NMIJ -19.0 31.5 -14.7 31.6 -13.2 31.6 -12.1 31.9 -10.0 31.9
Frequency→ 8 Hz 10 Hz 12.5 Hz 16 Hz 20 Hz Di Ui Di Ui Di Ui Di Ui Di Ui
Lab i↓ in mV/(m/s2)•10-2 in mV/(m/s2)•10-2 in mV/(m/s2)•10-2 in mV/(m/s2)•10-2 in mV/(m/s2)•10-2
NIM 3.4 15.9 3.0 15.9 2.9 15.9 2.1 15.9 1.7 15.9 NIMT 1.4 45.8 2.0 45.8 0.9 45.8 2.1 45.8 2.7 45.9 NMIJ -8.6 31.9 -8.0 31.9 -7.1 31.9 -5.9 32.0 -5.3 32.0
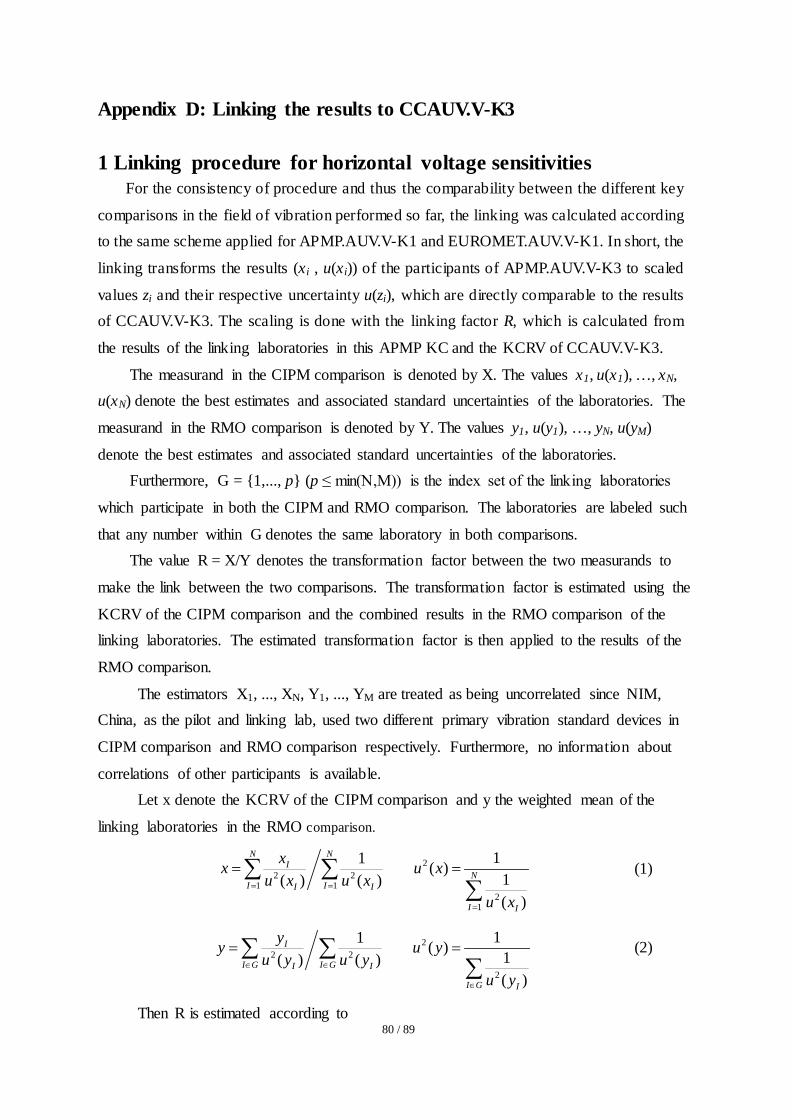
80 / 89
Appendix D: Linking the results to CCAUV.V-K3
1 Linking procedure for horizontal voltage sensitivities For the consistency of procedure and thus the comparability between the different key
comparisons in the field of vibration performed so far, the linking was calculated according to the same scheme applied for APMP.AUV.V-K1 and EUROMET.AUV.V-K1. In short, the
linking transforms the results (xi , u(xi)) of the participants of APMP.AUV.V-K3 to scaled
values zi and their respective uncertainty u(zi), which are directly comparable to the results of CCAUV.V-K3. The scaling is done with the linking factor R, which is calculated from
the results of the linking laboratories in this APMP KC and the KCRV of CCAUV.V-K3.
The measurand in the CIPM comparison is denoted by X. The values x1, u(x1), …, xN, u(xN) denote the best estimates and associated standard uncertainties of the laboratories. The
measurand in the RMO comparison is denoted by Y. The values y1, u(y1), …, yN, u(yM)
denote the best estimates and associated standard uncertainties of the laboratories. Furthermore, G = {1,..., p} (p ≤ min(N,M)) is the index set of the linking laboratories
which participate in both the CIPM and RMO comparison. The laboratories are labeled such
that any number within G denotes the same laboratory in both comparisons. The value R = X/Y denotes the transformation factor between the two measurands to
make the link between the two comparisons. The transformation factor is estimated using the
KCRV of the CIPM comparison and the combined results in the RMO comparison of the linking laboratories. The estimated transformation factor is then applied to the results of the
RMO comparison.
The estimators X1, ..., XN, Y1, ..., YM are treated as being uncorrelated since NIM, China, as the pilot and linking lab, used two different primary vibration standard devices in
CIPM comparison and RMO comparison respectively. Furthermore, no information about
correlations of other participants is available. Let x denote the KCRV of the CIPM comparison and y the weighted mean of the
linking laboratories in the RMO comparison.
22 2
1 12
1
11 ( ) 1( ) ( )( )
N NI
NI II I
I I
xx u xu x u x
u x= =
=
= =∑ ∑∑
(1)
22 2
2
11 ( ) 1( ) ( )( )
I
I G I GI I
I G I
yy u yu y u y
u y∈ ∈
∈
= =∑ ∑∑
(2)
Then R is estimated according to

81 / 89
2 22 2
2 4
( ) ( ) + ( ) x u x xr u r u yy y y
= = (3)
Z = RY denotes the corrected measurand in the regional comparison and
2 2 2 2 2
22
( ) ( ) + ( ) 2 ( , ), =1,...,
( ), ( , )
0, otherwise
I I I I I I
I
z ry u z y u r r u y ryu r y I Mx u y I Gyu r y
= = +
− ∈=
(4)
are the corresponding estimates including the associated uncertainties.
The degrees of equivalence are defined as the differences between the corrected results
in the RMO comparison and the KCRV of the CIPM comparison - , =1,...,i id z x i M= (5)
and the standard uncertainties associated with these differences where
2 2 2 ( ) ( ) + 1 2 ( ), =1,...,ii i
zu d u z u x i Mx
= − (6)
Furthermore, the degrees of equivalence between the laboratories of the RMO
comparison and the CIPM comparison are defined as the differences - , =1,..., , =1,...,ij i jd x z i N j M= (7)
and the standard uncertainties associated with these differences where
2 2 2 2 ( ) ( ) + ( ) 2 ( ), =1,..., , =1,...,ji j i j
zu x z u x u z u x i N j M
x− = − (8)
2 Degrees of Equivalence to the CCAUV Reference Value for horizontal voltage sensitivities
The linking laboratories for horizontal voltage sensitivities are NIM, NMIA, NMISA, KRISS and NMIJ for all available measurement results at different frequencies except
measurement result at 20 Hz of KRISS which has not contributed to CCAUV reference
value of CCAUV.V-K3.

82 / 89
Table 1: degrees of equivalence of the participants with respect to the KCRV
of CCAUV.V-K3 for horizontal voltage sensitivities of SE-1021
Frequency→ 0.5 Hz 0.63 Hz 0.8 Hz
Di Ui Di Ui Di Ui
Lab i ↓ in mV/(m/s2)·10-2 in mV/(m/s2)·10-2 in mV/(m/s2)·10-2
NIM 0.19 0.22 0.15 0.22 0.14 0.22 NMIA -0.09 0.21 -0.05 0.22 -0.05 0.22
NMISA -0.28 0.37 -0.25 0.37 -0.21 0.38 KRISS 0.12 0.66 0.12 0.66 0.04 0.38 NMIJ 0.72 2.74 -0.21 1.08 -0.27 1.08 CMS 0.60 3.71 0.97 3.72 0.89 3.30
Frequency→ 1 Hz 1.25 Hz 1.6 Hz
Di Ui Di Ui Di Ui
Lab i ↓ in mV/(m/s2)·10-2 in mV/(m/s2)·10-2 in mV/(m/s2)·10-2
NIM 0.07 0.22 0.07 0.22 0.08 0.22 NMIA -0.04 0.22 -0.03 0.22 -0.02 0.22
NMISA -0.08 0.37 -0.06 0.38 -0.04 0.38 KRISS 0.06 0.66 0.01 0.38 0.03 0.52 NMIJ -0.18 1.22 -0.32 0.94 -0.27 0.66 CMS 1.35 3.18 1.04 3.17 1.39 3.18
Frequency→ 2 Hz 2.5 Hz 3.15 Hz
Di Ui Di Ui Di Ui
Lab i ↓ in mV/(m/s2)·10-2 in mV/(m/s2)·10-2 in mV/(m/s2)·10-2
NIM 0.06 0.22 0.06 0.22 0.10 0.22 NMIA -0.06 0.22 -0.06 0.22 -0.02 0.22
NMISA -0.08 0.38 -0.07 0.38 -0.14 0.38 KRISS 0.10 0.38 0.06 0.38 -0.02 0.38 NMIJ -0.21 0.94 ─ ─ ─ ─ CMS 0.69 3.16 0.37 3.02 0.41 0.70
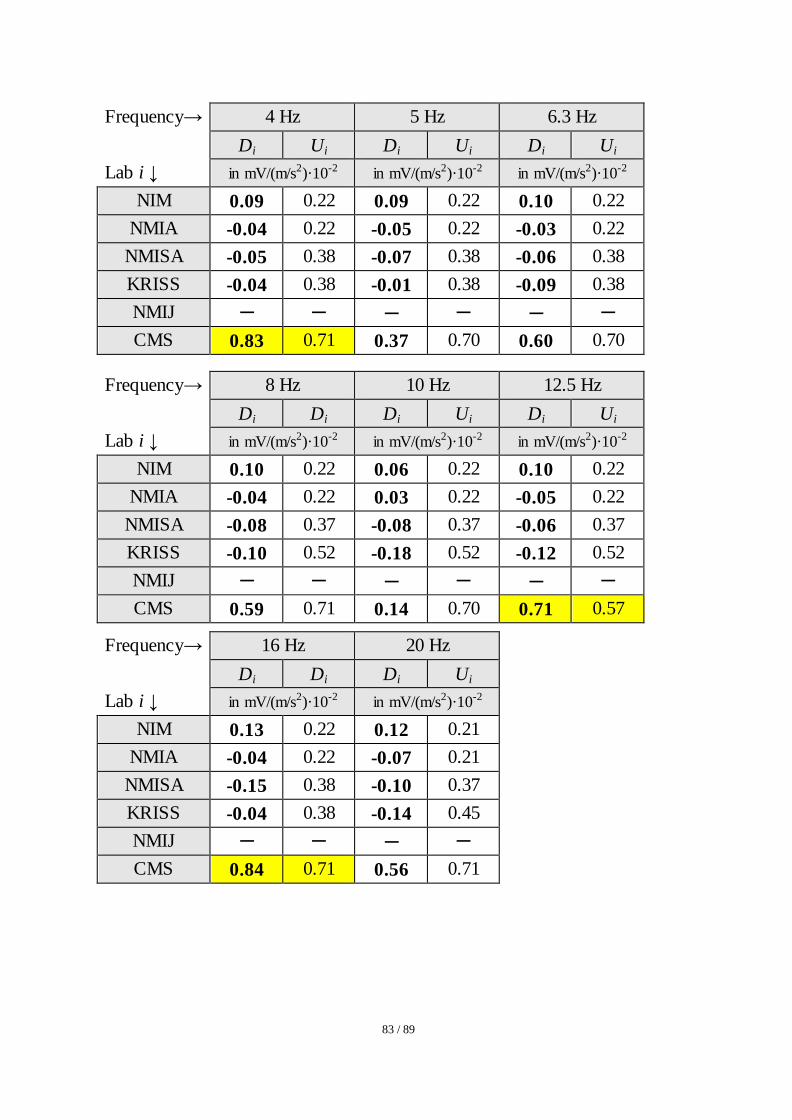
83 / 89
Frequency→ 4 Hz 5 Hz 6.3 Hz
Di Ui Di Ui Di Ui
Lab i ↓ in mV/(m/s2)·10-2 in mV/(m/s2)·10-2 in mV/(m/s2)·10-2
NIM 0.09 0.22 0.09 0.22 0.10 0.22 NMIA -0.04 0.22 -0.05 0.22 -0.03 0.22
NMISA -0.05 0.38 -0.07 0.38 -0.06 0.38 KRISS -0.04 0.38 -0.01 0.38 -0.09 0.38 NMIJ ─ ─ ─ ─ ─ ─ CMS 0.83 0.71 0.37 0.70 0.60 0.70
Frequency→ 8 Hz 10 Hz 12.5 Hz
Di Di Di Ui Di Ui
Lab i ↓ in mV/(m/s2)·10-2 in mV/(m/s2)·10-2 in mV/(m/s2)·10-2
NIM 0.10 0.22 0.06 0.22 0.10 0.22 NMIA -0.04 0.22 0.03 0.22 -0.05 0.22
NMISA -0.08 0.37 -0.08 0.37 -0.06 0.37 KRISS -0.10 0.52 -0.18 0.52 -0.12 0.52 NMIJ ─ ─ ─ ─ ─ ─ CMS 0.59 0.71 0.14 0.70 0.71 0.57
Frequency→ 16 Hz 20 Hz
Di Di Di Ui
Lab i ↓ in mV/(m/s2)·10-2 in mV/(m/s2)·10-2
NIM 0.13 0.22 0.12 0.21 NMIA -0.04 0.22 -0.07 0.21
NMISA -0.15 0.38 -0.10 0.37 KRISS -0.04 0.38 -0.14 0.45 NMIJ ─ ─ ─ ─ CMS 0.84 0.71 0.56 0.71

84 / 89
Table 2: degrees of equivalence of the participants with respect to the KCRV
of CCAUV.V-K3 for horizontal voltage sensitivities of SE-1022
Frequency→ 0.5 Hz 0.63 Hz 0.8 Hz
Di Ui Di Ui Di Ui
Lab i ↓ in mV/(m/s2)·10-2 in mV/(m/s2)·10-2 in mV/(m/s2)·10-2
NIM 0.19 0.22 0.17 0.22 0.14 0.22 NMIA -0.10 0.21 -0.05 0.22 -0.06 0.22
NMISA -0.25 0.37 -0.20 0.37 -0.18 0.38 KRISS 0.10 0.66 0.03 0.66 0.01 0.38 NMIJ -0.01 2.73 -0.38 0.94 -0.17 1.08 CMS 0.96 3.58 1.02 3.72 0.92 3.44
Frequency→ 1 Hz 1.25 Hz 1.6 Hz
Di Ui Di Ui Di Ui
Lab i ↓ in mV/(m/s2)·10-2 in mV/(m/s2)·10-2 in mV/(m/s2)·10-2
NIM 0.09 0.22 0.08 0.22 0.11 0.22 NMIA -0.03 0.22 -0.01 0.22 -0.01 0.22
NMISA -0.14 0.37 -0.11 0.38 -0.10 0.38 KRISS 0.02 0.52 0.00 0.52 0.03 0.52 NMIJ -0.21 1.35 -0.25 0.94 -0.23 0.52 CMS 1.29 3.17 0.99 3.17 1.22 3.17
Frequency→ 2 Hz 2.5 Hz 3.15 Hz
Di Ui Di Ui Di Ui
Lab i ↓ in mV/(m/s2)·10-2 in mV/(m/s2)·10-2 in mV/(m/s2)·10-2
NIM 0.08 0.22 0.08 0.22 0.08 0.22 NMIA -0.04 0.22 -0.05 0.22 -0.06 0.22
NMISA -0.13 0.38 -0.13 0.38 -0.03 0.38 KRISS 0.10 0.38 0.08 0.38 -0.03 0.38 NMIJ -0.39 0.94 ─ ─ ─ ─ CMS 0.86 3.16 0.42 3.02 1.08 0.84

85 / 89
Frequency→ 4 Hz 5 Hz 6.3 Hz
Di Ui Di Ui Di Ui
Lab i ↓ in mV/(m/s2)·10-2 in mV/(m/s2)·10-2 in mV/(m/s2)·10-2
NIM 0.11 0.22 0.10 0.22 0.11 0.22 NMIA -0.04 0.22 -0.05 0.22 -0.05 0.22
NMISA -0.11 0.38 -0.02 0.38 -0.01 0.38 KRISS -0.05 0.38 -0.10 0.38 -0.12 0.38 NMIJ ─ ─ ─ ─ ─ ─ CMS 0.88 0.84 0.20 0.70 0.21 0.70
Frequency→ 8 Hz 10 Hz 12.5 Hz
Di Ui Di Ui Di Ui
Lab i ↓ in mV/(m/s2)·10-2 in mV/(m/s2)·10-2 in mV/(m/s2)·10-2
NIM 0.11 0.22 0.14 0.22 0.12 0.22 NMIA -0.06 0.22 -0.07 0.22 -0.04 0.22
NMISA -0.04 0.37 -0.09 0.37 -0.11 0.37 KRISS -0.13 0.52 -0.13 0.52 -0.12 0.52 NMIJ ─ ─ ─ ─ ─ ─ CMS 0.29 0.70 0.68 0.71 0.44 0.71
Frequency→ 16 Hz 20 Hz
Di Ui Di Ui
Lab i ↓ in mV/(m/s2)·10-2 in mV/(m/s2)·10-2
NIM 0.12 0.22 0.13 0.21 NMIA -0.05 0.22 -0.07 0.21
NMISA -0.11 0.37 -0.14 0.37 KRISS -0.07 0.52 -0.15 0.57 NMIJ ─ ─ ─ ─ CMS 0.78 0.71 0.42 0.71

86 / 89
3 Linking procedure for vertical voltage sensitivities The linking procedure is the same for vertical voltage sensitivities where more than
one linking laboratories are available. Otherwise, the linking procedure follows the
approach used for linking the results of EUROMET.AUV.V-K1.1 to those of CCAUV.V-K1.
The idea is to shift the results of the single linking lab (NIM) in APMP.AUV.V-K3 onto its linked results in CCAUV.V-K3 in order to compensate for the different sensitivities of the
devices under test in the two key comparisons. This shift with the associated uncertainty is
then applied as an additive term to the participant of NIMT for vertical installation direction, in order to make their results comparable to those of CCAUV.V-K3.
Let )( fδ be the difference between the results of the linking lab in APMP.AUV.V-K3
)( fx APMPNIM and its results in CCAUV.V-K3 )( fxCC
NIM for any single frequency f
)()()( fxfxf APMPNIM
CCNIM −=δ (9)
Then the standard uncertainty of this difference is: 222 )()( APMP
NIMCCNIM uuu +=δ (10)
The covariance of the different results of the linking lab is considered negligible in the
above equation.
The degree of equivalence of a participant i of this RMO KC with reference to a participant j of CCAUV.V-K3 is then given by the two values of deviation ijd and
standard uncertainty iju with CCj
APMPiij xxd −+= δ (11)
2222 )()( CCj
APMPiij uuuu ++= δ (12)
The degree of equivalence with respect to the CCAUV.V-K3 reference value (RV) is given by
CCRV
APMPii xxd −+= δ (13)
2 2 2 2( ) ( )APMP CCi i RVu u u uδ= + + (14)
provided that laboratory i is not the linking lab.
4 Degrees of Equivalence to the CCAUV Reference Value for vertical voltage sensitivities
Below 2.5 Hz, NIM is the only linking laboratory for vertical voltage sensitivities.
Otherwise, NIM and NMIJ function as linking laboratories.

87 / 89
Table 3: degrees of equivalence of the participants with respect to the KCRV
of CCAUV.V-K3 for vertical voltage sensitivities of NIMT below 2.5Hz
frequency in Hz
SE-1021 SE-1022 Di Ui Di Ui
in mV/(m/s2)·10-2 in mV/(m/s2)·10-2
0.5 -0.06 0.83 -0.05 0.83 0.63 -0.02 0.83 -0.04 0.83 0.8 -0.05 0.83 -0.08 0.83 1 0.01 0.72 -0.01 0.72
1.25 0.00 0.72 -0.01 0.72 1.6 -0.01 0.72 -0.02 0.72 2 -0.06 0.72 -0.07 0.72
Table 4: degrees of equivalence of the participants with respect to the KCRV
of CCAUV.V-K3 for vertical voltage sensitivities of SE-1021 at other frequencies
Frequency→ 2.5 Hz 3.15 Hz 4 Hz
Di Ui Di Ui Di Ui
Lab i ↓ in mV/(m/s2)·10-2 in mV/(m/s2)·10-2 in mV/(m/s2)·10-2
NIM 0.08 0.15 0.07 0.15 0.06 0.15 NMIJ -0.19 0.34 -0.15 0.34 -0.13 0.34 NIMT 0.03 0.72 0.01 0.72 0.01 0.72
Frequency→ 5 Hz 6.3 Hz 8 Hz
Di Ui Di Ui Di Ui
Lab i ↓ in mV/(m/s2)·10-2 in mV/(m/s2)·10-2 in mV/(m/s2)·10-2
NIM 0.06 0.15 0.04 0.15 0.04 0.15 NMIJ -0.13 0.34 -0.10 0.34 -0.10 0.34 NIMT 0.04 0.59 0.03 0.59 0.02 0.59

88 / 89
Frequency→ 10 Hz 12.5 Hz 16 Hz
Di Ui Di Ui Di Ui
Lab i ↓ in mV/(m/s2)·10-2 in mV/(m/s2)·10-2 in mV/(m/s2)·10-2
NIM 0.04 0.15 0.03 0.15 0.03 0.15 NMIJ -0.08 0.34 -0.07 0.34 -0.08 0.34 NIMT 0.03 0.59 0.03 0.59 0.01 0.59
Frequency→ 20 Hz
Di Ui
Lab i ↓ in mV/(m/s2)·10-2
NIM 0.03 0.15 NMIJ -0.06 0.34 NIMT 0.02 0.59

89 / 89
Table 5: degrees of equivalence of the participants with respect to the KCRV
of CCAUV.V-K3 for vertical voltage sensitivities of SE-1022 at other frequencies
Frequency→ 2.5 Hz 3.15 Hz 4 Hz
Di Ui Di Ui Di Ui
Lab i ↓ in mV/(m/s2)·10-2 in mV/(m/s2)·10-2 in mV/(m/s2)·10-2
NIM 0.09 0.15 0.07 0.15 0.06 0.15 NMIJ -0.21 0.34 -0.16 0.34 -0.14 0.34 NIMT 0.04 0.72 0.02 0.72 0.01 0.72
Frequency→ 5 Hz 6.3 Hz 8 Hz
Di Ui Di Ui Di Ui
Lab i ↓ in mV/(m/s2)·10-2 in mV/(m/s2)·10-2 in mV/(m/s2)·10-2
NIM 0.06 0.15 0.05 0.15 0.04 0.15 NMIJ -0.13 0.34 -0.11 0.34 -0.09 0.34 NIMT 0.02 0.59 0.03 0.59 0.02 0.59
Frequency→ 10 Hz 12.5 Hz 16 Hz
Di Ui Di Ui Di Ui
Lab i ↓ in mV/(m/s2)·10-2 in mV/(m/s2)·10-2 in mV/(m/s2)·10-2
NIM 0.04 0.15 0.03 0.15 0.03 0.15 NMIJ -0.08 0.34 -0.08 0.34 -0.06 0.34 NIMT 0.03 0.59 0.01 0.59 0.03 0.59
Frequency→ 20 Hz
Di Ui
Lab i ↓ in mV/(m/s2)·10-2
NIM 0.02 0.15 NMIJ -0.05 0.34 NIMT 0.03 0.59


![40th meeting of the JCRB - BIPM - BIPM · [The corresponding BIPM presentation is available on the restricted-access JCRB working documents webpage as JCRB-40/03.1.] 3.2. BIPM QMS](https://img.pdfslide.us/doc/110x75/6047869895787e1e9f1920f7/40th-meeting-of-the-jcrb-bipm-bipm-the-corresponding-bipm-presentation-is-available.jpg)