Embed Size (px)
Citation preview
MTH302-Business Mathematics & StatisticsSUBJECTIVE QUESTION FOR FINAL TERM
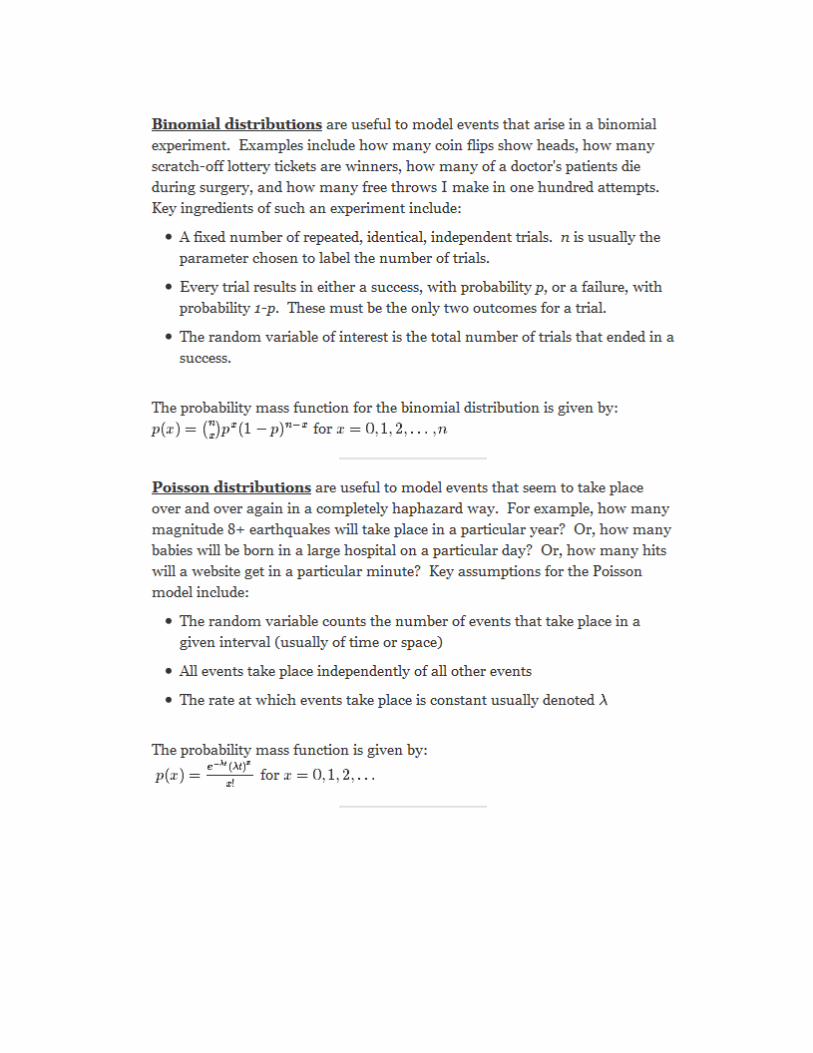
What are the differences between Normal distribution, Binomial Distribution and Poisson distribution?ANSWER:
How many different 5-letter arrangements are there of the letters in the word DIGIT? (Marks: 2)ANSWER:D=1I=2G=1Formula= 5*4*3*2*1 /1*2*1*1120/2= 60
Explain what is meant by confidence interval? (Marks: 2) ANSWER: A range of values so defined that there is a specified probability that the value of a parameter lies within it.Confidence intervals are one way to represent how "good" an estimate is; the larger a 90% confidence interval for a particular estimate, the more caution is required when using the estimate. Confidence intervals are an important reminder of the limitations of the estimates.
Average sale and standard deviation for a store are 17 and 5.5 respectively .Find coefficient of variation. (Marks: 2)ANSWER: cv = s.d/average *100cv=5.5/17*100cv=32.35%
Suppose a coin is flipped 3 times. What is the probability of getting two tails and one head? (Marks: 3)ANSWER: HT total probability is 50 50Now probability of getting 2 tails id 2/3And probability of getting one head is 1/3Now total probability of getting 2 tails and 1 head is 3/6 = ½
Find the probability that in a family of 4 children there will be at least 1 boy. (Marks: 5)ANSWER: (probability of at least boy) +(probability of girls) =1p(boy) = 1- p(girls)p(boy) = 1 - ¾p(boy) = ¼
Define normal distribution? (Marks: 3) ANSWER: a function that represents the distribution of many random variables as a symmetrical bell-shaped graph.
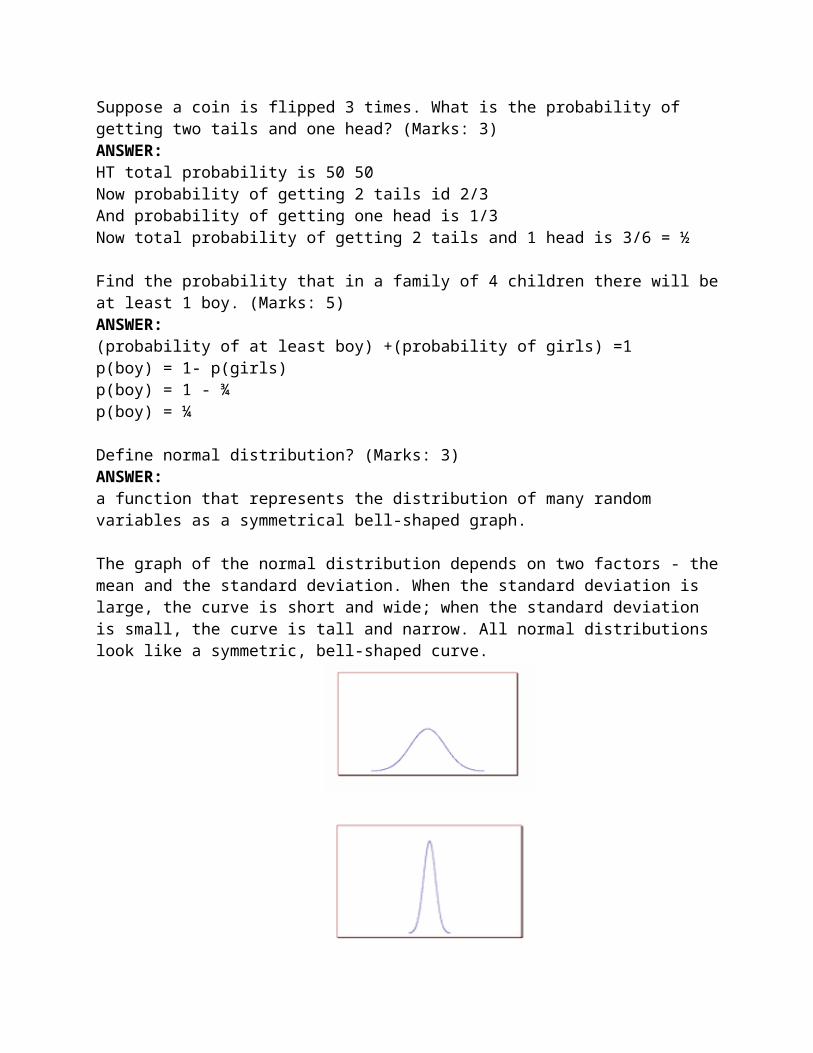
The graph of the normal distribution depends on two factors - the mean and the standard deviation. When the standard deviation is large, the curve is short and wide; when the standard deviation is small, the curve is tall and narrow. All normal distributions look like a symmetric, bell-shaped curve.
The curve on the top is shorter and wider than the curve on the bottom, because the curve on the top has a bigger standard deviation.
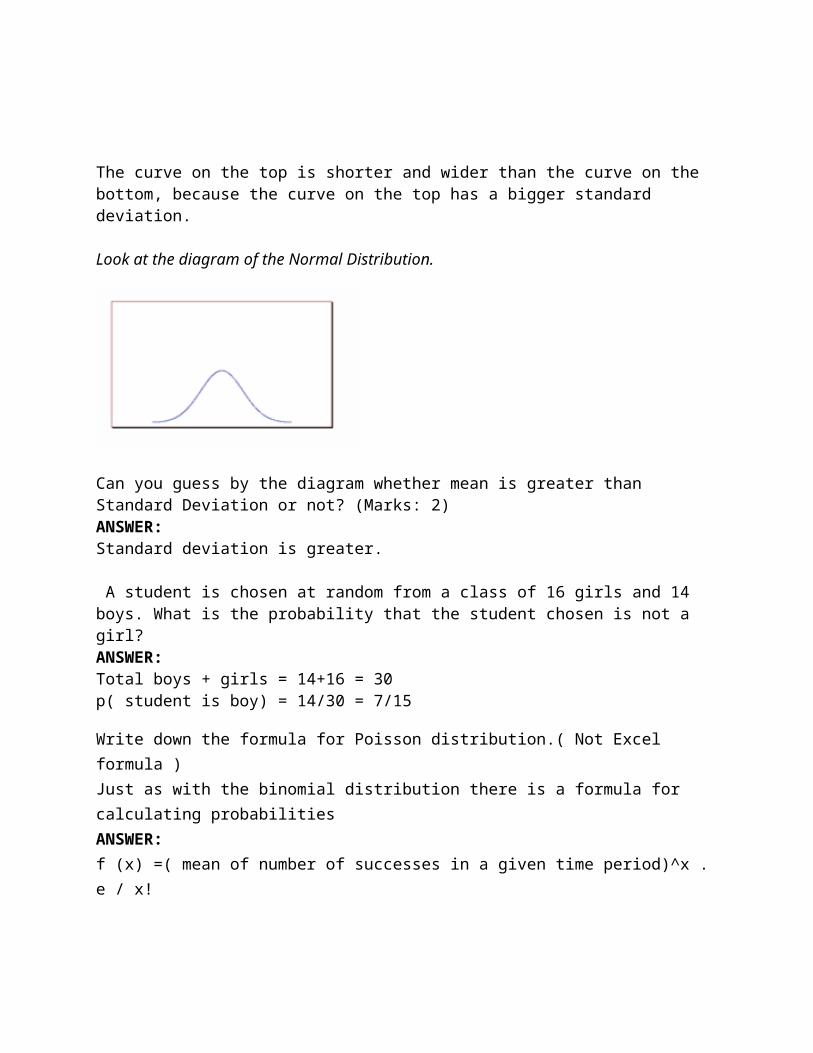
Look at the diagram of the Normal Distribution.
Can you guess by the diagram whether mean is greater than Standard Deviation or not? (Marks: 2)ANSWER:Standard deviation is greater.
A student is chosen at random from a class of 16 girls and 14 boys. What is the probability that the student chosen is not a girl? ANSWER:Total boys + girls = 14+16 = 30 p( student is boy) = 14/30 = 7/15
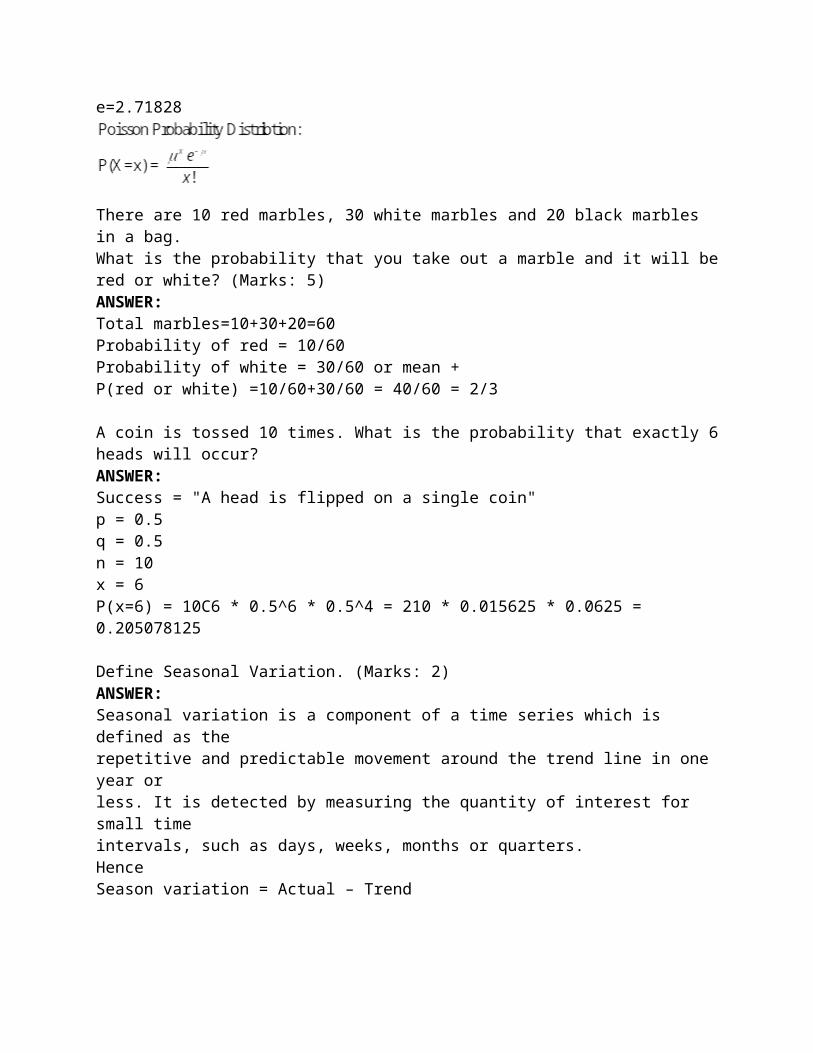
Write down the formula for Poisson distribution.( Not Excel formula ) Just as with the binomial distribution there is a formula for calculating probabilities ANSWER:f (x) =( mean of number of successes in a given time period)^x . e / x!e=2.71828
There are 10 red marbles, 30 white marbles and 20 black marbles in a bag.What is the probability that you take out a marble and it will be red or white? (Marks: 5)ANSWER:Total marbles=10+30+20=60Probability of red = 10/60Probability of white = 30/60 or mean +P(red or white) =10/60+30/60 = 40/60 = 2/3
A coin is tossed 10 times. What is the probability that exactly 6 heads will occur?ANSWER:Success = "A head is flipped on a single coin"p = 0.5q = 0.5n = 10x = 6P(x=6) = 10C6 * 0.5^6 * 0.5^4 = 210 * 0.015625 * 0.0625 = 0.205078125
Define Seasonal Variation. (Marks: 2) ANSWER:Seasonal variation is a component of a time series which is defined as therepetitive and predictable movement around the trend line in one year orless. It is detected by measuring the quantity of interest for small timeintervals, such as days, weeks, months or quarters.HenceSeason variation = Actual – Trend
From the data below:Week no. Actual sales Forecast2 4000 4500Given that α = 0.4, find the forecast for the 3rd week. (Marks: 3) ANSWER:
Calculate the coefficient of variation where mean= 30 and S.D = 13.04. (Marks: 2)ANSWER: Coefficient of variation=standard deviation/mean * 100= 13.04/30*100=43.46
If a single 6-sided die is rolled, what is the probability of a number that is not 8? (Marks: 2)ANSWER:Since in single 6 sided 8 cannot come. P=6/6 =1
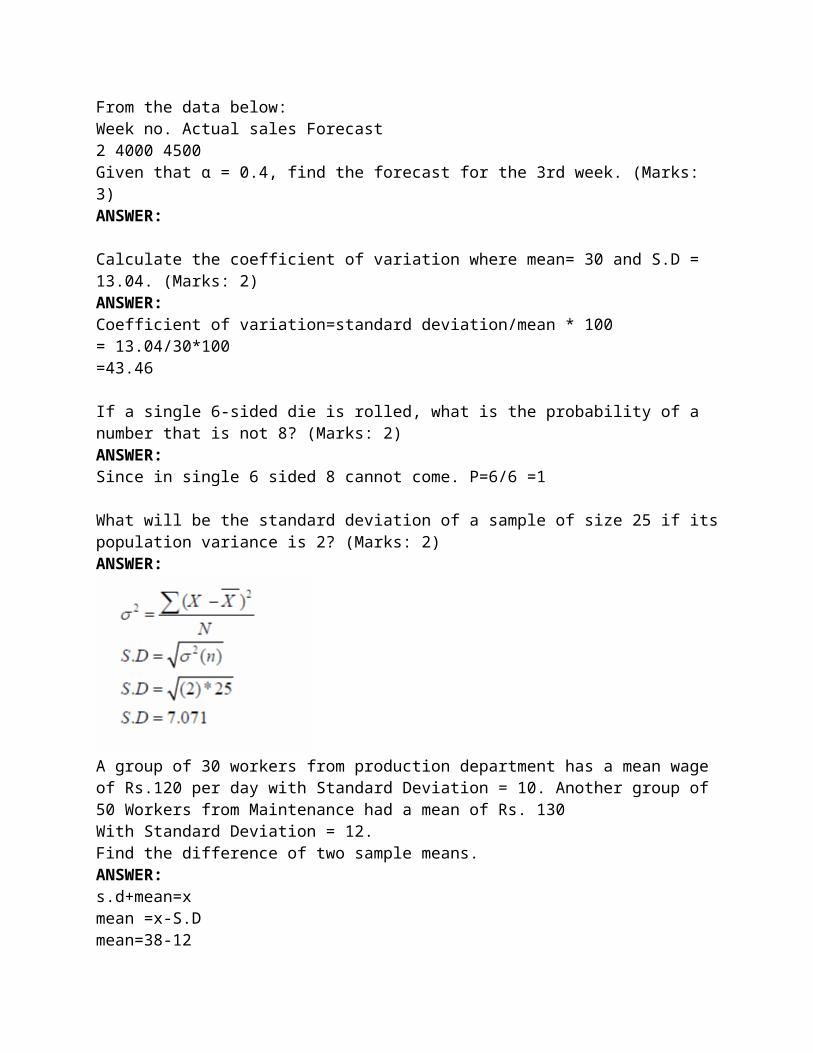
What will be the standard deviation of a sample of size 25 if its population variance is 2? (Marks: 2)ANSWER:
A group of 30 workers from production department has a mean wage of Rs.120 per day with Standard Deviation = 10. Another group of 50 Workers from Maintenance had a mean of Rs. 130With Standard Deviation = 12.Find the difference of two sample means.ANSWER:s.d+mean=xmean =x-S.Dmean=38-12=26mean=38-12=26
What will be y-intercept ‘b’ in the regression line Y=aX+b if Y = 9, X = 3 and a = 2 ?ANSWER:9 = (2 x 3) + bb = 9 – 6
b = 3 will be the Intercept
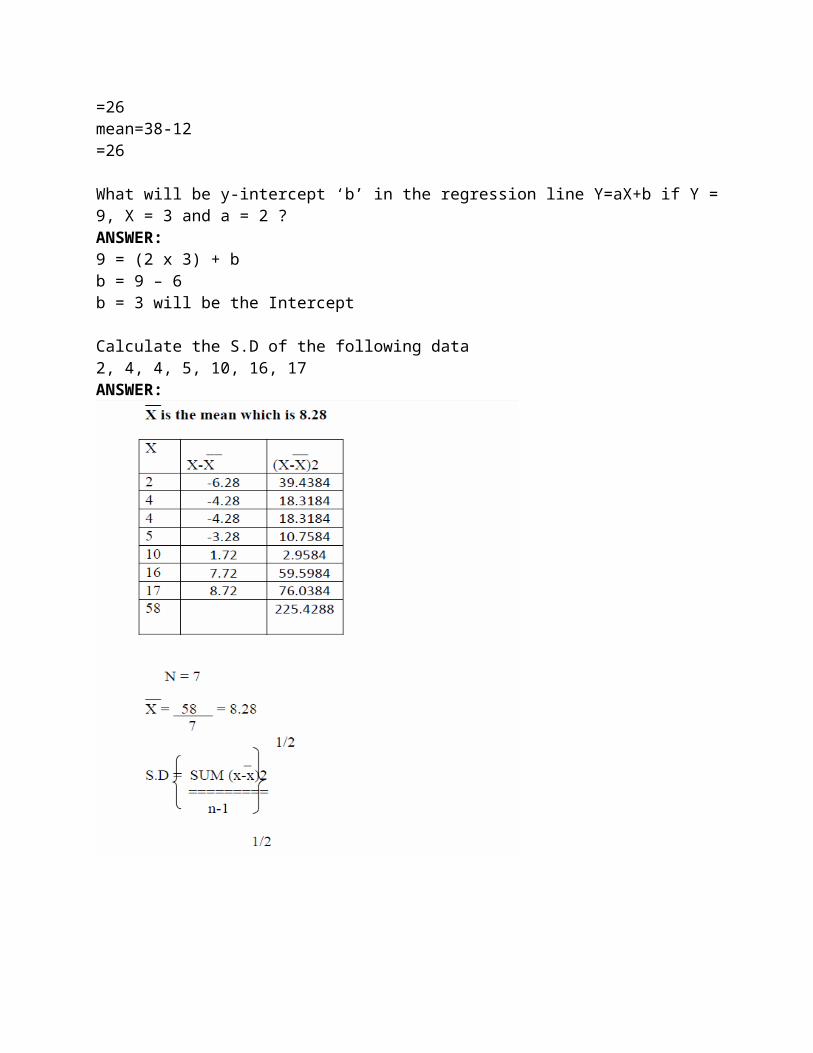
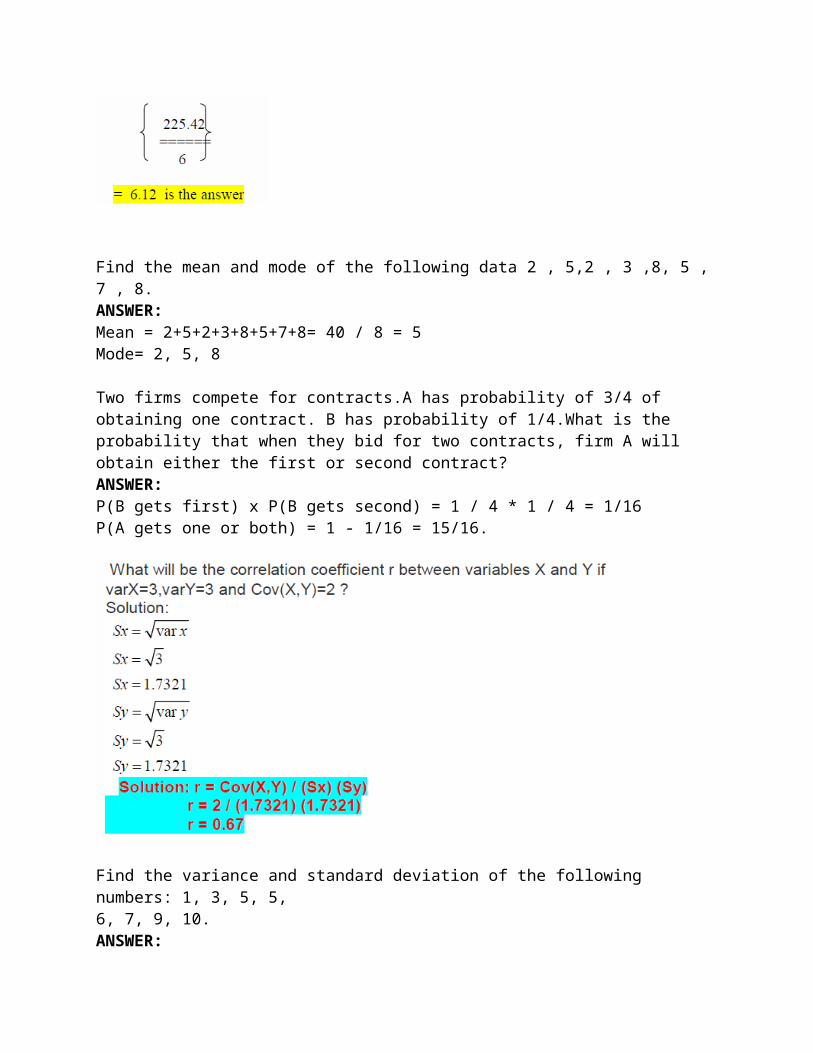
Calculate the S.D of the following data2, 4, 4, 5, 10, 16, 17ANSWER:
Find the mean and mode of the following data 2 , 5,2 , 3 ,8, 5 , 7 , 8.ANSWER:Mean = 2+5+2+3+8+5+7+8= 40 / 8 = 5Mode= 2, 5, 8
Two firms compete for contracts.A has probability of 3/4 of obtaining one contract. B has probability of 1/4.What is the probability that when they bid for two contracts, firm A will obtain either the first or second contract?ANSWER:P(B gets first) x P(B gets second) = 1 / 4 * 1 / 4 = 1/16P(A gets one or both) = 1 - 1/16 = 15/16.
Find the variance and standard deviation of the following numbers: 1, 3, 5, 5,6, 7, 9, 10.ANSWER:X mean = 1+3+5+5+6+7+9+10 = 46 / 8 = 5.751 – 5.75 = - 4.75 = 22.563 – 5.75 = - 2.75 = 7.565 – 5.75 = -.75= .565 – 5.75 = - .75 = .566 – 5.75 = .25 = .067 – 5.75 = 1.25 = 1.569 – 5.75 =3.2510 – 5.75 = 4.251628.29 / 7Under rootSD = 14.25Variance = 232.59
The number of phone calls at a call centre per minute is 7. What is the probability that on a given minute there will be more than 8 phone calls?Mean = 7x = 8ANSWER:=(e^-8)(8^7)/7!
=(0.0003)(2097152)/5040=629.146/5040=0.1248 = 12.5%
If Y = 5 + b X, find the value of b when Y = 9 and x = 2.ANSWER:Y=5+b XY-5=b Xb = (Y-5)/XPutting the given value:b = (9-5)/2b = 4/2b= 2
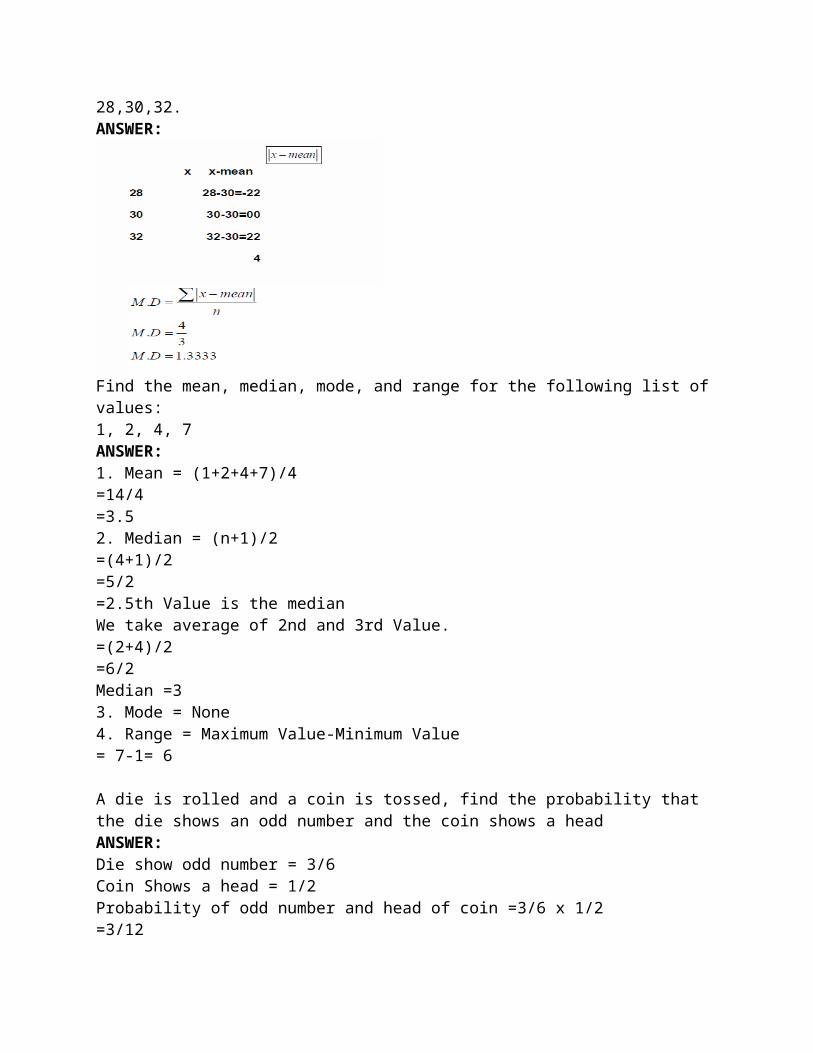
Calculate the mean deviation from mean = 30 of the following set of examination marks28,30,32.ANSWER:
Find the mean, median, mode, and range for the following list of values:1, 2, 4, 7ANSWER:1. Mean = (1+2+4+7)/4=14/4=3.52. Median = (n+1)/2=(4+1)/2=5/2=2.5th Value is the medianWe take average of 2nd and 3rd Value.=(2+4)/2=6/2Median =33. Mode = None4. Range = Maximum Value-Minimum Value= 7-1= 6
A die is rolled and a coin is tossed, find the probability that the die shows an odd number and the coin shows a headANSWER:Die show odd number = 3/6Coin Shows a head = 1/2Probability of odd number and head of coin =3/6 x 1/2=3/12=1/4
Define the Null Hypothesis.ANSWER:Null hypothesis is a scenario which explain a given set of data. It is tested to determine whether data provides sufficient reasons to pursue some alternative hypothesis.It is a hypothesis that states there is no difference between 2 or more sets of data.
Find harmonic mean (HM) of 10,12,14,17.ANSWER: Harmonic mean,HM = n/(1/x1 + 1/x2 + 1/x3 + 1/x4 +…… +1/xn)N= 4X1 = 10X2 = 12X3 = 14X4 = 171/x1 + 1/x2 + 1/x3 + 1/x4 = 1/10 + 1/12+ 1/14+ 1/17 = 0.2385Harmonic mean = 4/0.2385= 16.77
Given for a frequency distribution mode = 18, mean = 21. Calculate median. Using these values comment on skewness of distribution.ANSWER: We know that, Mean-mode= 3(mean- median) Median= (2*mean+mode)/3 Since, Mean= 21 Mode= 18So, Median = (2*21+18)/3 = (42+18)/3 = 60/3 = 10The distribution is Moderately skewed and unimodal distribution.
How many different ways can you select 2 letters from the set of letters: X, Y, and Z? (Hint: In this problem, order is NOT important; i.e., XY is considered the same selection as YX.)ANSWER:Total number of letters = 3
Letters taken at a time = 2
Number of ways in which 2 letters can be selected out of 3 = 3C2 = 3! / 2!(3-2)!
=3*2*1/ 2
= 3In which condition none of the hypothesis testing procedures can be safely used.ANSWER:In the null hypothesis we don’t consider about proving null hypothesis and we must begin with assumption that there is no change at all.
How many possible permutations can be formed from the word MATHEMATICS?ANSWER:Total number of alphabets in mathematics = 11M = 2A = 2T = 2H = 1E = 1I = 1C = 1S = 1Permutations = 11! / 2! * 2! * 2! *1! * 1! * 1* 1! * 1!
= 11! / 8 = 4,989,600
What is most common measure of central tendency and how it is calculated?ANSWER:Central Tendency refers to middle value and most common measure of central tendency is the “Mean”.Mean is calculated as follows:Mean= (The sum of all values) / (The Number of Values)
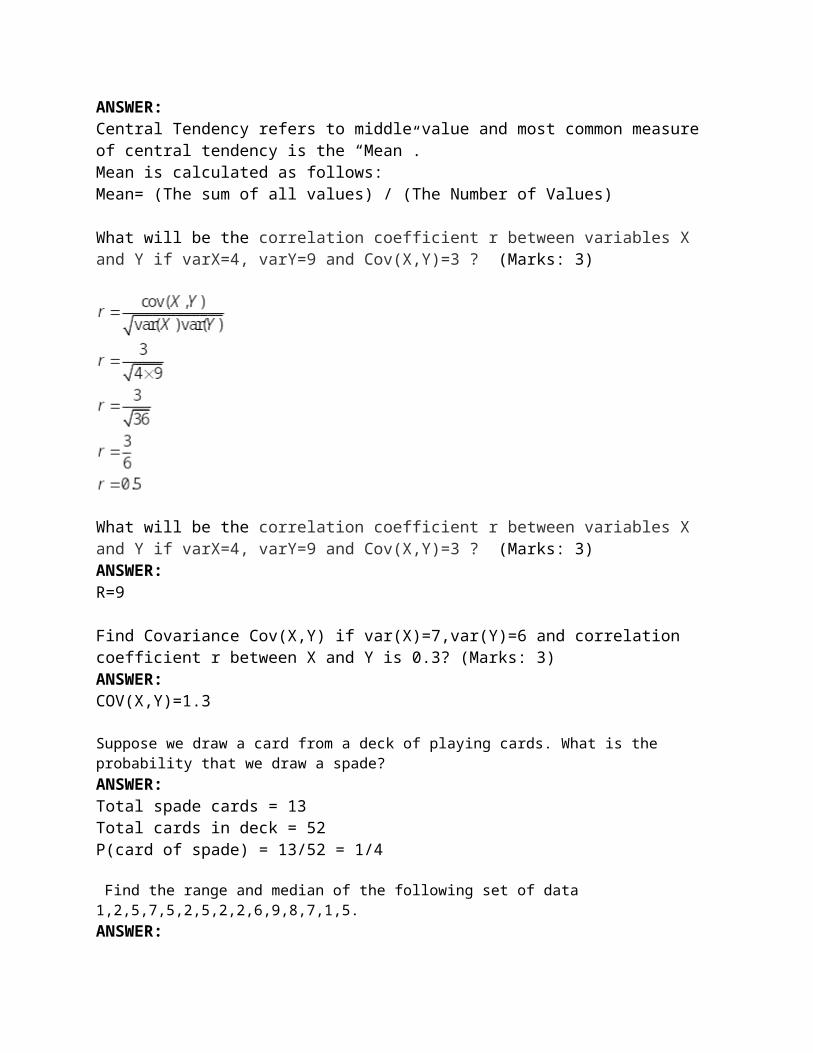
What will be the correlation coefficient r between variables X and Y if varX=4, varY=9 and Cov(X,Y)=3 ? (Marks: 3)
What will be the correlation coefficient r between variables X and Y if varX=4, varY=9 and Cov(X,Y)=3 ? (Marks: 3)ANSWER:R=9
Find Covariance Cov(X,Y) if var(X)=7,var(Y)=6 and correlation coefficient r between X and Y is 0.3? (Marks: 3)ANSWER:COV(X,Y)=1.3
Suppose we draw a card from a deck of playing cards. What is the probability that we draw a spade?ANSWER:Total spade cards = 13Total cards in deck = 52P(card of spade) = 13/52 = 1/4 Find the range and median of the following set of data 1,2,5,7,5,2,5,2,2,6,9,8,7,1,5.ANSWER:To get median sorting
1 1 2 2 2 2 5 5 5 5 6 7 7 8 9
Median = 5 and 2Range = highest value – lowest value
= 9-1 = 8
A random sample of size n is drawn from normal population with mean 6 and standard deviation1.2; if z = 4, x = 8 what is n?ANSWER:N=2
If a pollster might want to know whether or not, say, the sex, the ethnic background or salary range of a person is factor in his or her vote in election or for some type of legislation then justify which distribution is best fit for this scenario?(least two sentence description )ANSWER:
We prefer Normal Distribution over others due to following
It is applied in situations where data is widely distributed. We use Normal distribution on sample data to get a better picture of large data which is not possible to collect in real life like population, scientific research data etc. because normal distributions are much easier to analyze.
The normal distribution can be used to describe, at least approximately, any variable that gathered near the mean In simple terms the Normal distribution is useful for study of real world distributions because in the real world a single distribution (like height of men) is a result of other random factors. In normal distribution we can calculate indefinite number of data.
ANSWER:
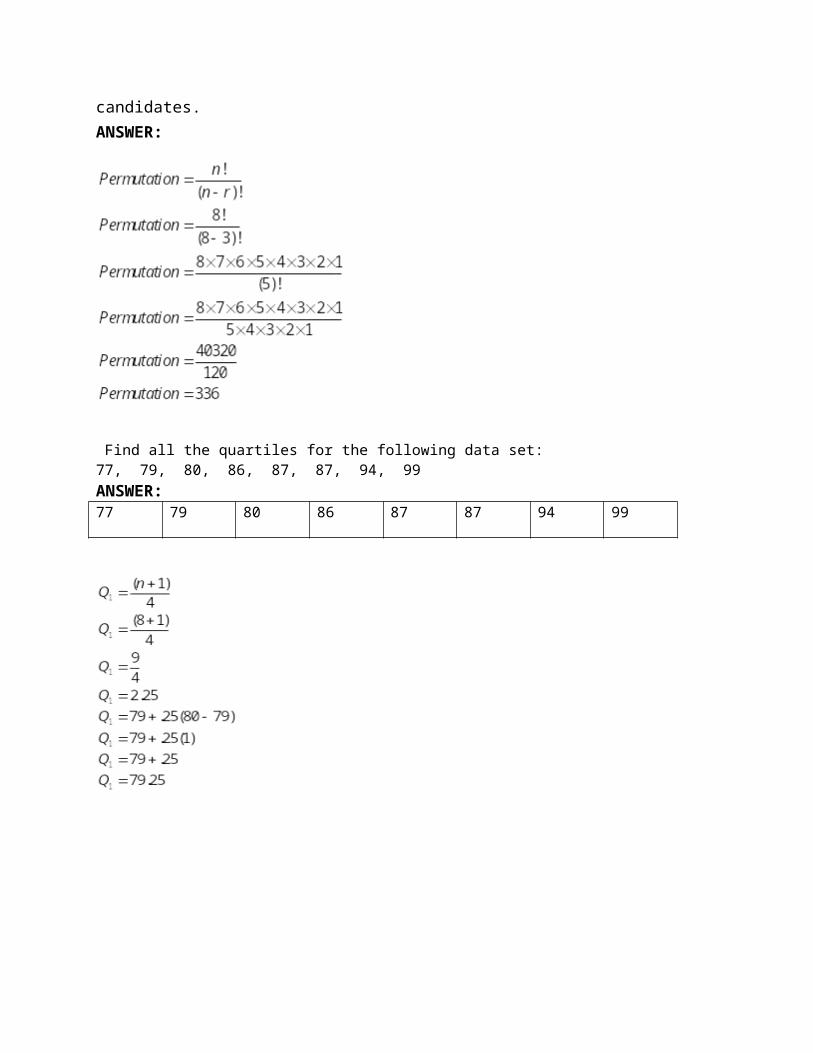
Calculate number of ways, a committee of 3 people comprising the President, Secretary and Treasurer to chosen from 8 possible candidates.ANSWER:
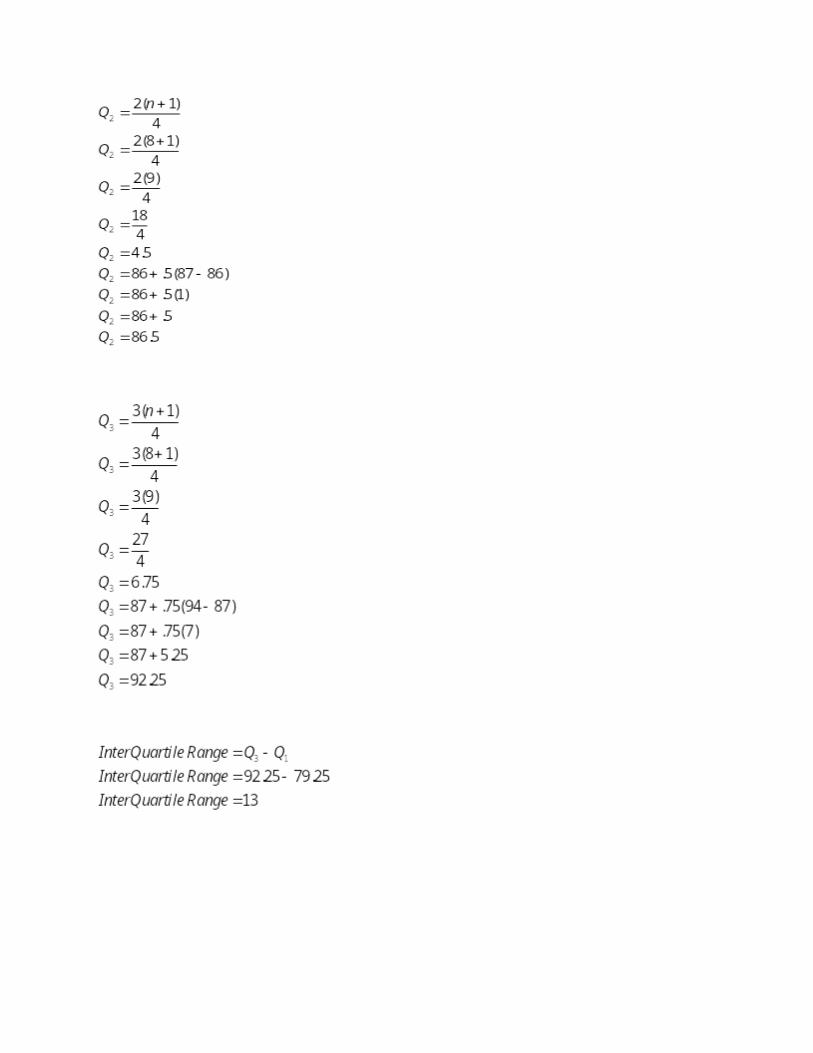
Find all the quartiles for the following data set: 77, 79, 80, 86, 87, 87, 94, 99ANSWER:77 79 80 86 87 87 94 99
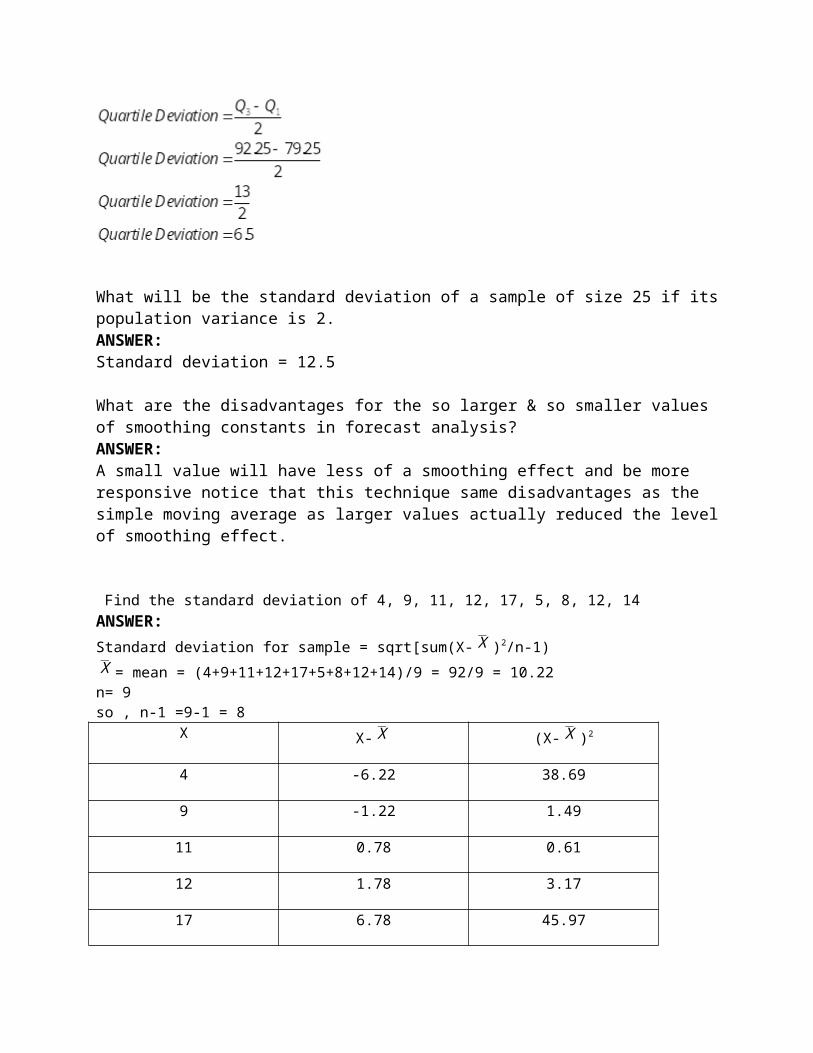
What will be the standard deviation of a sample of size 25 if its population variance is 2.ANSWER:Standard deviation = 12.5
What are the disadvantages for the so larger & so smaller values of smoothing constants in forecast analysis?ANSWER:A small value will have less of a smoothing effect and be more responsive notice that this technique same disadvantages as the simple moving average as larger values actually reduced the level of smoothing effect.
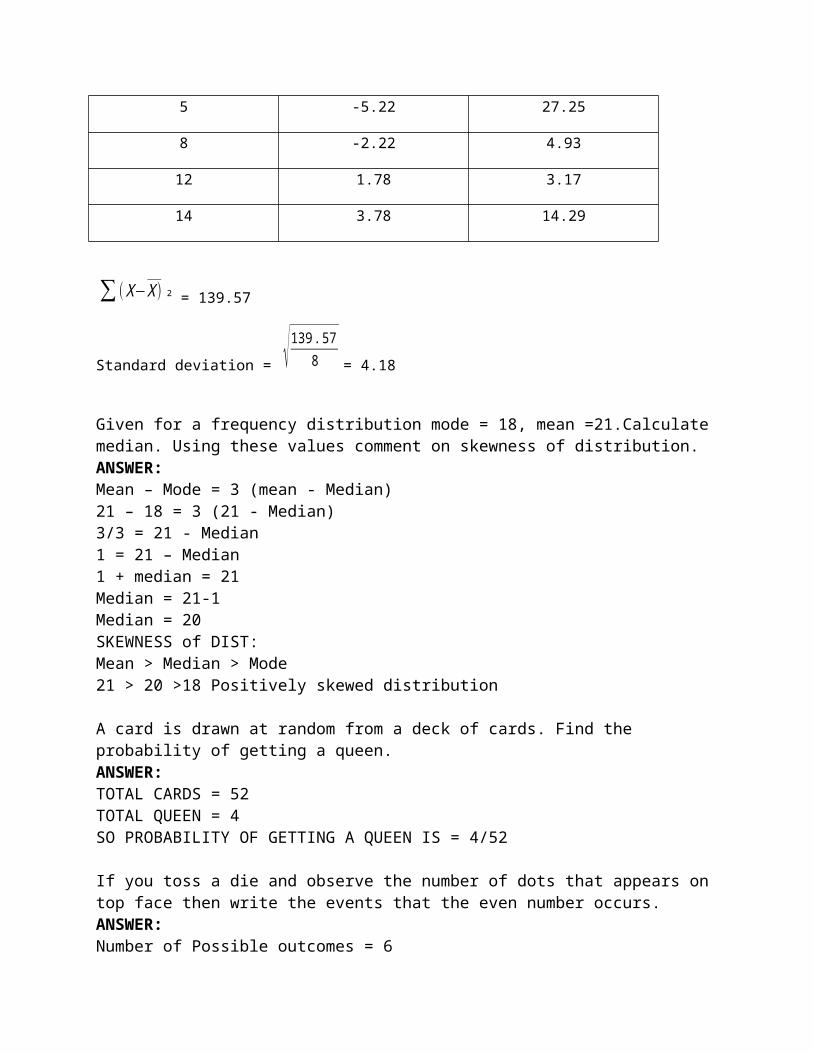
Find the standard deviation of 4, 9, 11, 12, 17, 5, 8, 12, 14ANSWER:Standard deviation for sample = sqrt[sum(X-X )2/n-1)X = mean = (4+9+11+12+17+5+8+12+14)/9 = 92/9 = 10.22n= 9 so , n-1 =9-1 = 8
X X-X (X-X )2
4 -6.22 38.69
9 -1.22 1.49
11 0.78 0.61
12 1.78 3.17
17 6.78 45.97
5 -5.22 27.25
8 -2.22 4.93
12 1.78 3.17
14 3.78 14.29
∑ ( X−X ) 2 = 139.57
Standard deviation = √139. 578 = 4.18
Given for a frequency distribution mode = 18, mean =21.Calculate median. Using these values comment on skewness of distribution.ANSWER:Mean – Mode = 3 (mean - Median)21 – 18 = 3 (21 - Median)3/3 = 21 - Median1 = 21 – Median1 + median = 21Median = 21-1Median = 20SKEWNESS of DIST:Mean > Median > Mode21 > 20 >18 Positively skewed distribution
A card is drawn at random from a deck of cards. Find the probability of getting a queen.ANSWER:TOTAL CARDS = 52TOTAL QUEEN = 4SO PROBABILITY OF GETTING A QUEEN IS = 4/52
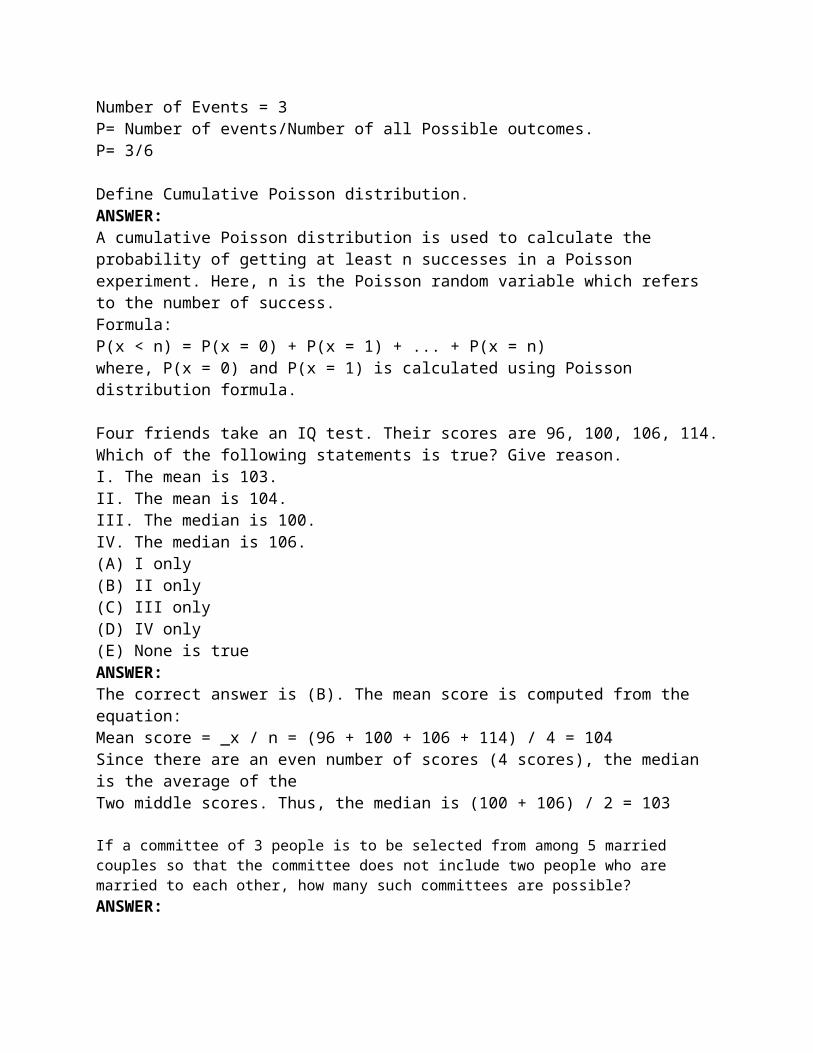
If you toss a die and observe the number of dots that appears on top face then write the events that the even number occurs.ANSWER:Number of Possible outcomes = 6Number of Events = 3P= Number of events/Number of all Possible outcomes.P= 3/6
Define Cumulative Poisson distribution.ANSWER:A cumulative Poisson distribution is used to calculate the probability of getting at least n successes in a Poisson experiment. Here, n is the Poisson random variable which refers to the number of success.Formula:P(x < n) = P(x = 0) + P(x = 1) + ... + P(x = n)where, P(x = 0) and P(x = 1) is calculated using Poisson distribution formula.
Four friends take an IQ test. Their scores are 96, 100, 106, 114. Which of the following statements is true? Give reason.I. The mean is 103.II. The mean is 104.III. The median is 100.IV. The median is 106.(A) I only(B) II only(C) III only(D) IV only(E) None is trueANSWER:The correct answer is (B). The mean score is computed from the equation:Mean score = _x / n = (96 + 100 + 106 + 114) / 4 = 104Since there are an even number of scores (4 scores), the median is the average of theTwo middle scores. Thus, the median is (100 + 106) / 2 = 103
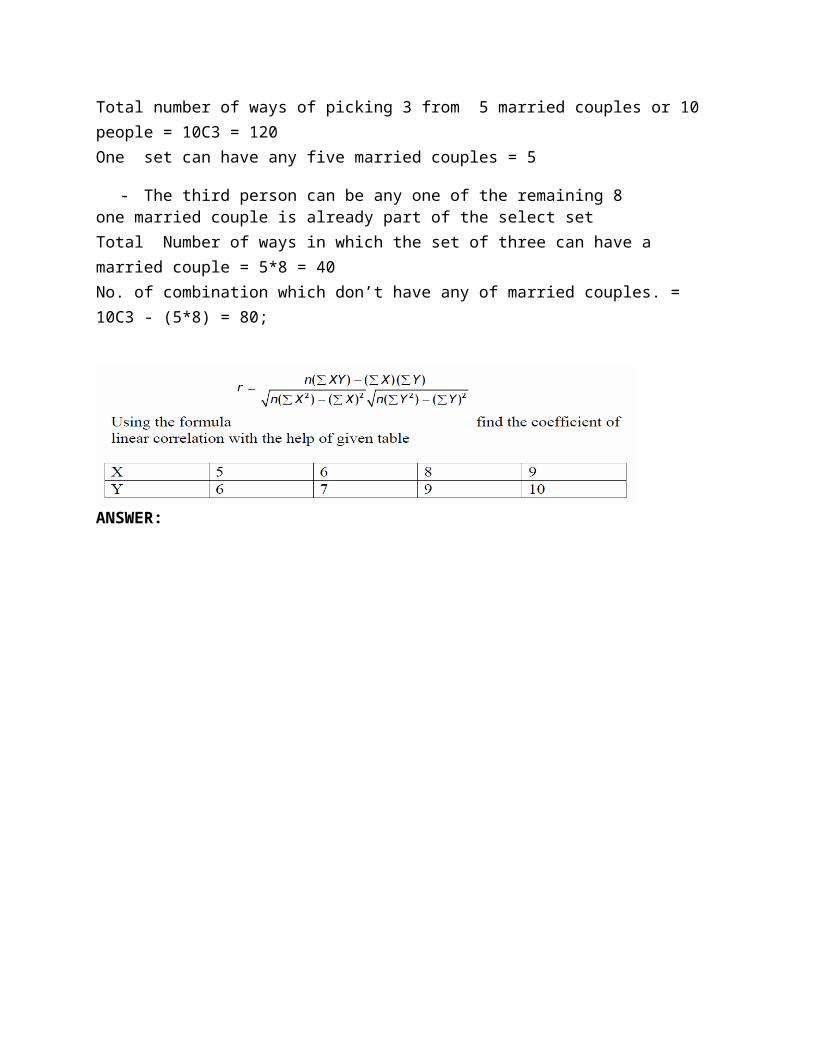
If a committee of 3 people is to be selected from among 5 married couples so that the committee does not include two people who are married to each other, how many such committees are possible?ANSWER:Total number of ways of picking 3 from 5 married couples or 10 people = 10C3 = 120One set can have any five married couples = 5
- The third person can be any one of the remaining 8one married couple is already part of the select set Total Number of ways in which the set of three can have a married couple = 5*8 = 40No. of combination which don’t have any of married couples. = 10C3 - (5*8) = 80;
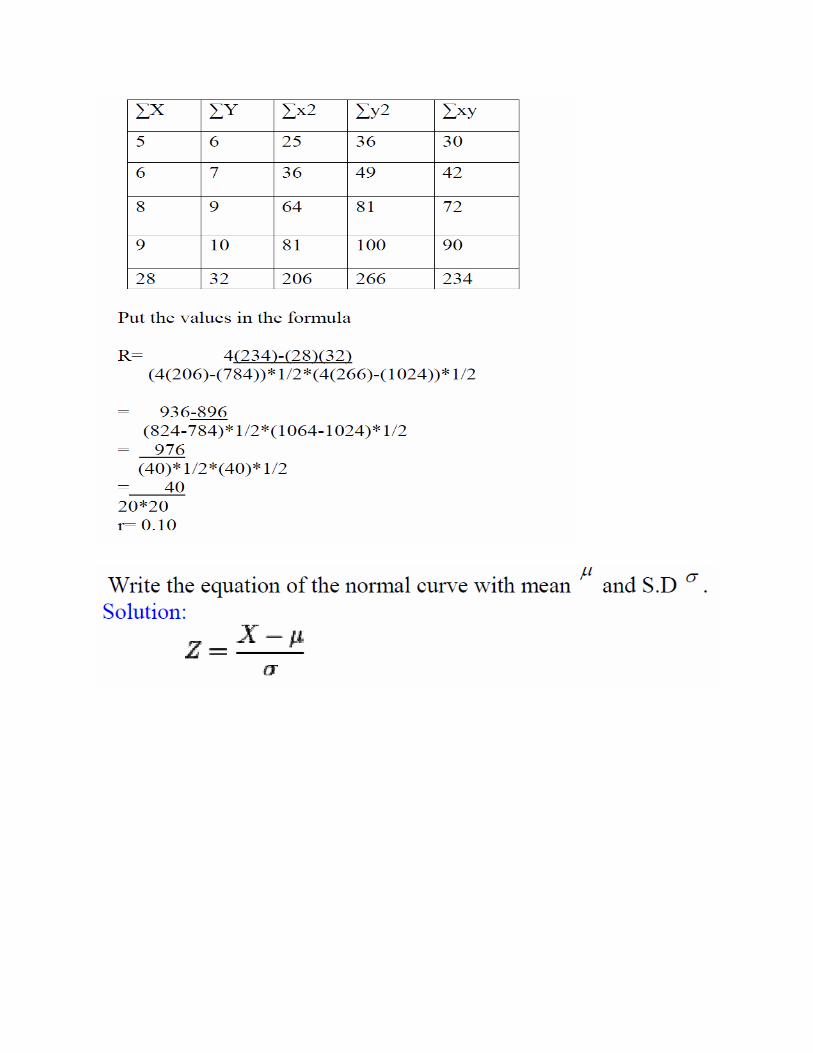
ANSWER:
ANSWER:
Find the value of standard normal equation where mean is 0 and standard deviation is 1 (Marks: 2) ANSWER:
In a school, 50% students study science subjects and 30% of them study biology. What is the probability that the student studies Biology? (Marks: 3)ANSWER:
If the variance of the Poisson distribution is 2, find the probabilities for X=0 and X=1 (Marks: 5)ANSWER:
Find proportion of bags which have weight in excess of 505 g.Mean = 500.StDev = 2.5 g(For z=2.00 probability is 0.4772) (Marks: 3)ANSWER:
A random sample of size 36 is taken from a normal population with a known varianceσ 2 = 25. If the mean of the sample is 42.6. Find the left confidence limit for the population mean. (Marks: 3) ANSWER:
Two students were informed that they received standard scores of 0.8 and -0.4 respectively on a multiple choice examination in English. If their marks were 88 and 64 respectively. Find the mean and standard deviation of the examination marks. (Marks: 5) ANSWER:
At Pizza Parlor, in addition to cheese there are 8 different toppings. If you can order any number of toppings, then how many different toppings are possible? (Marks: 2) ANSWER:
Find the variance and standard deviation of the following data44, 50, 38, 96, 42, 47, 40, 39, 46, 50ANSWER:
Suppose in a university there are 5 male and 3 female instructors for the subject of statistics then by using the sum rule of counting, in how many ways a student can choose the instructor of this subject? (Marks: 2) ANSWER:
Define Type-I error. (Marks: 3)ANSWER:
If you toss a die and observe the number of dots that appears on top face then write the event that an even number AND a number exceeding 3 occurs. (Marks: 3) ANSWER:
Suppose a password consists of 4 characters, the first 2 being the letters in the (English) alphabet and the last 2 being digits. Find the number n of:(a) Passwords(b) Passwords beginning with a vowel.ANSWER:
Suppose an institute offer 3 different statistics courses, 2 different mathematics courses and 4 different management courses then in how many ways the student can choose ONE of the EACH courses? (Marks: 3) ANSWER:
The mean weekly earnings of skilled factory workers in one particular country were $19.50 with a standard deviation of $ 4, while for its neighboring country the figures were Rs. 75 and Rs. 28 respectively.By calculating coefficient of variation in each case, find which country has the GREATER VARIABILITY in earnings. (Marks: 3) ANSWER:
The Poisson distribution is the most commonly used to model the number of random occurrences of some phenomenon in a specified unit of space or time. Give two examples of Poisson distribution from the daily life. (Marks: 3)ANSWER:
State three important properties of regression line.ANSWER:
A local trade union consists of plumbers and electricians. Classified according to rank:
Apprentice Journeyman Master ------------------------------------ Plumbers 25 | 20 | 30 75 ------------------------------------ Electricians 15 | 40 | 20 75 ------------------------------------- 40 60 50A member of the union is selected at random. Given that thePerson selected is a plumber, find the probability that he is aJourneyman ANSWER:
If the random variable Z has the standard normal distribution, find probability P(z<1.46).ANSWER:
The answer of BINIMDIST is #NUM. Give the reason of this error message.ANSWER:
Show that X and Y are uncorrelated by using the following table. (Marks: 3)
X 2 4
Y 3 3
ANSWER:
Determine two variables X and Y are correlated or uncorrelated by using the following table
X 0 4
Y 2 4
ANSWER:
Suppose the following table gives the percentage of the number of persons per household in the country for the given year.
ANSWER:
ANSWER:
Find the centered average in the data below: (Marks: 5)
If X is a normal random variable with mean (m) 100 and standard deviation (σ) is10, find P(X<110). (Marks: 5)(Use the following chart: