Embed Size (px)
Citation preview
Free Radical Biology & Medicine 44 (2008) 1833–1845
Contents lists available at ScienceDirect
Free Radical Biology & Medicine
j ourna l homepage: www.e lsev ie r.com/ locate / f reeradb iomed
Original Contribution
Apigenin-induced prostate cancer cell death is initiated by reactive oxygenspecies and p53 activation
Sanjeev Shukla a, Sanjay Gupta a,b,c,⁎a Department of Urology, Case Western Reserve University, Cleveland, OH 44106, USAb University Hospitals Case Medical Center, Case Western Reserve University, Cleveland, OH 44106, USAc Case Comprehensive Cancer Center, Case Western Reserve University, Cleveland, OH 44106, USA
a r t i c l e i n f o
⁎ Corresponding author. Department of Urology, CasCleveland, OH 44106, USA. Fax: +1 216 368 0213.
E-mail address: [email protected] (S. Gupta).Abbreviations: Apaf-1, apoptosis protease-activating
species; ERK, extracellular signal-regulated kinase; NFinsulin-like growth factor binding protein; PARP, poly(Amurine doubleminute; GSH, glutathione; DCF, dichloroflu
0891-5849/$ – see front matter © 2008 Elsevier Inc. Aldoi:10.1016/j.freeradbiomed.2008.02.007
a b s t r a c t
Article history:Received 6 December 2007Revised 24 January 2008Accepted 6 February 2008Available online 26 February 2008
Apigenin, a plant flavone, potentially activates wild-type p53 and induces apoptosis in cancer cells. Weconducted detailed studies to understand its mechanism of action. Exposure of human prostate cancer 22Rv1cells, harboring wild-type p53, to growth-suppressive concentrations (10–80 μM) of apigenin resulted in thestabilization of p53 by phosphorylation on critical serine sites, p14ARF-mediated downregulation of MDM2protein, inhibition of NF-κB/p65 transcriptional activity, and induction of p21/WAF-1 in a dose- and time-dependent manner. Apigenin at these doses resulted in ROS generation, which was accompanied by rapidglutathione depletion, disruption of mitochondrial membrane potential, cytosolic release of cytochrome c,and apoptosis. Interestingly, we observed accumulation of a p53 fraction to themitochondria, whichwas rapidand occurred between 1 and 3 h after apigenin treatment. All these effects were significantly blocked bypretreatment of cells with the antioxidant N-acetylcysteine, p53 inhibitor pifithrin-α, and enzyme catalase.Apigenin-mediated p53 activation and apoptosis were further attenuated by p53 antisense oligonucleotidetreatment. Exposure of cells to apigenin led to a decrease in the levels of Bcl-XL and Bcl-2 and increase in Bax,triggering caspase activation. Treatment with the caspase inhibitors Z-VAD-FMK and DEVD-CHO partiallyrescued these cells from apigenin-induced apoptosis. In vivo, apigenin administration demonstrated p53-mediated induction of apoptosis in 22Rv1 tumors. These results indicate that apigenin-induced apoptosis in22Rv1 cells is initiated by a ROS-dependent disruption of the mitochondrial membrane potential throughtranscriptional-dependent and -independent p53 pathways.
© 2008 Elsevier Inc. All rights reserved.
Keywords:Reactive oxygen speciesApoptosisp53Prostate cancerApigeninFree radicals
Cancer prevention is profoundly dependent on the p53 tumorsuppressor protein, as it functions in regulating cellular growth andprotecting cells from malignant transformation [1,2]. Several studieshave demonstrated the anticancer activities of p53, and in fact, p53 isthe most frequently altered protein in human cancers [2,3]. Approxi-mately 50% of all human malignancies harbor mutations or deletionsin the TP53 gene that disable the tumor suppressor function of theencoded protein [4,5]. Most other human cancers express wild-typep53 protein but encode alternate defects in the p53 signaling pathwaythat play critical roles in tumorigenesis [4–6]. The role that the p53gene plays in preventing the onset of cancer involves the eliminationof damaged or infected cells by causing cell cycle arrest and/orapoptosis. The suppression of cellular proliferation by p53 occursthrough two different mechanisms: apoptosis and cell cycle arrest. In
e Western Reserve University,
factor-1; ROS, reactive oxygen-κB, nuclear factor-κB; IGFBP,DP)ribose polymerase; MDM,
orescein; NAC,N-acetylcysteine.
l rights reserved.
abnormally proliferating cells, induction of p53 leads to programmedcell death or apoptosis, whereas in normal fibroblasts p53 induces G1arrest in response to genotoxic agents, presumably to allow the cells toperform critical repair functions before progressing through the cellcycle [7]. Apoptosis mediated by p53 in response to DNA damage ispredominantly attributable to the transcriptional activation of genesthat regulate the cell cycle and apoptosis, such as the BH3-onlyproteins Noxa and Puma, p21/WAF-1, MDM2, gadd45, Bax, p53AIP1,and PERP [8–10], and is additionally attributable to transcriptionalrepression, involving inhibition of the expression of a number ofgenes, including c-fos, DNA polymerase α, microtubule-associatedprotein A, IGF-IR, NF-κB/p65/RelA, Bcl-2, and survivin [11,12]. Wild-type p53 protein activity is associatedwith apoptosis induced by DNA-damaging agents and growth hormone depletion [13]. In addition toits roles in such transcriptional regulation, recent evidence hassuggested the existence of a transcription-independent pathway ofp53-mediated apoptosis [4]. A fraction of the p53 molecules thataccumulate in damaged cells translocate to mitochondria, and thistranslocation is sufficient for p53 to induce permeabilization of theouter mitochondrial membrane through formation of complexes withthe protective proteins Bcl-XL and Bcl-2, resulting in the release ofcytochrome c into the cytosol [15,16]. Cytochrome c then binds to
1834 S. Shukla, S. Gupta / Free Radical Biology & Medicine 44 (2008) 1833–1845
apoptosis protease-activating factor-1 (Apaf-1) and activates caspase-3 through caspase-9, resulting in execution of apoptosis [17].Consequently, regulation of the expression of the p53 gene may beof critical importance to the induction of apoptosis in premalignantand malignant cells, and agents that can influence this process mayprove to be valuable in the prevention and/or therapeutic manage-ment of cancer.
In recent years plant flavonoids have gained considerable attentionas anticancer agents, particularly apigenin (4',5,7-trihydroxyflavone),which is abundantly present in common fruits and vegetables andwhich has shown considerable promise for development as a chemo-preventive agent [18,19]. Recent studies fromour grouphave shown thatapigenin is capable of selectively inhibiting cell growth and inducingapoptosis in cancer cells without affecting normal cells [20]. In addition,the anticancer properties of apigenin in animals have been demon-strated by inhibition of tumor initiation induced by various carcinogens[21,22]. Apigenin has been shown to suppress angiogenesis in mela-noma and carcinomaof the breast, skin, and colon [23–26]. Apigenin is apotent inhibitor of several protein tyrosine kinases, including epidermalgrowth factor receptor and Src tyrosine kinase [27,28]. Apigenin has alsobeen shown to modulate the expression of phosphatidylinositol 3-kinase, protein kinase B/Akt, mitogen-activated protein kinase, ERK1/2,casein kinase-2, and other upstream kinases involved in the develop-ment and progression of cancer [29–31]. Recently, our laboratory hasdemonstrated that apigenin sensitizes tumor cells to TNF-α-inducedapoptosis through inhibition of NF-κB [32]. We also observed that api-genin induces apoptosis in solid tumors through upregulation of IGFBP-3 [33]. More recently, we have demonstrated that apigenin-inducedsuppression of tumor proliferation correlates with downregulation ofcyclin D1 expression and cdk4-mediated Rb phosphorylation, inductionof p21/WAF-1, and p53 stabilization [34]. However, the mechanisms bywhich apigenin influences p53-mediated apoptosis are not clearlyunderstood.Weundertook studies of humanprostate cancer cell lines aswell as studies of prostate cancer xenografts in athymic nude mice toinvestigate the role of apigenin in p53-mediated apoptosis, examiningits influence in both p53-dependent and p53-independent activation ofapoptotic mechanisms that culminate in cell death.
Materials and methods
Reagents and antibodies
Apigenin (N95% purity) was obtained from A.G. Scientific (SanDiego, CA, USA), N-acetyl- L-cysteine (NAC) was from Sigma–Aldrich(St. Louis, MO, USA), and pifithrin-α, Z-VAD-FMK, and DEVD-CHOwere from Alexis (San Diego, CA, USA). Fetal bovine serum wasobtained from Life Technologies (Gaithersburg, MD, USA). Antibodiesrecognizing full-length poly(ADP)ribose polymerase and its cleavedproduct, p53 (No. 9282); phospho-p53, Ser6 (No. 9285); phospho-p53,Ser9 (No. 9288); phospho-p53, Ser15 (No. 9284); phospho-p53, Ser20(No. 9287); phospho-p53, Ser37 (No. 9289); phospho-p53, Ser46(No. 2521); phospho-p53, Ser392 (No. 9281); p14ARF (No. 2407);caspase-3 (No. 9662); caspase-8, 1C12 (No. 9746); and Bcl-XL (No.2762) were purchased from Cell Signaling Technology (Fremont, CA,USA). MDM2, D-12 (No. sc-5304); Apaf-1, H324 (No. sc-8339); Bax,6A7 (No. sc-23959); Bcl2, C-2 (No. sc-7382); cytochrome c, 7H8 (No.sc-13560); caspase-9, p10(F-7) (No. sc-17784); and actin (1-19) (No.sc-1616) were procured from Santa Cruz Biotechnology (Santa Cruz,CA, USA), whereas monoclonal antibodies for WAF-1/p21 wereobtained from Lab Vision Corp. (Fremont, CA, USA).
Cell culture and treatment
Human prostate cancer 22Rv1 cells were purchased fromthe American Type Culture Collection (Manassas, VA, USA). Addition-ally, we used other cell lines which were isogenic prostate cells PC-3
(p53−/−) and PC-3 (p53+/+); the only difference was in their p53 status.Cells were cultured in RPMI 1640 medium with 10% heat-inactivatedfetal bovine serum (FBS),100 μg/mlpenicillin–streptomycin (Invitrogen,Carlsbad, CA, USA), and maintained in an incubator with a humidifiedatmosphere of 95% air and 5% CO2 at 37°C. The cells were treated withvarying concentrations of apigenin dissolved in DMSO, which wasprovided to the control group within permissible concentrations.
Cell growth inhibition by 3-(4,5-dimethylthiazol-2-yl)-2,5-diphenyltetrazolium bromide (MTT) assay
The effects of apigenin on cell viability/proliferation were deter-mined using theMTTassay, as described previously [31]. Briefly,1×104
cells/well were plated in 96-well culture plates. After overnightincubation, the cells were treated with varying concentrations ofapigenin (0, 10, 20, 40, or 80 µM) for 12, 24, and 48 h. The cells weretreated with 50 μl of 5 mg/ml MTT and the resulting formazan crystalswere dissolved in dimethyl sulfoxide (200 μl). Absorbance wasrecorded at 540 nm with a reference at 650 nm serving as the blank.The effect of apigenin on cell viability was assessed as percentage cellviability compared to vehicle-treated control cells, which were arbi-trarily assigned 100% viability.
Preparation of total cell lysates and mitochondrial lysates
After treatment of the cells, themediumwas aspirated and the cellswere washed twice with cold phosphate-buffered saline (PBS; 10 mM,pH 7.4). Ice-cold lysis buffer (50 mM Tris–HCl, 150 mM NaCl, 1 mMEGTA, 1 mM EDTA, 20 mMNaF, 100 mMNa3VO4, 0.5% NP-40, 1% TritonX-100, 1 mM PMSF, 10 mg/ml aprotinin, 10 mg/ml leupeptin, pH 7.4)was added to the plates, which were then placed over ice for 30 min.The cellswere scraped, and the lysatewas collected in amicrofuge tubeand passed through a 21-gauge needle to break up the cell aggregates.The lysate was cleared by centrifugation at 14,000 g for 15 min at 4°Cand the supernatant (total cell lysate) was either used immediately orstored at −80°C. Mitochondria were isolated using an ApoAlert cellfractionation kit following the manufacturer's protocol (BD Clontech,USA). Cells were trypsinized, collected, and centrifuged at 600 g for5 min at 4 °C. After being washed, the cell pellet was resuspended in0.8ml ice-cold fractionation buffermix and incubated on ice for 10minfollowed by homogenization in an ice-cold Dounce homogenizer. Thehomogenate was centrifuged at 700 g for 10min. The supernatant wasagain centrifuged at 10,000 g for 25 min at 4°C. Supernatant (cytosol)was collected and the pellet (mitochondria) was resuspended in 50 μlof cell fractionation buffer. Purity was checked by COX-IV immuno-blotting. The protein concentrationwas determined by the DC Bio-Radassay using the manufacturer's protocol (Bio-Rad Laboratories).
Catalase treatment
22Rv1 cells were pretreated with 400 units/ml concentration ofcatalase, which was followed by the addition of 1 mM H2O2 or 40 μMapigenin for 3 h. The cells were washed with PBS and then total celllysate and cytosolic and mitochondrial fractions were preparedaccording to previously described methods.
Enzyme-linked immunoabsorbent assay (ELISA) for detection ofapoptosis
22Rv1 cells were treated with varying concentrations of apigeninfor 12, 24, and 48 h, then apoptotic cells were evaluated by using theCell Death Detection ELISAplus kit (Roche Molecular Biochemicals,Indianapolis, IN, USA). The assay is based on the enrichment of mono-and oligonucleosomes in the cytoplasm of the apoptotic cells due todegradation of DNA by endogenous endonuclease (that cleavesdouble-stranded DNA at the internucleosomal linker regions). Cell
1835S. Shukla, S. Gupta / Free Radical Biology & Medicine 44 (2008) 1833–1845
lysates and the assay procedures were performed according to themanufacturer's protocol. Absorbance at 405 nm was measured as theindicator of apoptotic cells. The reference wavelength was 490 nm.The enrichment factor (total amount of apoptosis) was calculated bydividing the absorbance of the sample (A405 nm) by the absorbance ofthe controls without treatment (A490 nm).
Immunoblot analysis
22Rv1 cells were cultured on 100-mm dishes and grown toapproximately 60% confluence. The cells were then treated withapigenin and other agents and harvested at various time intervals.Tumor lysates were prepared and subjected to immunoblot analysis.Fifty micrograms of protein from total cell lysates or tumor lysates wasresolved by 10% SDS–PAGE and transferred to nitrocellulose mem-brane. After being blocked with blocking buffer (PBS containing 0.1%Tween 20 and 10% FBS) for 2 h, the membrane was incubated withprimary antibody for 2 h at room temperature. The membrane wasthen incubatedwithHRP-conjugated secondary antibodies for another2 h at room temperature. The protein was detected by ECL substratereagents (Amersham Biosciences, Arlington Heights, IL, USA).
Assay for mitochondrial membrane potential
Mitochondrial membrane potential was quantitatively determinedby flow cytometry using the lipophilic cationic probe JC-1 dye(5,5',6,6'-tetrachloro-1,1',3,3'-tetraethylbenzimidazolcarbocyanineiodide) detection kit, following the manufacturer's instructions. Inbrief, 60% confluent 22Rv1 cells were treated with apigenin (0, 20, and40 µM) for 12 h, harvested, and washed with PBS buffer and 1×10⁶
cells were incubated in 1 ml PBS containing 10 mg JC-1 dye for 15 minat 37°C in the dark. Stained cells were washed, resuspended in 500 mlPBS, and used for immediate FACS analysis.
Measurement of reactive oxygen species (ROS)
22Rv1 cells were maintained 75–80% in RPMI 1640 mediumwith10% FBS and were treated or not with NAC for 3 h. The treatmentmedium was removed and the monolayer was exposed to PBScontaining 10 µM 2'7'-dichlorofluorescein diacetate (DCF; MolecularProbes, Eugene, OR, USA), a dye that fluoresces when ROS aregenerated. The cells were incubated with the dye for 20 min, afterwhich fluorescence intensity was determined with an adherentcell laser cytometer using 488 nm for excitation and 560 nm fordetection of fluorescence emission. The values, expressed in per-centage arbitrary fluorescence units, were compared across treat-ment groups.
Transfections and p53 luciferase reporter assay
22Rv1 cells (2×10⁵ per well) were plated in 35-mm dishes andcotransfected the next day using Lipofectamine transfection reagent(Invitrogen) according to the protocol of the manufacturer done withluciferase p53-responsive reporter plasmid. Twenty-four hours later,cells were treated with various concentrations of apigenin. Thepreparation of cell lysates and luciferase activity measurementswere made with the Luciferase Assay Kit (Promega, Madison, WI,USA) according to the instructions of the manufacturer. The luciferaseactivities were normalized to β-galactosidase activity (Promega). Datashown are from one of at least two independent experiments withsimilar results.
Analysis of DNA fragmentation by agarose gel electrophoresis
The 22Rv1 cells were grown to about 70% confluence and treatedwith apigenin (1, 10, 20, 40, and 80 µM concentration) for 48 h. After
these treatments, the cells were washed twice with phosphate-buffered saline (10 mM Tris, pH 7.5, 150 mM NaCl, 5 mM MgCl2, and0.5% Triton X-100), left on ice for 15 min, and pelleted bycentrifugation (14,000 g) at 4°C. The pellet was incubated with DNAlysis buffer (10 mM Tris, pH 7.5, 400 mM NaCl, 1 mM EDTA, and1%Triton X-100) for 30min on ice and then centrifuged at 14,000 g in 4°C.The supernatant obtained was incubated overnight with RNase(0.2 mg/ml) at room temperature and then with proteinase K(0.1 mg/ml) for 2 h at 37°C. DNA was extracted with phenol:chloroform (1:1) and precipitated with 95% ethanol for 2 h at 80°C.The DNA precipitate was centrifuged at 14,000 g at 4°C for 15 min andthe pellet was air dried and dissolved in 20 μl of Tris–EDTA buffer(10 mM Tris–HCl, pH 8.0, and 1 mM EDTA). The total amount of DNAwas resolved over 1.5% agarose gel, containing 0.3 μg/ml ethidiumbromide in TBE buffer (pH 8.3, 89 mM Tris, 89 mM boric acid, and2 mM EDTA) (Bio Whittaker, Walkersville, MD, USA). The bands werevisualized under UV trans-illuminator (Model TM-36; UVP, SanGabriel, CA, USA) followed by Polaroid photography (MP-4 Photo-graphic System, Fotodyne, Hartland, WI, USA).
ELISA for NF-κB/p65/RelA activity
ELISAwas performed for NF-κB/p65/RelA activity. The commerciallyavailable Trans-AM NF-κB assay kit was obtained from Active MotifNorth America (Carlsbad, CA, USA) for assay of NF-κB/p65 activityaccording to the vendor's protocol. Briefly, the assay uses an oligonu-cleotide containing the NF-κB consensus site (5'-GGGACTTTCC-3') thatbinds to the cell extract and can detect NF-κB, which can recognize anepitope on p65 activated and bound to its target DNA. This assay isspecific for NF-κB activation and is highly sensitive.
Estimation of cellular glutathione (GSH)
Cellular GSHwas estimated according to the vendor's protocol. Cellextracts were prepared by sonication and deproteination. Total GSHwas detected by measuring the product of glutathionylated 5,5'-dithio-bis(2-nitrobenzoic acid) by UV spectrophotometer at 405 nm.The cellular GSH contents were calculated using the standard curvegenerated in parallel experiments.
Experimental design for tumor xenograft studies
22Rv1 tumors were grown subcutaneously in athymic nudemice. Approximately 1 million 22Rv1 cells suspended in 0.05 ml ofmedium and mixed with 0.05 ml of Matrigel were subcutaneouslyinjected into the left and right flank of each mouse to initiatetumor growth. The first group received only 0.2 ml of vehiclematerial by gavage daily and served as a control group. The secondand third groups of animals received 20 and 50 μg/mouse/daydoses of apigenin in vehicle, respectively, for 10 weeks. Thesedoses are comparable to the daily consumption of flavonoid inhumans as reported in previously published studies [33,34].Apigenin feeding was started 2 weeks before cell inoculation andwas continued for 10 weeks. Animals were monitored daily, andtheir body weights were recorded weekly throughout the studies.Once the tumors started growing, their sizes were measured twiceweekly in two dimensions with calipers. At the termination of theexperiment, tumors were excised and weighed to record wettumor weight. A portion of the tumors from control and treatedanimals was used for preparation of tumor lysate used in furtherexperiments.
Statistical analysis
Changes in tumor volume and body weight during the course ofthe experiments were visualized by scatter plot. Differences in
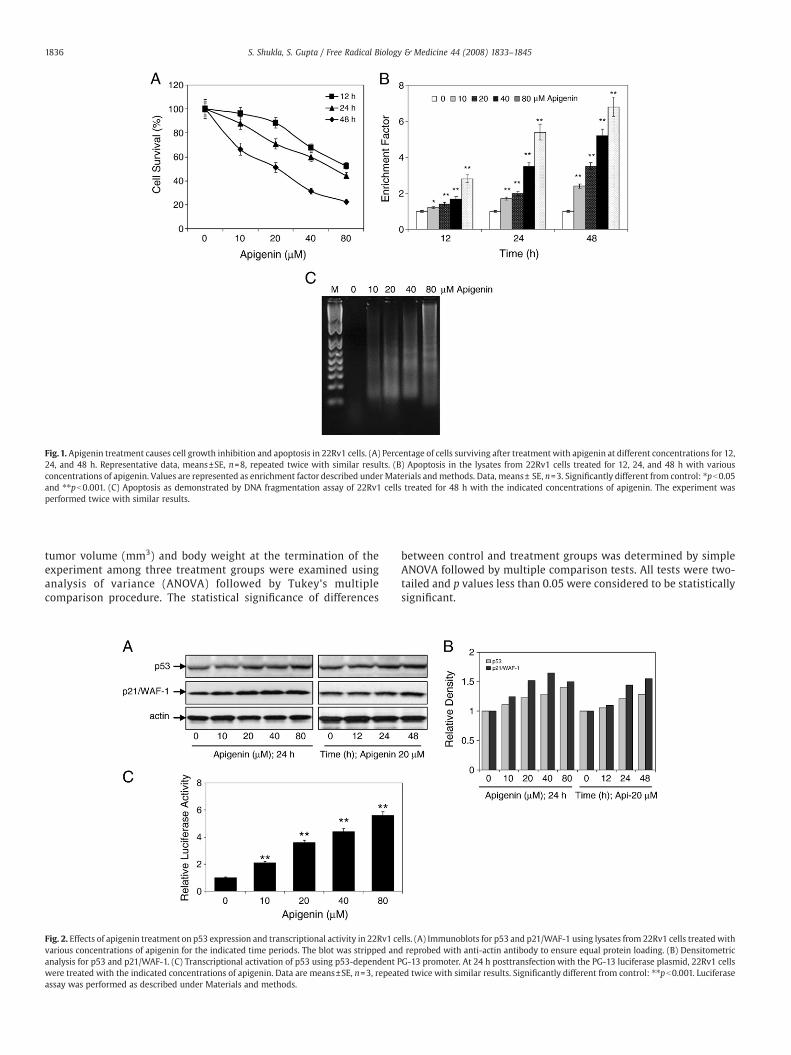
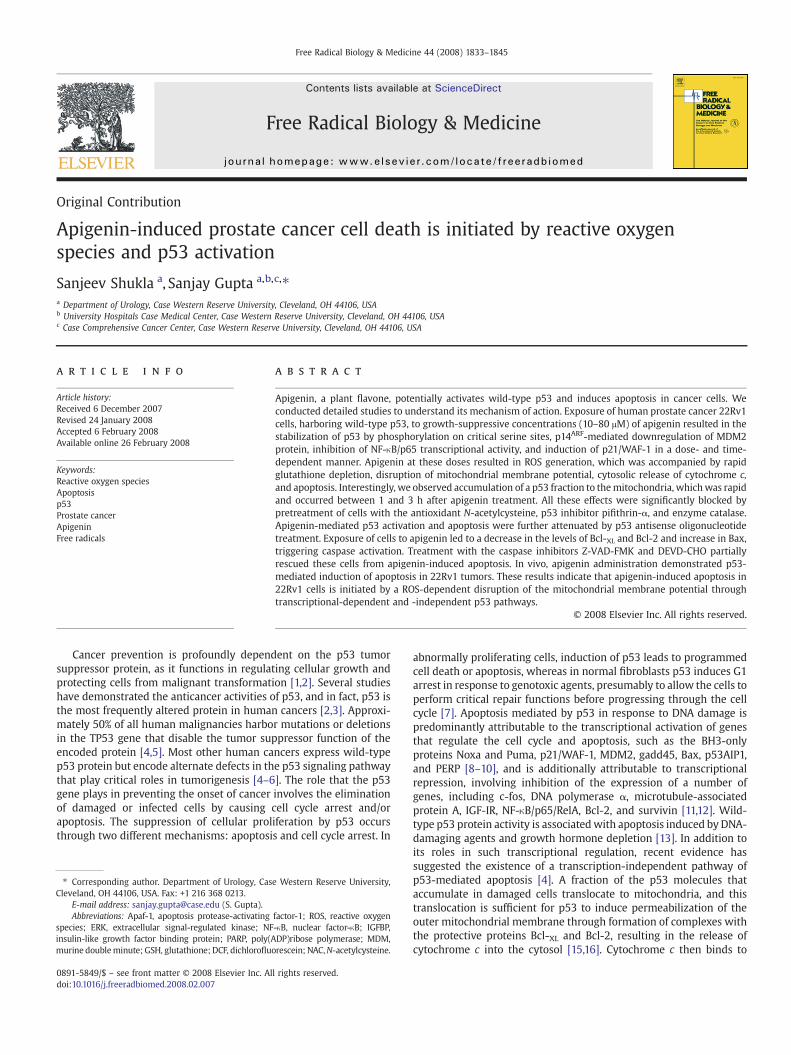
Fig.1. Apigenin treatment causes cell growth inhibition and apoptosis in 22Rv1 cells. (A) Percentage of cells surviving after treatment with apigenin at different concentrations for 12,24, and 48 h. Representative data, means±SE, n=8, repeated twice with similar results. (B) Apoptosis in the lysates from 22Rv1 cells treated for 12, 24, and 48 h with variousconcentrations of apigenin. Values are represented as enrichment factor described under Materials andmethods. Data, means± SE, n=3. Significantly different from control: ⁎pb0.05and ⁎⁎pb0.001. (C) Apoptosis as demonstrated by DNA fragmentation assay of 22Rv1 cells treated for 48 h with the indicated concentrations of apigenin. The experiment wasperformed twice with similar results.
1836 S. Shukla, S. Gupta / Free Radical Biology & Medicine 44 (2008) 1833–1845
tumor volume (mm3) and body weight at the termination of theexperiment among three treatment groups were examined usinganalysis of variance (ANOVA) followed by Tukey's multiplecomparison procedure. The statistical significance of differences
Fig. 2. Effects of apigenin treatment on p53 expression and transcriptional activity in 22Rv1 cevarious concentrations of apigenin for the indicated time periods. The blot was stripped ananalysis for p53 and p21/WAF-1. (C) Transcriptional activation of p53 using p53-dependent Pwere treated with the indicated concentrations of apigenin. Data are means±SE, n=3, repeatassay was performed as described under Materials and methods.
between control and treatment groups was determined by simpleANOVA followed by multiple comparison tests. All tests were two-tailed and p values less than 0.05 were considered to be statisticallysignificant.
lls. (A) Immunoblots for p53 and p21/WAF-1 using lysates from 22Rv1 cells treated withd reprobed with anti-actin antibody to ensure equal protein loading. (B) DensitometricG-13 promoter. At 24 h posttransfection with the PG-13 luciferase plasmid, 22Rv1 cellsed twice with similar results. Significantly different from control: ⁎⁎pb0.001. Luciferase
1837S. Shukla, S. Gupta / Free Radical Biology & Medicine 44 (2008) 1833–1845
Results
Apigenin induces inhibition of cell growth, decrease in NF-κB/p65 activity,and apoptosis in 22Rv1 cells
To study the effect of apigenin on prostate cancer, human prostatecancer 22Rv1 cells were exposed to 10–80 μM concentration ofapigenin for 12, 24, and 48 h and their viability was determinedposttreatment by MTT assay. We observed that doses higher than10 μM apigenin were effective in inhibiting cell growth in that 30%inhibition was observed at 24 h and 50% at 48 h exposure with 20 μMapigenin (Fig. 1A). Exposure of 22Rv1 cells to 20 μM apigenin caused adecrease in NF-κB/p65 transcriptional activity by 24% at 12 h, whichwas further decreased to 41% at 24 h (data not shown). To determine ifthe loss of cell viability and NF-κB/p65 transcriptional activity inducedby apigenin resulted in apoptosis, we measured apoptosis in 22Rv1cells by ELISA and DNA fragmentation assays. Apigenin-inducedapoptosis was observed as early as 12 h posttreatment, which wassignificant for 40 and 80 μM apigenin. We observed significantapoptosis in 22Rv1 cells after 24 and 48 h of treatment with 20, 40,and 80 μM apigenin (Fig. 1B). The exposure of 22Rv1 cells for 48 h toapigenin further resulted in DNA laddering in a dose-dependentmanner (Fig. 1C). These results indicate that apigenin inhibits cellgrowth, which could be a result of decreased NF-κB activity inducingapoptosis in 22Rv1 cells as a function of dose and time.
Apigenin increases the expression and transcriptional activation ofp53 in 22Rv1 cells
To investigate whether apigenin has an effect on p53 proteinexpression, we determined the p53 levels in 22Rv1 cells treated with10–80 μM doses of apigenin for 12, 24, and 48 h. Immunoblot analysisshowed that apigenin exposure increased the protein expression ofp53. The increased p53 protein expression correlated with an increasein the levels of its transcriptional target p21/WAF-1 (Fig. 2A). Therelative densities of these proteins exhibit an increase in the levels ofp53 and p21/WAF-1 with 24 h of exposure to 20 μM apigenin (Fig. 2B).To examine if increased p53 expression resulted in concurrentupregulation of its transcriptional activity, 22Rv1 cells were trans-fected with the PG-13 luciferase plasmid, which contains p53consensus binding sites. For normalizing transfection efficiency,22Rv1 cells were co-infected with a β-galactosidase plasmid. After
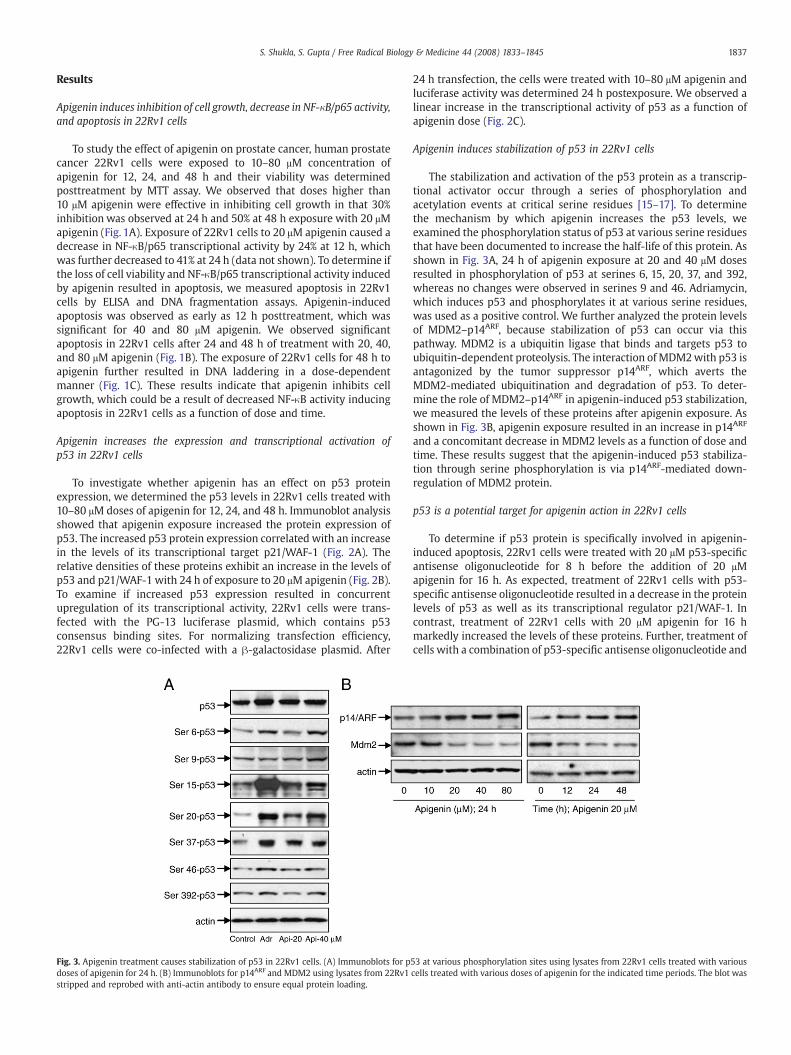
Fig. 3. Apigenin treatment causes stabilization of p53 in 22Rv1 cells. (A) Immunoblots for pdoses of apigenin for 24 h. (B) Immunoblots for p14ARF and MDM2 using lysates from 22Rv1stripped and reprobed with anti-actin antibody to ensure equal protein loading.
24 h transfection, the cells were treated with 10–80 μM apigenin andluciferase activity was determined 24 h postexposure. We observed alinear increase in the transcriptional activity of p53 as a function ofapigenin dose (Fig. 2C).
Apigenin induces stabilization of p53 in 22Rv1 cells
The stabilization and activation of the p53 protein as a transcrip-tional activator occur through a series of phosphorylation andacetylation events at critical serine residues [15–17]. To determinethe mechanism by which apigenin increases the p53 levels, weexamined the phosphorylation status of p53 at various serine residuesthat have been documented to increase the half-life of this protein. Asshown in Fig. 3A, 24 h of apigenin exposure at 20 and 40 μM dosesresulted in phosphorylation of p53 at serines 6, 15, 20, 37, and 392,whereas no changes were observed in serines 9 and 46. Adriamycin,which induces p53 and phosphorylates it at various serine residues,was used as a positive control. We further analyzed the protein levelsof MDM2–p14ARF, because stabilization of p53 can occur via thispathway. MDM2 is a ubiquitin ligase that binds and targets p53 toubiquitin-dependent proteolysis. The interaction of MDM2with p53 isantagonized by the tumor suppressor p14ARF, which averts theMDM2-mediated ubiquitination and degradation of p53. To deter-mine the role of MDM2–p14ARF in apigenin-induced p53 stabilization,we measured the levels of these proteins after apigenin exposure. Asshown in Fig. 3B, apigenin exposure resulted in an increase in p14ARF
and a concomitant decrease in MDM2 levels as a function of dose andtime. These results suggest that the apigenin-induced p53 stabiliza-tion through serine phosphorylation is via p14ARF-mediated down-regulation of MDM2 protein.
p53 is a potential target for apigenin action in 22Rv1 cells
To determine if p53 protein is specifically involved in apigenin-induced apoptosis, 22Rv1 cells were treated with 20 μM p53-specificantisense oligonucleotide for 8 h before the addition of 20 μMapigenin for 16 h. As expected, treatment of 22Rv1 cells with p53-specific antisense oligonucleotide resulted in a decrease in the proteinlevels of p53 as well as its transcriptional regulator p21/WAF-1. Incontrast, treatment of 22Rv1 cells with 20 μM apigenin for 16 hmarkedly increased the levels of these proteins. Further, treatment ofcells with a combination of p53-specific antisense oligonucleotide and
53 at various phosphorylation sites using lysates from 22Rv1 cells treated with variouscells treated with various doses of apigenin for the indicated time periods. The blot was
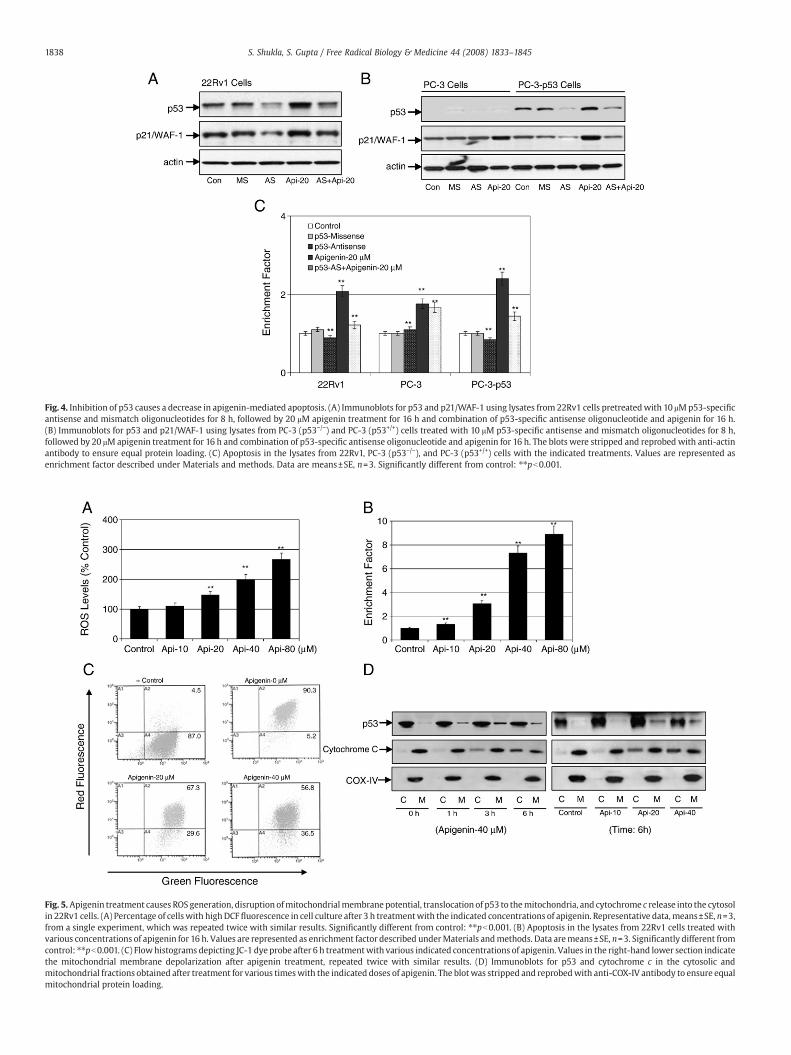
Fig. 4. Inhibition of p53 causes a decrease in apigenin-mediated apoptosis. (A) Immunoblots for p53 and p21/WAF-1 using lysates from 22Rv1 cells pretreatedwith 10 μMp53-specificantisense and mismatch oligonucleotides for 8 h, followed by 20 μM apigenin treatment for 16 h and combination of p53-specific antisense oligonucleotide and apigenin for 16 h.(B) Immunoblots for p53 and p21/WAF-1 using lysates from PC-3 (p53−/−) and PC-3 (p53+/+) cells treated with 10 μM p53-specific antisense and mismatch oligonucleotides for 8 h,followed by 20 μM apigenin treatment for 16 h and combination of p53-specific antisense oligonucleotide and apigenin for 16 h. The blots were stripped and reprobed with anti-actinantibody to ensure equal protein loading. (C) Apoptosis in the lysates from 22Rv1, PC-3 (p53−/−), and PC-3 (p53+/+) cells with the indicated treatments. Values are represented asenrichment factor described under Materials and methods. Data are means±SE, n=3. Significantly different from control: ⁎⁎pb0.001.
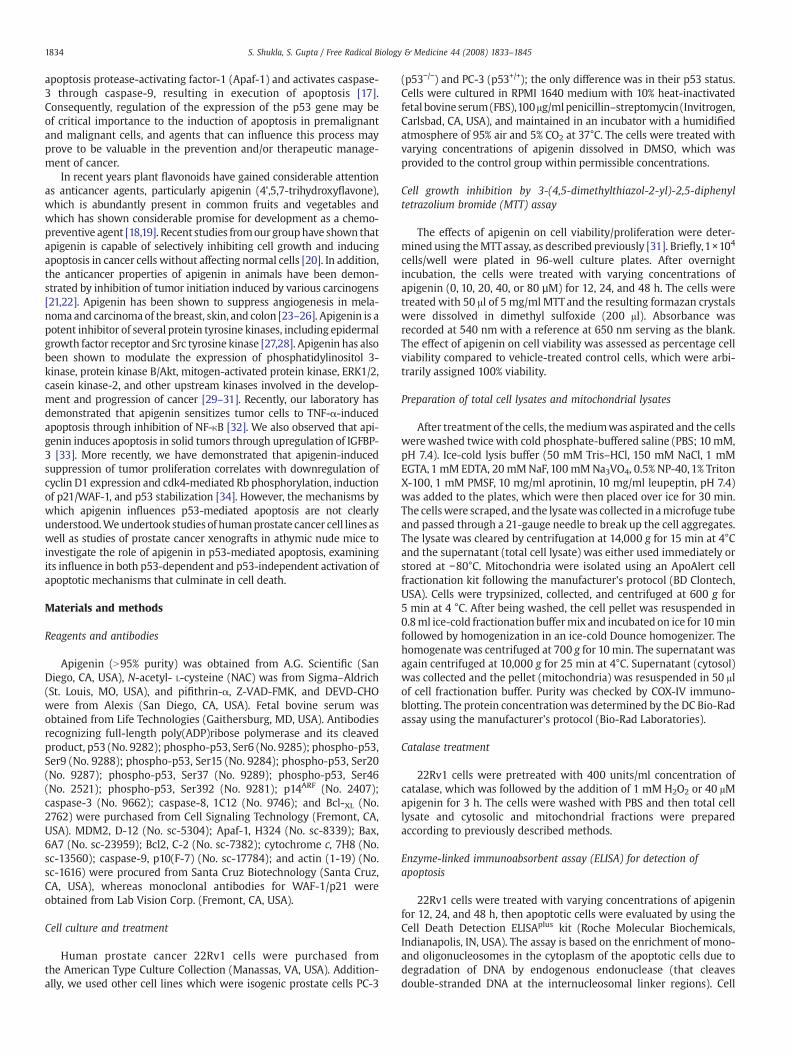
Fig. 5. Apigenin treatment causes ROS generation, disruption ofmitochondrialmembrane potential, translocation of p53 to themitochondria, and cytochrome c release into the cytosolin 22Rv1 cells. (A) Percentage of cells with highDCF fluorescence in cell culture after 3 h treatmentwith the indicated concentrations of apigenin. Representative data,means±SE, n=3,from a single experiment, which was repeated twice with similar results. Significantly different from control: ⁎⁎pb0.001. (B) Apoptosis in the lysates from 22Rv1 cells treated withvarious concentrations of apigenin for 16 h. Values are represented as enrichment factor described underMaterials andmethods. Data aremeans±SE, n=3. Significantly different fromcontrol: ⁎⁎pb0.001. (C) Flowhistograms depicting JC-1 dyeprobe after 6 h treatmentwith various indicated concentrations of apigenin. Values in the right-hand lower section indicatethe mitochondrial membrane depolarization after apigenin treatment, repeated twice with similar results. (D) Immunoblots for p53 and cytochrome c in the cytosolic andmitochondrial fractions obtained after treatment for various timeswith the indicated doses of apigenin. The blotwas stripped and reprobedwith anti-COX-IV antibody to ensure equalmitochondrial protein loading.
1838 S. Shukla, S. Gupta / Free Radical Biology & Medicine 44 (2008) 1833–1845
1839S. Shukla, S. Gupta / Free Radical Biology & Medicine 44 (2008) 1833–1845
apigenin for 16 h attenuated the effects of apigenin-induced p53 andp21/WAF-1 (Fig. 4A). Under this condition apigenin-induced apoptosiswas attenuated by the p53-specific antisense oligonucleotide andsignificantly decreased apoptosis in these cells (Fig. 4C).
To further evaluate the requirement for p53 in apigenin-mediatedapoptosis, we used isogenic prostate cancer PC-3 cells. PC-3 (p53−/−)and PC-3 (p53+/+) differ only in their p53 status. Introduction of wild-type p53 into PC-3 cells renders these cells more susceptible toapigenin exposure and causes a significant increase in apoptosiscompared to the parental cells (Fig. 4C). Indeed, apigenin-inducedincrease in p53 protein was effectively inhibited by treatment withp53-specific antisense oligonucleotide, which was attenuated byaddition of 20 μM apigenin (Fig. 4B). These results indicate that p53protein plays a critical role in apigenin-induced apoptotic cell death.
Apigenin treatment induces reactive oxygen species generation in 22Rv1cells
Next we evaluated the hypothesis that apigenin-induced apoptosisis initiated by ROS, which have been implicated in apoptosis induc-tion by various stimuli, including ionizing radiation, hyperoxia, andtherapeutic/chemopreventive agents [13–16]. Intracellular ROS levelsin 22Rv1 cells after apigenin exposure was assessed using fluoro-metric analysis. We used the fluorescence probe 2',7'-chlorofluor-escein diacetate, which converts to highly fluorescent DCF in thepresence of intracellular ROS. A time-course study using 40 μMapigenin showed an increase in ROS generation as early as 1 h afterapigenin treatment, which peaked at approximately 3–4 h, followedby a decreasing trend (data not shown). Therefore, we next assessedthe levels of ROS after 3 h of apigenin treatment. As shown in Fig. 5A,exposure of 22Rv1 cells to 10–80 μM apigenin for 3 h resulted in a
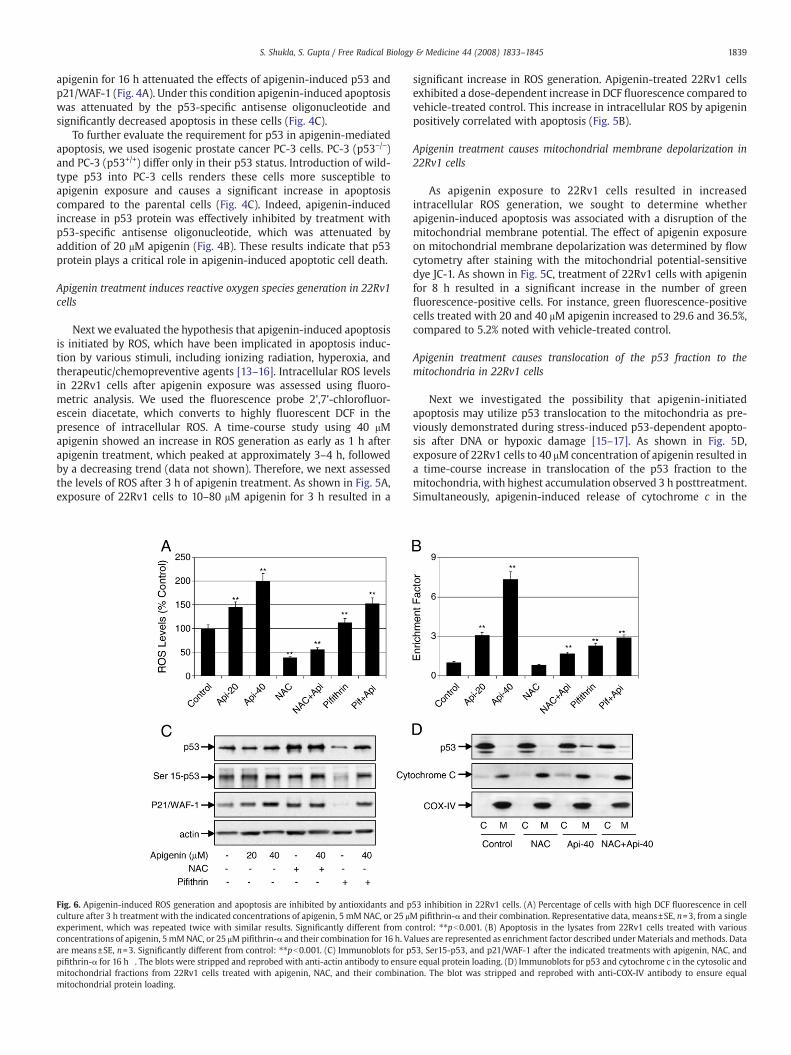
Fig. 6. Apigenin-induced ROS generation and apoptosis are inhibited by antioxidants and pculture after 3 h treatment with the indicated concentrations of apigenin, 5 mM NAC, or 25 μexperiment, which was repeated twice with similar results. Significantly different from coconcentrations of apigenin, 5mMNAC, or 25 μMpifithrin-α and their combination for 16 h. Vaare means±SE, n=3. Significantly different from control: ⁎⁎pb0.001. (C) Immunoblots for ppifithrin-α for 16 h . The blots were stripped and reprobed with anti-actin antibody to ensurmitochondrial fractions from 22Rv1 cells treated with apigenin, NAC, and their combinatmitochondrial protein loading.
significant increase in ROS generation. Apigenin-treated 22Rv1 cellsexhibited a dose-dependent increase in DCF fluorescence compared tovehicle-treated control. This increase in intracellular ROS by apigeninpositively correlated with apoptosis (Fig. 5B).
Apigenin treatment causes mitochondrial membrane depolarization in22Rv1 cells
As apigenin exposure to 22Rv1 cells resulted in increasedintracellular ROS generation, we sought to determine whetherapigenin-induced apoptosis was associated with a disruption of themitochondrial membrane potential. The effect of apigenin exposureon mitochondrial membrane depolarization was determined by flowcytometry after staining with the mitochondrial potential-sensitivedye JC-1. As shown in Fig. 5C, treatment of 22Rv1 cells with apigeninfor 8 h resulted in a significant increase in the number of greenfluorescence-positive cells. For instance, green fluorescence-positivecells treated with 20 and 40 μM apigenin increased to 29.6 and 36.5%,compared to 5.2% noted with vehicle-treated control.
Apigenin treatment causes translocation of the p53 fraction to themitochondria in 22Rv1 cells
Next we investigated the possibility that apigenin-initiatedapoptosis may utilize p53 translocation to the mitochondria as pre-viously demonstrated during stress-induced p53-dependent apopto-sis after DNA or hypoxic damage [15–17]. As shown in Fig. 5D,exposure of 22Rv1 cells to 40 μM concentration of apigenin resulted ina time-course increase in translocation of the p53 fraction to themitochondria, with highest accumulation observed 3 h posttreatment.Simultaneously, apigenin-induced release of cytochrome c in the
53 inhibition in 22Rv1 cells. (A) Percentage of cells with high DCF fluorescence in cellM pifithrin-α and their combination. Representative data, means±SE, n=3, from a singlentrol: ⁎⁎pb0.001. (B) Apoptosis in the lysates from 22Rv1 cells treated with variouslues are represented as enrichment factor described underMaterials andmethods. Data53, Ser15-p53, and p21/WAF-1 after the indicated treatments with apigenin, NAC, ande equal protein loading. (D) Immunoblots for p53 and cytochrome c in the cytosolic andion. The blot was stripped and reprobed with anti-COX-IV antibody to ensure equal
1840 S. Shukla, S. Gupta / Free Radical Biology & Medicine 44 (2008) 1833–1845
cytosol was observed at 3 h with increasing trend up to 6 h. Dose-dependent studies with 10–40 μM apigenin exposure for 6 h exhibitedsimilar increases in p53 in the mitochondrial fraction along with therelease of cytochrome c into the cytosol (Fig. 5D).
NAC pretreatment protects against apigenin-induced ROS generationand apoptosis in 22Rv1 cells
To test whether augmented ROS levels play a role in mediating thedeath signal of p53, 22Rv1 cells were pretreated with a well-knownantioxidant, NAC, at 5 mM concentration or 25 μM pifithrin-α, a well-known p53 inhibitor, for 3 h. Both NAC and pifithrin-α treatmentexhibited protective effects against apigenin-induced and p53-mediated apoptosis as well as attenuating the intracellular ROS gen-eration in 22Rv1 cells, albeit at different levels (Figs. 6A and B).
To determine the relationship between ROS and the apoptoticcascade of p53 after apigenin exposure, we used NAC and pifithrin-αto further test whether they could influence p53 levels and apoptosisin 22Rv1 cells. As shown in Fig. 6C, treatment of cells with apigeninbefore NAC exposure caused an increase in p53-Ser15 phosphoryla-tion and induction of p21/WAF-1, suggesting that ROS and p53 re-gulate the apoptotic process of 22Rv1 cells after apigenin treatment.Further, NAC pretreatment inhibited the translocation of p53 to themitochondria and the release of cytochrome c into the cytosol of22Rv1 cells after exposure to apigenin (Fig. 6D).
Apigenin treatment causes glutathione depletion in 22Rv1 cells
Because apigenin induced cytotoxicity by causing excessive ROSaccumulation, we next investigated the mechanisms by whichapigenin caused an increase in ROS generation. Based on the importantrole of GSH as a major cellular antioxidant, we postulated that theactive ROS generation in 22Rv1 cells would render them highlydependent on GSH to maintain redox balance and that a depletion ofGSH by apigenin would result in excessive ROS generation, triggeringp53 stabilization, whichmay drive the damaged cells to apoptosis [35].To test this possibility we first examined the effects of apigenin on GSH
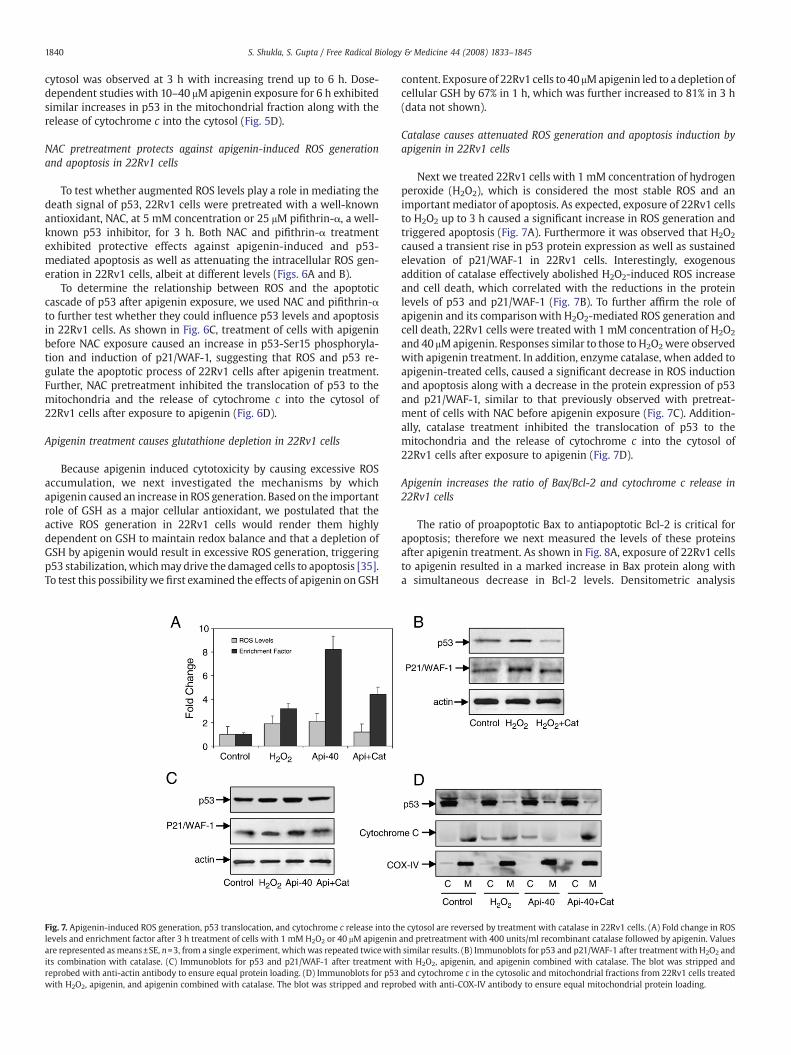
Fig. 7. Apigenin-induced ROS generation, p53 translocation, and cytochrome c release into thlevels and enrichment factor after 3 h treatment of cells with 1 mM H2O2 or 40 μM apigeninare represented as means±SE, n=3, from a single experiment, which was repeated twice withits combination with catalase. (C) Immunoblots for p53 and p21/WAF-1 after treatment wreprobed with anti-actin antibody to ensure equal protein loading. (D) Immunoblots for p53with H2O2, apigenin, and apigenin combined with catalase. The blot was stripped and repro
content. Exposure of 22Rv1 cells to 40 μMapigenin led to a depletion ofcellular GSH by 67% in 1 h, which was further increased to 81% in 3 h(data not shown).
Catalase causes attenuated ROS generation and apoptosis induction byapigenin in 22Rv1 cells
Next we treated 22Rv1 cells with 1 mM concentration of hydrogenperoxide (H2O2), which is considered the most stable ROS and animportant mediator of apoptosis. As expected, exposure of 22Rv1 cellsto H2O2 up to 3 h caused a significant increase in ROS generation andtriggered apoptosis (Fig. 7A). Furthermore it was observed that H2O2
caused a transient rise in p53 protein expression as well as sustainedelevation of p21/WAF-1 in 22Rv1 cells. Interestingly, exogenousaddition of catalase effectively abolished H2O2-induced ROS increaseand cell death, which correlated with the reductions in the proteinlevels of p53 and p21/WAF-1 (Fig. 7B). To further affirm the role ofapigenin and its comparisonwith H2O2-mediated ROS generation andcell death, 22Rv1 cells were treated with 1 mM concentration of H2O2
and 40 μMapigenin. Responses similar to those to H2O2were observedwith apigenin treatment. In addition, enzyme catalase, when added toapigenin-treated cells, caused a significant decrease in ROS inductionand apoptosis along with a decrease in the protein expression of p53and p21/WAF-1, similar to that previously observed with pretreat-ment of cells with NAC before apigenin exposure (Fig. 7C). Addition-ally, catalase treatment inhibited the translocation of p53 to themitochondria and the release of cytochrome c into the cytosol of22Rv1 cells after exposure to apigenin (Fig. 7D).
Apigenin increases the ratio of Bax/Bcl-2 and cytochrome c release in22Rv1 cells
The ratio of proapoptotic Bax to antiapoptotic Bcl-2 is critical forapoptosis; therefore we next measured the levels of these proteinsafter apigenin treatment. As shown in Fig. 8A, exposure of 22Rv1 cellsto apigenin resulted in a marked increase in Bax protein along witha simultaneous decrease in Bcl-2 levels. Densitometric analysis
e cytosol are reversed by treatment with catalase in 22Rv1 cells. (A) Fold change in ROSand pretreatment with 400 units/ml recombinant catalase followed by apigenin. Valuessimilar results. (B) Immunoblots for p53 and p21/WAF-1 after treatment with H2O2 andith H2O2, apigenin, and apigenin combined with catalase. The blot was stripped andand cytochrome c in the cytosolic and mitochondrial fractions from 22Rv1 cells treatedbed with anti-COX-IV antibody to ensure equal mitochondrial protein loading.

Fig. 8. Apigenin treatment caused a modulation in Bcl-2 family member proteins, Apaf-1, and cytochrome c in 22Rv1 cells. (A) Immunoblots for Bax, Bcl-2, Bcl-XL, Apaf-1, andcytochrome c using lysates from 22Rv1 cells treated with various concentrations of apigenin for the indicated time periods. The blots were stripped and reprobed with anti-actinantibody to ensure equal protein loading. (B) Densitometric analysis for proteins.
1841S. Shukla, S. Gupta / Free Radical Biology & Medicine 44 (2008) 1833–1845
indicated that the shift in Bax/Bcl-2 ratio in favor of apoptosis was afunction of dose and time (Fig. 8B). Apigenin treatment also resulted ina decrease in Bcl-XL protein and an increase in cytochrome c and Apaf-1 levels in the cytosol (Figs. 8A and B).
Apigenin induces caspase activation and PARP cleavage in 22Rv1 cells
We demonstrated earlier that apigenin-induced apoptosis in 22Rv1cells is associatedwith a shift in the Bax/Bcl-2 ratio and disruption of themitochondrial membrane potential, leading to the release of cyto-
Fig. 9. Apigenin treatment causes caspase activation, PARP cleavage, and apoptosis,whichwasp3, -8, and -9 using lysates from 22Rv1 cells treatedwith various concentrations of apigenin for ttreatmentwithvarious concentrationsof apigenin for the indicated timeperiods. Full-length (10in22Rv1 cells after treatmentof cellswith40 μMapigenin aswell as pretreatmentwith thegeneby apigenin. Values are means±SE, n=3, from a single experiment, which was repeated twice
chrome c and other apoptogenic molecules from the mitochondria tothe cytosol (Figs. 8A and B). Once in the cytosol, cytochrome c binds toApaf-1 and recruits and activates caspase-9 in the apoptosome. Activecaspase-9 cleaves andactivates executioner caspases, including caspase-3.We therefore determined caspase activation after apigenin treatment.Exposure of 22Rv1 cells for 24 h to apigenin led to increased levels ofactive caspase-9 and -3 and caused cleavageof PARPasa functionof doseand time. In addition, apigenin exposure also increased the levels ofactive caspase-8 in 22Rv1 cells, suggesting the involvement of bothextrinsic and intrinsic pathways of apoptosis (Figs. 9A and B).
artiallyprotectedagainst bycaspase inhibitors in22Rv1cells. (A) Immunoblots for caspase-he indicated time periods. (B) Cleavage of poly(ADP)ribose polymerase in 22Rv1 cells after8kDa) and cleavedproducts (89 kDa) are depicted. (C) Apoptosis asdemonstratedbyELISAral caspase inhibitor Z-VAD-FMKand the caspase-3-specific inhibitorDEVD-CHO, followedwith similar results. Significantly different from control: ⁎⁎pb0.001.
1842 S. Shukla, S. Gupta / Free Radical Biology & Medicine 44 (2008) 1833–1845
Next we evaluated whether blocking caspases could inhibitapigenin-mediated p53-dependent apoptosis in these cells. Exposureof cells to the general caspase inhibitor Z-VAD-FMK before apigenintreatment partially blocked apoptosis. Further, use of the caspase-3inhibitor DEVD-CHO partially rescued the cells from apigenin-inducedapoptosis, at higher levels than Z-VAD-FMK (Fig. 9C). None of theseinhibitors, however, affected the p53 serine phosphorylation in 22Rv1cells (data not shown).
Apigenin intake inhibits growth of 22Rv1 xenografts in athymic nudemice
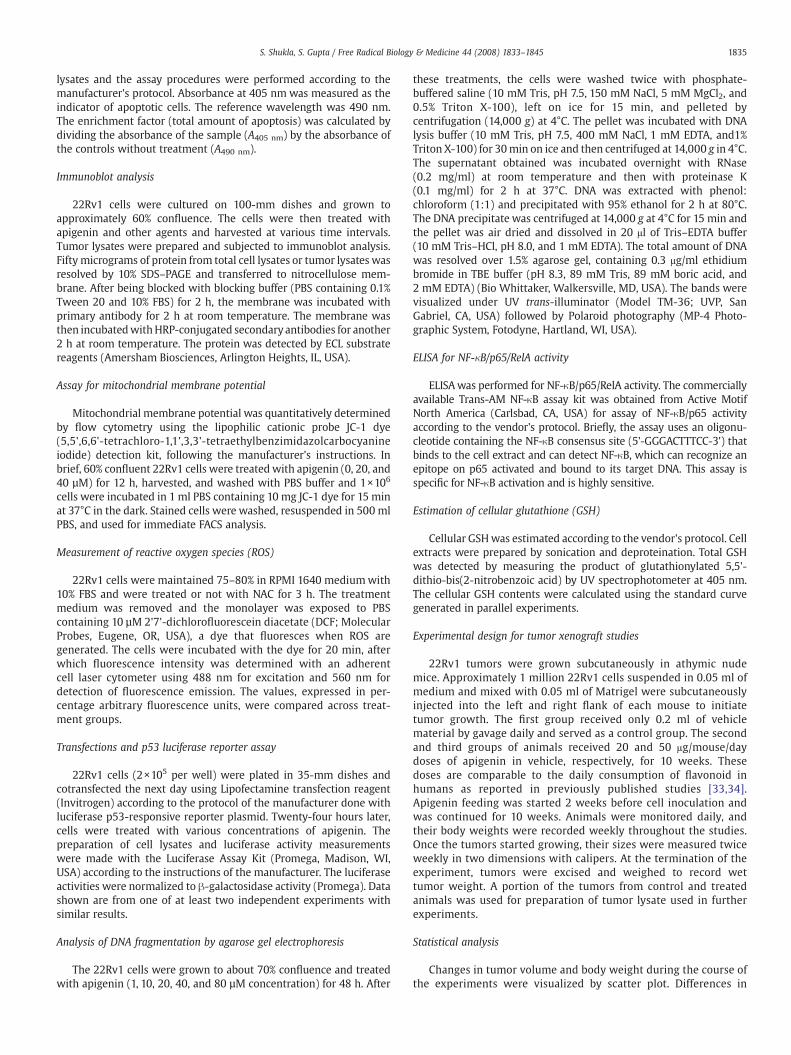
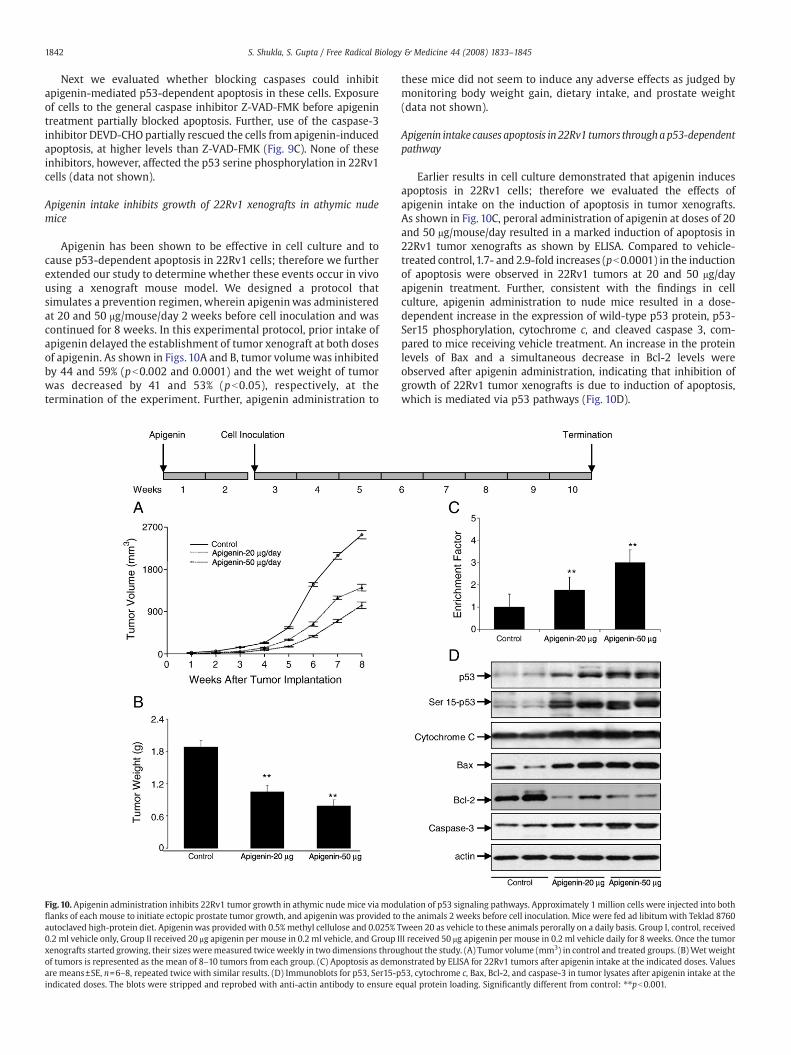
Apigenin has been shown to be effective in cell culture and tocause p53-dependent apoptosis in 22Rv1 cells; therefore we furtherextended our study to determine whether these events occur in vivousing a xenograft mouse model. We designed a protocol thatsimulates a prevention regimen, wherein apigeninwas administeredat 20 and 50 μg/mouse/day 2 weeks before cell inoculation and wascontinued for 8 weeks. In this experimental protocol, prior intake ofapigenin delayed the establishment of tumor xenograft at both dosesof apigenin. As shown in Figs. 10A and B, tumor volumewas inhibitedby 44 and 59% (pb0.002 and 0.0001) and the wet weight of tumorwas decreased by 41 and 53% (pb0.05), respectively, at thetermination of the experiment. Further, apigenin administration to
Fig. 10. Apigenin administration inhibits 22Rv1 tumor growth in athymic nude mice via modflanks of each mouse to initiate ectopic prostate tumor growth, and apigeninwas provided toautoclaved high-protein diet. Apigeninwas provided with 0.5% methyl cellulose and 0.025% T0.2 ml vehicle only, Group II received 20 μg apigenin per mouse in 0.2 ml vehicle, and Group Ixenografts started growing, their sizes weremeasured twice weekly in two dimensions throuof tumors is represented as the mean of 8–10 tumors from each group. (C) Apoptosis as demoare means±SE, n=6–8, repeated twice with similar results. (D) Immunoblots for p53, Ser15-pindicated doses. The blots were stripped and reprobed with anti-actin antibody to ensure e
these mice did not seem to induce any adverse effects as judged bymonitoring body weight gain, dietary intake, and prostate weight(data not shown).
Apigenin intake causes apoptosis in 22Rv1 tumors throughap53-dependentpathway
Earlier results in cell culture demonstrated that apigenin inducesapoptosis in 22Rv1 cells; therefore we evaluated the effects ofapigenin intake on the induction of apoptosis in tumor xenografts.As shown in Fig. 10C, peroral administration of apigenin at doses of 20and 50 μg/mouse/day resulted in a marked induction of apoptosis in22Rv1 tumor xenografts as shown by ELISA. Compared to vehicle-treated control,1.7- and 2.9-fold increases (pb0.0001) in the inductionof apoptosis were observed in 22Rv1 tumors at 20 and 50 μg/dayapigenin treatment. Further, consistent with the findings in cellculture, apigenin administration to nude mice resulted in a dose-dependent increase in the expression of wild-type p53 protein, p53-Ser15 phosphorylation, cytochrome c, and cleaved caspase 3, com-pared to mice receiving vehicle treatment. An increase in the proteinlevels of Bax and a simultaneous decrease in Bcl-2 levels wereobserved after apigenin administration, indicating that inhibition ofgrowth of 22Rv1 tumor xenografts is due to induction of apoptosis,which is mediated via p53 pathways (Fig. 10D).
ulation of p53 signaling pathways. Approximately 1 million cells were injected into boththe animals 2 weeks before cell inoculation. Mice were fed ad libitumwith Teklad 8760ween 20 as vehicle to these animals perorally on a daily basis. Group I, control, receivedII received 50 μg apigenin per mouse in 0.2 ml vehicle daily for 8 weeks. Once the tumorghout the study. (A) Tumor volume (mm3) in control and treated groups. (B)Wet weightnstrated by ELISA for 22Rv1 tumors after apigenin intake at the indicated doses. Values53, cytochrome c, Bax, Bcl-2, and caspase-3 in tumor lysates after apigenin intake at thequal protein loading. Significantly different from control: ⁎⁎pb0.001.
1843S. Shukla, S. Gupta / Free Radical Biology & Medicine 44 (2008) 1833–1845
Discussion
In this study, we demonstrated that apigenin is able to induceapoptosis in 22Rv1 cells and in in vivo tumors. This induction ofapoptosis is accompanied by increases in ROS production, p53 phos-phorylation, and p21/WAF-1 induction; alterations inMDM2/p14ARF; adecrease in NF-κB/p65 transcriptional activity leading to loss ofmitochondrial membrane potential; and caspase activation. Althoughour study and prior studies have shown that apigenin-induced p53-dependent apoptosis occurs inprostate cancer and othermalignancies,the pathways whereby p53 leads to execution of the apoptosis pro-gram are not well characterized.
There is accumulating evidence that apigenin can suppress thegrowth of malignant prostate cells as well as tumor xenografts in vivoby causing cell cycle arrest and apoptosis [31–34,36]. In this study wehave demonstrated that the p53-associated pathway is required forapigenin-mediated apoptosis, as evidenced by the p53 antisenseoligonucleotide experiment. Apigenin-induced p53 response inprostate cancer cells is primarily achieved through DNA damage viainitiation and generation of ROS. We observed that exposure of 22Rv1cells to growth-suppressive concentrations of apigenin resulted inROS generation as indicated by an increase in oxidation of DCF. Thisincrease in ROS production leads to activation and increase in thecellular levels of p53. This increase in p53 expression was accom-panied by phosphorylation of p53 at serines 6, 15, 20, 37, and 392, butnot at serines 9 and 46. Phosphorylation of p53 at serines 15 and 20has been shown to stimulate p53-dependent transcriptional activa-tion [37] and also results in reduced interaction of p53 with itsnegative regulator MDM2 both in vivo and in vitro [24,38]. Apigenintreatment also resulted in increased expression of p14ARF, a tumorsuppressor that negatively regulates MDM2 [39]. Our results indicatethat apigenin stabilizes p53 via both phosphorylation of p53 andmodulation of the p14ARF–MDM2 pathway. Interestingly, we observeda decrease in the levels of MDM2 protein in response to apigenintreatment. We speculate that this decrease may be directly mediatedby apigenin at the transcriptional level [40] or may be a result of anapigenin-mediated increase in p14ARF levels [41].
The importance of p53 in apigenin-mediated apoptosis was furtherdemonstrated by the introduction of wild-type p53 in PC-3 cells,which have a p53-null status. Compared to parental PC-3 cells, thep53-PC-3 cells were more sensitive to apigenin-mediated apoptosis,similar to 22Rv1 cells, which harbor wild-type p53. Additionally,apigenin-induced stabilization of p53 caused an increase in itstranscriptional activity, thereby resulting in an upregulation of itsdownstream target p21/WAF-1. p21/WAF-1 can inhibit cdk's 2, 4, and6, causing cell cycle arrest [42]. Earlier studies from our laboratoryhave demonstrated that apigenin-mediated upregulation of p21/WAF-1 is critical in inducing both cell cycle arrest and apoptosis [31,34]. Themechanisms by which p21 promotes apoptosis are not currentlyunderstood, but may be related to its ability to interact with andpossibly regulate components of the DNA repair machinery [43].
Several recent reports suggest a role for ROS in apoptosis inducedby drugs, including certain chemopreventive agents, through theengagement of downstream proteins involved in execution ofapoptosis [44–46]. Intracellular generation of H2O2, the most stableROS, has been considered an important mediator of apoptosis, andeven exogenous addition of H2O2 is a potent activator of the apoptoticmachinery [47]. In our studies, sublethal concentrations of H2O2
caused an increase in p53 protein expression along with sustainedelevation of p21/WAF-1, which correlated with increased apoptosisobserved in these cells. These effects were alleviated by pretreatmentof cells with 400 units/ml concentration of catalase. There is evidencethat mitochondrial catalase provides protective effects againstexogenously added H2O2, which suggests that some of the addedH2O2 diffuses into the mitochondria and perhaps causes damage tothe mitochondrial membrane [47,48]. This suggests that mitochond-
rially produced H2O2 diffuses into the cytosol where it may exertcytotoxic effects. It seems that catalase produced in any cellularcompartment might act as a sink for H2O2 and further addition ofcatalase may promote H2O2 movement down to its concentrationgradient. Further reports suggest that catalase added to the culturemedium might protect cells against oxidant-induced injury, whereasthis may reflect some uptake of catalase into the cells by endocytosisand/or removal of diffusible H2O2 from the cells [48]. Underphysiological conditions, H2O2 may play an important role in signaltransduction pathways and activation of p53 [49]. Our studies indicatethat intracellular H2O2 generation induced by exogenous H2O2 orapigenin was suppressed by the addition of catalase, which in turninhibited the release of cytochrome c into the cytosol as well astranslocation of p53 to the mitochondria.
It is well established that p53 is a transcriptional regulator and thatp53-mediated apoptosis in response to DNA damage is predominantlyattributable both to the transcriptional activation of genes that encodeapoptotic effectors, such as Bax, and to transcriptional repression ofgenes for antiapoptotic proteins such as Bcl-2 [8–10]. In this context,upregulation of Bcl-2 by NF-κB might be critical in compromising theapoptotic abilities of p53. We have shown that apigenin inhibits thetranscriptional activity of NF-κB/p65, downregulates the levels of Bcl-2 and Bcl-XL, and concomitantly upregulates the levels of Bax protein,shifting the Bax/Bcl-2 ratio in favor of apoptosis. In addition to suchtranslational regulation, recent findings have demonstrated theexistence of a transcription-independent pathway of p53-mediatedapoptosis, wherein a fraction of the p53 molecule accumulates in thedamaged cells and translocates to mitochondria in quantitiessufficient to induce permeabilization of the outer mitochondrialmembrane, resulting in the release of cytochrome c [15,16]. Ourstudies demonstrate that apigenin causes the translocation of p53 tothe mitochondria as early as 1 h, peaking at 3 h post-apigenintreatment. This increased translocation of p53 to the mitochondrialeads to cytochrome c release observed as early as 3 h and increasingup to 24 h post-apigenin treatment. Because apigenin-induced p53activation and translocation are dependent on ROS generation, whichwas evident as early as 1 h posttreatment, whereas the translocationof p53 and cytochrome c release were not observed until 3–6 h afterapigenin exposure, we conclude that ROS act as upstream signalingmolecules to initiate p53-mediated cell death responses. This hypo-thesis is further supported by our findings that pretreatment of 22Rv1cells with NAC not only prevents ROS generation but also confersalmost complete protection against apigenin-induced p53-transloca-tion to the mitochondria, cytochrome c release, and cell death. More-over, inhibition of p53 by the use of pifithrin-α protected tumor cellsfrom apigenin-induced apoptosis, further demonstrating the involve-ment of p53 in cell death. ROS generation in apoptosis induction bysome agents has been shown to occur downstream of cytochrome crelease; however, apigenin-induced release of cytochrome c is signif-icantly inhibited by pretreatment with NAC. These results indicatethat ROS acts as a trigger for apigenin-induced apoptosis upstream ofboth p53 and cytochrome c.
Many apoptotic cascades in eukaryotic cells utilizemitochondria asa nodal point at which diverse death stimuli translate from initiationto execution of apoptosis [50,51]. Mitochondria play an essential rolein death signal transduction through the permeability transition poreopening and collapse of the mitochondrial membrane potential,resulting in the rapid release of caspase activators such as cytochromec into the cytoplasm. Cytochrome c then binds to Apaf-1 and activatescaspase-3 through caspase-9, culminating in cell death [50,51]. Wedemonstrated that the release of cytochrome c into the cytosolincreased within 3 h of apigenin treatment, a time frame parallel tothat for initiation of apoptosis. Furthermore, the increase in cyto-chrome c paralleled Apaf-1 levels observed between 3 and 24 h ofapigenin exposure, which led to the activation of caspase-3 andcleavage of poly(ADP)ribose polymerase. In addition, we also observed
1844 S. Shukla, S. Gupta / Free Radical Biology & Medicine 44 (2008) 1833–1845
an increase in caspase-8, albeit at higher doses of apigenin treatment.The general caspase inhibitor, Z-VAD-FMK, led to the protection of22Rv1 cells against apoptosis, indicating that apigenin-mediatedapoptosis is caspase dependent. Our data suggest that the caspase-8and the caspase-9 activation pathways contributed to the activation ofthe executioner caspase-3. In our studies, the protective effect of thecaspase-3 inhibitor, DEVD-CHO, against apigenin-induced apoptosiswas greater than that of Z-VAD-FMK, indicating the involvement ofadditional caspases in execution of cell death by apigenin. Furtherwork is required to examine the detailed mechanism(s) of apigeninwith respect to the death receptor cascades as well as the endoplasmicreticulum-stress activated caspases.
In our cell culture studies, growth inhibition and apoptosis in-duction by apigeninwere observed at 10–40 μMconcentrations, whichprovided mechanistic insights; however, demonstration that theseeffects are also operative in vivo is required to establish a potential forclinical development. Our in vivo studies using 20 and 50 μg/dayapigenin administration to mice with prostate cancer xenograftsconfirmed that apigenin administration significantly inhibited tumorgrowth, without any apparent signs of toxicity. Consistent with thefindings in cell culture, apigenin intake resulted in p53 activation andits phosphorylation at serine 15, cytochrome c release, increase in thelevels of cleaved caspase-3, and altered Bax and Bcl-2 protein levels,favoring apoptosis, compared to vehicle-treated animals. Based onthese observations it is apparent that apigenin most likely exerts itscancer preventive/therapeutic effects directly through the p53 signal-ing pathway, utilizing mitochondria as a universal key effector of celldeath. Understanding the modes of action of apigenin should provideuseful information for its possible application in cancer prevention andperhaps in therapy for prostate cancer.
Acknowledgments
This researchwas supported by the Athymic Animal Core Facility ofthe Comprehensive Cancer Center of Case Western Reserve Universityand University Hospitals Case Medical Center (P30 CA43703). Thiswork was also supported by grants from the U.S. Public HealthServices, RO1 CA108512, RO1 AT002709, RO3 CA094248, and RO3CA099049, and received partial support of funds from the CancerResearch and Prevention Foundation to S.G. The authors are thankfulto Dr. Pingfu Fu for performing statistical evaluations for this study.
References
[1] Selivanova, G. p53: fighting cancer. Curr. Cancer Drug Targets 4:385–402; 2004.[2] Oren, M. Decision making by p53: life, death and cancer. Cell Death Differ.
10:431–442; 2003.[3] Bode, A. M.; Dong, Z. Post-translational modification of p53 in tumorigenesis. Nat.
Rev., Cancer 4:793–805; 2004.[4] Russo,A.; Bazan,V.; Iacopetta, B.; Kerr,D.; Soussi, T.;Gebbia,N., TP53–CRCCollaborative
Study Group. The TP53 Colorectal Cancer International Collaborative Study on theprognostic and predictive significance of p53mutation: influence of tumor site, type ofmutation, and adjuvant treatment. J. Clin. Oncol. 23:7518–7528; 2005.
[5] Roncuzzi, L.; Brognara, I.; Baiocchi, D.; Amadori, D.; Gasperi-Campani, A. Loss ofheterozygosity at 17p13.3–ter, distal to TP53, correlates with negative hormonalphenotype in sporadic breast cancer. Oncol. Rep. 14:471–474; 2005.
[6] Downing, S. R.; Russell, P. J.; Jackson, P. Alterations of p53 are common in earlystage prostate cancer. Can. J. Urol. 10:1924–1933; 2003.
[7] Jackson, J. G.; Pereira-Smith, O. M. p53 is preferentially recruited to the promotersof growth arrest genes p21 and GADD45 during replicative senescence of normalhuman fibroblasts. Cancer Res. 66:8356–8360; 2006.
[8] Bohm,M.;Wolff, I.; Scholzen, T. E.; Robinson, S. J.; Healy, E.; Luger, T. A.; Schwarz, T.;Schwarz, A. Alpha-melanocyte-stimulating hormone protects from ultravioletradiation-induced apoptosis and DNA damage. J. Biol. Chem. 280:5795–5802; 2005.
[9] Baus, F.; Gire, V.; Fisher, D.; Piette, J.; Dulic, V. Permanent cell cycle exit in G2 phaseafter DNA damage in normal human fibroblasts. EMBO J. 22:3992–4002; 2003.
[10] Flatt, P. M.; Price, J. O.; Shaw, A.; Pietenpol, J. A. Differential cell cycle checkpointresponse in normal human keratinocytes and fibroblasts. Cell Growth Differ.9:535–543; 1998.
[11] Shen, Y.; Shenk, T. Relief of p53-mediated transcriptional repression by theadenovirus E1B 19-kDa protein or the cellular Bcl-2 protein. Proc. Natl. Acad. Sci.U. S. A. 91:8940–8944; 1994.
[12] Hoffman, W. H.; Biade, S.; Zilfou, J. T.; Chen, J.; Murphy, M. Transcriptionalrepression of the anti-apoptotic survivin gene by wild type p53. J. Biol. Chem.277:3247–3257; 2002.
[13] Caelles, C.; Helmberg, A.; Karin, M. p53-dependent apoptosis in the absence oftranscriptional activation of p53-target genes. Nature 370:220–223; 1994.
[14] Haupt, Y.; Rowan, S.; Shaulian, E.; Vousden, K. H.; Oren, M. Induction of apoptosisin HeLa cells by trans-activation-deficient p53. Genes Dev. 9:2170–2183; 1995.
[15] Marchenko, N. D.; Zaika, A.; Moll, U. M. Death signal-induced localization of p53protein to mitochondria: a potential role in apoptotic signaling. J. Biol. Chem.275:16202–16212; 2000.
[16] Arima, Y.; Nitta, M.; Kuninaka, S.; Zhang, D.; Fujiwara, T.; Taya, Y.; Nakao, M.; Saya,H. Transcriptional blockade induces p53-dependent apoptosis associated withtranslocation of p53 to mitochondria. J. Biol. Chem. 280:19166–19176; 2005.
[17] Schuler,M.; Bossy-Wetzel, E.; Goldstein, J. C.; Fitzgerald, P.; Green, D. R. p53 inducesapoptosis by caspase activation throughmitochondrial cytochrome c release. J. Biol.Chem. 275:7337–7342; 2000.
[18] Ren, W.; Qiao, Z.; Wang, H.; Zhu, L.; Zhang, L. Flavonoids: promising anticanceragents. Med. Res. Rev. 23:519–534; 2003.
[19] Patel, D.; Shukla, S.; Gupta, S. Apigenin and cancer chemoprevention: progress,potential and promise (review). Int. J. Oncol. 30:233–245; 2007.
[20] Gupta, S.; Afaq, F.; Mukhtar, H. Selective growth-inhibitory, cell-cycle deregulatoryand apoptotic response of apigenin in normal versus human prostate carcinomacells. Biochem. Biophys. Res. Commun. 287:914–920; 2001.
[21] Wei, H.; Tye, L.; Bresnick, E.; Birt, D. F. Inhibitory effect of apigenin, a plantflavonoid, on epidermal ornithine decarboxylase and skin tumor promotion inmice. Cancer Res. 50:499–502; 1990.
[22] Tatsuta, A.; Iishi, H.; Baba, M.; Yano, H.; Murata, K.; Mukai, M.; Akedo, H.Suppression by apigenin of peritoneal metastasis of intestinal adenocarcinomasinduced by azoxymethane in Wistar rats. Clin. Exp. Metastasis 18:657–662; 2000.
[23] Liu, L. Z.; Fang, J.; Zhou, Q.; Hu, X.; Shi, X.; Jiang, B. H. Apigenin inhibits expressionof vascular endothelial growth factor and angiogenesis in human lung cancer cells:implication of chemoprevention of lung cancer. Mol. Pharmacol. 68:635–643;2005.
[24] Fang, J.; Xia, C.; Cao, Z.; Zheng, J. Z.; Reed, E.; Jiang, B. H. Apigenin inhibits VEGFand HIF-1 expression via PI3K/AKT/p70S6K1 and HDM2/p53 pathways. FASEB J.19:342–353; 2005.
[25] Trochon, V.; Blot, E.; Cymbalista, F.; Engelmann, C.; Tang, R. P.; Thomaidis, A.;Vasse, M.; Soria, J.; Lu, H.; Soria, C. Apigenin inhibits endothelial-cell proliferationin G(2)/M phase whereas it stimulates smooth-muscle cells by inhibiting P21 andP27 expression. Int. J. Cancer 85:691–696; 2000.
[26] Schindler, R.; Mentlein, R. Flavonoids and vitamin E reduce the release of theangiogenic peptide vascular endothelial growth factor from human tumor cells.J. Nutr. 136:1477–1482; 2006.
[27] Huang,Y. T.; Kuo,M. L.; Liu, J. Y.;Huang, S.Y.; Lin, J. K. Inhibitionsof protein kinaseCandproto-oncogene expressions in NIH 3T3 cells by apigenin. Eur. J. Cancer 32:146–151;1996.
[28] Agullo, G.; Gamet-Payrastre, L.; Manenti, S.; Viala, C.; Remesy, C.; Chap, H.;Payrastre, B. Relationship between flavonoid structure and inhibition ofphosphatidylinositol 3-kinase: a comparison with tyrosine kinase and proteinkinase C inhibition. Biochem. Pharmacol. 53:1649–1657; 1997.
[29] Yin, F.; Giuliano, A. E.; Law, R. E.; Van Herle, A. J. Apigenin inhibits growth andinduces G2/M arrest by modulating cyclin-CDK regulators and ERK MAP kinaseactivation in breast carcinoma cells. Anticancer Res. 21:413–420; 2001.
[30] Llorens, F.; Miro, F. A.; Casanas, A.; Roher, N.; Garcia, L.; Plana, M.; Gomez, N.; Itarte,E. Unbalanced activation of ERK1/2 and MEK1/2 in apigenin-induced HeLa celldeath. Exp. Cell Res. 299:15–26; 2004.
[31] Shukla, S.; Gupta, S. Apigenin-induced cell cycle arrest is mediated by modulationof MAPK, PI3K-Akt, and loss of cyclin D1 associated retinoblastoma depho-sphorylation in human prostate cancer cells. Cell Cycle 6:1102–1114; 2007.
[32] Shukla, S.; Gupta, S. Suppression of constitutive and tumor necrosis factor alpha-induced nuclear factor (NF)-kappaB activation and induction of apoptosisby apigenin in human prostate carcinoma PC-3 cells: correlation with down-regulation of NF-kappaB-responsive genes. Clin. Cancer Res. 10:3169–3178;2004.
[33] Shukla, S.; Mishra, A.; Fu, P.; MacLennan, G. T.; Resnick, M. I.; Gupta, S. Up-regulation of insulin-like growth factor binding protein-3 by apigenin leads togrowth inhibition and apoptosis of 22Rv1 xenograft in athymic nudemice. FASEB J.19:2042–2044; 2005.
[34] Shukla, S.; Gupta, S. Molecular targets for apigenin-induced cell cycle arrest andapoptosis in prostate cancer cell xenograft. Mol. Cancer Ther. 5:843–852; 2006.
[35] Galati, G.; Chan, T.; Wu, B.; O'Brien, P. J. Glutathione-dependent generation ofreactive oxygen species by the peroxidase-catalyzed redox cycling of flavonoids.Chem. Res. Toxicol. 12:521–525; 1999.
[36] Zheng, P. W.; Chiang, L. C.; Lin, C. C. Apigenin induced apoptosis through p53-dependent pathway in human cervical carcinoma cells. Life Sci. 76:1367–1379;2005.
[37] Dumaz, N.; Meek, D. W. Serine15 phosphorylation stimulates p53 transactivationbut does not directly influence interaction with HDM2. EMBO J. 18:7002–7010;1999.
[38] Shieh, S. Y.; Ikeda, M.; Taya, Y.; Prives, C. DNA damage-induced phosphorylation ofp53 alleviates inhibition by MDM2. Cell 91:325–334; 1997.
[39] Weber, J. D.; Taylor, L. J.; Roussel, M. F.; Sherr, C. J.; Bar-Sagi, D. Nucleolar Arfsequesters Mdm2 and activates p53. Nat. Cell Biol. 1:20–26; 1999.
[40] Levites, Y.; Amit, T.; Youdim,M.B.;Mandel, S. InvolvementofproteinkinaseCactivationand cell survival/cell cycle genes in green tea polyphenol ())-epigallocatechin 3-gallateneuroprotective action. J. Biol. Chem. 277:30574–30580; 2002.

1845S. Shukla, S. Gupta / Free Radical Biology & Medicine 44 (2008) 1833–1845
[41] Jackson,M.W.; Lindstrom,M. S.; Berberich, S. J. MdmXbinding to ARFaffectsMdm2protein stability and p53 transactivation. J. Biol. Chem. 276:25336–25341; 2001.
[42] Bates, S.; Vousden, K. H. Mechanisms of p53-mediated apoptosis. Cell Mol. Life Sci.55:28–37; 1999.
[43] Gartel, A. L.; Tyner, A. L. The role of the cyclin-dependent kinase inhibitor p21 inapoptosis. Mol. Cancer Ther. 1:639–649; 2002.
[44] Hirpara, J. L.; Clément, M. V.; Pervaiz, S. Intracellular acidification triggered bymitochondrial-derived hydrogen peroxide is an effector mechanism for drug-induced apoptosis in tumor cells. J. Biol. Chem. 276:514–521; 2001.
[45] Trachootham, D.; Zhou, Y.; Zhang, H.; Demizu, Y.; Chen, Z.; Pelicano, H.; Chiao, P. J.;Achanta, G.; Arlinghaus, R. B.; Liu, J.; Huang, P. Selective killing of oncogenicallytransformed cells through a ROS-mediated mechanism by beta-phenylethylisothiocyanate. Cancer Cell 10:241–252; 2006.
[46] Singh, S. V.; Srivastava, S. K.; Choi, S.; Lew, K. L.; Antosiewicz, J.; Xiao, D.; Zeng, Y.;Watkins, S. C.; Johnson, C. S.; Trump, D. L.; Lee, Y. J.; Xiao, H.; Herman-Antosiewicz,
A. Sulforaphane-induced cell death in human prostate cancer cells is initiated byreactive oxygen species. J. Biol. Chem. 280:19911–19924; 2005.
[47] Dini, L. Apoptosis induction in DU-145 human prostate carcinoma cells. Tissue Cell37:379–384; 2005.
[48] Bai, J.; Rodriguez, A. M.; Melendez, J. A.; Cederbaum, A. I. Overexpression ofcatalase in cytosolic or mitochondrial compartment protects HepG2 cells againstoxidative injury. J. Biol. Chem. 274:26217–26224; 1999.
[49] Chen, Q. M.; Liu, J.; Merrett, J. B. Apoptosis or senescence-like growth arrest:influence of cell-cycle position, p53, p21 and bax in H2O2 response of normalhuman fibroblasts. Biochem. J. 347:543–551; 2000.
[50] Cheng,W. C.; Berman, S. B.; Ivanovska, I.; Jonas, E. A.; Lee, S. J.; Chen, Y.; Kaczmarek,L. K.; Pineda, F.; Hardwick, J. M. Mitochondrial factors with dual roles in death andsurvival. Oncogene 25:4697–4705; 2006.
[51] Armstrong, J. S. The role of the mitochondrial permeability transition in cell death.Mitochondrion 6:225–234; 2006.