Embed Size (px)
Citation preview

APES
Turn in Soil LabAnswer on a separate piece of paper: 1. Calculate how many liters of water are wasted
in 1 month (30 days) by a faucet that leaks 2 drops of water per second.
2. How many gallons is this?
( 1 liter of water = about 3500 drops)
(1 liter = 0.265 gallons)

Use Factor Label Method
2 drops x 60 sec x 60 min x 24 hour x 30 day
1 sec 1 min 1 hour 1 day 1 month
_____ drops x 1 Liter =
1 month 3500 drops
_____ Liters x 0.265 gallons =
1 month 1 Liter

Water Resources
Ch. 13

Properties of Water
HYDROGEN BONDS
– Major factor in determining water’s unique properties
– Strong molecular attraction between molecules

O
H H+ +
--
O
H H+ +
--O
H H+ +
--
Hydrogen Bonds
Covalent bonds

Water’s Unique Properties
Liquid over wide temperature range• High boiling point 100°C (212°F)• Low freezing point 0°C (32°F)
Changes temperature slowly, high heat capacity• Helps protect organisms• Moderates the earth’s climate• Excellent coolant
High heat of evaporation• Absorbs heat as it changes into water vapor• Releases heat as vapor condenses

Water’s Unique Properties
Great dissolving power, Universal Solvent• Carries dissolved nutrients into tissue• Flush waste products out of tissue• All-purpose cleanser• Remove and dilute water-soluble wastes
Balances pH• Helps maintain balance between acids and
bases by ionizing (releasing H+ or OH- ions)Adhesion and cohesion
• Surface tension• Wetting ability
Expands when it freezes• Ice floats – less dense in solid form

Water, a vital resource
Oceans and
saline lakes
97.4%
Fresh Water 2.6%

Water Footprints and Virtual Water
• Water footprint– Volume of water we directly and indirectly
• Average American uses 260 liters per day– Flushing toilets, 27%– Washing clothes, 22%– Taking showers, 17%– Running faucets, 16%– Wasted from leaks, 14%– World’s poorest use 19 liters per day

Water Footprints and Virtual Water
• More water is used indirectly = virtual water– Hamburger, 2400 liters
• Virtual water often exported/imported – Grains and other foods

Fig. 13-A, p. 321
1 tub = 151 liters (40 gallons)
= 1 tub
= 4 tubs
= 16 tubs
= 17 tubs
= 72 tubs
= 2,600 tubs
= 16,600 tubs
Virtual Water
Use

Supply of Water Resources
FreshwaterFreshwater Readily accessible freshwaterReadily accessible freshwater
Biota0.0001%
Biota0.0001%
Rivers0.0001%Rivers
0.0001%
Atmosphericwater vapor
0.001%
Atmosphericwater vapor
0.001%
Lakes0.007%
Soilmoisture0.005%
Groundwater0.592%
Groundwater0.592%
Ice capsand glaciers
0.1.984%
0.014%0.014%

Surface Water
• Precipitation that does not infiltrate the ground or return to the atmosphere by evaporation (transpiration included)
• Flows into streams, lakes, wetlands, reservoirs
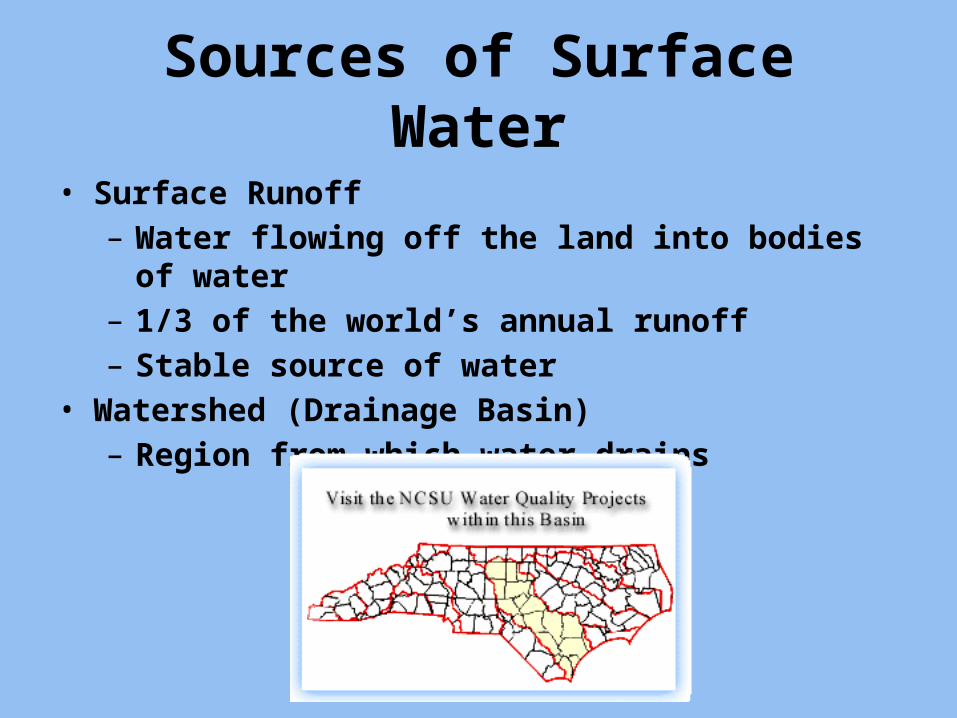
Sources of Surface Water
• Surface Runoff– Water flowing off the land into bodies of
water– 1/3 of the world’s annual runoff– Stable source of water
• Watershed (Drainage Basin)– Region from which water drains
Groundwater
• Water that sinks into the soil and is stored in slowly flowing and slowly renewed underground reservoirs (aquifers).
• Underground water in the zone of saturation below the water table

Groundwater
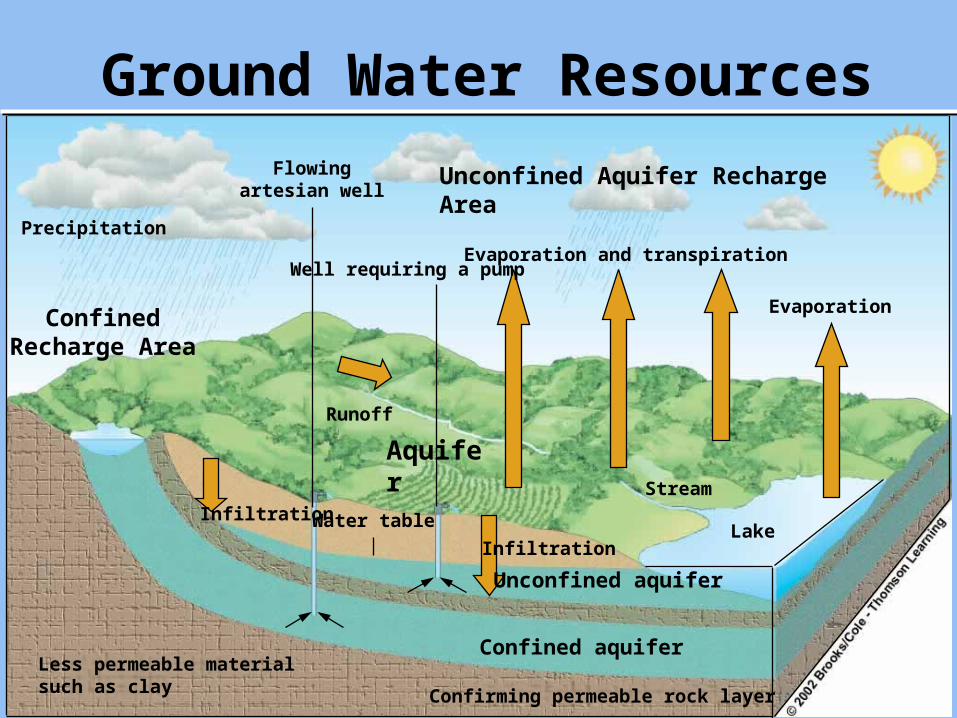
Evaporation and transpiration
Evaporation
Stream
Infiltration
Water tableInfiltration
Unconfined aquifer
Confined aquifer
Lake
Well requiring a pump
Flowingartesian well
Runoff
Precipitation
ConfinedRecharge Area
Aquifer
Less permeable materialsuch as clay Confirming permeable rock layer
Ground Water Resources
Unconfined Aquifer Recharge Area

Groundwater
Aquifers– Confined – located between
impermeable layers of rock– Unconfined – drains from porous
rock above
Recharge Area – area of land through which water passes downward or laterally into an aquifer

Aquifers

Groundwater Reservoir Zones
As ground water moves through soil (infiltration) it can collect in one of two zones divided by the water table

Water TableThe upper level of the saturated zone of groundwater.

Zone of Saturation
• Area where water fills ALL spaces between sediments
• GROUNDWATER found HERE!

Zone of Aeration
• Also called unsaturated zone• Area where air fills ALL spaces
between sediments• Located above the water table.

Movement of Groundwater through Soil can be described using two terms
• Porosity• Permeability

Porosity & Permeability
Porosity• Pore = Opening• Measure of empty
space in a material• Storage ability• Space between the
grains• High porosity = A
LOT of empty space• Measured as a
percentage
Permeability• Ability of a material
(soil) to transmit fluid
• High permeability = water moves through it fast

Porosity

Permeability

Permeability

Use of Water Resources
• Agriculture• Industry• Domestic• Power
Plants
Humans use about 50% of runoff Humans use about 50% of runoff
United States
Industry 11%
Public 10%
Powercooling
38%
Agriculture41%

5,500
5,000
4,500
4,000
3,500
3,000
2,500
2,000
1,500
1,000
500
1900 1920 1940 1960 1980 2000
Wat
er u
se (
cub
ic k
ilom
eter
s p
er y
ear) Total use
Agricultural use
Industrial use
Domestic use
Year

Water in the United
States• Average
precipitation (top) in relation to water-deficit regions and their proximity to metropolitan areas (bottom).

Too Little Water – Shortages
1) Dry climate• Air circulation patterns
2) Drought• 21 days+• Precipitation <70%• Increased evaporation
3) Desiccation• Drying of the soil
4) Water stress• Low per capita
availability• Caused by increased
population• Limited runoff levels
Acute shortage
Adequate supply
Shortage
Metropolitan regions with population greater than 1 million

Water Resource Problems
1. Flooding- Causes property damage- Development of flood plains
(deforestation/industrialization)- Removes vegetation that traps/absorbs
precipitation- surface runoff, erosion, risk of
flooding

Water Resource Problems
2. Water Shortages- Reservoirs are stressed by overpopulation- Diverted water for irrigation of agriculture
fields- Water for livestock who overgraze and
erode soils

Water Resource Problems
3. Overdrawing of surface waters- Diversion of rivers/streams from
their natural flow or patternEX. Mono Lake, CA
www.monolake.org/about/story

Water Resource Problems
4. Aquifer Depletion- Lowering of groundwater table can cause subsidence or sinking (sink holes)

Water Resource Problems
5. Salinization of Irrigated Soils