Embed Size (px)
Citation preview

PUE HypePUE HypeSetting realistic expectations
Understanding PUEMeasurement and analysis tools and processesBest practices for improving PUE
Dennis Bouley Strategic Research Analyst, Data Center Science CenterAPC by Schneider Electric

The PUE derby
S PUE t d
Typical data centerExtreme PUE claims
• Google 1 12
Source … PUE reported …
1.12
• Microsoft “data lab” G tMicrosoft data lab 1.24
Great-Lets do it!
• Microsoft Generation 4 data centers (PUE target) 1.12
Lets see how they get there….Lets see how they get there….

Five key PUE concepts
• PUE is based on math1What are reasonable PUE expectations?
It is “knowable” using reasonable methods and standardized guidelines
• PUE comparisons are difficultValid PUE comparisons are critically dependent on common terminology and assumptions
12● Shared building systems should be included for a real PUE
Often overlooked, these need to be fairly allocated to data center operations
● Redundancy worsens PUE
3● Redundancy worsens PUE
Redundancy of power and cooling systems (an availability choice you make) reduces PUE because of lowered load across the redundant devices
● Your electric bill and efficiency (PUE) are not the same thing
4
5● Your electric bill and efficiency (PUE) are not the same thing One can get better while the other gets worse, for legitimate design decisions you might make5
Compare “apples to apples” and don’t Compare “apples to apples” and don’t overlook hidden electrical lossesoverlook hidden electrical losses

“The devil is in the details”
=The simplesimplestory PUE represents how much EXTRA power
(“electrical losses”) you consume to power, cool, and and protect the IT load
The
LOWER is better, 1 is perfect
But to get ● What is included? (What’s IN, what’s OUT?)The
WHOLE story
you need t k
● Annualized average or point-in-time snapshot?
● At what % load? (PUE degrades at lower loading)
to ask questions ... ● In what geographical location? (e.g., access to “free cooling”)
When comparing PUE, always make sure When comparing PUE, always make sure it’s “apples to apples”it’s “apples to apples”

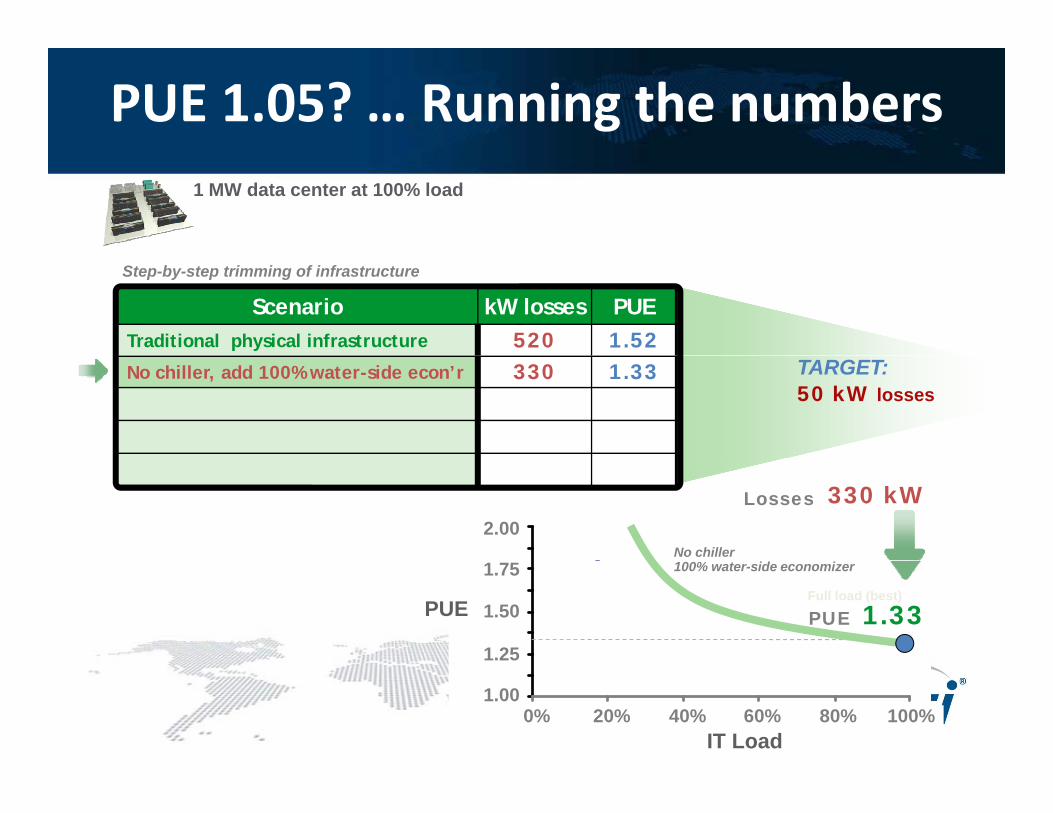
PUE 1.05? … Running the numbers1 MW data center at 100% load
PUE1.05 =
1050
1000
Input power needed( IT load power)PUE 1.05 50 kW physical infrastructure losses
What would it take to get down to 50 kW of losses? Step-by-step trimming of infrastructure
Scenario kW losses PUEScenario kW losses PUETraditional physical infrastructure 520 1.52
TARGET:50 kW losses
520 kWLosses2 00
1 3751.5001.6251.7501.8752.000
PUE 1.52PUE
Full load (best)Traditional physical infrastructure
1.50
1.75
PUE
2.00
1.0001.1251.2501.375
0% 20% 40% 60% 80% 100%
% IT Load1.00
1.25
0% 20% 40% 60% 80% 100%
PUE 1.05? … Running the numbers1 MW data center at 100% load
Scenario kW losses PUETraditional physical infrastructure 520 1.52
Step-by-step trimming of infrastructure
No chiller, add 100% water-side econ’r 330 1.33 TARGET:50 kW losses
1.8752.000
330 kWLosses
No chiller 2.00
1.2501.3751.5001.6251.750
PUE
100% water-side economizer
1.25
1.50
1.75
PUE 1.33PUEFull load (best)
1.0001.125
0% 20% 40% 60% 80% 100%% IT Load
1.000% 20% 40% 60% 80% 100%
IT Load

PUE 1.05? … Running the numbers1 MW data center at 100% load
Scenario kW losses PUETraditional physical infrastructure 520 1.52
Step-by-step trimming of infrastructure
Traditional physical infrastructure 520 1.52No chiller, add 100% water-side econ’r 330 1.33UPS on bypass with 415V distribution 220 1.22
TARGET:50 kW losses
220 kWLosses
UPS on bypass2.00
1 2501.3751.5001.6251.7501.8752.000
PUE 1.22PUE
Full load (best)
415 V distribution
1.25
1.50
1.75
PUE
1.0001.1251.250
0% 20% 40% 60% 80% 100%
% IT Load
1.000% 20% 40% 60% 80% 100%
IT Load

PUE 1.05? … Running the numbers1 MW data center at 100% load
Scenario kW losses PUETraditional physical infrastructure 520 1.52
Step-by-step trimming of infrastructure
No chiller, add 100% water-side econ’r 330 1.33UPS on bypass with 415V distribution 220 1.22Air-side economizer, no UPS 140 1.14
TARGET:50 kW losses
1.8752.000
140 kWLosses
Air side economizer
2.00
1.2501.3751.5001.6251.750
PUE
1.14PUEFull load (best)
Air-side economizerNo UPS
1.25
1.50
1.75
PUE
1.0001.125
0% 20% 40% 60% 80% 100%
% IT Load
1.000% 20% 40% 60% 80% 100%
IT Load

PUE 1.05? … Running the numbers1 MW data center at 100% load
Scenario kW losses PUETraditional physical infrastructure 520 1.52
Step-by-step trimming of infrastructure
No chiller, add 100% water-side econ’r 330 1.33UPS on bypass with 415V distribution 220 1.22Air-side economizer, no UPS 140 1.14
50 1 05
TARGET:50 kW losses
1.8752.000
50 kWLosses
No environmental conditioning fans 50 1.05
2.00
1.2501.3751.5001.6251.750
PUE
No air conditioning fans
PUEFull load (best)
1 051.25
1.50
1.75
PUE
1.0001.125
0% 20% 40% 60% 80% 100%
% IT Load
PUE 1.051.00
0% 20% 40% 60% 80% 100%IT Load

PUE less than 1.10? Unrealistic for ordinary data centers in ordinary places with ordinary budgets
Very large, purpose built examples may be closing in on impressive PUEs, but they have flexibility and resources you may not have:
• Choice of geographic location (for free-cooling opportunities)
• An extensive fault-tolerant system architecture (so equipment failure
may not have:
architecture (so equipment failure doesn’t matter)
• Nonstandard servers (e.g., NEBS carrier grade) that are more tolerant of Spartan
No UPS
Little or no power redundancy
“Free cooling” onlygrade) that are more tolerant of Spartan conditions
AND …
Free cooling only
No air conditioning fans
• A very large budget to meet green initiatives !
These extreme strategies are rarely suitable or These extreme strategies are rarely suitable or fundable for the typical enterprise data centerfundable for the typical enterprise data center

Moving towards a standardized calculationcalculation
• Data center efficiency is an evolving issue and standards are not settled
The industry is making progress …
issue and standards are not settled yet
• PUE standards are under development by industry
k h ldstakeholders • White Papers discuss ongoing
efforts toward standardized calculation of PUE
#158 A Standard MethodMethod for Calculation of Data Center Efficiency
Standardized calculations ensure Standardized calculations ensure that you are comparing “apples to apples”that you are comparing “apples to apples”

The big question: What’s in, what’s out?
Cooling subsystems are sometimes forgotten in the PUE calculationShared building-wide system power must be prorated for the data center’s share of use
Data centersubsystem
In the PUE formula, is it part of …
IT load? Physical infrastructure?
Not included?
C li t b i h t √It ft Cooling tower basin heaters √
Water treatment √
Pipe freeze protection √
Items often omitted from the PUE calculation
Air compressors √
Condensate pumps √Make-up air / √
Excerpted from Table 1 in APC White Paper 158
fresh air system power √
Unit heaters √
Well pumps √
p
Leaving these out will falsely improve PUELeaving these out will falsely improve PUE

PUE vs. the electric bill
Be careful of using PUE as your only metricIt may not tell the whole story !
Data centerdesign upgrade Electric bill PUE
Virtualization / consolidationBETTER
(lower)Because of optimized use of server capacity
WORSE(higher)
Unless power and cooling are downsized to align
with lower IT load *
Higher server inlet temperature
WORSE(higher)
If increased server fan power exceeds cooling
t i
BETTER(lower)
Because of higher efficiency of cooling
tsystem savings system
Beware of “Cause and EffectBeware of “Cause and Effect “
APC White paper 118 efficiency effects of virtualization APC White paper 138 efficiency effects of increased inlet temperature

Web-enabled interfaceFor easy integration with 3rd party web page through application programming
Efficiency dashboardpage through application programming
interface (API)
Subsystem energy lossesEnergy efficiency calculation
Current and historical PUE values based Subsystem energy lossesInsight into energy losses and cost of
subsystems, with details of which subsystem draws the greatest cost
C Uon the current IT load for a fact-based
understanding of energy efficiency at the facility level

Subsystem breakdown of energy cost
Cost (USD)
Air-cooled
Chilled w
at
CR
AH
Switchgea
Primary au
Lighting
Generator
Critical pow
Critical aux
UPS
chiller
ter pump
ruxiliaries
wer dist.
xiliaries

BMS: Data center main screen‐monitoring, control overall energy use & PUEcontrol, overall energy use & PUE
Chiller PlantHumidificationHeat
Data Center Floor Plan
Data Center Piping
CRACs (Computer Room Air Conditioners)General HVAC, Controls, and Misc. Gray SpaceIT EquipmentUPS Loses
PID Tuning
Report
Square D Panels Kw
Transformer and PDU LossesLighting / White SpaceSwitchgear and Generator Plant LossesPumps (Dedicated to Data Center CRAC Units)
Security
Veris Panel
Veris Histories
V i Hi tp ( )
Veris History
TOTAL
4
123PUE calculation: 157.3 (total) ÷ 88.3 (IT) = 1.78
PUE = 1.779

GoGo to online “live” version of this tool tools.apc.com

A realistic PUE forecast
4 The average will get betterThe average will get better
3
The worst will get MUCH betterThe worst will get MUCH better
3
PUE Where are YOUR data Where are YOUR data centers today?centers today?
2
worst
1
worst
best
average
2008 201820132010

Drivers of infrastructure efficiency gains
Goal: Reduce PUE from 2.13 to 1.39How to get there: Upgrades to power and cooling infrastructure
Convert from ROOM COOLING to dynamic ROW/RACK cooling
DYNAMIC CONTROL OF COOLING PLANT(VFD fans, pumps, chillers)
32% t ib ti10% contribution
PUE2 13
415/240 V TRANSFORMERLESS power distribution (NAM)
32% contribution.24 PUE reduction
.07 PUE reduction 2.13Total pie represents the overall PUE improvement th t t lki b t
HigherUPS EFFICIENCY
p ( )10% contribution.07 PUE reduction
that we are talking about
Each piece is the relative PUE contribution of upgrades
Cooling ECONOMIZERS
UPS EFFICIENCY16% contribution.12 PUE reduction
1.39
contribution of upgrades that could be made
Baseline: Average of existing installed base
RIGHT-SIZING via modular power and cooling
16% contribution.12 PUE reduction
16% contribution.12 PUE reduction

PUE hype vs. realistic expectations
● Understand PUE
Checklist for joining the PUE conversation with confidence
● Understand PUE ● Claims of extremely low PUE are becoming more common, but many are
based on incomplete data and most are not realistic for your data center • Leverage on-line tools to do ROI on efficiency improvements
● What’s In and What’s Out can dramatically effect PUE – always “compare
● What s In and What s Out can dramatically effect PUE always compare apples to apples”
● PUE is not the only metric you should look at – don’t forget the electric bill !
● Choose your PUE measurement strategy● Choose your PUE measurement strategy● Manual vs. automated● Lower vs. higher accuracy● Subsystem breakdown
● Consider your options for PUE improvement● Close-coupled row-based cooling● High-efficiency scalable power and cooling
● Tools for efficiency analysis and capacity management● Scalable/modular growth● Hybrid density data centers

Questions?
Post-event questions or comments about this presentation? [email protected] - The Data Center Science Center at APC by Schneider Electric
© 2009 APC by Schneider Electric


![9u!pnpu! paJ!nbêJ LLM0J]ad-gps pup sueaw pue upu_lnq uo swnoD q1!M pue 8UUêêU18Uê q8!Ll 40 s! Uletl-l s !ueuog pue 10 pue pue aunpueq alqnop e se aqa S>POM uonuedaad as!u0J1.puKs](https://img.pdfslide.us/doc/110x75/6149323e080bfa6260147480/-9upnpu-pajnbj-llm0jad-gps-pup-sueaw-pue-upulnq-uo-swnod-q1m-pue-8uuu18u.jpg)

![Risk Management and Ethics Committe Policy - NWPG · Kew LP!UM '(spaÇoud leimeaado pue la!deo) speÇ0Jd pue leuonuado Åpweu sea]e u! JO auawa6euew pue 'Mê!Aaa aqL • -IOJ pue](https://img.pdfslide.us/doc/110x75/5c8eaea009d3f2ec738b75e1/risk-management-and-ethics-committe-policy-kew-lpum-spacoud-leimeaado.jpg)
![· punoue qwq pa13nnsu03 aq Ileus pue èua!pef 'alls aleud0Jdde 10 swep pue 'su!up pue .Åvad0Jd pue uoasuoul _laue naa] aq Ileqs su!eup aul watud01anap llaq uaauî 'speou au!Lu](https://img.pdfslide.us/doc/110x75/5e37d892818bf70c1f099a04/punoue-qwq-pa13nnsu03-aq-ileus-pue-uapef-alls-aleud0jdde-10-swep-pue-suup.jpg)