Embed Size (px)
Citation preview
Yours faithfully, Fir APOLL9-1IOSPITALS ENTERPRISE LIMITED
AP9J,LO HOSPITALS ENTERPRISE LIMITED 2 r une 2u21
CIN : L85110TN1979PLC008035
Apollo I HOSPITALS
TOUCHING LIVES
The Secretary, Bombay Stock Exchange Ltd (BSE) Phiroze 3heejheebhoy Towers, Dalal Street, Mumbai - 400 001. Scrip Code - 508869 ISIN 1NE437A01024
The Secretary, National Stock Exchange, Exchange Plaza, 5th Floor Plot No.C/1, 'G' Block Bandra - Kurla Complex Bandra (E) Mumbal - 400 051. Scrip Code-APOLLOHOSP ISIN INE437A01O24
The Manager The National Stock Exchange, Wholesale Debt Market Exchange Plaza, 5th Floor Plot No.C/1, 'G' Block Bandra - Kurla Complex Bandra CE) Mumbal - 400 051.
Dear Sir,
Sub: Investors presentation on the Audited Financial Results of the Company for the
quarter & year ended 31st March, 2021.
Please find enclosed the following:-
1. Copy of Investors Presentation on the Audited Financial Results of the Company for
the quarter & year ended 31st March, 2021
2. Invite for the Analyst/Investors Call scheduled to be held today at 3.05 p.m.
Kindly take the above in your records.
The copy of same is also being uploaded on the website of the Company.
Thanking you,
S.M. KRISHNAN— VICE PRESIDENT - l'INANCE AND COMPANY SECRETARY
CC : The Secretary, Luxembourg Stock Exchange, B.P. 165, L-2011 Luxembourg.
Ret: ISIN US037608 1065 - Rule 144a GDR ISIN US0376082055 - Reg. S GDR
IS/ISO 9001:2000
Securities and Exchange Commission Division of Corporation Finance Office of International Corporate Finance 450 Fifth Street, N.W. Washington, D.0 20549-0302 File No. 82-34893
Regd. Office: 19, Bishop Gardens, Raja Annamalaipuram, Chennai - 600 028.
Genera! Office: "Au Towers", lii Floor, #55, Greams Road, Chennai - 600 006.
Tel : 044 - 28290956 / 3896 I 6681 Telefax : 044 - 2829 0956 Email : investor.relationsapollohospitaIs.com Website: www.apollohospitals.com

1
Apollo Hospitals Enterprise Limited to host Q4 FY21 Earnings
Conference Call on
Thursday, 24 June, 2021 at 3:05 PM IST
Apollo Hospitals Enterprise Ltd. will organize a conference call for investors on June 24, 2021
at 3:05 pm IST. AHEL will be represented by:
Ms. Suneeta Reddy – Managing Director
Dr. Hariprasad – President, Hospitals Division
Mr. A. Krishnan - Chief Financial Officer
The conference call follows the announcement of AHEL’s financial results for the quarter
ended March 31, 2021 which will be announced on Wednesday, June 23, 2021. The financial
results along with the Earnings Presentation will be available on the corporate website:
www.apollohospitals.com.
Details of the conference call are as follows:
Timing 3:05 pm IST on Thursday, June 24, 2021
Conference dial-in
Primary number +91 22 6280 1141 / +91 22 7115 8042
Playback (India Number) +91 22 7194 5757 (ID: 64547 until 1-July-21)
Singapore Toll Free Number 800 101 2045
Hong Kong Toll Free Number 800 964 448
USA Toll Free Number 1 866 746 2133
UK Toll Free Number 0 808 101 1573
Pre-registration
To enable participants to connect to the conference call without having to wait for an operator, please register at the below mentioned link:
You will receive dial in numbers, passcode and a pin for the concall on the registered email
address provided by you. Kindly dial into the call on the Conference Call date and use the
passcode & pin to connect to call
- ENDS -
2
For further information please contact
R Krishnakumar Mayank Vaswani
Apollo Hospitals Ltd. CDR, India
Tel: +91 44 2829 7840 Tel: +91 98209 40953
email: [email protected] email: [email protected]
About Apollo Hospitals Enterprise Ltd. (AHEL)
It was in 1983 that Dr. Prathap Reddy made a pioneering endeavour by launching India’s first corporate
hospital - Apollo Hospitals in Chennai. Over the years, Apollo Hospitals has established itself as home to
the largest cardiac practice in India with over 160,000 cardiac surgeries. Apollo Hospitals is also the
world’s largest private cancer care provider and runs the world’s leading solid organ transplant
program. As Asia’s largest and most trusted healthcare group, its presence includes 10,209 beds across
71 Hospitals, 4,118 Pharmacies, over 200 Primary Care and Diagnostic Clinics, 148 plus Telemedicine
Centres.
As an integrated healthcare service provider with Health Insurance services, Global Projects
Consultancy capability, over 15 medical education centres and a Research Foundation with a focus on
global Clinical Trials, epidemiological studies, stem cell & genetic research Apollo Hospitals has been at
the forefront of new medical breakthroughs with the most recent investment being that of
commissioning the first Proton Therapy Center in Chennai across Asia, Africa, and Australia. Every four
days, the Apollo Hospitals Group touches a million lives, in its mission to bring healthcare of
International standards within reach of every individual.
In a rare honour, the Government of India issued a commemorative stamp in recognition of Apollo's
contribution, the first for a healthcare organization. Apollo Hospitals Chairman, Dr. Prathap C Reddy,
was conferred with the prestigious Padma Vibhushan in 2010. For more than 37 years, the Apollo
Hospitals Group has continuously excelled and maintained leadership in medical innovation, world-
class clinical services, and cutting-edge technology. Our hospitals are consistently ranked amongst the
best hospitals globally for advanced medical services and research.
Note: This invite is intended solely for the use of the named addressee(s). Any distribution of this invite is strictly prohibited by the sender. If you are not the intended recipient, we request you to notify the sender immediately and delete this document.

6/23/2021 1www.apollohospitals.com
Q4 FY 2021 Earnings Update

6/23/2021 2www.apollohospitals.com
SAFE HARBOUR
• No representation or warranty, express or implied, is made as to, and noreliance should be placed on, the fairness, accuracy, completeness orcorrectness of the information or opinions contained in this presentation.Such information and opinions are in all events not current after the date ofthis presentation. Certain statements made in this presentation may not bebased on historical information or facts and may be “forward lookingstatements” based on the currently held beliefs and assumptions of themanagement of the Company, which are expressed in good faith and in theiropinion reasonable, including those relating to the Company’s generalbusiness plans and strategy, its future financial condition and growthprospects and future developments in its industry and its competitive andregulatory environment.
• Forward-looking statements involve known and unknown risks, uncertaintiesand other factors, which may cause the actual results, financial condition,performance or achievements of the Company or industry results to differmaterially from the results, financial condition, performance orachievements expressed or implied by such forward-looking statements,including future changes or developments in the Company’s business, itscompetitive environment and political, economic, legal and socialconditions. Further, past performance is not necessarily indicative of futureresults. Given these risks, uncertainties and other factors, viewers of thispresentation are cautioned not to place undue reliance on these forward-looking statements. The Company disclaims any obligation to update theseforward-looking statements to reflect future events or developments.
• Numbers mentioned in this Presentation in respect of information providedon hospital operating parameters and other operating metrics have beencompiled by the management and are being provided only by way of
additional information. These are not to be construed as being providedunder any legal or regulatory requirements. The accuracy of these numbershave neither been vetted nor approved by the Audit Committee and theBoard of Directors of Apollo Hospitals Enterprise Limited (AHEL), nor havethey been vetted or reviewed by the Auditors, and therefore may differ fromthe actual.
• Important risk factors and uncertainties could make a material difference tothe Company’s operations. These risks include but are not limited to, the riskfactors described in AHEL’s prospectus, annual reports and other periodicfilings made by the company. The Company assumes no responsibility topublicly amend, modify or revise any forward looking statement, on thebasis of any subsequent development, information or events, or otherwise.
• This presentation is for general information purposes only, without regard toany specific objectives, financial situations or informational needs of anyparticular person. The Company may alter, modify or otherwise change inany manner the content of this presentation, without obligation to notifyany person of such change or changes. This presentation may not be copiedor disseminated in any manner.
• The Company on a quarterly basis adopts and publishes Standalone &Consolidated financial results as per the stock exchange listing agreementrequirements.
• Previous year figures have been reworked/regrouped /rearranged andreclassified wherever necessary to conform to the requirement of revisedSchedule VI format
2

6/23/2021 3www.apollohospitals.com
Contents
3
HIGHLIGHTSSTANDALONE
FINANCIAL PERFORMANCE
CONSOLIDATED FINANCIAL
PERFORMANCE
OPERATIONAL PERFORMANCE – HOSPITALS
UPDATE ON AHLL,
GLENEAGLES KOLKATA &
MEDICS LUCKNOW
APOLLO HEALTHCO TRANSFORMATIONAL
UNLOCKING

6/23/2021 4www.apollohospitals.com
• Apollo 24/7 represents Apollo Group’s transformational journey to creating “India’s Largest
Omnichannel Digital Healthcare Platform” that:
— combines the strengths of Apollo Group’s offline healthcare leadership with Apollo
Group’s new-age digital offerings to address all healthcare consumer needs;
— involves an asset light approach (through digital offerings) to fuel growth – 100
million targeted registered users on Apollo 24/7 platform in 5 years.
— presents huge funnelling potential for healthcare consumers into the Apollo Group
ecosystem.
• Structure to set the platform for a new pool of investor capital and to enable rapid scale-up. At the time of capital raise, AHL valuation to reflect current and future growthpotential.
• Post external capital raise at AHL,
— AHEL expected to retain dominant majority shareholding in AHL; and
— Slump sale consideration of INR Rs 1,210 crs will be received by AHEL.
4
AHEL
(Listed)
Healthcare
Services
Backend
Pharmacy +
Apollo 24/7
Apollo HealthCo Limited
(AHL)
100%
Slump sale
Apollo HealthCo: Transformational Value Unlocking
Slump Sale of the identified business undertakinginto AHL including the following
• Back-end pharmacy supply (excludes HospitalBased Pharmacies)
• Apollo 24/7 Digital healthcare Platform
• Investment in pharmacy retail business (i.e.Apollo Medicals Private Limited)
• “Apollo 24/7” brand, the “Apollo Pharmacy”brand and private label brands
Reorganization through Slump Sale

6/23/2021 5www.apollohospitals.com
Health ProblemApollo Experts
#Expertiseisforeveryone
Omni Channel Medicine Delivery 10,000+ Pin Codes
Home Sample CollectionApollo Quality for all
Legal problem Lawyer
Build a house Architect
Fix your car Mechanic
Health problem Internet Doctor
Neighbours/Relatives
Miraculous drinks/ointments
TV/Newspapers
Self-Prescribed drugs
Health ProblemWhenever one feels the need to ask a question around ones health
Consult Apollo Doctor
Choose from over 60 speciality and among the best 7000 Apollo Doctors
15 Minutes for the Best Doctor to consultRound the Clock Across the Country
Getting Back Good Health
#Expertiseisforeveryone
Medical Lab Test2 Hrs Medicine Delivery
Follow Up with Doctor/Medical procedure at Hospital

6/23/2021 6www.apollohospitals.com
Condition management
Doctor on Call 24|7
CONSULT APOLLO Specialist
Medicine Home Delivery in 2 Hrs
Home Sample Collection for Lab test
Doctor follow-up and medicines reorder (CIRCLE)
Powered by CDSS and Apollo doctors for early support
15 Minutes round the clock commitment for over 60 speciality with over 7000 doctors
• Home Delivery at 10,000 + pin codes across India integrating over 4000 Pharmacies.
• Home Sample Collection for Lab tests
Preventive and Proactive support:Unique membership based subscription that provides superior access across the eco-system.Platform for the Super Users.
Comprehensive healthcare managementWith full health and financial responsibility for cohorts with chronic ailments.
Apollo 24|7 - CARE Triangle

6/23/2021 7www.apollohospitals.com
Dig
ital
se
rvic
es
Ph
ys
ica
l n
etw
ork
& c
ap
ab
ilit
ies
Distinctive digital ecosystem …
… coupled with formidablephysical network & capabilities
Online medicine delivery
Health insurance
Apollo offline
pharmacy (3,600+
stores)(3)
Apollo Homecare Services
Virtual doctor consultation
Online diagnostic booking
Condition management
Health predictor(1)
Well-being companion(2)
10,000+ doctors across Apollo
hospitals & clinics Apollo’s
500+ diagnostic centers
3mn+ annual chronic patients
managed at Apollo
hospitals
Leverage learnings from
30mn+ IP/OP till date at Apollo
hospitals
300+ corporate
tie-ups
Part of Apollo 24/7
Enablers provided by Apollo Group
Companies (unique & other players cannot provide)
1
2
3
4
5
6
7
8
Consumer
Apollo Group Is creating India’s Largest Omni-channel Healthcare Platform: Apollo 24/7

6/23/2021 8www.apollohospitals.com
HIGHLIGHTS
8

6/23/2021 9www.apollohospitals.com
Q4 FY21 Consolidated Revenues of ` 28,680 mio (decline of 2% yoy).
Q4 FY21 Consolidated EBITDA (Pre Ind AS 116) of ` 3,718 mio.
New Hospitals (excluding Proton) reported an EBITDA of ` 437 mio in Q4 FY21 as compared to an EBITDA of ` 166 mio in Q4FY20.
Proton reported EBITDA (Pre Ind AS 116) of ` 7 mio in Q4 FY21 as compared to EBITDA loss of ` (90) mio in Q4 FY20.
AHLL reported EBITDA (Pre Ind AS 116) of ` 127 mio in Q4 FY21 as compared to EBITDA loss of ` (17) mio in Q4FY20.
Consolidated PAT of ` 1,678 mio in Q4 FY21.
Includes AHLL PAT loss of ` (77) mio.
Ind-AS 116 on operating lease impacted reported PBT in FY21 to the extent of ` 112 mio
Highlights
Financial Performance
Q4 FY21
Key Operational
HighlightsQ4 FY21
9
Q4FY21 occupancy across the group was at 4,631 beds (63% occupancy) as compared to 4,658 beds (63% occupancy) inQ3FY21. The Q4FY21 occupancy in mature hospitals was at 3,365 beds (64% occupancy). New hospitals had an occupancy of1,266 beds (60%) occupancy) in Q4FY21.
Inpatient Volumes across the group increased by 9% QoQ from 99,197 to 108,169.
ARPOB registered a growth of 11% in Q4FY21 as compared to the previous year.
6/23/2021 10www.apollohospitals.com
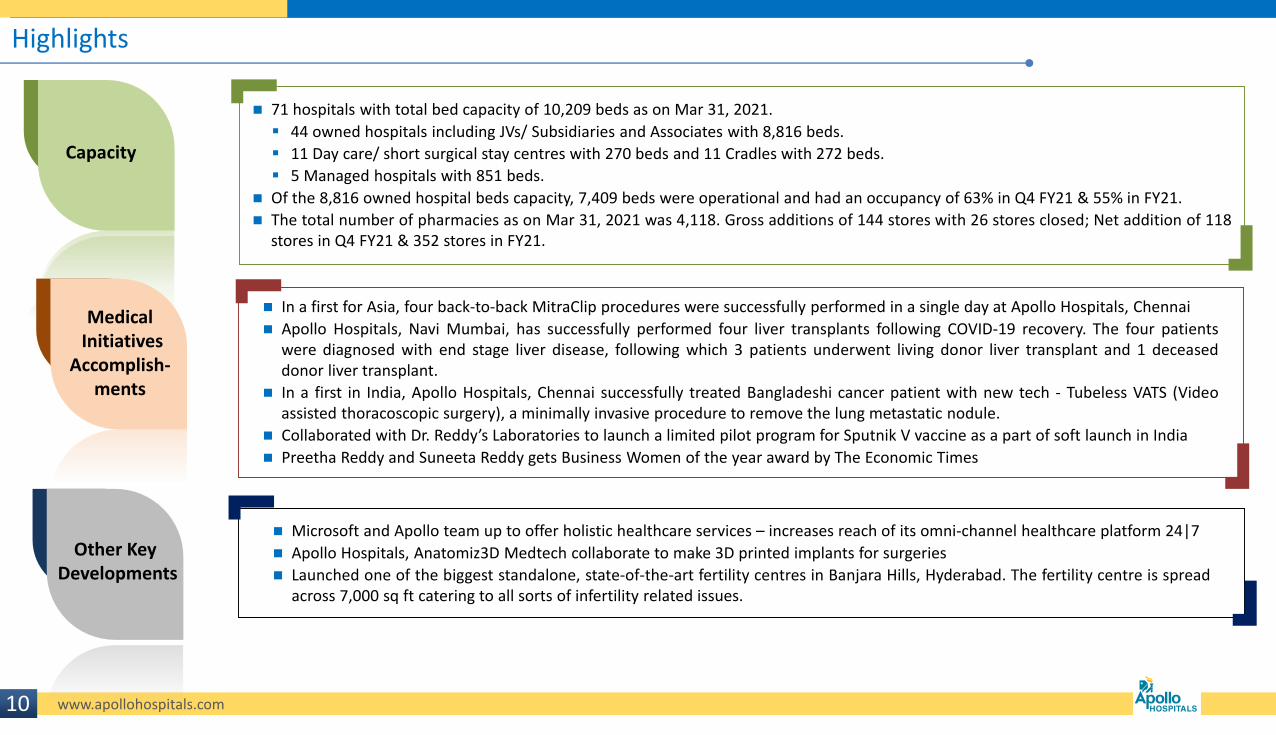
71 hospitals with total bed capacity of 10,209 beds as on Mar 31, 2021.
44 owned hospitals including JVs/ Subsidiaries and Associates with 8,816 beds.
11 Day care/ short surgical stay centres with 270 beds and 11 Cradles with 272 beds.
5 Managed hospitals with 851 beds.
Of the 8,816 owned hospital beds capacity, 7,409 beds were operational and had an occupancy of 63% in Q4 FY21 & 55% in FY21.
The total number of pharmacies as on Mar 31, 2021 was 4,118. Gross additions of 144 stores with 26 stores closed; Net addition of 118stores in Q4 FY21 & 352 stores in FY21.
Other Key Developments
Highlights
Capacity
MedicalInitiatives
Accomplish-ments
10
In a first for Asia, four back-to-back MitraClip procedures were successfully performed in a single day at Apollo Hospitals, Chennai
Apollo Hospitals, Navi Mumbai, has successfully performed four liver transplants following COVID-19 recovery. The four patientswere diagnosed with end stage liver disease, following which 3 patients underwent living donor liver transplant and 1 deceaseddonor liver transplant.
In a first in India, Apollo Hospitals, Chennai successfully treated Bangladeshi cancer patient with new tech - Tubeless VATS (Videoassisted thoracoscopic surgery), a minimally invasive procedure to remove the lung metastatic nodule.
Collaborated with Dr. Reddy’s Laboratories to launch a limited pilot program for Sputnik V vaccine as a part of soft launch in India
Preetha Reddy and Suneeta Reddy gets Business Women of the year award by The Economic Times
Microsoft and Apollo team up to offer holistic healthcare services – increases reach of its omni-channel healthcare platform 24|7
Apollo Hospitals, Anatomiz3D Medtech collaborate to make 3D printed implants for surgeries
Launched one of the biggest standalone, state-of-the-art fertility centres in Banjara Hills, Hyderabad. The fertility centre is spreadacross 7,000 sq ft catering to all sorts of infertility related issues.

6/23/2021 11www.apollohospitals.com
Covid Testing and Treatment
40,000+In -Patients
8,500+Stay I
1,158Dedicated beds
399,000+Tests
20,000+Home care
* As of Mar 31, 2021
‘Project Stay I’ saw success with over 78,300 room nights.
Our effort in the Home care segment enabled us to move into 51,000 homes, (of which COVID care was at 20,000
homes) and provide medically supervised home isolation services
Digital healthcare app Apollo 24/7 – agile and digitally connected to the consumer, 5 lakh digital consults till date
4

6/23/2021 12www.apollohospitals.com
IND AS 116 IMPACT ANALYSIS
8

6/23/2021 13www.apollohospitals.com
Impact on P&L and Balance Sheet – FY21
Balance sheet Profit & Loss
Right of use Asset as of March 31, 2021
5,888
Lease liabilitiesas of March 31, 2021
7,682
Equity (Transaction impact as on Apr 01, 2019 -Net of Tax)
2,109
Revenue -
Other expenses (Lease rent)
1,486
EBITDA 1,486
Amortisation 946
EBIT 540
Finance charge 925
PBT 385
Note: Accounting increase in Assets & Liabilities in the Balance sheet (due to Right of Use Asset) optically supresses the ROCE and increases the leverage ratios. No real impact in actual business ROCE.
AHEL Standalone (post IND AS 116)
Balance sheet Profit & Loss
Right of use Asset as of March 31,2021
9,836
Lease liabilitiesas of March 31,2021
13,003
Equity (Transaction impact as on Apr 01, 2019 -Net of Tax)
3,052
AHEL Consolidated (post IND AS 116)
Revenue -
Other expenses (Lease rent)
2,252
EBITDA 2,252
Amortisation 1,446
EBIT 806
Finance charge 1,379
PBT 573
(` mio)
Ind AS 116 was effective 1st April 2019
9

6/23/2021 14www.apollohospitals.com
STANDALONE FINANCIAL PERFORMANCE
14

6/23/2021 15www.apollohospitals.com
Standalone Financial Performance – Total (` mio)
FY21 EBIT of ` 5,115 mio
FY21 PAT of ` 1,052mio
FY21 Revenues at ` 91,530 mio
FY21 EBITDA (Pre Ind AS 116) at ` 7,988 mio
Key Highlights
15Previous year figures have been reworked/regrouped/rearranged and reclassified wherever necessary to conform to the requirement of revised Schedule VI format
FY21 EBITDA (Post Ind AS 116) at ` 9,474 mio
Ind-AS 116, effective 1st April 2019 has recognized interest expense on lease liabilities of ` 925 mio and depreciation on right-of-use asset of ` 946 mio. The effect of applying this standard resulted in reduction of PBT by ` 385 mio in FY 21
Q4 FY 20 Q4 FY 21 yoy (%) FY 20 FY 21 yoy (%)Revenue 25,721 24,101 -6.3% 97,944 91,530 -6.5%Operative Expenses 13,956 13,674 -2.0% 51,820 53,574 3.4%Employee Expenses 3,930 2,930 -25.4% 15,192 12,751 -16.1%Administrative & Other Expenses 4,353 4,139 -4.9% 16,780 15,731 -6.3%Total Expenses 22,238 20,743 -6.7% 83,792 82,056 -2.1%EBITDA (Pre Ind AS 116) 2,877 3,153 9.6% 11,894 7,988 -32.8%margin (%) 11.2% 13.1% 190 bps 12.1% 8.7% -342 bpsEBITDA (Post Ind AS 116) 3,483 3,358 -3.6% 14,152 9,474 -33.1%margin (%) 13.5% 13.9% 39 bps 14.4% 10.4% -410 bpsDepreciation 1,291 1,014 -21.4% 4,823 4,359 -9.6%EBIT 2,193 2,344 6.9% 9,330 5,115 -45.2%margin (%) 8.5% 9.7% 120 bps 9.5% 5.6% -394 bpsFinancial Expenses 1,073 683 -36.4% 4,259 3,438 -19.3%Other Income -8 107 109 182 66.2%Exceptional Item 1644 -80 1644 -91Profit Before Tax 2,756 1,689 -38.7% 6,824 1,767 -74.1%Profit After Tax 2,056 1,155 -43.8% 4,703 1,052 -77.6%margin (%) 8.0% 4.8% -320 bps 4.8% 1.1% -365 bps
Total Debt 22,815
Cash & Cash equivalents (includes investment in liquid funds) 13,594Net Debt 9,221
Exceptional item recognized in P&L FY21: Capital gains on disposal of front end
pharmacy business to APL of ` 845 mio has been netted of against ` 856 mio of net economic benefit transferred from appointed date (1.4.2019) to effective date (01.09.2020). The resultant loss of ` 11 mio .
Impairment of Investment in Stemcyteof ` 80 mio

6/23/2021 16www.apollohospitals.com
Standalone Financial Performance – Mature & New Breakup – Q4 FY21
Health Care Services revenue grew by 6% from ` 12,136 mio in Q4 FY 20 to `12,913 mio in Q4 FY21
Mature Hospitals revenues grew by 2% at ` 9,407. New Hospitals revenues grew by 16% from ` 2,752 mio in Q4 FY20 to `3,197mio in Q4 FY 21
Key Highlights
(` mio)
16
Pharmacy Distribution revenue at `11,187 and EBITDA of ` 541 mio (4.8% margin) in Q4 FY 21, excluding 24/7 operating costs the EBITDA was at ` 793 mio (7.1% margin)
The Combined Pharmacy platform business reported revenue of ` 14,174 mio in Q4FY21 as compared to a Revenue of ` 13,585 mio in Q4FY20, 4% growth.
• The like-to-like EBITDA (Pre Ind As 116) in Q4FY21 was at ` 931 mio as compared to ` 847 mio in Q4FY20, growth of 10%.
• The EBITDA margins were higher by 33 bps at 6.6% in Q4FY21 as compared to 6.2% in Q4FY20.
* EBITDA Pre Ind AS 116 - excluding 24/7 operating costs
Healthcare
Service
(Mature)
New
Hospitals Proton
Healthcare
Services
(Total)
Pharmacy
DistributionStandalone
Hospitals 21 10 1 32
Operating beds 3,163 1,563 53 4,779
Occupancy 63% 57% 35% 61%
Revenue 9,407 3,197 309 12,913 11,187 24,101
EBITDA (Pre Ind AS 116)* 2,167 437 7 2,611 793 3,405
margin (%) 23.0% 13.7% 2.4% 20.2% 7.1% 14.1%
24/7 Operating Costs -252 -252
EBITDA (Pre Ind AS 116) 2,167 437 7 2,611 541 3,153
margin (%) 23.0% 13.7% 2.4% 20.2% 4.8% 13.1%
EBITDA (Post Ind AS 116) 2,273 500 25 2,799 559 3,358
margin (%) 24.2% 15.7% 8.1% 21.7% 5.0% 13.9%
EBIT 1,683 234 -74 1,843 501 2,344
margin (%) 17.9% 7.3% -24.0% 14.3% 4.5% 9.7%
Hospitals 22 10 1 33
Operating beds 3,359 1,489 47 4,895
Occupancy 63% 58% 30% 61%
Revenue 9,187 2,752 197 12,136 13,585 25,721
EBITDA (Pre Ind AS 116) 1,954 166 -90 2,030 847 2,877
margin (%) 21.3% 6.0% 16.7% 6.2% 11.2%
EBITDA (Post Ind AS 116) 2,054 230 -75 2,210 1,274 3,483
margin (%) 22.4% 8.4% 18.2% 9.4% 13.5%
EBIT 1,521 -30 -156 1,335 858 2,193
margin (%) 16.6% 11.0% 6.3% 8.5%
YOY Growth
2.4% 16.2% 6.4% -17.7% -6.3%
-6.3% 18.3%
10.9% 162.8% 28.6% -36.1% 9.6%
10.7% 117.6% 26.7% -56.1% -3.6%
10.7% 38.1% -41.6% 6.9% EBIT Growth
Q4 FY 21
Q4 FY 20
Revenue Growth
EBITDA (Pre Ind AS 116) Growth
EBITDA (Post Ind AS 116) Growth
EBITDA (Pre Ind AS 116)* Growth

6/23/2021 17www.apollohospitals.com
Standalone Financial Performance – Mature & New Breakup – FY21
Health Care Services revenue degrewby 14% from ` 49,738 mio in FY20 to `42,770 mio in FY21
Key Highlights
(` mio)
17
Pharmacy Distribution revenue at `48,760 mio and EBITDA of ` 2,937 mio (6.0% margin) in FY21, excluding the 24/7 operating costs the EBITDA was at ` 3,189 mio in FY21(6.5% margin)
The Combined Pharmacy platform business on a like-to-like basis delivered a strong revenue & EBITDA growth in FY21. • Revenue of ` 56,103 mio in FY21 as compared
to a Revenue of ` 48,206 mio in FY20 16% growth
• The like-to-like EBITDA (Pre Ind As 116) in FY21 was at ` 3,591 mio as compared to ` 2,893 mio in FY20, growth of 24%.
• The EBITDA margins were higher by 40 bps at 6.4% in FY21 as compared to 6.0% in FY20.
Mature Hospitals revenues were at ` 30,663 mio in FY21. New Hospitals revenues were at ` 11,125 mio in FY21
*includes SAP from 1st Apr 20 to 31st Aug 20 and SAP backend from 1st Sep 20**EBITDA Pre Ind AS 116 - excluding 24/7 operating costs
Healthcare
Service
(Mature)
New
Hospitals Proton
Healthcare
Services
(Total)
* Pharmacy
DistributionStandalone
Hospitals 21 10 1 32
Operating beds 3,163 1,563 53 4,779
Occupancy 52% 54% 35% 53%Revenue 30,663 11,125 982 42,770 48,760 91,530
EBITDA (Pre Ind AS 116)** 4,321 810 -80 5,051 3,189 8,240
margin (%) 14.1% 7.3% 11.8% 6.5% 9.0%
24/7 Operating Costs -252 -252
EBITDA (Pre Ind AS 116) 4,321 810 -80 5,051 2,937 7,988
margin (%) 14.1% 7.3% -8.2% 11.8% 6.0% 8.7%
EBITDA (Post Ind AS 116) 4,740 1,065 -11 5,794 3,680 9,474
margin (%) 15.5% 9.6% -1.2% 13.5% 7.5% 10.4%
EBIT 2,594 9 -393 2,210 2,904 5,115
margin (%) 8.5% 0.1% 5.2% 6.0% 5.6%
Hospitals 22 10 1 33
Operating beds 3,359 1,489 47 4,895
Occupancy 67% 62% 24% 65%Revenue 38,061 11,091 586 49,738 48,206 97,944
EBITDA (Pre Ind AS 116) 8,357 917 -273 9,001 2,893 11,894
margin (%) 22.0% 8.3% 18.1% 6.0% 12.1%
EBITDA (Post Ind AS 116) 8,755 1,169 -224 9,700 4,452 14,152
margin (%) 23.0% 10.5% 19.5% 9.2% 14.4%
EBIT 6,767 128 -468 6,428 2,902 9,330
margin (%) 17.8% 12.9% 6.0% 9.5%
YOY Growth
-19.4% 0.3% 67.6% -14.0% 1.1% -6.5%
10.2% -30.7%
-48.3% -11.7% -43.9% 1.5% -32.8%
-45.9% -8.9% -40.3% -17.3% -33.1%
-61.7% -92.9% -65.6% 0.1% -45.2%
FY 21
FY 20
Revenue Growth
EBITDA (Pre Ind AS 116) Growth
EBIT Growth
EBITDA (Post Ind AS 116) Growth
EBITDA (Pre Ind AS 116)** Growth

6/23/2021 18www.apollohospitals.com
*Healthcare Services consists of Hospitals, Hospital Based Pharmacies and Consulting
**Pharmacy distribution represents the exclusive pharmacy distribution backend business for Apollo Pharmacies Ltd (SAP business).
Standalone Financial Performance – Segment Reporting
Key Highlights
FY21 Healthcare services Revenues at ` 42,771 mio
(` mio)
18
FY21 Healthcare services EBIT at ` 1,867 mio
Q4 FY 20 Q4 FY 21 yoy (%) FY 20 FY 21 yoy (%)
Revenues from each segment
Healthcare Services* 12,138 12,913 6.4% 49,746 42,771 -14.0%
Stand-alone Pharmacy 13,585 0 -100.0% 48,206 22,698 -52.9%
Pharmacy Distribution** 11,187 0 26,062
Total 25,723 24,101 -6.3% 97,953 91,532 -6.6%Less: Intersegmental Revenue 2 0 9 1
Net Revenues 25,721 24,101 -6.3% 97,944 91,530 -6.5%
Profit before Tax & Interest (EBIT)
Healthcare Services* 1,268 1,755 38.4% 6,097 1,867 -69.4%
Stand-alone Pharmacy 738 -100.0% 2510 1,309 -47.9%Pharmacy Distribution** 495 0 1,399
Total EBIT 2,006 2,250 12.1% 8,607 4,575 -46.8%
Profit before Tax & Interest (EBIT) margins
Healthcare Services* 10.4% 13.6% 314 bps 12.3% 4.4% -789 bps
Stand-alone Pharmacy 5.4% 5.2% 5.8% 56 bps
Pharmacy Distribution** 4.4% 5.4%Total EBIT margin 7.8% 9.3% 153 bps 8.8% 5.0% -379 bps

6/23/2021 19www.apollohospitals.com
CONSOLIDATEDFINANCIAL PERFORMANCE
19

6/23/2021 20www.apollohospitals.com
1 of 3Consolidated Financial Performance - Total
Key Highlights
FY 21 Consolidated Revenues at` 105,600 mio
FY21 Consolidated EBITDA of ` 9,122 mio
FY21 Consolidated PAT of ` 1,504 mio
(` mio)
20
Ind-AS 116, effective 1st April 2019 has recognized interest expense on lease liabilities of ` 1,379 mio and depreciation on right-of-use asset of ` 1,446 mio. The effect of applying this standard resulted in reduction of PBT by ` 573 mio in FY 21.
Q4 FY 20 Q4 FY 21 yoy (%) FY 20 FY 21 yoy (%)
Total Revenues 29,224 28,680 -1.9% 112,468 105,600 -6.1%
EBITDA (Pre Ind AS 116) 2,989 3,718 24.4% 12,880 9,122 -29.2%
margin (%) 10.2% 13.0% 274 bps 11.5% 8.6% -281 bps
EBITDA (Post Ind AS 116) 3,801 4,118 8.4% 15,873 11,374 -28.3%
margin (%) 13.0% 14.4% 135 bps 14.1% 10.8% -334 bps
EBIT 2,162 2,734 26.5% 9,676 5,643 -41.7%
margin (%) 7.4% 9.5% 213 bps 8.6% 5.3% -326 bps
Profit After Tax 2,193 1,678 -23.5% 4,549 1,504 -66.9%
Total Debt 28,596
Cash & Cash equivalents (includes investment in liquid funds) 17,222
Net Debt 11,374• Pursuant to the demerger of the Front
End pharmacy, AHEL’s ownership in the wholly owned subsidiary AMPL changed to 25.5%. The assets and liabilities derecognised resulted in gain on loss of control on AMPL amounting to ` 354 mio.
• Gain on fair valuation of investment in Medics, Lucknow ` 250 mio on acquisition of majority stake.
Exceptional item recognized in P&L FY21:

6/23/2021 21www.apollohospitals.com
AHLL – Cradle & Clinics reported EBITDA of ` 127 mio as compared to a loss of ` (17) mio in Q4 FY 20
2 of 3Consolidated Financial Performance – Mature & New Breakup – Q4 FY21
Key Highlights
(` mio)
21
Mature hospitals revenue at `10,597 mio in Q4FY21.
New Hospitals revenues at ` 4,481 in Q4 FY 21
Pharmacy distribution EBITDA of ` 793 mio (7.1% margin) in Q4 FY21
Healthcare
Serv
Group
(Mature)
Healthcare
Serv
Group
(New &
Others)
Proton
Healthcare
Serv
Group
(Total)
Pharmacy
DistributionAHLL Consol
Hospitals 30 13 1 44
Operating beds 5,290 2,066 53 7,409
Occupancy 64% 60% 35% 63%
Revenue 10,597 4,481 309 15,388 11,187 2,105 28,680
EBITDA (Pre Ind AS 116)* 2,442 600 7 3,049 793 127 3,970
margin (%) 23.0% 13.4% 2.4% 19.8% 7.1% 6.0% 13.8%
24/7 Operating Costs -252 -252
EBITDA (Pre Ind AS 116) 2,442 600 7 3,049 541 127 3,718
margin (%) 23.0% 13.4% 19.8% 4.8% 6.0% 13.0%
EBITDA (Post Ind AS 116) 2,552 677 25 3,254 559 305 4,118
margin (%) 24.1% 15.1% 8.1% 21.1% 5.0% 14.5% 14.4%
EBIT 1,895 335 -74 2,155 501 77 2,734
margin (%) 17.9% 0.0% 0.0% 14.0% 4.5% 3.7% 9.5%
Hospitals 31 13 1 45
Operating beds 5,489 1,955 47 7,491
Occupancy 64% 61% 30% 63%
Revenue 10,325 3,444 197 13,966 13,585 1,673 29,224
EBITDA (Pre Ind AS 116) 2,052 196 -90 2,159 847 -17 2,989
margin (%) 19.9% 5.7% 15.5% 6.2% -1.0% 10.2%
EBITDA (Post Ind AS 116) 2,165 273 -75 2,363 1,274 164 3,801
margin (%) 21.0% 7.9% -37.9% 16.9% 9.4% 13.0%
EBIT 1,556 -30 -156 1,370 858 -66 2,162
margin (%) 15.1% 9.8% 6.3% -3.9% 7.4%
Revenue Growth 2.6% 30.1% 10.2% -17.7% 25.8% -1.9%
EBITDA (Pre Ind AS 116)* Growth -6.3% 32.8%
EBITDA (Pre Ind AS 116) Growth 19.0% 205.3% 41.3% -36.1% 24.4%
EBITDA (Post Ind AS 116) Growth 17.9% 148.2% 0.0% -56.1% 86.1% 8.4%
EBIT Growth 21.8% 57.3% -41.6% 26.5%
Q4 FY 21
Q4 FY 20
*EBITDA Pre Ind AS 116 - excluding 24/7 operating costs

6/23/2021 22www.apollohospitals.com
AHLL – Cradle & Clinics reported EBITDA of ` 18 mio in FY20 as compared to EBITDA of ` 98 mio in FY21.
3 of 3Consolidated Financial Performance – Mature & New Breakup – FY21
Key Highlights
(` mio)
22
Mature hospitals revenue at ` 34,682 mio in FY21.
New Hospitals revenues at ` 14,358 mio in FY21.
Pharmacy distribution EBITDA of ` 3,189 mio(6.5% margin) in FY21
*includes SAP from 1st Apr 20 to 31st Aug 20 and SAP backend from 1st Sep 20
Healthcare
Serv
Group
(Mature)
Healthcare
Serv
Group
(New &
Others)
Proton
Healthcare
Serv
Group
(Total)
*Pharmacy
DistributionAHLL Consol
Hospitals 30 13 1 44
Operating beds 5,290 2,066 53 7,409
Occupancy 54% 57% 35% 55%
Revenue 34,682 14,358 982 50,022 48,760 6,818 105,600
EBITDA (Pre Ind AS 116)** 5,016 1,152 -80 6,087 3,189 98 9,374
margin (%) 14.5% 8.0% -8.2% 12.2% 6.5% 1.4% 8.9%
24/7 Operating Costs -252 -252
EBITDA (Pre Ind AS 116) 5,016 1,152 -80 6,087 2,937 98 9,122
margin (%) 14.5% 8.0% 12.2% 6.0% 1.4% 8.6%
EBITDA (Post Ind AS 116) 5,480 1,457 -11 6,925 3,680 768 11,374
margin (%) 15.8% 10.1% 13.8% 7.5% 11.3% 10.8%
EBIT 3,026 213 -393 2,845 2,904 -107 5,643
margin (%) 8.7% 1.5% 5.7% 6.0% 5.3%
Hospitals 31 13 1 45
Operating beds 5,489 1,955 47 7,491
Occupancy 69% 64% 24% 67%
Revenue 42,892 13,820 586 57,297 48,206 6,964 112,468
EBITDA (Pre Ind AS 116) 9,189 1,054 -273 9,970 2,893 18 12,880
margin (%) 21.4% 7.6% 17.4% 6.0% 0.3% 11.5%
EBITDA (Post Ind AS 116) 9,629 1,346 -224 10,750 4,452 671 15,873
margin (%) 22.4% 9.7% 18.8% 9.2% 9.6% 14.1%
EBIT 7,295 166 -468 6,993 2,902 -219 9,676
margin (%) 17.0% 1.2% 12.2% 6.0% -3.1% 8.6%
YOY Growth
Revenue Growth -19.1% 3.9% -12.7% 1.1% -2.1% -6.1%
EBITDA (Pre Ind AS 116)**Growth 10.2% -27.2%
EBITDA (Pre Ind AS 116) Growth -45.4% 9.3% -38.9% 1.5% -29.2%
EBITDA (Post Ind AS 116) Growth -43.1% 8.3% -35.6% -17.3% -28.3%
EBIT Growth -58.5% 28.3% -59.3% 0.1% -41.7%
FY 21
FY 20
**EBITDA Pre Ind AS 116 - excluding 24/7 operating costs

6/23/2021 23www.apollohospitals.com
OPERATIONAL PERFORMANCEHOSPITALS
23

6/23/2021 24www.apollohospitals.com
Notes:(1) Tamilnadu region includes Chennai hospitals, Madurai, Karur, Karaikudi, Trichy & Nellore.
(2) AP, Telangana Region includes Hyderabad, Karimnagar, Vizag old, Vizag new & Kakinada.
(3) Karnataka region includes Bangalore, Mysore, Jayanagar & Malleswaram.
(4) Others include Bhubaneswar, Bilaspur, Nashik & Navi Mumbai.
(5) Significant Hospital JVs/Subs/Associates are – Ahmedabad, Kolkata, Delhi, Indore, Assam & Lucknow (full revenues shown in table above).
(6) Outpatient volume represents New Registrations only.
(7) Revenues under Ind AS have been grossed up for Fixed fee Doctors & considered separately as operating cost. This was earlier being netted off from Revenues under Indian GAAP.
(8) Revenues under the head “Total” have not been provided as Consolidated actual results will differ from total due to proportionate consolidation.
* Inpatient volumes are based on discharges.
Operational Performance – Hospitals (1/2) (` mio)
24
Particulars FY 20 FY 21 yoy (%) FY 20 FY 21 yoy (%) FY 20 FY 21 yoy (%)
No. of Operating beds 7,491 7,409 2,208 2,043 1,344 1,344
Inpatient volume 478,032 352,624 -26.2% 134,713 85,403 -36.6% 78,002 50,151 -35.7%
Outpatient volume(6) 1,627,514 1,160,247 -28.7% 531,218 311,329 -41.4% 238,382 167,513 -29.7%
Inpatient ALOS (days) 3.86 4.19 3.53 4.20 3.90 4.48
Bed Occupancy Rate (%) 67% 55% 59% 48% 62% 46%
Inpatient revenue (` mio) NA NA 16,660 14,252 -14.5% 9,159 8,761 -4.3%
Outpatient revenue (` mio) NA NA 5,742 3,348 -41.7% 1,840 1,685 -8.5%
ARPOB (` /day)(7) 37,397 40,214 7.5% 47,151 49,115 4.2% 36,184 46,479 28.4%
Total Net Revenue (` mio)(7) NA NA 22,402 17,600 -21.4% 10,999 10,445 -5.0%
Total (8) Tamilnadu Region
(Chennai & others) (1)
AP, Telengana Region
(Hyderabad & others) (2)

6/23/2021 25www.apollohospitals.com
Operational Performance – Hospitals (2/2) (` mio)
25
Notes:(1) Tamilnadu region includes Chennai hospitals, Madurai, Karur, Karaikudi, Trichy & Nellore.
(2) AP, Telangana Region includes Hyderabad, Karimnagar, Vizag old, Vizag new & Kakinada.
(3) Karnataka region includes Bangalore, Mysore, Jayanagar & Malleswaram.
(4) Others include Bhubaneswar, Bilaspur, Nashik & Navi Mumbai.
(5) Significant Hospital JVs/Subs/Associates are – Ahmedabad, Kolkata, Delhi, Indore, Assam & Lucknow (full revenues shown in table above).
(6) Outpatient volume represents New Registrations only.
(7) Revenues under Ind AS have been grossed up for Fixed fee Doctors & considered separately as operating cost. This was earlier being netted off from Revenues under Indian GAAP.
(8) Revenues under the head “Total” have not been provided as Consolidated actual results will differ from total due to proportionate consolidation.
* Inpatient volumes are based on discharges.
FY 20 FY 21 yoy (%) FY 20 FY 21 yoy (%) FY 20 FY 21 yoy (%)
769 769 962 1,011 2,208 2,242
55,881 45,392 -18.8% 71,940 62,297 -13.4% 137,496 109,381 -20.4%
179,906 166,271 -7.6% 145,473 138,304 -4.9% 532,535 376,830 -29.2%
3.61 3.79 4.00 4.00 4.21 4.32
72% 61% 82% 67% 72% 58%
6,204 5,410 -12.8% 6,288 6,191 -1.5% 16,585 14,368 -13.4%
1,126 1,035 -8.1% 1,125 1,009 -10.3% 3,738 2,836 -24.1%
36,336 37,463 3.1% 25,790 28,919 12.1% 35,145 36,441 3.7%
7,330 6,446 -12.1% 7,413 7,200 -2.9% 20,322 17,204 -15.3%
Significant Subs/JVs/associates (5)
Karnataka Region
(Bangalore & others) (3) Others (4)
Particulars
No. of Operating beds
Inpatient volume
Outpatient volume(6)
Inpatient ALOS (days)
Bed Occupancy Rate (%)
Inpatient revenue (` mio)
Outpatient revenue (` mio)
ARPOB (` /day)(7)
Total Net Revenue (` mio)(7)

6/23/2021 26www.apollohospitals.com
UPDATE ON APOLLO HEALTH & LIFESTYLE & GLENEAGLES KOLKATA
26

6/23/2021 27www.apollohospitals.com27
Update on AHLL – Q4 FY21 (` mio)
* Footfalls and ARPP for diagnostics represent outpatient / external business and for Cradle and Spectra it represents Inpatient volumes.
Primary care includes Clinics, Sugar, Dental and Dialysis segments. Specialty care includes Cradles and Spectra
Key Highlights
AHLL reported EBITDA of ` 127 mio as compared to a loss of ` 17 mio in Q4 FY20
Q4 vs Q4 Diagnostics Primary Care Specialty Care Corporate Intra Group AHLL (Consol)
Q4 FY21 495 602 1104 0 -97 2,105
Q4 FY20 275 532 968 0 -102 1,673
Q4 21 Vs Q4 20 80% 13% 14% 26%
Q4 FY21 469 469 730 0 -95 1,573
Q4 FY20 254 409 636 0 -100 1,200
Q4 21 Vs Q4 20 85% 15% 15% 31%
Q4 FY21 69 124 195 -83 0 305
Q4 FY20 25 77 137 -76 0 164
Q4 FY21 51 78 80 -83 0 127
Q4 FY20 -1 27 33 -76 0 -17
Q4 FY21 41 66 55 -85 0 77
Q4 FY20 -3 7 5 -75 0 -66
Q4 FY21 47 37 -55 -137 0 -107
Q4 FY20 -13 -2 -93 -103 0 -211
Gross Revenue
Net Revenue
EBITDA [with Ind AS
116]
EBITDA (with out Ind
AS 116)
EBIT
PAT
Q4 FY21 Clinics Diagnostics Sugar Dental Dialysis Cradles (IP) IVF Spectra (IP)
Network 191 796 22 62 69 8 11 11
Footfalls/Day* 1806 9010 438 152 1061 36 20 67
Gross ARPP (Rs.)* 1954 642 2829 6651 1475 95096 36908 103198

6/23/2021 28www.apollohospitals.com28
Update on AHLL – FY 21 (` mio)
* Footfalls and ARPP for diagnostics represent outpatient / external business and for Cradle and Spectra it represents Inpatient volumes.
Primary care includes Clinics, Sugar, Dental and Dialysis segments. Specialty care includes Cradles and Spectra
Key Highlights
AHLL reported EBITDA of ` 98 mio as compared to EBITDA of ` 18 mio in FY20
FY21 vs FY20 Diagnostics Primary Care Specialty Care Corporate Intra Group AHLL (Consol)
FY21 1749 1814 3618 1 -364 6,818
FY20 1185 2272 3983 0 -476 6,964
FY21 vs FY20 48% -20% -9% -2%
FY21 1657 1439 2453 1 -358 5,191
FY20 1094 1714 2688 0 -470 5,026
FY21 vs FY20 51% -16% -9% 3%
FY21 281 232 534 -280 2 768
FY20 103 262 560 -256 2 671
FY21 220 54 103 -280 2 98
FY20 39 86 147 -256 2 18
FY21 189 -9 5 -293 2 -107
FY20 16 30 18 -284 2 -218
FY21 159 -85 -348 -336 0 -609
FY20 -10 -9 -342 -354 0 -715
Gross Revenue
Net Revenue
EBITDA [with Ind AS
116]
EBITDA (with out Ind
AS 116)
EBIT
PAT
FY21 Clinics Diagnostics Sugar Dental Dialysis Cradles (IP) IVFSpectra
(IP)
Network 191 796 22 62 69 8 11 11
Footfalls/Day* 1,291 6,546 327 98 946 37 12 47
Gross ARPP (Rs.)* 2,013 741 2,611 6,381 1,444 101,691 32,538 98,125

6/23/2021 29www.apollohospitals.com
Previous year figures have been reworked/regrouped/rearranged and reclassified wherever necessary to conform to the requirement of revised Schedule VI format
(` mio)
29
Update on Gleneagles Kolkata & Medics Lucknow
Key Highlights
Apollo Gleneagles Kolkata reported Revenue of ` 3,570 mio in FY21.
Pre OMA Fees EBITDA (Pre Ind AS 116) of ` 69 mioin FY21
PAT loss of ` 104 mio in FY21
* OMA indicates contractual Operations and Management fees paid to both Gleneagles Management Services PTE Ltd & Apollo Hospitals Enterprise Ltd.
Apollo Medics Lucknow reported Revenue of ` 1,925 mio in FY21.
EBITDA (Pre Ind AS 116) of ` 346 mio in FY21
PAT of ` 98 mio in FY21 compared to a loss of ` (243) mio in FY20
Particulars Q4 FY 20 Q4 FY 21 yoy (%) FY 20 FY 21 yoy (%)
Total Income 1,155 1,263 9.4% 4,670 3,570 -23.6%
EBITDA (Pre OMA Fees)* 162 222 37.1% 795 69 -91.3%
margin (%) 14.0% 17.6% 17.0% 1.9%
OMA Fees 81 0 -100.0% 331 0 -100.0%
Profit after Tax 15 208 115 -104
margin (%) 1.3% 16.5% 2.5% -2.9%
No. of Operating beds 700 700 700 700
Bed Occupancy Rate (%) 77% 73% 79% 56%
ARPOB (` /day) 31,151 34,277 10.0% 30,197 33,216 10.0%
Apollo Gleneagles Kolkata
Q4 FY 20 Q4 FY 21 yoy (%) FY 20 FY 21 yoy (%)
Total Revenues 288 500 73.3% 1,151 1,925 67.2%
EBITDA (Pre Ind AS 116) -24 82 -34 346
margin (%) -8.5% 16.5% 2495 bps -2.9% 18.0%
Profit After Tax -73 5 -243 98
margin (%) -25.3% 1.0% -21.1% 5.1%
No. of Operating beds 149 175 149 175
Bed Occupancy Rate (%) 56% 70% 58% 73%
ARPOB incl HBP (` /day) 37,730 45,312 20.1% 36,554 41,317 13.0%
Apollo Medics Lucknow

6/23/2021 30www.apollohospitals.com30

6/23/2021 31www.apollohospitals.com
Appendix: Basis of Consolidation –
31
Subsidiaries Location Description
AHEL
Ownership
Samudra Healthcare Enterprises Ltd. Kakinada Hospital 100.00%
Apollo Hospitals (UK) Ltd UK Hospital 100.00%
Imperial Hospital and Research Centre Ltd. Bangalore Hospital 90.00%
Pinakini Hospitals Ltd. Nellore Hospital 80.87%
Apollo Home Health care India Ltd Chennai Paramedical Services 100.00%
Apollo Health and Lifestyle Ltd. Hyderabad Apollo Clinics 68.25%
AB Medical Centres Limited Chennai Infrastructure 100.00%
Western Hospitals Corporation Pvt Ltd Belapur Hospital 100.00%
Sapien Bioscienses Pvt Ltd Hyderabad Biobanking tissues 70.00%
Apollo Rajshree Hospital Indore Hospital 54.63%
Apollo Lavasa Health Corporation Ltd Maharashtra Hospital 51.00%
Apollo Home Health care Ltd Hyderabad Paramedical Services 89.42%
Total Health 100.00%
Apollo Healthcare Technology Solutions ltd Chennai Hospital 40.00%
Assam Hospitals Ltd Assam Hospital 65.85%
Apollo Hospitals International Ltd. Ahmedabad Hospital 50.00%
Apollo Hospitals Singapore.PTE Limited 100.00%
Apollo Medics * (from Jan-21) Lucknow Hospital 51.00%
Future Parking Pvt Ltd Chennai Infrastructure 100.00%
Associates Location Description
Indraprastha Medical Corporation Ltd. Delhi, Noida Hospital 22.03%
Apollo Gleneagles Hospitals Ltd. Kolkata Hospital 50.00%
Apollo Gleneagles PET-CT Pvt. Ltd. Hyderabad Hospital 50.00%
Family Health Plan Ltd. TPA, Health Insurance 49.00%
ApoKos Rehab Pvt Ltd Hyderabad Rehab Centre 50.00%
Stemcyte India Therapautics Pvt Ltd Ahmedabad Stemcell Banking 24.50%
Apollo Medics * (ti l l Dec-20) Lucknow Hospital 50.00%
Apollo Medicals Private Limited Chennai Pharmaceutical 25.50%
AHEL Standalone Location Description AHEL Ownership
Chennai Main Chennai Hospital
ACI - Chennai Chennai Hospital
Tondiarpet - Chennai Chennai Hospital
FirstMed - Chennai Chennai Hospital
Apollo Children's Hospital Chennai Hospital
Apollo Specialty, Vanagaram Chennai Hospital
Women & Child, OMR Chennai Hospital
ASH Perungudi Chennai Hospital
Women & Child, Shafee Mohammed Road Chennai Hospital
Apollo Proton & Cancer care Chennai Hospital
Madurai Madurai Hospital
Karur Karur Hospital
Karaikudi Karaikudi Hospital
Trichy Trichy Hospital
Nellore Nellore Hospital
Hyderabad Hyderabad Hospital
Bilaspur Bilaspur Hospital
Mysore Mysore Hospital
Vizag (old ) Vizag Hospital
Karim Nagar Karim Nagar Hospital
Bhubaneswar Bhubaneswar Hospital
Jayanagar Bangalore Hospital
Nashik Nashik Hospital
Vizag New Vizag Hospital
Malleswaram Bangalore Hospital
Navi Mumbai Mumbai Hospital
100.00%

6/23/2021 32www.apollohospitals.com
Operating Beds
Occupancy
ALOS
ARPOB / day
Contribution
* Apollo does not include fees paid to fee-for-service consultants in its IP Revenue
Hospitals – Understanding Key Operating Metrics
Description Formula / Calculation Key Driver
• Number of operating beds
• Average Length of Stay per In-patient
• Average Revenue Per Occupied Bed Day
• Contribution
• In-patient Bed Days Billed
• In-Patient Bed Days /In-Patient Admissions
• (IP Revenue* +OP Revenue + Hospital BasedPharmacy Revenue) /IP Bed Days
• Revenue – Variable costs
• In-patient Bed Days
• Project execution• Capital Expenditure
• Brand• Doctor reputation• Quality of outcomes• Competition
• Case-Mix / Type of procedures• Leverage technology and quality
of clinical care to shorten stay
• Case-Mix / Type of procedures• Better utilization of operational
theatres, medical equipment• Pricing
• Purchasing efficiency• Operating efficiency
32

6/23/2021 33www.apollohospitals.com
THANK YOU
33