Embed Size (px)
Citation preview

Data Analysis andProbability
GreatPredictions
TEACHER’S GUIDE

Mathematics in Context is a comprehensive curriculum for the middle grades.It was developed in 1991 through 1997 in collaboration with theWisconsin Centerfor Education Research, School of Education, University ofWisconsin-Madison andthe Freudenthal Institute at the University of Utrecht, The Netherlands, with thesupport of the National Science Foundation Grant No. 9054928.
The revision of the curriculum was carried out in 2003 through 2005, with thesupport of the National Science Foundation Grant No. ESI 0137414.
National Science FoundationOpinions expressed are those of the authorsand not necessarily those of the Foundation.
© 2010 Encyclopædia Britannica, Inc. Britannica, Encyclopædia Britannica, thethistle logo, Mathematics in Context, and the Mathematics in Context logo areregistered trademarks of Encyclopædia Britannica, Inc.
All rights reserved.
No part of this work may be reproduced or utilized in any form or by any means,electronic or mechanical, including photocopying, recording or by any informationstorage or retrieval system, without permission in writing from the publisher.
International Standard Book Number 978-1-59339-965-8
Printed in the United States of America
1 2 3 4 5 13 12 11 10 09
Roodhardt, A.,Wijers, M., Bakker, A., Cole, B. R., & Burrill, G. (2010). Greatpredictions. InWisconsin Center for Education Research & Freudenthal Institute(Eds.), Mathematics in context. Chicago: Encyclopædia Britannica, Inc.
The Teacher’s Guide for this unit was prepared by David C.Webb, Beth R. Cole,MonicaWijers, Truus Dekker, and Sonia Palha.

The Mathematics in Context Development TeamDevelopment 1991–1997
The initial version of Great Expectations was developed by Anton Roodhardt and Monica Wijers. It was adapted for use in American schools by Beth R. Cole and Gail Burrill.
Wisconsin Center for Education Freudenthal Institute StaffResearch Staff
Thomas A. Romberg Joan Daniels Pedro Jan de LangeDirector Assistant to the Director Director
Gail Burrill Margaret R. Meyer Els Feijs Martin van ReeuwijkCoordinator Coordinator Coordinator Coordinator
Project Staff
Jonathan Brendefur Sherian Foster Mieke Abels Jansie NiehausLaura Brinker James A, Middleton Nina Boswinkel Nanda QuerelleJames Browne Jasmina Milinkovic Frans van Galen Anton RoodhardtJack Burrill Margaret A. Pligge Koeno Gravemeijer Leen StreeflandRose Byrd Mary C. Shafer Marja van den Heuvel-PanhuizenPeter Christiansen Julia A. Shew Jan Auke de Jong Adri TreffersBarbara Clarke Aaron N. Simon Vincent Jonker Monica WijersDoug Clarke Marvin Smith Ronald Keijzer Astrid de WildBeth R. Cole Stephanie Z. Smith Martin KindtFae Dremock Mary S. SpenceMary Ann Fix
Revision 2003–2005
The revised version of Great Predictions was developed Arthur Bakker and Monica Wijers. It was adapted for use in American Schools by Gail Burrill.
Wisconsin Center for Education Freudenthal Institute StaffResearch Staff
Thomas A. Romberg David C. Webb Jan de Lange Truus DekkerDirector Coordinator Director Coordinator
Gail Burrill Margaret A. Pligge Mieke Abels Monica WijersEditorial Coordinator Editorial Coordinator Content Coordinator Content Coordinator
Project Staff
Sarah Ailts Margaret R. Meyer Arthur Bakker Nathalie KuijpersBeth R. Cole Anne Park Peter Boon Huub Nilwik Erin Hazlett Bryna Rappaport Els Feijs Sonia PalhaTeri Hedges Kathleen A. Steele Dédé de Haan Nanda QuerelleKaren Hoiberg Ana C. Stephens Martin Kindt Martin van ReeuwijkCarrie Johnson Candace UlmerJean Krusi Jill VettrusElaine McGrath

Cover photo credits: (left, middle) © Getty Images;(right) © Comstock Images
Illustrationsxii (left) Jason Millet; 8 Holly Cooper-Olds; 12 James Alexander; 17, 18,24 Holly Cooper-Olds; 28, 29 James Alexander; 34, 36, 40 ChristineMcCabe/© Encyclopædia Britannica, Inc.; 44Holly Cooper-Olds
Photographsxii Amos Morgan/PhotoDisc/Getty Images; xix PhotoDisc/GettyImages; xx Peter Van Steen/ HRW Photo; 1 Photodisc/Getty Images;2 © Raymond Gehman/Corbis; 3 USDA Forest Service– Region;4 Archives, USDA Forest Service, www.forestryimages.org;7 © Robert Holmes/Corbis; 16 laozein/Alamy; 18 © Corbis;30Victoria Smith/HRW; 32 Epcot Images/Alamy; 36Dennis MacDonald/Alamy; 39 Creatas; 42 (left to right) © PhotoDisc/Getty Images;© Corbis; 44 Dennis MacDonald/ Alamy; 45 Dynamic Graphics Group/Creatas/Alamy; 47 © Corbis

Contents
Great Predictions v
OverviewNCTM Principles and Standards for School Mathematics viiMath in the Unit viiiData Analysis and Probability Strand: An Overview xStudent Assessment in Mathematics in Context xivGoals and Assessment xviMaterials Preparation xviii
Student Material and Teaching NotesStudent Book Table of ContentsLetter to the Student
Section Drawing Conclusions from SamplesSection Overview 1AChance or Not? Understanding Chance Using Proportional Reasoning 1Taking Samples: Calculating Probability; Evaluating Reasonableness 4Populations and Sampling: Evaluating Samples 8Summary 10Check Your Work 10
Section Maybe There is a ConnectionSection Overview 12AOpinion Poll: Distinguishing Between Independent and
Dependent Events; Calculating Probability 12Insect Repellent: Using Probability to Make Conjectures 16Ape Shapes: Calculating Probability 17Glasses: Using Tree Diagrams 18Summary 20Check Your Work 21
Section Reasoning from SamplesSection Overview 24AFish Farmer: Displaying Data from Random Samples;
Calculating Probability 24Backpack Weight: Interpreting Line Plots; Making Conjectures 28Summary 30Check Your Work 30
C
B
A

vi Great Predictions Contents
Contents
Section ExpectationsSection Overview 32ACarpooling: Calculating Expected Values 32Advertising: Using a Chance Tree to Make Conjectures 34Expected Life of a Mayfly: Making Conjectures; Calculating
Expected Value 36Free Throws: Making a Chance Tree; Calculating Expected Value 36Summary 38Check Your Work 38
Section Combining SituationsSection Overview 40AFree Meal: Using Probability Rules; Designing a Simulation 40Delayed Luggage: Using Probability Rules; Making Conjectures 45Summary 48Check Your Work 49
Additional Practice 50
Assessment and SolutionsAssessment Overview 55AQuiz 1 56Quiz 2 58Unit Test 60Quiz 1 Solutions 64Quiz 2 Solutions 65Unit Test Solutions 67
Glossary 70
Blackline MastersLetter to the Family 72Student Activity Sheets 73Fish Cards 76
D
E

Overview
Great Predictions andthe NCTM Principles andStandards for SchoolMathematics for Grades6–8The process standards of Problem Solving, Reasoning and Proof,Communication, Connections, and Representation are addressedacross all Mathematics in Context units.In addition, this unit specifically addresses the following PSSMcontent standards and expectations:
Data Analysis and Probability
In grades 6–8, all students should:
• select, create, and use appropriate graphical representations ofdata;
• find, use, and interpret measures of center and spread;
• discuss and understand the correspondence between data setsand their graphical representations;
• use observations about differences between two or more samplesto make conjectures about the populations from which the sampleswere taken;
• use conjectures to formulate new questions and plan new studiesto answer them;
• understand and use appropriate terminology to describe comple-mentary and mutually exclusive events;
• use proportionality and a basic understanding of probability tomake and test conjectures about the results of experiments andsimulations; and
• compute probabilities for simple compound events, using suchmethods as organized lists, tree diagrams, and area models.
In grades 9–12, all students should:
• use simulations to construct empirical probability distributions;
• compute and interpret the expected value of random variables insimple cases;
• understand the concepts of conditional probability and independentevents; and
• understand how to compute the probability of a compound event.
Geometry
In grades 6–8, all students should:
•use geometric models to represent and explain numericalrelationships.
Overview Great Predictions vii

Overview
viii Great Predictions Overview
Prior Knowledge
Great Predictions is the final unit in the Data Analysisand Probability strand. It assumes students haveworked through all the units in this strand andknow and can do the following with understanding:
• add, subtract, multiply, and divide rationalnumbers in all representations;
• use fractions, decimals, and percents to solveproblems, as in the Number units;
• use and find experimental and theoreticalchances and express a chance as a ratio of thenumber of favorable outcomes to the totalnumber of possible outcomes, as formalized inthe unit Second Chance;
• use organized counting techniques and strategies;
• understand and use statistical measures (mean,median, mode, spread), as introduced and usedin the units Picturing Numbers, Dealing withData, and Insights into Data.
• understand, make, and interpret statisticalgraphs such as number line plots and his-tograms, as introduced in the units PicturingNumbers and Dealing with Data;
• know and understand the terms population andsample, as introduced and used in the unitsDealing with Data and Insights into Data;
• recognize possible bias in samples and surveyresults, as introduced in the unit Insights intoData;
• collect and represent data through surveys,experiments, and simulations, as introduced inthe units Second Chance and Insights into Data;
• use tree diagrams, as introduced in the unitTake a Chance, and chance trees, two-waytables, and the area model, as introduced in theunit Second Chance.
Great Predictions is the last unit in the Data Analysisand Probability strand and integrates concepts fromboth strands. The unit explores such topics as rep-resentative and biased samples, dependent andindependent events, expected values, and jointprobability.
Descriptions of unusual events lead to a deeperunderstanding of the mathematical concepts ofrepresentative, biased, and random samples.Students reason about how likely it is that certainevents will occur.
They explore questions such as: Are unusual events,those which differ from expected outcomes, due tochance, or can the results be explained by a deeperinvestigation? Can results from a sample be used tomake reliable estimates for the population or not?And on what does this depend? Surveys provide thecontext for describing an unknown population andinvestigating sources of bias.
By studying samples and taking samples withvarying sample size, students learn in more depththat drawing conclusions from samples alwaysinvolves uncertainty. Students also experience thatsmall samples can have great variability. Recordingthe results of an increasing sample size for example,by combining results of samples collected by awhole class, helps students realize that variabilitycan decrease if sample size increases and that alarger sample is more likely to be representative ofthe population. Students use data from varioussamples to estimate chances of particular events.
An opinion poll about building a bridge across ariver formally introduces the concept of dependentand independent events. Students use tree diagrams,chance trees, and tables to organize informationand make inferences about whether events seemto be dependent or not. Students are made awareof the fact that although using these models canhelp them decide if two events are possiblydependent, they cannot help them find out why aconnection exists. Some situations from earlierunits are revisited, and the dependency of eventsis formally addressed.
Math in the Unit
Bridge
River
West District:200 Citizens Polled
East District:100 Citizens Polled

Chance trees that were introduced in the unitSecond Chance—as a special type of tree diagram—are used to explore and calculate expected values.To make the calculation of the expected value easierto understand, now numbers are used in the chancetrees, such as in the example shown.
The expected toll in this example can be found byadding the total toll collected, which is $3,400, anddividing this over the 1,000 cars, which results in anexpected toll of $3.40 per car. Students investigatewhat happens if they start with a different numberof cars, which leads to the notion that the expectedvalue only depends on the chances of the differentoutcomes. This notion is addressed in a preformalway.
Students continue the study of chances of combinedevent situations, which began in the unit SecondChance. They explore more complex situationsusing chance trees and area models. The multipli-cation rule for chance is formalized in this unit.Students find out that this rule will not alwayswork, such as in the case of dependent events.
When students have finished the unit, they:
• understand the relationship between a sampleand a population;
• Samples were informally introduced in the unitDealing with Data, and revisted preformally inthe unit Insight into Data.
• Students can draw conclusions from samples,and they know that uncertainty or chance isinvolved when doing this.
• Students know that samples must be largeenough and randomly chosen to give a goodimage of the population.
• Students understand the concepts ofrandomness and bias.
• understand the difference between independentand dependent events;
• Students use information from two-way tablesor tree diagrams to decide whether events aredependent or independent.
• Students understand that if events aredependent, this does not tell why aconnection exists. This may be due to chance.
• calculate and use expected value to makedecisions;
• Students can calculate expected value from achance tree or a table.
• understand the meaning of chance or probabilityand can estimate and compute chances; and
• Students can find chances as relativefrequencies from tables and graphs.
• Students can calculate chances inmulti-event situations using chance trees oran area model. These models were introducedand used in the units Take a Chance andSecond Chance.
• The multiplication rule for chances (for inde-pendent events) is formalized in this unit.
• can make connections between statistics andprobability.
• Students can use data to compute chances.
20%
80%
for each car� $1.00 � $200
for each car� $4.00 � $3,200
200Cars
800Cars
1,000Cars
Overview Great Predictions ix
iii.16
56
12
12

Overview
x Great Predictions Overview
One thing is for sure: our lives are full of uncertainty.We are not certain what the weather will be tomor-row or which team will win a game or how accuratea pulse rate really is. Data analysis and probabilityare ways to help us measure variability and uncer-tainty. A central feature of both data analysis andprobability is that these disciplines help us makenumerical conjectures about important questions.
The techniques and tools of data analysis andprobability allow us to understand general patternsfor a set of outcomes from a given situation, suchas tossing a coin, but it is important to rememberthat a given outcome is only part of the larger pat-tern. Many students initially tend to think of indi-vidual cases and events, but gradually they learn tothink of all features of data sets and of probabili-ties as proportions in the long run.
The MiC Approach to Data Analysisand Probability
The Data Analysis and Probability units in MiCemphasize dealing with data, developing anunderstanding of chance and probability, usingprobability in situations connected to data analysis,and developing critical thinking skills.
The strand begins with students’intuitive understanding of thedata analysis concepts of most,least, and middle in relationto different types of graphicalrepresentations that showthe distribution of data and
the probability concepts of fairness and chance.As students gradually formalize these ideas, theyuse a variety of counting strategies and graphicalrepresentations. In the culminating units of thisstrand, they use formal rules and strategies forcalculating probabilities and finding measuresof central tendency and spread.
Throughout this development, there is a constantemphasis on interpreting conclusions made bystudents and suggested in the media or othersources. In order for students to make informeddecisions, they must understand how informationis collected, represented, and summarized, and theyexamine conjectures made from the informationbased on this understanding. They learn aboutall phases of an investigative cycle, starting withquestions, collecting data, analyzing them, andcommunicating about the conclusions. They areintroduced to inference-by-sampling to collectdata and reflect on possible sources of bias. Theydevelop notions of random sampling, variationand central tendency, correlation, and regression.Students create, interpret, and reflect on a widerange of graphical representations of data and relatethese representations to numerical summaries suchas mean, mode, and range.
Body Length (in centimeters)
32 3
4 3
6 3
8
Head
Circu
mfe
rence
(in
centim
ete
4850
5254 56
Source: Sunburst Communications
TheDataAnalysis and Probability Strand:An Overview

Overview
Overview Great Predictions xi
Organization of the Strand
Statistical reasoning based on data is addressed inall Data Analysis and Probability units. Students’work in these units is organized into two substrands:Data Analysis and Chance. As illustrated in thefollowing map of the strand, the three core unitsthat focus on data analysis are Picturing Numbers,Dealing with Data, and Insights into Data. The twounits that focus on probability are Take a Chanceand Second Chance. The sixth core unit in thisstrand, Great Predictions, integrates data analysisand probability.
Data Analysis
In the units of the DataAnalysis substrand,students collect,depict, describe, andanalyze data. Usingthe statistical toolsthey develop, theymake inferences anddraw conclusionsbased on data sets.
The substrand beginswith Picturing Numbers.Students collect dataand display them in tabular and graphical forms,such as histograms, number line plots, and piecharts. Measures of central tendency, such as themean, are used informally as students interpretdata and make conjectures.
In Dealing with Data, students create and interpretscatter plots, box plots, and stem-and-leaf plots, inaddition to other graphical representations. Themean, median, mode, range, and quartiles are usedto summarize data sets. Students investigate datasets with outliers and make conclusions about theappropriate use of the mean and median.
Sampling is addressed across this substrand, butin particular in Insights into Data, starting withinformal notions of representative samples,randomness, and bias. Students gather data usingvarious sampling techniques and investigate thedifferences between a survey and a sample. Theycreate a simulation to answer questions about asituation. Students also consider how graphicalinformation can be misleading, and they areintroduced informally to the concepts of regressionand correlation.
123
Pathways through the Data Analysisand Probability Strand
(Arrows indicate prerequisite units.)
GreatPredictions
PicturingNumbers
SecondChance
Insightsinto Data
Dealingwith Data
Take aChance
Level 1
Level 2
Level 3
50–5
9
60–6
9
70–7
9
80–8
9
90–1
00
0
Nu
mb
er
of
Stu
de
nts
Scores
Histogram
1
2
3
4
5
6
7
8
9
10Stem-and-Leaf Plot
Test Scores
5 2 8
6 1 3 3 6 7
7 0 2 2 4 5 8
8 1 3 3 4 5 6 7 7 9
9 5 8 8
Key: 5 | 2 means a score of 52
1 2 3 4 5 6 7 8 9Number of Babies in Litter
1 2 3 4 5 6 7 8 9ABCDEFGHIJKLMNOPQR

Overview
xii Great Predictions Overview
In Great Predictions, students learn to recognizethe variability in random samples and deepen theirunderstanding of the key statistical concepts ofrandomness, sample size, and bias. As the capstoneunit to the Data Analysis and Probability strand,data and chance concepts and techniques areintegrated and used to inform conclusions aboutdata.
Chance
Beginning with the concept of fairness, Take aChance progresses to everyday situations involvingchance. Students use coins and number cubes toconduct repeated trials of an experiment. A chanceladder is used as a model throughout the unit torepresent the range from impossible to certainand to ground the measure of chance as a numberbetween 0 and 1. Students also use tree diagramsto organize and count, and they use benchmarkfractions, ratios, and percents to describe theprobability of various outcomes and combinations.
The second probability unit, Second Chance, furtherdevelops students’ understanding of fairness andthe quantification of chance. Students make chancestatements from data presented in two-way tablesand in graphs.
Students also reason about theoretical probabilityand use chance trees as well as an area model tocompute chances for compound events. They useinformation from surveys, experiments, and simu-lations to investigate experimental probability.Students also explore probability concepts suchas complementary events and dependent andindependent events.
These concepts are elaborated further in the finalunit of the strand, Great Predictions. This last unitdevelops the concepts of expected value, featuresof independent and dependent events, and the roleof chance in world events.
Sure to Happen
Sure Not to Happen0%
100%Sure it will; 100% chance
Unlikely to happen
50–50 chance
Very likely to happen
It probably will
Very unlikely to happen
No way it will; 0% chance
Men
Glasses
Total
Women Total
32
88
3
42
35
No Glasses 56 39 95
130
Man68%
Woman
Glasses
Glasses
NoGlasses
NoGlasses
130

Overview
Overview Great Predictions xiii
Critical Reasoning
Critical reasoning about data and chance is a themethat exists in every unit of the Data Analysis andProbability strand. In Picturing Numbers, studentsinformally consider factors that influence datacollection, such as the wording of questions on asurvey, and they compare different graphs of thesame data set. They also use statistical data to buildarguments for or against environmental policies.
In Take a Chance, students use their informalknowledge of fairness and equal chances as theyevaluate decision-making strategies.
In Dealing with Data, students explore how thegraphical representation of a data set influences theconjectures and conclusions that are suggested bythe data. They compare advantages and disadvan-tages of various graphs and explore what you learnfrom using different measures of central tendency.
Throughout the curriculum, students are asked toview representations critically. Developing a criticalattitude is especially promoted in Insights into Data,when students analyze graphs from mass media.
In Second Chance, students explore the notionof dependency (for instance, the relation of genderand wearing glasses) and analyze statements aboutprobabilities (for instance, about guessing duringa test).
In Great Predictions, students study unusual samplesto decide whether they occurred by chance or forsome other reason (pollution, for instance). Theyexplore how expected values and probability canhelp them make decisions and when this informa-tion could be misleading.Dry SpellMay EndSoon 3.1
28242016128402.6
3.0
2.9
2.8
2.7
Hours Worked Per Week
Gra
de P
oin
t A
vera
ge
3.2
28242016128400
2.8
2.4
1.6
0.8
2.0
1.2
0.4
Hours Worked Per Week
Gra
de P
oin
t A
vera
ge

Overview
xiv Great Predictions Overview
Level IIIanalysis
Level IIconnections
Leve
ls o
f Rea
sonin
g
Questions P
osedDom
ains of Mathem
atics
Level Ireproduction
algebra
geometry
number
statistics &
probability
X
O
easy
difficult
Student Assessment inMathematics in ContextAs recommended by the NCTM Principles and Standards for SchoolMathematics and research on student learning, classroom assessmentshould be based on evidence drawn from several sources. An assessmentplan for a Mathematics in Context unit may draw from the followingoverlapping sources:
• observation—As students work individually or in groups, watchfor evidence of their understanding of the mathematics.
• interactive responses —Listen closely to how students respond toyour questions and to the responses of other students.
• products —Look for clarity and quality of thought in students’solutions to problems completed in class, homework, extensions,projects, quizzes, and tests.
Assessment Pyramid
When designing a comprehensive assessment program, the assessmenttasks used should be distributed across the following three dimensions:mathematics content, levels of reasoning, and difficulty level. TheAssessment Pyramid, based on Jan de Lange’s theory of assessment,is a model used to suggest how items should be distributed acrossthese three dimensions. Over time, assessment questions should“fill” the pyramid.
Overview
Overview Great Predictions xv
Levels of Reasoning
Level I questions typically address:
• recall of facts and definitions and
• use of technical skills, tools, and standardalgorithms.
As shown in the pyramid, Level I questions are notnecessarily easy. For example, Level I questions mayinvolve complicated computation problems. Ingeneral, Level I questions assess basic knowledgeand procedures that may have been emphasizedduring instruction. The format for this type ofquestion is usually short answer, fill-in, or multiplechoice. On a quiz or test, Level I questions closelyresemble questions that are regularly found in agiven unit, substituted with different numbersand/or contexts.
Level II questions require students to:
• integrate information;
• decide which mathematical models or tools touse for a given situation; and
• solve unfamiliar problems in a context, basedon the mathematical content of the unit.
Level II questions are typically written to elicit shortor extended responses. Students choose their ownstrategies, use a variety of mathematical models,and explain how they solved a problem.
Level III questions require students to:
• make their own assumptions to solve open-endedproblems;
• analyze, interpret, synthesize, reflect; and
• develop one’s own strategies or mathematicalmodels.
Level III questions are always open-ended problems.Often, more than one answer is possible and thereis a wide variation in reasoning and explanations.There are limitations to the type of Level III prob-lems that students can be reasonably expected torespond to on time-restricted tests.
The instructional decisions a teacher makes as heor she progresses through a unit may influence thelevel of reasoning required to solve problems. If amethod of problem solving required to solve aLevel III problem is repeatedly emphasized duringinstruction, the level of reasoning required to solvea Level II or III problem may be reduced to recallknowledge, or Level I reasoning. A student who doesnot master a specific algorithm during a unit butsolves a problem correctly using his or her owninvented strategy may demonstrate higher-levelreasoning than a student who memorizes andapplies an algorithm.
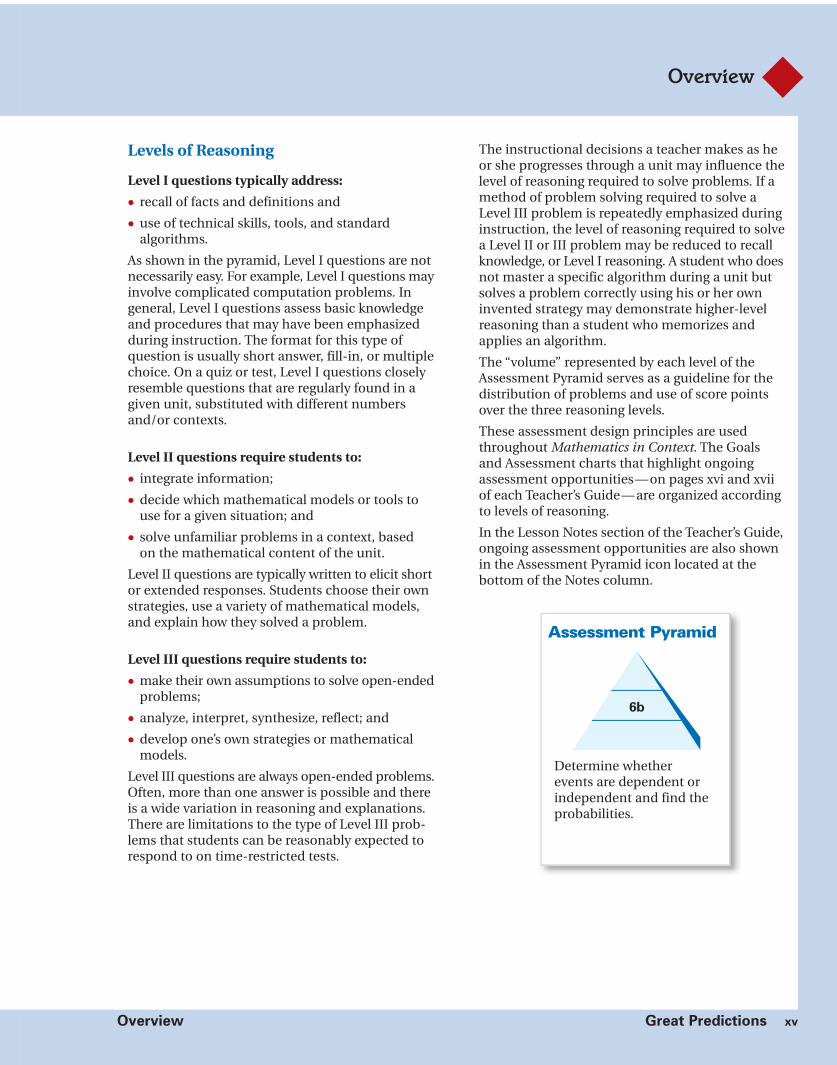
The “volume” represented by each level of theAssessment Pyramid serves as a guideline for thedistribution of problems and use of score pointsover the three reasoning levels.
These assessment design principles are usedthroughout Mathematics in Context. The Goalsand Assessment charts that highlight ongoingassessment opportunities—on pages xvi and xviiof each Teacher’s Guide—are organized accordingto levels of reasoning.
In the Lesson Notes section of the Teacher’s Guide,ongoing assessment opportunities are also shownin the Assessment Pyramid icon located at thebottom of the Notes column.
Assessment Pyramid
6b
Determine whetherevents are dependent orindependent and find theprobabilities.

Overview
xvi Great Predictions Overview
Goals and AssessmentGoals and Assessment
Level I:
Conceptual
and Procedural
Knowledge
Ongoing Unit
Goal Assessment Opportunities Assessment Opportunities
1. Use chance trees, Section B p.13, #2b Quiz 1 #2ccounting strategies, p. 19, #17c Quiz 2 #2abtwo-way tables, and rules Section C p. 27, #10abd Test #3a , 4acto find probability. Section D p. 34, #8ab
p. 37, #17aSection E p. 42, #8abc
p. 43, #10abp. 44, #11
2. Use different represent- Section B p. 18, #12, 13 Quiz 2 #2abations (ratios, percents, Section C p. 27, #10bd Test #4afractions, and so on) Section D p. 34, #8abto describe probability. Section E p. 44, #11
3. Understand that Section A p. 3, #4abcde Quiz 1 #2cvariability is inherent in Quiz 2 #2cany probability situation.
4. Use graphs and measures Section C p. 25, #2a, 5 Quiz 2 #1abof central tendency to p. 27, #7adescribe data. p. 28, #12a
Ongoing Unit
Goal Assessment Opportunities Assessment Opportunities
In the Mathematics in Context curriculum, unit goals, organizedaccording to levels of reasoning described in the Assessment Pyramidon page xiv, relate to the strand goals and the NCTM Principles andStandards for School Mathematics. The Mathematics in Contextcurriculum is designed to help students demonstrate their under-standing of mathematics in each of the categories listed below.
Ongoing assessment opportunities are alsoindicated on their respective pages throughoutthe teacher guide by an assessment pyramidicon. It is important to note that theattainment of goals in one category is not aprerequisite to attaining those in anothercategory. In fact, students should progresssimultaneously toward several goals in
different categories. The Goals and Assessment table is designed tosupport preparation of an assessment plan.

Overview
Overview Great Predictions xvii
Level II:
Reasoning,
Communicating,
Thinking,
and Making
Connections
Ongoing Unit
Goal Assessment Opportunities Assessment Opportunities
5. Reason about likely and Section A p. 6, #7c Quiz 1 #1ab, 2aunlikely samples and factors p. 7, #8b Quiz 2 #1cthat can bias a survey. p. 8, #12 Test #2
Section D p. 36, #14b
6. Use simulation and Section E p. 41, #5abcmodeling to investigateprobability.
7. Understand the Section A p. 6, #7crelationship between asample and a populationand the effect of thesample size.
8. Make decisions using Section B p. 18, #14 Quiz 1 #2cprobability and expected Section D p. 34, #8cd Quiz 2 #2dvalues. p. 36, #14b Test #4bc
p. 37, #17b
9. Determine whether Section B p. 15, #6b Quiz 1 #2bevents are dependent or p. 19, #18ab Test #1, 3bindependent and find theprobabilities.
Level III:
Modeling,
Generalizing,
and Non-Routine
Problem Solving
Ongoing Unit
Goal Assessment Opportunities Assessment Opportunities
10.Develop and use a Section E p. 46, #16, 18critical attitude towardthe use of probability.
Overview
xviii Great Predictions Overview
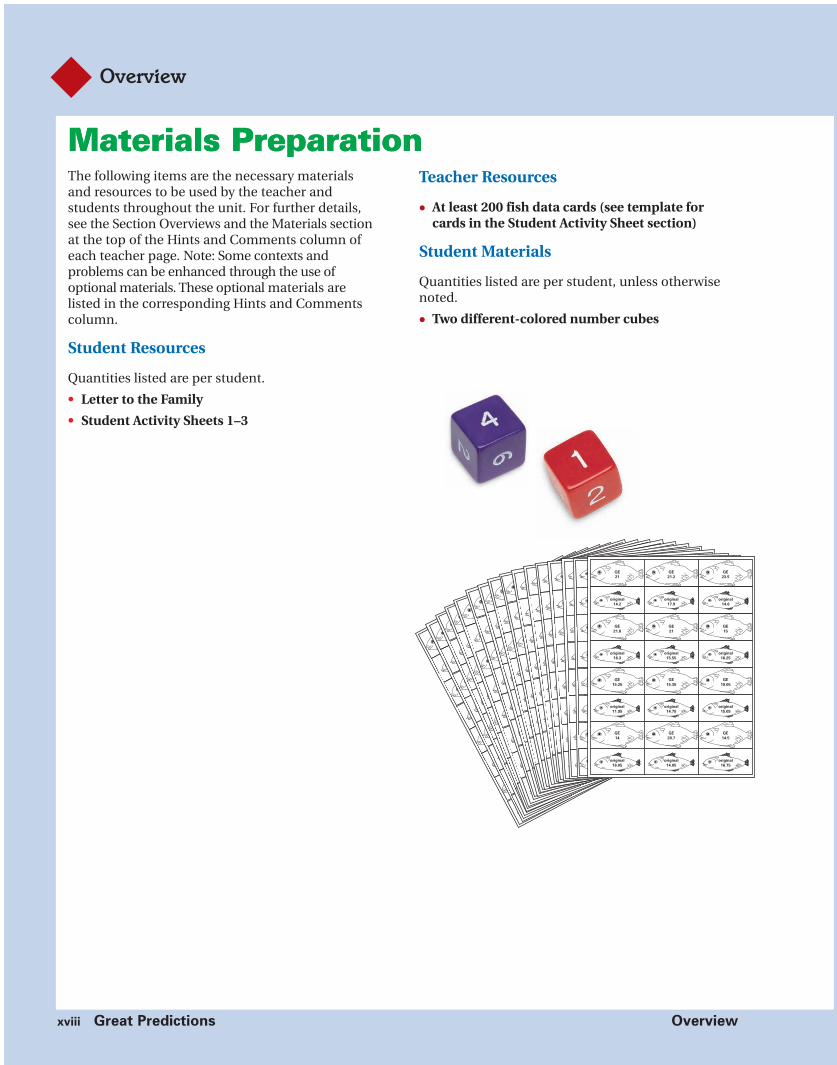
Materials PreparationThe following items are the necessary materialsand resources to be used by the teacher andstudents throughout the unit. For further details,see the Section Overviews and the Materials sectionat the top of the Hints and Comments column ofeach teacher page. Note: Some contexts andproblems can be enhanced through the use ofoptional materials. These optional materials arelisted in the corresponding Hints and Commentscolumn.
Student Resources
Quantities listed are per student.
• Letter to the Family
• Student Activity Sheets 1–3
Teacher Resources
• At least 200 fish data cards (see template forcards in the Student Activity Sheet section)
Student Materials
Quantities listed are per student, unless otherwisenoted.
• Two different-colored number cubes
Materials Preparation
GE
24.3
GE
15.5
original
19
original
15.6
GE
22.3
original
14.55
GE
15.05
original
18.4GE
19.25
original
18.1GE
14.9
GE
16.75
GE
22.25
GE
21.85
GE
18.5
GE
22.65
GE
23
original
16.35
original
19.15
original
16.85
original
15.6
original
15.95
original
16.5
original
14.5
GE
21.3
GE
23.7
original
15.1
original
15.85
GE
18.9
original
16.9
GE
22.5
original
15GE
17.7
original
12.6GE
15.6GE
16.8
GE
17
GE
20.05
original
16.2
original
13.6
original
15.25
original
13.65
original
15.5
original
16.95
original
17
original
13.45
original
17.45
original
15.65
GE
21.3
GE
23.7
original
15.1
original
15.85
GE
18.9
original
16.9
GE
22.5
original
15 GE
17.7
original
12.6 GE
15.6
GE
16.8
GE
17
GE
20.05
original
16.2
original
13.6
original
15.25
original
13.65
original
15.5
original
16.95
original
17
original
13.45
original
17.45
original
15.65
GE
18
GE
22.7
original
14.45
original
16.7
GE
18.25
original
15.35
GE
24.6
original
16.9 GE
16.55
original
15.85GE
20.8
GE
15.7
GE
19.55
GE
18.2
original
16.05
original
14.9
original
15.4
original
15.95
original
16.05
original
17.3
original
14.55
original
16.35
original
13.1
original
16.1
GE
18.45
GE
17.5
original
15.35
original
15.8
GE
21.15
original
15.15
original
13.4
original
13.3
GE
20.6
GE
23.05
GE
22.5
original
17.2
original
17.55
original
16.25
original
17.3
original
17.6
original
13.2
original
16.65
original
14.9
original
16.25
original
16.35
original
15.75
original
17.9
original
13.8
GE
17.3
GE
16.2
original
14
original
15.6
GE
14.15
original
16.2
original
17.7
original
15.65
GE
21.9
GE
20.15
GE
17.3
original
14.25
original
14.7
original
17.85
original
13.95
original
15
original
17.95
original
15.55
original
15
original
13.35
original
12.4
original
13.6
original
14.4
original
16.55
GE
23
GE
20.45
original
13.6
original
14.3
GE
18.8
original
16.85
original
15.65
original
17.55
GE
23.2
GE
19.9
GE
17.5
original
17.15
original
16.3
original
16.35
original
17.35
original
16.95
original
17.05
original
15.5original
14.25
original
13.35
original
14.65
original
15.5
original
16.3
original
14.8
GE
22.4
GE
21.75
original
16.7
original
14.9
GE
16.9
original
13.2
original
14.25
original
16.85
GE
13.6
GE
20.45
original
14.3
original
14.2
original
15.65
original
17.25
original
17.25
original
14.8
original
16.3original
13.75
original
14.6
original
16.3
original
15.9
original
14.25
original
17
GE
19.35
GE
22.4
GE
21.75
original
16.7
original
14.9
GE
16.9
original
13.2
original
14.25
original
16.85
GE
13.6
GE
20.45
original
14.3
original
14.2
original
15.65
original
17.25
original
17.25
original
14.8
original
16.3
original
13.75
original
14.6
original
16.3
original
15.9
original
14.25
original
17
GE
19.35
original
18.65
original
17.3
original
13.65
original
15.4
original
15.4
original
14.3
original
13.6
original
15
original
15.4
original
15.85
original
16.15
original
15.65
original
13.1
original
14.95
original
16.35
original
13.85
original
17.95
original
16.8
original
16.15
original
15.4
original
15.9
original
17.1
original
14.75
original
16.6
original
15
original
16.35
original
16.55
original
15.65
original
16.45
original
15.15
original
15.2
original
15.05
original
14
original
17.25
original
13.65
original
16.3
original
15.75
original
16.15
original
15.95
original
13.7
original
16.95
original
13.05
original
16.5
original
16.85
original
13.6
original
14.1
original
15.9
original
14.65
original
17.55
original
17.25
original
16.4
original
17
original
15.5
original
14.45
original
15.45
original
15.7
original
16.75
original
15.4
original
14.95
original
14.5
original
15.2
original
14.85
original
11.8
original
16.05
original
16.25
original
15.9
original
15.85
original
17.85
original
14.4
original
16.85
original
15.9
original
14.45
original
15.3
original
16.1
original
12.75
original
15.7
original
15.55
original
13.55
original
15.45
original
12.15
original
14.7
original
14.2
original
14.55
original
17.3
original
15.5
original
14.85
original
16.25
original
12.85
original
15.4
original
17.95
original
13.2original
15
original
14.4
original
17
original
14.65
original
14.6
original
17.45
original
15.15
original
16.3
original
15.65
original
13.1
original
15.1
original
14.2
original
16.6
original
15.65
original
12.7
original
15.95
original
18.55
original
15.65
original
14.8
original
17.2
original
16.5
original
15.8
original
15.65
original
15.4original
14.2
original
16.45
original
15.5
original
14.9
original
16.65
original
14.8
original
13.95
original
14.35
original original original
original original
original original original
originaloriginal
19.2
original
original
14.6
original
15.35
original
16.45
GE GE GE
GE GE GE
GE
GE
21
GE
21.2
original
14.2
original
17.9
GE
23.5
original
14.6
GE
15.25
original
16.3
GE
15.35
original
15.55
GE
19.05
GE
14
GE
20.7
GE
14.5
GE
21.8
GE
21
GE
15
original
16.25
original
11.95
original
14.75
original
15.05
original
16.05
original
14.05
original
16.75

StudentMaterial
andTeaching
Notes
StudentMaterial
andTeaching
Notes

Teachers Matter
v Great Predictions Teachers Matter
ContentsLetter to the Student vi
Section A Drawing Conclusions from SamplesChance or Not? 1Taking Samples 4Populations and Sampling 8Summary 10Check Your Work 10
Section B Maybe There is a ConnectionOpinion Poll 12Insect Repellent 16Ape Shapes 17Glasses 18Summary 20Check Your Work 21
Section C Reasoning From SamplesFish Farmer 24Backpack Weight 28Summary 30Check Your Work 30
Section D ExpectationsCarpooling 32Advertising 34Expected Life of a Mayfly 36Free Throws 36Summary 38Check Your Work 38
Section E Combining SituationsFree Meal 40Delayed Luggage 45Summary 48Check Your Work 49
Additional Practice 50
Answers to Check Your Work 55

Teachers Matter
Teachers Matter vT
Dear Student,
Welcome to Great Predictions!
Surveys report that teens preferbrand-name jeans over any otherjeans.
Do you think you can believe all the conclusions that are reported as“survey results”? How can the results be true if they are based onthe responses of just a few people?
In this unit, you will investigate how statistics can help you study,and answer, those questions. As you explore the activities in thisunit, watch for articles in newspapers and magazines about surveys.Bring them to class and discuss how the ideas of this unit help youinterpret the surveys.
When you finish Great Predictions, you will appreciate how peopleuse statistics to interpret surveys and make decisions.
Sincerely,
TThe Mathematics in Context Development Team

1A Great Predictions Teachers Matter
Teachers MatterA
Section Focus
Students investigate chance and expected outcomes in several real worldsituations. They discover that drawing conclusions from samples alwaysinvolves uncertainty. Students consider how samples should be taken to beable to draw reliable conclusions. They study situations in which samplesgive unusual results, and they reflect on whether there is a cause for theseunexpected outcomes or whether they may be due to chance.
Pacing and Planning
Day 1: Chance or Not? Student pages 1–4
INTRODUCTION Problem 1 Discuss how a sample of the total numberof households in a community is surveyedto determine the popularity of televisionprograms.
CLASSWORK Problems 2–4 Determine whether or not the death rateof trees dying in several forests is due tochance or another cause.
HOMEWORK Problem 5 Consider situations where the unexpectedoutcome may be due to chance or tosome other cause.
Day 2: Taking Samples Student pages 4–6
ACTIVITY Activity, page 4 Complete an experiment that involvestaking samples from a population.
CLASSWORK Problem 6 Evaluate how well samples reflect themakeup of a population.
HOMEWORK Problem 7 Consider the reliability of samples andclassify eight given samples according tothe population from which they weremost likely to have come.
Day 3: Taking Samples (Continued) Student pages 7 and 8
INTRODUCTION Problem 8 Analyze results from a survey to determinethe yogurt flavor to order for the wholeschool.
CLASSWORK Problems 9–11 Use the response of a representativesample to determine expected attendance.
HOMEWORK Problem 12 Explain why a survey conducted at aschool is not representative of theschool population.

Teachers Matter Section A: Drawing Conclusions from Samples 1B
Teachers Matter A
Materials
Student Resources
Quantities listed are per student.
• Letter to the Family
• Student Activity Sheet 1
Teachers Resources
No resources required
Student Materials
No resources required
* See Hints and Comments for optional materials.
Learning Lines
Sample and Population
In this section, the terms sample and populationare important concepts. These were introducedand used in the unit Dealing with Data andfurther elaborated and used in the units Insightsinto Data and Second Chance. In this sectionthey are revisited and formalized. Students useresults from samples to make estimates about thepopulation using ratios and percents. Theyinvestigate several real-life situations, such astelevision ratings, surveys for favorite music, andattendance in the House of Representatives.
Students consider how reliable the estimates forthe population are, whether the sampling processwas biased, and if unexpected results may be dueto chance or other factors. Students understandthat sampling needs to be random, representative,and not selective (e.g., only asking friends).A sample also needs to be of sufficient size.
Students also realize that, in real-life situations,other information than the information collectedby sampling may be needed to make a decisionabout a situation.
Sample and Simulation
Students select random samples from a populationof 400 colored and white squares. The squares area model of the real-life situation and studentssimulate taking samples. In the simulationstudents can take as many random samples asthey like and as large a sample as they like.In doing so, students discover that samplingalways involves uncertainty and there is variabilityin the results. By taking several samples or byincreasing the sample size, the chance of gettingunexpected and unusual results gets smaller andthe results will better reflect the population.
At the End of This Section: LearningOutcomes
Students have a better understanding of therelationship between a sample and a population.They can draw conclusions from samples, andthey know that uncertainty or chance is involvedwhen doing this. They are also aware of methodsto reduce this uncertainty. Students know thatsamples must be large enough and randomlyselected to give representative results for thepopulation.
Day 4: Populations and Sampling (Continued) Student pages 9–11
INTRODUCTION Review homework. Review homework from Day 3.
ASSESSMENT Problem 13; Student self-assessment: Make decisionsCheck Your Work based on the analysis of survey results.
ASSESSMENT For Further Reflection Propose a theory about professionalsampling methods.
Additional Resources: Additional Practice, Section A, Student Book page 50

Notes
This page introduces thefirst context, televisionratings, and begins tointroduce the idea of thesection, using samples tomake conclusions.
Some students may havebeen part of a “NielsenFamily” and be able toshare what they had to do.Some families fill out adiary while others have adevice attached to theirtelevision set.
DrawingConclusionsfromSamples
A
Vocabulary Building
The term rating is defined in the text, it is important that students realizethat the rating is expressed in terms of a percent.
English Language Learners
There is a great deal of text on this page; partner reading or reading aloudwith the whole class may be particularly useful for English languagelearners.
Reaching All Learners
1 Great Predictions
How Do Television Networks Rate Their Programs?
People often complain about the number of commercials aired duringtheir favorite television program, but the money brought in by thesecommercials pays the majority of the cost of producing the program.The cost of airing a commercial during a television program largelydepends on the current rating of the program. Popular televisionprograms often charge top dollar for a one-minute commercial spot,while less popular programs charge less money. Therefore, televisionnetworks look closely at each program’s rating on a weekly basis.
The rating for a particular show is the percent of households with TVsthat watch the show. How do the major television networks determinewho is watching what program?
ADrawing Conclusionsfrom Samples
Chance or Not?

Section A: Drawing Conclusions from Samples 1T
Hints and CommentsOverviewStudents read a text about how TV ratings aredetermined by large samples of people who recordthe television programs they watch weekly. There areno problems for students to solve on this page.
About the Mathematics
In this context, the concepts of sampling, population,representativeness, and bias are informally revisited.These topics were formally introduced in the unitInsights into Data.
Planning
You may want to discuss the text in class beforeproceeding to problem 1 on the next page, StudentBook page 2. For more information on TV ratingsand how data are collected, see, for example:http://www.nielsenmedia.com/
You may also have students do this problem first andhave a class discussion following that. When youdiscuss this text and problem 1, you may want to referto the unit Insights into Data to review the conceptsof sampling, representativeness, and bias.
Did You Know?
Student interest in the Nielson ratings is usually quitehigh. Some students in your class might have beenpart of a sample, either keeping a diary or having amonitor attached to their television at home.The ratings are important, not only because theyreflect how many people watch a given program, butalso because they reflect who watches the program.Young people spend more money than older people,so programs that are watched primarily by olderpeople are sometimes dropped, even though there isa large audience, because the audience does notspend enough to make the ads profitable.

Notes1 Students may referback to earlier unitswhere they have learnedabout sampling, represent-ativeness, and bias.
1d Students shouldmention that there willbe some variability inthe estimates due to thesampling process andthat the sample may nothave exactly the samecharacteristics as thewhole population. At thistime, students are notexpected to use the termssampling, population,or bias.
2b Students should realizethat while some differencefrom an average may beexpected, this difference isquite substantial.
DrawingConclusionsfromSamples
A
Accommodation
Encourage students who are struggling to use a ratio table to solveproblem 2a.
Extension
Have students look up the ratings for particular TV shows and thencompare the ratings to the number of families represented in the classwho watched the show.
Reaching All Learners
2 Great Predictions
At one time, independent survey companies asked a large sample ofpeople to complete a diary in which they listed all the programs theywatched each week. For example, in a city with 297,970 householdswith TVs, the survey company might have 463 households keep diaries.
1. a. Why didn’t survey companies give a diary to every household?
b. How do you think survey results could be used to estimate theoverall popularity of television programs?
c. Suppose that 230 of the 463 surveyed households watched theSuper Bowl. How would you estimate the total number ofhouseholds in that city that watched the Super Bowl?
d. How reliable do you think the estimate would be?
A Forest at Risk
Drawing Conclusions from SamplesA
Many insects and diseases are an important part of creating healthyand diverse patterns of vegetation in the forests, even though theysometimes kill or stunt large patches of trees. In addition, trees areoften stressed by weather conditions (too much or too little water, forexample) and die.
In many areas of the Rocky Mountains, the forest rangers foundclusters of trees scattered throughout the forests that were dying.They discovered that the trees were infested by a beetle that burrowsinto the bark.
In a forested area near Snow Creek, anaverage of 12 trees per 10 acres died fromsevere weather conditions over the lastseveral years. But this year from Januaryto August, forest rangers reported about42 dead or dying trees per 10 acres.
2. a. The forest near Snow Creek isabout 5,000 acres. How manytrees would you normally expectto die from storms in the area?
b. Explain whether you think theforesters should be concernedabout the health of the trees.

Section A: Drawing Conclusions from Samples 2T
Hints and CommentsOverviewStudents reflect on the method television networksuse to rate their programs. Next they are introducedto the situation of trees dying in several forests.Students consider whether this may be due to chanceor to another cause.
About the Mathematics
In the case of collecting information to rate televisionprograms, the population at study is very large;therefore, sample(s) need to be taken. If the sample isrepresentative and large enough, the results will bereliable for smaller samples. Large variation in theresults may occur due to chance. Based on the resultsof a sample, estimations can be made for the wholepopulation. Students will do so using ratios orpercents. Students consider causes for unexpectedevents in a sample. If results are unexpected orunusual, this can be due to several reasons: it can be“pure chance,” the sample may not be “good” or betoo small, or there may be other causes. In problem 2,students informally calculate an expected value.This concept will be formalized later in the unit.
Planning
Students may work on problems 1 and 2 individuallyor in small groups. You may want to discuss theirexplanations for 1d and 2b. See also suggestions onthe previous page.
Comments About the Solutions
1. c. Students should understand that the percent inthe sample is only an estimate of the percentfor the population. Students may use severalstrategies to solve this problem. You may wantto discuss these in class, possibly in combinationwith the strategies for this problem.
2. a. Students may use several strategies; even witha ratio table, different operations may be used.You may want to discuss these in class, possiblyin combination with the strategies forproblem 2c.
b. Encourage students to provide sound reasoning.You may want to ask them what assumptionsunderlie their answers.
Solutions and Samples
1. a. Answers will vary. Sample response:
It would be very expensive and time-consumingto have everyone who watches television keepa diary. Many people would refuse to keep adiary or might not keep accurate records.
b. Answers will vary. Sample response:
The popularity of television programs isestimated by calculating the percent of thepeople in the sample who watched a particularshow and then using that to estimate the percentof the whole population that might be watchingthe show.
c. Answers will vary. Accept answers close to150,000. Students may use a variety of strategiesto solve this problem.
Students might reason as follows:230____463 is about 230____
460 which is 1__2 . So about
one-half of 297,970 households in the city,or approximately 149,000 households, werewatching the Super Bowl.
d. Answers will vary. Sample response:
It depends on whether the 463 householdsfairly represent all the people in the city. If thegroup was randomly selected, the estimate isprobably fairly reliable.
2. a. About 6,000 trees. Students might reason asfollows: 12 trees per 10 acres is 1,200 trees per1,000 acres, so 1,200 � 5 � 6,000 trees per5,000 acres.
b. Answers will vary. Sample responses:
• Yes, because in eight months, more thanthree times the normal average of trees died.So the foresters should be concerned andfurther investigate the situation.
• No, because 12 trees per 10 acres is anaverage. The actual number of trees dyingper year can be different. You do not knowhow many years this average represents.So the foresters should not be concerned.

Notes
3a This problem mayprovide a good connectionto the science class asstudents think aboutpossible differences.
3b Encourage students tobe specific in theirdescriptions of whatforesters might do.
DrawingConclusionsfromSamples
A
Extension
Encourage students to check newspapers and magazines for articles about“lucky streaks,” unusually warm weather for a long period of time, or otherunusual occurrences. Discuss whether these are truly unusual and whetherthey might have occurred by chance or could have been caused by someother factor.
Reaching All LearnersAssessment Pyramid
4abcde
Understand that variabilityis inherent in any probabilitysituation.
3 Great Predictions
ADrawing Conclusions from Samples
The mountain pine beetle is the most aggressiveand destructive insect affecting pine trees inwestern North America. Pine beetles are part ofthe natural cycle in forests. Recent evidenceindicates that in certain regions, mountain pinebeetle populations are on the rise.
In the Rocky Mountains, more trees were dying than was normallyexpected.
3. a. Reflect The number of dead or dying trees seemed to bedifferent in certain areas, for example in Snow Creek and theRocky Mountains. What may have caused this difference?
b. What do you think foresters do to support their case thatthe change in the number of damaged and dying trees issomething to watch?
There is a similarity between the two examples presented in questions2 and 3. In each case, an important question is being raised.
When is a difference from an expected outcome a coincidence (or dueto chance), and when could there be another explanation that needsto be investigated?
Keep this question in mind throughout this section as you look atother situations. For the example about Snow Creek, the high numberof death or dying trees seemed to be a coincidence, while thereseemed to be an explanation for the high rate of dying trees in theRocky Mountains.
For each of the following situations, the result may be due to chanceor perhaps there is another explanation. For each situation, give anexplanation other than chance. Then decide which cause you think ismore likely, your explanation or chance.
4. a. A basketball player made eleven free throws in a row.
b. Each of the last seven cars that drove past a school was red.
c. In your town, the sun has not been out for two weeks.
d. On the drive to school one morning, all the traffic lights weregreen.
e. All of the winners of an elementary school raffle werefirst-graders.

Section A: Drawing Conclusions from Samples 3T
Hints and CommentsOverviewStudents continue their investigation of the dyingtrees in several areas, they reflect on the possiblecauses of unexpected outcomes: due to chance or not?
About the Mathematics
The situation described on the previous page and thesituation described here both deal with anunexpected event, a number of dying trees higherthan normal. In the first situation — in Snow Creek— ,this may have been due to chance, and in the secondsituation — the Rocky Mountains—, other factors areseen to contribute to this high number. Investigationsinto possible causes may be needed if other factorsseem to have caused the unusual and unexpectedoutcomes. Problems 2 and 3 deal informally withexpected value, and implicit attention is paid to thefact that a sample does not always reflect thepopulation.
Planning
You may want students to work on problems 3 and 4individually. Have students compare their answers forproblems 2 and 3.
Comments About the Solutions
3. Students can find information regarding thisquestion in the text on Student Book pages2 and 3. They may also look for other informationon this subject on the Internet, for example.
Solutions and Samples
3. a. It is suggested that the larger number of dyingtrees in the Rocky Mountains is caused by thefact that the number of mountain pine beetlesis on the rise. It is not clear whether this is alsothe case in Snow Creek forest. The larger numberof dying trees may be due to chance. It is alsopossible other factors are causing this.
b. Answers may differ. Sample answer:
The foresters should present information onthe numbers of trees dying for several yearsand make clear that the number is now unusuallyhigh. They may use tables or graphs or a map ofthe forest to support this. In addition, they mayresearch the number of mountain pine beetlesin the area to see if the number is rising.
4. Explanations will vary. Sample explanations:
a. The basketball player may have been lucky,but it is more likely that he or she is a very goodshooter.
b. Maybe the cars belong to a club or organization,but it is more likely that it was a coincidence.
c. The overcast skies may be the result of majorclimatic changes, normal weather patterns,or chance.
d. It may be luck that the traffic lights were allgreen, but it is more likely that the lights wereall timed so that someone driving at a constantspeed could make all the green lights withoutstopping.
e. It may be coincidence that all the winners werefirst-graders, or perhaps many more first-gradersentered the school raffle.

Notes
Be sure that studentsunderstand that the entiresquare represents thepopulation and the coloredsquares are randomlycolored to represent thenewspaper subscribers.
Activity
Students could also do thisactivity by dropping a smallopened paper clip. Wherethe open point of the paperclip lands would be wherethey look to keep the tally.
DrawingConclusionsfromSamples
A
Vocabulary Building
Both population and sample are defined on this page. It is important thatstudents understand, and are comfortable using, both of these termscorrectly.
Writing Opportunity
This problem can be used as part of a whole-class activity in which studentswrite, present, and discuss personal experiences with unexpected events.You might have students write their answers in the form of a small storydescribing an unexpected event in their notebooks. Students may readtheir stories in class. After each story, you might lead the whole class in adiscussion of a likely explanation for the unexpected event.
Reaching All Learners
4 Great Predictions
A researcher wants to take a random sample of ten people fromthe population in the town. You are going to simulate taking thesample by using the diagram on Student Activity Sheet 1.
Drawing Conclusions from SamplesA
5. Reflect If something unusual happened in your life, how wouldyou decide whether it was due to chance or something else?Give an example.
Taking SamplesHere are some terms that are helpful when you want to talk aboutchance.
A population is the whole group in which you are interested.
A sample is a part of that population.
In a town of 400 people, 80 subscribeto the local newspaper. This could berepresented in a diagram in which80 out of 400 squares have been filledin randomly. So the red squaresrepresent the subscribers.
Close your eyes and hold your pencil over the diagram onStudent Activity Sheet 1. Let the tip of your pencil land lightlyon the diagram. Open your eyes and note where the tip landed.
Do this experiment a total of 10 times, keeping track of how manytimes you land on a black square. The 10 squares that you land onare a sample.

Section A: Drawing Conclusions from Samples 4T
Hints and CommentsMaterialsStudent Activity Sheet 1 (one per student);graphing calculator, optional (one per student)
Overview
Students perform an experiment in which they takesamples from a population by randomly choosingsquares from a diagram.
About the Mathematics
The relationship between the distribution of apopulation and that of a sample is explored in thisactivity. This issue is also covered in the unit Insightsinto Data. A random sample is one in which everymember of the population has an equal chance ofbeing selected and the selection of one member doesnot affect the selection of another. Students aresupposed to take random samples in the activity.But it will probably be difficult to obtain a trulyrandom sample because students will tend to selectsquares from the middle of the chart.
Planning
Students will do the activity individually. Make surethey record the results. You may want to have studentstake a bigger sample, for example 25 tries.
Extension or Alternative Using Technology
It is possible to use a graphing calculator to simulatethe situation. Students can use a calculator simulationto look at a larger sample. Say, In a calculatorsimulation, you will use dots instead of squares torepresent your population. Working in small groups,use the directions on the activity sheet to create apopulation of 400 dots, 80 of which are marked. Fromthis population, you will take a sample of 25 dots anddisplay it on your calculator.
1. Each student should select a different sample of25 from the population and record the number ofmarked dots in that sample. Note: Each memberof the group selects a different sample of 25 dots,but all members use the same population.
a. How many marked dots would you expect inyour sample of 25? (answer: about 5)
b. Look at the numbers of marked dots in thesamples from your group. Which, if any, of thesamples would you call unexpected? Why doyou think they are unexpected? (sampleanswer: 10, which is 40% or higher, can becalled unexpected)
See more Hints and Comments on page 91.
Solutions and Samples
5. Answers will vary. Sample response:
If something unusual happened to me, I wouldfind out what the chances were for this event torandomly occur. The event might happen due tosomething that was planned. It might be that I gota really good test grade in a subject I find difficult(I could have really studied or just guessed andbeen lucky), or that all of my friends and I worethe same color shirt to school (we all belonged tothe band and it was band day, or it was justcoincidental).

Notes6 This series of questionsallows students to beginthinking informally aboutthe chance, then calculatingthe theoretical probability,and then looking at theexperimental probability.While it is not necessarythat students know theseterms, it may be useful tohave a conversation withthe students about theprogression of thequestions.
DrawingConclusionsfromSamples
A
Accommodation
It may be helpful to prepare a histogram that can be filled in to graphicallyrepresent the chart.
Reaching All Learners
5 Great Predictions
A
6. a. Do you think that, in general, there is a better chance oflanding on a white square or on a black square?
b. What is the chance (probability) of landing on a black square?How did you calculate the chance?
c. Organize the samples from the entire class in a chart like theone shown.
d. Look carefully at the chart below and describe what this tellsyou about the random samples. How well do the samplesreflect the overall population with respect to the subscribersto the newspaper?
Drawing Conclusions from Samples
Number of
Black Squares
in 10 Tries
Number of
Students Who
Get This Number
0
1
2
3
4
5
6
7
8
9
10

Section A: Drawing Conclusions from Samples 5T
Hints and CommentsMaterialstransparency of chart shown on Student Book page 5,optional (one per class);overhead projector, optional (one per class)
Overview
Students investigate how well their samples reflect themakeup of the population.
About the Mathematics
Students were introduced to finding chance as a ratioof the number of favorable outcomes divided by thetotal number of possible outcomes in the unit SecondChance. Students should be able to convert and moveeasily between the different representations ofchance: ratios, fractions, percents, and decimals. Inthe activity, the sample size is small (only 10). Ifsamples from the whole class are collected, thedistribution will become clear.
Planning
Students may work on parts a and b individually.Part c will be a whole class activity. Part d can be doneindividually again. Discuss the answers to part d,in class.
Comments About the Solutions
6. b. Chance can best be found by starting with aratio and converting this into a percent orfraction. Calculating chance is also addressedin the units Take a Chance and Second Chance.
c. Collect the results on the activity from theentire class. This can be done in a chart on theboard or an overhead projector.
d. Students should realize that not all randomsamples are equivalent; a sample can be a goodsample even though it does not have exactlythe same ratio of marked squares as thepopulation. The variation is due to chance.
Solutions and Samples
6. a. Answers will vary. Sample response:
Chances are better that the pencil will fall on awhite square since there are 320 white squaresand only 80 black squares.
b. The chance is one-fifth, or 20%. Strategies willvary. The chance can be found by dividing thenumber of black squares by the total number ofsquares; 80 divided by 400 is 80____
400 , which is 1__5 ,
or 20%. It can also be found by converting80 out of 400 to 20 out of 100, which is 20%.
c. Results will vary. Sample result of 19 students:
d. Answers will vary, depending on the collectedresults. Sample response based on the sampleresults for part c:
Eight people’s pencils landed on a black squarein 2 out of 10 trials. This means the mostcommon result is that 2 out of 10 peoplesubscribed to the newspaper, which is 20%.You could expect an answer like this becauseof the way reasoned for the answer to part b.This was the most likely result for theexperiment. However, five people’s pencilslanded on a black square in 3 out of 10 trials,and others had results that were farther awayfrom two out of 10. All of these were by chance.
Number of Students
Who Get This Number
Number of Black
Squares in 10 Tries0 1 2 3 4 5 6 7 8 9 10
0005 2 1 0 1820

Notes
7 Encourage students todecide which populationeach sample comes fromby estimating the percentof shaded squares, ratherthan by counting.Challenge the students byasking, Could all of thesamples come from thesame population? Theycould, but it is not likelysince some are quitedifferent from others.
DrawingConclusionsfromSamples
A
Intervention
This is the point where it is critical that students understand that samplesusually represent their population accurately, but there is some variation.If students are unclear about this, you could conduct an experimentdrawing different colored chips from a bag. Hopefully, students will beginto see that most samples are similar to the population, but some variationis expected.
Accommodation
You may want to make three “parent populations”, labeled A, B, and C, ontransparencies with 1,000-square grids with 200, 300, and 500 squaresshaded to help students visualize the populations.
Reaching All LearnersAssessment Pyramid
7c
Reason about likely andunlikely samples.Understand the relationshipbetween a sample and apopulation.
6 Great Predictions
Drawing Conclusions from SamplesA
It can be difficult to draw a conclusion about a population from asample. Consider the following problem, in which members of apopulation are represented by squares.
Each of the samples was taken from one of three different populations.Population A has 200 red squares out of 1,000. Population B has 300red squares out of 1,000, and Population C has 500 red squares outof 1,000.
7. a. For each sample, decide whether you think it belongs toPopulation A, Population B, or Population C. Explain whyyou made each decision. What is the size of each sample?
b. Which samples do you find the most difficult to classify? Whyare these difficult?
c. What do you think is the problem with making a conclusionbased on a sample?
i ii iii iv
v vi vii viii

Section A: Drawing Conclusions from Samples 6T
Hints and CommentsMaterialsblank transparencies, optional (three per class);overhead projector, optional (one per class)
Overview
Students consider the reliability of samples andclassify eight given samples according to thepopulation from which they were most likelyto have come.
About the Mathematics
Samples, even if they are representative and largeenough, may not reflect the overall population withrespect to the aspects studied. The eight samples onthis page are taken ‘literally’ from the parentpopulations. There are no unknown factors norredundant information since the situation is justabout red and white squares. This will provide aclearer picture of the relation between samples andpopulations. Still for some samples, it is hard todecide from which population they have been taken.This is due to chance, to variability. There is no othercause in this case!
Planning
Students may work on problem 6 in small groups.Encourage students to discuss this problem. Afterstudents complete it, you may want to briefly discussit as a whole-class activity.
Comments about the Problems
7. Encourage students to decide which populationeach sample comes from by estimating the percentof red squares, rather than by counting. Ask, Couldsamples VI and VIII come from the same population?[Yes, such different samples could come from thesame population.]
Again students should realize that not all randomsamples are equivalent; a sample can be a goodsample even though it does not have exactly thesame ratio of marked squares as the population.The variation is due to chance.
Solutions and Samples
7. a. Answers will vary. Sample response:
i is from population B (with 28 red squaresout of 100);
ii is from population A (with 17 red squaresout of 100);
iii is from population C (with with 47 redsquares out of 100);
iv is from population B (with 33 red squaresout of 100);
v is from population C (with 57 red squaresout of 100);
vi may come from population A orpopulation B (with 24 red squares outof 100);
vii is from population B (with 28 red squaresout of 100);
viii may come from population B orpopulation C (with 38 red squares outof 100).
b. Answers will vary. Sample response:
The most difficult samples to classify are viand viii, because the ratio of red squares to thetotal falls between the ratios for two differentpopulations.
c. Answers will vary. Sample response:
The problem with drawing conclusions basedon samples is that, by chance, a sample maybe very different from the population.

Notes
8a With the number ofstudents who were askedgiven, it should be easy forstudents to find out howmany made each choice.
8b It is important forstudents to realize thatTara’s is not arepresentative sample.
10 Students should thinkabout possible sources ofbias that might occur evenin this situation.
DrawingConclusionsfromSamples
A
Extension
Students could be challenged to come up with a survey for your school andto explain both a sample that would be unlikely to yield useful results and asample that would be more reliable.
Reaching All LearnersAssessment Pyramid
8b
Reason about likely andunlikely samples andfactors that can bias asurvey.
7 Great Predictions
ADrawing Conclusions from Samples
Suppose you are the director of a zoo and youare having students in the area attend thegrand opening of a new primate center.
There are five schools in your area, each with300–500 students, but you know that not everystudent will be able to attend. You randomlychoose 20 students from each school and askwhether they would be interested in attending.Your survey results suggest that 30 studentssay that they will attend, and 70 students saythat they will not attend.
9. a. If 2,000 students live in the area, howmany would you expect to come to thegrand opening?
b. Reflect To plan the grand opening,what else do you need to know?
In the zoo problem, you could not know the percent of students in thepopulation who would attend, so you needed a sample to estimatethe percent.
10. To answer problem 9a, you probably assumed that the sample andthe population had the same percentage of students who wantedto attend the opening. How reasonable is this assumption?
Who Prefers Which Yogurt?Tara is trying to determine whether students at her school prefervanilla, banana, or strawberry yogurt. She asks four friends andrecords their preferences. Based on their preferences Tara decidesthat half the school prefers strawberry, 25% prefer vanilla, and 25%prefer banana.
Carla is interested in the same question. She stands at the door asstudents are leaving school and asks 50 students which flavor theyprefer. She decides that 22% prefer strawberry, 26% prefer vanilla,and 52% prefer banana.
8. a. How did Tara and Carla come up with the percentages?
b. Reflect If you were ordering the yogurt for the school picnic,on whose results would you base your order, Tara’s or Carla’s?Why?
Who’s Going to the Zoo?

Section A: Drawing Conclusions from Samples 7T
Hints and CommentsOverviewStudents decide which sample they will base theirdecisions about the yogurt flavor to order for thewhole school. Next they draw conclusions based onthe response of a representative sample about thenumber of students expected to attend the openingof a new primate center.
About the Mathematics
When conclusions are based on samples, it isimportant to know how the sampling process hasbeen done and whether there are possible causes forbias. Students should further develop and use acritical attitude towards sampling and drawingconclusions. Students were informally introduced tothe concepts of population and sampling in the unitsTake a Chance and Second Chance, this was formalizedand connected to the concept of bias in the unitInsights into Data. Students should be able tocalculate easily with ratios and percents.
Planning
Students may work on problems 8–10 in small groups.You may want to discuss students’ answers toproblem 10 in class.
Comments About the Solutions
8. Make sure students understand that thepercentages in the text are based on theanswers of the students in the samples. Theyshould also understand the need to reasonbackwards from the statements about thepopulation (the whole school) to the samples(of 4 students and of 50 students).
Solutions and Samples
8. a. Answers will vary. Sample response.
Tara asked four friends. If she concludes that50% like strawberry, two of her friends musthave liked strawberry, since 2 out of 4 is 50%.Tara then concluded that 50% of the wholeschool would prefer strawberry. She did thesame for vanilla and banana. Each flavor waspreferred by one of her four friends; 1 out of 4is 25%.
Carla asked 50 students. She concludes 22%prefer strawberry; this would most likely meanthat 22% out of the 50 students he asked(11 students) said they liked strawberry best.The same for the other flavors: 26% of the 50,which is 13 students, preferred vanilla, andthe rest, 26 students (52% out of 50) preferredbanana.
b. Answers will vary. Sample response:
• I would base the school’s order on Carla’sresults because she surveyed a larger sampleof students.
• I would use Carlas’s results because Tara onlyasked her friends and they might not betypical of any of the other students. Carla atleast used a method that might get opinionsfrom all different sets of students.
9. a. Answers will vary. Sample response:
Out of 2,000 students, about 600 are expectedto attend the opening at the zoo. This is 30% of2,000. Since in the sample there are 20 studentsselected from 5 schools, the sample is 100students. Thirty out of 100 say they will attendthe opening, which is 30%.
The actual number of students attending mayvary a bit around 600 because the sample willnot quite approximate the total population.
b. Answers will vary. Sample response:
The zoo director needs to know, for example,what time the students will arrive, how thegroup will be supervised, and whether thestudents plan to eat lunch at the zoo.
Students
Attending
Total Number
of Students
30
100
300
1,000
600
2,000
� 10 � 2
10. Answers will vary. Sample response:
It is risky to assume that calculating the ratio ofthose who will attend from a single sample willgive the same ratio as those from the populationwho will attend. Unusual samples can occur bychance. Other samples may produce slightlydifferent results. On the other hand, the sampleseems to be drawn in a way that gives all studentsa chance to be selected: 20 students are randomlychosen from each of the five schools, and eachschool is about the same size. So it is likely thatthe sample percent is somewhat close to thepopulation percent.
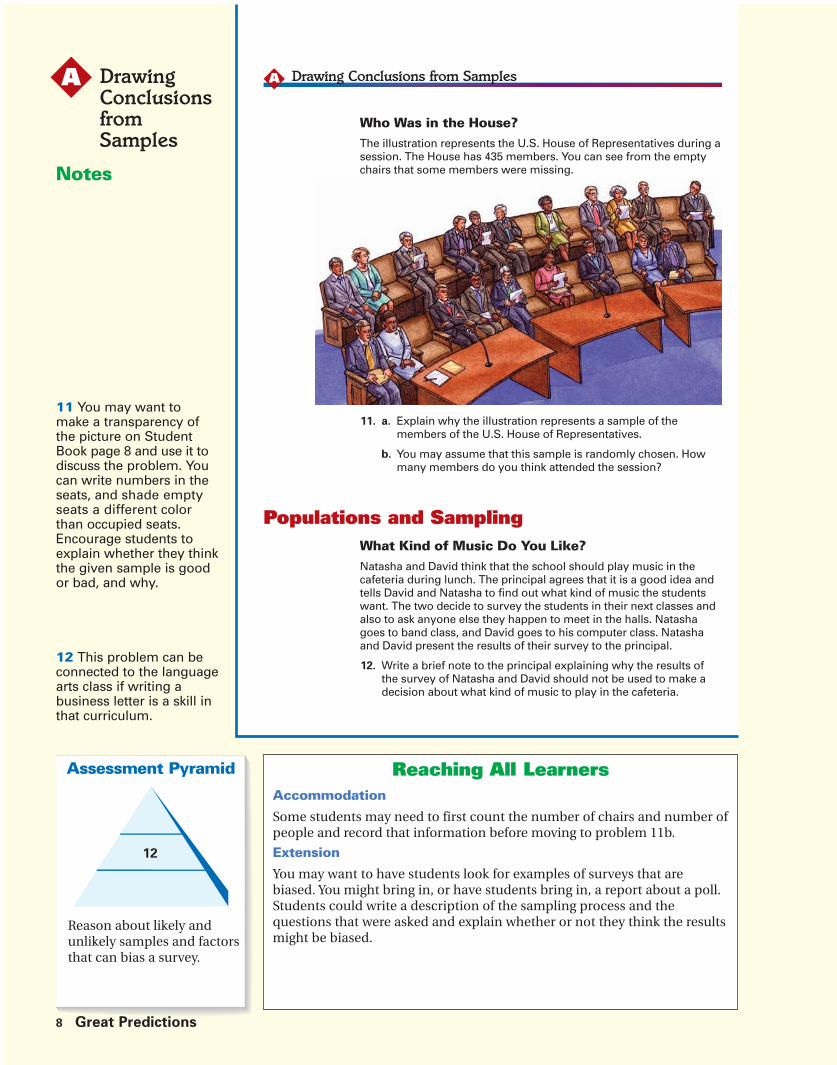
Notes
11 You may want tomake a transparency ofthe picture on StudentBook page 8 and use it todiscuss the problem. Youcan write numbers in theseats, and shade emptyseats a different colorthan occupied seats.Encourage students toexplain whether they thinkthe given sample is goodor bad, and why.
12 This problem can beconnected to the languagearts class if writing abusiness letter is a skill inthat curriculum.
DrawingConclusionsfromSamples
A
Accommodation
Some students may need to first count the number of chairs and number ofpeople and record that information before moving to problem 11b.
Extension
You may want to have students look for examples of surveys that arebiased. You might bring in, or have students bring in, a report about a poll.Students could write a description of the sampling process and thequestions that were asked and explain whether or not they think the resultsmight be biased.
Reaching All LearnersAssessment Pyramid
12
Reason about likely andunlikely samples and factorsthat can bias a survey.
8 Great Predictions
Drawing Conclusions from SamplesA
Populations and Sampling
Who Was in the House?The illustration represents the U.S. House of Representatives during asession. The House has 435 members. You can see from the emptychairs that some members were missing.
11. a. Explain why the illustration represents a sample of themembers of the U.S. House of Representatives.
b. You may assume that this sample is randomly chosen. Howmany members do you think attended the session?
What Kind of Music Do You Like?Natasha and David think that the school should play music in thecafeteria during lunch. The principal agrees that it is a good idea andtells David and Natasha to find out what kind of music the studentswant. The two decide to survey the students in their next classes andalso to ask anyone else they happen to meet in the halls. Natashagoes to band class, and David goes to his computer class. Natashaand David present the results of their survey to the principal.
12. Write a brief note to the principal explaining why the results ofthe survey of Natasha and David should not be used to make adecision about what kind of music to play in the cafeteria.

Section A: Drawing Conclusions from Samples 8T
Hints and CommentsMaterialstransparency of illustration on Student Book page 8,optional (one per class);overhead projector, optional (one per class)
Overview
Students estimate how many representatives in theU.S. House of Representatives attended a session,based on an illustration of part of the House floor.Next students explain why a survey conducted at aschool is not representative of the whole schoolpopulation.
About the Mathematics
Students revisit the concept of the representativenessof samples of the population. In one example, thesample is presented visually, students need to retrievethe numerical information from the illustration. To doso, they need to decide which aspects of theillustration are relevant and how the illustration formsa sample.
Planning
Students may work on problems 11 and 12 in smallgroups.
Comments About the Solutions
12. Encourage students to think about how theprocess used to select the samples could producea biased sample. This kind of a sample is usuallyreferred to as a convenience sample and may givebiased results, representing the views of only onepart of the population.
Solutions and Samples
11. a. Explanations will vary. Sample explanations:
• The illustration represents a sample becausenot all of the seats for the 435 representativesare visible.
• It is a sample of the members of the U.S.House of Representatives because theillustration shows a part of it.
b. Answers will vary. About 290 members probablyattended the session. 300 can also be a goodenough estimate. Sample strategy:Count the members in the illustration (20) andthe empty seats (10), and use the sameproportion for the 435 members of the fullHouse; 20___
30, or 2__3 of 435 is 290 people who
attended.
A ratio table may be used as well; Sample ratiotable:
So an estimate is that 300 members attended.
12. Letters will vary. Students’ letters should includethe argument that it is likely that the sample thatNatasha and David used represents only a smallpart of the school population. Natasha and Davidasked people in only two specialized classes—bandand computer—and the people they “met in thehalls,” probably their friends. This sample maynot represent the views of most students. Also,students in band class may prefer other types ofmusic from students who are not in band class.
Members
Attending
Total Number
of Seats
20
30
200
300
100
150
300
450
� 10 � 2 � 3

Notes
At this point, studentsshould be quite comfortablewith the idea of samplingand be able to evaluateclaims based on a sample.
13a and b It is importantthat students understandthe difference between thepopulation and the samplein this article.
13d Two aspects shouldbe discussed: the fact thatthe people in the study getolder as well as the factthat technologies tend tospread over more groupsover time. This is hintedat in the last paragraph ofthe article.
DrawingConclusionsfromSamples
A
Accommodation
Provide students with a copy of the article so that they can underline orhighlight key information.
Extension
Ask students to locate the reporting of the results of another survey in thenewspaper. They can answer parts a and b in relation to this survey andthen comment on it.
It is possible to look for information on the Internet about the number ofpeople who own technological devices (for different years). For example,information on cellular phone ownership can be easily found.
Reaching All Learners
9 Great Predictions
A
13. a. What population was studied in the article?
b. Describe the sample taken: do you think this is a good sample?Why or why not?
c. Do you think you can believe the claim made in the secondparagraph of the article: “Roughly one in nine Americans 18 orolder has an iPod or an MP3 player.” Explain your reasoning.
d. How do you think the results will be different if this study wereto be repeated 5 years from now?
Drawing Conclusions from Samples
NEWS WATCH: DATA POINT;
For the Music Lover, Gray Hair Is No Barrier to White Earbuds
digital music players. “I would thinkthat we’ll even have acceleratinggrowth over the next year or two.” Hesaid more adults would probably buythe devices “as more players comeinto the market; as the price point rollsdown; as Apple itself rolls out newproducts.”
The survey, drawing on responsesof 2,201 people by telephone, alsorevealed a small gender gap, with moremen (14 percent) owning the devicesthan women (9 percent). “Look at anytechnology deployment over the lastcentury and a half,” Mr. Rainie said.“Men tend to be dominant early on,and women tend to catch up.”
By MARK GLASSMAN
Published: February 17, 2005
Youthful silhouettes rocking outmay be the new fresh faces of portabledigital music, but—shh!—grown-upsare listening, too.
Roughly one in nine Americans 18 orolder has an iPod or an MP3 player,according to survey results released thisweek by the Pew Internet and AmericanLife Project.
Younger adults were the most likelygroup to own the devices. Roughly onein five people 18 to 28 years old saidthey had a music player. About 2 percentof those 69 and over reported owningone.
“It’s obviously just now reaching thetipping point as a technology,” LeeRainie, the project director, said of
Source: New York Times, February 17, 2005

Section A: Drawing Conclusions from Samples 9T
Hints and CommentsOverviewStudents read an article presenting results of a surveyon what people own music players. They explore therepresentativeness of the sample that was taken.
About the Mathematics
Students revisit the issue of bias in sampling. It isimportant they learn to have a critical attitude whenreading articles or watching television programs inwhich results from surveys are presented. Often notenough information is given on the sampling process.This makes it hard (or impossible) to judge the valueof the conclusions. Bias in sampling has been studiedin the unit Insights into Data as well.
Planning
Students may work on problem 13 in small groups.You may want to read the article first as a whole class.
Comments About the Solutions.
13. c. The results presented cannot be used to verifythe claim made that ‘roughly one in nineAmericans owns a music player.’ Only part ofthe overall results are mentioned: for the agegroups 18–28 and 69 and over.
Solutions and Samples
13. a. The population being studied was Americansof 18 years or older. This is mentioned in thesecond paragraph of the article.
b. Answers will vary. They may contain thefollowing elements:
• The responses are from 2,201 people, andthe survey is taken by telephone. See the lastparagraph of the article.
• There is no information given on the actualsampling process.
• It is clear that women as well as men werein the sample and that different age groupswere represented in the sample.
• It is unclear whether the respondents wereselected randomly, in a way that mirrors thepopulation distribution with respect to acertain variable.
• It is also unclear if all persons sampledactually responded. Probably not, since2,201 seems like a strange number to take asa sample size.
c. Answers will vary. Some students may doubtthe claim because they believe that the sampleof 2,201 people is not large enough to representall Americans 18 years or over.
Other students may be more inclined to believethe statement because they may see the sampleas being typical and unbiased because it istaken by an official project.
d. Answers will vary. Some students may thinkthat more people will own a music playerbecause technology spreads over time. Theymay also reason that in 5 years all people thatare now in the study will still own a musicplayer and the group of 18–28 will have newpeople (that are now younger) who will thenown a player as well. Other students may thinkthat in five years there will be different devices,so maybe fewer will own a music player.

Notes
Be sure to read the Summaryas a class. One strategy is tocall on students to identifythe key points in theSummary and then havethem refer back to thecontexts in the section thatillustrate the idea.
DrawingConclusionsfromSamples
A
Parent Involvement
Have students share the Summary with their parents as well as their workon the Check Your Work problems. Parents will be better able to supporttheir students by seeing where the unit begins.
Intervention
If students are struggling with problem 1, have them make a ratio table byfirst asking, If there were 100 students, how many would have one or morepets?
Reaching All LearnersAssessment Pyramid
1
Assesses Section A Goals
10 Great Predictions
Drawing Conclusions from SamplesA
Drawing conclusions from samples always involves uncertainty.
In the case of the television ratings, it would take too much time andcost too much money to find the exact number of people who watcha certain program. Instead, information from a random sample canbe used to deduce information about the whole group. By doing this,you introduce uncertainty.
Information from a sample drawn from a population may or may notbe what you would expect about the population. If a sample seemsunusual, you have to think about whether there could be an explanationor whether the difference is due to chance. In Snow Creek the highernumber of damaged trees seemed to be due to chance, but in theRocky Mountains the unusual high number of damaged trees could beexplained by the increasing numbers of mountain pine beetles.
Sample results can be affected by the way questions are asked andthe way the sample was selected.
When taking a sample, it is important to do so randomly so that everydifferent possible sample of the size you want from the populationhas the same chance of being selected.
Bora Middle School has a total of 250 students. A survey about petswas conducted at the school. Sixty percent of the students have oneor more pets.
1. How many students in Bora Middle School have one or morepets?

Section A: Drawing Conclusions from Samples 10T
Hints and CommentsOverviewStudents read the Summary, which reviews the maintopics covered in this section.
Solutions and Samples
1. 150 students have one or more pets.
One solution is using the 10% strategy.
10% of 250 � 25
60% of 250 is 6 � 25 � 150

Notes
2c Challenge students tothink about many possibleexplanations.
3b Students should realizethat this is more than thetotal for the whole school.
4 This problem summarizesthe main idea of the unit.Have students share theiranswers after they havewritten them so that theyhave an opportunity tohear others’ ideas.
For Further ReflectionThis extends the idea ofsampling from samplingthe whole population tosampling subsets of thepopulation. Be sure thatstudents understand whatis being done before theyspend time thinking.
DrawingConclusionsfromSamples
A
Extension
Ask students to think of another situation when it might make sense todivide the population before taking a random sample.
Advanced Learners
Push students to use the fact that random samples can be different fromthe population to defend the practice of sampling from different agecategories.
Reaching All LearnersAssessment Pyramid
2, 3, 4, FFR
Assesses Section A Goals
11 Great Predictions
Claire asked 20 students in her sixth-grade science class if they haveany pets.
2. a. How many of the 20 students do you expect answered “yes”?Explain.
b. It turned out that 16 out of the 20 students that Claire surveyedhave one or more pets. Does this result surprise you? Why orwhy not?
c. Why do you think so many students in Claire’s science classhave pets?
3. a. If Claire had asked 200 students at Bora Middle School insteadof 20, how many would you expect to have pets?
b. Would you be surprised if Claire told you she found that 160out of the 200 have pets? Explain your answer.
4. Suppose you want to know how many students in your schoolhave pets. You cannot take a survey or ask all students. In whatway would you select a sample to find out how many studentsin your school have pets? Give reasons for your answer.
When sampling is done to rate television programs, the poll takersdo not take a random sample of the entire population. Instead theydivide the population into age groups. What are some of the reasonswhy they might do this?

Section A: Drawing Conclusions from Samples 11T
Hints and CommentsOverviewIn Check Your Work, students assess themselves onthe concepts and skills from this section. Students cancheck their answers on pages 55-56 of the StudentBook. They reflect on the topics addressed in thissection in the problem for Further Reflection.
Planning
After students finish Section A, you may assignappropriate activities from the Additional Practicesection, located on page 50 of the Great PredictionsStudent Book, for homework.
Solutions and Samples
2. a. The expected number of students is 12.One possible explanation: If the sample of20 students is typical for the whole school,then you might expect 60% of 20 students,which is 12, to have one or more pets.
b. Different responses are possible. Sixteen out of20 is not surprising since it seems to be prettyclose to the expected number of 12. The fouradditional students having one or more petsmay be due to chance.
Sixteen out of 20 is surprising since this is 80%of the sample, which seems a lot bigger thanthe 60% that was expected. But you shouldremember that a sample of size 20 is fairlysmall. Just a few people different from whatyou would expect will change the percent quitea lot, so it is really hard to say that it is not justchance.
c. Different responses are possible. Students fromlower grades may be more likely to have pets.Students who take biology classes may be morelikely to have pets. Perhaps Claire asked onlyher friends who like pets.
3. a. The expected number is 120. You can usedifferent strategies, for example, a ratio table.
b. Yes. You might have different explanations.
1st example: I would expect that a large sampleof 200 people would be more typical of thepopulation. The number of students with petsshould be close to the expected number (120).
2nd example: Only 150 students in the schoolhave pets (see problem 1), so even if Claireasked 200 different students in the school, shecould not have found 160 who had pets.
4. Different answers are possible. You may use therolls from each grade level and randomly select anumber of students from each grade. Thisnumber must not be too small. During lunchbreak, you might also ask every fifth student wholeaves the lunch room. You can think of othermethods yourself! Be sure your sample is taken atrandom—that means every student in your schoolmust have the same chance of being in the sample.
10%
20
100%Percentage
200Number of
Students
� 2 � 3
20%
40
60%
120
� 10
� 2 � 3� 10
For Further Reflection
Answer will vary. Sample response.
They divide people in age groups because differentaged people watch and prefer different types ofprograms. By dividing the population in age groupsand taking a sample from each age group, they aresure to get reliable information for all age groups.

12A Great Predictions Teachers Matter
Teachers MatterB
Section Focus
In this section, students evaluate results from surveys, samples, orexperiments to determine whether or not there is a connection betweenapparently unrelated events. For example: Is there a connection betweenwhere people live and how they vote? Does a new brand of insect repellentwork and does it work better in some regions than in others? Does anorangutan in a zoo prefer blocks of a particular shape and color?Students use tree diagrams, two-way tables, and chance trees to decidewhether two events are independent or dependent.
Pacing and Planning
Day 5: Opinion Poll Student pages 12–15
INTRODUCTION Problem 1 Investigate the results of an opinion poll.
CLASSWORK Problems 2–6 Use two-way tables and tree diagrams tocompare opinion poll data from differentparts of town and introduce dependentand independent events.
Day 6: Insect Repellent Student pages 16–18
INTRODUCTION Problem 7 Reason about experimental design.
CLASSWORK Problems 8–12 Study the results of scientific experimentspresented in two-way tables.
HOMEWORK Problems 13 and 14 Reason about the chances of correctlyguessing the type of block Koko, theorangutan, will pick.
Day 7: Glasses Student pages 19–23
INTRODUCTION Review homework. Review homework from Day 6.
CLASSWORK Problems 15–18 Investigate if there is a connectionbetween gender and wearing glassesusing a chance tree and a two-way table.
HOMEWORK Check Your Work Use (contingency) tables to analyze theresults of various experiments andsurveys.

Teachers Matter Section B: Maybe There Is a Connection 12B
Teachers Matter B
Materials
Student ResourcesNo resources required
Teachers ResourcesNo resources required
Student MaterialsNo materials required
* See Hints and Comments for optional materials.
Learning LinesDependent and Independent Events
An opinion poll about building a bridge across ariver introduces the concepts of dependent andindependent events. Students organize the datainto a two-way table and a tree diagram to decidewhether there is a connection between where aperson lives and how a person votes.
Dependent and independent events were infor-mally studied in the unit Second Chance; theseconcepts are revisited and formalized in thissection. Some of the contexts, like wearing glassesfrom the unit Second Chance, are revisited in thissection, and the issue of dependency is formal-ized. Students are made aware of the fact thatalthough using models such as tree diagrams,two-way tables, and chance trees can supportdecisions about whether two events are depend-ent, these models cannot show why a connectionexists or what type of connection exists betweenthe variables studied.
Models
Students use tree diagrams, chance trees, andtables to organize information and make inferencesabout whether events seem to be dependent or not.
These models were used in previous units in theData Analysis and Probability strand. The chancetree that was introduced and used in the unitSecond Chance is now expanded: in addition tochances (now written as percents), the absolutenumbers are now added to the tree.
This information makes it easier to calculateexpected value, which is explored in the nextsection.
At the End of This Section: LearningOutcomes
Students understand the difference between inde-pendent and dependent events. They can organizeinformation in two-way tables, tree diagrams, orchance trees to decide whether events aredependent or independent. Students understandthat if events are dependent, this does not tell whya connection exists. This relationship may be dueto chance or to other unknown factors.
Day 8: Summary
INTRODUCTION Review homework. Review homework from Day 7.
ASSESSMENT Quiz 1 Assesses Section A and B Goals
HOMEWORK For Further Reflection Explain the requirements for two eventsto be independent.
Additional Resources: Additional Practice, Section B, Student Book page 51
Man68%
32%
93%
7%
64%
36%
Woman
Glasses
Glasses
NoGlasses
NoGlasses
130
88
42
39
3
56
32

Notes
This page introduces thenext context. Be sure thatstudents understand thatthe results shown on thenext page are a sample ofthe population. In addition,it is important to note thatthe location of the squaresapproximates the locationof the respondent’s house.
MaybeThere Is aConnection
B
Vocabulary Building
This would be a good opportunity to discuss referenda that have recentlyappeared on local election ballots. Make sure students understand thatballots often include more than electing people to office. A referendum willoften “put before the voters” issues that would result in an increase in taxes,such as building a new school, maintaining roads, highways, parks,and so on.
Reaching All Learners
12 Great Predictions
Next month, the citizens of Milo will vote on the following referendum.
Question: Should the city of Milo construct a second bridgebetween the east and west districts?
The local newspaper organized an opinion poll using a sample ofthe city’s residents. The diagram on the next page shows the results.Each square represents a person who took part in the poll and showsapproximately where he or she lives. A white square means that theperson plans to vote “no,” and a green square indicates that theperson plans to vote “yes.”
BMaybe There Is aConnection
Opinion Poll

Section B: Maybe There Is a Connection 12T
Hints and CommentsOverviewStudents are introduced to an opinion poll held in thetown of Milo on the construction of a bridge. Thereare no problems on this page for students to solve.
About the Mathematics
In a survey, there may be a connection between twoor more of the variables in the study. The same canhappen in other situations were events are related.This section focuses on the concept of dependent andindependent events. Students learn to evaluate resultsor outcomes to determine whether events that seemapparently unrelated are nonetheless dependentor not.
Planning
You may want to read the text on this page as awhole-class activity

Notes
1a Students are likely toestimate by eye, but warnthem to be careful.Because the shadedsquares are darker, theymay tend to overshadowthe white squares.
2a Point out to studentsthat the totals are given inthe table, so they shouldbe able to check theircounts by comparing tothe total.
2c It is important thatstudents use goodreasoning to support theiranswers. They should referto the chart in support oftheir answers.
MaybeThere Is aConnection
B
Accommodation
Provide an enlarged copy of the diagram that students can mark on whilethey are making their counts. A copy of the table may be helpful as well.
Extension
Students could be asked to find the percent of yes and no votes for eachgroup as well as the overall percentages.
Reaching All Learners
13 Great Predictions
Assessment Pyramid
Use two-way tables to findprobability.
2b
1. a. Do you think a majority of the citizens will vote for a new bridge?Make an estimate from the diagram to support your answer.
b. Based on the sample, what is the chance that someone wholives in the west district will vote “yes”?
You might wonder whether there is a connection between wherepeople live and how they plan to vote.
2. a. Count the actual responses to the bridge poll as shown in thediagram. Use a two-way table like the one shown to organizeyour numbers.
b. Which group of people, those in the east district or those in thewest district, seem to be more in favor of the bridge?
c. Do you think that there is a connection in the town of Milobetween where people live and how they plan to vote?Explain your reasoning.
BMaybe There is a Connection
Bridge
River
West District:200 Citizens Polled
East District:100 Citizens Polled
No
Total
Yes
200 100 300
West East Total

Section B: Maybe There Is a Connection 13T
Hints and CommentsOverviewStudents investigate the results of an opinion poll inthe town of Milo. The votes are represented by greenand white squares on a diagram of the two districts ofthe town that were polled. They draw conclusions asto whether or not where people live is related to howthey intend to vote. Students use two-way tables toorganize information from the poll.
About the Mathematics
Information can be represented visually. Sometimesa visual model will represent the “story” of the datamore clearly. In this case, the picture of the dataconveys two variables: where a person lives and howthe person votes. The ratio of the number of greensquares (or the number of white squares) to the totalis an estimate of the chance that the event connectedwith that type of square will occur. This way of findingprobabilities is introduced in the unit Take a Chanceand further formalized in the unit Second Chance.Students have also used this method earlier in thisunit. Two-way tables are then used to organize theinformation on the two combined events; this makesit easier to calculate different ratios and chances.The concept of dependent and independent eventsand the way these influence chance was informallyintroduced in the unit Second Chance and is revisitedand formalized in this section.
Planning
Students may work on problems 1 and 2 individuallyor in pairs. Discuss their answers as a whole class.
Comments About the Solutions
1. b. Here students must count the green and whitesquares to find the probability of a yes vote forsomeone in the west district. You mightencourage them to share the counting, withone partner counting the total squares and theother counting the green squares. You maywant to ask students whether, based on theanswer for 1b, they think they should changetheir answers to 1a.
2. If students answered no, leave this until problemnumber 4, where this question is addressed again.You may want to discuss the difference betweencomparing absolute numbers and comparingratios (relative comparison). This was introducedin the unit Ratios and Rates and used in the unitSecond Chance.
Solutions and Samples
1. a. Answers will vary. The actual numbers are 135yes to 165 no votes, so you might estimate thatthe majority will vote no.
b. 38.5%. There are a total of 200 squares on thewest side, of which 77 are green. That meansthat of the sample of 200 people, 77 plan tovote yes. The chance a person on the west sidewould vote yes would be around 77____
200 , or 38.5%.
2. a.
b. Answers will vary. Sample response:
People in the east district seem to want thebridge more because 58 out of 100 people(more than half) voted in favor of the bridge.In the west district, only 77 out of 200 people(less than half) voted for the bridge.
c. Yes. A larger number of people on the west sidewant the bridge, but a larger percentage ofthose on the east side do. You can see that morethan half of the people on the east side (58 outof 100) say they will vote yes, and fewer thanhalf of the people on the west side (77 out of200) will vote yes. Students may also calculatethe percents.
No
Total
Yes
West East Total
77
123
200
58
42
100
135
165
300

Notes
3 To solve this problem,students will need theiranswers from problem 2.
3b Be sure studentsunderstand that each ofthe boxes should contain anumber: how many peoplefit that category.
MaybeThere Is aConnection
B
Accommodation
Blank copies of the tree for students to fill in may be useful.
Intervention
If students are having difficulty understanding the tree, choose a singlesquare from the original diagram and help the students trace through thetree to see where that person would be counted.
Reaching All Learners
14 Great Predictions
You can separate the 300 members of the sample into two groups:those who live in the west district and those who live in the eastdistrict. You can subdivide each of the two groups into two moregroups: those who plan to vote “yes” and those who plan to vote“no,” for a total of four groups. You can describe this situationusing a tree diagram.
Because it is not possible to draw a branch for each person in thesample, branches are combined in such a way that you have twobranches, one for the people living in the west district and one forthe people in the east.
3. a. What number of people does the branch for people living inthe west district represent?
b. Redraw the tree-diagram, filling in each of the boxes with theappropriate number from problem 2.
c. Reflect Which method—a two-way table or a tree diagram—seems more helpful to you for finding out whether there is aconnection between where people live and how they will vote?Give a reason for your choice.
Maybe There is a ConnectionB
Yes
No
West
Population Place person lives
Vote
Vote
East
Yes
No

Section B: Maybe There Is a Connection 14T
Hints and CommentsOverviewStudents use tree diagrams to represent the results ofthe opinion poll in Milo. They compare the two waysof describing the situation (two-way table and treediagram).
About the Mathematics
This is a special version of a tree diagram. The use oftree diagrams to represent uncertainty is introducedand used in the units Take a Chance and SecondChance. On this page, the tree diagram is not yet achance tree since only the absolute numbers areshown in the boxes. Chance trees were introduced inthe unit Second Chance. In a chance tree, severalbranches may be combined into one, and chances arewritten with the branches; the tree diagram presentedhere shows the actual numbers and how these aredivided over the several outcomes. Based on thesenumbers, chances can be calculated on each of theoutcomes.
Note that the layout of this tree diagram is differentfrom the layout of chance trees. The “titles” are now inthe tree between the branches, whereas in chancetrees, “the titles” are above the tree.
Planning
Students may work on problem 3 individually. Discussthe reasons they give in problem 3c.
Solutions and Samples
3. a. The branch or arrow represents 200 people.
b.
c. Answers will vary. For some students, the treediagram may make the differences clearer,while other students may prefer the two-waytable. The reasons students give will vary andcan be very personal, for example:
• I find a table easier to read than a treediagram.
• I find a table easier to draw than a treediagram.
• A tree diagram more clearly shows thestructure of the situation.
• I find it easier to calculate ratios from atwo-way table.
Yes
No
West
Population Place person lives
Vote
Vote
East
Yes
No
200
100
42
58
123
77

Notes
4 Students need to realizethat, in this case, thenumbers are differentenough that there appearsto be a connection. Somemay note that it is possiblethat one of the sampleswas poor, but we need toassume that these arerepresentative samples.
5 It is important thatstudents are able not onlyto decide whether eventsare related but also toexplain the connection, orsuggest possibleconnections.
6a Some students mayneed to be reminded thatthe number polled on theeast side is half thenumber polled on thewest.
MaybeThere Is aConnection
B
Vocabulary Building
Independent and dependent events are defined on this page. Independentevents are two events that are unrelated, dependent events are events thatare related.
Advanced Learners
Ask students to expand their answers to problem 6b to include a treediagram for independent events and explain how it is clear that they areindependent.
Intervention
If students have difficulty answering problem 6b, you might refer them totheir answers to problems 3 and 6a.
Reaching All Learners
15 Great Predictions
Assessment Pyramid
6b
Determine whether eventsare dependent orindependent and find theprobabilities.
There are two possibilities for voting on the Milo bridge.
i. There is no connection between where people live and howthey will vote. In other words, the two factors, or “events,” areindependent. Another way to think about this is that the chanceof a “yes” vote is the same for all citizens, no matter on whichside of the river they live.
ii. There is a connection. The two events are dependent. In thiscase, how a person votes is affected by where the person lives.
4. For voting on the Milo bridge, which possibility seems more likelyto you, possibility i or ii? Give a reason for your choice.
If the events are dependent, sometimes you can explain the connectionby looking carefully at the situation.
5. Reflect What are some reasons that people on different sides ofthe river might vote differently on the Milo bridge?
Now let’s suppose there is no connection between where people liveand how they will vote. In other words, those events are independent.In the first column of the two-way table below, you can see howpeople in the west district voted.
6. a. Assuming that the events “where a person lives” and “howthat person votes” are independent, how many people fromthe east district have voted “yes” and how many have voted“no”? Copy and complete the table. Explain how you got youranswer.
b. Reflect In general, how can you use the numbers in a tableor diagram to decide whether two events are dependent orindependent? Hint: Use the word ratio or percent in youranswer.
BMaybe There is a Connection
No
Total
Yes
200 100 300
80
120
West East Total

Section B: Maybe There Is a Connection 15T
Hints and CommentsOverviewStudents decide whether the events “where a personlives” and “how a person votes” are dependent.They think about reasons for a possible connection.They show what the outcomes could be for a situationwhere the events are not related in a two-way table.
About the Mathematics
The distinction between independent and dependentevents is formally made here. Equal ratios (probabilities)imply that there is no connection and the two eventsare independent. Unequal ratios (probabilities) implythat there is a connection and the two events aredependent. If events are dependent, it is important tobe able to find reasons for the connection.
Analyzing data may give reason to suppose aconnection exists, but it cannot explain what causesthe connection.
Planning
Students may work on problems 4–6 individually orin pairs. You may want to discuss students’ answersin class.
Comments About the Solutions
4. Have students look back to their answer toproblem 2c.
6. a. You may want to emphasize that this is aproblem in which there is no connection.If there is no connection, it is reasonable toassume that the ratios would be about thesame for both districts. It is important thatall students realize this. Of course, the actualnumbers will differ because of the differentsizes of the populations.
Solutions and Samples
4. Option II: It is more likely that there is a connection.Explanations will vary. For an explanation, seealso the answer to problem 2c. If the ratios orpercents are quite different, it seems reasonableto investigate the possibility of a connection.
5. Answers will vary. Sample responses:
People in the west district might vote differentlyfrom people in the east district if the places wheremost people work are in the west district; westdistrict people live there and do not have to driveacross the river. An airport and a train or busstation might all be located in one district. A largeshopping mall might be located in one district.One district might be closer to a major highway
6. a. If the events were independent, 60 people ofthe east district should have voted yes and 40should have voted No.
Explanations will vary. Sample explanation:
In the west district, 120 out of 200 people votedyes, which is 60% voting yes and 40% voting no.If there is no relation, the ratios for yes and novotes must be the same in the east district.
b. Explanations will vary. Sample explanation:
In general, if the chance something may happencan be described for two samples by ratios orpercents that are close to each other, therewould seem to be no connection between theevents. If the ratios or percents are quitedifferent, it seems reasonable to investigate thepossibility of a connection.
No
Total
Yes
West East Total
120
80
200
60
40
100
180
120
300

Notes
7 Experiments aredesigned with a controlgroup to prevent people’sbeliefs and expectationsfrom influencing the results.A control group is a set ofpeople who receive notreatment.
8 Interpreting numbersin two-way tables can bedifficult. This problem isintended to help studentsread the tables and extractand calculate with theimportant factors.
After problem 8, it may behelpful to have aconversation about whatthey notice about each ofthe four regions beforeproceeding with problem 9.
MaybeThere Is aConnection
B
Intervention
Some students may need to be reminded that “chance” has a precisemathematical definition. The chance is the number of favorable outcomesdivided by the number of possible outcomes.
If students have difficulty with problem 8, they can repeat the questionswith the other regions. This would also provide students with someinformation that might make problem 9 more accessible.
Act It Out
Students could use four colored chips to show the four groups for aparticular region. If each region were set up students would have a visualway to make a comparison in addition to the numerical.
Reaching All Learners
16 Great Predictions
8. a. How many people were used for the sample from Region I?
b. In Region I, explain what the numbers 120, 41, and 79 represent.
c. What is the chance that a randomly selected person from thesample in Region 1 was bitten?
d. Would you change your answer to c, if you were told the personhad used repellent?
9. If you knew people living in each of the four parts of the country,who would you encourage to use the repellent and who wouldyou discourage? Explain your advice; use chance in yourexplanation.
A new insect repellent was tested to see whether it preventsmosquito bites. It was not feasible to test the repellent on theentire U.S. population, so the researchers used a sample.
Because mosquitoes may be different in different parts ofthe country, the researchers ran the test in four differentgeographical regions. A sample of people was selected fromeach region and divided into two groups. Each person receiveda bottle of lotion. For one group, the lotion contained the newrepellent, and for the other group, the lotion had no repellent.The people in each group did not know whether or not theyreceived the repellent.
7. Why do you think the test was designed in such acomplicated way?
Maybe There is a ConnectionB
Insect Repellent
The researchers ran the insect repellent test in four parts of thecountry and summarized the results.
Region I
41
79
120
94
106
200
53
80
27
70
40
110
58
90
32
B
NB
Totals
Region III
100
30
130
149
51
200
128
72
200
111
89
200
49
70
21
50
60
110
61
90
29
KEY:
R � RepellentNR � No RepellentB � BittenNB � Not Bitten
R NR Totals
B
NB
Totals
R NR
B
NB
Totals
R NR
B
NB
Totals
R NR Totals
Totals
Totals
Region IV
Region II

Section B: Maybe There Is a Connection 16T
Hints and CommentsOverviewStudents study the results of a scientific experimentpresented in four two-way tables.
About the Mathematics
Here, the context is changed from using a sample in asurvey to using a sample in a scientific experiment.This type of experiment uses two groups, a controlgroup and an experimental group. The data arepresented in two-way tables. Students must interpretthese data and draw conclusions. How chance can befound from information in two-way tables wasintroduced and used in the unit Second Chance.Students use this knowledge here. In these problems,students apply what they learned so far to a morecomplex situation.
Planning
Students may work on problems 7–9 in small groups.Be sure to discuss students’ answers to problems7 and 9.
Comments About the Solutions
9. Students must compare and interpret the datafrom the tables. If they have difficulty, you mightdiscuss one of the regions in class. It is not necessaryto calculate a percent for every cell in the tables.You can have students compare the tables moregenerally and at a glance. For example, studentsmight make statements like the following: InRegion I, about 1__
3 of the people who used repellentwere bitten, whereas more than 1__
2 of the peoplewho didn’t use repellent were bitten. So usingrepellent seems to be effective in Region I.
For example, in Region II, more than half of thepeople were bitten whether they used repellent ornot. In Region IV, about half of those who usedrepellent were not bitten, whereas 1__
3 who did notuse repellent were not bitten.
Solutions and Samples
7. Answers will vary. Sample response:
The test was designed in such a complicated wayso that it would be easy to determine whether therepellent really works. The group whose lotioncontains repellent (the experimental group) canbe compared to the group whose lotion does notcontain repellent (the control group). It isimportant for people not to know which groupthey are in so that the results are unbiased.Sometimes people get better just because theythink the medicine is supposed to make thembetter.
8. a. 200 people
b. 41 people received repellent and were bittenanyway, 79 people received repellent and werenot bitten, and a total of 120 people were giventhe repellent.
c. 94 out of the 200 persons in Region I werebitten. The chance is 94____
200 , or 47%.
d. Yes, the chance would change because now youonly take into account the persons usingrepellent. So the chance a randomly selectedperson from Region I who uses repellent wasbitten is 41____
120 , or about 34%.
9. Explanations will vary. Sample explanation:
The repellent seemed to have the best effect inRegion I. Fifty-three out of 80 people (about66%) who did not use the repellent were bitten.However, only 41 out of 120 people (about 34%)who used the repellent were bitten.
The repellent also seemed to be effective inRegion IV. So, one recommendation might beto use the repellent in Regions I and IV and toavoid using it in the other regions.
Region I: With repellent, about 34% were bitten;without repellent, about 66% were bitten.
Region II: With repellent, about 64% were bitten;without repellent, about 64% were bitten.
Region III: With repellent, about 77% were bitten;without repellent, about 70% were bitten.
Region IV: With repellent, about 45% were bitten;without repellent, about 68% were bitten.

Notes
10 Students must realizethat the chances can befound using ratios. Sinceprobability is usuallyexpressed using percentsor decimals, the ratiosmust be converted.
11 Students need toorganize the data in a two-way (cross) table. It maybe helpful for students tobegin by making talliesand then fill in the totals.Be sure to check students’counts before they moveon since they need to havean accurate table for thenext problems.
B
Accommodation
It may be helpful to provide a tally chart for students to use in analyzing the40 blocks.
Reaching All Learners
17 Great Predictions
MaybeThere Is aConnection
BMaybe There is a Connection
Ape Shapes
Koko is an orangutan at the zoo. She is allowed to play with blocksthat come in three shapes—cylinders, cubes, and pyramids. Theyalso come in two colors—blue and orange. Here are 40 blocks thatKoko took out of a bucket full of blocks.
10. a. If Koko randomly chooses one of her 40 blocks, what is thechance that it will be a cube?
b. What is the chance that the block Koko chooses will be blue?
The zookeepers wonder whether there is a connection between theshape of a block and its color for the blocks Koko chose. In otherwords, does Koko like blue cubes better than orange ones? Orangecylinders better than blue ones? And so on.
The first step in answering this question is to organize the data.
Total
Blue
Orange
Total 11. a. Copy the two-way table and record theinformation about the 40 blocks Kokohas chosen.
b. Is there a connection between blockshape and color? How did you decide?

Section B: Maybe There Is a Connection 17T
Hints and CommentsOverviewStudents investigate whether a connection existsbetween the color and the shape of the blocksselected by Koko, an orangutan at a zoo.
About the Mathematics
Students investigate again whether events are related.The information is presented visually. Students use atwo-way table with three columns and two rows toorganize and categorize the information. It may beeasier to tally the information first. The situation israther “abstract,” which also implies there are noother factors in the situation to consider than thecolor and the shape of the blocks.
Planning
Students may work on problems 10 and 11 in pairs.
Comments About the Solutions
11. Students will need an accurate table to solveproblems 12–14 on the next page.
Solutions and Samples
10. a. 16 out of 40 (or 40%)
b. 20 out of 40 (or 50%)
11. a.
b. Answers will vary. Sample response:
For cubes and cylinders, there seems to be arelation, for pyramids not. Koko seems to likeorange cubes better than blue cubes ( 12___
16 � 75%of the cubes are orange), and she prefers bluecylinders ( 12___
15 � 80% are blue). She does nothave a marked preference between the pyramids( 5__
9 � 55% are orange).
Total
Blue
Orange
Total
4
12
16
4
5
9
12
3
15
20
20
40

Notes
13 This problem informallyintroduces students to theconcept of conditionalprobability. Be surestudents recognize thatthe denominator here isnot all of the blocks, butonly the cubes. Studentsshould contrast thisproblem with problem 12.
14 In this problem,students are asked toanalyze the entire situationto consider all of thecombined probabilities.
MaybeThere Is aConnection
B
Intervention
Students who are struggling with problem 14 could be asked to repeatproblems 12 and 13 using different colors and shapes. This may help themin solidifying their understanding of the dependent nature of somesituations and the independent nature of others.
Advanced Learners
Students could be challenged to come up with other sets of 40 blocks thatshow different dependencies, for example, a set where there is a connectionbetween blue and sphere but no others.
Reaching All LearnersAssessment Pyramid
14
12, 13
Use different representationsto describe probability.Make decisions usingprobability and expectedvalues.
Maybe There is a ConnectionB
In this two-way table, you see data on peoplewearing glasses. The data are from a sampleof 130 people.
Glasses
Total
Glasses
No Glasses
88 42 130
56 39 95
32 3 35
Men Women Total
During the game, one of the zoo visitors says that the shape Kokochose is a cube.
Again, the zookeeper guesses orange.
13. What is the chance that she is right this time?
The information that the shape is a cube changes the situationbecause now there are fewer possible blocks; in other words, itchanges the chance that the block is orange.
14. What shape can Koko choose that will give the zookeeper theleast help in guessing the color? Explain.
Koko and the zookeeper play a game with somezoo visitors. Koko picks up one of her 40 blocksand shows it to the visitors. The zookeeper, whois blindfolded, guesses the color.
The zookeeper guesses orange.
12. What is the chance that she is right?
18 Great Predictions

Section B: Maybe There Is a Connection 18T
Hints and CommentsOverviewStudents continue to investigate the situation of Kokoselecting blocks. They reason about the chances ofguessing correctly what type of block Koko picked.Next, students are introduced to the context of arelation between genders and the wearing of glasses.
About the Mathematics
Students informally reason about conditionalprobability. They have done so before in the unitSecond Chance. Depending on the informationstudents have, they will determine the probabilityof certain outcomes differently. If, for example, theyknow one of the characteristics of the blocks, they canuse the information in the two-way table to find thechance it also has one of the other characteristics.For example, if they know a block is orange, it is morelikely that this block is a cube than one of the othershapes. If no information was presented on the color,the chance a randomly chosen block is a cube isabout the same as the chance it is a cylinder.
Planning
Students can work on problems 12–14 individually orin pairs.
Comments About the Solutions
14. Students must now reason the other way around.It is important that they can translate thesituation as meaning that they need to find theshape for which the chance on each color is aboutequally likely. They need to reason from chanceback to the data in the two-way table. This is acrucial problem to check whether studentsunderstand how conditional probability works.
Extension
You may want to have students draw a tree diagramfor the situation on page 17 of the Student Book.There is no fixed order for the branches in the tree;either shape or color can go first. Note that the treemust have three branches for shape.
Solutions and Samples
12. The chance is 20___40 � 1__2 , or 50%, because half of all
the blocks are orange.
13. The chance is 12___16 � 3__
4 , or 75%, because 12 of the16 cubes are orange.
14. Giving the clue “pyramid” will provide the leasthelp because there are about as many blue asorange pyramids Koko has chosen.

Notes
Before students begin thispage, be sure they under-stand the two-way tableon the previous page. Youcould ask students whatthey notice about thenumbers in the table beforethey begin problem 15.
17 Students shouldnotice that the chancesin percents for every pairof lines in the tree addup to 100% (or to 1).
18 This problem is the keyto the section. Studentsneed to realize that if thechance is the same forglasses no matter thegender, then wearingglasses is independent.If, as in this case, thechances differ, the situationis dependent.
MaybeThere Is aConnection
B
Intervention
Students who are struggling to understand what an independent tree wouldlook like could be asked to create a two-way table where the situations areindependent and then use that to make a chance tree.
Advanced Learners
Students could be asked to think of a situation in the school that they arenot sure is independent or dependent. They could take a survey and createa chance tree to decide.
Reaching All LearnersAssessment Pyramid
18ab
17c
Determine whetherevents are dependent orindependent. Use chancetrees to find probability.
19 Great Predictions
BMaybe There is a Connection
A person from this sample is chosen at random.
15. a. What is the chance that the person wears glasses?
b. If you were told that the person is a woman, would you changeyour answer for part a? How?
The data from the table can be used to make a tree diagram.
16. Copy and complete the tree diagram by filling in the correctnumbers in the boxes.
Man68%
Woman
Glasses
Glasses
NoGlasses
NoGlasses
130
You can make the tree diagram into a chance tree by listing the chance,or probability, for each event. The chances are written next to thearrows. For example, the chance that a person from the sample is aman is 68%.
17. a. Explain how the 68% was calculated from the data in the table.
b. Fill in the chance for each event in your tree diagram.
c. Use the tree diagram to find the chance a randomly selectedperson from this sample is a man wearing glasses.
18. a. Reflect Explain how you can use the chance tree to concludethat wearing glasses is dependent on whether the person is aman or a woman.
b. What would your chance tree look like if wearing glasses wasindependent of being a man or a woman?

Section B: Maybe There Is a Connection 19T
Hints and CommentsOverviewStudents investigate if there is a connection betweengender and wearing glasses. They use a chance treeand a two-way table to do so.
About the Mathematics
Students revisit a context they have seen in the unitSecond Chance. This problem context deals withconditional probability, which occurs when twoevents are dependent. For this particular context,students will discover that “being male” and “wearingglasses” are dependent. In such a case, the probabilityof a person’s wearing glasses changes according to thegender of the person. Students do not need to knowthe term conditional probability, or any formal rules.They must realize the difference between finding thechance of a combined event “men wearing glasses”and finding a conditional probability: given that aperson is a man, what the chance he is wearingglasses is. They find chances by using two-way tables,tree diagrams, and chance trees and by reasoning.The tree diagrams that were used to organize data arenow transformed into chance trees, as was done inthe unit Second Chance. Chances are written next tothe arrows that represent the events, now usingpercents instead of fractions.
Planning
Students may work on problems 15–18 individually orin pairs.
Comments About the Solutions
17. c. This is not an example of conditional probability,it is a combined event. Students have todetermine the chance that someone from thesample (of all the 130 people) is in the category“men wearing glasses” (top-left cell of table).
Solutions and Samples
15. a. The chance that the person wears glasses is35____130 � 0.27, or about 27%.
b. Yes. If the person is a woman, the chance shewears glasses is 3___
42 � 0.071, which is about 7%.
16.
17. a. 68% was calculated by dividing 88 by 130.
b.
c. This chance is 32 out of 130, which is about 25%.
18. a. Answers will vary, Sample answer.
You can use a chance tree and compare thechances for wearing glasses along the branchesfor men and for women. For women, the chanceis 7%, and for men, this is 36%. This is verydifferent, so it would seem that a connectionexists and that the “events” might be dependent.
b. The tree would have the same percentagesof glasses and no glasses for both men andwomen. For example, the percentage of thewomen who wear glasses would be the sameas the percentage of men who wear glasses,so they both would be 36%.
Man68%
Woman
Glasses
Glasses
NoGlasses
NoGlasses
130
88
42
39
3
56
32
Man68%
32%
93%
7%
64%
36%
Woman
Glasses
Glasses
NoGlasses
NoGlasses
130
88
42
39
3
56
32
Man68%
32%
64%
36%
64%
36%
Woman
Glasses
Glasses
NoGlasses
NoGlasses
130
88
42
27
15
56
32

Notes
This page summarizes thesection. At this point,students should be clearabout the connectionbetween the two-way tableand the tree as well asunderstanding how todetermine if the events aredependent or independent.
MaybeThere Is aConnection
B
Parent Involvement
Have students share the summary with their parents. They should showtheir parents where the numbers in the two-way table would be filled-inon the chance tree.
Reaching All Learners
20 Great Predictions
You can use each of these tools to decide whether members ofparticular groups are more likely to have a certain property.
While tools like this can help you decide if two events are possiblydependent, they cannot help you find out why a connection exists.
Maybe There is a Connection
In this section, you studied methods to investigate whether two eventsare dependent or independent. Two-way tables, tree diagrams, andchance trees are three tools to help you make such decisions.
B
Man68%
Woman
Glasses
Glasses
NoGlasses
NoGlasses
130
Total
Glasses
No Glasses
88 42 130
56 39 95
32 3 35
Men Women Total

Section B: Maybe There Is a Connection 20T
Hints and CommentsOverviewStudents read the Summary, which reviews the maintopics covered in this section.
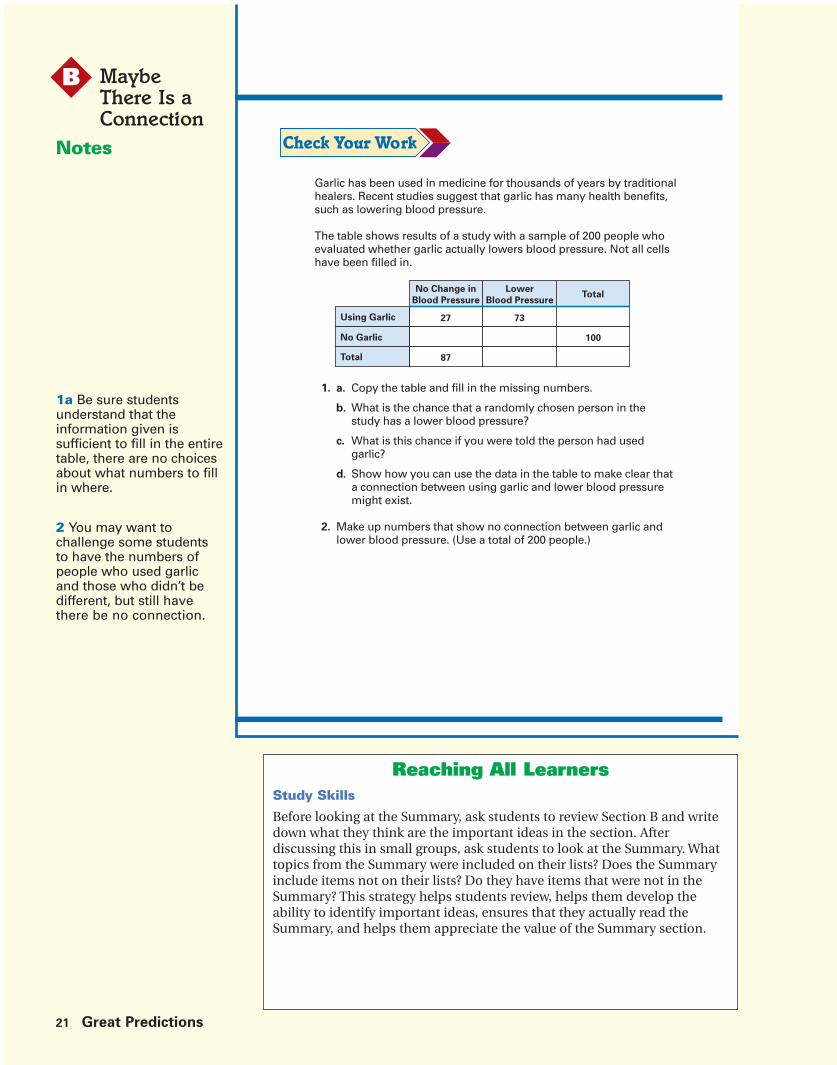
Notes
1a Be sure studentsunderstand that theinformation given issufficient to fill in the entiretable, there are no choicesabout what numbers to fillin where.
2 You may want tochallenge some studentsto have the numbers ofpeople who used garlicand those who didn’t bedifferent, but still havethere be no connection.
MaybeThere Is aConnection
B
Study Skills
Before looking at the Summary, ask students to review Section B and writedown what they think are the important ideas in the section. Afterdiscussing this in small groups, ask students to look at the Summary. Whattopics from the Summary were included on their lists? Does the Summaryinclude items not on their lists? Do they have items that were not in theSummary? This strategy helps students review, helps them develop theability to identify important ideas, ensures that they actually read theSummary, and helps them appreciate the value of the Summary section.
Reaching All Learners
21 Great Predictions
Garlic has been used in medicine for thousands of years by traditionalhealers. Recent studies suggest that garlic has many health benefits,such as lowering blood pressure.
The table shows results of a study with a sample of 200 people whoevaluated whether garlic actually lowers blood pressure. Not all cellshave been filled in.
1. a. Copy the table and fill in the missing numbers.
b. What is the chance that a randomly chosen person in thestudy has a lower blood pressure?
c. What is this chance if you were told the person had usedgarlic?
d. Show how you can use the data in the table to make clear thata connection between using garlic and lower blood pressuremight exist.
2. Make up numbers that show no connection between garlic andlower blood pressure. (Use a total of 200 people.)
No Change in
Blood Pressure
Lower
Blood PressureTotal
Using Garlic
No Garlic
Total
27
87
73
100

Section B: Maybe There Is a Connection 21T
Hints and CommentsOverviewIn Check Your Work, students assess themselves on theconcepts and skills from this section. Students cancheck their answers on Student Book pages 56–58.They reflect on the topics addressed in this section inthe For Further Reflection problem.
Planning
After students finish Section B, you may assign ashomework appropriate activities from the AdditionalPractice section, located on Student Book page 51.
Solutions and SamplesAnswers to Check Your Work
1. a.
b. The chance that a randomly chosen person inthe study has lower blood pressure is 113 out of200, which is 113____
200 � 0.565, or about 57%.
c. The chance would be 73 out of 100, or 73%.You only look at the 73 people of the 100 whoused garlic.
d. The percentage of people with lower bloodpressure is larger in the group that uses garlic;73% of that group have lower blood pressure,while in the whole group, about 57% have lowerblood pressure, and in the group that uses nogarlic, only 40% have lower blood pressure.So there seems to be a connection. However,you cannot tell whether the garlic caused thelower blood pressure. And of course, thesample must be chosen carefully!
2. You can use different numbers in the table.One example is shown. If no connection exists,the percentage of people with lower bloodpressure would probably be about the same inboth the group that used garlic and the group thatdidn’t use garlic.
Using Garlic
No Garlic
Total 87 113 200
60 40 100
27 73 100
No Change in Lower
Blood Pressure Blood Pressure Total
Using Garlic
No Garlic
Total 101 99 200
52 48 100
49 51 100
No Change in Lower
Blood Pressure Blood Pressure Total

Notes
3b It might be helpful tohave students check theirnumbers with each otherbefore they move on topart c to make sure theydon’t have any errors.
4 Be sure students lookcarefully at the table beforemoving on to answer theproblems on the next page.It is important that theyunderstand the situationbefore they try to answerthe argument presented.
MaybeThere Is aConnection
B
Accommodation
It might be helpful to provide blank chance trees for some students forproblem 3c so they do not spend too much time actually drawing the tree.
Advanced Learners
Students could be asked to expand on their response to problem 3d toshow how each of the three representations could be used to find an answer.
Reaching All LearnersAssessment Pyramid
3ae
3bcd
Assesses Section B Goals
22 Great Predictions
Maybe There is a Connection
Some people have problems driving in the dark. Researchers wonderwhether this is different for men and women.
3. a. Who would be interested in knowing whether there is adifference between men and women and driving in the dark?
Researchers have studied the ability to drive in the dark for a sampleof 1,000 people, half of whom were women and half men. They foundthat 34% of the men and 58% of the women had problems driving inthe dark. So they suspected that a connection exists.
b. Fill in the table with the correct numbers.
c. Make a chance tree that would represent the situation in thetable.
d. What is the chance that a randomly chosen person from thisgroup has problems driving in the dark?
e. Did you use the table or the chance tree to find the chance inpart d? Give a reason for your choice.
4. At Tacoma Middle School, a survey was held to find how manyhours a week students spend at home on their school work.These are the results.
B
Men
Women
Total
TotalNo Problem Driving
in the Dark
Problems Driving
in the Dark
Grade 6
Grade 7
Grade 8
Total
TotalLess Than 3 Hours
a Week
3 Hours a Week
or More
40
30
20
90
40
45
40
125
80
75
60

Section B: Maybe There Is a Connection 22T
Hints and CommentsOverviewStudents continue to complete the Check Your Workproblems from this section. Students can check theiranswers on Student Book pages 56-58. They reflect onthe topics addressed in this section in the For FurtherReflection problem.
Planning
After students finish Section B, you may assign ashomework appropriate activities from the AdditionalPractice section, located on Student Book page 51.
Solutions and Samples
3. a. Possible answer:The people in the traffic department mightwant to know because of safety reasons; eyedoctors might be interested and try toprescribe glasses that will help; insurancecompanies might be interested for assigninginsurance rates.
b.
First you fill in the column with the totals. Thenyou use the percentages to fill in the columnfor “problems driving in the dark.” With thenumbers from the last two columns, you canfind the numbers in the first column for menand women. The totals can be found by addingup the numbers for men and women.
c. A chance tree:
d. The chance that a randomly chosen person hasproblems driving in the dark is 460 out of 1,000,which is 46%
e. Be sure to tell which method you used to findyour answer and give a reason like maybe thetable is easier to read. You might not like thechance tree because all of the chances arefigured out on the tree.
Men
Women
Total
TotalNo Problem Driving
in the Dark
Problems Driving
in the Dark
330 (500 � 170)
210 (500 � 290)
540 (330 � 210)
170 (0.34 � 500)
290 (0.58 � 500)
460 (170 � 290)
500
500
1,000
1,000 People
500 Men 500 Women
330 No ProblemsDriving in Dark
170 ProblemsDriving in Dark
210 No ProblemsDriving in Dark
290 ProblemsDriving in Dark
50%
66% 34% 42% 58%
50%

Notes4 Encourage students torefer to the table and tomake trees as appropriateto support their answers.
MaybeThere Is aConnection
B
Parent Involvement
Have students share their work on the Further Reflection problem withtheir parents. The adults in their lives have other ideas about examples ofsituations not in the book that are independent or dependent.
Reaching All LearnersAssessment Pyramid
4ab
FFR
Assesses Section B Goals
23 Great Predictions
a. Julie states, “There is no connection between hours spent onschool work at home and grade level, since in all grades about40 students spend 3 hours a week or more.” Do you agreewith Julie? Why or why not?
b. Based on these results, do you think there is a connectionbetween grade level and hours spent on school work at home?Explain your answer.
Explain what it means for two events to be independent. Give anexample different from the ones in this section to show what youmean.

Section B: Maybe There Is a Connection 23T
Solutions and Samples
4. a. You might agree with Julie, but she is wrong.She is looking only at the numbers in themiddle column. She should also take intoaccount how many students are in each gradelevel and then compare the percentages.In grade 6, half (50%) of the students spend3 hours a week or more, and in grade 8, 40 outof 60 or 2__
3 of the students spend 3 hours ormore on homework.
b. Yes, there seems to be a connection. The higherthe grade level, the more, likely a student is tospend 3 hours or more per week on homework,although the percents are pretty close forgrades 7 and 8.
Grade 6: 40 out of 80 is 50%.
Grade 7: 45 out of 75 is 60%.
Grade 8: 40 out of 60 is 67%.
For Further Reflection
Answers will vary. Sample answer:
If two events are independent, it means that oneevent happening has nothing to do with the otherevent happening. There is no connection. If youwere to talk about chances, you could say that forindependent events the chance that the one eventhappens has nothing to do with the chance that theother event happens as well. An example of twoindependent events is: “going to school” and “theweather being sunny.” These events are not related.
Hints and CommentsOverviewStudents continue to complete the Check Your Workproblems from this section. Students can check theiranswers on Student Book pages 56–58. They reflect onthe topics addressed in this section in the For FurtherReflection problem.
Planning
After students finish Section B, you may assign ashomework appropriate activities from the AdditionalPractice section, located on Student Book page 51.

24A Great Predictions Teachers Matter
Teachers MatterC
Section Focus
In this section students study the distribution of results from samples andcompare this to the distribution in the population. They graph data innumber-line plots and histograms. They compare data from several samplesby comparing the plots and using statistical measures such as median andspread. They investigate what happens when samples get larger. They makechance statements based on data from samples and population.
Pacing and Planning
Day 9: Fish Farmer Student pages 24 and 25
INTRODUCTION Activity, page 24 Simulate the situation of catching fishfrom a pond.
CLASSWORK Problems 1–4 Study combined sample (for the wholeclass) to draw conclusions about thelengths of two types of fish.
HOMEWORK Problems 5 and 6 Use the results of the simulation toestimate the size of two types of fish.
Day 10: Fish Farmer (Continued) Student pages 26 and 27
INTRODUCTION Review homework. Review homework from Day 9.
CLASSWORK Problems 7–9 Study the distributions of the length offish from the pond and compare this tothe distribution in samples.
HOMEWORK Problem 10 Draw conclusions based on datagathered from a simulation.
Day 11: Backpack Weight Student pages 28–31
INTRODUCTION Problem 11 Investigate data on the weight of students’backpacks.
CLASSWORK Problems 12 and 13 Use medians and spread to comparebackpack data.
HOMEWORK Check Your Work Student self-assessment: MakeFor Further Reflection conclusions based on the analysis
of data from various problem contexts.
Additional Resources: Additional Practice, Section C, Student Book pages 51–53

Teachers Matter Section C: Reasoning from Samples 24B
Teachers Matter C
MaterialsStudent Resources
Quantities listed are per student.
• Student Activity Sheets 2 and 3
Teachers Resources
Quantities listed are per class.
• At least 200 fish data cards
Student Materials
No materials required
* See Hints and Comments for optional materials.
Learning LinesSample and Population
In this section, the relation between samples andthe population is further explored. Studentssimulate catching fish from a pond to determinethe average length for different types of fish.Students experience that small samples can havemuch variability. Recording the results of growingsamples, for example, by combining the results ofall the samples taken by the whole class helpsstudents realize that variability can be reduced asthe sample size increases. A larger sample is alsomore likely to be representative of the population.The data from the samples (that is, the type of fishand its length) are graphed in number-line plotsand histograms. Students were introduced to thesetypes of graphs in the units Picturing Numbers andDealing with Data.
Students notice that as the sample gets larger thedistribution of the lengths of the two types of fishis more distinct. They use the sample data to verifyclaims made about the lengths of the two types offish. Later they check this against the populationdata and conclude how well the sample data reflectthe data of the population.
Graphs and Chances
In the unit Second Chance, students used datapresented in graphs, like histograms, to estimatechances. They interpreted the relative frequency ofan outcome as the experimental (empirical) chancefor that outcome. This connection between dataanalysis and probability is further explored in thissection.
Instead of calculating the relative frequencies froma histogram, students may also estimate chancesby looking at the distribution of the outcomes tomake more general statements about chance.
Students may, for example, conclude that the chancefor several lengths of GE fish is about the samechance for all lengths of fish in the upper graphabove. In the lower graph, the chance of catchinga fish of about 16 cm is much greater than thechance of catching a fish that is 19 cm.
Students compare distributions of data for backpackweight for several samples of students from differentgrades. These data are graphed in number lineplots; students use the median and the spread todescribe the distributions.
At the End of This Section:Learning Outcomes
Students understand how to describe thedistribution of data and make statements aboutexperimental chance based on relative frequenciesof certain outcomes. They improve their under-standing of the relationship between a sample anda population by studying the effect of a growingsample.
Length of GE Fish
Nu
mb
er
of
Fis
h
Length (in cm)
80757065605550454035302520151050
1 2 3 4 5 6 7 8 9 10 11 12 13 14 15 16 17 18 19 20 21 22 23 24 25
Length of Original Fish
Nu
mb
er
of
Fis
h
Length (in cm)
80757065605550454035302520151050
1 2 3 4 5 6 7 8 9 10 11 12 13 14 15 16 17 18 19 20 21 22 23 24 25
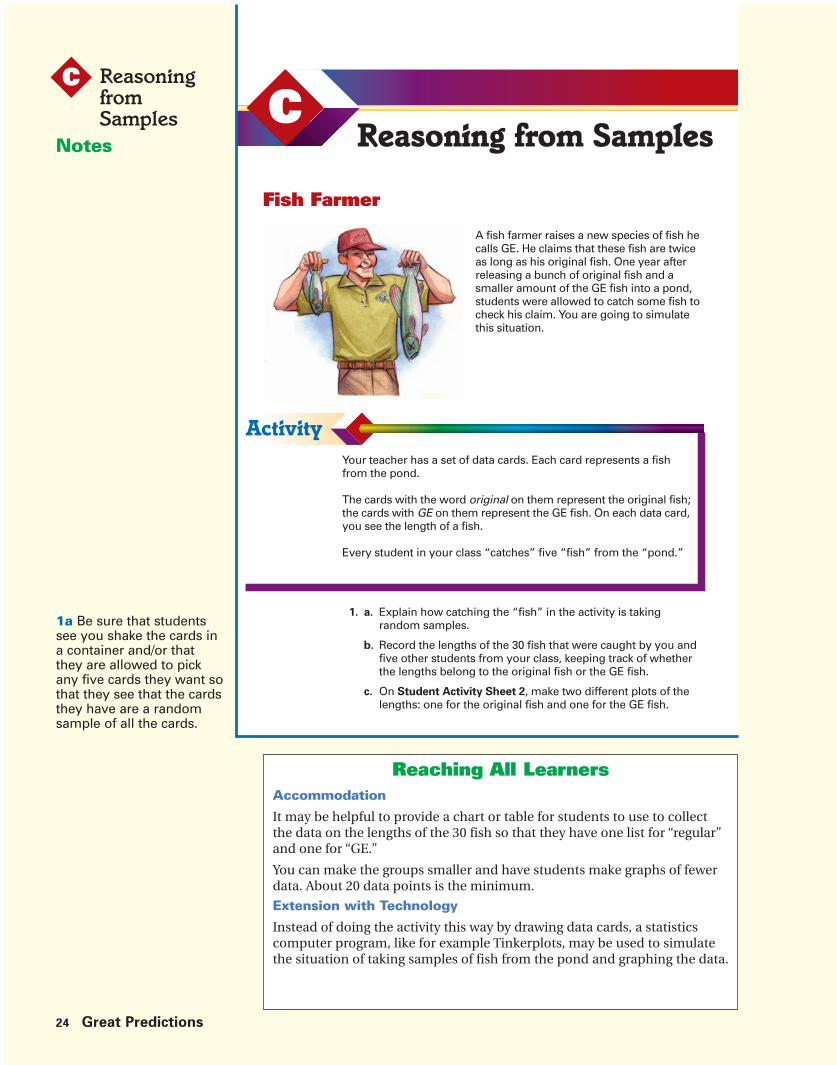
Notes
1a Be sure that studentssee you shake the cards ina container and/or thatthey are allowed to pickany five cards they want sothat they see that the cardsthey have are a randomsample of all the cards.
ReasoningfromSamples
C
Accommodation
It may be helpful to provide a chart or table for students to use to collectthe data on the lengths of the 30 fish so that they have one list for “regular”and one for “GE.”
You can make the groups smaller and have students make graphs of fewerdata. About 20 data points is the minimum.
Extension with Technology
Instead of doing the activity this way by drawing data cards, a statisticscomputer program, like for example Tinkerplots, may be used to simulatethe situation of taking samples of fish from the pond and graphing the data.
Reaching All Learners
24 Great Predictions
CReasoning from Samples
Fish Farmer
Your teacher has a set of data cards. Each card represents a fishfrom the pond.
The cards with the word original on them represent the original fish;the cards with GE on them represent the GE fish. On each data card,you see the length of a fish.
Every student in your class “catches” five “fish” from the “pond.”
A fish farmer raises a new species of fish hecalls GE. He claims that these fish are twiceas long as his original fish. One year afterreleasing a bunch of original fish and asmaller amount of the GE fish into a pond,students were allowed to catch some fish tocheck his claim. You are going to simulatethis situation.
1. a. Explain how catching the “fish” in the activity is takingrandom samples.
b. Record the lengths of the 30 fish that were caught by you andfive other students from your class, keeping track of whetherthe lengths belong to the original fish or the GE fish.
c. On Student Activity Sheet 2, make two different plots of thelengths: one for the original fish and one for the GE fish.

Section C: Reasoning from Samples 24T
Hints and CommentsMaterialsStudent Activity Sheet 2;at least 200 data cards with fish data (Note: A set ofdata cards should have been sent with the Teacher’sGuide). If you do not have a set of data cards, you cancreate these from the template pages found in theback of this book. Instead of copying and cuttingthese out, you may want to use small index cards andwrite the data of one of the fish on each of them.
Overview
Students simulate the situation of catching fish from apond; they record whether their fish are “original” fishor of a special type, so-called GE fish. And they recordthe length. They graph their data.
About the Mathematics
A situation can sometimes be simulated to get infor-mation that is hard to get in reality. Simulations canbe used, for example, to find out how likely certainoutcomes are in complex situations. To design asimulation, information must be available about thecharacteristics of the population that will be studied.In this section, students simulate catching samplesof two types of fish from a pond. By taking samples,they investigate whether length and type of fish areconnected.
There are two ways of taking samples: sampling withreplacement and sampling without replacement. Heresampling without replacement is used because thesamples of all students are combined to “grow” a biggersample. If the population is large enough, the differencebetween sampling with and without replacement willhardly make a difference on the outcomes.
Planning
The Activity is part of a whole class-activity. Studentscan work on problem 1a individually, but problem 1bmust be done in small groups. Problems on pages 24–27represent one problem context.
Comments About the Activity
Put the data cards into a box or paper bag and haveeach student draw five cards and record the type offish (GE or original) and the corresponding length.After each drawing, shake to mix the remaining cards,and have the next student draw five of the data cards.
1. b. Students may want to make a number-line plot,a bar graph, or a histogram. Have each student firstplot his or her own data; next have every student inthe group sum up his or her data—the type of fish andits length—while the other students in the group addthe data to their own graphs.
Solutions and Samples
1. a. Explanations will vary. Sample explanation:
Each card represents one fish in the pond.The cards are taken from the box withoutlooking; they are well mixed, so each card hasan equal chance of being picked. So the fivecards a student picks are a random sampletaken from the population of all data cards(all fish).
b. Graphs will vary depending on the samplesof students. Sample student graph, of 20data points
GE Fish Lengths
Length of Fish (in cm)
Fre
qu
en
cy (
Nu
mb
er
of
Fis
h)
80
1
2
3
4
5
6
7
8
9
10
11
12
13
14
15
16
17
18
19
20
21
9 10 11 12 13 14 15 16 17 18 19 20 21 22 23 24 25
Original Fish Lengths
Length of Fish (in cm)
Fre
qu
en
cy (
Nu
mb
er
of
Fis
h)
80
1
2
3
4
5
6
7
8
9
10
11
12
13
14
15
16
17
18
19
20
21
9 10 11 12 13 14 15 16 17 18 19 20 21 22 23 24 25

Notes
Throughout this page,students are asked to makeclaims and then to justifythem. Be sure that there issome consensus within theclass about what “counts”as a justification.
4 If it is possible, it mightbe helpful to copy eachsmaller group’s list ofdata for each of the othergroups so that they havethe information they needto do this problem. Theinformation could also berecorded on the board oron chart papers.
4 and 5 You may want tohave a transparency ofStudent Activity Sheet 2available, so that classresults can be shared onthe overhead projector.
ReasoningfromSamples
C
Accommodation
For some students, it may be less time consuming for them to use sometechnology, (Excel, Tinkerplots, graphing calculator) to make the graph.
Intervention
For problem 6, it is helpful to organize the data in a two-way table to findthe chances. You may want to point this out to students.
Reaching All LearnersAssessment Pyramid
2a, 5
Use graphs and measures ofcentral tendency to describedata.
25 Great Predictions
2. a. Write at least two observations about the lengths of the twotypes of fish based on the plots you made with your group.One observation should be about the mean length of the fish.
b. Compare your observations with the observations of anothergroup. What do you notice?
The fish farmer claimed that GE fish grew twice the size of theoriginal fish.
3. Based on your data about the length of fish in the plots, do youagree or disagree with the fish farmer’s claim about the length ofthe GE fish? Support your answer.
Add all the data points from every student in your class to the plots.
4. Now would you change your answer to problem 3?
5. What claim could you make about the lengths of the GE fishcompared to the original fish based on the graphs of the wholeclass data? How would you justify your claim?
The fish farmer only wants to sell fish that are 17 centimeters (cm)or longer.
6. a. Based on the results of the simulation activity from your class,estimate the chance that a randomly caught GE fish is 17 cmor longer.
b. Estimate the chance that a randomly caught original fish is17 cm or longer.
c. Estimate the chance that a randomly caught fish is 17 cm orlonger. How did you arrive at your estimate?
CReasoning from Samples

Section C: Reasoning from Samples 25T
6. a. Answers will vary, depending on students’samples. Sample answer based on a sample of100 fish from the whole population:
Based on the data in the table, the chance thata randomly caught GE fish is longer than 17 cmis 12___
18 , or 2__3 , which is about 0.67, or 67%.
b. The chance of catching an original fish longerthan 17 cm is 11___
82 , which is about 0.13, or 13%.
c. The chance that a randomly caught fish islonger than 17 cm is 23_____
100 , which is about 0.23,or 23%.
Solutions and Samples
2. a. Sample observations:
• There are many more original fish than GEfish.
• Some GE fish are much longer than alloriginal fish.
• The lengths of the GE fish have a larger range.
• The original fish are typically around 15 or16 cm long. This will be the mean.
b. Answers will vary since this depends on theobservations of the other groups. The sampleswill probably vary quite a lot since they aresmall. However, it could well be that eachgroup has a mean of about 15-17 cm for theoriginal fish. The mean of the GE can vary alot between groups since the sample size isvery small.
3. Disagree. Explanations will vary, depending onstudents plots. Sample answer:
The original fish have a mean of about 15 cm,but the GE fish do not have a mean length ofabout 30 cm.
4. This depends on the samples, but the plotsshould still show that while the GE fish are bigger;then are not really twice as big. Sample answer:
GE fish are larger; over half of the GE fish thatwere caught were over 21 cm long, but the typicaloriginal fish that was caught was about 15 to 17cm long, which is not half as much as the GE fish
5. Answer will vary based on the graphs. Samplegraphs of the entire class data, based on a sampleof 100 fish.
Sample answers:
• All of the larger fish that were caught wereGE fish.
• The GE fish seem to be in general around21 cm long, while the original fish arearound 15 cm. So the GE fish are about oneand a half times as long as the original fish.
• On average, the original fish are about15.5 cm long, and the GE fish about 19.3 cmlong. So a better estimate of the ratio wouldhave been 3 to 4 instead of 1 to 2.
• Some GE fish are very long (up to almost25 cm) and twice the size of some originalfish (about 12 cm). However, overall they arecertainly not twice the size of the originalfish.
Hints and CommentsMaterialsStudent Activity Sheet 2 (one per student);
See more Hints and Comments on page 92.
Length of GE Fish
Fre
qu
en
cy (
Nu
mb
er
of
Fis
h)
Length (in cm)
30282624222018161412106420
1 2 3 4 5 6 7 8 9 10 11 12 13 14 15 16 17 18 19 20 21 22 23 24 25
Length of Original Fish
Length (in cm)
1 2 3 4 5 6 7 8 9 10 11 12 13 14 15 16 17 18 19 20 21 22 23 24 25
Fre
qu
en
cy (
Nu
mb
er
of
Fis
h)
30282624222018161412106420
Original
GE
Total
TotalUp to 17 cm 17 cm or Longer
71
6
77
11
12
23
82
18
100

Notes
Be sure students understandthat these are histograms,so taller bars represent morefish of that length.
It would be helpful to haveboth graphs on overheadsso that everyone is lookingat the same graph and theycan be overlapped as a wayto compare.
ReasoningfromSamples
C
Accommodation
If you have students who have difficulty reading graphs and the values foreach of the bars, prepare in advance a table of values to use with thequestions about these two histograms.
Reaching All Learners
26 Great Predictions
Length of Original Fish
Nu
mb
er
of
Fis
h
Length (in cm)
80757065605550454035302520151050
1 2 3 4 5 6 7 8 9 10 11 12 13 14 15 16 17 18 19 20 21 22 23 24 25
The fish farmer caught 343 fish from the pond and recorded thelengths. He graphed the lengths and made these histograms. Thegraphs are also on Student Activity Sheet 3.
Reasoning from SamplesC
Length of GE Fish
Nu
mb
er
of
Fis
h
Length (in cm)
80757065605550454035302520151050
1 2 3 4 5 6 7 8 9 10 11 12 13 14 15 16 17 18 19 20 21 22 23 24 25

Section C: Reasoning from Samples 26T
Hints and CommentsMaterialsStudent Activity Sheet 3 (one per student)
Overview
Students study the graphs of the lengths of all 343 fishin the pond. There are no problems on this page forstudents to solve. The problems with these graphs areon Student Book page 27.

Notes
8a In order to answer theproblem, students mustcombine the data. Somemay do it visually, butsome may want to drawthe data from the GE fishonto the graph of theoriginal fish so that theycan see the entirepopulation.
9 This problem requiresstudents to grapple withsample size in twodifferent ways. Be surestudents are clear aboutwhat the differences arebetween the two answersthey are comparing.
10 Students should seethat, once they have thenumbers, it is much easierto make the necessarycomparisons.
ReasoningfromSamples
C
Intervention
If students are having difficulty with problem 8, have them draw a line onthe graph to show which fish are big enough.
For problem 8c, make sure students understand that they need to combinedata from both graphs since the problems are about all fish.
Reaching All LearnersAssessment Pyramid
7a, 10ab
Use graphs and measuresof centeral tendency todescribe data.
27 Great Predictions
7. a. If you caught an original fish at random, what length (roughly)is most likely? Use the data in the histograms and give reasonsfor your answer.
b. If you caught a GE fish, what length would be most likely?
Remember: The fish farmer only wants to sell fish that are 17 cm orlonger.
8. a. Based on the information in these graphs, estimate the chancethat a randomly caught original fish will be 17 cm or longer.
b. Estimate the chance that a randomly caught GE fish will be17 cm or longer.
c. Estimate the chance of randomly catching a fish that is 17 cmor longer.
9. a. Compare your answers to problems 6 and 8. Are they similar?If they are very different, what might explain the difference?
b. Why is the answer to 8c closer to the answer to 8a than to theanswer for 8b?
You can use a two-way table to organize the lengths of the fish thatwere caught.
10. a. Copy the two-way table into your notebook and fill in thecorrect numbers using the data from the histograms for thetotal of 343 fish. You already have a few of those numbers.
b. What is the chance the fish farmer will catch a GE fish?
c. Reflect How can you calculate in an easy way the chance thathe will catch an original fish?
d. What is the chance that he catches an original fish that is17 cm or longer?
e. Which type of fish do you advise the fish farmer to raise? Besure to give good reasons for your advice.
CReasoning from Samples
Original
GE
Total
TotalUp to 17 cm 17 cm or Longer
343

Section C: Reasoning from Samples 27T
Most samples of size two would reflect the nineoriginal fish, and the one GE fish would nothave much influence on the overall results.
10. a.
b. The chance that the fish farmer will catch a GEfish is 66____
343 , which is about 0.19, or 19%.
c. The chance that he catches an original fish isabout 81%. This can be found as thecomplementary chance of the chance found inpart a, it is 100% � 19%.
d. The chance that he catches an original fishlonger than 17 cm is 46____
343 , which is about 0.13,or 13%. Note that in this case, 46 has to bedivided by the total number of 343.
e. Answers will vary. Sample advice to the fishfarmer:
• He should grow GE fish because they aregenerally larger. And from the data in the table,you can see that the chance a GE fish is largerthan 17 cm is bigger (74%) than the chancethat an original fish is that long (13%).Of course, you cannot know if there are otherfactors that would influence his decision.Perhaps GE fish are harder to grow since nowthere are not many in his pond. Or these GEfish may not be typical of all GE fish.
Solutions and Samples
7. a. Answers will vary. Sample answer.
• Most likely it would be between 15 and 16 cmbecause this is the mode. There are 76 of thesefish.
• Most likely the length is between 15 and 18 cmbecause most data (a cluster of data) are inthe middle.
b. Answers will vary. Sample answer.
• It is hard to tell because there is not reallyone length that is most common. The lengthsare between 14 and 23 cm.
• Although not that many GE fish were caught,it seems that given the sample, a typical lengthfor GE fish would be between 20 and 21 cm.
• Most likely it is around 20 cm but it can beplus or minus 5 cm.
8. a. Estimations will vary. Sample estimation:
• The chance that an original fish caught islarger than 17 cm is about one sixth. This canbe found by fitting the bars.
• Based on the information in this graph thechance can be calculated, the chance is 46____
277 ,which is about 0.17 or 17%.
b. Estimations will vary. Sample estimation:
• The chance that a GE fish caught is largerthan 17 cm is about 75%.
• The chance can be calculated and is 49___66 ,
which is about 0.74 or 74%.
c. Answer will vary. Sample estimation:
• About 25%, I kind of added the graphstogether into one histogram and eyeballedthe part of the bars above 17 cm.
• The chance can be calculated: If you catch afish at random, the chance that it is longerthan 17 cm is (46 � 49) � (277 � 66), whichis about 0.28 or 28%.
9. a. Answers will vary, this depends on the actualsamples. Sample answer:
• The differences are not very large: 67% versus74% for GE fish, 13% versus 17% for originalfish, and 23% versus 28% for the wholepopulation.
b. This answer to 8c is closer to the answer toquestion 8a than to 8b because the group oforiginal fish is much larger than the group ofGE fish. The original fish population has a biggerinfluence on the overall chance of catching afish larger than 17 cm than the smaller GEpopulation. One way to think about this is toimagine a population with only 1 GE fish and9 original fish.
Hints and CommentsMaterialsStudent Activity Sheet 3
Overview
Students study the distributions of the lengths of alloriginal and all GE fish from the pond. They comparethese distributions to those from their samples. Theydraw conclusions based on the data.
See more Hints and Comments on page 93.
Original
GE
Total
TotalUp to 17 cm 17 cm or Longer
343
231
17
248
46
49
95
277
66

Notes11 This problem is a goodopportunity to be sure allof your students have anefficient way to calculate15% of a number.
11b Encourage studentsto pick reasonable weightsfor students. You mayneed to remind them thatto convert from pounds tokilograms, you divideby 2.2.
12 Make sure studentsrealize that the percent-ages (backpack weight ofbody weight) are graphedand not the weightsthemselves.
ReasoningfromSamples
C
Act it Out
Students could be asked to find out what percent of their own body weighttheir backpack is. If you do this in class, it is important to have studentsweigh themselves and their own backpacks so that there is no publicknowledge of another’s weight.
Reaching All LearnersAssessment Pyramid
12a
Use graphs and measuresof central tendency todescribe data.
28 Great Predictions
Too much weight in backpacks can cause shoulder pain or lower-backpain. Doctors say that you should not carry more than 15% of yourown weight.
11. a. Randy weighs 40 kilograms. What weight can he carry basedon the doctors’ rule?
b. Choose two other weights for students and calculate themaximum backpack weight for these weights.
Scientists decided to check the amount of weight students at anelementary school carry in their backpacks.
The scientists made a number line plot of the weights carried bya sample of students from grades 1 and 3.
Reasoning from SamplesC
0
1
2
3
4
5
6
5 10 15 20 25
Nu
mb
er
of
Stu
den
ts
Percentage of Student Weight
Backpack Weights
x x x x x x x x x x x x x x x
x x x x x x x x x
x x x x x x x
x x x
x x
x x
Backpack Weight
12. a. What do you think they concluded from this data set?
b. Reflect Based on the data from this sample, would it be sensibleto conclude that most students at the elementary school donot carry too much weight in their backpacks? Give reasons tosupport your answer.

Section C: Reasoning from Samples 28T
Hints and CommentsOverviewStudents investigate data on the weight of backpacksof students. Based on different samples, they decidewhether they can conclude that these are too heavyor not, according to a rule.
About the Mathematics
There is a difference between concluding that a ruleworks for individual cases or for a group. For example,the rule that backpack weight should be no morethen 15% of your own weight can be checked by eachindividual. But if someone wants to investigatewhether the backpacks of elementary school studentsare too heavy or not, they will take a sample and studythe distribution. In this case, data on the weight of thestudents and the backpacks in the sample are collected.These data are not graphed directly. First a calculationis made to find the percentage that the backpackweight is of the students’ weight. These data are thengraphed. Students investigate this situation andreflect on the way samples are taken and data arepresented.
Planning
Students can work on problems 11 and 12 in smallgroups. Discuss the answers to 12b in class.
Comments About the Solutions
11. b. Students can choose the weights themselves.Some students may choose weights they findeasy to use in the calculations, while othersmay want to be realistic and use weights ofpeople they know, still other students may usenumbers to show they can make more difficultcalculations as well. You may discuss students’work in class.
12. b. You may want to discuss the fact that thesample is only taken from grades 1 and 3, so itis not representative of all elementary schoolchildren, and the fact that it is taken at oneelementary school. Students may also indicatethat it is important to know more about the fivestudents with backpacks that are too heavy.
Solutions and Samples
11. a. According to the rule, Randy can carry 15% of40 kg, which is 6 kg. Strategies may vary.Sample strategy:
10% of 40 kg is 4 kg, and 5% of 40 kg is halfof this, so this is 2 kg. So 15% of 40 kg is4 �2 � 6 kg.
b. Answers will vary depending on the weightsstudents choose. Student results should be15% of the selected weight.
12. a. Answers may vary. Sample answer:
They probably concluded that there is not muchreason to worry. The mean is just above 10%,and there are only a few students, 5 out of 38,carrying too much weight.
b. Answers will vary. Sample answers:
• If the sample is taken randomly, a conclusionmay be that the weight percentages in grades1 and 3 at that elementary school are mostlywithin the 15% limit. This could be differentat another school, and for older students(next question), and even on another day.
• Since only students from grades 1 and 3 werein the sample, you cannot draw conclusionsfor all students at the elementary school.

Notes
13 In this problem,students should use whatthey have learned aboutstatistics to makeconclusions about thedifferent grades. You maywant to ask students, Whywas the median indicatedand not the mean? Wouldthe mean be helpful in thiscase? (Most likely not,because of the extremevalues.)
ReasoningfromSamples
C
Extension
Students could be challenged to make up the graph that they would expectfor grade 9 students.
Reaching All Learners
29 Great Predictions
The scientists wondered whether older students carried more weightin their backpacks. They decided to collect data on students in someof the upper grades as well.
Here are all their data from the sample of students in grades 1, 3, 5,and 7.
The red markers represent the medians of the group from each grade.
CReasoning from Samples
0 5 10 15 20 25 30 35 40
Percentage of Student Weight
Backpacks
Grade
First
Third
Fifth
Seventh
xxxxxxxx xxxx
xxx
xx xxxxxxxx
xx xxxxxxxxxxxx xxx x x xx
xx
x
xx x x xxxxxx xx xxxx x
x x
xxxx xx xx
xx
xx
13. a. How would you characterize the differences in mediansbetween grades 1, 3, 5, and 7?
b. What does the median of a group tell you?
c. How does the spread of the percents compare for the fourgrades? What does this mean about the weight students ineach sample carried in their backpacks?
d. What might you conclude about the amount of weightstudents carry in their backpacks? Support your ideaswith arguments.
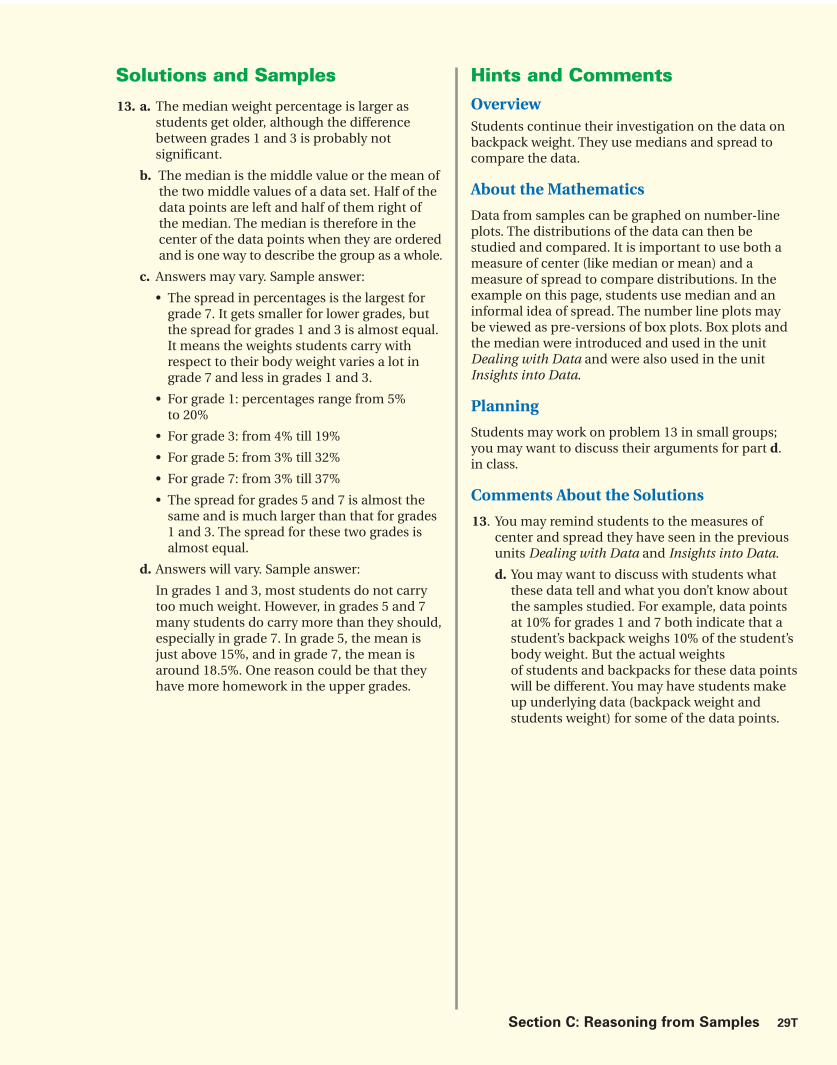
Section C: Reasoning from Samples 29T
Hints and CommentsOverviewStudents continue their investigation on the data onbackpack weight. They use medians and spread tocompare the data.
About the Mathematics
Data from samples can be graphed on number-lineplots. The distributions of the data can then bestudied and compared. It is important to use both ameasure of center (like median or mean) and ameasure of spread to compare distributions. In theexample on this page, students use median and aninformal idea of spread. The number line plots maybe viewed as pre-versions of box plots. Box plots andthe median were introduced and used in the unitDealing with Data and were also used in the unitInsights into Data.
Planning
Students may work on problem 13 in small groups;you may want to discuss their arguments for part d.in class.
Comments About the Solutions
13. You may remind students to the measures ofcenter and spread they have seen in the previousunits Dealing with Data and Insights into Data.
d. You may want to discuss with students whatthese data tell and what you don’t know aboutthe samples studied. For example, data pointsat 10% for grades 1 and 7 both indicate that astudent’s backpack weighs 10% of the student’sbody weight. But the actual weightsof students and backpacks for these data pointswill be different. You may have students makeup underlying data (backpack weight andstudents weight) for some of the data points.
Solutions and Samples
13. a. The median weight percentage is larger asstudents get older, although the differencebetween grades 1 and 3 is probably notsignificant.
b. The median is the middle value or the mean ofthe two middle values of a data set. Half of thedata points are left and half of them right ofthe median. The median is therefore in thecenter of the data points when they are orderedand is one way to describe the group as a whole.
c. Answers may vary. Sample answer:
• The spread in percentages is the largest forgrade 7. It gets smaller for lower grades, butthe spread for grades 1 and 3 is almost equal.It means the weights students carry withrespect to their body weight varies a lot ingrade 7 and less in grades 1 and 3.
• For grade 1: percentages range from 5%to 20%
• For grade 3: from 4% till 19%
• For grade 5: from 3% till 32%
• For grade 7: from 3% till 37%
• The spread for grades 5 and 7 is almost thesame and is much larger than that for grades1 and 3. The spread for these two grades isalmost equal.
d. Answers will vary. Sample answer:
In grades 1 and 3, most students do not carrytoo much weight. However, in grades 5 and 7many students do carry more than they should,especially in grade 7. In grade 5, the mean isjust above 15%, and in grade 7, the mean isaround 18.5%. One reason could be that theyhave more homework in the upper grades.

Notes
Be sure students read theSummary, and it might behelpful to call on studentsto point out the importantideas presented.
Reasoningfromsamples
C
Accommodation
This summary is very text heavy. It might be helpful to provide a copy forweak readers to highlight or take notes on in another way.
Parent Involvement
Have students share the summary and their work on the ‘‘Check Your Work’’Section.
Vocabulary Building
Students might think of complementary probabilities as a pair of chancesthat add up to 100%.
Reaching All Learners
30 Great Predictions
Reasoning from Samples
Small samples from the same population can be very different. Becausesmall samples can have so much variability, it is important that a sampleis large enough to get a sense of the distribution in the population.
It is also important that the sample is randomly chosen.
Based on data, you can estimate chances of particular events.
• For example, what is the chance of randomly catching a fishthat is 17 cm or longer? What is the chance that it is smaller than17 cm?
• If the chance that a randomly caught fish is 17 cm or longer is23%, then the chance of catching a fish with length up to 17 cmis 1 � 0.23 � 0.77, or in percentages: 100% � 23% � 77%. Wesay that these chances complement each other.
If you draw a conclusion from a sample, you have to be careful abouthow the sample was taken and from what population.
• For example, if you just study grades 1 and 3 students and theirbackpacks and find that their backpacks are not too heavy, youcannot make any conclusions about the backpack weights forstudents in general.
C
The police have set up a sign that showsdrivers how fast they are driving.Students at the Bora Middle School arestill worried about speeding cars nearthe school. Using the speed sign, theydecide to write down how fast cars goduring the hour before school.
Section C: Reasoning from Samples 30T
Hints and CommentsOverviewStudents read the Summary, which reviews the maintopics covered in this section. In Check Your Work,students will assess themselves on the concepts andskills from this section.
Planning
After students finish Section C, you may assign ashomework appropriate activities from the AdditionalPractice section, located on Student Book pages 51–53.

Notes
1 Have students sharetheir lists so that they gaina broader view of theadvantages anddisadvantages.
2 This problem is intendedto once again havestudents think about theproblems with smallsamples.
Reasoningfromsamples
C
Extension
If students concluded in problem 2 that speeding was not a problem,ask, How many more data over the speed limit they would have to add forthem to conclude that speeding was a problem?
Reaching All LearnersAssessment Pyramid
3, FFR
1, 2
Assesses Section C Goals
31 Great Predictions
These are the data values one student collected (in miles per hour):
24 28 27 26 31
And those of another student: 26 17 22 27 25
And of a third student: 25 27 28 32 32
1. Comment on the difference in the three sets of data they collected.
Does using a graph of the data help you understand how to estimatethe chance of an event? Explain why or why not.
Here is the complete data set of speeds the students collected(in miles per hour).
Speed (mi/hr)
2. Make a plot of these values. Then use the plot and any statisticsyou would like to calculate to write a paragraph for the schoolofficials describing the speed of the traffic on the road beforeschool.
3. List some advantages and disadvantages of large samples.
242827263118242625
322825303029223036
292825233221193023
292929223021273325
282431272632282526
172227242528322627
262832322724262719

Section C: Reasoning from Samples 31T
Hints and CommentsOverviewStudents complete the Check Your Work problemsfrom this section. Students can check their answerson Student Book pages 59–61. They reflect on thetopics addressed in this section in the For FurtherReflection problem.
Planning
After students finish Section C, you may assign ashomework appropriate activities from the AdditionalPractice section, located on Student Book pages 51–53.
Solutions and SamplesAnswers to Check Your Work
1. The samples are very small and give very differentimpressions of how fast the cars are going. In thefirst and third samples, four out of five cars drivefaster than 25 mi/h, but in the second sample,only two do so. The second sample does not givemuch reason to worry about speeding cars, butthe other two samples are more alarming.
One similarity is that the median in all three isaround 27 mi/h.
2. Your paragraph can have different plots anddescriptions. You can make a histogram, anumber-line plot, a box plot, or any other graphthat you think will work. The examples belowshow a number-line plot and a histogram. Thered marker represents the median.
Be sure that you use the numbers to tell a storyabout speeding.
Here are some examples.
• I think that speeding is a problem. The dot plotof a sample of the speeds of 63 cars as they gopast the school in the morning shows that overhalf of the cars are going as fast or faster than27 mi/h, which is speeding. Most of the speedswere right around the speed limit between 24and 28 mi/h, but about two thirds of them weregoing faster than the 25 mi/h speed limit. Fourcars were going less than 20 mi/h, but one was11 mi/h over the limit.
Speed (in mi/h)
5
0
16 18 20 22 24 26 28 30 32 34 36
Co
un
t
X X X X X X X X X X X X X X XX X X X X X X X X X X X X
X X X X X X X X X
X X X X X X X XX X X X X X X X
X X X XX X X
X
X X
Speed of Cars on Road before School in the Morning
Speed (in mi/h)
5
0
16 18 20 22 24 26 28 30 32 34 36
Co
un
t
Speed of Cars on Road before School in the Morning
• I do not think speeding is a problem. Half ofthe cars were going just a little bit over the 25mi/h speed limit. You can tell from the plot thatjust a few cars were going faster than 30 mi/h,and only one car was really speeding at 36mi/h. Most of the rest, about 75% of them, werewithin 5 miles of the speed limit, which showsthat they were really not going too fast.
3. An advantage of large samples, provided theyare randomly selected, is that you can get a fairlygood estimate of the center and spread of thedistribution. A disadvantage of large samples isthat they can be expensive and time-consumingto conduct. You might think of other advantagesand disadvantages.
For Further Reflection
Sample answers:
• A graph of data may help estimate the chanceof an event because, for example, in a histogramyou can “eyeball” what part of the bars is at orabove or below a certain value, and you canuse this as an estimate for the chance of thisoutcome.
• A graph of data may help to estimate chancesonly a little because it is hard to visuallyestimate chances since they are fractions. It iseasier to use the numbers, like the relativefrequencies of certain outcomes.

Teachers MatterD
Section Focus
The concept of expected value is formalized in this section. Studentscalculate, for example, the expected revenue for several toll options, theexpected number of readers that will become customers, and the expectedscore for a basketball player. Students use chance trees to model situationsand compute probabilities. They relate chance and expected value.
Pacing and Planning
Day 12: Carpooling Student pages 32–34
INTRODUCTION Problem 1 Calculate the money collected for a tollroad given the toll per motorist and thenumber of cars.
CLASSWORK Problems 2–7 Use chance trees to represent the surveyresults for drivers that plan to use the tollroad’s regular or new carpool lanes andto predict the money collected (expectedvalue) under this new toll plan.
HOMEWORK Problem 8 Predict the money collected under thisnew toll plan if different survey resultsare used in the calculations.
32A Great Predictions Teachers Matter
Day 13: Advertising Student pages 34–36
INTRODUCTION Problem 9 Use a chance tree to represent thenumber of newspaper readers who willread an advertisement and then becomecustomers.
CLASSWORK Problems 10–12 Use chance trees and tables to determineexpected values.
HOMEWORK Problems 13 and 14 Study a table containing data about thelife span of mayflies and use the data tocalculate the mayfly’s life span.
Day 14: Free Throws Student pages 36–39
INTRODUCTION Review homework. Review homework from Day 13.
CLASSWORK Problems 15–18 Use a tree diagram with probabilities(chance tree) to represent data in atwo-way table.
HOMEWORK Check Your Work Student self-assessment: Determine thechance for various events using chancetrees.

Teachers Matter Section D: Expectations 32B
Teachers Matter D
Materials
Student Resources
No resources required
Teachers Resources
No resources required
Student Materials
No materials required
* See Hints and Comments for optional materials.
Learning LinesExpected Value
The concept of expected value, informallyaddressed in the unit Second Chance, is nowformalized in this section. Chance trees, whichwere introduced in the unit Second Chance — as aspecial type of tree diagram — and were used inprevious sections of this unit, are now used toexplore and calculate expected values. To makethe computation of expected value easier tounderstand, “absolute” numbers are added to thechance trees, as in the example shown.
The total expected amount of tolls is found usingthe chance tree. The average expected value canbe found by dividing the total of tolls collected,which is $3,400, over the 1,000 cars. This results inan expected toll of $3.40 per car. The averageexpected value can also be calculated by multiplyingan outcome by its chance and adding the results forthe several outcomes. In the example of the toll road,this would be 0.2 � $1.00 + 0.8 � $4.00 = $3.40 percar. This method is not explicitly addressed in thissection. Students explore what happens if theystart with a different number of cars, and theydiscover that the expected value only depends onthe chances of the different outcomes. Expectedvalue and mean are related when studentscalculate the expected life span of mayflies.
Models
Students use the chance tree with absolute numbersto calculate expected values. This chance tree wasintroduced in Section B in this unit. Students alsouse data presented in tables to calculate expectedvalue. To do so, they must first reorganize theinformation.
At the End of This Section:Learning Outcomes
Students understand the meaning of expectedvalue and can calculate and use it to makedecisions. They use chance trees with absolutenumbers to calculate expected value. They canalso calculate expected value from data in a table.Students informally connect expected value to the(mathematical) mean.
20%
80%
for each car� $1.00 � $200
for each car� $4.00 � $3,200
200Cars
800Cars
1,000Cars
Day 15: Summary Student page 39
INTRODUCTION Review homework. Review homework from Day 14.
ASSESSMENT Quiz 2 Assesses Section C and D Goals
HOMEWORK For Further Reflection Describe the concept of expected valueto another family member.
Additional Resources: Additional Practice, Section D, Student Book pages 53 and 54

Notes
You might want tointroduce this sectionwith a conversation abouthighway congestion andwhy carpools might help.Students who completedthe unit Ratios and Rateshave examined this ideabefore.
1 and 2 Both of theseproblems involve simplenumeric calculations andprovide a chance to seeif your students arecomfortable with thecalculations.
ExpectationsD
English Language Learners
Be sure students understand what a toll road is as well as what a carpool is.
Extension
Have students write all the possible ways to pay the $2.50 toll. Studentsshould think of a systematic way to find all possible combinations of dollarbills and coins.
Reaching All Learners
32 Great Predictions
From the survey, the department also believesthat on a typical morning between 8:00 A.M.and 9:00 A.M., the number of cars using the tollroad will decrease from 1,400 to 1,000 due tothe carpooling efforts.
3. Copy and complete the chance tree thatdisplays the expected traffic after thechange.
DExpectations
Carpooling
On one toll road in the city, eachmotorist pays a toll of $2.50.One day, the Department ofTransportation counted 1,400cars that used the toll roadbetween 8:00 A.M. and 9:00 A.M.
1. During this time period,how much money wascollected?
The Department of Transportation wants people to carpool in order toreduce traffic on the toll road. The Department is considering creatinga “carpool only” lane for cars with three or more people. The toll forcars in the carpool lane would be reduced to $1.00. At the same time,the toll for cars in the regular lanes would be raised to $4.00.
The Department of Transportation takes a survey and estimates thatwhen the regulation goes into effect, 20% of the cars will use thecarpool lane.
2. If you see 100 cars enter the toll road, how many would youexpect to use the carpool lane?
Low Toll20%
High Toll
1,000 Cars

Section D: Expectations 32T
Hints and CommentsOverviewThis section introduces students to the notion ofexpected value. On this page, students familiarizethemselves with the context of a toll road. Theyinvestigate the effect of a proposed car pool lane ina toll road situation by completing a chance tree todetermine how many cars are expected to usewhich lane.
About the Mathematics
The expected value is the same as the mathematicalmean. Students learned how to calculate the mean inthe unit Dealing with Data. A chance tree is a graphicrepresentation of a problem situation in which allrelevant information is pictured. Students have usedchance trees in the unit Second Chance, however, inthat unit no absolute numbers were written in thechance tree. Writing the absolute numbers is donehere to make calculating the expected value more easy.
In this situation, as in many others students have seenso far, statistics and chances are more meaningful fora large group than for an individual. The fact that onecar has a 0.20 chance of paying a low toll actuallymeans that, on average, one out of every five cars paysthe low toll or that for a large group of cars, 1__
5 will paythe low toll. For an individual car, the 0.20 chance ofpaying a low toll is not meaningful information.
Planning
Students may work on problems 1–3 in small groups.Students used tree diagrams and chance trees in theunits Take a Chance and Second Chance, and in theprevious sections of this unit.
Comments About the Solutions
2. Students can represent the chance in a numberof different ways: 20% is the same as 1__
5 , 0.2, or1 out of 5. They can choose the way that makescalculating easy for them.
Solutions and Samples
1. $3,500 ($2.50 � 1,400 � $3,500)
2. You would expect about 20 cars to use the carpoollane (20% of 100).
3.
Low Toll20%
High Toll
80%
1,000 Cars
200
800

Notes4 This problem begins theintroduction of expectedvalue. If students havedifficulty, have them usetheir diagram fromproblem 3 to help themdetermine how many carswill pay each of the tolls.
7 This problem can bedone as a whole-classactivity. You might askstudents to explain whateach part of the diagramrepresents. It is critical thatstudents understand thisproblem before continuingwith the next because thisproblem combines all thecalculations that studentshave used to this point.
ExpectationsD
Intervention
If students have difficulty with problem 5, you might have them draw a treediagram of the situation. They can also use the chance tree on page 32 ofthe Student Book.
Extension
Students could be asked to frame their answer to problem 6 as a letter tothe department or as a presentation that they would make to the peoplemaking the decision.
Accommodation
Students might find a copy of the blank diagram helpful for problem 7.They could fill in words or phases to explain what is represented in each area.
Reaching All Learners
33 Great Predictions
DExpectations
4. a. How much money does the Department of Transportationexpect to collect between 8:00 A.M. and 9:00 A.M.?
b. What will be the average toll charge per car during this hour?
The department also wants to know how many people use the tollroad. To answer this question, some assumptions were made: A carthat uses the carpool lane has three occupants, and a car in one of theregular lanes has only one occupant.
5. Using those assumptions, how many people will travel on the tollroad from 8:00 A.M. to 9:00 A.M. on a typical morning?
The Department of Transportation is trying to decide whether to carryout the carpooling plan. It considers the change in the amount of tollmoney collected, the change in the number of cars on the road, andseveral other factors.
6. Do you think the department should carry out the carpooling plan?Justify your answer.
In solving the carpool problem, you used a process that can berepresented as follows:
The diagram on the right is a general version of the one on the left.
7. Explain the process shown in the diagrams.
20%
$3,400
—%� — � —
� — � ——%
——
80%
for each car� $1.00 � $200
for each car� $4.00 � $3,200
200Cars
800Cars
1,000Cars

Section D: Expectations 33T
Hints and CommentsOverviewStudents continue solving problems in the context ofthe toll road. They determine how much money isexpected to be collected and how many people areexpected to travel on the toll road using the proposedplan. Students explain how to use a diagram to solve aproblem about expected value.
About the Mathematics
By using absolute numbers of cars, the expected totaltoll can be calculated. The expected value is theaverage toll per car (the mathematical mean). Thisvalue does not depend on the number of cars. It canbe calculated by multiplying the value of eachpossible outcome (in this case, each toll fare) by itschance. Students, however, will use the absolutenumber of cars on this to find the total toll expected,they will then divide the total toll by the number ofcars to find the expected value. The chance tree withthe absolute numbers helps students use this method.The notion of expected value is introduced here, butthe term expected value is not yet introduced. This isdone on the next page, student book page 34.
Planning
Students may work on problems 4–6 in small groups.Discuss students’ solutions and strategies for problem4, before they proceed with the other problems.Problem 7 can be done as a whole-class activity.
Comments About the Solutions
4. You may want to discuss with students if theywould find another average toll if another numberof cars was used instead of 1,000.
6. Try to have students use several factors in theirreasoning. You may have students write theiranswers to problem 6 in their journals. You maywant to discuss their argumentations in class.
7. The total is in the box on the left, while the twobranches (arrows) show how the total is split.The meaning of each outcome and its chance areexpressed as a fraction, percent, or decimal and iswritten with the branch. The boxes at the ends ofthe branches show the resulting (expected) numbersfor each outcome. The chances in fractions,percents, or decimals should always add up toone (or 100%).
Solutions and Samples
4. a. $3,400
Sample strategy:
200 cars � $1.00 � $200
800 cars � $4.00 � $3,200
$200 � $3,200 � $3,400
b. The average toll charge per car will be $3.40($3,400 � 1,000 � $3.40).
5. 1,400 people
Sample strategy:
200 cars � 3 � 600 carpool users
800 cars � 1 � 800 non- carpool users
600 � 800 � 1,400 travelers
6. Answers will vary. Sample answers:
• Yes, the department should make the changebecause the 1,000 cars will hold 1,400 people(see answer to problem 5) and, before thecar-pool lane, most likely everyone of the 1,400people traveled in his or her own car. So therewill be 400 fewer cars on the road, which willlessen pollution, reduce road wear and tear,and be safer.
• No, the department should not make thechange. It will lose money. For the 1,400 carswith one person, they got $3,500 in tolls.For the 1,000 cars that have the same 1,400people, they will only collect $3,400. So thedepartment will lose money ($100) with thenew plan.
7. Explanations will vary. Sample explanation:
The cars are divided according to the lane theyuse, and the percents indicate the percentage thatis expected to use each lane or the chance a carwill use that lane. The toll for all the cars in eachlane can be calculated. Then, all the tolls areadded to find the total amount of toll revenue.

Notes
Be sure studentsunderstand the previouspage before moving toproblem 8. In this problem,students are asked torepeat the process withdifferent numbers.
Students need to extractthe important details fromthe context introductionon this page in order tocomplete the problemson the next page.
ExpectationsD
Vocabulary Building
The term expected value is introduced on this page. The expected value isthe value that is predicted using the assumed probabilities. Be sure studentsrealize that the expected value in a situation is based on probabilities, so itis not exactly what one should expect to earn.
Extension
You may want to have students make a diagram to represent a similar tollroad situation in which there is a higher or lower percentage of cars usingthe carpool lane or a different number of total cars using the toll road.
Reaching All LearnersAssessment Pyramid
8cd
8ab
Make decisions usingprobability and expectedvalues. Use tree diagramsand different representationsto describe probability.
34 Great Predictions
Ms. Lindsay is about to open a new store for teens. To reach herpotential customers, she decides to advertise in the local paper. Thereare about 15,000 teens who read the paper. This is her “target group.”
Ms. Lindsay knows that not every teenage reader will read heradvertisement. She also realizes that not every reader of theadvertisement will become a customer. She estimates that 40%of the readers of the paper will read the ad. Also, she expects only10% of those who read the ad to become customers.
ExpectationsD
The amount $3,400 represents what you expect to happen; in thiscase, it is the amount of money you expect to collect. Mathematicianscall this an expected value. Sometimes it is useful to calculate theexpected value as a rate. In this example, the rate would be theexpected toll charge per car.
Kathryn works for the Department of Transportation. She has lookedat a different survey and thinks that 30% of the cars will use thecarpool lane.
8. a. Using Kathryn’s results, make a tree diagram representing thetoll money collected for 1,000 cars.
b. How much money does Kathryn expect the department tocollect between 8:00 A.M. and 9:00 A.M.?
c. Under Kathryn’s plan, what is the expected value, that is, theaverage amount that a car on the toll road would pay?
d. Reflect Who would be interested in this value and why?
Advertising

Section D: Expectations 34T
Hints and CommentsOverviewStudents are introduced to the term expected valueand calculate the expected value of tolls on the tollroad if more cars use the carpool lane. They areintroduced to a new problem situation involvingadvertising.
About the Mathematics
While the mean is used as a statistic for a situation inwhich all data are known, the expected value is usedin a situation in which the population is not known,and samples are taken. From the samples, the chanceon each outcome can be estimated. These chancescan be used to find the expected value, which is infact a theoretical estimation for the mean of the totalpopulation (which is unknown). Students do not needto know this background. They can calculate theexpected value in the same way as they calculate themathematical mean. They learned to do this in theunit Dealing with Data.
Planning
You may want to read the text about expected valuewith the whole class. Students may work on problem8 individually or in pairs.
Comments About the Solutions
8. Students who understand how to calculateexpected value may not want to draw a treediagram. Ask them to write out their calculationsinstead.
Solutions and Samples
8. a.
b. $3,100. Strategies will vary. Sample strategy:
300 � $1.00 � $300
700 � $4.00 � $2,800
$300 � $2,800 � $3,100
c. The average amount is $3.10 per car ($3,100 �1,000 � $3.10).
d. The highway department might be interestedbecause they could use this value to estimatethe total revenue for different time periods.
—%� _____ � __________
� _____ � __________—%
____________
1,000
Cars
300
Cars $ 1 $300
$2,800
$3,100
$4
700
Cars

Notes9a Students should realizethat the second step inthe diagram shows 10%and 90% of the 6,000 adreaders, not 10% and 90%of the total 15,000 readers.
9b This problem ischallenging. If studentshave difficulty, you mightask, How many customersare there out of how manyreaders? (600 out of 15,000)This answer, 4%, meansthat 4% of the teens whoread the paper are likely tobecome customers. At thispoint you can ask, Whatis another way you couldarrive at the answer of 4%?[10% of 40% is 4%]It is not critical for allstudents to see thisrelationship at this point.
10 This problem is similarto 9, but the tree is morecomplicated.
ExpectationsD
Hands-on Learning
It might be helpful for some students to set up the situation in problem 9using counters. If you start with 150 counters the numbers work out the same,but there is less counting.
Accommodation
Copies of blank trees will be helpful for some students.
Extension
You may want to have students extend the chance tree to show what it willlook like if the ad is run three times. You could also have students drawchance trees for other percents or other numbers of readers.
Reaching All Learners
35 Great Predictions
DExpectations
9. a. Copy the diagram and completeit to show the percent of teens ineach category.
b. What is the chance that a teenreader will become a customer?
?
BecomeCustomers
% %
?
Don’t BecomeCustomers
?
Read the Ad
15,000 Teen Readers
?
Don’t Readthe Ad
% %
Another way to get more customers is to run the ad on twoconsecutive days. The chance that a teen reader will see an ad onthe first day is 40%, and the chance that a teen reader will see anad on the second day is also 40%. In this situation, the chance treelooks like this.
10. a. Copy the chance tree into your notebook and fill in the chancefor each of these events.
b. What are the meanings of boxes B, C, and D?
c. After two days of advertising, how many members of thetarget group can be expected to have read the ad?
d. What is the chance that a member of the target group willbecome a customer?
11. Reflect What other things would you need to know in order toadvise Ms. Lindsay about whether to run the ad twice?
15,000
Teen Readers
Read Ad 1
?
Read Ad 2
?
B
?
C
?
D
?
Don’t
Read Ad 1
?

Section D: Expectations 35T
Hints and CommentsOverviewStudents investigate a diagram representing thesituation involving advertising that was introducedon Student Book page 34. They explore the numberof customers that an ad is expected to generate.
About the Mathematics
The situation studied on this page is similar to thesituation about tolls, but more complex since it isabout combined events: two events that are dependent.Students can use chance trees to model the situation.In this situation, chances and expected value areexplicitly connected through the use of chance treesthat have absolute numbers in them as well. Studentsused chance trees for combined events in the unitSecond Chance. They can use either the multiplicationrule for chances (introduced and used in the unitSecond Chance) or the ratios of the absolute numbersin the trees to find the chances on the differentoutcomes. Students have not yet multiplied chancesthat were expressed as percentages. You may want topay explicit attention to how this should be done byconverting the percentages into decimals or fractionsfirst.
Planning
Students may work on problem 9 and 10 in smallgroups. After students finish problem 10, you maywant to discuss problems 9 and 10 and how to usechance trees. Students may work on problem 11individually.
Comments About the Problems
9. b. Students might use a ratio table to convert theratio into a percent as follows:
Solutions and Samples
9. a.
b. The chance that a teen reader will become acustomer is 600_________
15,000, or 4%.
10. a.
b. Box B represents people who read ad 1 but didnot read ad 2. Box C represents people whoread ad 2 but did not read ad 1. Box D representspeople who did not read any ad.
c. The number of people expected to have readthe ad after two days is 9,600. This is the sum ofthe totals of boxes A, B, and C (2,400 �3,600 �3,600), or all people minus the total of box D(15,000 � 5,400).
d. 6.4%. Strategies may vary. Sample strategies:
• Ten percent of the 9,600 people who read thead are expected to become customers, this is960 customers; The chance of a readerbecoming a customer thus is 960________
15,000 � 0.064� 6.4%.
• Students may also solve this problem byadding a row to the chance tree, calculating10% of boxes A, B, and C, and then addingthose numbers (although this is more tediousthen the first method described) and use theratio of the number of customers to allreaders to find the chance.
11. Answers will vary. Sample response:
If Ms. Lindsay runs the ad twice, she is expectedto get more customers: 960 instead of 600.She could also consider, however, the costs ofadvertising. The effect of rerunning the addecreases over time.
BecomeCustomers
% %
Don’t BecomeCustomers
Read the Ad
15,000 Teen Readers
Don’t Readthe Ad
% %40
10 90
60
6,000
600
9,000
5,400
15,000
Teen Readers
Read Ad 1
Read Ad 2 B C D
Don’t
Read Ad 1
40%
40% 60% 40% 60%
60%
6,000
2,400 3,600 3,600 5,400
9,000
Don’t Read Ad 2 Don’t Read Ad 2Read Ad 2
Customers
Readers
600
15,000
6
150
12
300
4
100

Notes
13b There are severalways to approach findingthe answer to thisproblem. Encouragestudents to think abouthow many mayflies live fora certain amount of time.They can then use thisinformation to think aboutthe expected value.
ExpectationsD
Intervention
Some students may need more direction in a way to find the expected lifespan of mayflies. These students could start by thinking about theprobability that a fly would live 6 hours [100%], then 7 hours and so on.
Extension
Students could find the free-throw percentage for different players in theWNBA or the NBA.
Reaching All LearnersAssessment Pyramid
14ab
Reason about likely andunlikely samples and factorsthat can bias a survey. Makedecisions using probabilityand expected values.
36 Great Predictions
For a science project, a group of students hatched 1,000 mayfliesand carefully observed them. After six hours, all of the mayflieswere alive, but then 150 died in the next hour.
ExpectationsD
Number Still Alive
Hours 6 7 8 9 10 11 12
1,000 850 600 250 100 20 0
Expected Life of a Mayfly
12. Based on the data in the table, write two statements aboutthe life span of mayflies.
13 a. Based on these data, what is the chance that a mayflylives 8 hours or more?
b. Use the students’ data to determine the expected lifespan of a randomly chosen mayfly. Explain how youfound your answer.
Think about how long people live.
14. a. Reflect Why would an expected value be useful?
b. How could sampling affect the expected value?
Free Throws
Mark is on a basketball team. He is a verygood free-throw shooter with an averageof 70%. This means that on average he willmake 70% of the free throws he takes. Youcan also say that his chance of making afree throw is 70%.
15. If Mark takes 50 free throws, howmany of these do you expect hewill miss?
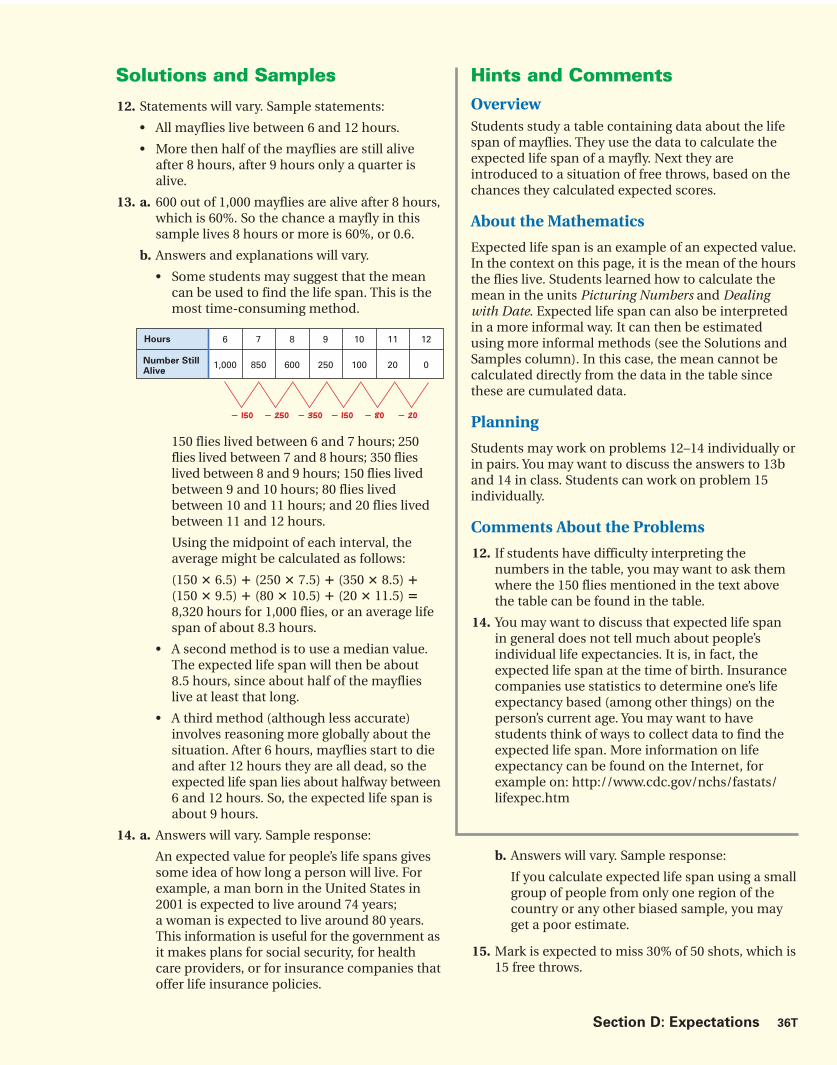
Section D: Expectations 36T
b. Answers will vary. Sample response:
If you calculate expected life span using a smallgroup of people from only one region of thecountry or any other biased sample, you mayget a poor estimate.
15. Mark is expected to miss 30% of 50 shots, which is15 free throws.
Solutions and Samples
12. Statements will vary. Sample statements:
• All mayflies live between 6 and 12 hours.
• More then half of the mayflies are still aliveafter 8 hours, after 9 hours only a quarter isalive.
13. a. 600 out of 1,000 mayflies are alive after 8 hours,which is 60%. So the chance a mayfly in thissample lives 8 hours or more is 60%, or 0.6.
b. Answers and explanations will vary.
• Some students may suggest that the meancan be used to find the life span. This is themost time-consuming method.
150 flies lived between 6 and 7 hours; 250flies lived between 7 and 8 hours; 350 flieslived between 8 and 9 hours; 150 flies livedbetween 9 and 10 hours; 80 flies livedbetween 10 and 11 hours; and 20 flies livedbetween 11 and 12 hours.
Using the midpoint of each interval, theaverage might be calculated as follows:
(150 � 6.5) � (250 � 7.5) � (350 � 8.5) �(150 � 9.5) � (80 � 10.5) � (20 � 11.5) �8,320 hours for 1,000 flies, or an average lifespan of about 8.3 hours.
• A second method is to use a median value.The expected life span will then be about8.5 hours, since about half of the mayflieslive at least that long.
• A third method (although less accurate)involves reasoning more globally about thesituation. After 6 hours, mayflies start to dieand after 12 hours they are all dead, so theexpected life span lies about halfway between6 and 12 hours. So, the expected life span isabout 9 hours.
14. a. Answers will vary. Sample response:
An expected value for people’s life spans givessome idea of how long a person will live. Forexample, a man born in the United States in2001 is expected to live around 74 years;a woman is expected to live around 80 years.This information is useful for the government asit makes plans for social security, for healthcare providers, or for insurance companies thatoffer life insurance policies.
Number StillAlive
Hours 6 7 8 9 10 11 12
1,000 850 600 250 100 20 0
� 150 � 250 � 350 � 150 � 80 � 20
Hints and CommentsOverviewStudents study a table containing data about the lifespan of mayflies. They use the data to calculate theexpected life span of a mayfly. Next they areintroduced to a situation of free throws, based on thechances they calculated expected scores.
About the Mathematics
Expected life span is an example of an expected value.In the context on this page, it is the mean of the hoursthe flies live. Students learned how to calculate themean in the units Picturing Numbers and Dealingwith Date. Expected life span can also be interpretedin a more informal way. It can then be estimatedusing more informal methods (see the Solutions andSamples column). In this case, the mean cannot becalculated directly from the data in the table sincethese are cumulated data.
Planning
Students may work on problems 12–14 individually orin pairs. You may want to discuss the answers to 13band 14 in class. Students can work on problem 15individually.
Comments About the Problems
12. If students have difficulty interpreting thenumbers in the table, you may want to ask themwhere the 150 flies mentioned in the text abovethe table can be found in the table.
14. You may want to discuss that expected life spanin general does not tell much about people’sindividual life expectancies. It is, in fact, theexpected life span at the time of birth. Insurancecompanies use statistics to determine one’s lifeexpectancy based (among other things) on theperson’s current age. You may want to havestudents think of ways to collect data to find theexpected life span. More information on lifeexpectancy can be found on the Internet, forexample on: http://www.cdc.gov/nchs/fastats/lifexpec.htm

Notes
16b Be sure studentsrealize that there are twodifferent ways to score onepoint.
17 It can help to add a rowfor score points to each ofthe boxes in the bottomrow. Note that one shotmade is counted as onepoint.
18 Note that the treehas only a second set ofbranches if the first shotis made. Otherwise theplayer will not get asecond free throw. Thetree is not symmetrical.Still per event in the tree,all percents or chanceswith the branches mustadd up to 100% or to 1.
ExpectationsD
Extension
Have students figure out the expected points per two-point free-throwbonus attempt for a player with a different free-throw percentage andcompare that to the expected points per free-throw attempt in a one-and-one situation.
Reaching All LearnersAssessment Pyramid
17b
17a
Make decisions usingprobability and expectedvalues. Use chance trees tofind probability.
37 Great Predictions
DExpectations
Basketball games have different free-throw shooting situations. In aone-and-one situation, a player can take the second free throw shotonly if the player made the first one. In the two-point free-throwsituation, the player can take two free throws regardless of whetherthe first shot is made.
Mark is often in the two-point free throw situation. This means thathe can take two shots. Suppose during a series of games, he will bein 100 two-point free-throw situations.
16. a. Copy the chance tree for Mark in the two-point free-throwsituation and complete it.
100 two-point
free throws
70%
70%70%
30%
First shot
Secondshot
30%30%
2nd shot made 2nd shot made2nd shot missed 2nd shot missed
1st shot missed1st shot made
b. In how many of the 100 times Mark takes two-point freethrows do you expect he will score one point?
c. What is the chance that Mark will score two points in atwo-point free-throw situation?
17. a. Use the chance tree to calculate how many points Markis expected to score in 100 two-point free-throw situations.
b. What is his expected score per two-point free-throw situation?
The other free throw situation is the one-and-one situation. A playercan try one free throw. If the player makes this shot, the player gets totry a second one. If the player misses the first shot, no second one isallowed. In this situation, Mark still has a 70% free throw average.
18. a. Make a chance tree for Mark in a one-and-one free-throwsituation. Suppose again that he was going to shoot 100one-and-one free throws.
b. What is the average score you expect Mark to make in aone-and-one free-throw situation? Show how you foundyour answer.

Section D: Expectations 37T
Hints and CommentsOverviewStudents investigate the expected scores for two free-throw situations in basketball for a player whosechance of scoring is known.
About the Mathematics
In the case of sports, statistics are often used toindicate how well players perform. A free-throwaverage of 70% means that a player is, on average,expected to score in 70% of free throws taken. His orher expected score can be said to be 0.7 per throw.Another way of expressing what the 70% means issaying that the chance a player scores on each throwis 70%. These different meanings of 70% are connectedhere. Chance trees are once again used to calculatechances on combined events as well as to calculateexpected values.
Planning
Students may work on problems 16–18 individually orin pairs. You may want to have a class discussion firston the rules for basketball.
Comments About the Solutions
16. You may have students look back to the chancetree for problem 10 on Student Book page 35.
17. b. You may want to discuss with students whatthe expected score per free throw means. It isnot an actual score the player can make eachtime. It is in fact a chance or an average over alarger number of situations; it can be used topredict expected scores or to compare theability of different players.
Solutions and Samples
16. a.
b. Mark scores one point if he misses one shotand makes one. This is the case in 21 � 21 � 42situations out of 100.
c. The chance he scores two points is 49 out of100 or 49%.
17. a. He is expected to score 2 points 49 times;1 point 21 � 21 or 42 times; and 0 points 9 times.This is a total of 140 points in 100 shots.
b. His expected score is 140____100 or 1.4 points.
18. a.
b. Now you expect Mark to score 2 points in 49out of 100 cases, to score 1 point in 21 out of100 cases, and to score 0 points in 30 out of100 cases. So in 100 one-and-one bonussituations, you expect Mark to score a total of49 � 2 � 21 � 119 points. So Mark’s expectedaverage score is 1.19 points.
100 two-point
free throws
70%
70%70%
30%
First shot
Secondshot
30%30%
2nd shot made 2nd shot made2nd shot missed 2nd shot missed
1st shot missed1st shot made
70 30
49 21 21 9
100
one-and-one
free throws
70%
70%
30%
30%
2nd shot made 2nd shot missed
1st shot missed1st shot made
70 30
49 21

Notes
Be sure that students areclear about how the chancetree is used to find theexpected value.
1 If different studentsbegin with differentnumbers of cars, they cancompare their results tocheck their thinking forpart d.
ExpectationsD
Parent Involvement
Have students share the Summary and their work at home. Students couldask their parents about any situations where they know that the expectedvalue is used. Parents may have examples when the true results were quitedifferent from the expected value.
Reaching All LearnersAssessment Pyramid
1d
1abc
Assesses Section D Goals
38 Great Predictions
Expectations
In this section, you investigated expected values.
To find the expected value of an event, you need to know the chanceassociated with the possible outcomes.
A chance tree shows the chance for each outcome. Note that chancecan be expressed as a percent or as a fraction.
You can use a chance tree to find expected values.
D
100 two-point
free throws
70%
70%70%
30%
First shot
Secondshot
30%30%
2nd shot made 2nd shot made2nd shot missed 2nd shot missed
1st shot missed1st shot made
On a toll road around the city, 25% of the cars are expected to use thecarpool lane. The toll is $3.00 for a car in the regular lanes and $1 per car inthe carpool lane.
1. a. Make a chance tree for this situation. Use any number of cars youlike.
b. How much money would be collected in the situation you made forpart a?
c. What is the average toll charge per car on this toll road?
d. If you start your chance tree in part a with a different number ofcars, would your answer for part c change? Explain your thinking.

Section D: Expectations 38T
Hints and CommentsOverviewStudents read the Summary, which reviews the maintopics covered in this section. In Check your Work,students assess themselves on the concepts and skillsfrom this section. Students can check their answerson Student Book pages 61 and 62.
Planning
After students finish Section D, you may assign ashomework appropriate activities from the AdditionalPractice section, located on Student Book pages 53and 54.
Solutions and SamplesAnswers to Check Your Work
1. a The chance tree you made for this situationmay look like this.
Since you could choose a number of cars tostart with, you may have chosen anothernumber. Your percentages should be the samebecause they do not depend on the number ofcars but only on the fraction.
b. In the situation for part a, 750 � $3.00 � 250 �$1.00 � $2,500, so $2,500 in tolls is collected. Ifyou used different numbers, your toll will bedifferent as well.
c. The average amount that a car on this toll roadpays is $2,500___________
1000 � $2.50 per car. If you used adifferent number of cars, this amount will bethe same.
d. No, the answer for part c will not change if thenumber of cars is different. For example, ifthere were 500 cars, the toll collected would be375 � $3 � 125 � $1 � $1,250. This is $1,250_______ ____
500 �
$2.50 per car. The average toll per car willalways be the same because the toll per cardepends on the percentage of cars for eachoption, which stays the same.
High toll75%
Low toll25%
750 cars
250 cars
1000 cars

Notes3 This problem is similarto the mayfly problem.Have students think abouta variety of ways toapproach the problem inorder to find the expectedwait time.
ExpectationsD
Parent Involvement
Students should share their work on For Further Reflection with whoeverthey wrote it for. They could report back to the class on how well they wereable to explain the concept.
Reaching All LearnersAssessment Pyramid
FFR
3d
2ab, 3abc
Assesses Section D Goals
39 Great Predictions
2. Brenda is a basketball player. She isan 80% free-throw shooter.
a. Make a chance tree to show howBrenda is expected to score in100 two-point free-throw situations.
b. What is the chance Brenda willscore two points in a two-pointfree-throw situation?
Write an explanation of expected value for someone in your family.Use examples to help the person understand what it is and how itmight be used.
Waiting Time (in minutes)
Number of Customers
0
24
1
16
2
9
3
7
4
6
6
8
7
8
8
11
9
9
10
2
3. The table contains data on how long customers have to wait inline for the bank teller. These data were collected from a sampleof 100 customers.
a. Based on the data, what is the chance a customer will have towait in line?
b. What is the chance that a customer must wait at least 6 minutes?
c. Use the data to calculate the expected waiting time percustomer.
d. Is knowing the “expected waiting time per customer” useful?Why or why not?

Section D: Expectations 39T
Hints and CommentsOverviewStudents complete the Check Your Work problemsfrom this section. Students can check their answerson Student Book pages 61 and 62. They reflect on thetopics addressed in this section in the For FurtherReflection problem.
Planning
After students finish Section D, you may assign ashomework appropriate activities from the AdditionalPractice section, located on Student Book pages 53and 54.
Solutions and Samples
2. a See chance tree.
b. The chance Brenda will score two points in atwo-point free-throw situation is 64 out of 100,which is 64%.
3. a. To compute the chance a customer will haveto wait in line, the number of customers whohave to wait in line longer than 0 minutes willbe 100 � 24 or 76 customers, which is a 76%chance.
b. The chance that a customer must wait at least6 minutes is (8 � 8 � 11 � 9 � 2)/100, whichis 38%.
c. All 100 customers together waited 1 � 16 � 2 �9 � 3 � 7 � 4 � 6 � 6 � 8 � 7 � 8 � 8 � 11 � 9� 9 � 10 � 2 � 372 minutes. This is 3.72 minutesexpected waiting time per customer.
d. Knowing the “expected waiting time percustomer” can be useful if you want to have aone-number indication of how long peoplemust wait. Bank managers are interested inserving their customers by trying to reducewaiting time but do not want tellers withnothing to do. It might be more useful incombination with measures of spread thatwould give an indication of how the wait timemight vary for different customers. The shortestand longest waiting times might also be usefulinformation.
For Further Reflection
Answers will vary. Sample answer:
Expected value is a kind of mean. If for example youknow the chances of certain outcomes, like the chanceson paying high toll and on paying low toll for cars,the expected amount of toll per car can be calculated.
First, the total expected toll for all cars can becalculated. From that, it is easy to calculate theexpected toll that will be paid per car. Expected valueis not an actual value that happens; no car will exactly
201st shot missed
100two-point free-throw
situations
16 made 4 missed
801st shot made
16 missed
80% 20%
64 made
80% 20% 20%80%
First shot
Second shot
pay the expected value of toll. Each car either pays thehigh toll or low toll, and the expected value is takenover a larger number of cars. It can still be a usefulvalue to compare or to predict.
Different toll situations can be compared by comparingthe expected values for the tolls. You can use expectedvalue in many situations, such as life expectancy,sports, and so on. The expected score a person willmake is based on his or her “scoring average.”

40A Great Predictions Teachers Matter
Teachers MatterE
Section Focus
In this section students investigate situations in which two events occurand the chance of each event is known. They use diagrams, area models,and chance trees to investigate both dependent and independent events.Students calculate chances for combined events. The multiplication rulefor chance is formalized. This section reviews topics addressed in theunit Second Chance and in previous sections of this unit.
Pacing and Planning
Day 16: Free Meal Student pages 40–42
INTRODUCTION Problem 1 Use fractions to estimate the probabilityof getting a free hot dog and free drinkat a school event.
CLASSWORK Problems 2–7 Conduct a simulation and use the resultsto estimate the probability of getting afree hot dog and free drink at a schoolevent.
HOMEWORK Problem 8 Use a chance tree to calculate the numberof students getting a free hot dog and freedrink at a school event.
Day 17: Free Meal (Continued) Student pages 43–45
INTRODUCTION Review homework. Review homework from Day 16.
CLASSWORK Problems 9–12 Use an area model to determine theprobability of getting a free hot dogat a school event and to justify themultiplication rule for the probabilitiesof combined events.
HOMEWORK Problem 13 Solve a problem where the fractions arenot multiplied to determine the answer.
Day 18: Delayed Luggage Student pages 45–49
INTRODUCTION Review homework. Review homework from Day 17.
CLASSWORK Problems 14–18 Solve a probability and expected valueproblem involving the possibility of havingdelayed luggage on an airplane flight.
HOMEWORK Check Your Work Find the chance for combined eventsFor Further Reflection using an area model.
Additional Resources: Additional Practice, Section E, Student Book page 54

Teachers Matter Section E: Combining Situations 40B
Teachers Matter E
Materials
Student ResourcesNo resources required
Teachers ResourcesNo resources required
Student MaterialsQuantities listed are per student.
• Two different-colored number cubes
* See Hints and Comments for optional materials.
Learning LinesCombined Events
Students continue the study of chances incombined event situations that they began in theunit Second Chance. They compare experimentalchances for the combined event of getting a freedrink and/or a free hot dog to the theoreticalchance. They explore more complex situationsusing chance trees and area models. Themultiplication rule for chances is formalized.Students find out that this rule will not alwayswork, such as in the case of dependent events.
Models and Strategies
Students can structure multi-event situationsby using a chance tree or an area model. Thesemodels were introduced and used in the unitSecond Chance.
In the illustration at the bottom left, the area ofthe whole rectangle in the area model represents achance of 1 as well as the total number of shirtsthat the problem is about (in this example 144).The area of each of the four parts into which therectangle is divided represents the chance for thedifferent combined outcomes. The chances ofthese outcomes can be found in two ways. Forexample, the chance of the combined event thata randomly chosen shirt is a T-shirt with a logo is24 out of 144 (using the absolute numbers of smallsquares), which is 1__
6 . Or it can be said to be 1__4 � 2__
3(using the chances, the fractional parts), which isalso 1__
6 .
Using the chance tree, a similar method can beused: calculating with the absolute numbers in theboxes or using the chances along the branches.For both models, when using the chances insteadof the absolute numbers, the multiplication rulefor chances is applied. Students discover that thisrule can be used only if the events are (or can bemade) independent.
At the End of This Section:Learning Outcomes
Students can calculate chances in multi-eventsituations using chance trees or an area model.The multiplication rule for chances (forindependent events) is formalized in this unit.
T-Shirt Tank Top
No Logo
With Logo
1 3
2 3
34
14

Notes
2 This problem is intendedto be students’ firstimpressions. However,you may want to brieflydiscuss the different waysthat the chance could beexpressed: percents,fractions, decimals, andproportions.
CombiningSituations
E
Intervention
If students think the probability is 1__4 because there are four outcomes, you
might want to begin to draw a tree to show the possibilities. You could alsorefer back to the two-point free-throw problem where the chance of makingeach shot made quite a difference on the expected value.
Reaching All Learners
40 Great Predictions
The eighth graders at Takadona Middle School are organizing a FunNight for all students in grades 7 and 8. There will be games, movies,and food for the students to enjoy. Each student who comes to FunNight will receive one red coupon and one green coupon. Some ofthe red coupons will have a star, which can be turned in for a free hotdog. Similarly, some of the green coupons will have a star, which isgood for a free drink. If a coupon does not have a star, it is good for adiscount on a food or drink purchase.
ECombining Situations
Free Meal
The organizers want to give away enough coupons with stars onthem so that the chance that a student will get a free hot dog is 1��6,and the chance a student will get a free drink is 1��2.
1. Choose a number of coupons you would make. How many wouldbe red, green, with star, and without star to make these chanceshappen?
Before the coupons are made, the mathematics teacher asks the classto find the chance that a student will get both a free hot dog and afree drink.
2. What do you think the chance of getting both will be?

Section E: Combining Situations 40T
Hints and CommentsOverviewStudents are introduced to the context of a Fun Nightat a middle school. Students guess the chance that astudent at Fun Night will receive coupons for both afree hot dog and a free drink.
About the Mathematics
Students were introduced to probability representedas a fraction in the unit Take a Chance, and theyworked with chances as fractions in the unit SecondChance . They usually used fractions in chance treesin that unit. Students revisit the situation of combinedevents, either events in a sequence or simultaneousevents. They were introduced to the use of chancetrees and an area model to calculate chances oncombined events in the unit Second Chance. This isrevisited and expanded in this section.
Planning
Students may work on problem 1 individually; youmay want to discuss students’ choices in a whole-class discussion. Problem 2 can be done n the sameway.
Comments About the Solutions
1. In this problem, students reason from a chance toan actual number of favorable and possibleoutcomes to find this chance. Be sure thefractional parts are calculated correctly. You maywant to discuss what numbers are easy and why.
2. Students have calculated chances for combinedevents in the unit Second Chance. They usedchance trees and the area model to help themstructure the situation and calculate the chances.They also used the rule for multiplication ofchances. Students may find the correct answer byusing the numbers of coupons they suggested forproblem 1 and calculating the chance as the ratioof favorable outcomes to the total number ofoutcomes.
Solutions and Samples
1. Answers will vary depending on what number ofvisitors the students expect. Sample answer:
I choose to make 300 coupons. Since each studentwill get one red and one green coupon, they couldmake 150 red and 150 green. 1__
6 of the 150 redones, 25 coupons, will have a star. 1__
2 of the 150green ones, 75 coupons will have a star.
2. Answers may vary, but the correct answer is about8%. Sample strategy multiplying the chances:1__2 � 1__
6 � 1___12 , or 8%.

Notes
3 Be sure students agreewithin each group on whatdifferent results on thenumber cubes will mean interms of the free food.
4 It is critical that studentshave a chart that will beefficient to use before theystart the activity. Studentsmay be tempted to recordonly “yes, both free” and“no, they were not.”These answers will notgive students the data theywill need to answer someof the later questions.
6 Students may have toconvert their answers tothe same form, decimals,percents, fractions, orratios, to makecomparisons.
CombiningSituations
E
Accommodation
It may be necessary to provide a ready-made chart for problem 4 for somestudents. It may also make sense to have some students only do 50 or even25 pairs and then combine the information.
Reaching All LearnersAssessment Pyramid
5abc
Use simulation andmodeling to investigateprobability.
41 Great Predictions
It is possible to do a simulation to estimate the chance that a studentgets both a free hot dog and a free drink. Instead of actually makingcoupons and handing them out, the class decides to use two differentcolored number cubes: a red one and a green one.
Each roll of the number cubes generates a pair of numbers. Theoutcome of the red number cube is for the red coupons; the outcomeof the green one is for the green coupons.
3. Describe how the outcomes of the number cubes can representthe stars for a free meal and a free drink.
You are going to generate 100 pairs of numbers with the two numbercubes to simulate 100 students arriving at Fun Night.
4. Design a chart that will make it easy to record the results. Thechart should show clearly what each student gets: a free hot dog,a free drink, both, or none.
ECombining Situations
Use the two different colored number cubes and the chart youdesigned in problem 4.
Try a few rolls with the number cubes to make sure that yourchart works.
Generate 100 pairs of numbers with the number cubes andrecord the results in your chart. Every possible pair of outcomeson the number cubes should fall into one of the possibilities onyour chart.
5. Use your simulation results to estimate:
a. the chance that a student gets a free hot dog;
b. the chance that a student gets a free drink; and
c. the chance that a student gets a free hot dog and a free drink.
6. How close was your answer to problem 2 to the results of thesimulation?

Section E: Combining Situations 41T
Hints and CommentsMaterialsTwo different-colored number cubes one pair perstudent;graphing calculators or other random-numbergenerator, optional (one per group of students)
Overview
Students design an experiment using number cubes tosimulate the situation of giving away free drinks andfree hot dogs. They investigate the chances of thedifferent outcomes.
About the Mathematics
The advantage of a simulation is that data can beobtained without doing the real experiment. Rollingnumber cubes helps to make the simulation occur asit would in real life (assuming that in real life thingsalso happen randomly). Designing and organizing thesimulation and using diagrams and charts to collectand represent the data are essential if you want tomake predictions about the situation. They haveused simulations in the units Insights into Data andSecond Chance. The chances based on data from anexperiment are called experimental or empiricalchances; calculated chances are called theoreticalchances. If a simulation is done a large number oftimes, the experimental probabilities (relativefrequencies of the outcomes) will approach thetheoretical chances.
Planning
Students may work on problems 3 and 4 in pairs orsmall groups. Discuss students’ answers to theseproblems in class to make sure all students use a correctsimulation and have a chart that can be used to recordthe results. Students can then work in pairs on theActivity and problems 5 and 6.
Comments About the Solutions
Activity
The colors of the number cubes are not important,but two different colors are needed to distinguish theoutcomes. Instead of using number cubes, pairs ofrandom numbers from 1–6 can be generated using agraphing calculator. You can have each studentgenerate 100 outcomes; you may also split the 100outcomes over two or four students in a group.Encourage students to code their results and recordthe code rather than trying to remember whatnumber they used to represent what outcome.
5. Students can find the chance of each outcome asthe relative frequencies of that outcome; they didthis in the unit Second Chance.
Solutions and Samples
3. Answers will vary. A sample answer:For the green number cube, the chance of astar/free drink must be 1__
2 , so three numbers onthe green number cube must represent thischance. For instance the numbers 1, 2, and 3 canrepresent the chance of a free drink. For the redcoupons, the chance of a star (free hot dog) mustbe 1__
6 , so one of the numbers on the red numbercube, for instance the 1, can represent a star.
4. Charts will vary. Sample chart, with a sample setof simulation results:
5. Answers will vary. Sample responses using thechart from problem 4:
a. The frequency of getting a free hot dog(number of favorable outcomes) is the sum ofthe first two rows: 19.
So the chance of getting a free hot dog basedon these results is 19____
100 .
b. The frequency of getting a free drink (numberof favorable outcomes) is the total of the firstand third rows, 39 � 11, or 50. The chance ofgetting a free drink based on these results is 50____
100 ,or 1__
2 .
c. The frequency of getting both a free hot dogand a free drink is found in row 1; it is 11.The chance of getting both a free hot dog anda free drink is 11____
100 .
6. Answers will vary, depending on the answer toproblem 5. Sample answer:
The chance calculated for problem 2 was 1 out of12 or 8%. The chance found in the simulation was11 out of 100 or 11%. These chances are close butdifferent.
1
2, 3, 4, 5, or 6
1, 2, or 3
4, 5, or 6
1, 2, or 3
free hot dogand free drink
free hot dogonly
1
11
8
2, 3, 4, 5, or 6 4, 5, or 6
free drinkonly
nothing free
39
42
Meaning FrequencyFirst Cube
(Red)
Second Cube
(Green)Total
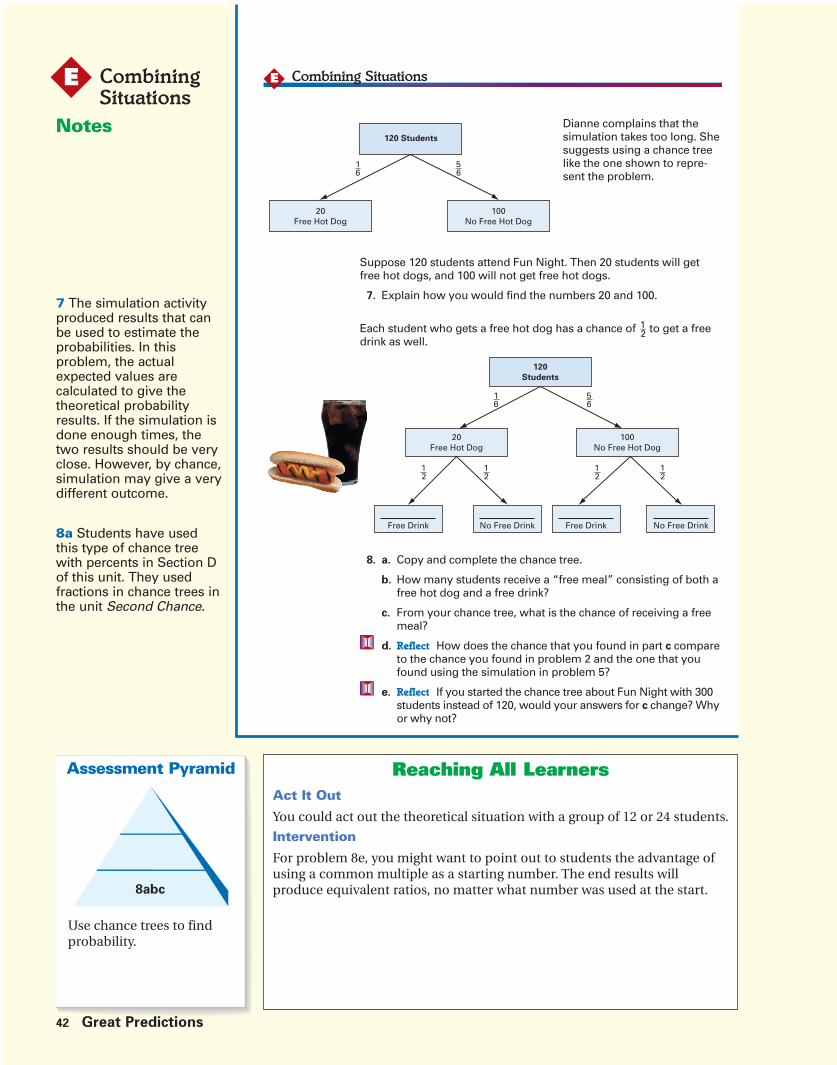
Notes
7 The simulation activityproduced results that canbe used to estimate theprobabilities. In thisproblem, the actualexpected values arecalculated to give thetheoretical probabilityresults. If the simulation isdone enough times, thetwo results should be veryclose. However, by chance,simulation may give a verydifferent outcome.
8a Students have usedthis type of chance treewith percents in Section Dof this unit. They usedfractions in chance trees inthe unit Second Chance.
CombiningSituations
E
Act It Out
You could act out the theoretical situation with a group of 12 or 24 students.
Intervention
For problem 8e, you might want to point out to students the advantage ofusing a common multiple as a starting number. The end results willproduce equivalent ratios, no matter what number was used at the start.
Reaching All LearnersAssessment Pyramid
8abc
Use chance trees to findprobability.
42 Great Predictions
8. a. Copy and complete the chance tree.
b. How many students receive a “free meal” consisting of both afree hot dog and a free drink?
c. From your chance tree, what is the chance of receiving a freemeal?
d. Reflect How does the chance that you found in part c compareto the chance you found in problem 2 and the one that youfound using the simulation in problem 5?
e. Reflect If you started the chance tree about Fun Night with 300students instead of 120, would your answers for c change? Whyor why not?
Combining SituationsE
120 Students
20Free Hot Dog
100No Free Hot Dog
5 6
1 6
120
Students
20Free Hot Dog
100No Free Hot Dog
Free Drink Free DrinkNo Free Drink No Free Drink
1 2
1 2
1 2
5 6
1 6
1 2
Dianne complains that thesimulation takes too long. Shesuggests using a chance treelike the one shown to repre-sent the problem.
Suppose 120 students attend Fun Night. Then 20 students will getfree hot dogs, and 100 will not get free hot dogs.
7. Explain how you would find the numbers 20 and 100.
Each student who gets a free hot dog has a chance of 1��2 to get a freedrink as well.

Section E: Combining Situations 42T
Hints and CommentsOverviewStudents use chance trees to calculate the theoreticalchance for getting a free hot dog or a free drink.
About the Mathematics
On the previous page, Student Book page 41, studentsdesigned a simulation to get data that could be usedto estimate chances. This is called experimental orempirical probability. Another way to find the chancesis through reasoning (using theoretical probability),without doing a simulation or experiment. Students doso on this page, where they use a chance tree tocalculate the chances for combined events,two outcomes both occurring. The chances foundboth ways are compared, and students reason aboutthe differences they found.
Planning
Students may work on problems 7 and 8 individuallyor in pairs.
Comments About the Solutions
7. The numbers 20 and 100 are the expected numbersof students to receive a free hot dog or not, basedon the theoretical chances.
8. d. On the previous page students used a simulationto estimate the chances on a free drink, a freehot dog, both, or neither. In part c, thetheoretical chance on the combined outcome iscalculated. If the simulation is done enoughtimes, the two results should be very close.However, by chance, due to variation in theoutcomes, simulations may give very differentchances.
e. Be sure students understand the significance ofusing a common multiple as a starting number.The end results will produce equivalent ratiosno matter what number was used at the start.The chances are the relative frequencies, theyonly depend on the fractions (chances) usedwith the branches in the tree. Some studentsmay remember that they can also find thechances without using a starting number.
Solutions and Samples
7. 20 is 1__6 of 120, and 100 is 120�20, which can also
be found as 5__6 of 120.
8. a.
b. According to the diagram, 10 students willreceive a free hot dog and a free drink.
c. The chance of receiving a free meal is 10____120 , or 1___
12 .
d. Answers will vary. Sample answer:
In problem 5, the simulated response was an11____
100 or 11% (experimental) chance on a freemeal; using the diagram, the theoretical chancewas 1___
12 or 8%. This was the same as in problem2.
e. No, this will make no difference in the chance.Now 50 students will receive a free hot dog,and of these, half or 25 students will alsoreceive a free drink. So the chance is 25____
300 � 1___12 ,
which is 8%. This is the same. Because thefractions have the same value, the chance willalso be the same.
120
Students
20Free Hot Dog
100No Free Hot Dog
Free Drink Free DrinkNo Free Drink No Free Drink
1 2
1 2
1 2
5 6
1 6
1 2
10 10 50 50

Notes
You may also advise somestudents to make a chancetree and see if they can finda number that will workthere. If students chose 120because this was usedbefore, ask them if theyknow a smaller numberthat will also work.
9 Students may have seenan area model before andmay realize that the processhere is multiplication.
10 This problem providesa chance for students totry the technique again.Be sure that they approachpart a carefully sincechoosing a number that isnot a common multiple of8 and 3 will make theproblem much moredifficult.
CombiningSituations
E
Accommodation
Providing a copy of chart iii may be helpful for some students rather thanhaving them copy the whole thing. For others, providing graph paper maybe sufficient.
Reaching All LearnersAssessment Pyramid
10ab
Use area models to findprobability.
43 Great Predictions
ECombining Situations
10
12
i. ii. iii.16
56
16
56
12
12
9. a. How many students does each diagram represent? Why doyou think this number is chosen?
b. What do grids ii and iii show in terms of the tickets forFun Night?
c. Copy grid iii into your notebook and shade the portion of thediagram that represents the students who get a free meal.
d. How do the diagrams help you find the fractional part of thestudents who get a free meal?
e. How does this help you find the chance of a free meal (hotdogand drink)?
Kiesha wanted to use another model to find the chance. She thoughtan area model might work. This is the series of drawings Kiesha madefor the situation on Fun Night.
The organizers of Fun Night are worried about cost. They have decidedto change the number of tickets with stars so that the chance of gettinga free hot dog will be 1��8 and the chance of a free drink will be 1��3 .
10. a. Draw an area model to represent this situation. Think about agood number of small squares to use!
b. Use your area model to find the chance of getting both a freehot dog and free drink in this new situation.

Section E: Combining Situations 43T
Hints and CommentsOverviewStudents use area models to model the situation ofthe free drink and free hot dog at Fun Night. They usethe model to calculate chances on combinedoutcomes.
About the Mathematics
The area model was introduced in the unit SecondChance as a model to find chances for situations withcombined events. The area model has the samenumber of units as a starting number in the chancetree. This area model may also be seen as a concreteversion of the two-way tables and charts used inSection B. Area models were also used in someNumber units to help students visualize themultiplication of fractions.
Planning
Students may work on problems 9 and 10 individuallyor in pairs.
Comments About the Solutions
9. Students must understand how the area model isdivided in two directions to represent the relativefrequencies (chances) of the combinations of theoutcomes for the two events. You may referstudents to other units in which the area modelwas used.
Solutions and Samples
9. a. The diagram represents the 120 students. Eachcell is one student. Reasons may vary. Samplereasons:
• This is the same number used in the chancetree on the previous page.
• It is a number that can be divided in sixthsand in halves.
b. The second grid shows that 1__6 of the students
(left of the vertical line) get a free hot dog,and 5__
6 (right of the line) get no free hot dog.The third grid shows that half of the students(the part above—or under—the horizontal line)get a free drink, and the other half get no freedrink
c. The double shaded part in the lower left corner,represents the students who get a free meal:free drink and free hot dog.
d. You can determine what part of the grid isshaded both times. This part representsstudents who get a free meal. This is 10 out ofthe 120 squares, so it is 10____
120 , or 1___12 .
e. The chance of getting a free meal is the same asthe fractional part found in d, the relativefrequency, so the chance of a free meal is 10____
120,or 1___
12 .
10. a. Sample area model with 24 squares:
b. The chance of getting both a free hot dog and afree drink is 1___
24 .
16
56
16
56
12
12
12
23
13
18
78

Notes
11 This problem givesstudents a chance tocombine what they havelearned and apply thestrategies to a newsituation. Observe thestrategies students use togauge their understandingof the concepts.
12 Students should beable to relate the areamodel to multiplicationand thus understand whymultiplying the chancesmakes sense. Manystudents will haveobserved this prior to thestatement; this problemgives them a chance tojustify it.
CombiningSituations
E
Intervention
Students who are struggling with problem 11 should make a chance tree oran area model first.
Reaching All LearnersAssessment Pyramid
11
Use chance trees, countingstrategies, two-way tables,and rules to find probability.
Use different representationsto describe probability.
44 Great Predictions
Combining SituationsE
One of the events for Fun Night is a student volleyball tournament.The Fun Night Committee plans to give the players on the winningteam shirts donated by the Takadona Sports Apparel Mart.
There will be both tank tops andT-shirts.
Two-thirds (2��3) of all the shirtswill be T-shirts.Logos will be applied randomlyto 1��4 of all shirts.
After the tournament, the winning captaincan pull one shirt out of the box.
11. What is the chance that the shirt willbe a T-shirt with a logo? Show themethod you used to find your answer.
One way to find the chance of an event is to list all the possibleresults and count them, but this is often very time-consuming. Hereis a rule that seems to work: The chance for a combination of twoevents to occur is the chance of the first event times the chance ofthe second event. We can call this a multiplication rule for chance.
12. a. Does the rule work for problems 10 and 11?
b. Reflect How does this rule show up in the chance tree and thearea model?
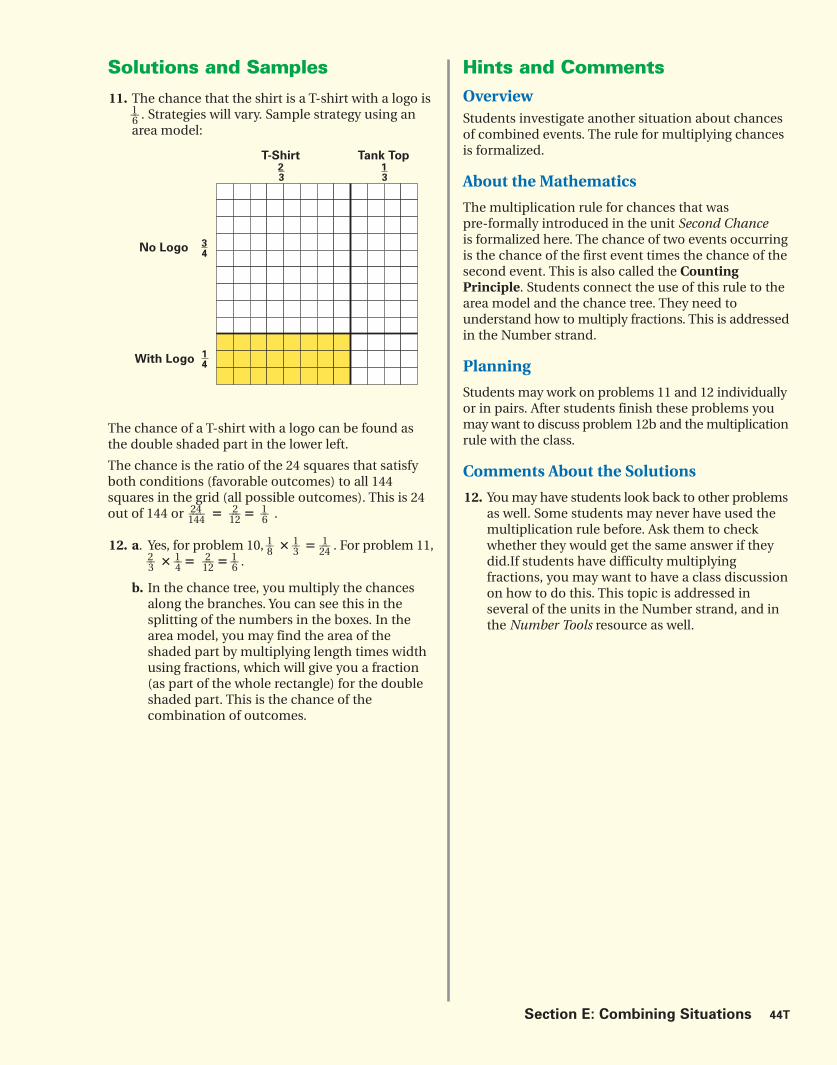
Section E: Combining Situations 44T
Hints and CommentsOverviewStudents investigate another situation about chancesof combined events. The rule for multiplying chancesis formalized.
About the Mathematics
The multiplication rule for chances that waspre-formally introduced in the unit Second Chanceis formalized here. The chance of two events occurringis the chance of the first event times the chance of thesecond event. This is also called the CountingPrinciple. Students connect the use of this rule to thearea model and the chance tree. They need tounderstand how to multiply fractions. This is addressedin the Number strand.
Planning
Students may work on problems 11 and 12 individuallyor in pairs. After students finish these problems youmay want to discuss problem 12b and themultiplicationrule with the class.
Comments About the Solutions
12. Youmay have students look back to other problemsas well. Some students may never have used themultiplication rule before. Ask them to checkwhether they would get the same answer if theydid.If students have difficulty multiplyingfractions, you may want to have a class discussionon how to do this. This topic is addressed inseveral of the units in the Number strand, and inthe Number Tools resource as well.
Solutions and Samples
11. The chance that the shirt is a T-shirt with a logo is1__6 . Strategies will vary. Sample strategy using anarea model:
The chance of a T-shirt with a logo can be found asthe double shaded part in the lower left.
The chance is the ratio of the 24 squares that satisfyboth conditions (favorable outcomes) to all 144squares in the grid (all possible outcomes). This is 24out of 144 or 24____
144 � 2___12 � 1__
6 .
12. a. Yes, for problem 10, 1__8 � 1__3 � 1___
24 . For problem 11,2__3 � 1__
4 � 2___12 � 1__
6 .
b. In the chance tree, you multiply the chancesalong the branches. You can see this in thesplitting of the numbers in the boxes. In thearea model, you may find the area of theshaded part by multiplying length times widthusing fractions, which will give you a fraction(as part of the whole rectangle) for the doubleshaded part. This is the chance of thecombination of outcomes.
T-Shirt Tank Top
No Logo
With Logo
13
23
34
14

Notes
13 The purpose of thisproblem is to show thatthe multiplication rule,discussed on the previouspage, does not work if theevents are connected inany way. In formalprobability language, if theevents are independent,you can multiply theprobabilities. Studentsshould be able to connectthis to their work in theprevious sections.
14 You may want to askstudents to write theprobability using severaldifferent representations.
CombiningSituations
E
Parent Involvement
You could have students ask their relatives or friends whether they haveever lost luggage on a trip. Students can use the data they gather to checkthe information that one out of every 200 pieces of luggage gets lost.Students can also find information on current rates from the U.S. Departmentof Transportation.
Reaching All Learners
45 Great Predictions
Suppose the Takadona Sports Apparel Mart has discovered that thelogos do not fit very well on the tank tops. They realize that they canonly put logos on T-shirts. Two thirds of the shirts will still be T-shirts,and 1–
4 of all of the shirts will still have logos
13. a. Choose a total number of shirts. Make a diagram to show howmany of these are tank tops, how many are T-shirts, and howmany are T-shirts with logos.
b. If you select one of these shirts at random, what is the chancethat it will be a T-shirt with a logo?
c. Does this problem follow the multiplication rule? What makesthis situation different from the situation in problem 11?
Overall, if there is no connection between getting one outcome andgetting the other, then you can use the multiplication rule to find thechance that both events will happen. Otherwise, you have to usesome other method to find the chance, like you did in problem 13.
ECombining Situations
Delayed Luggage
Vernon is planning a trip over winter break. Heis excited about traveling by plane, but he hasheard stories about people’s luggage beingdelayed. He is wondering what the chancesare that he will fly to his vacation spot withouthaving his luggage delayed. Through a littleresearch, he found that about 1 out of every200 pieces of luggage is delayed per flight.
14. What is the chance that a piece of luggagewill arrive on time on a one-way trip?

Section E: Combining Situations 45T
Hints and CommentsOverviewStudents determine how many shirts are T-shirtsand how many T-shirts have logos. They determinethe chance that a T-shirt selected at random will havea logo. Then, they explain why this problem does notfollow the multiplication rule. Next they investigatechances of losing luggage on a flight.
About the Mathematics
Chance trees, area models, and systematic lists of thepossibilities often help students to visualize theproblem situation. When all possibilities are listed, itis not difficult to find the appropriate chances.Because listing the possibilities can be very time-consuming however, it is often faster to use a rule orformula, like the rule for multiplication of chances.However, this rule will not work for dependent events.So it is not very wise to just multiply chances insituations with combined events. Making a drawing ofthe situation before using such a rule will help clarifythe situation and decide whether events may bedependent and how chances must be found.
Planning
Students may work on problem 13 individually.Discuss the answers in class. You may read the textabout lost luggage in class; students can work onproblem 14 individually.
Solutions and Samples
13. a. Answers will vary. Sample answer:
If there are 12 shirts, 8 will be T-shirts since 8 istwo thirds of 12. Because 1__
4 of all the shirtshave logos and the logos can only be on T-shirts,1__4 of the 12 shirts, which is three of the eightT-shirts, will have logos.
This is shown in the chance tree diagram.
b. The chance that the shirt chosen will be a T-shirtwith a logo is 3 out of 12, or 1__
4 .
c. Answers will vary. Sample response:
You cannot multiply 2__3 � 1__
4 to find the correctchance. This can be seen for example in thechance tree. The 1__
4 is at the same “level” in thetree as 2__
3 ; you don’t pass the two fractionswhen you follow the route in the tree.
The situation is different than the one inproblem 11 since there is a connection betweenhaving a logo and a T-shirt. Logos go onT-shirts, so these events are dependent. In theother case, getting a free drink did not have anyconnection to getting a free hot dog.
14. The chance is 199 in 200, or 99.5%.
8 4
T-shirts Tank Tops
Logo No Logo
12
Students13
14
23
3 5

Notes
17 As they think aboutthese problems, studentsmay have ideas aboutsituations in which theprobabilities are added.They may also realize thatit is possible to workbackwards—using thecomplement of an eventto find the probability.
18 The problem can besolved using themultiplication rule, but notin the same way as on theprevious pages. Since thesame piece of luggagecannot get lost on both thefirst and the second flight,it is not possible tocalculate a meaningfulchance by multiplying1/200 by 1/200.
CombiningSituations
E
Intervention
When working with problem 16, students may give a wrong answer, basedjust on what they think. You may ask them to make up numbers for thechances for which both methods will give a different result. You can alsoleave the wrong answers. In problem 17, they will investigate the situationby using a chance tree.
Reaching All LearnersAssessment Pyramid
16,18
Develop and use a criticalattitude toward the use ofprobability.
46 Great Predictions
Vernon wants to find the chance that hisluggage will make it without any delay on atrip that has one layover. (During a layover,people and luggage often change planes.)He decides to use a tree diagram. He beginsby thinking about 1,000 pieces of luggage.
Vernon concludes that, in all, about 990pieces of luggage will make it without anydelay on a trip that has one layover.
15. Explain the numbers in the diagram.Add chances to the branches.
Combining SituationsE
1,000Pieces of Luggage
995On Time
990.025On Time
4.975Delayed
5Delayed
Richard, one of Vernon’s friends, questions his calculations. He pointsout that on the first flight, five pieces of luggage out of a 1,000 will bedelayed. And on the second flight, five pieces out of 1,000 shouldalso be delayed. This means that exactly ten pieces are delayed, so990 pieces of luggage will arrive on time.
While Vernon’s and Richard’s answers are close, their calculations aredifferent.
16. Which method of calculation, Vernon’s or Richard’s, do you thinkis correct?
17. a. To explore the two different methods, use both Vernon’sand Richard’s methods to calculate the number of pieces ofluggage that are not delayed on a trip with one layover if 1 outof every 5 pieces is delayed on every flight. Start your diagramwith 1,000 pieces of luggage.
b. Based on your results, which method do you think is correct?
18. Can you use the multiplication rule to solve Vernon’s problem?Why or why not?

Section E: Combining Situations 46T
Hints and CommentsOverviewStudents continue investigating the chances of losingluggage using several methods.
About the Mathematics
In probability it is very easy to reason in the wrongway. A common mistake is to take the wrong set of allpossible outcomes or, for a sequence of events, toneglect to take into account what happened in thefirst event. If, for example, an event occurs twice, thechance is the second time may be influenced by whathappened the first time. This of course is not alwaysthe case; it is wise to check if the events aredependent. On this page, in the context of delayedluggage, students compare two ways of reasoningabout chances and decide which is the correct way.
Planning
Students may work on problems 15–18 individuallyor in pairs.
Did You Know?
The Bureau of Transportation Statistics (website:http://www.bts.gov/) collects data each month onseveral aspects of travel. One of their subjects ismishandled luggage. Almost every month, an AirTravel Consumer Report is published by The Officeof Aviation Enforcement and Proceedings, AviationConsumer Protection Division, that has a chapterwith statistics of mishandled luggage. These reportscan be found on the Internet.http://airconsumer.ost.dot.gov/reports/index.htm.
Solutions and Samples
15. Explanations will vary. Sample explanation: 995pieces out of 1,000 of the luggage (which is thesame as 199 out of every 200, or 99.5%) will arriveon time, and five pieces out of 1,000 (or 1 out ofevery 200, or 0.5%) will be delayed. I used thesame ratios for the second flight. When 0.5%is taken from 995 pieces of luggage, 990 pieces areleft and 5 are delayed. These numbers should berounded because a fraction of a piece of luggagecannot be delayed. The first two branches have99.5% and 0.5% chances. The second set has thesame.
16. Vernon’s method of calculation is correct. Richard’smethod does not take the five pieces that havealready been delayed into account. Both methodsresult in the same answer in this instance, becauseof the small percentage for delayed luggage andthe rounding that needs to be done, but Richard’smethod will not always work.
17 a. Vernon’s method:
There were 640 pieces of luggage that were notdelayed.
Richard’s method: 200 pieces of luggage weredelayed on the first flight, and 200 were delayedon the second flight. There were 400 pieces ofluggage delayed, so there were 600 that werenot delayed.
b. Vernon’s method: Students should understandthe error in Richard’s method. Richard’smethod assumes that an equal number aredelayed on the second flight, even though thereare fewer bags.
18. You can use the multiplication rule since theevents are independent. The chance that a pieceof luggage will make both trips without any delay
is 199____200 � 199____
20039,601________40,000 � 99%.
1,000Pieces of Luggage
800
Not Delayed
640
Not Delayed
200
Delayed
160
Delayed
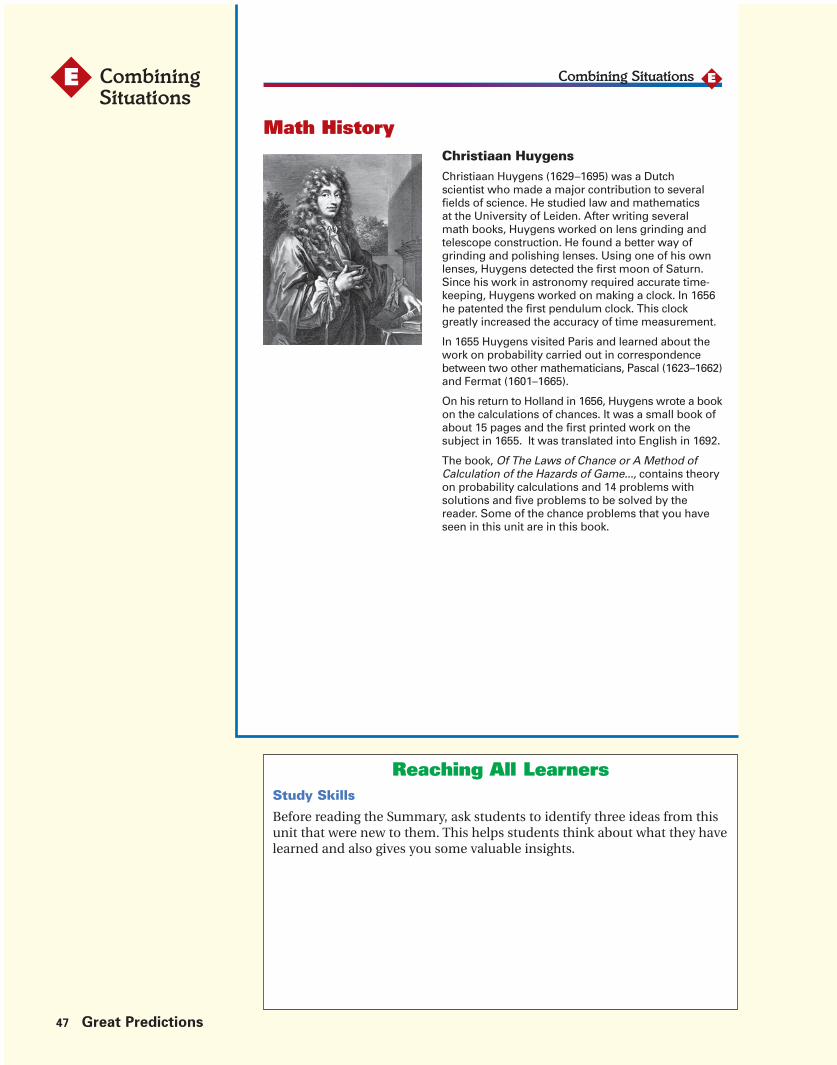
CombiningSituations
E
Study Skills
Before reading the Summary, ask students to identify three ideas from thisunit that were new to them. This helps students think about what they havelearned and also gives you some valuable insights.
Reaching All Learners
47 Great Predictions
Christiaan HuygensChristiaan Huygens (1629–1695) was a Dutchscientist who made a major contribution to severalfields of science. He studied law and mathematicsat the University of Leiden. After writing severalmath books, Huygens worked on lens grinding andtelescope construction. He found a better way ofgrinding and polishing lenses. Using one of his ownlenses, Huygens detected the first moon of Saturn.Since his work in astronomy required accurate time-keeping, Huygens worked on making a clock. In 1656he patented the first pendulum clock. This clockgreatly increased the accuracy of time measurement.
In 1655 Huygens visited Paris and learned about thework on probability carried out in correspondencebetween two other mathematicians, Pascal (1623–1662)and Fermat (1601–1665).
On his return to Holland in 1656, Huygens wrote a bookon the calculations of chances. It was a small book ofabout 15 pages and the first printed work on thesubject in 1655. It was translated into English in 1692.
The book, Of The Laws of Chance or A Method ofCalculation of the Hazards of Game..., contains theoryon probability calculations and 14 problems withsolutions and five problems to be solved by thereader. Some of the chance problems that you haveseen in this unit are in this book.
ECombining Situations
Math History

Section E: Combining Situations 47T
Hints and CommentsOverviewStudents read the Math History. There are noproblems on this page for students to solve.

Notes
At this point, studentsshould be clear about theconnections between thedifferent models and wheneach is appropriate. Spendsome time discussing eachof the models and whichare useful when.
CombiningSituations
E
Parent Involvement
Have students explain the models to their parents.
Reaching All Learners
48 Great Predictions
Combining Situations
In this section, you explored two-event probability problems.Sometimes you can calculate the chance of a combined eventfrom the chances of the underlying events.
To find the chances for two combined events you can use severalmethods:
• a chance tree
• an area model
E
1,200
Students
200Free Hot Dog
1,000No Free Hot Dog
Free Drink Free DrinkNo Free Drink No Free Drink
1 2
1 2
1 2
5 6
1 6
1 2
16
56
12
12
• the multiplication rule
For example: The chance of getting a T-shirt is 2��3, and the chanceof getting a logo is 1��4 , so the chance of a T-shirt with a logo is1��4 � 2��3 , which is 2���12 or 1��6 .
Note that not all three methods can be used in all situations.
If the two events are independent and do not affect each other, suchas putting logos on all of the shirts and being a T-shirt or a tank top,then the chances of each event can be multiplied to find the chancethat both events will occur.
If the two events are dependent, such as putting logos only onT-shirts, then you cannot multiply the two chances but must findanother way to figure the chance that both events will occur.

Section E: Combining Situations 48T
Hints and CommentsOverviewStudents read the Summary, which reviews the maintopics covered in this section. There are no problemson this page for students to solve.
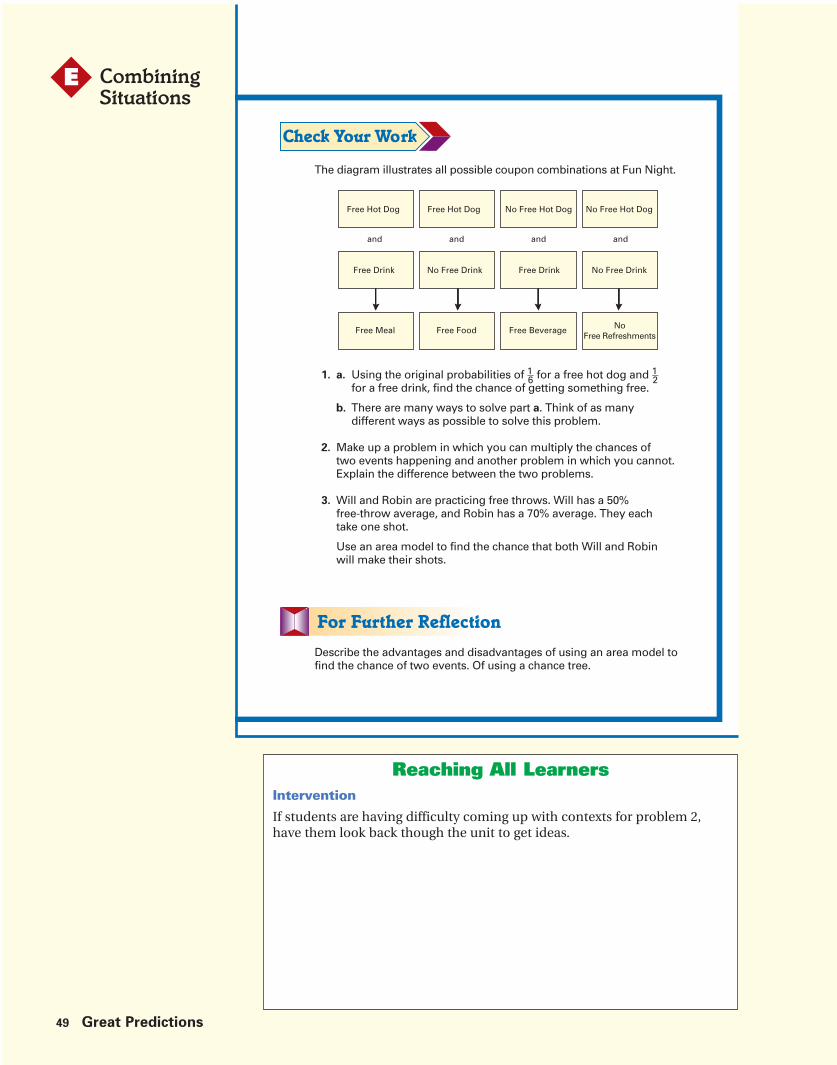
CombiningSituations
E
Intervention
If students are having difficulty coming up with contexts for problem 2,have them look back though the unit to get ideas.
Reaching All Learners
49 Great Predictions
The diagram illustrates all possible coupon combinations at Fun Night.
1. a. Using the original probabilities of 1��6 for a free hot dog and 1��2for a free drink, find the chance of getting something free.
b. There are many ways to solve part a. Think of as manydifferent ways as possible to solve this problem.
2. Make up a problem in which you can multiply the chances oftwo events happening and another problem in which you cannot.Explain the difference between the two problems.
3. Will and Robin are practicing free throws. Will has a 50%free-throw average, and Robin has a 70% average. They eachtake one shot.
Use an area model to find the chance that both Will and Robinwill make their shots.
Free Hot Dog Free Hot Dog No Free Hot Dog No Free Hot Dog
Free Drink Free DrinkNo Free Drink No Free Drink
Free Meal Free Food Free Beverage NoFree Refreshments
and and and and
Describe the advantages and disadvantages of using an area model tofind the chance of two events. Of using a chance tree.
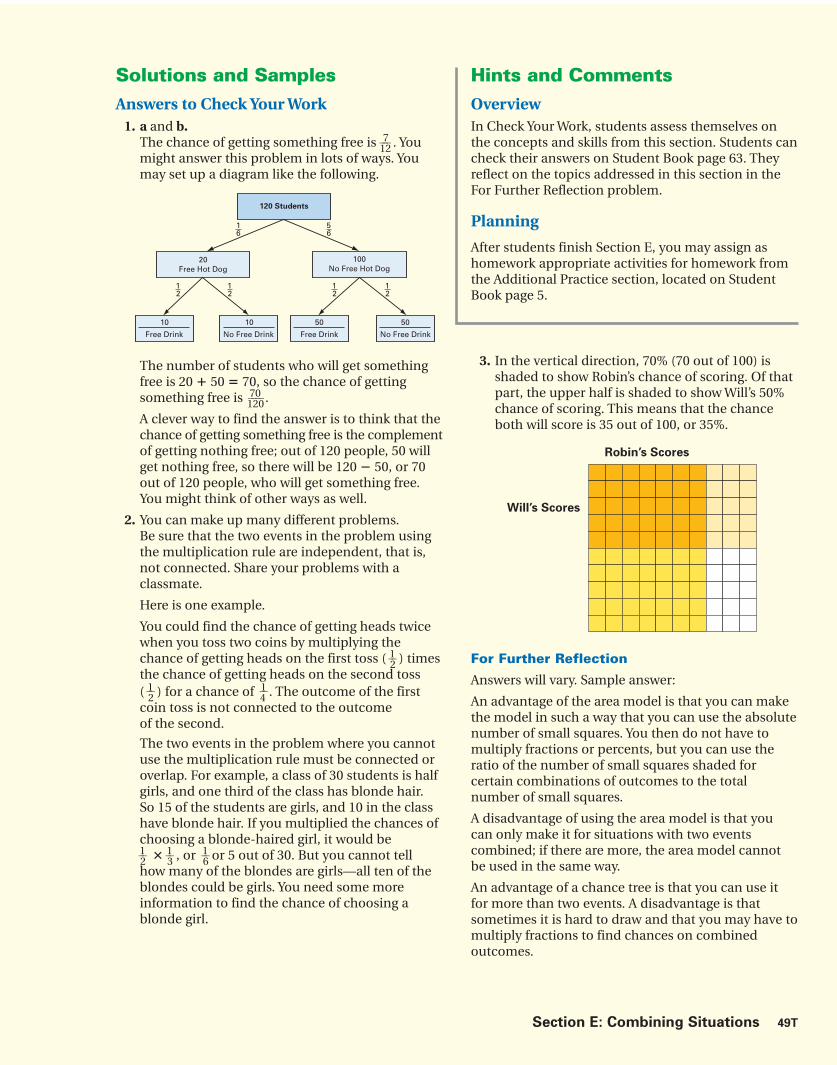
Section E: Combining Situations 49T
Hints and CommentsOverviewIn Check Your Work, students assess themselves onthe concepts and skills from this section. Students cancheck their answers on Student Book page 63. Theyreflect on the topics addressed in this section in theFor Further Reflection problem.
Planning
After students finish Section E, you may assign ashomework appropriate activities for homework fromthe Additional Practice section, located on StudentBook page 5.
Solutions and SamplesAnswers to Check Your Work
1. a and b.The chance of getting something free is 7___
12 . Youmight answer this problem in lots of ways. Youmay set up a diagram like the following.
The number of students who will get somethingfree is 20 � 50 � 70, so the chance of gettingsomething free is 70____
120.
A clever way to find the answer is to think that thechance of getting something free is the complementof getting nothing free; out of 120 people, 50 willget nothing free, so there will be 120 � 50, or 70out of 120 people, who will get something free.You might think of other ways as well.
2. You can make up many different problems.Be sure that the two events in the problem usingthe multiplication rule are independent, that is,not connected. Share your problems with aclassmate.
Here is one example.
You could find the chance of getting heads twicewhen you toss two coins by multiplying thechance of getting heads on the first toss ( 1__
2 ) timesthe chance of getting heads on the second toss( 1__
2 ) for a chance of 1__4 . The outcome of the first
coin toss is not connected to the outcomeof the second.
The two events in the problem where you cannotuse the multiplication rule must be connected oroverlap. For example, a class of 30 students is halfgirls, and one third of the class has blonde hair.So 15 of the students are girls, and 10 in the classhave blonde hair. If you multiplied the chances ofchoosing a blonde-haired girl, it would be1__2 � 1__
3 , or 1__6 or 5 out of 30. But you cannot tell
how many of the blondes are girls—all ten of theblondes could be girls. You need some moreinformation to find the chance of choosing ablonde girl.
120 Students
20Free Hot Dog
100No Free Hot Dog
Free Drink Free DrinkNo Free Drink No Free Drink
10 10 50 50
1 2
1 2
1 2
1 2
5 6
1 6
3. In the vertical direction, 70% (70 out of 100) isshaded to show Robin’s chance of scoring. Of thatpart, the upper half is shaded to show Will’s 50%chance of scoring. This means that the chanceboth will score is 35 out of 100, or 35%.
For Further Reflection
Answers will vary. Sample answer:
An advantage of the area model is that you can makethe model in such a way that you can use the absolutenumber of small squares. You then do not have tomultiply fractions or percents, but you can use theratio of the number of small squares shaded forcertain combinations of outcomes to the totalnumber of small squares.
A disadvantage of using the area model is that youcan only make it for situations with two eventscombined; if there are more, the area model cannotbe used in the same way.
An advantage of a chance tree is that you can use itfor more than two events. A disadvantage is thatsometimes it is hard to draw and that you may have tomultiply fractions to find chances on combinedoutcomes.
Robin’s Scores
Will’s Scores

Additional Practice SolutionsStudent Page
50 Great Predictions Additional Practice Solutions Student Page
1. Describe at least three situations involving uncertainty in which itis important to estimate the likelihood of an event’s occurrence.
2. Think back to the questions on television ratings in this section.Do you think that the ratings computed are accurate enough tobe used to decide how much to charge for an advertisement?Explain why or why not.
Suppose that a particular television station wants to know whether toadd another half-hour of news to its evening broadcast. During theevening news for several nights, the announcers ask people to call atoll-free number to say whether or not they want an extra half-hour ofnews. The result of the poll was that a large majority voted in favor ofextending the evening news.
3. a. If you were in favor of the expansion, what argument wouldyou make?
b. If you were against the expansion, what argument wouldyou make?
In the small town of Arens (population 2,000), a journalist from thelocal newspaper went to the park and surveyed 100 people aboutbuilding a recreation center on one side of town. Twenty-five peoplesaid they would like the center. The next day the journalist wrote anarticle about this issue with the headline:
A Large Majority of the People in Arens Do NOT Want aRecreation Center.”
4. a. Is this headline a fair statement? Explain your answer.
A television reporter wanted to conduct her own survey. Shecalled a sample of 20 people, whose names she randomlyselected from the Arens telephone directory. Sixty percent saidthey were in favor of the recreation center.
b. Is it reasonable to say that 60% of all the people in Arens arein favor of the recreation center? Explain why or why not.
c. Describe how you would try to find out how many of thepeople in Arens want a recreation center. Explain why youthink your method works.
Additional Practice
Section Drawing Conclusions from SamplesA

Section A. Drawing Conclusionsfrom Samples
1. Answers will vary. Sample responses:
• In football, it is important to have somesense of what the offense will do (pass orrun) so you can set up your defense.
• In planning a trip, it is important to knowwhether it is likely to rain so you knowwhether or not to bring an umbrella.
• People who live along a river need toknow whether the river is likely to floodduring the spring so they can makepreparations in case it does.
2. Answers will vary. Sample responses:
• No, because there were not enough peoplein the survey.
• No, because people can manipulate theresults of the survey.
• Yes, because this is how Nielsen MediaResearch collected information, so itmust work to some degree.
• Yes, because it uses random samples.
You may suggest that you would needmore information to decide how much tocharge for an advertisement.
3. a. Different answers are possible. For example,you could say that the majority of the peoplewho responded favored the expansion.
b. Answers will vary. Sample response:
The number of people watching may nothave been sufficient to make a decisionbased on their views. If only 20 peoplewere watching, a large majority of themwould still not be a large number of people.Also, the sample was not chosen randomly.Only those watching had the opportunity tocall in, and of those, only those who choseto call in were part of the survey. The surveyexcluded those who did not watch theevening broadcast.
4. a. Answers and explanations will vary. Sampleresponse:
The people were not chosen randomly.The people who were not at the park thatday had no chance to respond to the survey.Also, the people surveyed might live nearthe proposed recreation center and think itwould be good to build it . The headline isbased on the sample, so it may not be a fairstatement.
b. Answers and explanations will vary. Sampleresponse:
It may not be reasonable to say that 60%of the people in Arens are in favor of a recre-ation center. The method of choosing thesample seems to be fair. But the sample isvery small, so the percent of the populationin favor of a recreation center may still bedifferent from the 60% quoted in the survey.
c. Answers and explanations will vary.Students should suggest that a sample berandom, where everyone has a chance torespond, and not too small. If studentssuggest asking all the people in Arens,you might ask them to compare this methodto taking a sample, considering the followingfactors: the survey method (how they wantto reach everyone), the number of peoplewho will not respond, the time it will take,and the reliability.
Additional Practice Solutions Great Predictions 50T
Additional Practice Solutions

Additional Practice SolutionsStudent Page
51 Great Predictions Additional Practice Solutions Student Page
Benjamin has a drawer in which he keeps his pens and pencils. Theycome in different colors. He counts the pens and pencils and findsthat there are 40 pencils, 12 of which are black, 8 are red, and the restare blue. There are 20 pens. Eight pens are black, 2 are red, and therest are blue.
1. Organize the information in a table.
2. a. If Benjamin takes one item out of his drawer at random, whatis the chance that it is a pencil?
b. If Benjamin takes one item out of his drawer at random, whatis the chance that it is red? Show how you found your answer.
c. If Benjamin chose a pencil in part b, is your answer the same?
Section May be There is a ConnectionB
Section Reasoning from SamplesC
0
2
4
6
8
10
12
14
16
18
20
The Speed of Cars
Speed (in mi/h)
Nu
mb
er
of
Cars
14 17 20 23 26 29 32 35 38
Here is a histogram of the speed of 63 cars at a road close to the BoraMiddle School.
1. a. Estimate the chance that a car randomly chosen from thissample is driving faster than 30 mi/h.
b. Based on your answer to a, how can you easily calculate thechance that a car is driving 30 mi/h or slower?
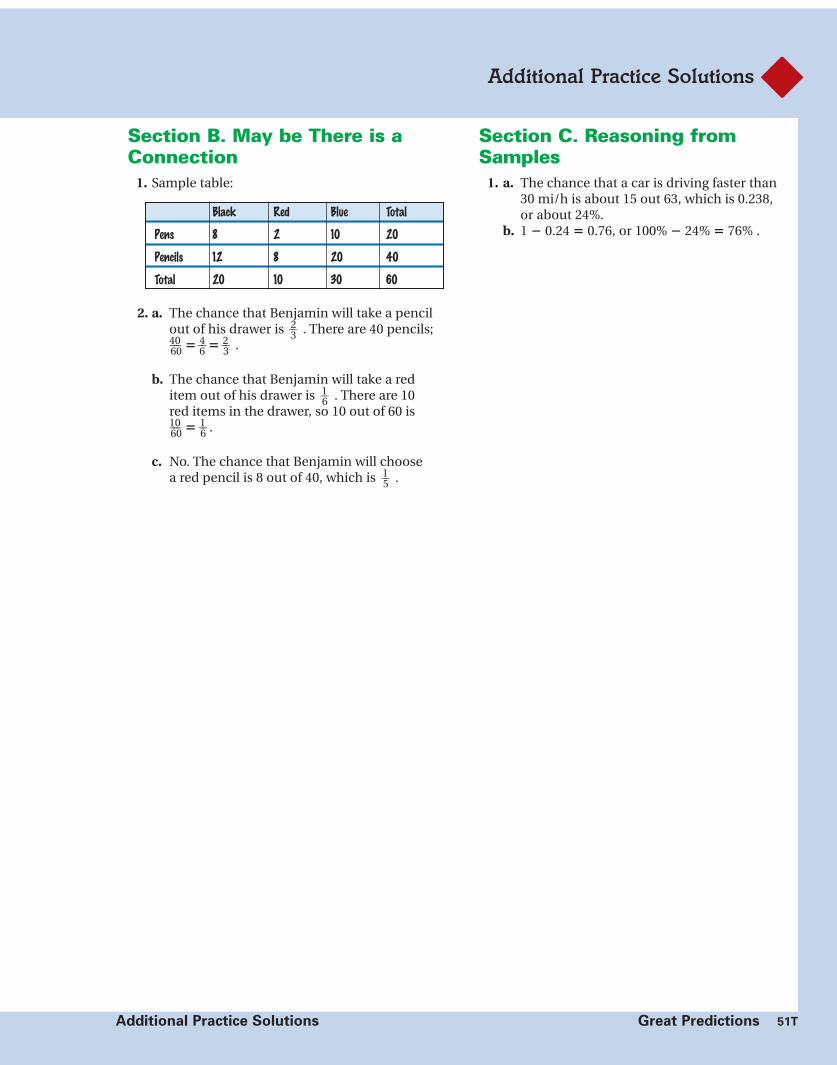
Additional Practice Solutions Great Predictions 51T
Section B. May be There is aConnection
1. Sample table:
2. a. The chance that Benjamin will take a pencilout of his drawer is 2__
3 . There are 40 pencils;40___60 � 4__
6 � 2__3 .
b. The chance that Benjamin will take a reditem out of his drawer is 1__
6 . There are 10red items in the drawer, so 10 out of 60 is10___60 � 1__6 .
c. No. The chance that Benjamin will choosea red pencil is 8 out of 40, which is 1__
5 .
Section C. Reasoning fromSamples
1. a. The chance that a car is driving faster than30 mi/h is about 15 out 63, which is 0.238,or about 24%.
b. 1 � 0.24 � 0.76, or 100% � 24% � 76% .
Black Red Blue Total
Pens 8 2 10 20
Pencils 12 8 20 40
Total 20 10 30 60
Additional Practice Solutions

Additional Practice SolutionsStudent Page
52 Great Predictions Additional Practice Solutions Student Page
Additional Practice
a. Organize the data in a two-way table like the one below anduse the table to answer Jorge’s question.
b. If a middle school student is chosen at random from thisgroup, what is the chance that it is a girl who plays less thantwo hours of video games per day?
c. If you decide to choose a boy at random from the group,what is the chance he will play less than 2 hours of videogames per day?
d. Jorge announced that the survey showed the chance that aseventh grader played two or more than two hours a day wasabout 53%. What do you think of his statement?
2. The table contains the results of a survey on the number of hoursa day that students in middle school play video games. Jorgewants to know the chance that a student randomly chosen fromthis group that was surveyed plays video games for two or morehours a day.
Boys
Girls
Total
TotalPlayed Less Than
2 Hours Per Day
Played 2 or More
Hours Per Day
GirlsHours per Day
BoysHours per Day
1
1
1.5
1
2
2
0
2
0
2.5
1
1.5
1.5
3
3
3
3.5
4
1.5
3.5
1
4
2
4.5
1
4
2.5
6
1
3.5
1.5
3
1
0
0
0 4 3.5

Additional Practice Solutions
Additional Practice Solutions Great Predictions 52T
Section C. Reasoning fromSample (Continued)
2. a.
The chance of playing 2 or more hours perday is 20 out of 38, or about 53%.
b. The chance is 13 out of 38, or about 34%.
c. The chance is 5 out of 20, or 25%. This answeris different than the answer for part b. In partb you are picking from the whole group, soyou have to compare the favorable outcometo the whole group. In part c, however, youare picking only from the boys, so you onlyhave to compare the favorable outcome tothe total number of boys.
d. Answers may vary. Sample answer:
The survey did not tell which grade thestudents were in, so Jorge could not reallyknow anything about seventh graders fromthe results. The survey gave resultsfor middle school students as a group;for students from this sample, 53%is correct.
Played Less than
2 Hours per Day
Played 2 or More
Hours per DayTotal
Boys
Girls
Total
5
13
18
15
5
20
20
18
38

Additional Practice SolutionsStudent Page
53 Great Predictions Additional Practice Solutions Student Page
A new dairy bar has opened on Baker Street. It serves only low-fatmilk and yogurt drinks. The milk drinks cost $1.00, and the yogurtdrinks cost $3.00. The owner does not yet know if his business will besuccessful. On his first day, 100 people place orders at the bar, 80% ofwhom order low-fat milk.
1. How much money did the dairy bar make on the first day ofbusiness? Draw a tree diagram to help you answer the problem.
The owner thinks that he may have overpriced the yogurt drinkbecause most people are buying milk drinks. The second week, hereduces the price of his yogurt drinks to $2.50, but he does not wantto lose money, so he raises the price of milk drinks to $1.50. He nowexpects to sell only 70% milk drinks and the rest yogurt drinks.
2. a. How much money does the owner expect to make if 100people come to the dairy bar? Use a tree diagram to help youanswer the problem.
b. Has he lost income compared to his opening day?
Additional Practice
Section ExpectationsD
One class did a survey and asked students what job they would like.
3. Can they conclude that being a teacher is the favorite choice for acareer among students at their school?
Teacher
Scientist
Pilot
Medical
Engineer
0 5
Count
Jo
b
X X X X X X
X X X X X X
X X X X
X X
X X X X X X X
Students Future Jobs

Additional Practice Solutions
Additional Practice Solutions Great Predictions 53T
Section D. Expectations1. $80 � $60 � $140
2. a. $105 � $75 � $180
b. He has not lost income. He has gained $40.
Section C. Reasoning fromSamples (Continued)
3. No, this is just a small sample, and thedifferences between the votes for teacher,a medical job, or engineer are very small.
� �
� �
80
People
100
People
20
People
$1.00 $80.00
$3.00 $60.00
Low-fat Milk
80%
Yogurt
� $1.50 � $105.00
� $2.50 � $75.00
70
People
100
People
30
People
Low-fat Milk
70%
Yogurt

Additional Practice SolutionsStudent Page
54 Great Predictions Additional Practice Solutions Student Page
The owner changes the prices so that the milk and yogurt drinks eachcost $2.00. He now expects to sell 40% yogurt drinks.
3. How much money does he expect to make with 100 customers?How does this compare to his previous income?
On the third week, the shop begins selling bagels for $1.00. It turnsout that of the customers who buy milk drinks, 60% also buy a bagel.For customers who buy yogurt drinks, only 50% also buy a bagel.
4. How much money does the owner expect to make now if he has100 customers?
Additional Practice
Section Combining SituationsE
Monica buys a ticket for the movies. Of the 240 seats in the theater,80 are in the balcony.
Each seat in the theater has a number. The number of odd seats is thesame as the number of even seats.
1. What is the chance that Monica will sit in the balcony?
2. a. What is the chance that Monica will sit in a seat with an evennumber that is not in the balcony?
b. Explain whether or not you can use the multiplication rule forchance to answer a.

Additional Practice Solutions
Additional Practice Solutions Great Predictions 54T
Section D. Expectations(Continued)
3. $200. Since all drinks cost $2.00, he expects tomake 100 � $2.00 � $200. He has now earnedanother $20.
4. $256. One hundred milk or yogurt drinks at$2.00 each plus 56 bagels at $1.00 each equals$256.
Section E. CombiningSituations
1. 80 of the 240 seats are in the balcony, so thechance is 80____
240 , or 1__3 .
2. a. Strategies will vary. Sample strategy:
Two-thirds of the seats are not in the balcony,and half of these seats have even numbers,so the probability is 2__
3 � 1__2 � 2__
6 � 1__3 .
b. Yes, you can use the multiplication rulebecause of the two events. Having an oddnumber on the seat and a seat in thebalcony are independent events.60
People
100
People
40
People
Low-fat Milk
60%
40%
Yogurt
Bagel
50%
No
Bagel
Bagel
60%
No
Bagel
36
People
24
People
20
People
20
People

55A Great Predictions Assessment Overview
Assessment OverviewUnit assessments in Mathematics in Context include two quizzes and a Unit Test.Quiz 1 is to be used anytime after students have completed Section B. Quiz 2 can beused after students have completed Section D. The Unit Test addresses most of themajor goals of the unit. You can evaluate student responses to these assessments todetermine what each student knows about the content goals addressed in this unit.
Pacing
Each quiz is designed to take approximately 25 minutes to complete. The unit test isdesigned to be completed during a 45-minute class period. For more information onhow to use these assessments, see the Planning Assessment section on the next page.
Goal Assessment Opportunities Problem Levels
• Use chance trees, counting strategies, Quiz 1 Problem 2ctwo-way tables, and rules to find probability. Quiz 2 Problems 2ab
Test Problems 3a, 4ac
• Use different representations (ratios, Quiz 2 Problems 2abpercents, fractions, and so on) to describe Test Problem 4aprobability. Level I
• Understand that variability is inherent in Quiz 1 Problem 2cany probability situation. Quiz 2 Problem 2c
• Use graphs and measures of central Quiz 2 Problems 1abtendency to describe data.
• Reason about likely and unlikely samples Quiz 1 Problems 1ab, 2aand factors that can bias a survey. Quiz 2 Problems 1c
Test Problem 2
• Make decisions using probability and Quiz 1 Problem 2c Level IIexpected values. Quiz 2 Problem 2d
Test Problems 4bc
• Determine whether events are dependent Quiz 1 Problem 2bor independent, and find the probabilities. Test Problems 1, 3b
Assessment Overview
Assessment Overview

Assessment Overview Great Predictions 55
About the Mathematics
These assessment activities assess the majority of the goals for GreatPredictions. Refer to the Goals and Assessment Opportunities sectionon the previous page for information regarding the goals that areassessed in each problem. Some of the problems that involve multipleskills and processes address more than one unit goal. To assessstudents’ ability to make mathematical connections (a Level II goal inthe Assessment Pyramid), some problems assess students’ ability tochoose an appropriate model or strategy to solve a problem.For example, in the theater activity on the Unit Test (problem 4),students must apply their knowledge of probability models to makeprobabilistic decisions and determine expected values for a newproblem context.
Planning Assessment
These assessments are designed for individual assessment; however,some problems can be done in pairs or small groups. It is importantthat students work individually if you want to evaluate each student’sunderstanding and abilities.
Make sure you allow enough time for students to complete theproblems. If students need more than one class session to completethe problems, it is suggested that they finish during the next mathe-matics class or you may assign select problems as a take-home activity.Students should be free to solve the problems their own way. Studentuse of calculators on these assessments is at the teachers’ discretion.
If individual students have difficulties with any particular problems,you may give the student the option of making a second attemptafter providing him or her a hint. You may also decide to use one ofthe optional problems or Extension activities not previously done inclass as additional assessments for students who need additional help.
Scoring
Solution and scoring guides are included for each quiz and the UnitTest. The method of scoring depends on the types of questions oneach assessment. A holistic scoring approach could also be used toevaluate an entire quiz.
Several problems require students to explain their reasoning or justifytheir answers. For these questions, the reasoning used by students insolving the problems, as well as the correctness of the answers,should be considered in your scoring and grading scheme.
Student progress toward goals of the unit should be considered whenreviewing student work. Descriptive statements and specific feedbackare often more informative to students than a total score or grade.You might choose to record descriptive statements of select aspectsof student work as evidence of student progress toward specific goalsof the unit that you have identified as essential.
Assessment Overview

Great Predictions Quiz 1 Page 1 of 2
Name ____________________________________________ Date ______________________
Use additional paper as needed.
© E
ncy
clo
pæ
dia
Bri
tan
nic
a, In
c.
Th
is p
age
may
be
rep
rod
uce
d f
or
clas
sro
om
use
.
1. Mary wants to know whether students at her school, Julian MiddleSchool, prefer to go to the movies or prefer to watch TV. Sheinterviewed 12 of her friends, and based on their preferences, she decided that 1__
4 of the school prefers to go to the movies and 3__4
prefers to watch TV.
a. Do you think Mary’s results are reliable? Explain why or why not.
b. Julian Middle School has a total of 324 students. Describe anotherway to find out whether students at Julian Middle School prefergoing to the movies or stay home to watch TV. Make sure yourmethod will provide reliable results.
2. At Julian Middle School a random sample of all students completeda survey that asked questions about how many hours a week theyspend doing homework. The results of the survey are shown in thetable below.
a. Explain what is meant by a “random sample of all students” inthis situation.
56 Great Predictions Quiz 1 Mathematics in Context
Less Than 3 Hours a Week
3 or MoreHours a Week Total
Girls
Boys
Total
38
50
88
31
31
62
69
81
150

© E
ncy
clo
pæ
dia
Bri
tan
nic
a, In
c.
Th
is p
age
may
be
rep
rod
uce
d f
or
clas
sro
om
use
.
Page 2 of 2 Great Predictions Quiz 1
b. Tora states: “There is no connection between hours spent onschool work at home and being a boy or girl, since the samenumber of boys (31) and girls (31) spend 3 or more hours a week on homework.” Do you agree with Tora? Why or why not?Support your answer mathematically.
c. Below are four statements about this survey. For each statement,indicate whether the statement is a good conclusion that can bedrawn from the survey or a poor conclusion. Explain your ratingsfor each statement.
i. Girls at Julian Middle School work harder than boys.
ii. I expect that about 60% of all boys at Julian Middle Schoolspend less than 3 hours a week doing homework.
iii. If you randomly choose a student from the group of 150, it ismore likely that it will be a boy than a girl.
iv. If you randomly choose a student from the group of 150, it ismore likely that this student spends three or more hours doinghomework (instead of less than three hours).
Mathematics in Context Great Predictions Quiz 1 57

Great Predictions Quiz 2 Page 1 of 2
Name ____________________________________________ Date ______________________
Use additional paper as needed.
©EncyclopædiaBritannica,Inc.
Thispagemay
bereproducedforclassroom
use.
1. Mary complains that the school bus often arrives late.For 31 days, she recorded how many minutes the bus wasdelayed. If the bus arrived on time or early, she recordedzero minutes. She made a histogram of the data:
Mary considers the bus late if it is delayed two or moreminutes.
a. Suppose you select at random one of the 31 days sherecorded this information. What is the chance that on thisday the bus will be between 2 and 4 minutes late? Showyour work.
b. Based on the information in this graph, what conclusionshould Mary make? Show your work.
c. Assume you are the owner of the bus company. Whataspects of Mary’s survey methods would you criticize?
0
2
4
6
8
10
12
2 4 6 8 10 12 14 16 18 20 22
Delay (in minutes)
Buses That Were Late Arriving at School
Nu
mb
er
of
Tim
es
58 Great Predictions Quiz 2 Mathematics in Context

© E
ncy
clo
pæ
dia
Bri
tan
nic
a, In
c.
Th
is p
age
may
be
rep
rod
uce
d f
or
clas
sro
om
use
.
Page 2 of 2 Great Predictions Quiz 2
2. John is playing a computer game where he has to shoot aball at a goal. If he misses on the first try, he can shoot asecond time. John says he misses about 40% of the time onhis first try and 30% of the time on his second try.
a. John plays the game once. What is the chance that Johnmisses the goal both times? Make a chance tree that showsthe possible outcomes.
b. What is the chance that John misses on his first try andhits the goal on his second try?
c. John plays the game 10 times. Is it possible for him to hitthe goal 8 out of 10 times on his first try?
d. John plays the game 100 times and gets 1 point for eachgoal he scores. What is his average expected score ofpoints per game?
Mathematics in Context Great Predictions Quiz 2 59

Great Predictions Unit Test Page 1 of 4
Name ____________________________________________ Date ______________________
Use additional paper as needed.
© E
ncy
clo
pæ
dia
Bri
tan
nic
a, In
c.
Th
is p
age
may
be
rep
rod
uce
d f
or
clas
sro
om
use
.
Use additional paper as needed.
1. On Swanson’s car lot, one-half of the cars in stock haveantilock brakes. Ten percent of the cars in stock are red.Every morning, the dealer randomly chooses a differentcar to put in the showroom window. There is no connectionbetween a car’s being red and having antilock brakes.
What is the chance that the car in the showroom windowon a particular day has antilock brakes and is red? Write anexplanation describing how you calculated the chance.You may want to use a diagram to illustrate your explanation.
60 Great Predictions Unit Test Mathematics in Context

© E
ncy
clo
pæ
dia
Bri
tan
nic
a, In
c.
Th
is p
age
may
be
rep
rod
uce
d f
or
clas
sro
om
use
.
Page 2 of 4 Great Predictions Unit Test
2. The following announcement was in a newspaper.
Explain why the people running the poll included thestatement at the bottom of the announcement.
Mathematics in Context Great Predictions Unit Test 61

Great Predictions Unit Test Page 3 of 4
Name ____________________________________________ Date ______________________
Use additional paper as needed.
© E
ncy
clo
pæ
dia
Bri
tan
nic
a, In
c.
Th
is p
age
may
be
rep
rod
uce
d f
or
clas
sro
om
use
.
Use additional paper as needed.
3. Mr. Smith works in the school administration of Bora MiddleSchool. He wants to find out how students come to school, either by car or by school bus (nobody walks or rides a bike toschool). One day, he took a survey of a sample of students in two grades. He organized the results into the following table:
a. Based on these results, would you expect that comingto school by car depends upon the grade level of thestudent? Show your work.
b. Mr. Smith repeated the survey with another group studentsfrom the same grade levels. The results were organized intothe following table.
Based on the results of the larger sample, would you come toa different conclusion than the one you gave for Problem 4aabout the connection between coming to school by car andgrade? Support your answer with an explanation or by showingyour work.
Transport Car Bus Total
Grade 5
Grade 6
Total
11
5
16
17
21
38
28
26
Transport Car Bus Total
Grade 5
Grade 6
Total
66
52
245
223
62 Great Predictions Unit Test Mathematics in Context

© E
ncy
clo
pæ
dia
Bri
tan
nic
a, In
c.
Th
is p
age
may
be
rep
rod
uce
d f
or
clas
sro
om
use
.
Page 4 of 4 Great Predictions Unit Test
4. A theater recorded the number of tickets that were sold at areduced price of $9. For most shows, the percent of tickets sold atthe reduced price is about 40%. For next week’s show, the managerwants to estimate the total amount of ticket sales. The price of aregular ticket is $12.
a. The manager expects 200 tickets to be sold for next week’sshow. What amount of money should the theater owner expectto make next week on ticket sales?
b. What could happen to the total amount if the manager decidesto make the reduced tickets a little cheaper? Give an exampleand give reasons to support your answer.
c. Peter wants to see the show, but all of the tickets are sold out.He expects that about 2% of the people who bought a ticket forthat day will decide to skip the show. Peter also expects that onefifth of the people who skip the show will try to sell their ticket tosomeone else at the theater before the show begins. The theaterholds about 500 people.
What is the chance that Peter will be able to purchase a ticket if he goes to the theater right before the show begins? Showyour work.
Mathematics in Context Great Predictions Unit Test 63

Great Predictions Quiz 1Solution and Scoring Guide
Possible student answer Problem levelSuggested numberof score points
(Award 1 point for an alternative method and
1 point for a correct explanation.)
1. a. Mary’s results are probably NOT reliable. 2 II
Sample explanation: Mary only asked her friends,and these may not represent the preferences ofmost students.
b. Different answers are possible. Sample answer: 2 II• Mary could randomly choose 10 students from
each class or grade level and interview them.
2. a. Sample answer: 1 IIEach student at Julian Middle School hasan equal chance of being in the sample.
b. Sample answer: 3 III do not agree with Tora.
• 31 out of 69 girls (or about 45%) spend 3 hoursa week or more on their homework; 31 out of81 boys (or about 38%) spend 3 hours a weekor more on their homework.
• 38 out of 69 girls (or about 55%) spend lessthan 3 hours a week doing homework, whereas50 out of 81 boys (or about 62%) do so.
c. i. Poor conclusion. A higher percentage of girls 4 I/IIspend more hours on homework, but the difference between girls and boys seemsrelatively small.
ii. Good conclusion. The sample was random,so you may expect the ratio of boys and girls to be the same for the whole school as in this sample.
iii. Good conclusion. There are more boys thangirls in the sample.
iv. Poor conclusion. 88 out of 150 studentsspend less than 3 hours doing homework,and 62 out of 150 spend more than 3 hours.It is more likely a randomly chosen studentbelongs to the first group of 88 because thisgroup is larger .
Total score points 12
(Award 1 point for each correct answer.)
64 Great Predictions Quiz 1 Mathematics in Context
(Award 1 point for a correct conclusion and,
2 points for correct computation.)

Great Predictions Quiz 2Solution and Scoring Guide
Possible student answer Problem levelSuggested numberof score points
1. a. The chance is 8 out of 31, or about 25%. 2 I
b. Mary will conclude that the bus is usually late. 2 ISample calculations:
• In 31 days, the bus is late 2 minutes or more19 times. Therefore, the bus is delayed about61% of the time.
• The bus arrives on time 12 days out of 31.The bus is on time about 39% of the time.
c. Sample answers: 2 II
(Note: Students only need to give one reason.)
• This was a small sample. You cannot drawthese conclusions if you only observe whathappens over one month.
• Her sample was not randomly selected.In this time of the year, traffic is alwaysbad because of weather conditions, and thesafety of the children is our top priority! She should have measured, for example,several times a week over many months.
• Perhaps in this month, there were moretraffic jams than usual.
• The bus driver is a new driver withoutmuch experience. Give him time to getused to the route.
2. a. The chance is about 12%. 3 I
Sample explanations:
• I started with 100 first tries and found that12 out of 100 times both shots failed tohit the goal.
• The chance both shots failed is 40____100 � 30____
100� 12____
100 �12%.
40% of 30% is 12%.
(1 point for a correctconclusion based on
the data and, 1 point for correct
calculations.)
(Award 2 points for a correct chance tree and
1 point for a correct answer.)
40%
30%
60%
70%
MissedTarget
MadeTarget
MadeTarget
MissedTarget
Mathematics in Context Great Predictions Quiz 2 65

Great Predictions Quiz 2Solution and Scoring Guide
Possible student answer Problem levelSuggested numberof score points
b. The chance is 28%. 2 I
40____100 � 70____
100 � 4___10 � 7___10 � 28____
100 .
c. Yes, this is possible. You would expect John to hit 2 Ithe goal 60% of the time on his first try. So 8 outof 10 seems quite possible. It is actually possiblefor John to hit 10 in a row, although it is not likely.
d. He has an expected score of 88 points for the 2 II100 games, which is an average expected scoreper game of 0.88 points. For 100 games, he scores60 on his first try and 28 on his second try. So hescores 88 points in all over 100 games.
Total score points 15
66 Great Predictions Quiz 2 Mathematics in Context
(Award 1 point for “yes” and 1 point for a correct
explanation.)
(Award 1 point for the answer, one for
the calculation.)

Great Predictions Unit TestSolution and Scoring Guide
Possible student answer Suggested numberof score points
Problem level
1. 0.05, or 5%. 2 II
Sample strategies:
Strategy 1: Students might multiply the twoindividual chances:
0.5 � 0.1 � 0.05 or 5% (or 50% � 10% � 5%).
Strategy 2: Students might use a chance tree.
I assumed there were 300 cars on the lot. Half ofthe cars (150) had antilock brakes. One-tenth ofthe 150 cars were red ( 1___10 � 150 �15 cars). So, thechance that a car is red and has antilock brakesis 1___5_
300 , which is 0.05 or 5%.
2. Sample response: 2 II
The poll results may be biased due to thesampling method used.
The poll is not scientifically designed since thesurvey responses are only from people whophone in, not from a randomly selected sample.People who have strong feelings one-way or theother are the ones who will respond. People whodo not respond may have an opinion, but they may not feel strongly enough about it to call in. In addition, the survey will only reach those who read the newspaper that day, which is not a random group of people.
300 Cars
50%
10% 90% 10% 90%
50%
150AntilockBrakes
150 No Antilock
Brakes
15Red
15Red
135Not Red
135Not Red
Mathematics in Context Great Predictions Unit Test 67

Possible student answer
Great Predictions Unit TestSolution and Scoring Guide
68 Great Predictions Unit Test Mathematics in Context
Problem levelSuggested numberof score points
3. a. 2 I
Yes this seems dependent. Of the Grade 5 students, 11 out of 28 (or 39%) took a car toschool. Of the Grade 6 students, 5 out of 26(or 19%) took a car to school. This differenceis rather large.
b. Yes, the larger sample leads to a different 2 IIconclusion from the small sample. Now thepercentages for students in the two gradescoming to school by car are almost the same.So coming by car does seem to be independentof the grade level.
4. a. The expected amount is $2,160. 2 I
Sample work:
40% of 200 is 80 tickets, and 80 � $9 � $720.
So $720 is the income for the reduced tickets.
120 � $12 � $1,440 is the income for theregular tickets.
In total: $720 � $1,440 � $2,160.
b. Sample answers: 2 II
• If the same number of people come to theshow, the total amount of money will belower, because the price of the reducedtickets is lower.
80 tickets � $8 � $640120 tickets � $12 � $1,440
$2,080
Transport Car Bus Total
Grade 5
Grade 6
Total
11
5
16
17
21
38
28
26
54
(39%)
(19%)
(30%)
Transport Car Bus
Grade 5
Grade 6
Total
66
52
118
(21%)
(19%)
(20%)
245
223
468
Total
311
275
586
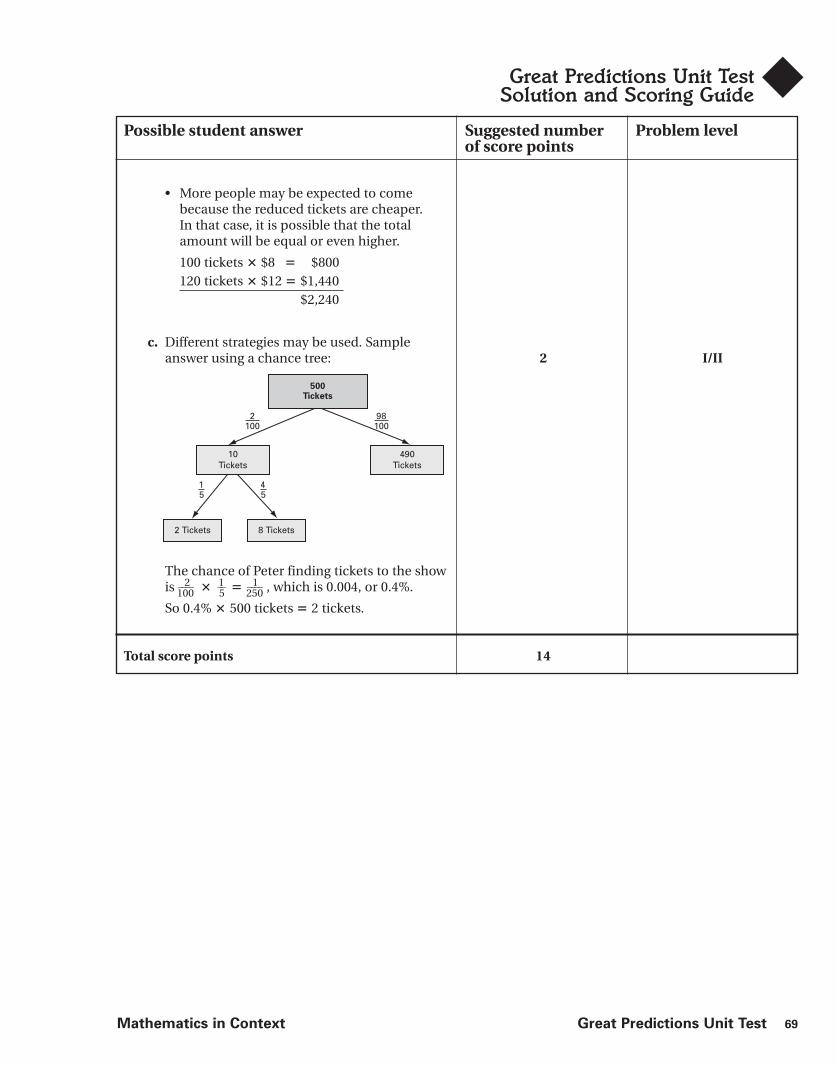
Great Predictions Unit TestSolution and Scoring Guide
Mathematics in Context Great Predictions Unit Test 69
Possible student answer Suggested numberof score points
Problem level
• More people may be expected to comebecause the reduced tickets are cheaper.In that case, it is possible that the totalamount will be equal or even higher.
100 tickets � $8 � $800120 tickets � $12 � $1,440
$2,240
c. Different strategies may be used. Sampleanswer using a chance tree: 2 I/II
The chance of Peter finding tickets to the show is 2____
100 � 1__5 � 1____
250 , which is 0.004, or 0.4%.
So 0.4% � 500 tickets � 2 tickets.
Total score points 14
490Tickets
500Tickets
10Tickets
8 Tickets2 Tickets
2100
1 5
98100
4 5

The Glossary defines all vocabulary words indicated in this unit. It includesthe mathematical terms that may be new to students, as well as wordshaving to do with the contexts introduced in the unit. (Note: The StudentBook has no glossary. Instead, students are encouraged to construct theirown definitions, based on their personal experiences with the unit activities.)
The definitions below are specific for the use of the terms in this unit. Thepage numbers given are from the Student Book.
bias (TG p. 1T) an inclination to choose a sample that is not representativeof the whole, which would favor certain outcomes and provide untrue data
chance (TG p. 2T) the likelihood of an event’s occurring; the number oftimes an event occurs divided by the total number of all possible occur-rences
chance tree (p. 19) a pictorial representation of a probability situation inwhich all outcomes are shown and their probabilities given
complement (p. 30) two independent events for a given situation that,when combined together, represent all the outcomes (with a combinedprobability of 100%)
dependent events (p. 15) events for which the outcomes are connected
expected value (p. 34) the amount or number that is expected; this canbe a total or a rate
independent events (p. 15) events for which the outcomes are notconnected
multiplication rule for chance (p. 44) the chance for a combinationof events to occur; the chance of the first event to occur times the chance ofthe second event to occur. This is also called the Counting Principle.
population (p. 4) any group of individuals
probability (p. 5) the chance or likelihood of an event’s occurrence; thenumber of favorable outcomes divided by the total number of possibleoutcomes
sample (p. 4) a group taken from a larger population
simulation (TG p. 24T) a model of a chance situation often used to gatherexperimental data
tree diagram (TG p. 14T) a diagram with branches representing allpossible choices or combinations of choices
uncertainty (TG p. 1B) something about which you cannot make adetermination
Glossary
Glossary
70 Great Predictions Glossary

BlacklineMasters
BlacklineMasters

Letter to the Family
Dear Family,
Your child is starting the Mathematics in Context unit Great Predictions.Below is a letter to your child that introduces the unit and its goals.
Surveys are used extensively in politics and business. In this unit,your child will have the opportunity to investigate how probability andstatistics can be used to evaluate survey results.
You can help your child to relate classwork to his or her own life byfinding the results of a survey in a newspaper or magazine and dis-cussing the data. Discuss why the survey wastaken and what might be done with theresults. Look for important information, suchas who sponsored the survey, how therespondents were selected, and what ques-tions they were asked.
You might discuss ways in which chanceand probability play important roles ineveryday life—in forecasting the weather,in predicting the likelihood that a certainsports team will win the big game or that alocal politician will win a senate race,and so on.
We have great expectations that youand your child will enjoy investigatingprobability and statistics.
Sincerely,
The Mathematics inContext DevelopmentTeam
Great Predictions
Dear Student,
Welcome to Great Predictions!Surveys report that teens prefer brand-name jeans over any other jeans.
Do you think you can believe all the conclusions that are reported as
“survey results”? How can the results be true if they are based on
the responses of just a few people?In this unit, you will investigate how statistics can help you study,
and answer, those questions. As you explore the activities in this
unit, watch for articles in newspapers and magazines about surveys.
Bring them to class and discuss how the ideas of this unit help you
interpret the surveys.When you finish Great Predictions, you will appreciate how people
use statistics to interpret surveys and make decisions.Sincerely,
The Mathematics in Context Development Team
© E
ncy
clo
pæ
dia
Bri
tan
nic
a, In
c.
Th
is p
age
may
be
rep
rod
uce
d f
or
clas
sro
om
use
.
72 Great Predictions Letter to the Family

Student Activity Sheet 1Use with Great Predictions,
pages 4
Name ________________________________________
© E
ncy
clo
pæ
dia
Bri
tan
nic
a, In
c.
Th
is p
age
may
be
rep
rod
uce
d f
or
clas
sro
om
use
.
Student Activity Sheet 1 Great Predictions 73

Student Activity Sheet 2Use with Great Predictions,pages 24 and 25.
Name ________________________________________
© E
ncy
clo
pæ
dia
Bri
tan
nic
a, In
c.
Th
is p
age
may
be
rep
rod
uce
d f
or
clas
sro
om
use
.
74 Great Predictions Student Activity Sheet 2
810
1214
1618
2022
2426
28
Le
ng
th (
in c
m)
GE
Fis
h L
en
gth
s
810
1214
1618
2022
2426
28
Le
ng
th (
in c
m)
Ori
gin
al
Fis
h L
en
gth
s

Student Activity Sheet 3Use with Great Predictions,
pages 26 and 27.
Name ________________________________________
©EncyclopædiaBritannica,Inc.
Thispagemay
bereproducedforclassroom
use.
Length of GE Fish
Nu
mb
er
of
Fis
h
Length (in cm)
80757065605550454035302520151050
1 2 3 4 5 6 7 8 9 10 11 12 13 14 15 16 17 18 19 20 21 22 23 24 25
Length of Original Fish
Nu
mb
er
of
Fis
h
Length (in cm)
80757065605550454035302520151050
1 2 3 4 5 6 7 8 9 10 11 12 13 14 15 16 17 18 19 20 21 22 23 24 25
Student Activity Sheet 3 Great Predictions 75

Fish Card 1Use with Great Predictions.
GE
21
GE
21.2
original
14.2
original
17.9
GE
23.5
original
14.6
GE
15.25
original
16.3
GE
15.35
original
15.55
GE
19.05
GE
14
GE
20.7
GE
14.5
GE
21.8
GE
21
GE
15
original
16.25
original
11.95
original
14.75
original
15.05
original
16.05
original
14.05
original
16.75
76 Great Predictions Fish Card 1

Fish Card 2Use with Great Predictions.
GE
24.3
GE
15.5
original
19
original
15.6
GE
22.3
original
14.55
GE
15.05
original
18.4
GE
19.25
original
18.1
GE
14.9
GE
16.75
GE
22.25
GE
21.85
GE
18.5
GE
22.65
GE
23
original
16.35
original
19.15
original
16.85
original
15.6
original
15.95
original
16.5
original
14.5
Fish Card 2 Great Predictions 77

Fish Card 3Use with Great Predictions.
78 Great Predictions Fish Card 3
GE
21.3
GE
23.7
original
15.1
original
15.85
GE
18.9
original
16.9
GE
22.5
original
15
GE
17.7
original
12.6
GE
15.6
GE
16.8
GE
17
GE
20.05
original
16.2
original
13.6
original
15.25
original
13.65
original
15.5
original
16.95
original
17
original
13.45
original
17.45
original
15.65

Fish Card 4Use with Great Predictions.
Fish Card 4 Great Predictions 79
GE
18
GE
22.7
original
14.45
original
16.7
GE
18.25
original
15.35
GE
24.6
original
16.9
GE
16.55
original
15.85
GE
20.8
GE
15.7
GE
19.55
GE
18.2
original
16.05
original
14.9
original
15.4
original
15.95
original
16.05
original
17.3
original
14.55
original
16.35
original
13.1
original
16.1

Fish Card 5Use with Great Predictions.
80 Great Predictions Fish Card 5
GE
18.45
GE
17.5
original
15.35
original
15.8
GE
21.15
original
15.15
original
13.4
original
13.3
GE
20.6
GE
23.05
GE
22.5
original
17.2
original
17.55
original
16.25
original
17.3
original
17.6
original
13.2
original
16.65
original
14.9
original
16.25
original
16.35
original
15.75
original
17.9
original
13.8

Fish Card 6Use with Great Predictions.
Fish Card 6 Great Prediction 81
GE
17.3
GE
16.2
original
14
original
15.6
GE
14.15
original
16.2
original
17.7
original
15.65
GE
21.9
GE
20.15
GE
17.3
original
14.25
original
14.7
original
17.85
original
13.95
original
15
original
17.95
original
15.55
original
15
original
13.35
original
12.4
original
13.6
original
14.4
original
16.55

Fish Card 7Use with Great Predictions.
82 Great Predictions Fish Card 7
GE
23
GE
20.45
original
13.6
original
14.3
GE
18.8
original
16.85
original
15.65
original
17.55
GE
23.2
GE
19.9
GE
17.5
original
17.15
original
16.3
original
16.35
original
17.35
original
16.95
original
17.05
original
15.5
original
14.25
original
13.35
original
14.65
original
15.5
original
16.3
original
14.8

Fish Card 8Use with Great Predictions.
Fish Card 8 Great Predictions 83
GE
22.4
GE
21.75
original
16.7
original
14.9
GE
16.9
original
13.2
original
14.25
original
16.85
GE
13.6
GE
20.45
original
14.3
original
14.2
original
15.65
original
17.25
original
17.25
original
14.8
original
16.3
original
13.75
original
14.6
original
16.3
original
15.9
original
14.25
original
17
GE
19.35

Fish Card 9Use with Great Predictions.
84 Great Predictions Fish Card 9
original
15.15
original
16.65
original
17.4
original
19.55
original
14.85
original
16
original
15
original
14.6
original
17
original
16.05
original
16.95
original
16.65
original
14.8
original
15
original
18.1
original
15.85
original
14.15
original
16.05
original
14.7
original
18
original
15.35
original
13.6
original
17.45
original
18.5

Fish Card 10Use with Great Predictions.
Fish Card 10 Great Prediction 85
original
18.65
original
17.3
original
13.65
original
15.4
original
15.4
original
14.3
original
13.6
original
15
original
15.4
original
15.85
original
16.15
original
15.65
original
13.1
original
14.95
original
16.35
original
13.85
original
17.95
original
16.8
original
16.15
original
15.4
original
15.9
original
17.1
original
14.75
original
16.6
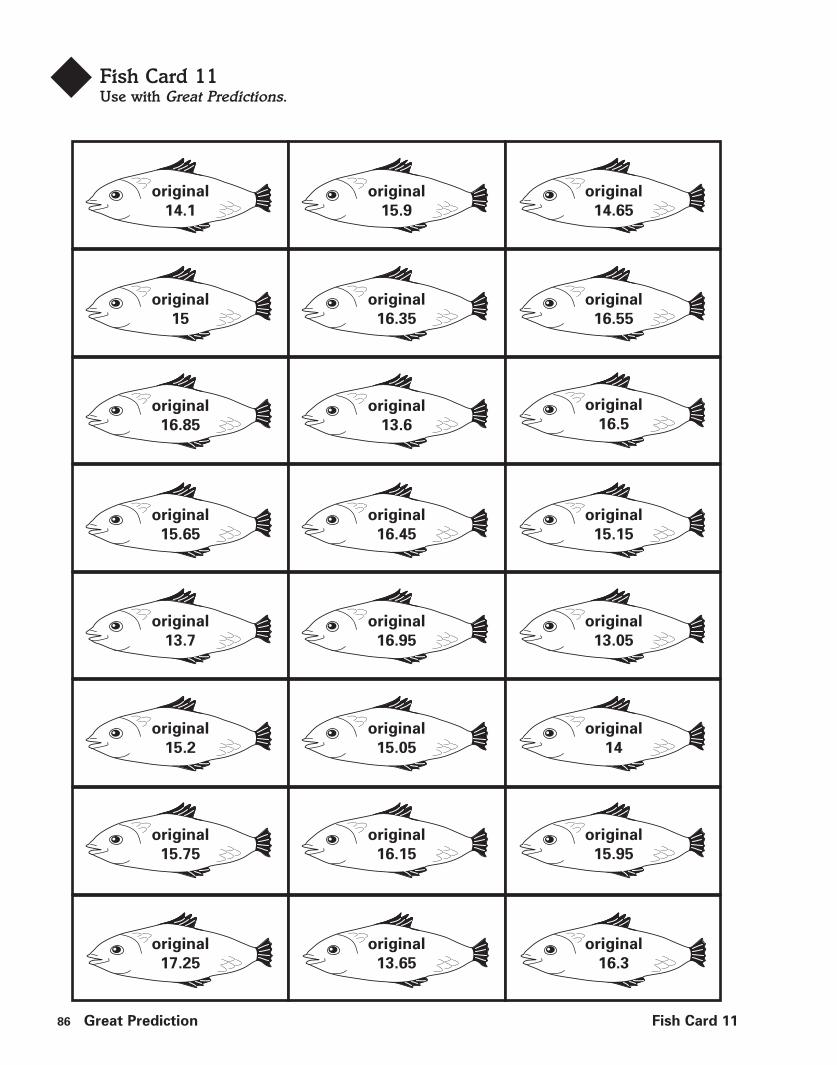
Fish Card 11Use with Great Predictions.
86 Great Prediction Fish Card 11
original
15
original
16.35
original
16.55
original
15.65
original
16.45
original
15.15
original
15.2
original
15.05
original
14
original
17.25
original
13.65
original
16.3
original
15.75
original
16.15
original
15.95
original
13.7
original
16.95
original
13.05
original
16.5
original
16.85
original
13.6
original
14.1
original
15.9
original
14.65

Fish Card 12Use with Great Predictions.
Fish Card 12 Great Prediction 87
original
17.55
original
17.25
original
16.4
original
17
original
15.5
original
14.45
original
15.45
original
15.7
original
16.75
original
15.4
original
14.95
original
14.5
original
15.2
original
14.85
original
11.8
original
16.05
original
16.25
original
15.9
original
15.85
original
17.85
original
14.4
original
16.85
original
15.9
original
14.45

Fish Card 13Use with Great Predictions.
88 Great Prediction Fish Card13
original
15.3
original
16.1
original
12.75
original
15.7
original
15.55
original
13.55
original
15.45
original
12.15
original
14.7
original
14.2
original
14.55
original
17.3
original
15.5
original
14.85
original
16.25
original
12.85
original
15.4
original
17.95
original
13.2
original
15
original
14.4
original
17
original
14.65
original
14.6
Fish Card 14Use with Great Predictions.
Fish Card 14 Great Prediction 89
original
17.45
original
15.15
original
16.3
original
15.65
original
13.1
original
15.1
original
14.2
original
16.6
original
15.65
original
12.7
original
15.95
original
18.55
original
15.65
original
14.8
original
17.2
original
16.5
original
15.8
original
15.65
original
15.4
original
14.2
original
16.45
original
15.5
original
14.9
original
16.65

Fish Card 15Use with Great Predictions.
90 Great Prediction Fish Card 15
original
14.8
original
13.95
original
14.35
original original original
original original
original original original
originaloriginal
19.2
original
original
14.6
original
15.35
original
16.45
GE GE GE
GE GE GE
GE

Section A: Drawing Conclusions from Samples 91
A
Hints and Comments(continued from page 4T)
Extension or Alternative Using Technology
2. a. As a group, investigate sample sizes of 40, 60,and 100. For each different sample size, decidehow many marked dots you would expect.Then record the actual number of marked dotsfor that sample. What observations can youmake? (answers: number of expected markeddots are: 8, 12, and 20 respectively)
b. Compare your results with those of othergroups. What conclusions can you draw?
A researcher wants to take a random sample of ten people fromthe population in the town. You are going to simulate taking thesample by using the diagram on Student Activity Sheet 1.
Drawing Conclusions from SamplesA
5. Reflect If something unusual happened in your life, how wouldyou decide whether it was due to chance or something else?Give an example.
Taking SamplesHere are some terms that are helpful when you want to talk aboutchance.
A population is the whole group in which you are interested.
A sample is a part of that population.
In a town of 400 people, 80 subscribeto the local newspaper. This could berepresented in a diagram in which80 out of 400 squares have been filledin randomly. So the red squaresrepresent the subscribers.
Close your eyes and hold your pencil over the diagram onStudent Activity Sheet 1. Let the tip of your pencil land lightlyon the diagram. Open your eyes and note where the tip landed.
Do this experiment a total of 10 times, keeping track of how manytimes you land on a black square. The 10 squares that you land onare a sample.
DrawingConclusionsfrom Samples

92 Great Predictions
Reasoningfrom Samples
C2. a. Write at least two observations about the lengths of the two
types of fish based on the plots you made with your group.One observation should be about the mean length of the fish.
b. Compare your observations with the observations of anothergroup. What do you notice?
The fish farmer claimed that GE fish grew twice the size of theoriginal fish.
3. Based on your data about the length of fish in the plots, do youagree or disagree with the fish farmer’s claim about the length ofthe GE fish? Support your answer.
Add all the data points from every student in your class to the plots.
4. Now would you change your answer to problem 3?
5. What claim could you make about the lengths of the GE fishcompared to the original fish based on the graphs of the wholeclass data? How would you justify your claim?
The fish farmer only wants to sell fish that are 17 centimeters (cm)or longer.
6. a. Based on the results of the simulation activity from your class,estimate the chance that a randomly caught GE fish is 17 cmor longer.
b. Estimate the chance that a randomly caught original fish is17 cm or longer.
c. Estimate the chance that a randomly caught fish is 17 cm orlonger. How did you arrive at your estimate?
CReasoning from Samples
Hints and Comments(continued from page 25T)
Overview
Students combine the data from their samples intoone big sample. They study this sample and drawconclusions about the lengths of the two types of fish.
About the Mathematics
By graphing data, the underlying distributionbecomes visible. In this case, the data are the lengthof fish.The distribution of the lengths approaches thenormal distribution (bell-shaped curve); as thesample size gets larger, the data in the sample willalso approach the normal distribution. Students cancharacterize data with measures of center like meanor median, combined with the spread in data. Thiswas addressed in the unit Dealing with Data.
Planning
Students may work on problems 2 and 3 in smallgroups. You may want to discuss their answers inclass. Problem 4 is a whole-class activity; you coulduse either the overhead or draw a large graph on theboard or flip chart. Problems 5–6 can be doneindividually or in pairs.
Comments About the Solutions
3. You may want to discuss how the data from theirsample can influence the conclusions and howreliable students think their conclusions are.
4. Discuss the effect of the growing sample in class.Most likely the general pattern will not changemuch, but the distribution of lengths from theGE fish will become more clear.
5. Students may have different opinions but shouldhave good reasons for their decisions. They mayfeel that the sample sizes are too small to makeany good decision.

Section C: Reasoning from Samples 93
C
Planning
Students can work on problems 7–10 individually orin pairs.
Comments About the Solutions
7. You may want to have students describe thedifferences in the shapes of the distributions ofthe lengths.
9. Whether the sample size will influence thestatements about chance will depend on thesamples students took. A larger sample does notnecessarily give a different chance. Because thesamples will vary, it is reasonable to expect somevariation in the calculations. Students would needto be concerned if they found a sample that wasvery different from what they might expect basedon the others.
Hints and Comments(continued from page 27T)
About the Mathematics
Data can be distributed in several ways. A verycommon distribution is the normal distribution thatshows as a bell-shaped curve. The two histograms ofthe length of the fish that students study on this pageare very different in shape: one has a kind of bell shape;the other one is flatter. Students must try to characterizethe distribution in an overall sense instead of just bylooking at individual data points. This is a veryimportant ability in statistics and probability. Theycan talk about these shapes using informal terms like“bump,” “flat,” “spread out,” and so on.
Students compare the two distributions and reasonabout the chances of catching fish of different lengths.The data from the two types of fish and their lengthscan be combined into one two-way table to find out ifa connection exists between length and type of fish.
7. a. If you caught an original fish at random, what length (roughly)is most likely? Use the data in the histograms and give reasonsfor your answer.
b. If you caught a GE fish, what length would be most likely?
Remember: The fish farmer only wants to sell fish that are 17 cm orlonger.
8. a. Based on the information in these graphs, estimate the chancethat a randomly caught original fish will be 17 cm or longer.
b. Estimate the chance that a randomly caught GE fish will be17 cm or longer.
c. Estimate the chance of randomly catching a fish that is 17 cmor longer.
9. a. Compare your answers to problems 6 and 8. Are they similar?If they are very different, what might explain the difference?
b. Why is the answer to 8c closer to the answer to 8a than to theanswer for 8b?
You can use a two-way table to organize the lengths of the fish thatwere caught.
10. a. Copy the two-way table into your notebook and fill in thecorrect numbers using the data from the histograms for thetotal of 343 fish. You already have a few of those numbers.
b. What is the chance the fish farmer will catch a GE fish?
c. Reflect How can you calculate in an easy way the chance thathe will catch an original fish?
d. What is the chance that he catches an original fish that is17 cm or longer?
e. Which type of fish do you advise the fish farmer to raise? Besure to give good reasons for your advice.
CReasoning from Samples
Original
GE
Total
TotalUp to 17 cm 17 cm or Longer
343
Reasoningfrom Samples