Embed Size (px)
Citation preview

EMISSION FACTOR DOCUMENTATION FOR
AP-42 SECTION 2.2
SEWAGE SLUDGE INCINERATION
Office of Air Quality Planning and StandardsOffice of Air and Radiation
U.S. Environmental Protection AgencyResearch Triangle Park, North Carolina 27711
July 1993
1-1
1.0 INTRODUCTION
The document "Compilation of Air Pollutant Emission Factors" (AP-42) has
been published by the U.S. Environmental Protection Agency (EPA) since 1972.
Supplements to AP-42 have been routinely published to add new emission source
categories and to update existing emission factors. AP-42 is routinely updated by
EPA to respond to new emission factor needs of EPA, state, and local air pollution
control programs and industry.
An emission factor relates the quantity (weight) of pollutants emitted to a
unit of activity of the source. The uses for the emission factors reported in AP-42
include:
1. Estimates of area-wide emissions;
2. Emission estimates for a specific facility; and
3. Evaluation of emissions relative to ambient air quality.
The purpose of this report is to provide background information from test
reports to support calculation of emission factors for sewage sludge incinerators
(SSI). Including the introduction (Chapter 1.0), this report contains five chapters.
Chapter 2.0 gives a description of the sewage sludge incineration industry. It
includes a characterization of the industry, an overview of the different process
types, a description of emissions, and a description of the technology used to control
emissions resulting from sewage sludge incineration. Chapter 3.0 is a review of
emissions data collection and analysis procedures. It describes the method used to
locate and collect test data, the screening of emission data reports, and the quality
rating system for both emissions data and emission factors. Chapter 4.0 details
pollutant emission factor development. It includes the review of specific data sets,
the results of data analysis, and the data base protocol. Chapter 5.0 presents the
AP-42 Section 2.5.

2-1
2.0 INDUSTRY DESCRIPTION
Incineration is a means of disposing of sewage sludge generated by the
treatment of wastewater from residential, commercial, and industrial
establishments. When compared to other forms of disposal, incineration has the
advantages of reducing the solid mass, destroying or reducing the organic matter
present in the sludge, and the potential for recovering energy through combustion.
Disadvantages include the necessity of ash disposal and the potential for air
emissions of pollutants.
This section provides background information on the current status of
sewage sludge incineration. In Section 2.1, the sewage sludge incineration industry
is briefly overviewed. Incinerator and emission control design are described in
detail in Sections 2.2 and 2.3, respectively.
2.1 CHARACTERIZATION OF THE INDUSTRY
There are currently about 170 sewage sludge incineration (SSI) plants in
operation in the United States. Three main types of incinerators are used:
Multiple hearth, fluidized bed, and electric infrared. Some sludge is co-fired with1
municipal solid waste in combustors based on refuse combustion technology.
Unprocessed refuse co-fired with sludge in combustors based on sludge incinerating
technology is limited to multiple hearth incinerators. Over 80 percent of the
identified operating sludge incinerators are of the multiple hearth design. About
15 percent are fluidized bed combustors and about 3 percent are electric. The
remaining combustors co-fire refuse with sludge.
Most SSI facilities are located in the eastern United States, though there are
a significant number on the West Coast. New York has the largest number of
facilities with 33. Pennsylvania and Michigan have 21 and 19 sites, respectively.
Approximately 5.9 million dry megagrams (Mg) (6.5 million dry tons) of
sludge are generated in U.S. municipal wastewater plants each year. It is2
estimated that 25 percent of this sludge is incinerated. This means that about3
1.5 million dry Mg (1.6 million dry tons) of sludge is incinerated annually. A

2-2
database containing results of the National Sewage Sludge Use and Disposal
Survey conducted in 1988, and sponsored by the U.S. EPA, is available to the public
from the National Technical Information Service (NTIS). The database contains
general operating, financial, and use disposal practice data, as well as chemical
concentrationss from sludge samples collected prior to disposal.
2.2 SLUDGE INCINERATION TECHNOLOGIES
Sewage sludge incineration refers to the oxidation of combustible materials
generated by wastewater sewage treatment plants to reduce the volume of solid
waste. The first step in the process of sewage sludge incineration is the dewatering
of the sludge. Sludge is generally dewatered until it is about 15 to 30 percent
solids. Above 25 percent solids, the sludge will usually burn without auxiliary fuel.
After dewatering, the sludge is sent to the incinerator where thermal oxidation
occurs. The unburned residual ash is removed from the incinerator, usually on a
continuous basis, and is disposed. A portion of the noncombustible waste, as well
as unburned volatile organic compounds, is carried out of the combustor through
entrainment in the exhaust gas stream. Air pollution control devices, primarily wet
scrubbers, are used to remove the entrained pollutants from the exhaust gas
stream. The cleaned gas stream is then exhausted to the ambient air, and the
collected pollutants, now suspended in the scrubber water, are sent back to the
head of the wastewater treatment plant.
Several different incineration technologies are used for sewage sludge
incineration. They include 1) multiple hearth, 2) fluidized bed, 3) electric,
4) co-incineration with refuse, 5) single hearth cyclone, 6) rotary kiln, and 7) high
pressure, wet air oxidation. In this section, only the first four will be discussed in
detail; multiple hearth and fluidized bed are most commonly used. The other
technologies are not widely used in the United States.4
2.2.1 Multiple Hearth Furnaces
The multiple hearth furnace (MHF) was originally developed for mineral ore
roasting nearly a century ago. The air-cooled variation has been used to incinerate
sewage sludge since the 1930s. The basic multiple hearth furnace is a verticlly

2-3
oriented cylinder. The outer shell is constructed of steel, lined with refractory, and
surrounds a series of horizontal refractory hearths. A hollow cast iron rotating
shaft runs through the center of the hearths. Attached to the central shaft are the
rabble arms, which extend above the hearths. Cooling air for the center shaft and
rabble arms is introduced into the shaft by a fan located at its base. Each rabble
arm is equipped with a number of teeth, approximately 6 inches in length, and
spaced about 10 inches apart. The teeth are shaped to rake the sludge in a spiral
motion, alternating in direction from the outside in, then inside out, between
hearths. Typically, the upper and lower hearths are fitted with 4 rabble arms, and
the middle hearths are fitted with two. Burners, providing auxiliary heat, are
located in the sidewalls of the hearths.
In most multiple hearth furnaces, partially dewatered sludge is fed onto the
perimeter of the top hearth by conveyors or pumps. The rabble arms move the
sludge through the incinerator by raking the sludge toward the center shaft where
it drops through holes located at the center of the hearth. On the next hearth, the
sludge is raked in the opposite direction. This process is repeated in the
subsequent hearths. The effect of the rabble motion is to break up solid material to
allow better surface contact with heat and oxygen. A sludge depth of about one
inch is maintained in each hearth at the design sludge flow rate.
Scum may also be fed to one or more hearths of the incinerator. Scum is the
material that floats on wastewater. It is generally composed of vegetable and
mineral oils, grease, hair, waxes, fats, and other materials that will float, and it
usually has a higher heating value and a larger volatile fraction than sludge. Scum
may be removed from many treatment units including pre-aeration tanks,
skimming tanks, and sedimentation tanks. Quantities of scum are generally small
compared to those of other wastewater solids.
Ambient air is first ducted through the central shaft and its associated rabble
arms. A portion, or all, of this air is then taken from the top of the shaft and
recirculated into the lowermost hearth as preheated combustion air. Shaft cooling
air which is not circulated back into the furnace is ducted into the stack

2-4
downstream of the air pollution control devices. The combustion air flows upward
through the drop holes in the hearths, countercurrent to the flow of the sludge,
before being exhausted from the top hearth. Air enters the bottom to cool the ash.
Provisions are usually made to inject ambient air directly into the middle hearths
as well.
From the standpoint of the overall incineration process, multiple hearth
furnaces can be divided into three zones. The upper hearths comprise the drying
zone where most of the moisture in the sludge is evaporated. The temperature in
the drying zone is typically between 425 and 760EC (800 and 1,400EF). Sludge
combustion occurs in the middle hearths (second zone) as the temperature is
increased between 815 and 925EC (1,500 and 1,700EF). The combustion zone can be
further subdivided into the upper-middle hearths where the volatile gases and
solids are burned, and the lower-middle hearths where most of the fixed carbon is
combusted. The third zone, made up of the lowermost hearth(s), is the cooling zone.
In this zone, the ash is cooled as its heat is transferred to the incoming combustion
air.
Multiple hearth furnaces are sometimes operated with afterburners to
further reduce odors and concentrations of unburned hydrocarbons. In the
afterburn process, furnace exhaust gases are ducted to a chamber where they are
mixed with supplemental fuel and air and are completely combusted. Some
incinerators have the flexibility to allow sludge to be fed to a lower hearth, thus
allowing the upper hearth(s) to function essentially as an afterburner.
Under normal operating conditions, 50 to 100 percent excess air must be
added to a MHF in order to ensure complete combustion of the sludge. Besides
enhancing contact between fuel and oxygen in the furnace, these relatively high
rates of excess air are necessary in order to compensate for normal variations in
both the organic characteristics of the sludge feed and the rate at which it enters
the incinerator. When an inadequate amount of excess air is available, only partial
oxidation of the carbon will occur with a resultant increase in emissions of carbon
monoxide, soot, and hydrocarbons. Too much excess air, on the other hand, can

2-5
cause increased entrainment of particulate and unnecessarily high auxiliary fuel
consumption.
Multiple hearth furnace emissions are usually controlled by a venturi
scrubber, an impingement tray scrubber, or a combination of both. Wet cyclones
are also used. Wet electrostatic precipitators (ESPs) are being installed as retrofits
where tighter limits on particulates and metals are required by State regulations.
2.2.2 Fluidized Bed Incinerators
Fluidized bed technology was first developed by the petroleum industry to be
used for catalyst regeneration. Fluidized bed technology was first used for
municipal sludge incineration in 1962. Fluidized bed combustors (FBCs) consist of
a verically oriented outer shell constructed of steel and lined with refractory.
Tuyeres (nozzles designed to deliver blasts of air) are located at the base of the
furnace within a refractory-lined grid. A bed of sand and ash, approximately 0.75
meters (2.5 feet) thick, rests upon the grid. Two general configurations are
distinguished based on how the fluidizing air is injected into the furnace. In the
"hot windbox" design, the combustion air is first preheated by passing through a
heat exchanger where heat is recovered from the hot flue gases. Alternatively,
ambient air can be injected directly into the furnace from a cold windbox.
Partially dewatered sludge is fed into the bed of the furnace. Air injected
through the tuyeres, at pressures from 20 to 35 kPa (3 to 5 psig), fluidizes the bed of
hot sand and the incoming sludge. Temperatures of 750 to 925EC (1,380 to
1,700EF) are maintained in the bed. Residence times are typically 2 to 5 seconds.
As the sludge burns, fine ash particles are carried out the top of the furnace. Some
sand is also removed in the air stream; sand make-up requirements are on the
order of 1 percent for every 60 hours of operation.4
The overall process of combustion of the sludge occurs in two zones. Within
the bed itself (zone 1), evaporation of the water and pyrolysis of the organic
materials occur nearly simultaneously as the temperature of the sludge rapidly
increases. In the second zone (freeboard area), the remaining free carbon and

2-6
combustible gases are burned. The second zone functions essentially as an
afterburner.
Fluidization of the bed achieves nearly ideal mixing between the sludge and
the combustion air, and the turbulence facilitates the transfer of heat from the hot
sand to the sludge. The most noticeable impact of the improved mixing and
combustion provided by a fluidized bed incinerator is the lower excess air required
for complete combustion of the sludge. Typically, FBCs can achieve complete
combustion with 20 to 50 percent excess air, about half the excess air required by
multiple hearth furnaces. As a consequence, FBC incinerators have generally lower
fuel requirements compared to MHF incinerators.
Fluidized bed incinerators most often have venturi scrubbers or
venturi/impingement tray scrubber combinations for emissions control.
2.2.3 Electric Incinerators
The first electric furnace was installed in 1975, and their use is not common.
An electric incinerator consists of a horizontally oriented, insulated furnace. A
woven wire belt conveyor extends the length of the furnace, and infrared heating
elements are located in the roof above the conveyor belt. Combustion air is
preheated by the flue gases and is injected into the discharge end of the furnace.
Electric incinerators consist of a number of prefabricated modules that are linked
together to provide the necessary furnace length.
The dewatered sludge is conveyed into one end of the incinerator. An
internal roller mechanism levels the sludge into a continuous layer approximately
one inch thick across the width of the belt. The sludge is sequentially dried and
then burned as it moves beneath the infrared heating elements. Ash is discharged
into a hopper at the opposite end of the furnace. The preheated combustion air
enters the furnace above the ash hopper and is further heated by the outgoing ash.
The direction of air flow is countercurrent to the movement of the sludge conveyor.
Exhaust gases leave the furnace at the feed end. Excess air rates vary from 20 to
70 percent.

2-7
Compared to MHF and FBC technologies, the electric furnace offers the
advantage of lower capital cost, especially for smaller systems. However, electric
costs in some areas may make an electric furnace infeasible. Another concern is
replacement of various components such as the woven wire belt and infrared
heaters, which have 3- to 5-year lifetimes.
Electric incinerator emissions are usually controlled with a venturi scrubber
or some other wet scrubber.
2.2.4 Co-incineration and Co-firing
Wastewater treatment plant sludge generally has a high water content and,
in some cases, fairly high levels of inert materials. As a result, its net fuel value is
often low. If one or more combustible waste materials are combined with sludge in
a co-incineration scheme (i.e., municipal solid waste and sewage sludge), a furnace
feed can be created that has both a low water concentration and a heat value high
enough to sustain combustion with little or no supplemental fuel.
Virtually any waste material that can be burned can be combined with
sludge in a co-incineration process. Common materials for co-incineration are
municipal solid waste, wood waste, and agricultural waste. Thus, a municipal or
industrial waste can be disposed of while providing an autogenous (self-sustaining)
sludge feed, thereby solving two disposal problems.
There are two basic approaches to burning sludge with municipal solid waste
(MSW): 1) use of MSW combustion technology by adding dewatered or dried sludge
to the MSW combustion unit, and 2) use of sludge combustion technology by adding
raw or processed MSW as a supplemental fuel to the sludge furnace. With the
latter, MSW is processed by removing noncombustibles, shredding, air-classifying,
and screening. Waste that is more finely processed is less likely to cause problems
such as severe erosion of the hearths, poor temperature control, and refractory
failures.5
Sewage sludge can also be co-fired with a non-waste material such as coal in
order to produce sustained combustion.

2-8
2.3 SEWAGE SLUDGE INCINERATION EMISSIONS AND CONTROL TECHNOLOGIES
2.3.1 Pollutant Emissions
Sewage sludge incinerators can emit significant quantities of pollutants. The
major pollutants emitted are: 1) particulate matter, 2) metals, 3) carbon monoxide
(CO), 4) nitrogen oxides (NO ), 5) sulfur dioxide (SO ), and 6) unburnedx 2
hydrocarbons. Partial combustion of sludge can result in emissions of intermediate
products of incomplete combustion (PICs) including toxic organic compounds.
Uncontrolled particulate emission rates vary widely depending on the type of
incinerator, the volatile compound and moisture contents of the sludge, and the
operating practices employed. Generally, uncontrolled particulate emissions are
highest from fluidized bed incinerators because suspension burning results in much
of the ash being carried out of the incinerator with the flue gas. Uncontrolled
emissions from multiple hearth and fluidized bed incinerators are extremely
variable, however. Electric incinerators appear to have the lowest rates of
uncontrolled particulate release of the three major furnace types, possibly because
the sludge is not disturbed during firing. In general, higher airflow rates increase
the opportunity for particulate matter to be entrained in the exhaust gases. Sludge
with low volatile content or high moisture content may compound this situation by
requiring more supplemental fuel to burn. As more fuel is consumed, the amount of
air flowing through the incinerator is also increased. However, no direct correlation
has been established between air flow and particulate emissions.
Metals emissions are affected by metals content of the sludge, fuel bed
temperature, and the level of particulate matter control. Since metals volatilized in
the combustion zone condense in the exhaust gas stream, most metals (except
mercury) are associated with fine particulate and are removed by the particulate
matter control device.
Carbon monoxide is formed when available oxygen is insufficient for
complete combustion or when combustion temperatures are too low. When
incomplete combustion occurs, CO is formed in place of CO .2

2-9
Nitrogen and sulfur oxide emissions are primarily the result of oxidation of
nitrogen and sulfur in the sludge. Therefore, these emissions can vary greatly
based on local and seasonal sewage characteristics.
Emissions of volatile organic compounds also vary greatly with incinerator
type and operation. Incinerators with countercurrent air flow such as multiple
hearth designs provide the greatest opportunity for unburned hydrocarbons to be
emitted. In the MHF, hot air and wet sludge feed are contacted at the top of the
furnace. Any compounds easily volatalized from the solids are immediately vented
from the furnace at temperatures too low to completely destruct them.
2.3.2 Control Technologies
Particulate emissions from sewage sludge incinerators have historically been
controlled by wet scrubbers, since the associated sewage treatment plant provides
both a convenient source and a good disposal option for the scrubber water. The
types of existing sewage sludge incinerator controls range from low pressure drop
spray towers and wet cyclones to higher pressure drop venturi scrubbers and
venturi/impingement tray scrubber combinations. Electrostatic precipitators and
baghouses are also employed, primarily where sludge is co-fired with municipal
solid waste.
There are three basic types of wet scrubbers:
1. Low energy (spray tower), primarily for acid gas control;
2. Medium energy (impingement scrubbers such as packed column, baffle
plate, and liquid impingement) for PM and/or acid gas control; and
3. High energy (venturi), primarily for PM control.
Low energy scrubbers (spray towers) are usually circular in cross-section.
The liquid is sprayed down the tower as the gases rise. Acid gases are
absorbed/neutralized by the scrubbing liquid. Large particles are removed by
impingement on the liquor pool, and finer particles are removed as the flue gas
rises through the tower. Low energy scrubbers mainly remove particles larger than
5-10 microns.7

2-10
Medium energy devices mostly rely on impingement to facilitate removal of
PM. This can be accomplished through a variety of configurations, such as packed
columns, baffle plates, and liquid impingement scrubbers.
High energy venturi scrubbers are designed for applications requiring high
removal efficiencies of submicron particles. They are often used for PM removal. A
typical venturi scrubber consists of a converging section, a throat, and a diverging
section.
The most widely used control device applied to a multiple hearth incinerator
is the impingement tray scrubber. Older units use the tray scrubber alone while
combination venturi/impingement tray scrubbers are widely applied to newer
multiple hearth incinerators and to fluidized bed incinerators. Most electric
incinerators and some fluidized bed incinerators use venturi scrubbers only.
In a typical combination venturi/impingement tray scrubber, hot gas exits
the incinerator and enters the precooling or quench section of the scrubber. In some
cases, hot flue gas from the incinerator passes through a waste heat boiler for steam
generation before going to the gas scrubber. Spray nozzles in the quench section
cool the incoming gas, and the quenched gas then enters the venturi section of the
control device.
Venturi water is usually pumped into an inlet weir above the quencher. The
venturi water enters the scrubber above the throat and floods the throat surface.
This eliminates build-up of solids and reduces abrasion. Turbulence created by
high gas velocity in the converging throat section deflects some of the water
traveling down the throat into the gas stream. Particulate matter carried along
with the gas stream impacts on these water particles and on the water wall. As the
scrubber water and flue gas leave the venturi section, they pass into a flooded elbow
where the stream velocity decreases, allowing the water and gas to separate. Most
venturi sections come equipped with variable throats. By restricting the throat
area within the venturi, the linear gas velocity and pressure drop increase. Up to a
certain point, increasing the venturi pressure drop increases the removal efficiency.

2-11
Venturi scrubbers typically attain 60 to 99 percent removal efficiency for
particulate matter, depending on pressure drop and particle size distribution.6
At the base of the flooded elbow, the gas stream passes through a connecting
duct to the base of the impingement tray tower. Gas velocity is further reduced
upon entry to the tower as the gas stream passes upward through the perforated
impingement trays. Water usually enters the trays from inlet ports on opposite
sides and flows across the tray. As gas passes through each perforation in the tray,
it creates a jet which bubbles up the water and further entrains solid particles. A
mist eliminator at the top of the tower reduces the carryover of water droplets in
the stack effluent gas. The impingement section can contain from one to four trays,
but most systems for which data are available have two or three trays.
Control devices such as fabric filters and dry ESPs are generally not used to
control emissions from sewage sludge incinerators due to the high moisture content
of the emission stream.

2-12
REFERENCES FOR CHAPTER 2.0
1. U.S. Environmental Protection Agency. Second Review of Standards ofPerformance for Sewage Sludge Incinerators, EPA-450/3-84-010, ResearchTriangle Park, NC, March 1984.
2. Environmental Regulations and Technology: Use and Disposal of MunicipalWastewater Sludge, EPA 625/10-84-003, U.S. Environmental ProtectionAgency Technology Transfer, September 1984.
3. U.S. Environmental Protection Agency. Seminar Publication: MunicipalWastewater Sludge Combustion Technology, EPA/626/4-85/015, Cincinnati,OH, September 1985.
4. Radian Corporation. Locating and Estimating Air Toxics Emissions fromSewage Sludge Incinerators, Research Triangle Park, NC, April 30, 1989.
5. U.S. Environmental Protection Agency. Process Design Manual for SludgeTreatment and Disposal, EPA-625/1-79-011, Cincinnati, OH, September1979.
6. U.S. Environmental Protection Agency. Control Techniques for ParticulateEmissions from Stationary Sources--Volume 1, EPA-450/3-81-005a, ResearchTriangle Park, NC, September 1982.
7. Radian Corporation. Hospital Waste Combustion Study: Data GatheringPhase. Prepared for the U.S. Environmental Protection Agency, ResearchTriangle Park, NC, EPA-450/3-88-017, December 1988.
8. Parish, M.G., Cleaver Brooks. Incinerator Heat Recovery and Its Effect onAir Pollution Control Selection. Presented at the 3rd National Symposiumon Infectious Waste Management, Chicago, IL, April 18, 1989.

3-1
3.0 GENERAL DATA REVIEW AND ANALYSIS PROCEDURES
3.1 LITERATURE SEARCH AND SCREENING
The first step of this investigation involved a search primarily to identify
recently-published literature relating to criteria and noncriteria pollutant emissions
associated with sewage sludge incineration. This task included an extensive
literature search, contacts to identify ongoing projects within EPA, and electronic
database searches. Source test reports and background documents for the previous
AP-42 section on sewage sludge incinerators were also retrieved from the EPA.
The literature search conducted for the update of this section included on-
line library system searches of the Office of Research and Development/National
Technical Information Service (ORD/NTIS) Database and the NSPS/CTG/CTC
database. The Crosswalk/Air Toxics Emission Factors (XATEF), VOC/PM Chemical
Speciation (SPECIATE), and the Aerometric Information Retrieval System
(AIRS)/Facility Subsystem Emission Factors (AFSEF) electronic databases were
also searched.
Contact was also made with the EPA's Office of Water (Alan Rubin), Risk
Reduction Engineering Laboratory (Harry Bostian), and Emission Standards
Division (Gene Crumpler), and the author of the AP-40 sewage sludge incineration
chapter (Cal Brunner).
3.2 LITERATURE AND DATA REVIEW
To reduce the large amount of literature collected to a final group of
references pertinent to this report, the following general criteria were used:
C Only primary references of emissions data were used.
C Test study source processes were clearly identified.
C Test studies specified whether emissions were controlled or
uncontrolled.
C Studies referenced for controlled emissions specify the control device.
C Data support (i.e., calculation sheets, sampling and analysis
description) was supplied.

3-2
C Test study units were convertible to selected reporting units.
C Test studies that were positively biased to a particular situation were
excluded.
A final set of reference materials was compiled after a thorough review of the
pertinent reports, documents, and information according to these criteria.
3.2 EMISSION DATA QUALITY RATING SYSTEM
As delineated by the Emission Inventory Branch (EIB), the reduced data set
was ranked for quality. The ranking of the data was used to identify questionable
data. Each data set was ranked as follows:
A - When tests were performed by sound methodology and reported inenough detail for adequate validation. These tests are not necessarilyEPA reference test methods, although such reference methods arepreferred.
B - When tests were performed by a generally sound methodology, butlack enough detail for adequate validation.
C - When tests were based on an untested or new methodology or arelacking a significant amount of background data.
D - When tests were based on a generally unacceptable method but themethod may provide an order-of-magnitude value for the source.1
The selected rankings were based on the following criteria:
C Source operation. The manner in which the source was operated iswell documented in the report. The source was operating withintypical parameters during the test.
C Sampling procedures. The sampling procedures conformed to a generally acceptable methodology. If actual procedures deviated fromaccepted methods, the deviations are well documented. When thisoccurs an evaluation is made of the extent such alternative procedurescould influence the test results.
C Sampling and process data. Many variations can occur unnoticed andwithout warning during testing. Such variations can induce widedeviations in sampling results. If a large spread between test resultscannot be explained by information contained in the test report, thedata are suspect and are given a lower rating.

3-3
C Analysis and calculations. The test reports contain original raw datasheets. The nomenclature and equations used were compared to those(if any) specified by EPA to establish equivalency. The depth of review of the calculations was dictated by the reviewer's confidence in theability and conscientiousness of the tester, which in turn was based on factors such as consistency of results and completeness of other areasof the test report.
3.3 PARTICLE SIZE DETERMINATION
There is no one method which is universally accepted for the determination
of particle size. A number of different techniques can be used which measure the
size of particles according to their basic physical properties. Since there is no
"standard" method for particle size analysis, a certain degree of subjective
evaluation was used to determine if a test series was performed using a sound
methodology for particle sizing.
For pollution studies, the most common types of particle sizing instruments
are cyclones and cascade impactors. Traditionally, cyclones have been used as a
precipitator ahead of a cascade impactor to remove the larger particles. These
cyclones are of the standard reverse-flow design whereby the flue gas enters the
cyclone through a tangential inlet and forms a vortex flow pattern. Particles move
outward toward the cyclone wall with a velocity that is determined by the
geometry, size and flow rate of the cyclone. Large particles are propelled by
centrifugal force towards the wall and are collected. A series of cyclones with
progressively decreasing cut-points can be used to obtain particle size distributions.
Cascade impactors used for the determination of particle size in process
streams consist of a series of plates or stages containing either small holes or slits
with the size of the openings decreasing from one plate to the next. In each stage of
an impactor, the gas stream passes through the orifice or slit to form a jet that is
directed toward an impaction plate. For each stage, there is a characteristic
particle diameter that has a 50 percent probability of impaction. This characteristic
diameter is called the cut-point (D50) of the stage. Typically, commercial

3-4
instruments have six to eight impaction stages with a backup filter to collect those
particles which are either too small to be collected by the last stage or which are
retrained off the various impaction surfaces by the moving gas stream.
3.4 PARTICULATE SIZE DATA ANALYSIS METHODOLOGY
The particulate emission information contained in the various reference
documents was reduced to a common format using a family of computer programs
developed especially for this purpose. These programs use the so-called "spline"
fits. Spline fits result in cumulative mass size distributions very similar to those
which would be drawn using a French curve and fully logarithmic graph paper. In
effect, the logarithm of cumulative mass is plotted as a function of the logarithm of
the particle size, and a smooth curve with a continuous, non-negative derivative is
drawn.
The process by which this smooth cumulative distribution is constructed
involves passing an interpolation parabola through three measured data points at a
time. The parabola is then used to interpolate additional points between measured
values. When the set of interpolated points are added to the original set of data, a
more satisfactory fit is obtained than would be the case using only the measured
data. The size-specific emission factors are determined once the size distribution is
obtained by a spline fit.
3.5 EMISSION FACTOR QUALITY RATING SYSTEM
The quality of the emission factors developed from analysis of the test data
was rated utilizing the following general criteria:
A - Excellent. Developed only from A-rated test data taken from manyrandomly chosen facilities in the industry population. The sourcecategory is specific enough to minimize the variability within thesource population.
B - Above average. Developed only from A-rated test data from a reasonable number of facilities. Although no specific bias is evident, itis not clear if the facilities tested represent a random sample of the industries. As with the A rating, the source category is specific enoughto minimize the variability within the source population.

3-5
C - Average. Developed only from A- and B-rated test data from a reasonable number of facilities. Although no specific bias is evident, itis not clear if the facilities tested represent a random sample of theindustry. As with the A rating, the source category is specific enoughto minimize the variability within the source population.
D - Below average. The emission factor was developed only from A- andB-rated test data from a small number of facilities, and there is reasonto suspect that these facilities do not represent a random sample of the industry. There also may be evidence of variability within the sourcecategory population. Any limitations on the use of the emission factorare noted in the emission factor table.
E - Poor. The emission factor was developed from C- and D-rated test data, and there is reason to suspect that the facilities tested do notrepresent a random sample of the industry. There also may beevidence of variability within the source category population. Limitations on the use of these factors are always clearly noted.1
The use of these criteria is somewhat subjective and depends to an extent on
the individual reviewer. Details of the rating of each candidate emission factor are
provided in Chapter 4 of this report.
REFERENCES FOR CHAPTER 3.0
1. Technical Procedures for Developing AP-42 Emission Factors and PreparingAP-42 Sections. Draft, Emission Inventory Branch, Office of Air QualityPlanning and Standards, U. S. Environmental Protection Agency, ResearchTriangle Park, North Carolina. March 6, 1992.
2. Interim Report to State/Local APC Agencies of Particle Size Distributionsand Emission Factors (Including PM10), Office of Air Quality Planning andStandards, U. S. Environmental Protection Agency, Research Triangle Park,North Carolina. July 1986.
3. Lime and Cement Industry--Source Category Report. Volume II--CementIndustry, EPA Contract No. 68-02-3891, Midwest Research Institute, KansasCity, Missouri. August 1986.

4-1
4.0 POLLUTANT EMISSION FACTOR DEVELOPMENT
This chapter describes the test data and methodology used to develop
pollutant emission factors for the sewage sludge incineration industry.
4.1 REVIEW OF SPECIFIC DATA SETS
A total of 108 references were documented and reviewed during the
literature search. These references are listed at the end of this chapter.
The following efforts were made to ensure that the selection and rating of
reference documents did not introduce a bias in the data. The majority of
references used were compliance test reports. Given the impetus for compliance
testing, these reports would be expected to characterize facilities with various levels
of maintenance, operation, and control. The remaining references were classified as
research or special study tests. In some cases, it could be reasoned that such
studies would involve testing of facilities with above average maintenance,
operation, and control and would, therefore, not be representative of the industry.
Rather than downgrade the ratings for these references, each reference was
considered on its own merit. The original group of 108 documents was reduced to a
final set of primary references utilizing the criteria outlined in Chapter 3.0. For
the reference documents not used, the reason(s) for rejection are summarized below:
Reference Reason for Rejection
8 Back-half collection included in results23 Control device not specified31 Insufficient lab, process, analytical data
35b Duplicate of test in References 34 n and s36 Not primary data
37a,b Insufficient lab, process, analytical data38 Duplicate of test in Reference 4
41a-j Test results based on only one run46 Duplicate of test in Reference 4250 Not primary data51 Test results based on only one run52 Insufficient process, control data

Reference Reason for Rejection
4-2
55 Duplicate of test in Reference 3056 Insufficient lab, process, analytical data57 Insufficient lab, process, analytical data58 Insufficient lab, process, analytical data59 Test results on only one run60 Test results on only one run61 Test results on only one run62 Insufficient lab, process, analytical data63 Insufficient lab, process, analytical data64 Insufficient lab, process, analytical data65 Insufficient process data66 Insufficient lab, process, analytical data73 Control device not specified74 Averages cannot be converted into selected reporting
units76 Scale-reading problems during test82 Insufficient lab, process, analytical data83 Duplicate of tests in Reference 594 Insufficient process data
100 Summary of tests in Referencees 104, 106, 107103 Insufficient process data105 Insufficient process data
The following is a discussion of the data contained in each of the primary references
used to develop candidate emission factors.
4.1.1 References 1 Through 3
References 1 through 3 are tests performed on three different sludge
incinerators by an EPA contractor. These tests were performed to gather emission
data for a study conducted under Tier 4 of the National Dioxin Study. The primary
objective of the tests was to determine the presence of dioxins and/or furan
emissions from the incineration process. Controlled data for these emissions are
provided in References 1 and 2. Reference 3 contains controlled and uncontrolled
emissions data. In References 1 and 3, testing results were also presented for

4-3
uncontrolled emissions of oxides of nitrogen (NO ), sulfur dioxide (SO ), and carbonx 2
monoxide (CO). Uncontrolled nonmethane volatile organic compound (VOC)
emissions results were provided in References 1 and 2. These values were obtained
from continuous monitoring of the combustion gases during the dioxin/furan tests.
A rating of A was assigned to the data in each of the tests for criteria
pollutants.
4.1.2 Reference 4
This report comprises emission tests performed on a fluidized-bed incinerator
to demonstrate the relationship between the temperature of incineration and the
emissions of certain trace metals. The tests were performed at three different
operating temperatures. Results were obtained for controlled emissions of total
particulate matter and metals (arsenic [As], cadmium [Cd], chromium [Cr], lead
[Pb], and nickel [Ni]). Modified Method 5 and source assessment sampling system
(SASS) train results were presented for each test, but the report states that SASS
train results were used in preference to the Modified Method 5 results because
approximately 10 times as much flow was sampled by the SASS train method.
Metal emissions did increase with increasing incineration temperature. Operating
temperatures for a fluidized-bed incinerator usually range from 680 to 820 Co
(1250 to 1500 F). These tests were conducted at 704, 816, and 927 C (1300, 1500,o o
and 1700 F). The data in this report were assigned a rating of B. Particle sizeo
determinations for controlled emissions were made by sampling with an Andersen
Cascade Impactor.
4.1.3 References 5o through 5r
These references contain data from particulate and gaseous emissions tests
conducted at four sludge incinerators. Each test provides controlled particulate
matter emission data, and, except for incinerator "q," uncontrolled data are also
presented. Controlled emission factors for Cd, Cr, Pb, SO , and H SO are2 2 4
presented for each incinerator. Data from incinerator "p" include controlled results
for Ni. Uncontrolled emission factors for SO and H SO are presented for2 2 4
incinerators "o," "p," and "r."

4-4
A rating of A was assigned to the data for incinerators "o" and "p." These
reports provided adequate detail for validation, and the methodology appeared to be
sound. The report for incinerator "q" did not contain sufficient process information
to determine whether the incinerator was operating within design specifications.
The report for incinerator "r" showed a wide, unexplained deviation in test results.
For these reasons, References 5q and 5r were given a B rating.
4.1.4 References 6 and 7
These are chromium and organics screening study test reports. The tests
were conducted by an EPA contractor on two incinerators located at the same site.
Tests were conducted at the inlet and outlet of the scrubber to determine the
concentration and mass emission rates of total particulate matter, semivolatile
organic compounds and VOCs. Results were also obtained for controlled methane
VOC emissions.
Total particulate matter emissions were determined using EPA Method 5.
Volatile organic compounds were measured with a Volatile Organic Sampling Train
(VOST) and semivolatile organic compound emissions were determined using
Modified Method 5 with an XAD-2 resin trap. The data for metals, semivolatile
organic compounds, and total particulate matter presented in Reference 7 were
assigned a rating of A. The report states that the VOC results must be considered
as "estimates" because the samples saturated the analytical systems during
analysis. Further, the inlet results were obtained from one incinerator and the
outlet results from another. Therefore, the volatile organic emission results were
assigned a rating of D and will be used for "order-of-magnitude" values only.
Particle size distribution measurements were made at the scrubber inlet and
outlet. Four samples were collected at the scrubber inlet and five at the scrubber
outlet. Particle size fractions were analyzed gravimetrically. Because the Method 5
particulate matter tests were conducted at the same time the particle size
determinations were made, the results can be used in the development of particle
size-specific emission factors.

4-5
4.1.5 References 9 through 13
These are the results of five particulate matter emissions compliance tests
performed on five different sludge incinerators located at one treatment plant.
Each test was conducted in accordance with EPA Methods 1 through 5 and provided
controlled emissions data.
It was determined that the tests were generally of good quality. However,
original raw field data sheets, laboratory data sheets, and sampling train
calibration data were not included with the reports. For this reason, a rating of B
was assigned to the test data in these references.
4.1.6 References 14 and 15
These are reports of compliance tests conducted to determine particulate
matter emissions from two different sludge incinerators. Each test was performed
in accordance with EPA Methods 1 through 5 and provided controlled emissions
data. The quality of each test was generally good. However, in each case,
information pertaining to design operating parameters (e.g., sludge feed rate) was
not provided; thus, it could not be determined if the sources were operating within
typical ranges of these parameters. Therefore, the test data from these references
were assigned a rating of B.
4.1.7 Reference 16
Reference 16 is a particulate matter emissions compliance test report that
provides controlled emissions data. The tests were performed in accordance with
EPA Methods 1 through 5. The quality of the tests and process description
provided were good, and the information required was complete. A rating of A was
assigned to the test data.
4.1.8 References 17 through 20
References 17 and 18 contain the results of two compliance tests for one
incinerator. References 19 and 20 contain information from compliance tests for
two incinerators at another site. For each test, EPA Methods 1, 2, 3, and 5 were
used to provide controlled particulate matter emissions data.

4-6
The quality of each test was good, and enough detail was provided for
adequate validation. The test data from each reference were assigned a rating of A.
4.1.9 Reference 21
Reference 21 is a source sampling report of testing performed concurrently at
the sludge incinerator scrubber inlet and scrubber stack to determine particulate
matter emissions and particle size distributions. The results of the EPA Method 5
tests provided controlled and uncontrolled particulate matter emissions data.
The tests were of good quality and all necessary data pertaining to process
descriptions and sampling and analytical data were provided. However, because
design parameters for the incinerator were missing, it is not known if the source
was operating within typical ranges for these parameters during the test. Because
of this, the data were rated B. Particle sizing was performed using a cascade
impactor attached to a probe on the Method 5 sampling train. The report presents
the scrubber collection efficiencies by particle size range.
4.1.10 References 22a through 22d
These compliance test reports present controlled particulate emissions data
for incinerators within the same metropolitan sewer district. The tests were
performed using EPA Methods 1 through 5. While the testing methodology appears
to be sound, all four reports lacked enough detail for adequate validation. Field,
laboratory, and calibration data were not provided in the reports. In addition, the
conditions under which the source was operated were not well documented. For
these reasons, each of the four tests was assigned a C rating.
4.1.11 References 24 and 25
These are reports of two particulate matter emissions compliance tests
performed on the same incinerator at different times. The testing methodology was
sound, and the level of detail of the documentation was adequate (except for
missing design parameters). However, the results of the tests, taken only 1 month
apart, show a wide deviation. Particulate matter emissions averaged
1.62 kilograms per dry megagram of sludge (3.25 pounds per dry ton of sludge) in
the first test and 0.36 kilograms per dry megagram of sludge (0.73 pounds per dry

4-7
ton of sludge) in the second test. While there may be a reasonable technical
explanation for the deviation, none was provided. Therefore, each test was
assigned a C rating.
4.1.12 References 26 through 29
These are reports of compliance tests conducted on four different sludge
incinerators. Results are presented for controlled emissions of total particulate
matter, NO (for References 26 through 28), SO , acid gases (HCl for References 26x 2
through 28, and H SO for Reference 27), and methane VOC. Reference 29 also2 4
contains controlled CO emission data. Reference 28 contains controlled Pb and Hg
emissions data. Controlled metal emissions data are included in References 26
and 28 for As, Cd, Cr, and Ni. Metal emissions data from Reference 27 were not
used because, according to information obtained from the State agency, the results
were based on sludge analysis.
The testing methodology for each test appeared to be generally sound. Each
of the reports lacked sufficient detail for adequate validation of the results. Also,
this State requires front- and back-half collections to be included in particulate
matter emission results, and the reports did not include a breakdown of the
collections. The State agency was contacted for additional information including
dry feed rates for each of the test runs and weights for the front-half collections of
particulate matter.
Because raw data sheets, design feed rates, and other process data were
missing from the reports, each data set was rated B.
4.1.13 Reference 30
Reference 30 is a particulate matter emissions compliance test report.
Sufficient documentation was provided for validation and the testing methodology
was generally sound. However, the first run of the test was made with the
percentage of isokinetic nozzle velocity less than the desired minimum of 90. The
report discussion mentions this deviation and states that corrections were made for
this in the report. Nevertheless, it was decided that only the second and third runs

4-8
would be used in determining the average emission value for this test. A rating
of B was assigned to the data.
4.1.14 Reference 32
This compliance report presented the results for particulate matter emissions
testing of one sludge incinerator. The testing methodology was sound and the level
of documentation was sufficient for validation purposes. However, background data
pertaining to the source operation and design parameters were not provided. For
this reason, the data were assigned a B rating.
4.1.15 Reference 33
Reference 33 is a particulate matter emissions compliance report for one
sludge incinerator. The tests were performed in accordance with EPA Method 5
and provided controlled emissions data. Complete background information and
testing details were provided. The data were given an A rating.
4.1.16 Reference 34n and s
This report presents the results of a source emissions survey conducted for an
incineration systems manufacturer. Testing was performed on two incinerators at
one site to determine particulate matter concentrations at both the scrubber inlet
and outlet. Tests at the scrubber inlet consisted of one run for each incinerator and
both back- and front-half collections were used. Three runs were used for each
outlet test, and the results were based on the front-half collections only.
The testing methodology was sound and the source process was described
adequately. Original field data, calibration information, and laboratory analysis
sheets were not included in the report. For this reason, the controlled (outlet) data
for each test were given a B rating. Uncontrolled (inlet) data were assigned a
D rating because the results were based on a single run. These data (using the
front-half collection results only) may provide an order-of-magnitude value for the
source.
Particle size distribution for uncontrolled emissions was determined using a
Coulter Counter. Results of particle sizing are presented in Reference 35b (a
duplicate of the particulate emissions test described in Reference 34).

4-9
4.1.17 References 35a, 35c, 35d, and 35e
These are reports presenting emission data for four infrared sludge
incinerators. Each of the reports provides controlled particulate matter emission
data, and Reference 35e provides uncontrolled data as well. Reference 35e also
presents emissions data for NO and SO before and after the control device.x 2
The data are part of summary reports compiled for an incinerator
manufacturer, and background information was not included. Raw data, analytical
reports, sampling procedures, calibration information, and process descriptions
were missing. Because of these deficiencies, each of the tests was assigned a
C rating.
References 35a and 35e provided controlled and uncontrolled particle size
data. In the case of Reference 35a, the uncontrolled particulate size distribution
data were established 5 months after the particulate loading tests. Therefore, these
data cannot be used.
4.1.18 References 39 and 40
These reports are part of research projects designed to investigate the
performance of air pollutant abatement systems for controlling metals and organics
emitted from sewage sludge incinerators. The tests were conducted by an EPA
contractor to determine the efficiency of an ESP and a baghouse, respectively. In
each case, testing was done on incinerators with existing scrubber systems, and
slipstreams were used for experimental testing of the control devices. Because
comparative data were needed, the reports contain scrubber inlet and outlet data
representing emissions not controlled by the ESP or the baghouse. Controlled and
uncontrolled emissions data are provided in Reference 39 for particulate matter, As,
Cd, Cr, Pb, and Ni. Uncontrolled emissions data are presented for nonmethane
VOC's in both reports and for NO , CO, and SO in Reference 39.x 2
The methodologies were sound, and background information and
documentation provided were complete in both reports. Therefore, both reports
were assigned A ratings.

4-10
Each report provides controlled and uncontrolled particulate matter mass
concentrations by SASS size fractions.
4.1.19 References 42 through 44
These are particulate matter emission compliance reports for sludge
incinerators at three different sites. In each case, the methodologies were sound,
and appropriate background information and documentation were provided. Each
data set was given an A rating.
4.1.20 Reference 45
This is a particulate matter and sulfur dioxide emissions test report for a
sludge incinerator. The report provides controlled emissions data for each of these
pollutants. While the methodology used was sound, the report did not include
sufficient background information to establish the design feed rate value.
Therefore, a B rating was assigned to the data.
4.1.21 Reference 47
Reference 47 is a particulate matter emission compliance report for one
sludge incinerator. Method 5 procedure was used for the test. The report did not
include complete documentation for validation purposes, nor did it provide design
parameters for the source. Therefore, the data were given a rating of B.
4.1.22 References 48 and 49
These references are reports of two particulate matter emission compliance
tests for the same incinerator. The tests were done in 1982 and 1984. Each report
contained documentation adequate for validation, and the test methodologies were
deemed to be sound. An A rating was assigned to each.
4.1.23 References 53 and 54
These are reports of compliance tests performed on two different sludge
incinerators. The reports contain controlled emissions data for particulate matter.
Reference 53 also contains data for Hg emissions after the control device.
In each case, sound testing methodologies were used. However, each report
lacked enough detail for adequate validation, e.g., source manner of operation was

4-11
not well documented. The State agency was contacted to determine dry feed rates
for use in emission factor calculations. Both reports were assigned a B rating.
4.1.24 References 67 through 72
References 67 through 72 comprise seven compliance tests on seven different
sludge incinerators. Each of the reports presents controlled particulate matter
emissions data. Other controlled emissions data reported include: Reference 68--
NO , CO, and nonmethane VOC's; Reference 69--NO , SO , and methane VOC's;x x 2
References 71 and 72--NO , and SO .x 2
Each of the tests was considered to have used sound testing methodologies,
and the reports included enough detail for adequate validation. The data were
assigned an A rating in each case.
4.1.25 Reference 75
This is a report of a compliance test performed on one incinerator and
provides controlled particulate matter emissions data. Sufficient process
information and field data were provided for validation of the results. However, no
information regarding the sampling procedures and test methodology was included
with the report. The State agency was contacted for this information and confirmed
that EPA Method 5 was used. The data were assigned a rating of A.
4.1.26 References 77 through 79
References 77 through 79 are reports of compliance tests performed on three
different sludge incinerators. Each test report provides controlled particulate
matter emissions data, and Reference 79 also provides controlled emissions data for
nonmethane VOC's. For each test report, the methodology was judged to be sound.
Each report included appropriate and complete background information with
details sufficient for validation. The reports were assigned A ratings.
4.1.27 Reference 80
This is a report of a compliance test performed on one sludge incinerator.
Controlled particulate matter emissions results are presented. Laboratory,
calibration, and field data sheets were provided, but information pertaining to the

4-12
source process was not included. The State agency was contacted to obtain this
information. The data were assigned an A rating.
4.1.28 Reference 81
This compliance test report provides controlled emissions data for total
particulate matter. The testing methodology was judged to be sound, and adequate
detail was provided for validation. A rating of A was assigned to the data.
4.1.29 Reference 84
This test report provides controlled emissions data for noncriteria pollutants.
The report included original raw field data sheets, laboratory data sheets, sampling
train calibration data, and process data. The quality of each test was good. The
data from the reference were assigned a rating of A.
4.1.30 References 85, 86, 87, and 88
These four reports (Sites 1 through 4) were all prepared under the same
group of authors for the U.S. EPA Water Engineering Research Laboratory. Sites 1
and 2 are MHF facilities with venturi and impingement scrubber pollution controls.
During testing, Site 1 handled 0.45 to 0.91 megagrams (Mg) per hour [0.5 to 1 ton
per hour (tph)] of dry sludge feed, and Site 2 handled about 1.3 Mg/hr (1.5 tph).
Controlled data only were available for Site 1, while both uncontrolled and
controlled data were reported for Site 2. At Site 1, data collected were for
18 organic compounds, 5 metals, and total PM. At Site 2, data collected covered
20 organic compounds and 6 metals. Emission tests for metals were conducted for
short-term and long-term conditions. Results of long-term tests were given an A
rating. Results of short-term testing were assigned a B rating due to likelihood that
fluctuations of results would occur. All other thes results were assigned an A
rating.
Site 3 is a FBC with venturi and impingement scrubber pollution control
devices. The facility processed an average of 0.9 Mg/hr (1 tph) of dry sludge during
testing, and emissions data collected were for controlled emissions. Data collected
covered 10 semivolatiles and 5 metals and were rated A.
4-13
Site 4 is another MHF. This facility used an afterburner, as well as venturi
and impingement scrubbers for air pollution control. The MHF was fed
approximately 0.5 Mg/hr (0.6 tph) dry sludge during testing. Pollutants were
sampled at 3 different locations: (1) uncontrolled emissions after the incinerator, (2)
emissions after the high energy scrubbers, and (3) emissions after the afterburner
and high energy scrubbers. Semivolatiles and metals data were collected for all
three operating conditions, and dioxins and furans data was collected for the third
operating condition. All data were rated A.
4.1.31 References 89, 90, and 91
All three of these reports present information on the same MHF facility
under a variety of test conditions. The facility is equipped with venturi and
impingement scrubbers.
Reference 89 presents two sets of tests on inlet and outlet emissions from the
venturi and impingement scrubbers during pilot-scale testing of a wet ESP and a
baghouse. Information was reported for 9 organic compounds during one set of
tests during the baghouse pilot-scale testing. Information was also reported for 19
organic compounds during one set of tests during the other set of tests conducted
during the ESP pilot-scale testing. The data from Reference 89 were assigned a
rating of A.
Reference 90 presents information on uncontrolled emissions from the
incinerator, and outlet emissions from the venturi and impingement scrubbers and
a wet ESP running in parallel. Information was reported for 24 metals in the
uncontrolled and controlled emission samples. The information from this reference
is rated B because some of the flue gas flow rates were calculated.
Reference 91 presents information on uncontrolled emissions from the
incinerator, and outlet emissions from the venturi and impingement scrubberss an
a fabric filter running in parallel. Information was reported for 24 metals in the
uncontrolled and controlled emission samples. The information from this sample is
rated A.

4-14
4.1.32 Reference 92
This report summarizes tests done at the Crenston facility on a multiple
hearth furnace equipped with a venturi/impingement/afterburner for control. The
report included information on dioxin/furan emissions and emissions of five metals.
Because of the lack of background information, the data were rated C.
4.1.33 Reference 93
This report summarizes tests for dioxins and furans done on a multiple
hearth incinerator. However, emissions were not measured at detectible levels.
Therefore, results of this test report were not used.
4.1.34 Reference 95
Reference 95 presents information on tests done at a MHF using a venturi
scrubber for control. The report presents information on 27 metals, dioxins/furans,
and polycyclic aromatic hydrocarbons (PAH’s) sampled at the venturi scrubber
outlet. The information from Reference 95 was assigned a rating of B because field
and analytical data sheets were not provided.
4.1.35 Reference 96
Reference 96 presents information on tests done at a MHF using a venturi
scrubber for air pollution control. Emissions from the venturi outlet were sampled
for 7 PAH’s. The data from this report were assigned a rating of C because field
and analytical data sheets were not included, and inadequate detail of sampling
procedures was provided.
4.1.36 Reference 97
Reference 97 presents information on tests conducted at an FBC using
venturi and impingement scrubbers for air pollution control. Emissions of 5 metals
were tested at the outlet of the venturi/impingement control system. The data from
this report were assigned a rating of C because field and analytical data sheets
were not included in the report.
4.1.37 Reference 98
Reference 98 contains data for three MHFs and one FBC. Two of the MHF’s
and the FBC are controlled with an impingement scrubber. The remaining MHF is

4-15
controlled with a cyclone scrubber. A total of 24 metals were tested at the inlet to
and outlet from the control devices for the MHF’s. Only outlet emissions from the
FBC were reported. The information from this reference was assigned a rating
of A.
4.1.38 Reference 99
Reference 99 contains data from tests done on one MHF using a
venturi/impingement system for air pollution control. The report presents
information on dioxins/ furans, 11 metals, 15 semi-volatile compounds, CO, HCl,
and total PM exiting the scrubber system. The data were rated A.
4.1.39 Reference 101
Reference 101 is a test report on a MHF equipped with a cyclone/venturi
system for air pollution control. Testing on the outlet emissions from the
cyclone/venturi system was performed to determine the emissions of HCl, PM, 12
metals, dioxins/furans, PAH compounds, and 3 organics. Testing was performed
during normal incinerator operation conditions with sludge feed rates between 1.5
and 1.7 tph (dry basis). The data are rated A.
4.1.40 Reference 102
Reference 102 contains data from tests conducted at a MHF equipped with a
venturi/impingement control system followed by a wet ESP. Emissions of 9 metals
were tested at the exit from the venturi/impingement system and after the wet ESP.
Data from this report are rated C because no field or analytical data sheets were
provided to validate the numbers reported.
4.1.41 References 104, 106, 107, and 108
These four reports (sites 6, 8, 9 and 10) are a continuation of those conducted
in References 85-88 (sites 1-4). Sites 6, 9, and 10 are MHF facilities. Site 8 is an
FBC facility.
Reference 104 presented data on 5 metals, PM and CO sampled at the inlet
and outlet of a venturi/impingement air pollution control system. Two sets of
results are reported: sampling during low CO operation and sampling during
normal CO operation. The data from this reference are rated A.

4-16
Site 8 is equipped with venturi/impingement scrubbers followed by a wet
ESP for air pollution control. Reference 106 presented data on 5 metals, SO , NO ,2 X
and CO sampled at the inlet to the venturi/impingement scrubbers, inlet to the ESP
(outlet from venturi/impingement), and outlet from the wet ESP. Also tested at the
inlet to the wet ESP were 14 organic compounds and dioxins/furans. The data from
this reference are rated A.
Site 9 is equipped with venturi/impingement scrubbers followed by a wet
ESP for air pollution control. Reference 107 presented data on 6 metals, PM, SO ,2
NO , CO, and organic compounds sampled at the inlet to the scrubbers, inlet to theX
ESP, and outlet from the ESP. However, data on the organic compounds could not
be converted to an emission rate value because stack flow rates were not reported
for this sampling run. Two sets of results were reported: sampling during low CO
operation and sampling during normal CO operation. All other test data are rated
A.
Site 10 is equipped with a cyclone and venturi for air pollution control.
Reference 108 presented data on 21 organic compounds sampled at the outlet of the
control system. Three sets of data were reported: tests conducted at low, medium
and high THC levels. The data from this reference are rated B because field and
analytical data sheets were not included.
4.2 RESULTS OF DATA ANALYSIS
Emission factor calculations were made in terms of weight of pollutant per
weight of dry sludge incinerated. It should be noted that the terms "controlled" and
"uncontrolled" in this discussion are indicative only of the location at which the
measurements were made.
A summary of the particulate emission data discussed below is contained in
Tables 4-1 and 4-2. Tables 4-3 through 4-7 present summaries of criteria pollutant
(other than particulate matter) data, and Tables 4-8 through 4-55 contain
summaries of noncriteria pollutant data. Table 4-56 summarizes the data
presented in Tables 4-1 through 4-55.

4-17
TABLE 4-1. SUMMARY OF EMISSION FACTORS FOR PARTICULATE MATTER FROMSEWAGE SLUDGE INCINERATORS
Source category/ Uncontrolled, After control devicereference/rating kg/Mg (lb/ton) kg/Mg (lb/ton) Efficiency, percent
Multiple hearth Cyclone 5r,b 23.1 (46.2) 1.17 (2.34) 94.9 79,a 2.930 (5.86) 98,q 51 (102) 1.86 (3.6) 96.4 Cyclone/impingement 78,a 0.404 (0.808) Cyclone/venturi 10,b 0.240 (0.480) 11,b 0.280 (0.560) 13,b 0.150 (0.300) 13,b 0.368 (0.736) 101,a 0.21 (0.42) Cyclone/venturi/impingement 39,a 15.9 (31.8) 0.309 (0.618) 98.1 Impingement 5o,a 178 (356) 0.458 (0.916) 99.7 5p,a 13.4 (26.8) 1.72 (3.44) 87.2 7,a 7.7 (15.4) 0.108 (0.216) 98.6 9,b 0.916 (1.832) 12,b 0.937 (1.874) 22d,c 0.375 (0.750) 30,b 0.233 (0.466) 53,b 0.574 (1.148) 54,b 0.521 (1.042) 67,a 1.116 (2.232) 68,a 1.16 (2.32) 71,a 0.179 (0.358) 72,a 0.726 (1.452) 75,a 0.233 (0.466)

4-18
TABLE 4-1. SUMMARY OF EMISSION FACTORS FOR PARTICULATE MATTER FROMSEWAGE SLUDGE INCINERATORS
(Continued)
Source category/ Uncontrolled, After control devicereference/rating kg/Mg (lb/ton) kg/Mg (lb/ton) Efficiency, percent
Venturi 21,b 12.4 (24.8) 1.73 (3.46) 86.1 24,c 0.365 (0.730) 25,c 1.625 (3.250) 26,b 0.274 (0.548) 27,b 7.065 (14.13) 32,b 1.60 (3.20) 47,b 0.540 (1.08) 70,a 0.429 (0.859) 77,a 0.880 (1.76)Venturi/impingement 15,b 0.235 (0.470) 16,a 0.411 (0.822) 17,a 0.105 (0.210) 18,a 0.270 (0.540) 19,a 0.370 (0.740) 20,a 0.290 (0.580) 22a,c 0.925 (1.850) 22b,c 0.460 (0.920) 22c,c 0.865 (1.730) 33,a 0.255 (0.510) 42,a 0.165 (0.330) 45,b 0.509 (1.018) 48,a 0.910 (1.820) 49,a 5.60 (11.2) 80,a 0.636 (1.272) 81,a 0.170 (0.340) 91,a 6.50 (13.0) 0.35 (0.70) 94.6 98,a 211 (422) 2.5 (5.0) 93.2 104,a 103.01 (206.3) 1.64 (3.3) 98 104,a 97.8 (195.7) 1.45 (2.9) 96.5 107,a 13.2 (26.4) 1.74 (3.47) 86.8 107,a 115.5 (230.9) 1.57 (3.14) 99

4-19
TABLE 4-1. SUMMARY OF EMISSION FACTORS FOR PARTICULATE MATTER FROMSEWAGE SLUDGE INCINERATORS
(Continued)
Source category/ Uncontrolled, After control devicereference/rating kg/Mg (lb/ton) kg/Mg (lb/ton) Efficiency, percent
Venturi/impingement/WESP 107,a 115.5 (230.9) 0.18 (0.36) 99.8
Fabric filter 91,a 0.20 (0.40) 0.002 (0.004) 99
Fluidized bed Cyclone/venturi/impingement 43,a 0.431 (0.862) 44,a 0.55 (1.10)
Impingement 5q,b 0.114 (0.228) 14,b 0.149 (0.298)
Venturi 69,a 0.570 (1.140)
Venturi/impingement 4,b 0.090 (0.180) 28,b 0.292 (0.584) 29,b 0.427 (0.854)
Venturi/impingement/WESP 98,a 0.25 (0.5) 106,a 230.5 (461.1)* 0.04 (0.08) 99.9 106,a 230.5 (461.1)* 0.01 (0.02) 100
Electric infrared Cyclone/venturi 35c,c 1.93 (3.86)
Impingement 35a,c 0.821 (1.642)

4-20
TABLE 4-1. SUMMARY OF EMISSION FACTORS FOR PARTICULATE MATTER FROMSEWAGE SLUDGE INCINERATORS
(Continued)
Source category/ Uncontrolled, After control devicereference/rating kg/Mg (lb/ton) kg/Mg (lb/ton) Efficiency, percent
Venturi/impingement 34n,d,b 2.50 (5.00) 0.472 (0.944) 81.1 34s,d,ba 4.05 (8.10) 0.640 (1.28) 35d,c 0.875 (1.750) 35e,c 4.55 (9.10) 1.818 (3.636) 60.0

4-21
TABLE 4-2. SUMMARY OF EMISSION FACTORS FOR PARTICLE SIZE (PM ) DATA 10FROM SEWAGE SLUDGE INCINERATORS
Uncontrolled Controlled
Source category/ microns Cum. % < lb/ton feed Cum. $ factor, lb/ton Controlreference/rating cut < cut feed efficiency, %
Cut diameter, Emission factor Emission
Multiple hearthImpingement
7,a 0.625 4.11 0.61 59.3 0.15 751.00 6.37 0.94 62.4 0.16 832.50 15.0 2.22 68.9 0.17 925.00 28.7 4.24 74.3 0.19 96
10.0 54.8 8.11 80.1 0.20 9815.0 80.0 11.8 83.7 0.21 98
Venturi
21,b 0.625 12.7 3.17 73.9 2.59 181.00 13.6 3.38 77.2 2.71 202.50 15.4 3.82 84.3 2.96 235.300 16.9 4.19 90.1 3.16 25
10.0 18.5 4.61 96.2 3.38 2715.0 19.6 4.87 99.3 3.49 28
Fluidized bedVenturi
4,b 0.625 32 0.161.0 60 0.302.50 71 0.355.00 78 0.39
10.0 86 0.4315.0 92 0.46

4-22
TABLE 4-2. SUMMARY OF EMISSION FACTORS FOR PARTICLE SIZE (PM ) DATA 10FROM SEWAGE SLUDGE INCINERATORS (Concluded)
Uncontrolled Controlled
Source category/ microns Cum. % < lb/ton feed Cum. $ factor, lb/ton Controlreference/rating cut < cut feed efficiency, %
Cut diameter, Emission factor Emission
Electric infraredImpingement
35a,c 0.625 3.41 0.0591.0 5.32 0.0922.50 12.6 0.225.00 24.3 0.42
10.0 46.8 0.8115.0 68.9 1.19
Venturi/impingement
34n,d 0.625 59.4 0.171.0 65.3 0.192.50 78.5 0.235.00 90.3 0.26
10.0 99.0 0.2915.0 100.0 0.29
34g,d 0.625 59.8 0.881.0 65.7 0.972.50 78.9 1.165.00 90.6 1.33
10.0 99.0 1.4615.0 100.00 1.47
35e,c 0.625 11.1 1.01 31.1 1.13 --1.0 13.9 1.526 36.2 1.32 --2.50 23.2 2.11 49.4 1.80 155.00 36.9 3.36 63.9 2.33 31
10.0 64.4 5.86 85.5 3.11 4715.0 93.7 8.53 100.0 3.64 57

4-23
TABLE 4-3. SUMMARY OF EMISSION FACTORS FOR VOLATILE ORGANIC COMPOUNDSFROM SEWAGE SLUDGE INCINERATORS
Source category/ Efficiency,reference/rating percentmethane nonmethane methane nonmethane
Uncontrolled, After control device, kg/Mg (lb/ton) kg/Mg (lb/ton)
Multiple hearth Cyclone 79,a 1.53 (3.06)
Cyclone/venturi 2,a 0.510 (1.02) 84,a 0.220 (0.440)
Cyclone/venturi/impingement 1,a 2.620 (5.24) 39,a 0.146 (0.292) 40,a 0.108 (0.216)
Impingement 6,d 0.39 (0.78) 68,a 0.785 (1.57)
Venturi 26,a 0.027 (0.054) 27,b 6.45 (12.9)
Fluidized Bed Venturi 69,a 1.65 (3.30)
Venturi/impingement 28,b 0.189 (0.378) 29,b 0.610 (1.220)

4-24
TABLE 4-4. SUMMARY OF EMISSION FACTORS FOR LEAD FROM SEWAGE SLUDGE INCINERATORS
Source category/ Uncontrolled, Controlled, Efficiency,reference/rating kg/Mg (lb/ton) kg/Mg (lb/ton) percent
Multiple hearth Cyclone 5r,b 0.037 (0.074) 98,a 0.044 (0.088) 0.016 (0.032) 64 Cyclone/venturi 84,a 0.0052 (0.0104) 101,a 0.0006 (0.0011) Cyclone/venturi/impingement 39,a 0.047 (0.094) 0.011 (0.022) 77.2 Impingement 50,a 0.019 (0.038) 5p,a 0.039 (0.078) 99,b 0.0031 (0.0063)Venturi/impingement 90,b 0.05 (0.10) 0.017 (0.0214) 66 102,c 0.00105 (0.0021) 91,a 0.03 (0.06) 0.003 (0.006) 90 85,b 0.011 (0.022) 85,a 0.02 (0.04) 95,a 0.064 (0.128) 0.018 (0.036) 71.6 86,b 0.013 (0.026) 88,a 0.068 (0.136) 0.037 (0.074) 45.6 104,a 0.14 (0.28) 0.04 (0.08) 71.2 104,a 0.23 (0.46)* 0.05 (0.11) 77 107,a 0.04 (0.08) 0.03 (0.05) 32.8 107,a 0.08 (0.17)* 0.04 (0.08) 54Venturi/WESP 102,c 0.00121 (0.00242) 0.00009 (0.00018) 92.7

4-25
TABLE 4-4. SUMMARY OF EMISSION FACTORS FOR LEAD FROM SEWAGE SLUDGE INCINERATORS(Continued)
Source category/ Uncontrolled, Controlled, Efficiency,reference/rating kg/Mg (lb/ton) kg/Mg (lb/ton) percent
Venturi 95,b 0.0009 (0.0018)Venturi/impingement/ afterburner 92,c 0.031 (0.062) 88,a 0.068 (0.136) 0.066 (0.132)Venturi/impingement/WESP 107,a 0.08 (0.17)*Wet ESP 90,b 0.05 (0.10) 0.00165 (0.0033) 95Fluidized Bed Impingement 5q,b 0.003 (0.006) Venturi/impingement 4,b 0.005 (0.010) 28,b 0.002 (0.004) 97,c 0.001 (0.002) 87,a 0.46 (0.92) 98,a 0.001 (0.002) 106,a 0.03 (0.06) 0.00002 (0.00004) 99.9
Venturi/impingement/WESP 106,a 0.03 (0.06) 0.000001 (0.00) 100
Fabric Filter 91,a 0.0008 (0.0016) 0.000005 (0.000010) 99.4
*Low CO.

4-26
TABLE 4-5. SUMMARY OF EMISSION FACTORS FOR SULFUR DIOXIDE FROMSEWAGE SLUDGE INCINERATORS
Source category/ Uncontrolled, Controlled,reference/rating kg/Mg (lb/ton) kg/Mg (lb/ton) Efficiency, percent
Multiple hearth Cyclone 5r,b 8.34 (16.68) 1.77 (3.54) 78.7 98,a 18.6 (37.2) 3.90 (7.80) 79.0 Cyclone/venturi/impingement 1,a 19.7 (39.4) 39,a 25.1 (50.2) Impingement 3,a 9.98 (19.96) 5o,a 14.4 (28.8) 0.031 (0.062) 99.7 5p,a 4.686 (9.372) 0.107 (0.214) 99.7 71,a 0.360 (0.720) 72,a 0.807 (1.614) 99,a 0.3 (0.6) Venturi 26,b 0.78 (1.56) 27,b 3.84 (7.68) Venturi/impingement 45,b 0.001 (0.002) 98,a 21.1 (42.2) 0.20 (0.40) 98.3Fluidized Bed Impingement 5q,b 0.347 (0.694) Venturi 69,a 9.25 (18.5) Venturi/impingement 28,b 0.10 (0.20) 29,b 0.78 (1.56) 98,a 0.76 (1.42) 106,a 0.15 (0.30) 0.01 (0.03) 91.2Electric infrared Venturi/impingement 35e,c 9.2 (18.4) 2.32 (4.64) 74.7

4-27
TABLE 4-6. SUMMARY OF EMISSION FACTORS FOR OXIDES OF NITROGEN FROMSEWAGE SLUDGE INCINERATORS
Source category/ Uncontrolled, After control devicereference/rating kg/Mg (lb/ton) kg/Mg (lb/ton) Efficiency, percent
Multiple hearth Cyclone 98,a 0.004 (0.008) Cyclone/venturi/impingement 1,a 4.37 (8.74) 39,a 6.73 (13.46) Impingement 3,a 5.965 (11.930) 68,a 5.65 (11.30) 71,a 0.888 (1.776) 72,a 3.77 (7.54) 99,a 0.44 (0.88) Venturi 26,b 0.248 (0.496) 27,b 1.705 (3.410)Venturi/impingement 98,a 0.08 (0.16) 107,a 0.3 (0.5)* 107,a 0.2 (0.4)Fluidized Bed Venturi 69,a 2.92 (5.84) Venturi/impingement 28,b 1.41 (2.82) 98,a 0.06 (0.12) 106,a 0.04 (0.09) 0.01 (0.02)Electric infrared Venturi/impingement 35e,c 4.32 (8.64) 2.90 (5.80)

4-28
TABLE 4-7. SUMMARY OF EMISSION FACTORS FOR CARBON MONOXIDE FROMSEWAGE SLUDGE INCINERATORS
Source category/ Uncontrolled, After control device Efficiency,reference/rating kg/Mg (lb/ton) kg/Mg (lb/ton) percent
Multiple hearth Cyclone 84,a 53 (106)
Cyclone/venturi 101,a 1.35 (2.7)
Cyclone/venturi/impingement 1,a 19.5 (39.0) 39,a 44.1 (88.2)
Impingement 3,a 27.0 (54.0) 68,a 1.65 (3.30) 72,a 1.78 (3.56) 99,a 3.26 (6.53)
Venturi/impingement 104,a 1.05 (2.11)* 104,a 2.04 (4.09) 107,a 1.42 (2.83) 107,a 0.65 (1.30)*
Fluidized Bed Venturi/impingement 29,b 2.13 (4.26) 106,a 0.005 (0.01) 0.003 (0.01) 27.7* Low CO.

4-29
TABLE 4-8. SUMMARY OF SULFURIC ACID AND HYDROGEN CHLORIDE, FACTORSFROM SEWAGE SLUDGE INCINERATORS
H SO HCl2 4
Source category/ Uncontrolled After control Efficiency, Uncontrolled After control Efficiency,reference/rating kg/Mg device percent kg/Mg (lb/ton) device percent
(lb/ton) kg/Mg (lb/ton) kg/Mg (lb/ton)
Multiple hearth Cyclone 5r,b 0.580 (1.16) 0.207 (0.414) 64.3 98,a 1.27 (2.54) 0.46 (0.92) 64.2Impingement 5o,a 0.491 (0.982) 0.042 (0.084) 91.4 5p,a 0.047 (0.094) 0.072 (0.144) 99,a Venturi 26,b 0.014 (0.028) 27,d 1.15 (2.30) 0.910 (1.820)Venturi/impingement 98,a 0.60 (1.20) 0.17 (0.34) 82.4Cyclone/venturi 101,a 0.012 (0.024)Cyclone/impingement 99,a 0.01 (0.03)Fluidized bed Impingement 5q,b 0.027 (0.054) Venturi/impingement 28,b 0.055 (0.110) 98,a 0.06 (0.12)

4-30
4-9. SUMMARY OF 2,3,7,8 TETRA-, TOTAL TETRA- AND TOTAL PENTACHLORINATED DIBENZO-P-DIOXINEMISSION FACTORS FROM SEWAGE SLUDGE INCINERATORSa
2,3,7,8 tetra Tetra
Source category/ After control After controlreference/rating Uncontrolled device Efficiency, Uncontrolled device Efficiency,
Fg/Mg (10 lb/ton) Fg/Mg (10 lb/ton) percent Fg/Mg (10 lb/ton) Fg/Mg (10 lb/ton) percent-9 -9 -9 -9
Multiple Hearth Cyclone/venturi 2,a 1.40 (2.80)
Cyclone/venturi/ impingement 0.263 (0.526) 63.8 (127.6) 1,a
Impingement 3,a 0.971 (1.942) 62.7 (125.4) 56.5 (113) 9.9 99,a 0.052 (0.105) 0.35 (0.69)
Venturi/impingement 92,c 2.4 (4.8) 134 (268) 88,a 1.63 (3.26)
Venturi/impingement/ afterburner 0.9 (1.8) 139 (278) 92,c
Fluidized Bed Venturi/impingement 106,a
Units in Fg/Mg (10 lb/ton) dry sludge.-9

4-31
TABLE 4-10. SUMMARY OF TOTAL PENTA- AND TOTAL HEXACHLORINATED DIBENZO-P-DIOXINEMISSION FACTORS FROM SEWAGE SLUDGE INCINERATORSa
Penta Hexa
Source category/ Uncontrolled After control Efficiency, Uncontrolled After control Efficiency,reference/rating Fg/Mg (10 lb/ton) device percent Fg/Mg (10 lb/ton) device percent-9
Fg/Mg (10 lb/ton) Fg/Mg (10 lb/ton)-9-9
-9
Multiple Hearth Cyclone/venturi/ impingement 1.51 (3.02) 4.38 (8.76) 1,a
Impingement 3,a 7.32 (14.64) 67.7 (135.4) 47.8 (95.6) 29.4 99,a 2.74 (5.48) 0.14 (0.29) 0.39 (0.80)
Venturi/impingement 92,c 50.6 (101.2) 39.5 (80) 88,a 55.6 (112) 37 (74)
Venturi/impingement/ afterburner 151.4 (300.8) 60 (120) 92,c
Fluidized Bed Venturi/impingement 106,a 1.1 (2.2) 0.9 (1.8)
Units in Fg/Mg (10 lb/ton) dry sludge.-9

4-32
TABLE 4-11. SUMMARY OF TOTAL HEPTA- AND TOTAL OCTACHLORINATED DIBENZO-P-DIOXINEMISSION FACTORS FROM SEWAGE SLUDGE INCINERATORSa
Hepta Octa
Source category/ Uncontrolled After control Efficiency, Uncontrolled After control Efficiency,reference/rating Fg/Mg (10 lb/ton) device percent Fg/Mg (10 lb/ton) device percent-9
Fg/Mg (10 lb/ton) Fg/Mg (10 lb/ton)-9-9
-9
Multiple Hearth Cyclone/venturi 2,a 0.774 (1.548) 3.439 (6.878)
Cyclone/venturi/ impingement 14.1 (28.2) 30.7 (61.4) 1,a
Impingement 3,a 340 (680) 144 (288) 57.6 375 (750) 105 (210) 72.2 99,a 1.6 (3.2) 1.50 (2.93)
Venturi/impingement 92,c 19.4 (38.8) 24.3 (48.6) 88,a 9.9 (20) 13.7 (27.4)
Venturi/impingement/ afterburner 23.3 (46.6) 12.1 (24.2) 92,c
Fluidized Bed Venturi/impingement 106,a 0.9 (1.8) 4.3 (8.6)
Units in Fg/Mg (10 lb/ton) dry sludge.-9

4-33
TABLE 4-12. SUMMARY OF TOTAL TETRA- THROUGH OCTACHLORINATED DIBENZO-P-DIOXINEMISSION FACTORS FROM SEWAGE SLUDGE INCINERATORSa
Source category/ Uncontrolled After control device Efficiency,reference/rating Fg/Mg (10 lb/ton) Fg/Mg (10 lb/ton) percent-9 -9
Multiple Hearth Cyclone/venturi 2,a 5.63 (11.26)
Cyclone/venturi/ impingement 113 (226) 1,a
Impingement 3,a 847 (1,694) 360 (720) 57.4 99,a 4 (8)
Venturi/impingement 92,c 271 (542)
Venturi/impingement/ afterburner 310 (620) 92,c
Units in Fg/Mg (10 lb/ton) dry sludge.-9

4-34
TABLE 4-13. SUMMARY OF 2,3,7,8 TETRA- AND TOTAL TETRAACHLORINATED DIBENZOFURANEMISSION FACTORS FROM SEWAGE SLUDGE INCINERATORSa
2,3,7,8 tetra Tetra
Source category/ Uncontrolled device Efficiency, Uncontrolled device Efficiency,reference/rating Fg/Mg (10 lb/ton) Fg/Mg (10 lb/ton) percent Fg/Mg (10 lb/ton) Fg/Mg (10 lb/ton) percent-9
After control After control
-9 -9 -9
Multiple Hearth Cyclone/venturi 2,a 7.50 (15.0) 74 (148) 84,a 3.8 (7.6) 26.1 (52.2)
Cyclone/venturi/ impingement 188 (376) 1,a
Impingement 3,a 620 (1,240) 371 (742) 40.2 1,708 (3,416) 1,395 (2,790) 18.3 99,a 0.79 (1.58) 7.1 (14.2)
Venturi/impingement 92,c 80.4 (160) 600 (1,200) 88,a 12.4 (24.8)
Venturi/impingement/ afterburner 53.7 (107.4) 350 (700) 92,c
Fluidized Bed Venturi/impingement 106,a 0.23 (0.46) 6.2 (12.5)
Units in Fg/Mg (10 lb/ton) dry sludge.-9

4-35
TABLE 4-14. SUMMARY OF TOTAL PENTA- AND TOTAL HEXACHLORINATED DIBENZOFURANEMISSION FACTORS FROM SEWAGE SLUDGE INCINERATORSa
Penta Hexa
Source category/ Uncontrolled After control Efficiency, Uncontrolled After control Efficiency,reference/rating Fg/Mg (10 lb/ton) device percent Fg/Mg (10 lb/ton) device percent-9
Fg/Mg (10 lb/ton) Fg/Mg (10 lb/ton)-9-9
-9
Multiple Hearth Cyclone/venturi 2,a 16.8 (33.6) 5.67 (11.34) 84,a 6.0 (12.0) 1.2 (2.4)
Cyclone/venturi/ impingement 57.5 (115) 1.777 (3.554) 1,a
Impingement 3,a 980 (1,960) 718 (1,436) 26.6 99.5 (199) 219 (438) 99,a 2.1 (4.2) 2.50 (5.04)
Venturi/impingement 92,c 1.3 (2.6) 74.1 (148.2) 88,a 39.7 (79.4)
Venturi/impingement/ afterburner 130 (260) 77.7 (155.4) 92,c
Fluidized Bed Venturi/impingement 106,a 5.2 (10.4) 4.1 (8.1)
Units in Fg/Mg (10 lb/ton) dry sludge.-9

4-36
TABLE 4-15. SUMMARY OF TOTAL HEPTA- AND TOTAL OCTACHLORINATED DIBENZOFURANEMISSION FACTORS FROM SEWAGE SLUDGE INCINERATORSa
Hepta Octa
Source category/ Uncontrolled After control device Efficiency, Uncontrolled After control device Efficiency,reference/rating Fg/Mg (10 lb/ton) Fg/Mg (10 lb/ton) percent Fg/Mg (10 lb/ton) Fg/Mg (10 lb/ton) percent-9 -9 -9 -9
Multiple Hearth Cyclone/venturi 2,a 0.257 (0.514) 84,a 0.9 (1.8) 1.2 (2.4)
Cyclone/venturi/ impingement 2.89 (5.78) 1.79 (3.58) 1,a
Impingement 3,a 481 (820) 410 (820) 14.9 491 (982) 310 (620) 36.9 99,a 0.34 (0.68) 0.12 (0.24)
Venturi/impingement 92,c 71.1 (142.2) 6.2 (12.4) 88,a 11.2 (22.4) 6.4 (12.8)
Venturi/impingement/ afterburner 48 (96) 7.7 (15.4) 92,c
Fluidized Bed Venturi/impingement 106,a 1.6 (3.3) 1.3 (2.6)
Units in Fg/Mg (10 lb/ton) dry sludge.-9

4-37
TABLE 4-16. SUMMARY OF TOTAL TETRA- THROUGH OCTACHLORINATED DIBENZOFURANEMISSION FACTORS FROM SEWAGE SLUDGE INCINERATORSa
Source category/ Uncontrolled After control device Efficiency,reference/rating Fg/Mg (10 lb/ton) Fg/Mg (10 lb/ton) percent-9 -9
Multiple Hearth Cyclone/venturi 2,a 97 (194) 84,a 35.5 (71.0)
Cyclone/venturi/impingement 1,a 250 (500)
Impingement 3,a 3,766 (7,532) 3,050 (6,100) 18.9 99,a 12 (24)
Venturi/impingement 92,c 931 (1,862)
Venturi/impingement/afterburner 88,a 318 (636) 92,c 613 (1,226)
Units in Fg/Mg (10 lb/ton) dry sludge.-9

4-38
TABLE 4-17. SUMMARY OF 1,1,1 TRICHLOROETHANE AND 1,1 DICHLOROETHANEEMISSION FACTORS FROM SEWAGE SLUDGE INCINERATORSa
1,1,1 Trichloroethane 1,1 Dichloroethane
Source category/ Uncontrolled After control device Efficiency, Uncontrolled After control device Efficiency,reference/rating g/Mg (10 lb/ton) g/Mg (10 lb/ton) percent g/Mg (10 lb/ton) g/Mg (10 lb/ton) percent-3 -3 -3 -3
Multiple Hearth Cyclone/impingement 89,a 0.13 (0.26) 3.22 (6.45) 0.23 (0.46) 89,a 0.66 (1.42)
Venturi/impingement 85,a 0.19 (0.38) 86,a 0.007 (0.014) 0.016 (0.032) 88,a 0.048 (0.096) 1.64 (3.28)
Venturi/impingement/ afterburner 0.048 (0.096) 1.38 (2.76) 88,a
Cyclone/venturi 108,b 0.43 (0.87)* 108,b 0.07 (0.14)
Fluidized Bed Venturi/impingement 87,a 0.44 (0.87) 106,a 0.08 (0.16)
Units in Fg/Mg (10 lb/ton) dry sludge.-9

4-39
TABLE 4-18. SUMMARY OF 1,2-DICHLOROETHANEEMISSION FACTORS FROM SEWAGE SLUDGE INCINERATORSa
Source category/ Uncontrolled After control device Efficiency,reference/rating g/Mg (10 lb/ton) g/Mg (10 lb/ton) percent-3 -3
Multiple Hearth Venturi/impingement 85,a 0.014 (0.028)
Venturi/impingement/ afterburner 88,a 0.031 (0.062)
Cyclone/venturi 108,b 0.004 (0.01)

4-40
TABLE 4-19. SUMMARY OF 1,2-DICHLOROBENZENE AND 1,3-DICHLOROBENZENEEMISSION FACTORS FROM SEWAGE SLUDGE INCINERATORS
1,2-Dichlorobenzene 1,3-Dichlorobenzene
Source category g/Mg device, g/Mg Efficiency, g/Mg device, g/Mg Efficiency,reference/rating (10 lb/ton) percent (10 lb/ton) (10 lb/ton) percent
Uncontrolled After control Uncontrolled After control
(10 lb/ton)-3 -3 -3 -3
Multiple hearth Venturi/impingement 85,a 0.001 (0.002) 0.0009 86,a 0.37 (0.74) 0.39 (0.78) (0.0018)
0.04 (0.08)
Cyclone/venturi 108,b 0.04 (0.07)* 0.3 (0.6)* 108,b 0.05(0.10)
Fluidized Bed Venturi/impingement 106,a 67.4 (134.7)
*High THC levels

4-41
TABLE 4-20. SUMMARY OF 1,4-DICHLOROBENZENE EMISSION FACTORS FROM SEWAGE SLUDGE INCINERATORS
1,4-Dichlorobenzene
Source category g/Mg g/Mg Efficiency,reference/rating (10 lb/ton) (10 lb/ton) percent
Uncontrolled After control device,
-3 -3
Multiple hearth Venturi/impingement 85,a 0.003 (0.006) 86,a 0.41 (0.82) 0.48 (0.96)
Cyclone/venturi 108,b 0.24 (0.49)* 108,b 0.007 (0.01)
Fluidized Bed Venturi/impingement 106,a 239 (479.4)
*High THC levels

4-42
TABLE 4-21. SUMMARY OF 2-NITROPHENOL AND ACETALDEHYDEEMISSION FACTORS FROM SEWAGE SLUDGE INCINERATORS
2-Nitrophenol Acetaldehyde
Source category g/Mg device, g/Mg Efficiency, g/Mg device, g/Mg Efficiency,reference/rating (10 lb/ton) (10 lb/ton) percent (10 lb/ton) (10 lb/ton) percent
Uncontrolled After control, Uncontrolled After control
-3 -3 -3 -3
Multiple hearth Venturi/impingement 86,a 6.0 (12.0) 1.18 (2.36) 80.0
Cyclone/impingement 99,a 0.16 (0.31)
Cyclone/venturi 108,b 0.76 (1.52)* 108,b 0.38 (0.75)
* High THC levels

4-43
TABLE 4-22. SUMMARY OF ACETONE EMISSION FACTORSFROM SEWAGE SLUDGE INCINERATORS
Acetone
Source category g/Mg device, g/Mg Efficiency,reference/rating (10 lb/ton) (10 lb/ton) percent
Uncontrolled After control
-3 -3
Multiple hearth venturi 89,a 3.16 (6.32)

4-44
TABLE 4-23. SUMMARY OF ACETONITRILE AND ACYLONITRILEEMISSION FACTORS FROM SEWAGE SLUDGE INCINERATORS
Acetonitrile Acylonitrile
Source category g/Mg device, g/Mg Efficiency, g/Mg device, g/Mg Efficiency,reference/rating (10 lb/ton) (10 lb/ton) percent (10 lb/ton) (10 lb/ton) percent
Uncontrolled After control Uncontrolled After control
-3 -3 -3 -3
Multiple hearth Venturi/impingement 88,a 25.4 (50.8) 9.76 (19.6) 61.6 25.4 (50.8) 33.5 (67.0) 85,a 8.20 (16.4) 86,a 25.3 (50.6) 10.1 (20.2)
Venturi/impingement/ afterburner 88,a 25.4 (50.8) 0.74 (1.44) 97.1 25.4 (50.8) 0.49 (0.97) 98.1
Cyclone/venturi 108,b 11.9 (23.8)* 108,b 0.15 (0.29)
* High THC levels.

4-45
TABLE 4-24. SUMMARY OF BENZENE, AND BIS(2-ETHYLHEXYL) PHTHALATEEMISSION FACTORS FROM SEWAGE SLUDGE INCINERATORS
Benzene Bis(2-ethylhexyl)phthalate
Source category g/Mg device, g/Mg Efficiency, g/Mg device, g/Mg Efficiency,reference/rating (10 lb/ton) (10 lb/ton) percent (10 lb/ton) (10 lb/ton) percent
Uncontrolled After control Uncontrolled After control
-3 -3 -3 -3
Multiple hearth Venturi/impingement 86,a 2.3 (4.6) 3.55 (7.10) 0.93 (1.86) 0.64 (1.28) 31.1 85,a 10.5 (21.1) 0.001 (0.002) 88,a 3.54 (7.04) 6.8 (13.6) 86,a 11.3 (22.6) 4.28 (8.56) 62.1
Venturi/impingement/ afterburner 88,a 3.54 (7.09) 0.17 (0.34) 95.2
Venturi 89,a 6.1 (12.2) 14.0 (28.1)
Cyclone/venturi 101,c 0.33 (0.66) 108,b 15.4 (30.8)* 1.0 (2.0)* 108,b 0.38 (0.75) 0.04 (0.08)
Fluidized bed Venturi/impingement 87,a 0.40 (0.80) 0.26 (0.52) 106,a 0.07 (0.14) 82.1 (164.2)
* High THC levels.

4-46
TABLE 4-25. SUMMARY OF BROMODICHLOROMETHANE AND CARBON TETRACHLORIDEEMISSION FACTORS FROM SEWAGE SLUDGE INCINERATORS
Bromodichloromethane Carbon Tetrachloride
Source category g/Mg device, g/Mg Efficiency, g/Mg device, g/Mg Efficiency, reference/rating (10 lb/ton) (10 lb/ton) percent (10 lb/ton) (10 lb/ton) percent
Uncontrolled After control Uncontrolled After control
-3 -3 -3 -3
Multiple hearth Venturi 89,a 0.0041 (0.0082) 1.48 (2.96)
Venturi/impingement afterburner 0.024 (0.048) 0.001 (0.002) 95.8 88,a
Venturi/impingement 85,a 0.07 (0.14) 86,a 0.0031 (0.0063) 0.002 (0.004) 35.5 88,a 0.024 (0.048) 0.011 (0.023) 54.2
Cyclone/venturi 108,b 0.007 (0.01)
Fluidized Bed Venturi/impingement 87,a 0.012 (0.024)

4-47
TABLE 4-26. SUMMARY OF CHLOROBENZENE AND CHLOROMETHANEEMISSION FACTORS FROM SEWAGE SLUDGE INCINERATORS
Chlorobenzene Chloromethane
Source category g/Mg device, g/Mg Efficiency, g/Mg device, g/Mg Efficiency,reference/rating (10 lb/ton) (10 lb/ton) percent (10 lb/ton) (10 lb/ton) percent
Uncontrolled After control Uncontrolled After control,
-3 -3 -3 -3
Multiple hearth Venturi 89,a 1.3 (2.6) 3.1 (1.11) 0.384 (0.768) 5.3 (10.4) 100,a 5.4 (10.8)
Venturi/impingement/ afterburner 88,a 0.66 (1.32) 0.26 (0.53) 60.6
Venturi/impingement 85,a 0.67 (1.34) 86,a 0.31 (0.62) 0.29 (0.59) 6.45 88,a 0.66 (1.32) 0.83 (1.65)
Cyclone/venturi 89,a 0.24 (0.48)*
0.006 (0.01)
Fluidized bed Venturi/impingement 87,a 0.005 (0.01)
* High THC levels.

4-48
TABLE 4-27. SUMMARY OF CHLOROFORM EMISSION FACTORSFROM SEWAGE SLUDGE INCINERATORS
Chloroform
Source category g/Mg device, g/Mg Efficiency,reference/rating (10 lb/ton) (10 lb/ton) percent
Uncontrolled After control
-3 -3
Multiple hearth Venturi 89,a 0.024 (0.048) 4.2 (8.3) 100,a 2.4 (4.7)
Venturi/impingement afterburner 88,a 0.063 (0.126) 0.49 (0.98)
Venturi/impingement 85,a 0.005 (0.01) 3.03 (6.05) 86,a 0.49 (1.0) 88,a 0.063 (0.126) 0.38 (0.76)
Cyclone/venturi 108,b 0.21 (0.43)* 108,b 0.024 (0.05)
Fluidized bed Venturi/impingement 87,a 3.76 (7.52) 106,a 0.20 (0.40)
* High THC levels.

4-49
TABLE 4-28. SUMMARY OF ETHYLBENZENE AND FORMALDEHYDEEMISSION FACTORS FROM SEWAGE SLUDGE INCINERATORS
Ethylbenzene Formaldehyde
Source category g/Mg device, g/Mg Efficiency. g/Mg device, g/Mg Efficiency,reference/rating (10 lb/ton) (10 lb/ton) percent (10 lb/ton) (10 lb/ton) percent
Uncontrolled After control Uncontrolled After control
-3 -3 -3 -3
Multiple hearth Venturi/impingement 85,a 0.94 (1.88) 86,a 0.30 (0.60) 0.41 (0.82) 88,a 1.32 (2.64) 1.68 (3.37)
Venturi/impingement/ afterburner 88,a 1.32 (2.64) 0.02 (0.04) 98.5
Cyclone/venturi 101,a 1.32 (2.64) 108,b 1.27 (2.54) 108,b 0.003 (0.01)
Venturi 89,a 9.76 (19.5) 89,a 0.68 (1.36) 2.29 (4.59) 0.40 (0.81)
Fluidized bed Venturi/impingement 106,a 0.03 (0.06) 87,a 0.02 (0.04)
* High THC levels.

4-50
TABLE 4-29. SUMMARY OF METHYL ETHYL KETONE EMISSION FACTORSFROM SEWAGE SLUDGE INCINERATORS
Methyl Ethyl Ketone
Source category g/Mg device, g/Mg Efficiency,reference/rating (10 lb/ton) (10 lb/ton) percent
Uncontrolled After control
-3 -3
Multiple hearth Venturi/impingement 88,a 6.1 (12.2) 8.88 (17.7)
Venturi 89,a 6.12 (12.24)
Venturi/impingement/ afterburner 88,a 6.1 (12.2) 0.05 (0.1) 99.2

4-51
TABLE 4-30. SUMMARY OF METHYL ISOBUTYL KETONE AND METHYLENE CHLORIDEEMISSION FACTORS FROM SEWAGE SLUDGE INCINERATORS
Methyl Isobutyl Ketone Methylene Chloride
Source category g/Mgreference/rating (10 lb/ton)
Uncontrolled
-3
After control Uncontrolled After controldevice, g/Mg Efficiency, g/Mg device, g/Mg Efficiency,(10 lb/ton) (10 lb/ton) (10 lb/ton)-3 percent percent-3 -3
Multiple hearth Cyclone/impingement 98,a 0.01 (0.03)
Venturi 89,a 0.016 (0.032) 2.15 (4.30)
Venturi/impingement 85,a 0.11 (0.22) 86,a 1.15 (2.30) 0.45 (0.89) 60.9 88,a 0.073 (0.146) 2.22 (4.44)
Venturi/impingement/ afterburner 88,a 0.073 (0.146) 0.42 (0.84)
Cyclone/venturi 108,b 0.27 (0.54)* 108,b 0.35 (0.71)
Fluidized bed Venturi/impingement 87,a 0.076 (0.152) 106,a 1.3 (2.6)
* High THC levels.

4-52
TABLE 4-31. SUMMARY OF NAPHTHALENE EMISSION FACTORSFROM SEWAGE SLUDGE INCINERATORS
Naphthalene
Source category g/Mg device, g/Mg Efficiency,reference/rating percent
Uncontrolled After control
(10 lb/ton) (10 lb/ton)-3 -3
Multiple hearth Venturi/impingement 88,a 0.024 (0.048) 86,a 18.3 (36.6) 0 (0) 100
Cyclone/venturi 101,a 0.0004 (0.0007) 108,b 2.83 (5.66)* 108,b 0.093 (0.19)
Fluidized bed Venturi/impingement 106,a 97.3 (194.5)
* High THC levels.
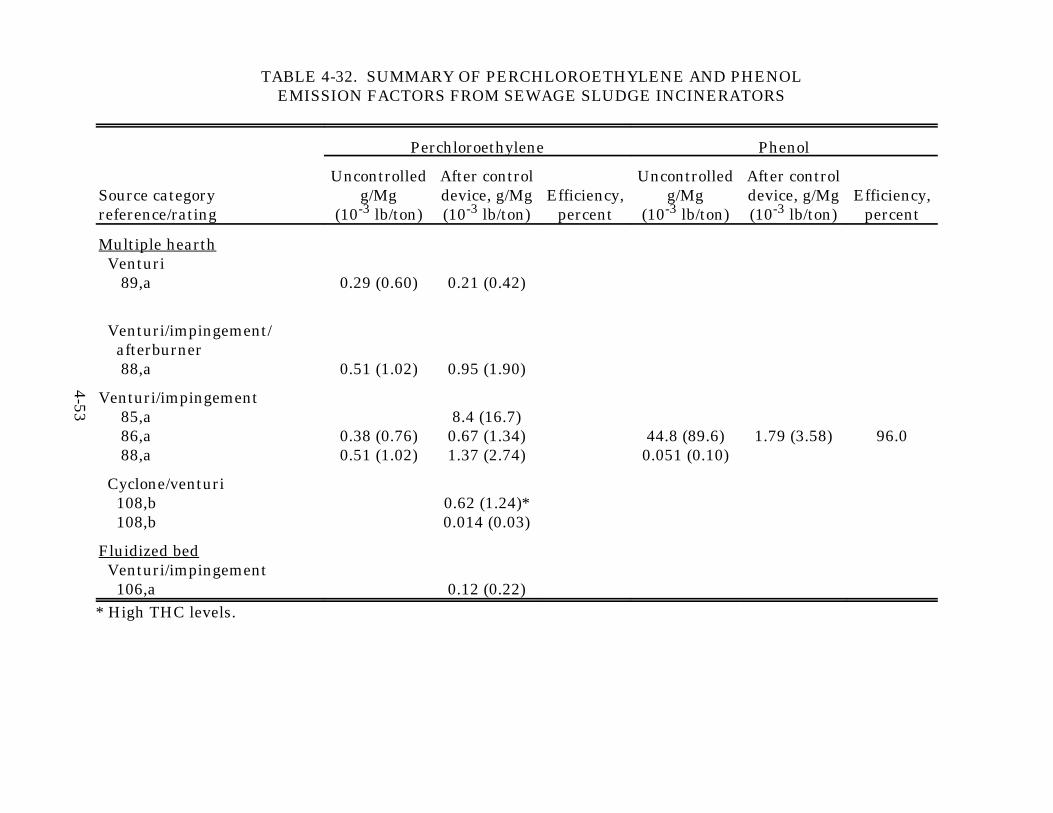
4-53
TABLE 4-32. SUMMARY OF PERCHLOROETHYLENE AND PHENOLEMISSION FACTORS FROM SEWAGE SLUDGE INCINERATORS
Perchloroethylene Phenol
Source category g/Mg device, g/Mg Efficiency, g/Mg device, g/Mg Efficiency,reference/rating (10 lb/ton) (10 lb/ton) percent (10 lb/ton) (10 lb/ton) percent
Uncontrolled After control Uncontrolled After control
-3 -3 -3 -3
Multiple hearth Venturi 89,a 0.29 (0.60) 0.21 (0.42)
Venturi/impingement/ afterburner 88,a 0.51 (1.02) 0.95 (1.90)
Venturi/impingement 85,a 8.4 (16.7) 86,a 0.38 (0.76) 0.67 (1.34) 44.8 (89.6) 1.79 (3.58) 96.0 88,a 0.51 (1.02) 1.37 (2.74) 0.051 (0.10)
Cyclone/venturi 108,b 0.62 (1.24)* 108,b 0.014 (0.03)
Fluidized bed Venturi/impingement 106,a 0.12 (0.22)* High THC levels.

4-54
TABLE 4-33. SUMMARY OF TETRACHLOROETHANE AND TOLUENE EMISSION FACTORS FROM SEWAGE SLUDGE INCINERATORS
Tetrachloroethane Toluene
Source category g/Mg device, g/Mg Efficiency, g/Mg device, g/Mg Efficiency,reference/rating percent percent
Uncontrolled After control Uncontrolled After control
(10 lb/ton) (10 lb/ton) (10 lb/ton) (10 lb/ton)-3 -3 -3 -3
Multiple hearth Venturi 89,a 21.4 (42.8)* 4.7 (9.4) 14.9 (29.8)* 89,a 2.2 (4.5) 16.2 (32.4)
Venturi/impingement 85,a 3.1 (6.3) 86,a 16.7 (33.4) 9.9 (19.8) 41.0 88,a 2 (4) 6.4 (12.8)
Venturi/impingement/ afterburner 88,a 2 (4) 0.66 (1.33) 67.0
Cyclone/venturi 108,b 6.5 (12.9) 108,b 0.008 (0.16)
Fluidized Bed Cyclone/impingement 87,a 0.62 (1.24) 106,a 0.09 (0.17)
* High THC levels.

4-55
TABLE 4-34. SUMMARY OF t-1,2-DICHLOROETHENE EMISSION FACTORSFROM SEWAGE SLUDGE INCINERATORS
t-1,2-Dichloroethene
Source category g/Mg device, g/Mg Efficiency,reference/rating (10 lb/ton) (10 lb/ton) percent
Uncontrolled After control
-3 -3
Multiple hearth Venturi 89,a 0.09 (0.18) 5.2 (10.4)
Venturi/impingement 88,a 0.047 (0.095)
Venturi/impingement/ afterburner 0.12 (0.25) 85,a 0.007 (0.013) 86,a 0.002 (0.004) 88,a
Cyclone/venturi 108,b 0.01 (0.02)

4-56
TABLE 4-35. SUMMARY OF M/P-XYLENE, AND TOTAL XYLENESEMISSION FACTORS FROM SEWAGE SLUDGE INCINERATORS
M/P-Xylene Total Xylenes
Source category g/Mgreference/rating (10 lb/ton)
Uncontrolled
-3
After control Uncontrolled After controldevice, g/Mg Efficiency, g/Mg device, g/Mg Efficiency,(10 lb/ton) (10 lb/ton) (10 lb/ton)-3 percent percent-3 -3
Multiple hearth Venturi 89,a 0.95 (1.90) 2.0 (4.0) 89,a 0.67 (1.34) 2.0 (4.0) 0.83 (1.66)

4-57
TABLE 4-36. SUMMARY OF ARSENIC EMISSION FACTORSFROM SEWAGE SLUDGE INCINERATORS
Arsenic
Source category g/Mg device, g/Mg Efficiency,reference/rating (10 lb/ton) (10 lb/ton) percent
Uncontrolled After control
-3 -3
Multiple hearth Cyclone/venturi 101,c 0.10 (0.20)Cyclone/venturi/impingement 14.7 (29.4) 0.849 (1.698) 94.2 39,a Venturi 26,b 0.004 (0.008) 92,c 0.09 (0.18) Venturi/impingement 102,c 5.90 (11.80) 0.26 (0.52) 95.5 91,a 0.19 (0.38) 107,a 1.68 (3.36)* 2.01 (4.03) 107,a 1.03 (2.06) 1.54 (3.08) 86,a 90,a 14 (28.1) 0.906 (1.81) 93.5 88,a 0.30 (0.60) 0.005 (0.010) 98.3 85,a 0.07 (0.14) 85,a 0.04 (0.08) 86,a 1.80 (3.6) 0.34 (0.68) 81.1 86,a 1.31 (2.62) 0.39 (0.78) 70.2 Venturi/WESP 102,c 0.12 (0.24) 0.013 (0.024) 89.2 107,a 1.68 (3.36)* 1.21 (2.42) 28 Venturi/impingement afterburner 88,a 0.030 (0.60) 0.04 (0.08) 86.7 92,c 0.04 (0.08) ESP 90,b 14 (28) 1.20 (2.40) 92.4 Fabric Filter 91,a 0.16 (0.32) 0.003 (0.006) 98.1Fluidized bed Venturi/impingement 4,b 0.003 (0.006) 28,b 0.019 (0.038) 87,a 0.028 (0.056) 106,a 2.22 (4.45) 0.01 (0.02) 99.5 Venturi/impingement/WESP 106,a 2.22 (4.5) 0.005 (0.009) 99.8
* Low CO.

4-58
TABLE 4-37. SUMMARY OF BERYLLIUM EMISSION FACTORSFROM SEWAGE SLUDGE INCINERATORS
Beryllium
Source category g/Mg device, g/Mg Efficiency,reference/rating (10 lb/ton) (10 lb/ton) percent
Uncontrolled After control
-3 -3
Multiple hearth Venturi/impingement 86,a 0.008 (0.016) 0.0007 (0.0014) 91.3 104,a 0.04 (0.08)* 0.005 (0.01) 89 104,a 0.04 (0.07) 0.01 (0.02) 85.4
Fluidized bed Venturi/impingement 106,a 0.4 (0.8) 0.0002 (0.0003) 99.95
Venturi/impingement/WE 0.4 (0.8) 0.0002 (0.0004) 99.95SP 106,a
* Low CO.

4-59
TABLE 4-39. SUMMARY OF CHROMIUM AND MERCURY EMISSION FACTORSFROM SEWAGE SLUDGE INCINERATORS
Chromium MercurySource category/ Uncontrolled After control Efficiency, Uncontrolled After control Efficiency,reference/rating g/Mg device, g/Mg percent g/Mg device, g/Mg percent
(10 lb/ton) (10 lb/ton) (10 lb/ton) (10 lb/ton)-3 -3 -3 -3
Multiple hearth Cyclone 5r,b 3.86 (7.72) 98,a 12.1 (24.2) 1.72 (3.44) 85.8 99,a 0.27 (0.552) 2.31 (4.63) Cyclone/venturi 84,a 0.8 (1.6) 101,a 0.26 (0.53) 1.65 (3.30)Impingement 5o,a 3.52 (7.04) 5p,a 16.1 (32.2) 53,b 0.968 (1.936) Cyclone/impingement 99,a 0.039 (0.077) Venturi 26,b 0.062 (0.124) 95,b 0.048 (0.086) 0.0051 (0.0101) Cyclone/venturi/ impingement 39,a 16.5 (33) 11.2 (22.4) 32.0Venturi/impingement 85,b 0.35 (0.70) 90,b 10.4 (20.8) 57 88,a 1.26 (2.52) 102,c 0.082 (0.164) 91,a 52.5 (105.0) 1.11 (2.22) 97.9 85,a 0.21 (0.42) 86,b 2.54 (5.08) 0.44 (0.88) 82.7 86,a 3.02 (6.04) 0.30 (0.60) 90.1 98,a 22.1 (44.2) 5.57 (11.14) 75.1 107,a 4.35 (8.69) 3.85 (7.70) 11.45 107,a 8.93 (17.85)* 0.99 (1.96) 89 104,a 28.68 (57.36) 0.2 (0.4) 99.3 104,a 33.8 (67.6) 0.09 (0.19) 99.7

4-60
TABLE 4-39. SUMMARY OF CHROMIUM AND MERCURY EMISSION FACTORSFROM SEWAGE SLUDGE INCINERATORS
(Continued)
Chromium MercurySource category/ Uncontrolled After control Efficiency, Uncontrolled After control Efficiency,reference/rating g/Mg device, g/Mg percent g/Mg device, g/Mg percent
(10 lb/ton) (10 lb/ton) (10 lb/ton) (10 lb/ton)-3 -3 -3 -3
Venturi/impingement/ afterburner 92,b 4.89 (9.8) ESP 90,b 16.3 (33.3) 1.45 (2.90) 91.1 Venturi/WESP 102,c 0.011 (0.022) 0.011 (0.022) 0 Fabric Filter 91,a 0.34 (0.68) 0.04 (0.08) 88.8 Venturi/impingement/ WESP 107,a 4.35 (8.7)* 0.11 (0.23) 97Fluidized bed Impingement 5q,b 0.319 (0.638) Venturi/impingement 4,b 0.091 (0.182) 28,b 0.575 (1.15) 0.03 (0.06) 97,a 0.002 (0.005) 87,a 0.71 (1.42) 98,a 32.3 (64.5) 0.16 (0.32) 99.5 106,a 0.0008 (0.17) Venturi/impingement/ WESP 107,a 32.3 (64.5) 0.026 (0.05) 99.92
* Low CO.

4-61
TABLE 4-40. SUMMARY OF NICKEL EMISSION FACTORSFROM SEWAGE SLUDGE INCINERATORS
Nickel
Source category g/Mg device, g/Mg Efficiency,reference/rating (10 lb/ton) (10 lb/ton) percent
Uncontrolled After control
-3 -3
Multiple hearth Cyclone 98,a 3.5 (7.0) 0.079 (0.158) 99 99,a 0.074 (0.148) Cyclone/venturi 84,a 0.65 (1.3) 101,c 0.044 (0.088) Cyclone/venturi/ impingement 5.4 (10.8) 4.51 (9.02) 16.5 39,a Impingement 5p,a 4.12 (8.24) Venturi 26,b 0 037 (0 074) 95,b 0.096 (0.192) Venturi/impingement 85,a 0.11 (0.22) 90,b 4.95 (64.4) 88,a 6.2 (12.4) 0.38 (0.76) 93.9 91,a 27.3 (54.6) 1.52 (3.04) 94.4 98,a 9.51 (19.0) 1.40 (2.80) 86.0 85,b 0.18 (0.36) 86,a 4.52 (9.04) 1.02 (2.04) 77.4 86,b 2.90 (5.80) 0.76 (1.52) 73.8 98,a 0.26 (0.52) 104,a 3.1 (6.1)* 0.1 (0.2) 97 104,a 2.9 (5.8) 0.2 (0.4) 93.4 107,a 8.2 (16.4) 0.6 (0.13) 92.2 107,a 20.5 (41.0) 0.08 (0.16) 100 Venturi/impingement/ afterburner 88,a 6.2 (12.4) 1.31 (2.62) 78.9 92,a 0.44 (0.88) Cyclone/impingement 98,a 0.79 (1.58) 99,a 2.91 (5.83) l00,a 0.11 (0.22)
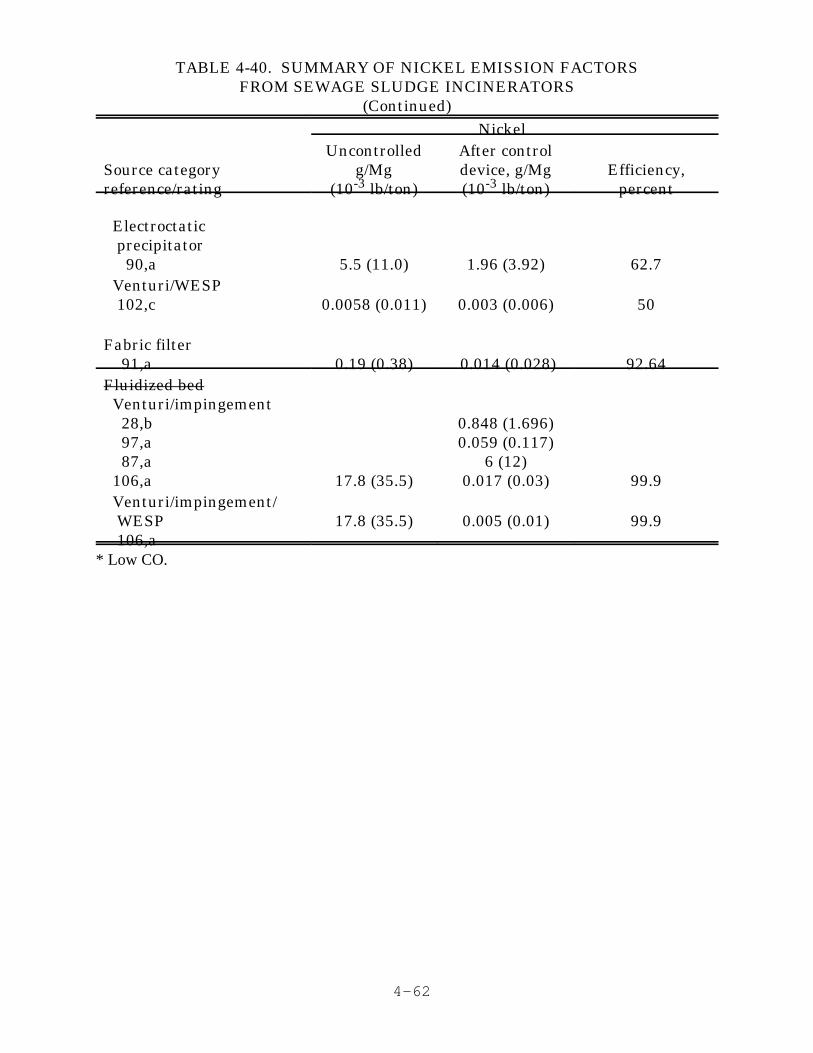
TABLE 4-40. SUMMARY OF NICKEL EMISSION FACTORSFROM SEWAGE SLUDGE INCINERATORS
(Continued)Nickel
Source category g/Mg device, g/Mg Efficiency,reference/rating (10 lb/ton) (10 lb/ton) percent
Uncontrolled After control
-3 -3
4-62
Electroctatic precipitator 90,a 5.5 (11.0) 1.96 (3.92) 62.7 Venturi/WESP 102,c 0.0058 (0.011) 0.003 (0.006) 50
Fabric filter 91,a 0.19 (0.38) 0.014 (0.028) 92.64Fluidized bed Venturi/impingement 28,b 0.848 (1.696) 97,a 0.059 (0.117) 87,a 6 (12) 106,a 17.8 (35.5) 0.017 (0.03) 99.9 Venturi/impingement/ WESP 17.8 (35.5) 0.005 (0.01) 99.9 106,a
* Low CO.

4-63
TABLE 4-41. SUMMARY OF ALUMINUM AND ANTIMONY EMISSION FACTORS FROMSEWAGE SLUDGE INCINERATORS
Aluminum Antimony
Source category g/Mg device, g/Mg Efficiency, g/Mg device, g/Mg Efficiency,reference/rating (10 lb/ton) (10 lb/ton) percent (10 lb/ton) (10 lb/ton) percent
Uncontrolled After control Uncontrolled After control
-3 -3 -3 -3
Multiple hearth Cyclone 98,a 93.9 (187.8) 0.28 (0.56) 99.7 0.77 (1.54) 0.32 (0.64) 58.4
Electrostatic precipitator 90,b 898 (1,796) 141 (282) 0.037 (0.073) 98.6
Fabric filter 91,a 0.59 (1.20) 0.68 (1.35) 0.047 (0.094) 0.004 (0.008) 92.4
Venturi/impingement 90,b 898 (1797) 323 (646) 64.0 2.84 (5.70) 0.21 (0.42) 92.6 91,a 39.4 (78.8) 25.7 (51.4) 34.7 1.86 (3.72) 0.23 (0.46) 87.9 98,a 183 (366) 15.1 (30.2) 86.7 1.82 (3.64) 0.30 (0.60) 61.4
Fluidized Bed Venturi/impingement 98,a 1.89 (2.78)

4-64
TABLE 4-42. SUMMARY OF BARIUM EMISSION FACTORS FROMSEWAGE SLUDGE INCINERATORS
Barium
Source category reference/rating g/Mg device, g/Mg Efficiency,Uncontrolled After control
(10 lb/ton) (10 lb/ton)-3 -3 percent
Multiple hearth Cyclone 98,a 7.86 (15.74) 0.10 (0.20) 98.7
Electrostatic precipitator 90,b 7.43 (14.9) 83.8
Fabric filter 91,a 0.043 (0.086) 0.004 (0.008) 90.6
Venturi/impingement 90,b 49.2 (98.4) 6.71 (13.4) 86.4 91,a 1.66 (3.32) 0.24 (0.48) 85.5 98,a 18.3 (36.6) 2.57 (5.14) 84.1
Fluidized Bed Venturi/impingement 98,b 0.24 (0.48)

4-65
TABLE 4-43. SUMMARY OF CALCIUM, AND COBALT EMISSION FACTORS FROMSEWAGE SLUDGE INCINERATORS
Calcium Cobalt
Source category/ g/Mg g/Mg Efficiency, g/Mg g/Mg Efficiency, reference/rating (10 lb/ton) (10 lb/ton) percent (10 lb/ton) (10 lb/ton) percent
Uncontrolled After control device, Uncontrolled After control device,
-3 -3 -3 -3
Multiple hearth Cyclone/impingement 98,a 287 (574) 1.19 (2.38) 99.6 0.57 (1.14) 0.02 (0.04) 99
Electrostatic precipitator 90,a 351 (631) 0.38 (0.77)
Fabric filter 91,a 10.3 (20.6) 0.08 (0.16) 0.052 (0.104) 0.006 (0.011) 87.1
Venturi/impingement 88,a 1440 (2880) 519 (1038) 64 1.01 (2.03) 0.06 (0.13) 94.1 90,a 493 (986) 64.9 0.06 (0.12) 93.7 91,a 947 (1,894) 5.78 (11.56) 99.4 1.28 (2.56) 1.25 (2.50) 2.4 98,a 828 (1,656) 34.5 (69.0) 85.4 1.60 (3.20) 0.42 (0.84) 76.4
Fluidized bed Venturi/impingement 98,a 5.20 (10.4)

4-66
TABLE 4-44. SUMMARY OF COPPER EMISSION FACTORSFROM SEWAGE SLUDGE INCINERATORS
Copper
Source category g/Mg device, g/Mg Efficiency,reference/rating (10 lb/ton) (10 lb/ton) percent
Uncontrolled After control
-3 -3
Multiple hearth Cyclone 98,a 27.1 (54.2) 3.9 (7.8) 85.7 99,a 1.46 (2.92) Electrostatic precipitator 90,b 101 0.2 (0.4) 99.8 Fabric filter 91,a 1.08 (2.16) 0.002 (0.004) 99.8 Cyclone/venturi l0l,a 1.04 (2.07) Venturi 95,b 0.44 (0.88) Venturi/esp 92,c 0.42 (0.84) 0.013 (0.026) 96.8 Venturi/impingement 90,b 11.2 (22.4) 88.5 102,c 0.49 (1.00) 91,a 35.8 (71.6) 2.22 (4.44) 93.8 98,a 37.8 (75.6) 8.12 (16.2) 81.0 Venturi/impingement/ afterburner 88,a 6.22 (12.44) 92,c 5.44 (10.88)Fluidized bed Venturi/impingement 97,a 0.48 (0.96) 98,a 0.16 (0.32)

4-67
TABLE 4-45. SUMMARY OF IRON AND GOLD EMISSION FACTORS FROMSEWAGE SLUDGE INCINERATORS
Iron Gold
Source category g/Mg device, g/Mg percent g/Mg device, g/Mg Efficiency,reference/rating (10 lb/ton) (10 lb/ton) (10 lb/ton) (10 lb/ton) percent
Uncontrolled After control Efficiency, Uncontrolled After control
-3 -3 -3 -3
Multiple hearth Cyclone 98,a 180 (360) 1.72 (3.44) 99.0
Electrostatic precipitator 90,a 1,382 (2,763) 25.2 (49.9) 98.0 0.009 (0.018) 0.002 (0.004) 85.4
Fabric filter 91,a 13.4 (26.8) 0.23 (0.46) 0.002 (0.004) 0.0008 (0.0016) 97.9
Venturi/impingement 90,b 1,382 (2,763) 71.8 (144) 94.8 0.001 (0.002) 91,a 622 (1,244) 6.20 (12.4) 99 0.08 (0.16) 0.00 100 98,a 619 (1,240) 64.8 (129.6) 87.1
Venturi 95,b 0.52 (1.04)
Fluidized Bed Venturi/impingement 98,a 2.70 (5.40)

4-68
TABLE 4-46. SUMMARY OF MANGANESE EMISSION FACTORS FROMSEWAGE SLUDGE INCINERATORS
Manganese
Source category/ g/Mg g/Mg Efficiency,reference/rating (10 lb/ton) (10 lb/ton) percent
Uncontrolled After control device,
-3 -3
Multiple hearth Cyclone 98,a 0.63 (1.27) 99,a 0.49 (0.98)
Electrostatic precipitator 90,b
0.32 (0.65)
Fabric filter 91,a 0.0002 (0.0005)
Venturi/impingement 90,a 10 (20) 1.24 (2.41) 88.2 91,a 7.65 (15.30) 0.20 (0.40) 97.4 98,a 26.0 (52.0) 1.12 (2.24) 75.4
Cyclone/venturi 101,a 2.97 (5.95)
Fluidized Bed Venturi/impingement 98,a 0.27 (0.54)

4-69
TABLE 4-47. SUMMARY OF MAGNESIUM AND PHOSPHORUS EMISSION FACTORS FROMSEWAGE SLUDGE INCINERATORS
Magnesium Phosphorus
Source category g/Mg g/Mg percent g/Mg g/Mgreference/rating (10 lb/ton) (10 lb/ton) (10 lb/ton) (10 lb/ton)
Uncontrolled After control device, Efficiency, Uncontrolled After control device,
-3 -3 -3 -3Efficiency,
percent
Multiple hearth Cyclone 99,a 2.69 (5.39) 13.5 (27.1) 98,a 21.1 (42.2) 0.16 (0.32) 99.3 89.6 (179.2) 4.26 (8.52) 95.3
Electrostatic precipitator 90,a 446 (892) 8.83 (17.7) 97.7 6.9 (13.8) 99.3
Fabric filter 91,a 3.85 (7.70) 0.03 (O.O5) 99.3 l0.5 (21) 0.21 (0.42) 98.0
Venturi/impingement 90,b 446 (892) 6.26 (12.52) 98.7 1,047 (2,093) 10 (20) 91,a 141 (282) 1.34 (2.68) 99.1 422 (844) 3.45 (6.90) 98,a 88.7 (177.4) 5.13 (10.2) 86.6 332 (664) 24.0 (48.0)
98.999.283.7
Venturi 95,b 0.96 (1.92)
Fluidized Bed Venturi/impingement 98,a 0.60 (1.20) 2.47 (4.94)

4-70
TABLE 4-48. SUMMARY OF SELENIUM EMISSION FACTORS FROMSEWAGE SLUDGE INCINERATORS
Selenium
Source category/ g/Mg device, g/Mg Efficiency,reference/rating (10 lb/ton) (10 lb/ton) percent
Uncontrolled After control
-3 -3
Multiple hearth Cyclone 98,a 0.19 (0.38)
Electrostatic precipitator 90,b 0.395 (0.79) 0.84 (1.64)
Fabric filter 91,a 0.033 (0.066) 0.12 (0.24)
Venturi/impingement 5.47 (10.54) 90,b 0.02 (0.04) 0.26 (0.52) 91,a 0.90 (1.80) 98,a
Cyclone/venturi 101,a 0.26 (0.53)
Venturi 102,c 0.064 (0.128)
Fluidized Bed Venturi/impingement 98,a 0.21 (0.42)

4-71
TABLE 4-49. SUMMARY OF SILICON AND SILVER EMISSION FACTORS FROMSEWAGE SLUDGE INCINERATORS
Silicon Silver
Source category g/Mg device, g/Mg percent g/Mg device, g/Mg Efficiency,reference/rating (10 lb/ton) (10 lb/ton) (10 lb/ton) (10 lb/ton) percent
Uncontrolled After control Efficiency, Uncontrolled After control
-3 -3 -3 -3
Multiple hearth Cyclone 98,a 218 (436) 4.63 (9.26) 97.9
Fabric filter 91,a 0.01 (0.02) 0.0001 (0.0002) 96.1
Electrostatic precipitator 90,a 1.27 (2.54) 0.0064 (0.0128) 99.5
Venturi/impingement 90,b 1.27 (2.54) 0.0983 (0.196) 91.9 91,a 0.67 (1.34) 0.09 (0.18) 86.6 98,a 474 (948) 44.4 (88.8) 85.8
Venturi 95,b 0.36 (0.72)
Fluidized Bed Venturi/impingement 98,a 3.18 (6.36)

4-72
TABLE 4-50. SUMMARY OF SODIUM EMISSION FACTORS FROMSEWAGE SLUDGE INCINERATORS
Sodium
Source category/ g/Mg device, g/Mg Efficiency,reference/rating (10 lb/ton) (10 lb/ton) percent
Uncontrolled After control
-3 -3
Multiple hearth Cyclone 98,a 13.1 (26.2) 1.79 (3.60) 86.2
Electrostatic precipitator 90,b 141 (282) 0.55 (1.10) 99.6
Fabric filter 91,a 1.07 (2.14) 0.01 (0.02) 99.1
Venturi/impingement 90,d 141 (282) 17.5 (35.0) 85.7 91,a 43.3 (86.6) 17.4 (34.8) 59.9 98,a 36.8 (73.6) 8.13 (16.2) 75.8
Fluidized Bed Venturi/impingement 98,a 1.18 (2.36)

4-73
TABLE 4-51. SUMMARY OF SULFUR AND TIN EMISSION FACTORS FROMSEWAGE SLUDGE INCINERATORS
Sulfur Tin
Source category g/Mg device, g/Mg percent g/Mg device, g/Mg Efficiency,reference/rating (10 lb/ton) (10 lb/ton) (10 lb/ton) (10 lb/ton) percent
Uncontrolled After control Efficiency, Uncontrolled After control
-3 -3 -3 -3
Multiple hearth Cyclone 98,a 22.9 (45.0) 19.5 (39.0) 15 10.3 (20.6) 5.90 (11.8) 42.6
Electrostatic precipitator 90,a 15,850 (31,700) 7,846 (15,693) 50.5 19.3 (38.5) 0.20 (0.41) 99.15
Fabric filter 91,a 44.1 (88.2) 60.4 (120.8) 0.26 (0.52) 0.016 (0.032) 93.9
Venturi/impingement 90,b 15,850 (31,700) 202 (403) 97.97 19.3 (38.5) 9.42 (18.8) 37.0 91,a 2,172 (4,344) 103 (206) 95.3 8.66 (17.32) 1.11 (2.22) 87.21 98,a 62.3 (124.6) 18.5 (37.0) 47.5 27.9 (55.8) 13.2 (26.4) 49.1
Venturi 95,b 0.36 (0.72)
Fluidized Bed Venturi/impingement 98,a 8.6 (17.2) 0.35 (0.70)

4-74
TABLE 4-52. SUMMARY OF TITANIUM EMISSION FACTORS FROMSEWAGE SLUDGE INCINERATORS
Titanium
Source category/ g/Mg device, g/Mg Efficiency,reference/rating (10 lb/ton) (10 lb/ton) percent
Uncontrolled After control
-3 -3
Multiple hearth Cyclone 98,a 32.1 (64.2) 0.12 (0.24) 99.6
Electrostatic precipitator 90,b 132 (263) 0.88 (1.76) 99.3
Fabric filter 91,a 1.41 (2.82) 0.006 (0.012) 99.6
Venturi/impingement 90,d 132 (263) 4.95 (10.0) 95.6 91,a 44.4 (88.8) 0.19 (0.38) 99.6 98,a 46.8 (93.6) 4.2 (8.40) 84.5
Fluidized Bed Venturi/impingement 98,a 0.39 (0.80)

4-75
TABLE 4-53. SUMMARY OF VANADIUM AND ZINC EMISSION FACTORS FROMSEWAGE SLUDGE INCINERATORS
Vanadium Zinc
Source category g/Mg device, g/Mg percent g/Mg device, g/Mg Efficiency,reference/rating (10 lb/ton) (10 lb/ton) (10 lb/ton) (10 lb/ton) percent
Uncontrolled After control Efficiency, Uncontrolled After control
-3 -3 -3 -3
Multiple hearth Cyclone 98,a 1.18 (2.34) 0.04 (0.08) 90.7 (181) 13.7 (27.4) 85.0 99,a 0.48 (0.95) 8.54 (17.1)Venturi 95,b 4.4 (8.8) Electrostatic precipitator 90,b 4.9 (9.8) 0.99 (0.38) 95.4 145 (290) 0.39 (0.78) 99.7 Fabric filter 91,a 0.26 (0.52) 0.002 (0.004) 99.2 1.54 (3.08) 0.04 (0.08) 97.2 Venturi/impingement 90,b 4.9 (9.8) 0.511 (1.02) 90 145 (290) 14.3 (20.6) 89 88,a 46.8 (93.6) 91,a 9.57 (19.14) 1.09 (2.18) 88.6 53.4 (106.8) 7.21 (14.42) 86.5 98,a 0.70 (1.40) 0.90 (1.80) 102 (204) 28.5 (47.0) 72.0 Cyclone /venturi 101,a 38.5 (77.1) Venturi/impingement/ Afterburner 92,c 47.2 (94.4) 88,a 18.8 (37.6) Venturi/WESP 102,b 2.76 (5.52) 0.2 (0.4) 92.7Fluidized Bed Venturi/impingement 98,a 0.11 (0.22) 1.03 (2.06)

4-76
TABLE 4-54. SUMMARY OF VINYL CHLORIDE EMISSION FACTORS FROMSEWAGE SLUDGE INCINERATORS
Vinyl chloride
Source category/ g/Mg device, g/Mg Efficiency,reference/rating (10 lb/ton) (10 lb/ton) percent
Uncontrolled After control
-3 -3
Multiple hearth 177 (353) Cyclone 98,a
Electrostatic precipitator 0.8 (1.61) 90,b
Venturi/impingement 90,d 3.3 (6.6) 91,a 9.6 (19.1) 6.2 (12.3) 35.4 98,a 3.6 (7.2) 1.6 (3.1) 55.6
Cyclone/venturi 108,b 0.04 (0.07) 108,b 2.02 (4.04)*
* High THC levels.

4-77
TABLE 4-56. SUMMARY OF SEWAGE SLUDGE INCINERATOR EMISSIONDATA FOR CRITERIA POLLUTANTS AND ACID GASES
Pollutant/source factor, kg/Mg ratingAverage emission Emission factor
Particulate matter Multiple hearth Uncontrolled 52.5 B Controlled Impingement 0.7 B Venturi 1.6 B Venturi/impingement 1.1 A Cyclone 2 E Cyclone/impingement 0.4 E Cyclone/venturi 0.25 D Cyclone/venturi/impingement 0.31 E Venturi/impingement/WESP 0.2 E Fabric Filter 0.002 E
Fluidized bed Uncontrolled 230.5 E Controlled Cyclone/venturi/impingement 0.5 Impingement 0.13 Venturi 0.57 Venturi/impingement 0.27 Venturi/impingement/WESP 0.1
Electric infrared Uncontrolled 3.7 Controlled Cyclone/venturi 1.93 Impingement 0.82 Venturi/impinqement 0.95
EEEEE
E
EEE
Methane VOC Multiple hearth Controlled Impingement 0.39 E Venturi 3.24 E
Fluidized bed Controlled Venturi 1.65 E Venturi/impingement 0.40 E

TABLE 4-56. SUMMARY OF SEWAGE SLUDGE INCINERATOR EMISSIONDATA FOR CRITERIA POLLUTANTS AND ACID GASES
(Continued)
Pollutant/source factor, kg/Mg ratingAverage emission Emission factor
4-78
Nonmethane VOC
Multiple hearth Uncontrolled 0.846 D Controlled Cyclone 1.530 E Cyclone/venturi 0.220 E Impingement 0.785 ELead (Pb)
Multiple hearth Uncontrolled 0.05 B Controlled Cyclone 0.03 E Cyclone/venturi 0.003 E Cyclone/venturi/impingement 0.011 E Impingement 0.02 E Venturi/impingement/afterburner 0.05 E Venturi 0.0009 E Venturi/WESP 0.00009 E Venturi/impingement 0.03 B Wet ESP 0.001 E
Fluidized bed Uncontrolled 0.02 E Controlled Impingement 0.003 E Venturi/impingement 0.08 D Venturi/impingement/WESP 0.000001 E Fabric filter 0.000005 E

TABLE 4-56. SUMMARY OF SEWAGE SLUDGE INCINERATOR EMISSIONDATA FOR CRITERIA POLLUTANTS AND ACID GASES
(Continued)
Pollutant/source factor, kg/Mg ratingAverage emission Emission factor
4-79
Sulfur dioxide (SO )2
Multiple hearth Uncontrolled 13.6 B Controlled Cyclone 2.8 E Venturi/impingement 0.1 E Venturi 2.3 E Impingement 0.32 D
Fluidized bed Uncontrolled 0.15 E Controlled Venturi/impingement 0.4 E Impingement 0.3 E Venturi 9.2 E
Electric infrared Uncontrolled 9.2 E Controlled Venturi/impingement 2.3 ENitrogen oxides (NO )x
Multiple hearth Uncontrolled 2.5 C Controlled Impingement Venturi Venturi/impingement Cyclone
Fluidized bed Uncontrolled 0.88 E Controlled Venturi/impingement Venturi
Electric infrared Uncontrolled 4.3 E Controlled Venturi/impingement 2.9 E

TABLE 4-56. SUMMARY OF SEWAGE SLUDGE INCINERATOR EMISSIONDATA FOR CRITERIA POLLUTANTS AND ACID GASES
(Continued)
Pollutant/source factor, kg/Mg ratingAverage emission Emission factor
4-80
Carbon monoxide (CO)
Multiple hearth Uncontrolled 15.5 C Controlled Cyclone/venturi Impingement Venturi/impingement
Fluidized bed Uncontrolled 1.1 E Controlled Venturi/impingementSulfuric acid (H SO )2 4
Multiple hearth Uncontrolled 0.6 D Controlled Cyclone 0.33 E Impingement 0.05 E Venturi/impingement 0.2 E
Fluidized bed Controlled Impingement 0.03 E Venturi/impingement 0.06 EHydrogen chloride (HCl)
Multiple hearth Controlled Impingement 0.01 E Venturi 0.01 E Cyclone/venturi 0.01 E Cyclone/impingement 0.01 E
Fluidized bed Controlled Venturi/impingement 0.05 E

4-81
TABLE 4-57. SUMMARY OF DIOXIN/FURAN EMISSION DATA
Pollutant/source factor, Fg/Mg ratingAverage emission Emission factor
2,3,7,8 Tetrachlorodibenzo-p-dioxin Multiple hearth Controlled Cyclone/venturi/impingement 0.3 E Impingement 0.5 E Venturi/impingement 2 E Venturi/impingement/afterburner 0.9 E
Fluidized bed Controlled Venturi/impingement 0.3 E
Total tetrachlorodibenzo-p-dioxin Multiple hearth Uncontrolled 63 E Controlled Cyclone/venturi 1.4 E Cyclone/venturi/impingement 63.8 E Impingement 28 E Venturi/impingement 134 E Venturi/impingement/afterburner 139 E
Fluidized bed Controlled Venturi/impingement 2.2 E
Total pentachlorodibenzo-p-dioxin Multiple hearth Uncontrolled 2.7 E Controlled Cyclone/venturi/impingement 1.5 E Impingement 3.7 E Venturi/impingement 53.1 E Venturi/impingement/afterburner 151.4 E
Fluidized bed Uncontrolled 1.1 E

TABLE 4-57. SUMMARY OF DIOXIN/FURAN EMISSION DATA(Continued)
Pollutant/source factor, Fg/Mg ratingAverage emission Emission factor
4-82
Total hexachlorodibenzo-p-dioxin Multiple hearth Uncontrolled 67.7 E Controlled Cyclone/venturi/impingement 4.4 E Impingement 24.1 E Venturi/impingement 38.2 E Venturi/impingement/afterburner 60.0 E
Fluidized bed Controlled Venturi/impingement 0.9 E
Total heptachlorodibenzo-p-dioxin Multiple hearth Uncontrolled 340 E Controlled Cyclone/venturi 0.8 E Cyclone/venturi/impingement 14.1 E Impingement 72.8 E Venturi/impingement 14.6 E Venturi/impingement/afterburner 23.3 E
Fluidized bed Controlled Venturi/impingement 0.9 E

TABLE 4-57. SUMMARY OF DIOXIN/FURAN EMISSION DATA(Continued)
Pollutant/source factor, Fg/Mg ratingAverage emission Emission factor
4-83
Total octachlorodibenzo-p-dioxin Multiple hearth Uncontrolled 375 E Controlled Cyclone/venturi 3.4 E Cyclone/venturi/impingement 30.7 E Impingement 53.2 E Venturi/impingement 19.0 E Venturi/impingement/afterburner 12.1 E
Fluidized bed Controlled Venturi/impingement 4.3 E
Total tetra- through octachlorodibenzo-p-dioxin Multiple hearth Uncontrolled 847 E Controlled Cyclone/venturi 5.6 E Cyclone/venturi/impingement 113 E Impingement 182 E Venturi/impingement 271 E Venturi/impingement/afterburner 310 E
2,3,7,8-Tetrachlorodibenzofuran Multiple hearth Uncontrolled 620 E Controlled Cyclone/venturi 5.6 E Impingement 186 E Venturi/impingement 46.4 E Venturi/impingement/afterburner 53.7 E
Fluidized bed Controlled Venturi/impingement 0.2 E

TABLE 4-57. SUMMARY OF DIOXIN/FURAN EMISSION DATA(Continued)
Pollutant/source factor, Fg/Mg ratingAverage emission Emission factor
4-84
Total tetrachlorodibenzofuran Multiple hearth Uncontrolled 1,708 E Controlled Cyclone/venturi 50 E Cyclone/venturi/impingement 188 E Impingement 701 E Venturi/impingement 600 E Venturi/impingement/afterburner 350 E
Fluidized bed Controlled Venturi/impingement 6.2 E
Total pentachlorodibenzofuran Multiple hearth Uncontrolled 980 E Controlled Cyclone/venturi 11.4 E Cyclone/venturi/impingement 57.5 E Impingement 360 E Venturi/impingement 1.3 E Venturi/impingement/afterburner 130 E
Fluidized bed Controlled Venturi/impingement 5.2 E

TABLE 4-57. SUMMARY OF DIOXIN/FURAN EMISSION DATA(Continued)
Pollutant/source factor, Fg/Mg ratingAverage emission Emission factor
4-85
Total hexachlorodibenzofuran Multiple hearth Uncontrolled 99.5 E Controlled Cyclone/venturi 3.4 E Cyclone/venturi/impingement 1.8 E Impingement 110.7 E Venturi/impingement 56.8 E Venturi/impingement/afterburner 77.7 E
Fluidized bed Controlled Venturi/impingement 4.1 E
Total heptachlorodibenzofuran Multiple hearth Uncontrolled 481 E Controlled Cyclone/venturi 0.9 E Cyclone/venturi/impingement 2.9 E Impingement 205 E Venturi/impingement 41.1 E Venturi/impingement/afterburner 48 E
Fluidized bed Controlled Venturi/impingement 1.6 E

TABLE 4-57. SUMMARY OF DIOXIN/FURAN EMISSION DATA(Continued)
Pollutant/source factor, Fg/Mg ratingAverage emission Emission factor
4-86
Total octachlorodibenzofuran Multiple hearth Uncontrolled 491 E Controlled Cyclone/venturi 0.7 E Cyclone/venturi/impingement 1.8 E Impingement 155 E Venturi/impingement 6.3 E Venturi/impingement/afterburner 7.7 E
Fluidized bed Controlled Venturi/impingement 1.3 E
Total tetra- through octachlorodibenzofuran Multiple hearth Uncontrolled 3,766 E Controlled Cyclone/venturi 66.2 E Cyclone/venturi/impingement 250 E Impingement l,531 E Venturi/impingement 931 E Venturi/impingement/afterburner 465 E

4-87
TABLE 4-58. SUMMARY OF ORGANIC AND METAL EMISSION DATA
Pollutant/source factor, g/Mg ratingAverage emission Emission factor
1,1,1-Trichloroethane Multiple hearth Uncontrolled 0.06 D Controlled Cyclone/impingement 1.94 E Cyclone/venturi 0.07 E Venturi/impingement/afterburner 1.38 E Venturi/impingement 0.61 D
Fluidized bed Controlled Venturi/impingement 0.26 E
1,3-Dichlorobenzene Multiple hearth Controlled Venturi/impingement 0.02 E Cyclone/venturi 0.05 E
l,l-Dichloroethane Multiple hearth Controlled Cyclone/impingement 0.23 E
1,2-Dichlorobenzene Multiple hearth Uncontrolled 0.37 E Controlled Venturi/impingement 0.19 E
Fluidized bed Controlled Venturi 67.4 E

TABLE 4-58. SUMMARY OF ORGANIC AND METAL EMISSION DATA(Continued)
Pollutant/source factor, g/Mg ratingAverage emission Emission factor
4-88
1,2-Dichloroethane Multiple hearth Controlled Venturi/impingement/afterburner 0.03 E Venturi/impingement 0.01 E Cyclone/venturi 0.004 E
1,4-Dichlorobenzene Multiple hearth Uncontrolled 0.41 E Controlled Venturi/impingement 0.24 E Cyclone/venturi 0.007 E
Fluidized bed Controlled Venturi/impingement 239.7 E
2-Nitrophenol Multiple hearth Uncontrolled 6.0 E Controlled Venturi/impingement 1.18 E Cyclone/venturi 0.38 E
Acetaldehyde Multiple hearth Controlled Impingement 0.16 E
Acetone Multiple hearth Controlled Venturi 3.16 E

TABLE 4-58. SUMMARY OF ORGANIC AND METAL EMISSION DATA(Continued)
Pollutant/source factor, g/Mg ratingAverage emission Emission factor
4-89
Acetonitrile Multiple hearth Uncontrolled 25.4 E Controlled Venturi/impingement/afterburner 0.74 E Venturi/impingement 9.76 E
Acrylonitrile Multiple hearth Uncontrolled 25.4 E Controlled Cyclone/venturi 0.15 E Venturi/impingement/afterburner 0.49 E Venturi/impingement 17.3 D
Aluminum Multiple hearth Uncontrolled 243 D Controlled Cyclone 0.3 E Electrostatic precipitator 141 E Venturi/impingement 0.68 E
Fluidized bed Controlled Venturi/impingement 1.9 E
124 E
Antimony Multiple hearth Uncontrolled 1.5 E Controlled Cyclone 0.32 E Electrostatic precipitator 0.04 E Fabric filter 0.004 E Venturi/impingement 0.24 E

TABLE 4-58. SUMMARY OF ORGANIC AND METAL EMISSION DATA(Continued)
Pollutant/source factor, g/Mg ratingAverage emission Emission factor
4-90
Arsenic Multiple hearth Uncontrolled 4.7 B Controlled Cyclone/venturi/impingement 0.85 E Cyclone/venturi 0.10 E Electrostatic precipitator 1.2 E Fabric filter 0.003 E Venturi/impingement 0.61 B Venturi 0.05 E Venturi/WESP 0.6 E Venturi/impingement/afterburner 0.04 E
Fluidized bed Uncontrolled 2.2 E Controlled Venturi/impingement 0.015 D Venturi/impingement/WESP 0.005 E
Barium Multiple hearth Uncontrolled 15.4 D Controlled Cyclone 0.1 E Electrostatic precipitator 7.43 E Fabric filter 0.004 E Venturi/impingement 3.2 D
Fluidized bed Controlled Venturi/impingement 0.24 E

TABLE 4-58. SUMMARY OF ORGANIC AND METAL EMISSION DATA(Continued)
Pollutant/source factor, g/Mg ratingAverage emission Emission factor
4-91
Benzene Multiple hearth Uncontrolled 5.8 D Controlled Cyclone/venturi 0.35 E Venturi 14.0 E Venturi/impingement/afterburner 0.17 E Venturi/impingement 6.3 D
Fluidized bed Controlled Venturi/impingement 0.2 E
Beryllium Multiple hearth Uncontrolled 0.15 E Controlled Cyclone 0.009 D Venturi/impingement 0.005 E
Fluidized bed Controlled Venturi/impingement 0.0002 E Venturi/impingement/WESP 0.0002 E
Bis(2-ethylhexyl)phthalateMultiple hearth Uncontrolled 0.93 E Controlled Cyclone/venturi 0.04 E Venturi/impingement 0.32 E
Fluidized bed Controlled Venturi/impingement 41.2 E

TABLE 4-58. SUMMARY OF ORGANIC AND METAL EMISSION DATA(Continued)
Pollutant/source factor, g/Mg ratingAverage emission Emission factor
4-92
Bromodichloromethane Multiple hearth Uncontrolled 0.004 E Controlled Venturi 1.48 E
Cadmium Multiple hearth Uncontrolled 15.7 B Controlled Cyclone 17.0 D Cyclone/venturi 12.6 C Cyclone/venturi/impingement 8.1 E Electrostatic precipitator 0.17 E Fabric filter 0.01 E Impingement 1.23 E Venturi 0.11 E Venturi/impingement/afterburner 3.04 E Venturi/impingement 3.3 B Venturi/impingement/WESP 0.1 E Venturi/WESP 0.04 E
Fluidized bed Uncontrolled 2.25 E Controlled Venturi/impingement 0.57 D Impingement 0.4 E Venturi/impingement 0. 001 E

TABLE 4-58. SUMMARY OF ORGANIC AND METAL EMISSION DATA(Continued)
Pollutant/source factor, g/Mg ratingAverage emission Emission factor
4-93
Calcium Multiple hearth Uncontrolled 702 C Controlled Cyclone 1.2 E Electrostatic precipitator 351 E Fabric filter 0.08 E Venturi/impingement 263 D
Fluidized bed Controlled Venturi/impingement 5.2 E
Carbon tetrachloride Multiple hearth Uncontrolled 0.01 E Controlled Venturi/impingement/afterburner 0.001 E Venturi/impingement 0.03 D Cyclone/venturi 0.007 E
Fluidized bed Controlled Venturi/impingement 0.012 E
Chlorobenzene Multiple hearth Uncontrolled 0.75 E Controlled 4.2 E Venturi 0.006 E Cyclone/venturi 0.26 E Venturi/impingement/afterburner 0.60 E Venturi/impingement
Fluidized bed Controlled Venturi/impingement 0.005 E

TABLE 4-58. SUMMARY OF ORGANIC AND METAL EMISSION DATA(Continued)
Pollutant/source factor, g/Mg ratingAverage emission Emission factor
4-94
Chloromethane Multiple hearth Uncontrolled 0.4 E Controlled Venturi 5.3 E
Chloroform Multiple hearth Uncontrolled Controlled 0.03 E Venturi Cyclone/venturi 3.3 E Venturi/impingement/afterburner 0.02 E Venturi/impingement 0.49 E
Fluidized bed Controlled Venturi/impingement 1.98 D
1.30 E

TABLE 4-58. SUMMARY OF ORGANIC AND METAL EMISSION DATA(Continued)
Pollutant/source factor, g/Mg ratingAverage emission Emission factor
4-95
Chromium Multiple hearth Uncontrolled 14.5 B Controlled Cyclone 1.95 D Cyclone/venturi 0.5 E Cyclone/venturi/impingement 11.2 E Impingement 9.8 E Venturi 0.5 E Electrostatic precipitator 1.45 E Fabric filter 0.04 E Venturi/impingement 2.14 B Venturi/impingement/afterburner 4.9 E Cyclone/impingement 0.04 E Venturi/WESP 0.01 E Venturi/impingement/WESP 0.11 E
Fluidized bed Controlled 0.25 C Venturi/impingement 0.32 E Impingement 0.03 E Venturi/impingement/WESP
Cobalt Multiple hearth Uncontrolled 0.9 C Controlled Cyclone 0.2 E Electrostatic precipitator 0.38 E Fabric filter 0.006 E Venturi/impingement 0.45 D

TABLE 4-58. SUMMARY OF ORGANIC AND METAL EMISSION DATA(Continued)
Pollutant/source factor, g/Mg ratingAverage emission Emission factor
4-96
Copper Multiple hearth Uncontrolled 40.5 B Controlled Cyclone 2.7 E Electrostatic precipitator 0.20 E Fabric filter 0.002 E Venturi/impingement/afterburner 5.8 E Venturi/impingement 5.5 D Venturi 0.4 E Cyclone/venturi 1.0 E Venturi/WESP 0. 01 E
Fluidized bed Controlled Venturi/impingement 0.3 E
Ethylbenzene Multiple hearth Uncontrolled 0.8 E Controlled Cyclone/venturi 0.003 E Venturi 6.02 E Venturi/impingement/afterburner 0.02 E Venturi/impingement 1.01 D
Fluidized bed Controlled Venturi/impingement 0.025 E
Formaldehyde Multiple hearth Controlled Cyclone/venturi 1.32 E Venturi 0.40 E

TABLE 4-58. SUMMARY OF ORGANIC AND METAL EMISSION DATA(Continued)
Pollutant/source factor, g/Mg ratingAverage emission Emission factor
4-97
Gold Multiple hearth Uncontrolled 0.03 E Controlled Electrostatic precipitator 0.009 E Fabric filter 0.002 E Venturi/impingement 0.001 E
Iron Multiple hearth Uncontrolled 563.3 C Controlled Cyclone 1.72 E Electrostatic precipitator 25.2 E Fabric filter 0.23 E Venturi/impingement 48.4 D
Manganese Multiple hearth Uncontrolled Controlled 9.4 C Cyclone Electrostatic precipitator 0.33 E Fabric filter 0.32 E Venturi/impingement 0.005 E
Fluidized bed Controlled Venturi/impingement 0.3 E
0.85 D

TABLE 4-58. SUMMARY OF ORGANIC AND METAL EMISSION DATA(Continued)
Pollutant/source factor, g/Mg ratingAverage emission Emission factor
4-98
Magnesium Multiple hearth Uncontrolled 140.1 C Controlled Cyclone 1.4 E Electrostatic precipitator 8.83 E Fabric filter 0.03 E Venturi/impingement 4.24 D
Fluidized bed Controlled Venturi/impingement 0.6 E
Mercury (Hg) Multiple Hearth Controlled Cyclone 2.3 E Cyclone/venturi 1.6 E Venturi/impingement 0.005 E Impingement 0.97 E
Fluidized bed Control Venturi/impingement 0.03 E
Methyl ethyl ketone Multiple hearth Uncontrolled 6.1 E Controlled Venturi 6.12 E Venturi/impingement/afterburner 0.050 E Venturi impingement 8.87 E
Methyl isobutyl ketone Multiple hearth Controlled Cyclone/impingement 0.01 E

TABLE 4-58. SUMMARY OF ORGANIC AND METAL EMISSION DATA(Continued)
Pollutant/source factor, g/Mg ratingAverage emission Emission factor
4-99
Methylene chloride Multiple hearth Uncontrolled 0.4 D Controlled Venturi 2.1 E Cyclone/venturi 0.3 E Venturi/impingement/afterburner 0.4 E Venturi/impingement 0. 9 D
Fluidized bed Controlled Venturi/impingement 0.7 E
Naphthalene Multiple hearth Uncontrolled 9.2 E Controlled Cyclone/venturi 0.97 D
Fluidized bed Controlled Venturi/impingement 97.3 E

TABLE 4-58. SUMMARY OF ORGANIC AND METAL EMISSION DATA(Continued)
Pollutant/source factor, g/Mg ratingAverage emission Emission factor
4-100
Nickel Multiple hearth Uncontrolled 8.0 B Controlled Cyclone 0.08 E Cyclone/venturi/impingement 4.51 E Impingement 4.12 E Electrostatic precipitator 1.96 E Fabric filter 0.014 E Venturi/impingement/afterburner 0.9 E Venturi/impingement 0.9 A Cyclone/venturi 0.35 E Venturi 0.06 E Cyclone/impingement 1.3 D Venturi/WESP 0.003 E
Fluidized bed Uncontrolled 17.8 E Controlled Venturi/impingement 1.7 E Venturi/impingement/WESP 0.005 E
Perchloroethylene Multiple hearth Uncontrolled Controlled 0.4 E Cyclone/venturi Venturi 0.3 E Venturi/impingement/afterburner 0.2 E Venturi/impingement 0.95 E
Fluidized bed Controlled Venturi/impingement 0.12 E
3.5 E

TABLE 4-58. SUMMARY OF ORGANIC AND METAL EMISSION DATA(Continued)
Pollutant/source factor, g/Mg ratingAverage emission Emission factor
4-101
Phenol Multiple hearth Uncontrolled 22.4 E Controlled Venturi/impingement 1.8 E
Phosphorus Multiple hearth Uncontrolled 380 D Controlled Cyclone 8.9 E Electrostatic precipitator 6.9 E Fabric Filter 0.2 E Venturi/impingement 12.5 D Venturi 0.96 E
Potassium Multiple hearth Uncontrolled 52.8 E Controlled Cyclone 0.9 E Venturi/impingement 7.3 E
Fluidized bed Controlled Venturi/impingement 0.6 E

TABLE 4-58. SUMMARY OF ORGANIC AND METAL EMISSION DATA(Continued)
Pollutant/source factor, g/Mg ratingAverage emission Emission factor
4-102
Selenium Multiple hearth Uncontrolled 0.15 D Controlled Cyclone 0.2 E Fabric Filter 0.12 E Electrostatic precipitator 0.8 E Venturi/impingement 2.2 D Cyclone/venturi 0.3 E Venturi 0.06 E
Fluidized bed Controlled Venturi/impingement 0.2 E
Silicon Multiple hearth Uncontrolled 346 E Controlled Cyclone 4.63 E Venturi/impingement 44.4 E
Fluidized bed Controlled Venturi/impingement 3.2 E
Silver Multiple hearth Uncontrolled 0.65 E Controlled Electrostatic precipitator 0.006 E Venturi/impingement 0.09 E Venturi 0.4 E Fabric Filter 0.0001 E

TABLE 4-58. SUMMARY OF ORGANIC AND METAL EMISSION DATA(Continued)
Pollutant/source factor, g/Mg ratingAverage emission Emission factor
4-103
Sodium Multiple hearth Uncontrolled 47 C Controlled Cyclone 1.8 E Electrostatic precipitator 0.55 E Fabric Filter 0.01 E Venturi/impingement 14.3 D
Sulfur Multiple hearth Uncontrolled Controlled 3630 D Cyclone Electrostatic precipitator 19.5 E Fabric Filter 7846 E Venturi/impingement 60.4 E
Fluidized bed Controlled Venturi/impingement 8.6 E
107.8 E
TetrachloroethaneMultiple hearth Controlled Venturi 11.8 E
Tin Multiple hearth Uncontrolled 13.3 C Controlled Cyclone 5.9 E Electrostatic precipitator 0.20 E Fabric Filter 0.02 E Venturi/impingement 7.9 D Fluidized bed Controlled Venturi/impingement 0.35 E

TABLE 4-58. SUMMARY OF ORGANIC AND METAL EMISSION DATA(Continued)
Pollutant/source factor, g/Mg ratingAverage emission Emission factor
4-104
Titanium Multiple hearth Uncontrolled 51.3 C Controlled Cyclone 0.1 E Electrostatic precipitator 0.9 E Fabric Filter 0.006 E Venturi/impingement 3.1 D
Fluidized bed Controlled Venturi/impingement 0.4 E
Toluene Multiple hearth Uncontrolled Controlled 7.8 D Venturi Cyclone/venturi 15.5 E Venturi/impingement/afterburner 3.3 E Venturi/impingement 0.66 E
Fluidized bed Controlled Cyclone/impingement
6.5 D
0.35 E
Trans-1,2-dichloroethene Multiple hearth Uncontrolled 0.09 E Controlled Venturi/impingement/afterburner 0.04 DVenturi/impingement 0.05 E Venturi 5.2 E

TABLE 4-58. SUMMARY OF ORGANIC AND METAL EMISSION DATA(Continued)
Pollutant/source factor, g/Mg ratingAverage emission Emission factor
4-105
Trichloroethene Multiple hearth Uncontrolled 0.5 E Controlled Venturi/impingement/afterburner 1.53 E Venturi/impingement 1.07 E
Fluidized bed Controlled Venturi/impingement 0.03 E
Vanadium Multiple hearth Uncontrolled 3.3 C Controlled Cyclone 0.3 E Electrostatic precipitator 0.99 E Fabric filter 0.002 E Venturi/impingement 0.8 E
Vinyl chloride Multiple hearth Uncontrolled 6.6 E Controlled Cyclone 177 E Cyclone/venturi 1.0 E Electrostatic precipitator 0.80 E Venturi/impingement 3.7 D
Xylene, m,p Multiple hearth Controlled Venturi 2.02 E
Xylenes, total Multiple hearth Uncontrolled 0.95 E Controlled Venturi 1.4 E

TABLE 4-58. SUMMARY OF ORGANIC AND METAL EMISSION DATA(Continued)
Pollutant/source factor, g/Mg ratingAverage emission Emission factor
4-106
Zinc Multiple hearth Uncontrolled 65.9 C Controlled Cyclone 11.1 E Electrostatic precipitator 0.39 E Fabric filter 0.04 E Venturi/impingement/afterburner 33 E Venturi/impingement 24.2 C Venturi 4.4 E Cyclone/venturi 38.5 E Venturi/WESP 0.2 E
Fluidized bed Controlled Venturi/impingement 1.0 E

4-107
4.2.1 Total Particulate Matter Emissions Data
Both uncontrolled and controlled particulate matter emission factors were
determined from the data contained in the reference documents described above. In
the case of uncontrolled emissions, References 5o, p, r; 7; 21; 34n and s; 35e; 39; 91;
98; 104; 106; and 107 contained useful data. For all of these except Reference 39,
the emission factors were determined from the test data by manual and computer
calculations from emission factors expressed in units other than mass of pollutant
per megagram of dry sewage sludge incinerated. For Reference 39, the appropriate
uncontrolled emission factor was extracted directly from the test report.
References 34n and s each contained a single-run value for uncontrolled particulate
matter emissions. As discussed in Section 4.1.16, these emission results were used
as order-of-magnitude values only.
For controlled processes, a procedure similar to that described above for
determining uncontrolled emission factors was used. References 4, 5o through 5r,
7, 9 through 21, 22a through 22d, 24 through 30, 32, 33, 34n and 34s, 35a, 35c, 35d,
35e, 39, 49, 53, 54, 67 through 72, 75, 77 through 81, 84, 91, 98, 101, 104, 106, and
107 contained useful data. Except for References 4, 10, 11, 13, 15, 17 through
22a-22d, 23, 24, 25, 32, 33, 34n and 34s, 35c and 35d, 39, 42, 47, 48, 49, and 70, the
controlled emission factors were calculated from data presented in other terms. A
summary of all available particulate matter emission factors is shown in Table 4-1.
4.2.2 Particle Size Data
Both uncontrolled and controlled particulate matter emission factors were
determined from the data contained in the reference documents described above. In
the case of uncontrolled emissions, References 7, 21, 35a, 34n and s, and 35e
contained useful data. For controlled emissions, References 4, 7, 21, 35a, and 35e
contained useful data. A summary of all available PM10 emission factors is shown
in Table 4-2.

4-108
4.2.3 Other Criteria Pollutant Emissions Data
4.2.3.1 Volatile Organic Compounds. Controlled VOC emission factors were
determined for both methane and nonmethane VOC's. References 68, 79, and 84
were used to determine controlled nonmethane VOC emission factors. References 6,
26 through 29, and 69 were used to determine controlled methane VOC emission
factors. Uncontrolled nonmethane VOC emission factors were determined from
data contained in References 1, 2, 39, and 40. No data were available to develop
emission factors for uncontrolled methane VOC's. In all cases, the emission factors
were determined from the test data by calculations from emission factors expressed
in terms other than mass of pollutant per megagram of dry sludge incinerated. A
summary of VOC emission factors is shown in Table 4-3.
4.2.3.2 Lead. Controlled Pb emission factors were determined from the data
contained in References 4, 5o through 5r, 28, 39, 84 through 88, 90 through
92,95,97 through 99, 101, 102, 104, 106, and 107. References 39, 85, 86, 88, 90, 91,
101, and 102 contained uncontrolled emissions data. None of the data reports
indicated that Pb emission values were based on data from lead compounds.
Therefore, elemental Pb was assumed in each case. Because the lead emission
factor is the sum of both front- and back-half catches, the lead emission weight
cannot be compared to the particulate matter emission weight.
In each case, calculations were performed to convert from the units used in
the reports to conventional emission factor units. A summary of Pb emission factors
is shown in Table 4-4.
4.2.3.3 Sulfur Dioxide, Oxides of Nitrogen and Carbon Monoxide. Data for
determining uncontrolled emission factors for SO were taken from References 1, 3,2
5o, 5p, 5r, 35e, 39, 98, 104, 106, and 107. Controlled emissions data used to
determine SO2 emission factors were taken from References 5o through 5r, 26
through 29, 35e, 45, 69, 71, and 72. Because water based scrubbers offer virtually
no control of NO or CO emission factors for these pollutants were determined byx
using both uncontrolled and controlled test data. Uncontrolled emissions data for
4-109
NO were available from References 1, 3, 35e, 39, 106, and 107; and for controlledx
emissions data from References 26 through 28, 35e, 68, 69, 71, 72, 98, 99 and 106.
Uncontrolled emissions data for CO were available from References 1, 3, 39, 84, and
106.; and for controlled emissions data from References 29, 68, 72, 99, 101, 104,
106, and 107. The emission factors were determined from the test data by
calculations. Tables 4-5 through 4-7 present a summary of emission factors for
those pollutants.
4.2.4 Noncriteria Pollutant Emissions Data
4.2.4.1 Acid Gases. Reference 5o, 5p, 5r, 98, and 99 contained data for
uncontrolled acid gas (H SO ) emissions. References 5o through 5r, 27,98, and 992 4
provided data for the determination of controlled emission factors for H SO . 2 4
References 26 through 28, and 99 were used for emission factors for HCl.
Calculations were required to convert into conventional emission factor units. A
summary of acid gas emission factors is shown in Table 4-8.
4.2.4.2 Organic Compounds. References 1, 2, 3, 84, 88, 99, and 106 were
used for the development of controlled emission factors for several dioxin and furan
compounds. Tables 4-9 through 4-14 present summaries of dioxin and furan
emission factors. References 85, 86, 87, 88, 89, 99, 101, 106, and 108 were used for
the development of controlled and uncontrolled emission factors for other organic
compound emissions, including acetaldehyde, acetone, acrolein, acrylonitrile,
benzene, butadiene, carbon tetrachloride, ethylbenzene, formaldehyde,
perchlorolethylene, styrene, toluene, vinyl chloride, and xylene. These emission
factors are listed in Table 4-17 through 4-35.
4.2.4.3 Inorganic Compounds. References 4, 26, 28, 39, 86 through 92, 99,
101, 102, 106, and 107 provided emissions data for arsenic (As). References 86, 99,
104, and 106 provided emissions data for beryllium (Be). References 4, 5o-5r, 7, 26,
28, 39, 84, 85-88, 90, 91, and 97-102 presented cadmium (Cd) emissions data.
References 4, 5o-5r, 26, 28, 39, 84, 85 through 87, 89 through 92, 95, 97 through
100, 102, 104, 106, and 107 presented data for chromium (Cr). Mercury (Hg) data

4-110
were presented in References 28, 53, 95, 99 and 101. Nickel (Ni) data were
presented in References 5o, 26, 28, 39, 84 through 92, 97 through 102, 104, 106, and
107. References 89, 90, 91, 95, 98 and 99 presented emissions data for aluminum
(Al), barium (Ba), calcium (Ca), iron (Fe), magnesium (Mg), silver (As), sodium
(Na), and titanium (Ti). References 90, 91, and 98 presented emissions data for
antimony (Sb) and phosphorous (P). Emissions data for manganese (Mn) and zinc
(Zn) were provided in References 89, 90, 91, 98, 99 and 101. Gold (Au) and sulfur
(S) emissions data were presented in References 89 through 91. Potassium (K) and
silicon (Si) data are presented in Reference 98. Cobalt (Co) and tin (Sn) data are
presented in References 89, 90, and 98. Copper (Cu) emissions data were presented
in References 88 through 92, 97 through 99, 101, and 102. References 90, 91, 98,
101, and 102 presented selenium (Se) data, and References 89 through 91
presented emissions data for vanadium. Summaries of emission factors for
inorganic compounds are presented in Tables 4-36 through 4-55.
4.3 ENGINEERING METHODOLOGY
The emission data were averaged as the arithmetic mean of different
sampling runs prior to inclusion in the data base. Test programs at most facilities
consisted of three sampling runs conducted during distinct and controlled normal
operating conditions.
Due to the variety of formats used to report units of measure at different
sludge incineration facilities, the emission data required some preprocessing to
standardize the units of measure prior to computer calculation of emission factors.
Emission factors were then calculated in terms of kg/Mg of dry sludge and lb/ton of
dry sludge for all pollutants. The list of conversion factors used is included as
Table 4-18.
If the pollutant-specific data, D1, were reported in ng/dscm corrected to
12 percent CO in the test report, the following calculation:2
DI = D1 * (percent concentration of CO )/122

D1 'D1 ( (1000 ( 0.02404)
(molecular weight of pollutant)
4-111
was performed to present the "uncorrected" value in the resulting table. When the
data, D1, were reported in ng/dscf in the test report, the conversion
D1 = D1 * 35.31
was required to present D1 as ng/dscm. Acid gas and criteria pollutant data were
presented in ppmdv corrected to 12 percent CO . In order to convert data, D1, from2
mg/dscm corrected to 12 percent CO to ppmdv at 12 percent CO , the following2 2
relation was employed:
Calculation of emission factors was performed using conversion factors (CF's)
to relate process conditions to emission concentration levels. The CF's were
calculated manually for each facility that provided percent concentration of CO ,2
process feed rate, and stack gas flow measurements. The emission factors in 10-10
lb/ton were calculated using the "corrected" concentration data in English units, E1
in 10-10 gr/dscf, and the following equation:
EF = CF * E1
where:
CF = (Percent concentration of CO )*(stack gas flow in2
dscfm)*(7.14x10 )÷ process rate in ton/hr;-4
The emission factor in Fg/Mg were then calculated using:
EF in Fg/Mg = (EF in 10 lb/ton) * 0.05-10
In order to calculate emission factors from data presented in ppmdv at 12 percent
SO , a second conversion factor, CCF, was needed. CCF was defined as:2

CCF '(molecular weight of pollutant) (1.3 x 10&8 ) (CF)
(7.14 x 10&4)
4-112
An emission factor value may be calculated from:
EF in lb/ton feed = (D1 in ppmdv @ 12 percent CO )(CCF)2
Because test periods were nonsimultaneous, CF values for some facilities were
different for the various pollutants. Determinations of emission factors were made
only when process feed rates were documented or derivable from plant records of
sludge process rates.
REFERENCES FOR CHAPTER 4.0
1. Final Draft Test Report--Site 01 Sewage Sludge Incinerator SSI-A. NationalDioxin Study. Tier 4: Combustion Sources, EPA Contract No. 68-03-3148,Radian Corporation, Research Triangle Park, North Carolina, July 1986.
2. Final Draft Test Report--Site 03 Sewage Sludge Incinerator SSI-B. NationalDioxin Study. Tier 4: Combustion Sources, EPA Contract No. 68-03-3148,Radian Corporation, Research Triangle Park, North Carolina, July 1986.
3. Draft Test Report--Site 12 Sewage Sludge Incinerator SSI-C, EPA ContractNo. 68-03-3138, Radian Corporation, Research Triangle Park, NorthCarolina, April 1986.
4. Trichon, M. and R. T. Dewling, The Fate of Trace Metals in a Fluidized-BedSewage Sludge Incinerator. (Port Washington). (GCA).
5. Particulate and Gaseous Emission Tests at Municipal Sludge IncineratorPlants "O", "P", "Q", and "R" (4 tests), EPA Contract No. 68-02-2815,Engineering-Science, McLean, Virginia, February 1980.

4-113
6. Organics Screening Study Test Report. Sewage Sludge Incinerator No. 13. Detroit Water and Sewer Department. Detroit, Michigan, EPA Contract No.68-02-3849. PEI Associates, Inc., Cincinnati, Ohio, August 1986.
7. Chromium Screening Study Test Report. Sewage Sludge Incinerator No. 13. Detroit Water and Sewer Department. Detroit Michigan, EPA Contract No.68-02-3849, PEI Associates, Inc., Cincinnati, Ohio, August 1986.
8. Results of the July 11, 1983, Emission Compliance Test on the No. 6Incineration System at the MWCC Metro Plant in St. Paul, Minnesota,[STAPPA/ALAPCO/05/27/86-No. 02], Interpoll Inc., Circle Pines, Minnesota,July 1983.
9. Results of the October 24, 1980, Particulate Compliance Test on the No. 1Sludge Incinerator Wet Scrubber Stack at the MWCC St. Paul WastewaterTreatment Plant in St. Paul, Minnesota, [STAPPA/ALAPCO/05/27/86-No.02], Interpoll Inc., Circle Pines, Minnesota, November 1980.
10. Results of the June 6, 1983, Emission Compliance Test on the No. 10Incinerator System in the F&I 2 Building at the MWCC Metro Plant in St.Paul, Minnesota, [STAPPA/ALAPCO/05/27/86-No. 02], Interpoll Inc., CirclePines, Minnesota, June 1983.
11. Results of the May 23, 1983, Emission Compliance Test on the No. 9Incinerator System in the F&I 2 Building at the MWCC Metro Plant in St.Paul, Minnesota, [STAPPA/ALAPCO/05/27/86-No. 02], Interpoll Inc., CirclePines, Minnesota, May 1983.
12. Results of the November 25, 1980, Particulate Emission Compliance Test onthe No. 4 Sludge Incinerator Wet Scrubber Stack at the MWCC St. PaulWastewater Treatment Plant in St. Paul, Minnesota,[STAPPA/ALAPCO/05/27/86-No. 02], Interpoll Inc., Circle Pines, Minnesota,December, 1980.
13. Results of the March 28, 1983, Particulate Emission Compliance Test on theNo. 8 Incinerator at the MWCC Metro Plant in St. Paul, Minnesota,[STAPPA/ALAPCO/05/28/86-No. 06], Interpoll Inc., Circle Pines, Minnesota,April 1983.
14. Particulate Emission Test Report for a Sewage Sludge Incinerator at the Cityof Shelby Wastewater Treatment Plant, [STAPPA/ALAPCO/07/28/86-No. 06].North Carolina DNR, February 1979.

4-114
15. Source Sampling Evaluation for Rocky River Wastewater Treatment Plant,Concord, North Carolina, [STAPPA/ALAPCO/05/28/86-No. 06], Mogul Corp.,Charlotte, North Carolina, July 1982.
16. Performance Test Report: Rocky Mount Wastewater Treatment Facility,[STAPPA/ALAPCO/07/28/86-No. 06], Envirotech, Belmont, California, July1983.
17. Performance Test Report for the Incineration System at the HonoluluWastewater Treatment Plant at Honolulu, Oahu, Hawaii. [STAPPA/ALAPCO/05/22/86-No. 11], Zimpro, Rothschild, Wisconsin, January1984.
18. (Test Results) Honolulu Wastewater Treatment Plant, Ewa, Hawaii,[STAPPA/ALAPCO/05/22/86-No. 11], Zimpro, Rothschild, Wisconsin,November 1983.
19. Air Pollution Source Test. Sampling and Analysis of Air Pollutant Effluentfrom Wastewater Treatment Facility--Sand Island Wastewater TreatmentPlant, Honolulu, Hawaii, [STAPPA/ALAPCO/05/22/86-No. 11], Ultrachem,Walnut Creek, California, December 1978.
20. Air Pollution Source Test. Sampling and Analysis of Air Pollutant EffluentFrom Wastewater Treatment Facility--Sand Island Wastewater TreatmentPlant, Honolulu, Hawaii--Phase II, [STAPPA/ALAPCO/05/22/86-No. 11],Ultrachem, Walnut Creek, California, December 1979.
21. Stationary Source Sampling Report. EEI Reference No. 2988. OsborneWastewater Treatment Plant. Greensboro, North Carolina. ParticulateEmissions and Particle Size Distribution Testing. Sludge IncineratorScrubber Inlet and Scrubber Stack, [STAPPA/ALAPCO/07/28/86-No. 06],Entropy, Research Triangle Park, North Carolina, October 1985.
22. (Four tests). Southwestern Ohio Air Pollution Control Agency. MetropolitanSewer District--Little Miami Treatment Plant (three tests: August 9, 1985,September 16, 1980, and September 30, 1980) and Mill Creek TreatmentPlant (one test: January 9, 1986), [STAPPA/ALAPCO/05/28/86-No. 14].
23. Emissions Testing of Incinerator No. 2. Green Bay Metropolitan SewerDistrict, Green Bay, Wisconsin, [STAPPA/ALAPCO/06/12/86-No. 19],Engineering Science, McLean, Virginia, October 1981.

4-115
24. City of Milwaukee South Shore Treatment Plant, Milwaukee, Wisconsin. Particulate Emissions Compliance Testing, [STAPPA/ALAPCO/06/12/86-No.19], Entropy, Research Triangle Park, North Carolina, December 1980.
25. City of Milwaukee South Shore Treatment Plant, Milwaukee, Wisconsin. Particulate Emissions Compliance Testing, [STAPPA/ALAPCO/06/12/86-No.19], Entropy, Research Triangle Park, North Carolina, November 1980.
26. Stack Test Report--Bayshore Regional Sewage Authority. Union Beach, NewJersey, [STAPPA/ALAPCO/05/22/86-No. 12], New Jersey State Departmentof Environmental Protection, Trenton, New Jersey, March 1982.
27. Stack Test Report--Jersey City Sewage Authority. Jersey City, New Jersey,[STAPPA/ALAPCO/05/22/86-No. 12], New Jersey State Department ofEnvironmental Protection, Trenton, New Jersey, December 1980.
28. Stack Test Report--Northwest Bergen County Sewer Authority. Waldwick,New Jersey, [STAPPA/ALAPCO/05/22/86-No. 12], New Jersey StateDepartment of Environmental Protection, Trenton, New Jersey, March 1982.
29. Stack Test Report--Pequannock, Lincoln Park, and Fairfield SewerageAuthority, Lincoln Park, New Jersey, [STAPPA/ALAPCO/05/22/86-No.12],New Jersey State Department of Environmental Protection, Trenton,New Jersey, December 1975.
30. Atmospheric Emission Evaluation. Anchorage Water and Wastewater UtilitySewage Sludge Incinerator, ASA, Bellevue, Washington, April 1984.
31. Stack Sampling Report for City of New London (CT) No. 1 SludgeIncinerator, Recon Systems, Inc., Three Bridges, New Jersey, April 1984.
32. Stack Sampling Report for Municipal Sewage Sludge Incinerator No. 1,Scrubber Outlet (Stack), Providence, Rhode Island, Recon Systems, Inc.,Three Bridges, New Jersey, November 1980.
33. Stack Sampling Report, Compliance Test No. 3, at Attleboro AdvancedWastewater Treatment Facility, Attleboro, Massachusetts, David GordonAssociates, Inc., Newton Upper Falls, Massachusetts, May 1983.
34. (Two tests). Source Emission Survey. North Texas Municipal Water District. Rowlett Creek Plant. Plano, Texas, Shirco, Inc., Dallas, Texas, November1978.

4-116
35. (Five tests). Emissions Data for Infrared Municipal Sewage SludgeIncinerators, Shirco, Inc., Dallas, Texas, January 1980.
36. Liao, P. B. and M. J. Pilat. Air Pollutant Emissions from Fluidized BedSewage Sludge Incinerators. Water and Sewage Works. February 1972.
37. (Two tests) Emission Evaluation for: Merrimack Wastewater TreatmentPlant, Merrimack, New Hampshire, Mogul Corp., Chagrin Falls, Ohio,November 1977.
38. Performance of Emission Tests and Material Balance for a Fluidized-BedSludge Incinerator, GCA Corp, Bedford, Massachusetts, November 1980.
39. Electrostatic Precipitator Efficiency on a Multiple Hearth IncineratorBurning Sewage Sludge, EPA Contract No. 68-03-3148, Radian Corp.,Research Triangle Park, North Carolina, August 1986.
40. Baghouse Efficiency on a Multiple Hearth Incinerator Burning SewageSludge, EPA Contract No. 68-03-3148, Radian Corp., Research TrianglePark, North Carolina, August 1986.
41. Farrell, J. B. and H. Wall. Air Pollution Discharges from Ten Sewage SludgeIncinerators, U. S. Environmental Protection Agency, Cincinnati, Ohio,August 1985.
42. Emission Test Report. Sewage Sludge Incinerator. Davenport WastewaterTreatment Plant. Davenport, Iowa, [STAPPA/ALAPCO/11/04/86-No. 119],PEDCo Environmental, Cincinnati, Ohio, October 1977.
43. Sludge Incinerator Emission Testing. Unit No. 1 for City of Omaha,Papillion Creek Water Pollution Control Plant, [STAPPA/ALAPCO/10/28/86-No. 100], Particle Data Labs, Ltd., Elmhurst, Illinois, September 1978.
44. Sludge Incinerator Emission Testing. Unit No. 2 for City of Omaha,Papillion Creek Water Pollution Control Plant, [STAPPA/ALAPCO/10/28/86-No. 100], Particle Data Labs, Ltd., Elmhurst, Illinois, May 1980.
45. Particulate and Sulfur Dioxide Emissions Test Report for Zimpro on theSewage Sludge Incinerator Stack at the Cedar Rapids Water PollutionControl Facility, [STAPPA/ALAPCO/11/04/86-No. 119], Serco, Cedar Falls,Iowa, September 1980.

4-117
46. City of Davenport (IA) Particulate Emission Test,[STAPPA/ALAPCO/11/04/86-No. 119], Zimpro, Rothschild, Wisconsin,September 1977.
47. Newport Wastewater Treatment Plant, Newport, Tennessee. (Nichols;December 1979). [STAPPA/ALAPCO/10/27/86-No. 21].
48. Maryville Wastewater Treatment Plant Sewage Sludge Incinerator EmissionTest Report, [STAPPA/ALAPCO/10/27/86-No. 21], Enviro-measure, Inc.,Knoxville, Tennessee, August 1984.
49. Maryville Wastewater Treatment Plant Sewage Sludge Incinerator EmissionTest Report, [STAPPA/ALAPCO/10/27/86-No. 21], Enviro-measure, Inc.,Knoxville, Tennessee, October 1982.
50. Newport (Tennessee) Utilities Board, [STAPPA/ALAPCO/10/27/86-No. 21],Entropy, Research Triangle Park, North Carolina, December 1974.
51. Kiski Valley (Pennsylvania) Water Pollution Control Authority. Source TestReport, [STAPPA/ALAPCO/11/04/86-No. 122], Pennsylvania, Department ofEnvironmental Resources, May 1986.
52. Anchorage Water and Sewer Utilities. Point Woronzof WastewaterTreatment Facility, [STAPPA/ALAPCO/10/28/80-No. 108], Chemical andGeological Laboratories of Alaska, Inc., September 1982.
53. Southerly Wastewater Treatment Plant, Cleveland, Ohio, Incinerator No. 3,[STAPPA/ALAPCO/11/12/86-No. 124], Envisage Environmental, Inc.,Richfield, Ohio, May 1985.
54. Southerly Wastewater Treatment Plant, Cleveland, Ohio. Incinerator No. 1,[STAPPA/ALAPCO/11/12/86-No. 124], Envisage Environmental, Inc.,Richfield, Ohio, August 1985.
55. Atmospheric Emission Evaluation. Anchorage Water and Wastewater UtilitySewage Sludge Incinerator, [STAPPA/ALAPCO/10/28/86-No. 108], AmericanServices Associates, Bellevue, Washington, April 1984.
56. Source Test Report Review. R. M. Clayton WPC Plant; Atlanta, Georgia. Nos. 1 and 2 Incinerators, (May 11 thru 12, 1983). [STAPPA/ALAPCO/06/23/86-No. 16].

4-118
57. Source Test Report Review. Flat Creek Wastewater Treatment Plant;Gainesville, Georgia. Nos. 51 and 1 Incinerators,[STAPPA/ALAPCO/06/23/86-No. 16], Department of Natural Resources,Atlanta, Georgia, January 1985.
58. City of Bellingham Post Point Wastewater Treatment Plant Mercury SourceTest, (January 29-30, 1979). [STAPPA/ALAPCO/10/28/86-No. 106].
59. Source Test Report. East Norriton and Plymouth Township Joint SewerAuthority, [STAPPA/ALAPCO/11/04/86-No. 122], Pennsylvania Departmentof Environmental Resources, July 1986.
60. Source Test Report. Erie Sewer Authority, Erie, Pennsylvania. SludgeIncinerator No. 1, [STAPPA/ALAPCO/11/04/86-No. 122], PennsylvaniaDepartment of Environmental Resources, July 1981.
61. Source Test Report. Erie Sewer Authority, Erie, Pennsylvania. SludgeIncinerator No. 2, [STAPPA/ALAPCO/11/04-86-No. 122], PennsylvaniaDepartment of Environmental Resources, July 1981.
62. Cities of Columbia and Charleston (three tests). [STAPPA/ALAPCO/05/29/86-No. 15], South Carolina Bureau of Air QualityControl, May 1976 and August 1977.
63. Letter from American Interplex to J. D. Helms, August 16, 1984. NorthLittle Rock (Arkansas) Stack Emission Summary.
64. Report from U. S. Environmental Protection Agency, Region II to BarryMitsch, Radian Corp. Information on Sewage Sludge Incinerators in RegionII and Emissions Data Report for Atlantic City, New Jersey.
65. Hobbs, B. Testing and Evaluation of Sewage Sludge Incinerator at FieldsPoint Wastewater Treatment Facility, Providence, Rhode Island, GCA Corp.,Bedford, Massachusetts, August 1982.
66. Report: South Essex Sewerage District: A Case History, MA Department ofEnvironmental Quality Engineering. November 1982.
67. Final Report for an Emission Compliance Test Program (July 1, 1982) at Cityof Waterbury Wastewater Treatment Plant Sludge Incinerator, Waterbury,Connecticut, [STAPPA/ALAPCO/12/17/86-No. 136], York Services Corp, July1982.

4-119
68. Incinerator Compliance Test at the City of Stratford Sewage Treatment Plantin Stratford, Connecticut, [STAPPA/ALAPCO/12/17/86-No. 136], EmissionTesting Labs. September 1974.
69. Emission Compliance Tests Conducted at Norwalk Wastewater TreatmentPlant, South Smith Street, Norwalk, Connecticut,[STAPPA/ALAPCO/12/17/86-No. 136], York Research Corp, Stamford,Connecticut. February 1975.
70. Final Report--Emission Compliance Test Program at East Shore WastewaterTreatment Plant, New Haven, Connecticut, [STAPPA/ALAPCO/12/17/86-No.136], York Services Corp., Stamford, Connecticut, September 1982.
71. Incinerator Compliance Test at Enfield Sewage Treatment Plant in Enfield,Connecticut, [STAPPA/ALAPCO/12/17/86-No. 136], York Research Corp.,Stamford, Connecticut, July 1973.
72. Incinerator Compliance Test at The Glastonbury Sewage Treatment Plant inGlastonbury, Connecticut, [STAPPA/ALAPCO/12/17/86-No. 136], YorkResearch Corp., Stamford, Connecticut, August 1973.
73. Report on Measurement of Particulate Emissions from the (Hartford,Connecticut) Sewage Sludge Incinerator of the Metropolitan DistrictCommission, [STAPPA/ALAPCO/12/17/86-No. 136], The Research Corp.,Wethersfield, Connecticut, August 1977.
74. Emissions Tests at the Hartford Sewage Sludge Incinerator Brainard Road,Hartford, Connecticut, [STAPPA/ALAPCO/12/17/86-No. 136], The ResearchCorp., Wetherfield, Connecticut, May 1973.
75. Results of the May 5, 1981, Particulate Emission Measurements of theSludge Incinerator Located at the Metropolitan District CommissionIncinerator Plant, Hartford, Connecticut, [STAPPA/ALAPCO/12/17/86- No.136], Henry Souther Laboratories.
76. Incinerator Compliance Test at The Willimantic Sewage Treatment Plant inWillimantic, Connecticut, [STAPPA/ALAPCO/12/17/86-No. 136], YorkResearch Corp., Stamford, Connecticut, February 1974.
77. Official Air Pollution Tests Conducted on the Nichols Engineering andResearch Corporation Sludge Incinerator Located on the WastewaterTreatment Plant, Middletown, Connecticut, [STAPPA/ALAPCO/12/17/86-No.136]. Rossnagel and Associates, Cherry Hill, New Jersey, November 1976.

4-120
78. Measured Emissions From the West Nichols-Neptune Multiple HearthSludge Incinerator at the Naugatuck Treatment Company, Naugatuck,Connecticut, April 24, 1985, [STAPPA/ALAPCO/12/17/86-No. 136], TheResearch Corp., East Hartford, Connecticut, April 1985.
79. Compliance Test Report--(August 27, 1986) Mattabasset District PollutionControl Plant Main Incinerator, Cromwell, Connecticut,[STAPPA/ALAPCO/12/17/86-No. 136], ROJAC Environmental Services, Inc.,West Hartford, Connecticut, September 1986.
80. Stack Sampling Report (May 21, 1986) City of New London No. 2 SludgeIncinerator Outlet Stack Compliance Test, [STAPPA/ALAPCO/12/17/86-No.136], Recon Systems, Inc., Three Bridges, New Jersey, June 1986.
81. Particulate Emission Tests, Town of Vernon Municipal Sludge Incinerator,February 10, 11, 1981, Vernon, Connecticut, [STAPPA/ALAPCO/12/17/86-No.136], The Research Corp., Wethersfield, Connecticut, March 1981.
82. Six Tests on Buckman Incinerator No. 1, Jacksonville, Florida. 1982 through1986. Provided by the Department of Health, Welfare, and Bio-Environmental Services, City of Jacksonville, Florida,[STAPPA/ALAPCO/01/05/87-No. 137].
83. (Four tests). Bennett, R. L. and K. T. Knapp. Characterization of ParticulateEmissions from Municipal Wastewater Sludge Incinerators, ES and TVolume 16, No. 12, 1982.
84. Non-Criteria Emissions Monitoring Program for the Envirotech Nine- HearthSewage Sludge Incinerator at the Metropolitan Wastewater TreatmentFacility, St., Paul, Minnesota, ERT Document No. P-E081-500; October 1986.
85. Knisley, D.R., et al., Radian Corporation. Site 1 Revised Draft Emission TestReport, Sewage Sludge Test Program. Prepared for U.S. EnvironmentalProtection Agency, Water Engineering Research Laboratory, Cincinnati, OH,February 9, 1989.
86. Knisley, D.R., et al., Radian Corporation. Site 2 Final Emission Test Report,Sewage Sludge Test Program. Prepared for U.S. Environmental ProtectionAgency, Water Engineering Research Laboratory, Cincinnati, OH, October19, 1987.

4-121
87. Knisley, D.R., et al., Radian Corporation. Site 3 Draft Emission Test Reportand Addendum, Sewage Sludge Test Program. Volume 1: Emission TestResults. Prepared for U.S. Environmental Protection Agency, WaterEngineering Research Laboratory, Cincinnati, OH, October 1, 1987.
88. Knisley, D.R., et al., Radian Corporation. Site 4 Final Emission Test Report,Sewage Sludge Test Program. Prepared for U.S. Environmental ProtectionAgency, Water Engineering Research Laboratory, Cincinnati, OH, May 9,1988.
89. Adams, R.C., et al., Radian Corporation. Organic Emissions from theExhaust Stack of a Multiple Hearth Furnace Burning Sewage Sludge,Prepared for U.S. Environmental Protection Agency, Water EngineeringResearch Laboratory, Cincinnati, OH, September 30, 1985.
90. Adams, R.C., et al., Radian Corporation. Particulate Removal Evaluation ofan Electrostatic Precipitator Dust Removal System Installed on a MultipleHearth Incinerator Burning Sewage Sludge. Prepared for U.S.Environmental Protection Agency, Water Engineering Research Laboratory,Cincinnati, OH, September 30, 1985.
91. Adams, R.C. et al., Radian Corporation. Particulate Removal Capability of aBaghouse Filter on the Exhaust of a Multiple Hearth Furnace BurningSewage Sludge. Prepared for U.S. Environmental Protection Agency, WaterEngineering Research Laboratory, Cincinnati, OH, September 30, 1985.
92. Radian Corporation. Rhode Island Toxics Integration Project, Phase II: Study of Air Emissions from Two Sewage Sludge Incineration Facilities. Prepared for State of Rhode Island Department of EnvironmentalManagement, Providence, RI, June 30, 1988.
93. McInnes, R.G., et al., GCA Corporation/Technology Division. Sampling andAnalysis Program at the New Bedford Municipal Sewage Sludge Incinerator. Prepared for the U.S. Environmental Protection Agency, Research TrianglePark, NC, November 1984.
94. Environment Canada. Organic and Inorganic Emissions from a Fluid BedSewage Sludge Incinerator at Duffin Creek Water Pollution Control Plant,August 1988.
95. Environment Canada. Organic and Inorganic Emissions from a Multi-Hearth Sewage Sludge Incinerator at Highland Creek Water PollutionControl Plant, August 1988.
4-122
96. Bridle, T.R., Environment Canada. Assessment of Organic Emissions fromthe Hamilton Sewage Sludge Incinerator.
97. Dewling, R.T., R.M. Manganelli, and G.T. Baer. Fate and Behavior ofSelected Heavy Metals in Incinerated Sludge, Journal of the Water PollutionControl Federation, Vol. 52, No. 10, October 1980.
98. Bennet, R.L., K.T. Knapp, and D.L. Duke. Chemical and PhysicalCharacterization of Municipal Sludge Incinerator Emissions, Report No. EPA600/3-84-047, NTIS No. PB 84-169325, U.S. Environmental ProtectionAgency, Environmental Sciences Research Laboratory, Research TrianglePark, NC, March 1984.
99. Acurex Corporation. 1990 Source Test Data for the Sewage SludgeIncinerator, Project 6595, Mountain View, CA, April 15, 1991.
100. U.S. Environmental Protection Agency. Emissions of Metals, Chromium, andNickel Species, and Organics from Municipal Wastewater SludgeIncinerators, Volume I: Summary Report, Cincinnati, OH, 1992.
101. Hentz, L.T., F.B. Johnson, and A. Baturay. Air Emission Studies of SewageSludge, Incinerators at the Western Branch Wastewater Treatment Plant,Water Environmental Research, Vol. 64, No. 2, March/April, 1992.
102. Source Emissions Testing of the Incinerator #2 Exhaust Stack at the CentralCosta Sanitary District Municipal Wastewater Treatment Plant, Mortmez,California. Galston Technical Services, Berkeley, CA, October, 1990.
103. Segal, R.R., W.G. DeWees, H.E. Bostian, E.P. Crumpler, and F.M. Lewis. Emissions of Metals, Chromium and Nickel Species, and Organics fromMunicipal Wastewater Sludge Incinerators, Volume II: Site 5 Test Report -Hexavalent Chromium Method Evaluation. EPA 600/R-92/003a, March1992.
104. Segal, R.R., W.G. DeWees, H.E. Bostian, E.P. Crumpler, and F.M. Lewis. Emissions of Metals, Chromium and Nickel Species, and Organics fromMunicipal Wastewater Sludge Incinerators, Volume III: Site 6 Test Report -Hexavalent Chromium Method Evaluation. EPA 600/R-92/003a, March1992.

4-123
105. Cone A.L. et al. Emissions of Metals, Chromium, Nickel Species, andOrganics from Municipal Wastewater Sludge Incinerators. Volume 5: Site 7Test Report CEMS. Entropy Environmentalists, Inc., Research TrianglePark, NC, March 1992.
106. Segal, R.R., W.G. DeWees, H.E. Bostian, E.P. Crumpler, and F.M. Lewis. Emissions of Metals, Chromium and Nickel Species, and Organics fromMunicipal Wastewater Sludge Incinerators, Volume VI: Site 8 Test Report -Hexavalent Chromium Method Evaluation. EPA 600/R-92/003a, March1992.
107. Segal, R.R., W.G. DeWees, H.E. Bostian, E.P. Crumpler, and F.M. Lewis. Emissions of Metals, Chromium and Nickel Species, and Organics fromMunicipal Wastewater Sludge Incinerators, Volume VII: Site 9 Test Report -Hexavalent Chromium Method Evaluation. EPA 600/R-92/003a, March1992.
108. Stack Sampling for THC and Specific Organic Pollutants at MWCCIncinerators. Prepared for the Metropolitan Waste Control Commission,Mears Park Centre, St. Paul, MN, July 11, 1991, QC-91-217.

4-124
5.0 AP-42 SECTION 2.2
Section 2.2 of AP-42 is presented in the following pages as it would appear inthe document.