Embed Size (px)
Citation preview
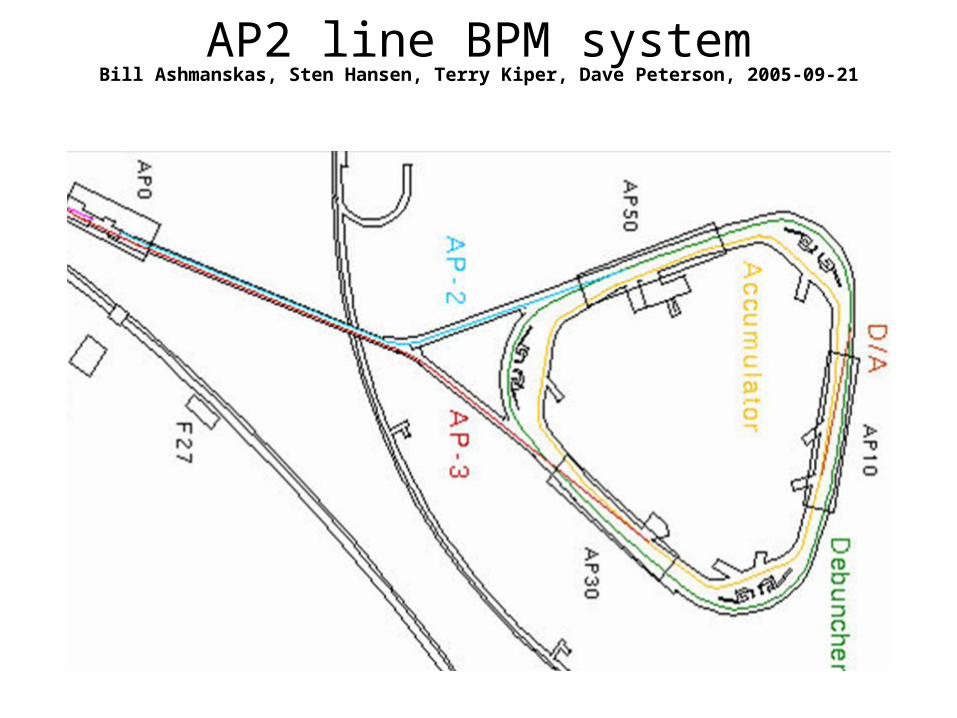
AP2 line BPM systemBill Ashmanskas, Sten Hansen, Terry Kiper, Dave Peterson, 2005-09-21

Background
• AP2 line 275 m long, travels from target to Debuncher• p/p 4% (at end of line)• Particles per pulse ~ 1010 at end of line, ~ 1011 earlier in line• ~ 108 antiprotons reach Debuncher every ~ 2 seconds• 1.5 s bunch train, bunched at 53.1 MHz• before amplification, signals while stacking range from about
-19 dBm (30 mV) upstream to about -35 dBm (4 mV) dnstream– so we amplify downstream signals 20dB in tunnel
• Reverse proton signals range from -50 dBm (1 mV) upstream to -23 dBm (20 mV) downstream (before downstream amplifiers)– maybe we should have amplified upstream, too?

Motivation
• Simulations by V. Lebedev et al. indicate that ~ 50% more flux into Debuncher may be possible with well understood optics
• Would like to use AP2 line BPMs– to measure optics vs. p/p for reverse protons– to correct orbit using reverse protons– to monitor orbit drift and intensities while stacking
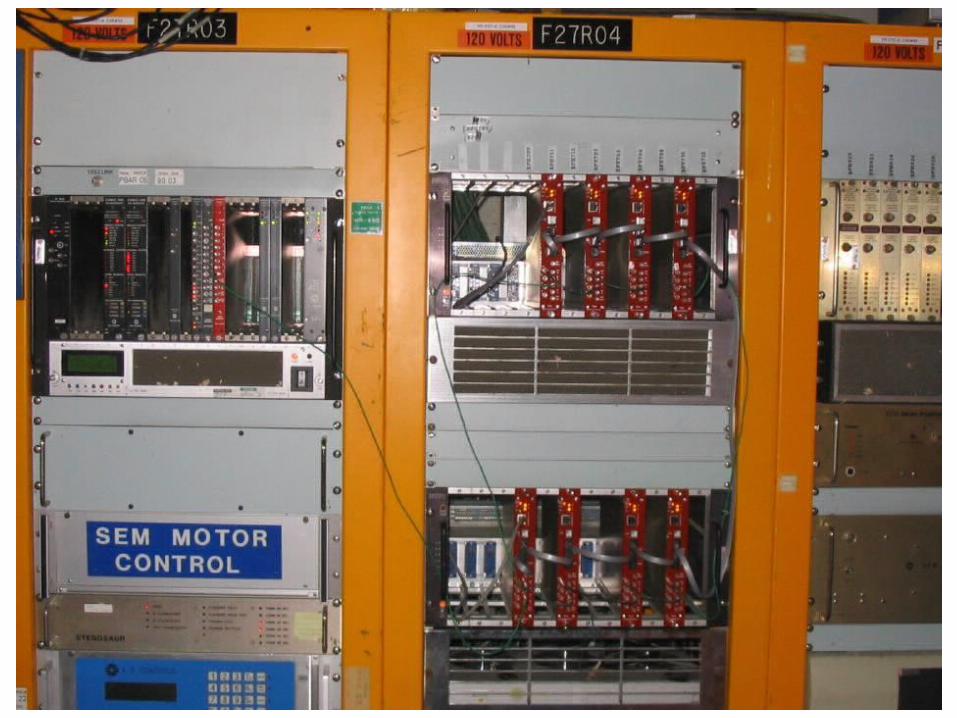
History
• Legacy AP2 BPM readout did not provide useful data:– signals much smaller than other beamlines’ 53 MHz signals– crosstalk from Debuncher injection kicker
• Kicker crosstalk looked pretty severe on oscilloscope– see http://www-bd.fnal.gov/cgi-mach/machlog.pl?nb=pbar03&page=318
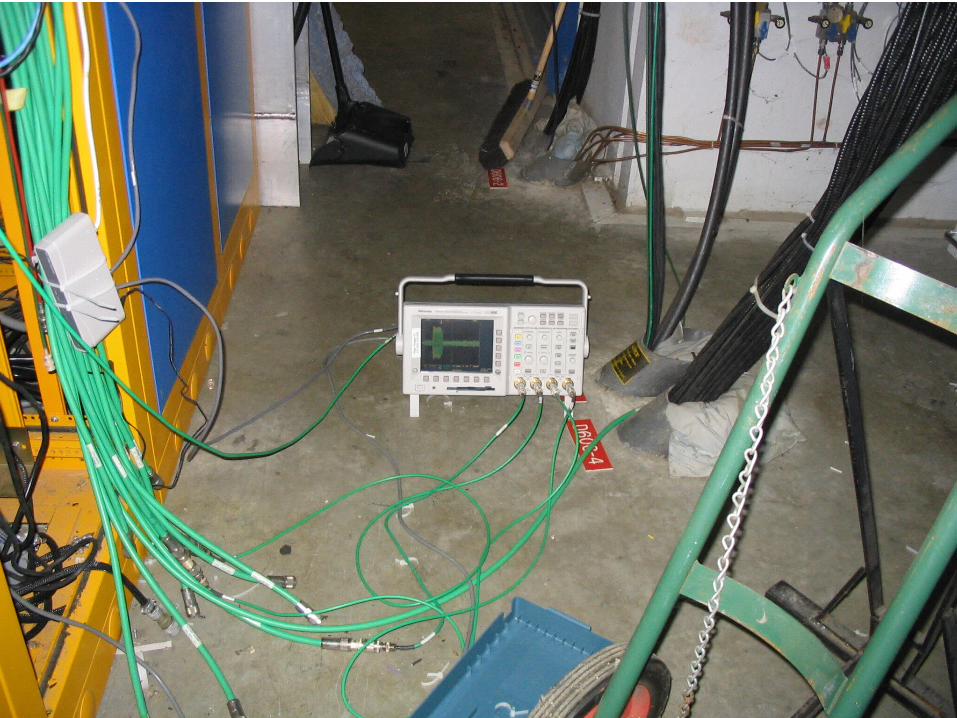
• But scope data looked OK offline with narrowband processing• Added BPF before scope to reduce dynamic range needed• (Re)connected existing 20 dB amplifiers to make interfering
kicker signal less important• Got ~ 1 mm resolution with scopes – good enough to be useful• Decided to build boards that do signal processing equivalent to
what we did with scopes – less clutter, easier readout, less costly

Blue = envelope read from new BPM boardRed = raw BPM signal (scope)Green = BPM signal after bandpass filter (scope)

We built something different from the echotek solution because …
• Modest demands — only 53 MHz needed• We wanted to control the details, since we weren’t sure how
much tinkering would be needed to make the system work– Didn’t have legacy system already working, to help specify upgrade
• I spent enough time with CDF trigger to learn to hate VxWorks• Substantially reduced infrastructure cost appealed to us• Gives us a toolkit for other ad-hoc projects
• It was much more fun to do it this way
• Anyway, the resolution is 100 m in the lab.– We think, some rainy day, we ought to be able to push it to < 50 m

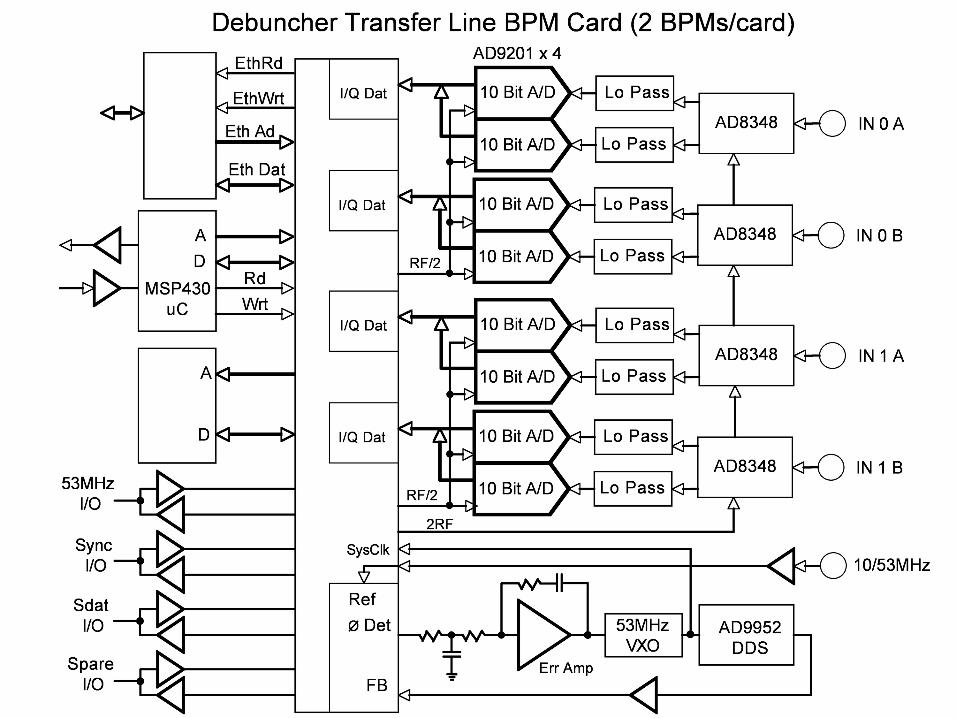
65 MHz LPFBPMsignal
53.1 MHz quadrature
demodulator
RF
LO
I
Q
5 MHz LPF
5 MHz LPF
10 bit dual ADC26.5 MHz
FPGA
TI MSP430
TCP/IP
Java OAC
Simplified block diagram

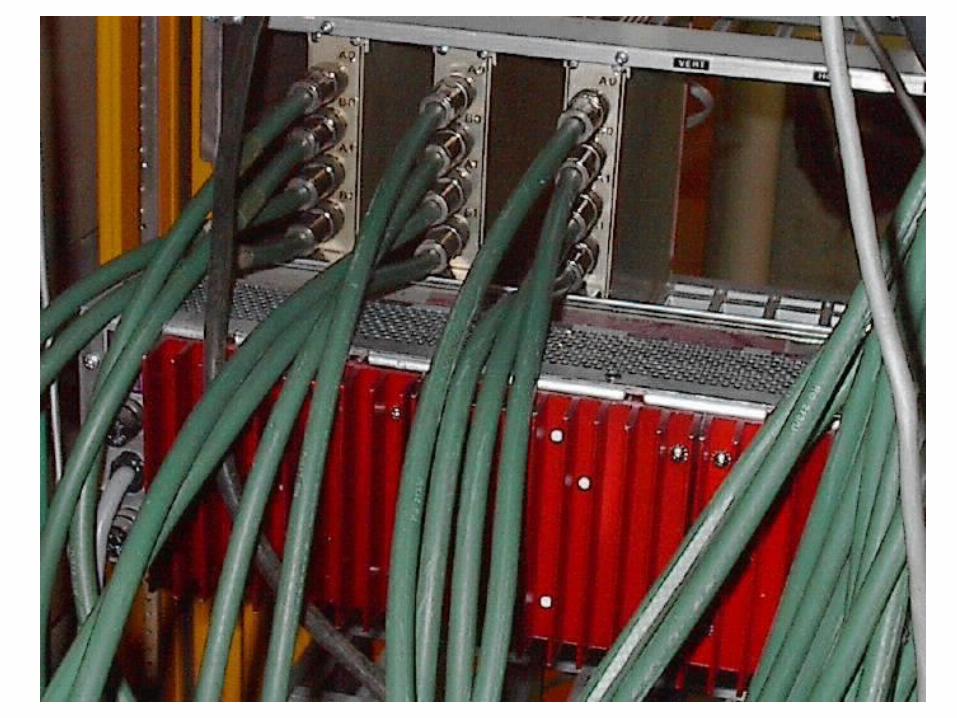


Misc features
• NIM module, 4 type N inputs, 2 BPMs• Can lock to external RF or 10 MHz – or not• 10 bit sampling of IF I and Q waveforms• 44dB adjustable gain in demodulator chip• Diagnostic DAC can drive (via analog switches) each input up
to about ¼ full scale (at maximum input gain); also drives FP lemo
• 32 MB SDRAM available (e.g. data capture), but not used now• Debug/test via USB console or telnet• MSP430F149, programmed in C, provides command interface• WIZnet 1” x 2” daughtercard provides TCP/IP stack• Nearly all processing done in Altera Cyclone 1C6Q240 FPGA• Remote FPGA + CPU update has been demonstrated (but not
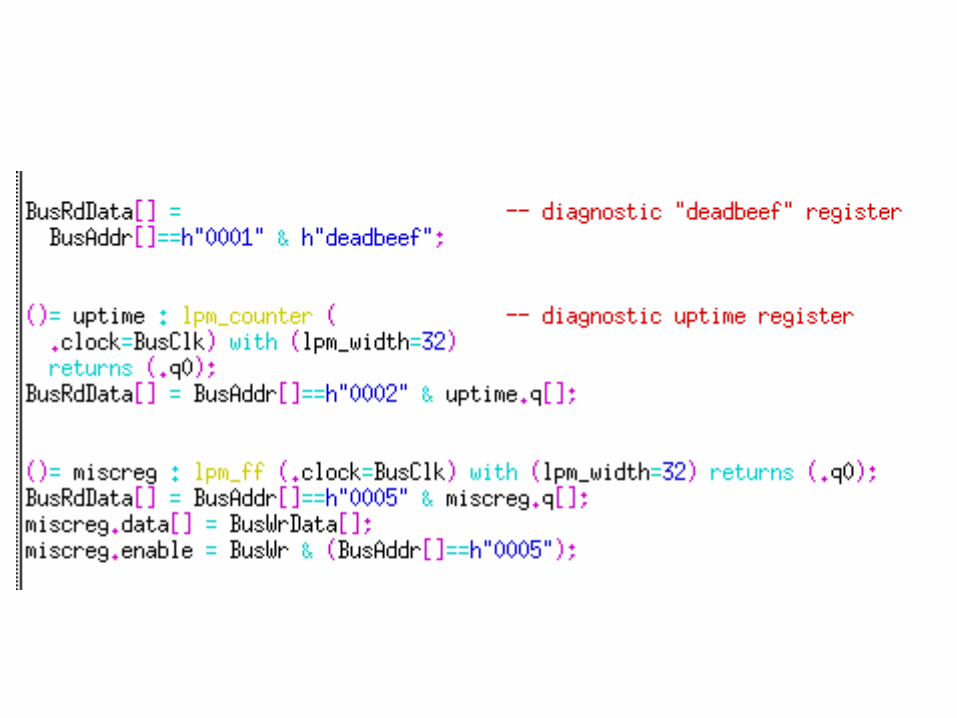
yet fully implemented in the field)• Single network connection reads out ~ 10 boards• Simple I/O protocol for remote register access (see next page)


Java
pro
gram
by
Jim
Bud
long
(an
alog
ous
to e
xist
ing
Deb
unch
er B
PM
pro
gram
)
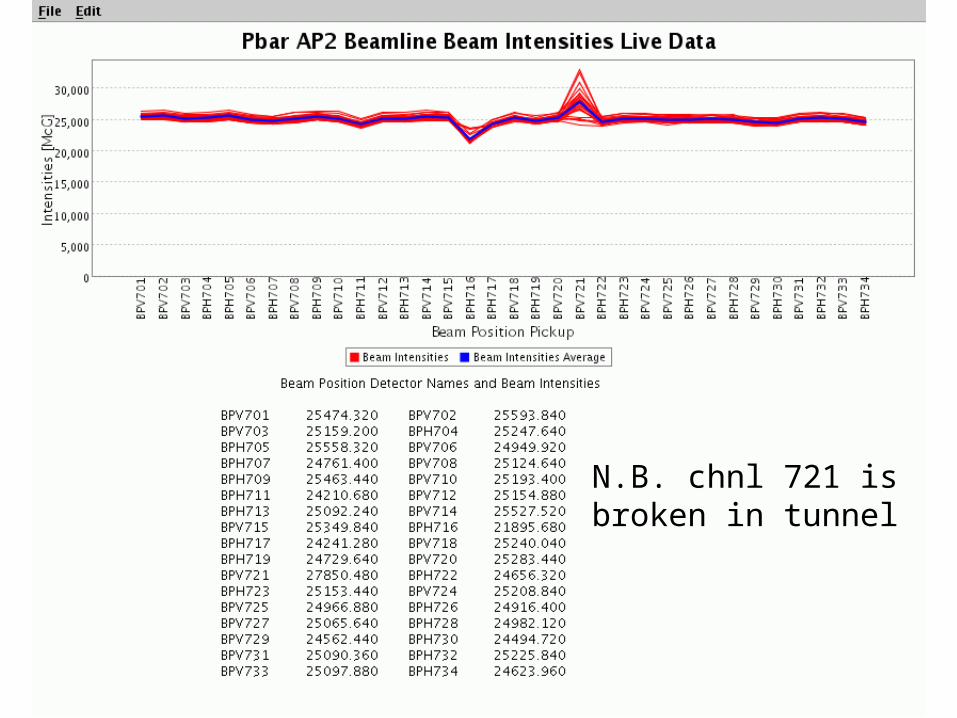
N.B. chnl 721 is broken in tunnel
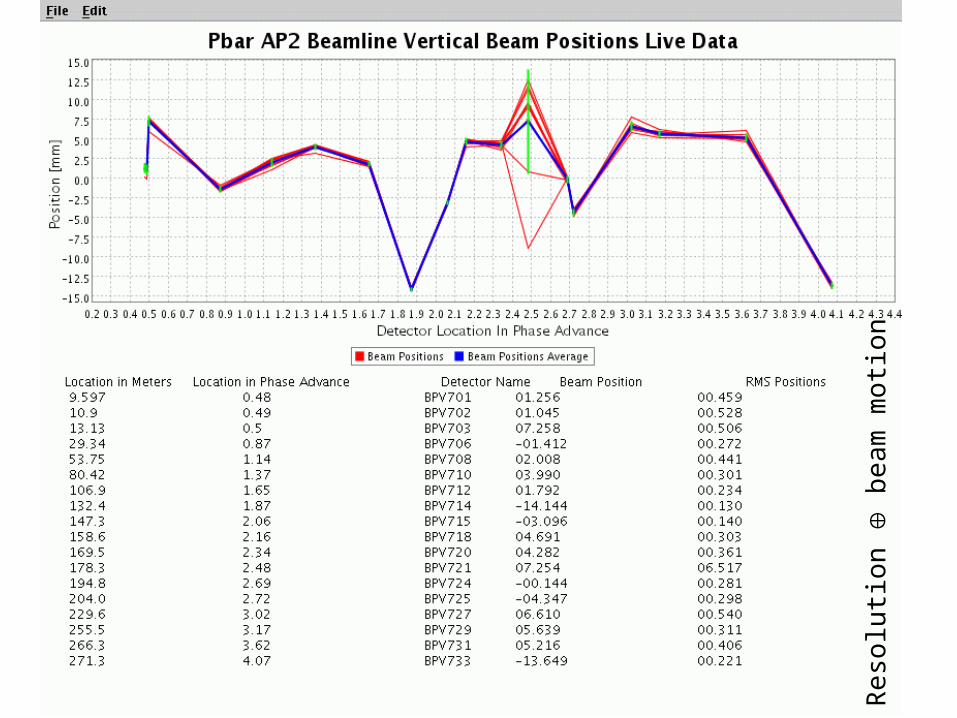
Res
olut
ion
b
eam
mot
ion

Res
olut
ion
b
eam
mot
ion
Response
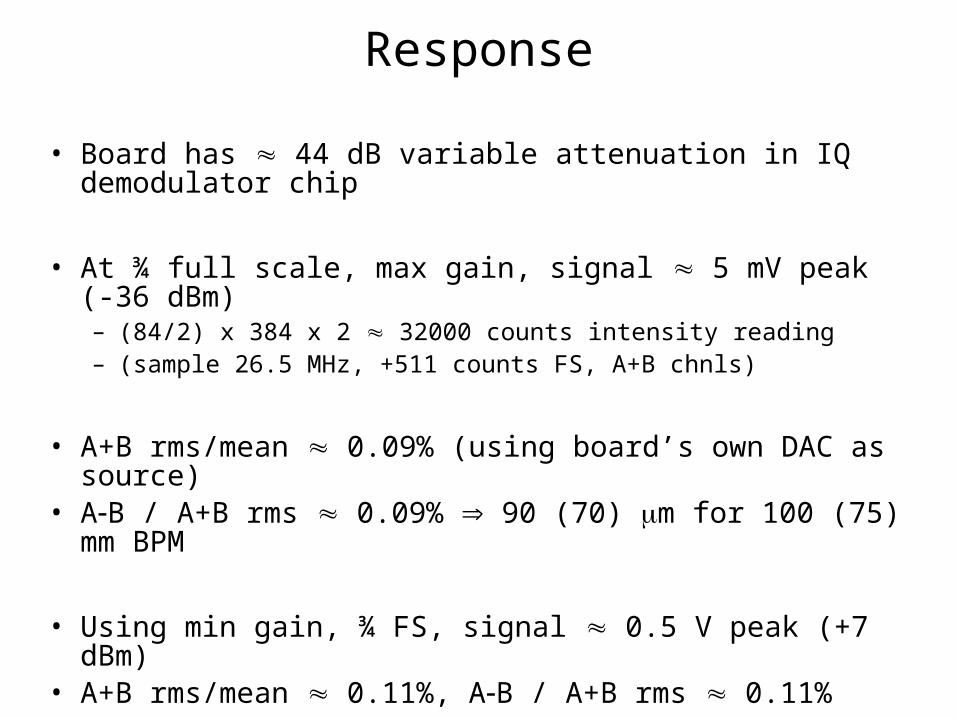
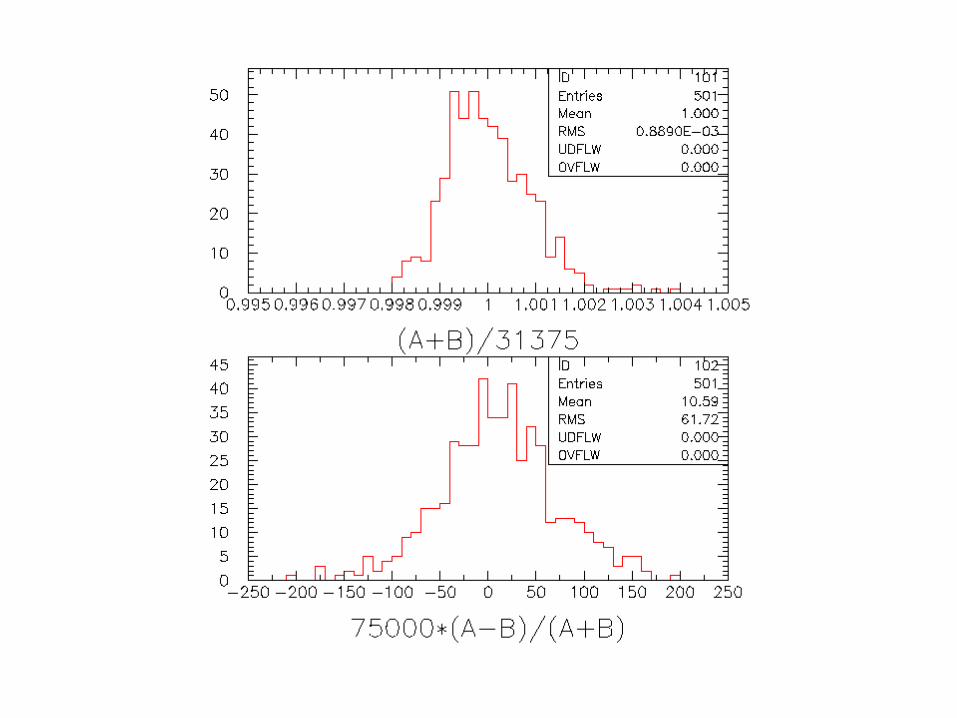
• Board has 44 dB variable attenuation in IQ demodulator chip
• At ¾ full scale, max gain, signal 5 mV peak (-36 dBm)– (84/2) x 384 x 2 32000 counts intensity reading– (sample 26.5 MHz, +511 counts FS, A+B chnls)
• A+B rms/mean 0.09% (using board’s own DAC as source)• AB / A+B rms 0.09% 90 (70) m for 100 (75) mm BPM
• Using min gain, ¾ FS, signal 0.5 V peak (+7 dBm)• A+B rms/mean 0.11%, AB / A+B rms 0.11%
Response
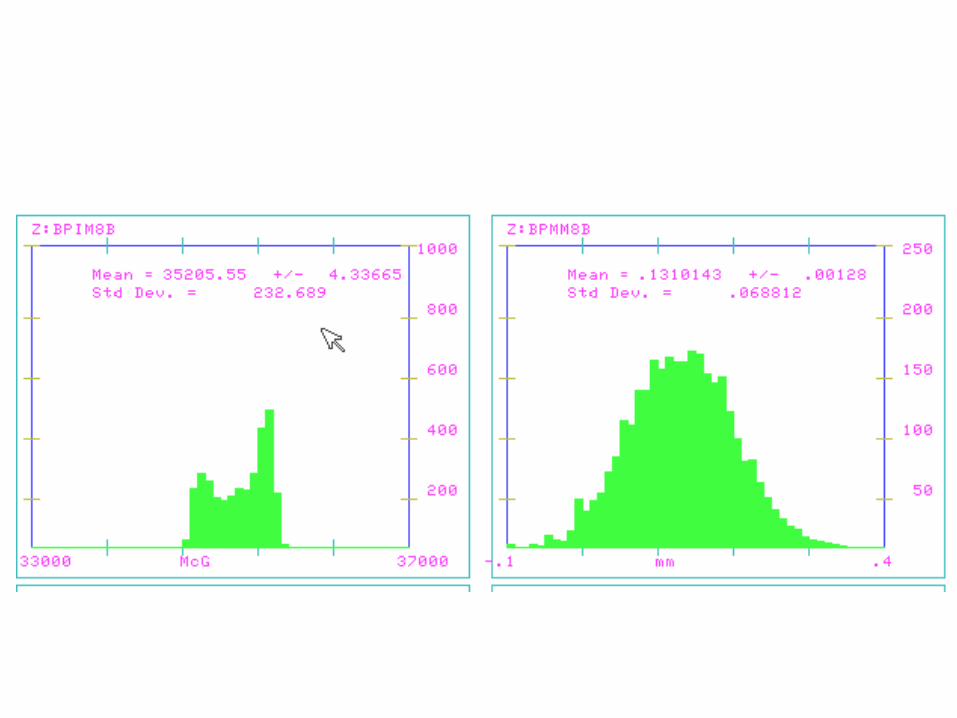
• Using AWG in instrumentation area, 24 dB atten, 83% FS,– A+B rms/mean = 0.65%, A-B / A+B rms = 0.092%– 69 m for 75 mm BPM (92 m for 100 mm BPM)
• Using another BPM board’s DAC as source (clocks not synchronized), still at ¾ FS, – A+B rms/mean 0.4%, AB / A+B rms 0.13%– Would be interesting to understand why this does worse than AWG


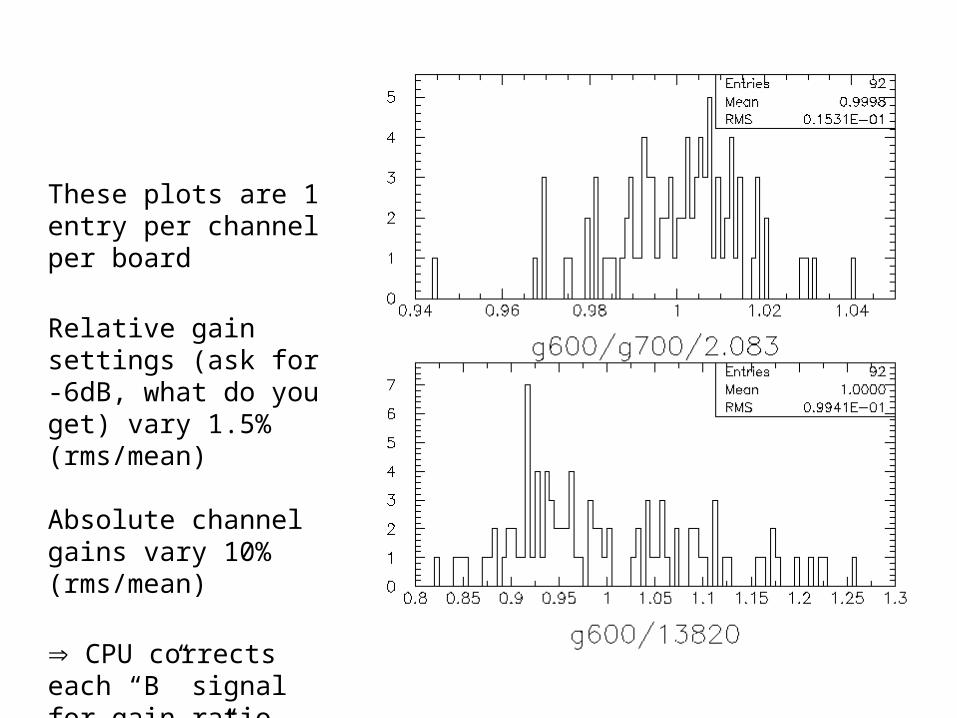
These plots are 1 entry per channel per board
Relative gain settings (ask for -6dB, what do you get) vary 1.5% (rms/mean)
Absolute channel gains vary 10% (rms/mean)
CPU corrects each “B” signal for gain ratio between “A” and “B”
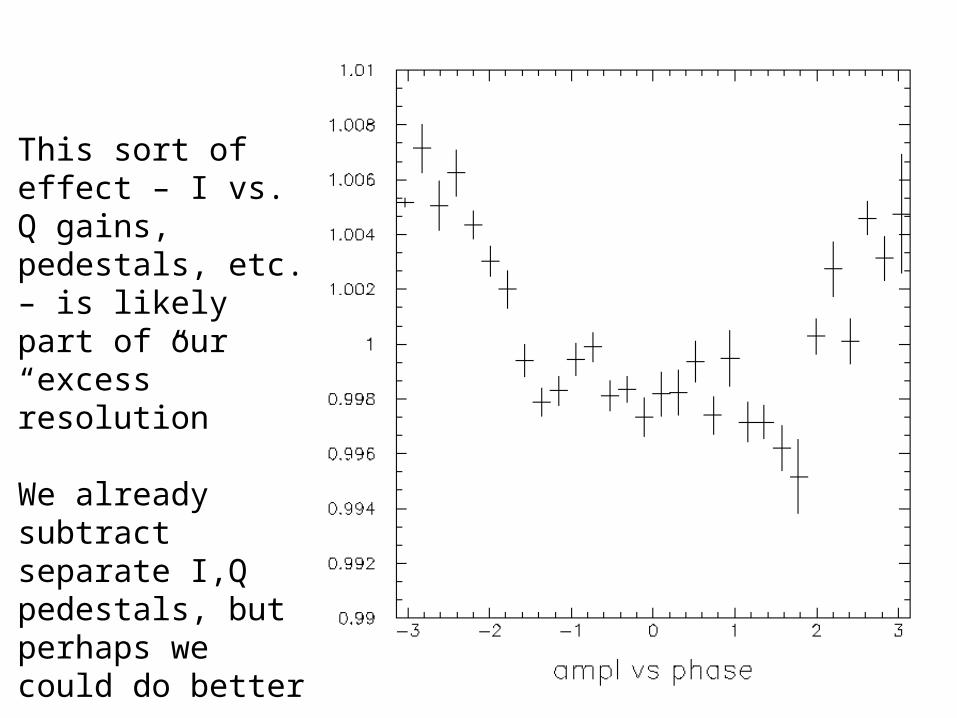
This sort of effect – I vs. Q gains, pedestals, etc. – is likely part of our “excess” resolution
We already subtract separate I,Q pedestals, but perhaps we could do better

To-do list• Remote software update needs to be finished• Better debug handles, e.g. waveform readout (partially exists)• Make lots of debug info accessible without creating a dozen new
ACNET devices per BPM• Streamlined (automatic) handling of stacking vs. studies settings• Simple application to manage calibration constants, gain
settings, timing offsets, etc.
• More comprehensive set of bench measurements may be nice
• Try mixing down with 52 MHz, not 53.1, followed by digital downconversion in FPGA? Better resolution??
• Implement “fast” fast time plots (as done for damper board)??• Use SDRAM for circular buffer• Decode TCLK, MIBS directly
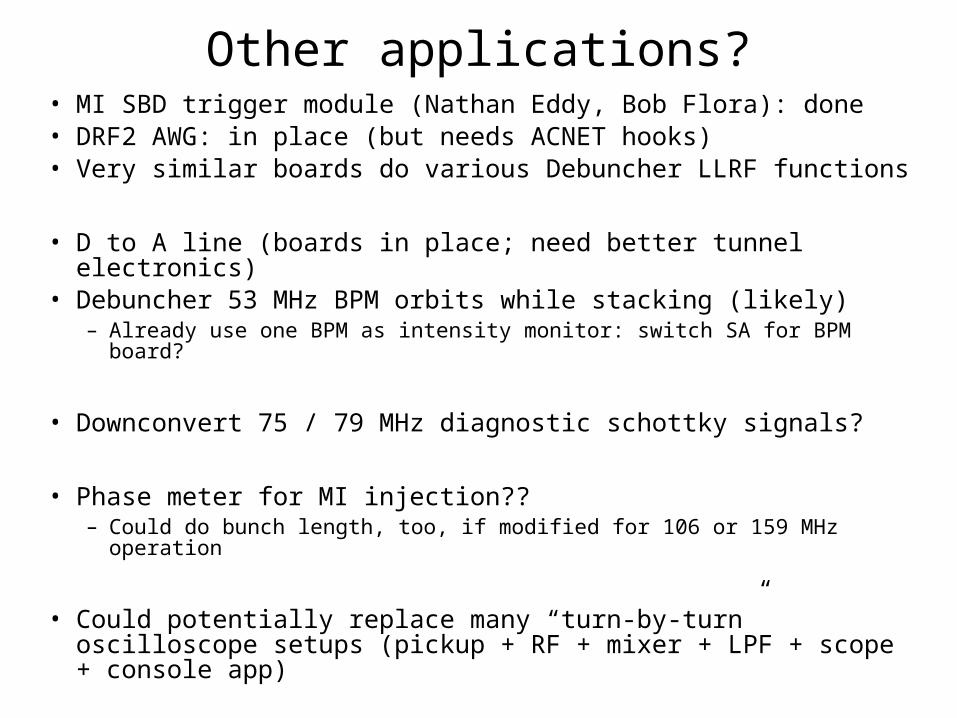
Other applications?• MI SBD trigger module (Nathan Eddy, Bob Flora): done• DRF2 AWG: in place (but needs ACNET hooks)• Very similar boards do various Debuncher LLRF functions
• D to A line (boards in place; need better tunnel electronics)• Debuncher 53 MHz BPM orbits while stacking (likely)
– Already use one BPM as intensity monitor: switch SA for BPM board?
• Downconvert 75 / 79 MHz diagnostic schottky signals?
• Phase meter for MI injection??– Could do bunch length, too, if modified for 106 or 159 MHz operation
• Could potentially replace many “turn-by-turn” oscilloscope setups (pickup + RF + mixer + LPF + scope + console app)

http://pbardebuncher.fnal.gov/wja/docs/ap2bpm/