Embed Size (px)
Citation preview
8/8/2019 Ap08 Statistics Coursedesc
http://slidepdf.com/reader/full/ap08-statistics-coursedesc 1/45
StatIStICSCourse Description
M a y 2 0 0 9 , M a y 2 0 1 0
8/8/2019 Ap08 Statistics Coursedesc
http://slidepdf.com/reader/full/ap08-statistics-coursedesc 2/45
The College Board: Connecting Students to College SuccessThe College Board is a not- or-pro t membership association whose mission is to connect studentsto college success and opportunity. Founded in 1900, the association is composed o more than5,400 schools, colleges, universities, and other educational organizations. Each year, the CollegeBoard serves seven million students and their parents, 23,000 high schools, and 3,500 collegesthrough major programs and services in college admissions, guidance, assessment, nancialaid, enrollment, and teaching and learning. Among its best-known programs are the SAT ®, thePSAT/NMSQT ®, and the Advanced Placement Program ® (AP ®). The College Board is committedto the principles o excellence and equity, and that commitment is embodied in all o its programs,services, activities, and concerns.
For urther in ormation visit www.collegeboard.com.
The College Board and the Advanced Placement Program encourage teachers, AP Coordinators,and school administrators to make equitable access a guiding principle or their AP programs.The College Board is committed to the principle that all students deserve an opportunity toparticipate in rigorous and academically challenging courses and programs. All students whoare willing to accept the challenge o a rigorous academic curriculum should be considered oradmission to AP courses. The Board encourages the elimination o barriers that restrict access toAP courses or students rom ethnic, racial, and socioeconomic groups that have been traditionallyunderrepresented in the AP Program. Schools should make every e ort to ensure that their APclasses refect the diversity o their student population.
© 2008 The College Board. All rights reserved. College Board, Advanced Placement Program, AP, AP Central, SAT, and theacorn logo are registered trademarks o the College Board. connect to college success is a trademark owned by the CollegeBoard. PSAT/NMSQT is a registered trademark o the College Board and National Merit Scholarship Corporation. All otherproducts and serv ices may be trademarks o t heir respective owners. Permission to use copyrighted College Board materialsmay be requested online at: www.collegeboard.com/inquiry/cbpermit.html.
Visit the College Board on the Web: www.collegeboard.com.
8/8/2019 Ap08 Statistics Coursedesc
http://slidepdf.com/reader/full/ap08-statistics-coursedesc 3/45
Dear Colleague: We know that AP ® is a unique collaboration among motivated students, dedicatedteachers, and committed high schools, colleges, and universities. Without your
contributions, the rigorous instruction that takes place in classrooms around the world would not be possible.In 2007, approximately 1.4 million students took more than 2.5 million AP Exams.
Guiding these students were talented, hardworking teachers, who are the heart andsoul o the AP Program. The College Board is grate ul or the dedication o APteachers and the administrators who support them.
One example o the collaboration that makes AP possible is the AP Course Audit,the process through which college aculty review AP teachers’ syllabi to ensure that both teachers and administrators are aware o the expectations colleges anduniversities have or AP courses. This yearlong intensive assessment involved thereview and analysis o more than 134,000 syllabi to determine which courses ul l lor exceed standards or college-level curricula. In total , 14,383 secondary schools worldwide succeeded in developing one or more courses that have receivedauthorization rom the College Board.
Through the AP Audit, teachers received a number o bene ts. For example, you or your colleagues told us that the AP Audit helped you to obtain more current college textbooks or your students. A signi cant number o teachers said they were able to prevent the reduction o lab or instructional time that was scheduledto a ect their courses. Because o the audit, 22,000 teachers said they were ableto incorporate advances in their discipline that had not yet been added to their curricula. The searchable AP Course Ledger is online at collegeboard.com.
The College Board remains committed to supporting the work o AP teachers. AP workshops and Summer Institutes held around the world provide stimulatingpro essional development or more than 60,000 teachers each year. Workshopsprovide teachers not only with valuable course-speci c in ormation but theopportunity to interact and network with their colleagues in the AP community.
This community is extended online at AP Central ® where teachers can access a wide range o resources, in ormation, and tools to support their work in the APclassroom. In response to requests rom educators to make our Web site easier touse, the College Board implemented extensive improvements to collegeboard.com. A new “K–12 Teacher” homepage makes it easier to nd an array o content andservices. AP Central serves as an integral part o this enhanced collegeboard.com Web site.
We appreciate all o your e orts in the AP classroom and in the courses that prepare students or the rigor and challenge o AP. It is through the dedication andhard work o educators like you that a wider range o students than ever be ore isbeing given the opportunity to succeed in AP.
Sincerely,
Gaston CapertonPresident The College Board

8/8/2019 Ap08 Statistics Coursedesc
http://slidepdf.com/reader/full/ap08-statistics-coursedesc 4/45
8/8/2019 Ap08 Statistics Coursedesc
http://slidepdf.com/reader/full/ap08-statistics-coursedesc 5/45

8/8/2019 Ap08 Statistics Coursedesc
http://slidepdf.com/reader/full/ap08-statistics-coursedesc 6/45
8/8/2019 Ap08 Statistics Coursedesc
http://slidepdf.com/reader/full/ap08-statistics-coursedesc 7/45
© 2008 T e C ege B ar . A r g ts reserve . V s t t e C ege B ar t e Web: www.c egeb ar .c .
Welcome to the AP ® Program
The Advanced Placement Program ® (AP) is a collaborative e ort among motivatedstudents; dedicated teachers; and committed high schools, colleges, and universities.
Since its inception in 1955, the Program has enabled millions o students to takecollege-level courses and exams, and to earn college credit or placement, while stillin high school.
Most colleges and universities in the United States, as well as colleges anduniversities in more than 40 other countries, have an AP policy granting incomingstudents credit, placement, or both on the basis o their AP Exam grades. Many o these institutions grant up to a ull year o college credit (sophomore standing) tostudents who earn a su cient number o quali ying AP grades.
Each year, an increasing number o parents, students, teachers, high schools, andcolleges and universities turn to the AP Program as a model o educational excellence.
More in ormation about the AP Program is available at the back o this Course
Description and at AP Central, the College Board’s online home or AP pro essionals(apcentral.collegeboard.com). Students can nd more in ormation at the AP student site (www.collegeboard.com/apstudents).
AP C rses Thirty-seven AP courses in a wide variety o subject areas are available now. A committee o college aculty and master AP teachers designs each AP course tocover the in ormation, skills, and assignments ound in the corresponding collegecourse. See page 2 or a complete list o AP courses and exams.
AP E a sEach AP course has a corresponding exam that participating schools worldwideadminister in May (except or AP Studio Art, which is a port olio assessment). AP Exams contain multiple- choice questions and a ree-response section (essay,problem solving, or oral response).
AP Exams are a culminating assessment in all AP courses and are thus an integralpart o the Program. As a result, many schools oster the expectation that students who enroll in an AP course will take the corresponding AP Exam. Because theCollege Board is committed to providing access to AP Exams or homeschooledstudents and students whose schools do not o er AP courses, it does not requirestudents to take an AP course prior to taking an AP Exam.
AP C rse A t The AP Course Audit was created at the request o secondary school and college anduniversity members o the College Board who sought a means to provide teachersand administrators with clear guidelines on the curricular and resource requirementsthat must be in place or AP courses. The AP Course Audit also helps colleges anduniversities better interpret secondary school courses marked “AP” on students’transcripts. To receive authorization rom the College Board to label a course “AP,”
8/8/2019 Ap08 Statistics Coursedesc
http://slidepdf.com/reader/full/ap08-statistics-coursedesc 8/45
2 © 2008 T e C ege B ar . A r g ts reserve . V s t t e C ege B ar t e Web: www.c egeb ar .c .
schools must demonstrate how their courses meet or exceed these requirements, which colleges and universities expect to see within a college-level curriculum.
The AP Program unequivocally supports the principle that each individual school
must develop its own curriculum or courses labeled “AP.” Rather than mandatingany one curriculum or AP courses, the AP Course Audit instead provides each AP teacher with a set o expectations that college and secondary school aculty nationwide have established or college-level courses. AP teachers are encouragedto develop or maintain their own curriculum that either includes or exceeds each o these expectations; such courses will be authorized to use the “AP” designation.Credit or the success o AP courses belongs to the individual schools and teachersthat create power ul, locally designed AP curricula.
Complete in ormation about the AP Course Audit is available at AP Central.
AP C rses a E a s Art Art History Studio Art: 2-D DesignStudio Art: 3-D DesignStudio Art: DrawingBiology CalculusCalculus ABCalculus BCChemistry Chinese Language and Culture
Computer ScienceComputer Science A Computer Science AB *
EconomicsMacroeconomicsMicroeconomicsEnglishEnglish Language and CompositionEnglish Literature and CompositionEnvironmental ScienceFrench
French LanguageFrench Literature *
German LanguageGovernment and PoliticsComparative Government and PoliticsUnited States Government and PoliticsHistory European History United States History World History Human Geography Italian Language and Culture *
Japanese Language and CultureLatinLatin Literature *
Latin: VergilMusic Theory PhysicsPhysics BPhysics C: Electricity and MagnetismPhysics C: MechanicsPsychology SpanishSpanish LanguageSpanish LiteratureStatistics
* AP Computer Science AB, AP French Literature, and AP Latin Literature will be discontinued a ter the May 2009exam administration. AP Italian may also be discontinued i external unding is not secured by May 2009. Visit AP Central or details.
8/8/2019 Ap08 Statistics Coursedesc
http://slidepdf.com/reader/full/ap08-statistics-coursedesc 9/45
8/8/2019 Ap08 Statistics Coursedesc
http://slidepdf.com/reader/full/ap08-statistics-coursedesc 10/45
© 2008 T e C ege B ar . A r g ts reserve . V s t t e C ege B ar t e Web: www.c egeb ar .c .
2. AP courses and exams are reviewed and updated regularly based on the resultso curriculum surveys at up to 200 colleges and universities, collaborationsamong the College Board and key educational and disciplinary organizations,and the interactions o committee members with pro essional organizations intheir discipline.
3. Periodic college comparability studies are undertaken in which the per ormance o college students on AP Exams is compared with that o AP students to con irm that the AP grade scale o 1 to 5 is properly aligned with current college standards.
For more in ormation about the role o colleges and universities in the APProgram, visit the Higher Ed Services section o collegeboard.com at pro essionals.collegeboard.com/higher-ed.
Sett g Cre t a P ace e t P c es f r AP Gra es The College Board Web site or education pro essionals has a section geared toward
colleges and universities that provides guidance in setting AP credit and placement policies and additional resources, including links to AP research studies, releasedexam questions, and sample student responses at varying levels o achievement or each AP Exam. Visit pro essionals.collegeboard.com/higher-ed/placement/ap.
The AP Credit Policy In o online search tool provides links to credit and place-ment policies at more than 1,000 colleges and universities. The tool helps students
nd the credit hours and advanced placement they can receive or quali yingexam scores within each AP subject. AP Credit Policy In o is available at www.collegeboard.com/ap/creditpolicy.
8/8/2019 Ap08 Statistics Coursedesc
http://slidepdf.com/reader/full/ap08-statistics-coursedesc 11/45
© 2008 T e C ege B ar . A r g ts reserve . V s t t e C ege B ar t e Web: www.c egeb ar .c .
AP Statistics
I n T R o d u C T I o n
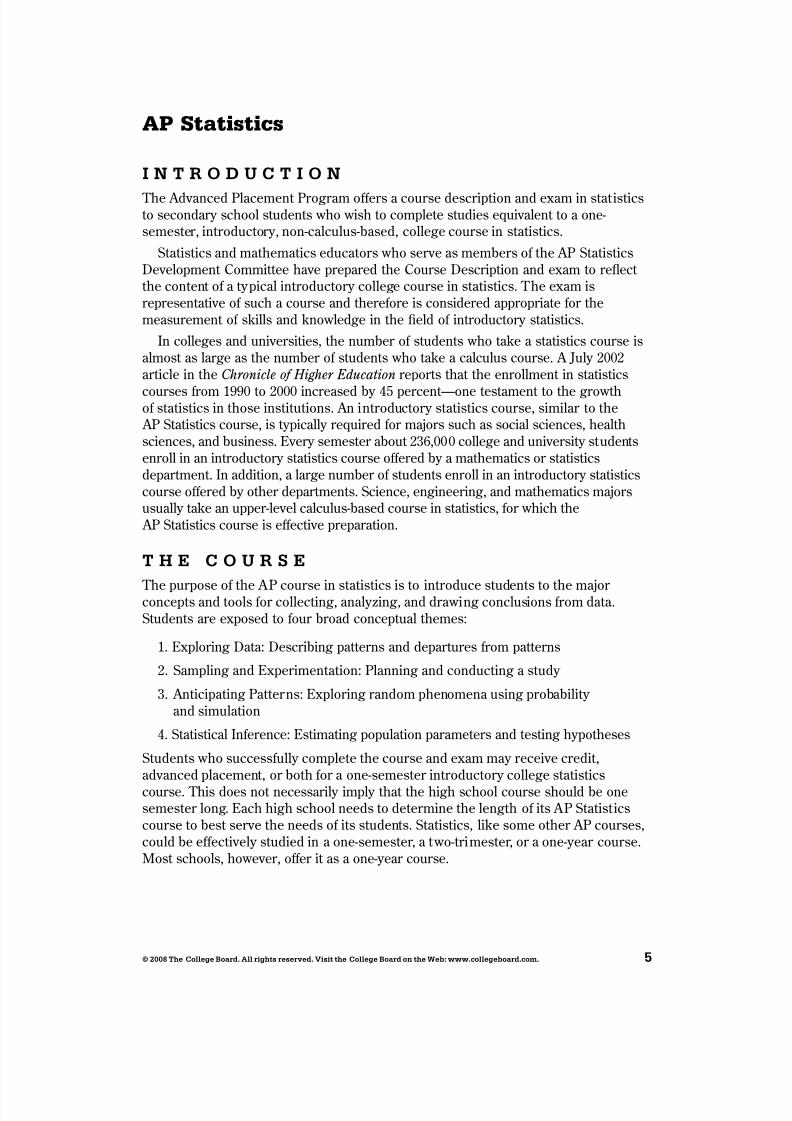
The Advanced Placement Program o ers a course description and exam in statisticsto secondary school students who wish to complete studies equivalent to a one-semester, introductory, non-calculus-based, college course in statistics.
Statistics and mathematics educators who serve as members o the AP StatisticsDevelopment Committee have prepared the Course Description and exam to refect the content o a typical introductory college course in statistics. The exam isrepresentative o such a course and there ore is considered appropriate or themeasurement o skills and knowledge in the eld o introductory statistics.
In colleges and universities, the number o students who take a statistics course isalmost as large as the number o students who take a calculus course. A July 2002article in the Chronicle of Higher Education reports that the enrollment in statistics
courses rom 1990 to 2000 increased by 45 percent—one testament to the growtho statistics in those institutions. An introductory statistics course, similar to the AP Statistics course, is typically required or majors such as social sciences, healthsciences, and business. Every semester about 236,000 college and university studentsenroll in an introductory statistics course o ered by a mathematics or statisticsdepartment. In addition, a large number o students enroll in an introductory statisticscourse o ered by other departments. Science, engineering, and mathematics majorsusually take an upper-level calculus-based course in statistics, or which the AP Statistics course is e ective preparation.
T h E C o u R S E
The purpose o the AP course in statistics is to introduce students to the major concepts and tools or collecting, analyzing, and drawing conclusions rom data.Students are exposed to our broad conceptual themes:
1. Exploring Data: Describing patterns and departures rom patterns
2. Sampling and Experimentation: Planning and conducting a study
3. Anticipating Patterns: Exploring random phenomena using probability and simulation
4. Statistical In erence: Estimating population parameters and testing hypotheses
Students who success ully complete the course and exam may receive credit,advanced placement, or both or a one-semester introductory college statisticscourse. This does not necessarily imply that the high school course should be onesemester long. Each high school needs to determine the length o its AP Statisticscourse to best serve the needs o its students. Statistics, like some other AP courses,could be e ectively studied in a one-semester, a two-trimester, or a one-year course.Most schools, however, o er it as a one-year course.
8/8/2019 Ap08 Statistics Coursedesc
http://slidepdf.com/reader/full/ap08-statistics-coursedesc 12/45
© 2008 T e C ege B ar . A r g ts reserve . V s t t e C ege B ar t e Web: www.c egeb ar .c .
St e t Se ect The College Board and the Advanced Placement Program encourage teachers, AP Coordinators, and school administrators to make equitable access a guiding
principle or their AP programs. The College Board is committed to the principle that all students deserve an opportunity to participate in rigorous and academically challenging courses and programs. All students who are willing to accept thechallenge o a rigorous academic curriculum should be considered or admission to AP courses. The Board encourages the elimination o barriers that restrict access to AP courses or students rom ethnic, racial, and socioeconomic groups that have beentraditionally underrepresented in the AP Program. Schools should make every e ort to ensure that their AP classes refect the diversity o their student population.
The AP Statistics course is an excellent option or any secondary school student who has success ully completed a second-year course in algebra and who possessessu cient mathematical maturity and quantitative reasoning ability.
Because second-year algebra is the prerequisite course, AP Statistics usually willbe taken in either the junior or senior year. The decisions about whether to take AP Statistics and when to take it depend on a student’s plans:
• Students planning to take a science course in their senior year will bene it greatly rom taking AP Statistics in their junior year.
• For students who would otherwise take no mathematics in their senior year, AP Statistics allows them to continue to develop their quantitative skills.
• Students who wish to leave open the option o taking calculus in college shouldinclude precalculus in their high school program and perhaps take AP Statisticsconcurrently with precalculus.
Students with the appropriate mathematical background are encouraged to take both AP Statistics and AP Calculus in high school.Students who take the AP Statistics course are strongly encouraged to take the
exam.
Teac g t e C rse The AP Statistics course lends itsel naturally to a mode o teaching that engagesstudents in constructing their own knowledge. For example, students workingindividually or in small groups can plan and per orm data collection and analyses where the teacher serves in the role o a consultant, rather than a director. Thisapproach gives students ample opportunity to think through problems, make
decisions, and share questions and conclusions with other students as well as withthe teacher.Important components o the course should include the use o technology, projects
and laboratories, cooperative group problem-solving, and writing, as a part o concept-oriented instruction and assessment. This approach to teaching AP Statistics will allow students to build interdisciplinary connections with other subjects and withtheir world outside school.
8/8/2019 Ap08 Statistics Coursedesc
http://slidepdf.com/reader/full/ap08-statistics-coursedesc 13/45
© 2008 T e C ege B ar . A r g ts reserve . V s t t e C ege B ar t e Web: www.c egeb ar .c .
The AP Statistics course depends heavily on the availability o technology suitableor the interactive, investigative aspects o data analysis. There ore, schools should
make every e ort to provide students and teachers easy access to computers toacilitate the teaching and learning o statistics.
Providing instructional in ormation and educational opportunities or teachers isan important component o the AP Program. The College Board o ers workshops,summer courses, and institutes or teachers in all AP courses. Further in ormationabout these and other training opportunities may be obtained at AP Central
(apcentral.collegeboard.com) and rom your College Board regional o ce (contact in ormation is on the inside back cover). The Teachers’ Resources section o AP Centralo ers reviews o textbooks, articles, Web sites, and other teaching resources. Theelectronic discussion groups (EDGs) accessible through AP Central also provide a moderated orum or exchanging ideas, insights, and practices among members o the AP pro essional community.
Additionally, the ollowing publications provide some insight into the philosophy o the AP Statistics course.
Cobb, George, “Teaching Statistics: More Data, Less Lecturing.” In Steen, Lynn Arthur, ed. 1992. Heeding the Call for Change: Suggestions for Curricular Action. Washington, D.C.: Mathematical Association o America. To order MAA publications call 800 331-1622 or go to www.maa.org.
Gordon, Florence and Sheldon, eds. 1992. Statistics for the Twenty-First Century, MA A Notes No. 26. Washington, D.C.: Mathematical Association o America.
Moore, Thomas, ed. 2000. Teaching Statistics: Resources for Undergraduate Instructors, MA A Notes Vol. 52. Washington, D.C.: Mathematical Associationo America.
National Council o Teachers o Mathematics. 2003. Principles and Standards for School Mathematics, 3rd ed. Reston, Va.: National Council o Teachers o Mathematics. www.nctm.org.
C rse C te t overv ew The topics or AP Statistics are divided into our major themes: exploratory analysis(20–30 percent o the exam), planning and conducting a study (10–15 percent o the exam), probability (20–30 percent o the exam), and statistical in erence(30–40 percent o the exam).
I. Exploratory analysis of data makes use of graphical and numerical techniquesto study patterns and departures from patterns. In examining distributions o data, students should be able to detect important characteristics, such asshape, location, variability, and unusual values. From care ul observations o patterns in data, students can generate conjectures about relationships among variables. The notion o how one variable may be associated with another permeates almost all o statistics, rom simple comparisons o proportionsthrough linear regression. The di erence between association and causationmust accompany this conceptual development throughout.
8/8/2019 Ap08 Statistics Coursedesc
http://slidepdf.com/reader/full/ap08-statistics-coursedesc 14/45
8 © 2008 T e C ege B ar . A r g ts reserve . V s t t e C ege B ar t e Web: www.c egeb ar .c .
II. Data must be collected according to a well-developed plan if valid informationis to be obtained. I data are to be collected to provide an answer to a questiono interest, a care ul plan must be developed. Both the type o analysis that isappropriate and the nature o conclusions that can be drawn rom that analysisdepend in a critical way on how the data was collected. Collecting data in a reasonable way, through either sampling or experimentation, is an essentialstep in the data analysis process.
III. Probability is the tool used for anticipating what the distribution of data should looklike under a given model. Random phenomena are not haphazard: they display an order that emerges only in the long run and is described by a distribution. The mathematical description o variation is central to statistics. The probability required or statistical in erence is not primarily axiomatic or combinatorial but is oriented toward using probability distributions to describe data.
IV. Statistical inference guides the selection of appropriate models. Models and data interact in statistical work: models are used to draw conclusions rom data, while the data are allowed to criticize and even alsi y the model throughin erential and diagnostic methods. In erence rom data can be thought o asthe process o selecting a reasonable model, including a statement in probability language, o how con dent one can be about the selection.
T o P I C o u T l I n EFollowing is an outline o the major topics covered by the AP Statistics Exam. Theordering here is intended to de ne the scope o the course but not necessarily thesequence. The percentages in parentheses or each content area indicate the coverage
or that content area in the exam.
I. Exploring Data: Describing patterns and departures rom patterns (20%–30%) Exploratory analysis of data makes use of graphical and numerical techniques to
study patterns and departures from patterns. Emphasis should be placed oninterpreting information from graphical and numerical displays and summaries .
A. Constructing and interpreting graphical displays o distributions o univariate data (dotplot, stemplot, histogram, cumulative requency plot)1. Center and spread2. Clusters and gaps3. Outliers and other unusual eatures4. Shape
B. Summarizing distributions o univariate data
1. Measuring center: median, mean2. Measuring spread: range, interquarti le range, standard deviation3. Measuring position: quartiles, percentiles, standardized scores (z-scores)4. Using boxplots5. The e ect o changing units on summary measures
8/8/2019 Ap08 Statistics Coursedesc
http://slidepdf.com/reader/full/ap08-statistics-coursedesc 15/45
© 2008 T e C ege B ar . A r g ts reserve . V s t t e C ege B ar t e Web: www.c egeb ar .c .
C. Comparing distributions o univariate data (dotplots, back-to-back stemplots,parallel boxplots)1. Comparing center and spread: within group, between group variation2. Comparing clusters and gaps3. Comparing outliers and other unusual eatures4. Comparing shapes
D. Exploring bivariate data 1. Analyzing patterns in scatterplots2. Correlation and linearity 3. Least-squares regression line4. Residual plots, outliers, and infuential points5. Trans ormations to achieve linearity: logarithmic and
power trans ormationsE. Exploring categorical data
1. Frequency tables and bar charts
2. Marginal and joint requencies or two-way tables3. Conditional relative requencies and association4. Comparing distributions using bar charts
II. Sampling and Experimentation: Planning and conducting a study (10%–15%)
Data must be collected according to a well-developed plan if valid information on aconjecture is to be obtained. This plan includes clarifying the question and deciding upon a method of data collection and analysis.
A. Overview o methods o data collection1. Census2. Sample survey 3. Experiment 4. Observational study
B. Planning and conducting surveys1. Characteristics o a well-designed and well-conducted survey 2. Populations, samples, and random selection3. Sources o bias in sampling and surveys4. Sampling methods, including simple random sampling, strati ed random
sampling, and cluster samplingC. Planning and conducting experiments
1. Characteristics o a well-designed and well-conducted experiment 2. Treatments, control groups, experimental units, random assignments,
and replication3. Sources o bias and con ounding, including placebo e ect and blinding4. Completely randomized design5. Randomized block design, including matched pairs design
D. Generalizability o results and types o conclusions that can be drawn romobservational studies, experiments, and surveys
8/8/2019 Ap08 Statistics Coursedesc
http://slidepdf.com/reader/full/ap08-statistics-coursedesc 16/45
0 © 2008 T e C ege B ar . A r g ts reserve . V s t t e C ege B ar t e Web: www.c egeb ar .c .
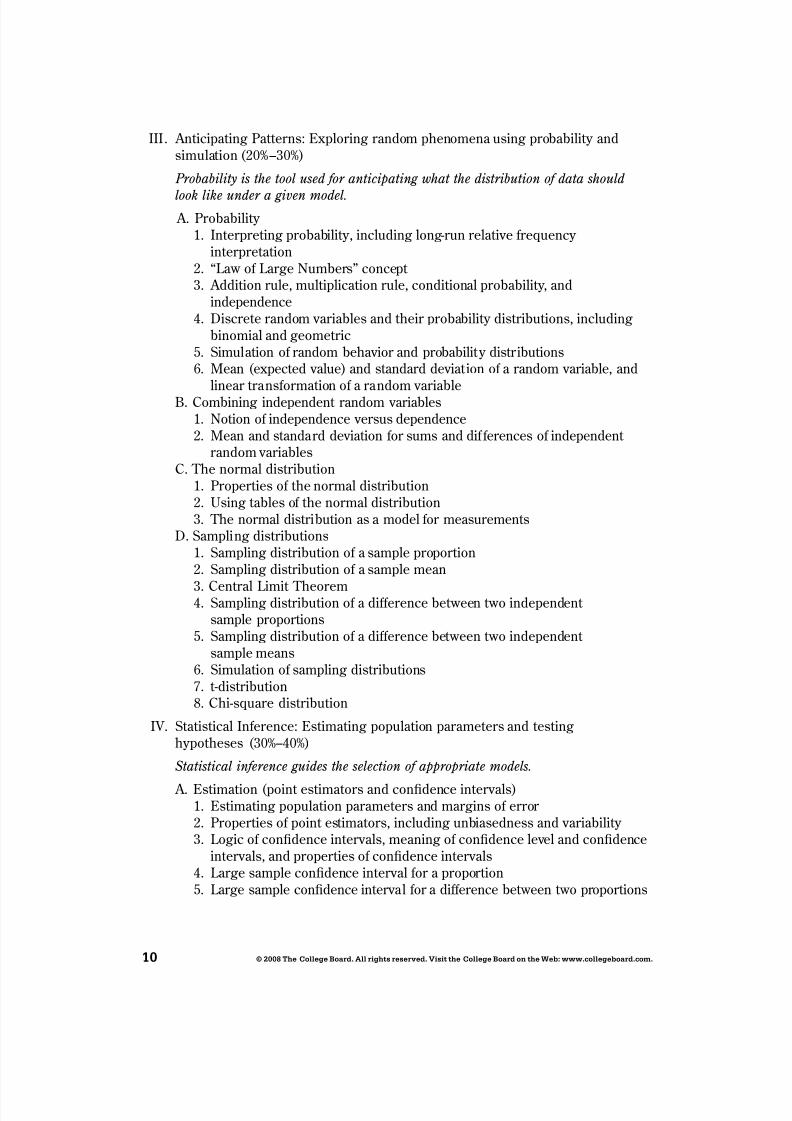
III . Anticipating Patterns: Exploring random phenomena using probability andsimulation (20%–30%)
Probability is the tool used for anticipating what the distribution of data should
look like under a given model. A. Probability
1. Interpreting probability, including long-run relative requency interpretation
2. “Law o Large Numbers” concept 3. Addition rule, multiplication rule, conditional probability, and
independence4. Discrete random variables and their probability distributions, including
binomial and geometric5. Simulation o random behavior and probability distributions6. Mean (expected value) and standard deviation o a random variable, and
linear trans ormation o a random variableB. Combining independent random variables
1. Notion o independence versus dependence2. Mean and standard deviation or sums and di erences o independent
random variablesC. The normal distribution
1. Properties o the normal distribution2. Using tables o the normal distribution3. The normal distribution as a model or measurements
D. Sampling distributions1. Sampling distribution o a sample proportion2. Sampling distribution o a sample mean
3. Central Limit Theorem4. Sampling distribution o a di erence between two independent sample proportions
5. Sampling distribution o a di erence between two independent sample means
6. Simulation o sampling distributions7. t-distribution8. Chi-square distribution
IV. Statistical In erence: Estimating population parameters and testinghypotheses (30%–40%)
Statistical inference guides the selection of appropriate models.
A. Estimation (point estimators and con dence intervals)1. Estimating population parameters and margins o error 2. Properties o point estimators, including unbiasedness and variability 3. Logic o con dence intervals, meaning o con dence level and con dence
intervals, and properties o con dence intervals4. Large sample con dence interval or a proportion5. Large sample con dence interval or a di erence between two proportions
8/8/2019 Ap08 Statistics Coursedesc
http://slidepdf.com/reader/full/ap08-statistics-coursedesc 17/45
© 2008 T e C ege B ar . A r g ts reserve . V s t t e C ege B ar t e Web: www.c egeb ar .c .
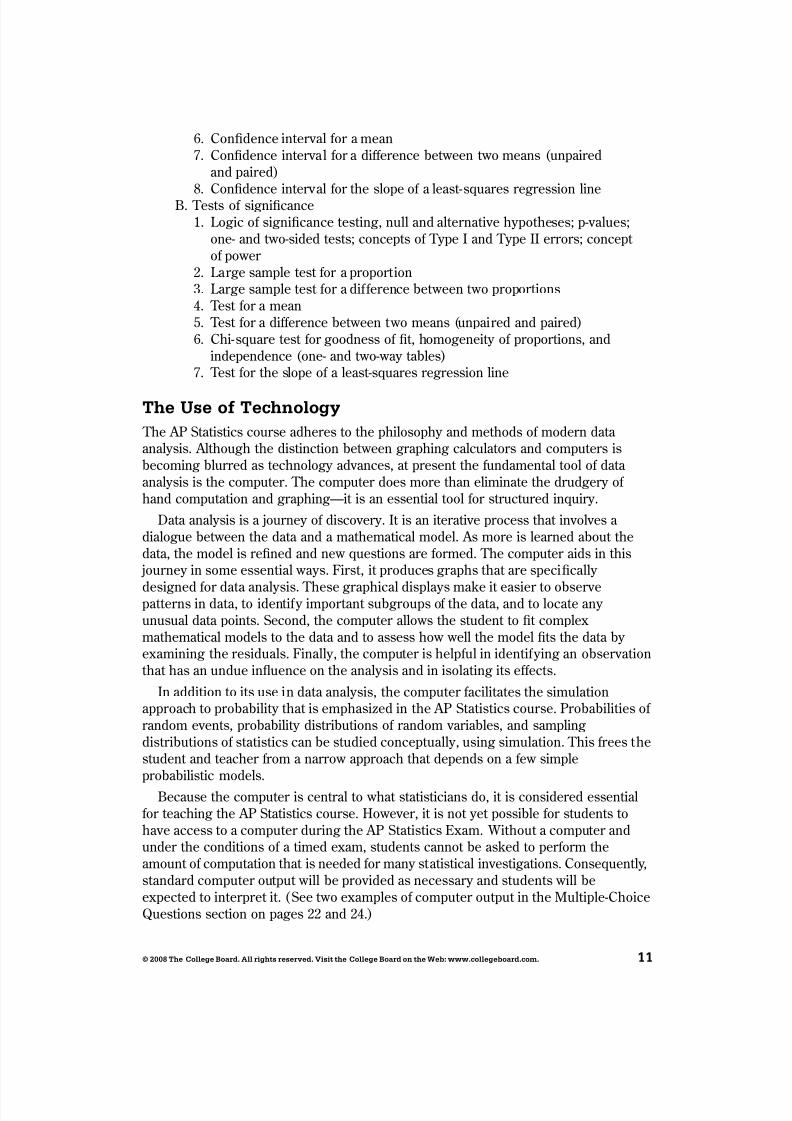
6. Con dence interval or a mean7. Con dence interval or a di erence between two means (unpaired
and paired)8. Con dence interval or the slope o a least-squares regression line
B. Tests o signi cance1. Logic o signi cance testing, null and alternative hypotheses; p-values;
one- and two-sided tests; concepts o Type I and Type II errors; concept o power
2. Large sample test or a proportion3. Large sample test or a di erence between two proportions4. Test or a mean5. Test or a di erence between two means (unpaired and paired)6. Chi-square test or goodness o t, homogeneity o proportions, and
independence (one- and two-way tables)7. Test or the slope o a least-squares regression line
T e use f Tec gy The AP Statistics course adheres to the philosophy and methods o modern data analysis. Although the distinction between graphing calculators and computers isbecoming blurred as technology advances, at present the undamental tool o data analysis is the computer. The computer does more than eliminate the drudgery o hand computation and graphing—it is an essential tool or structured inquiry.
Data analysis is a journey o discovery. It is an iterative process that involves a dialogue between the data and a mathematical model. As more is learned about thedata, the model is re ned and new questions are ormed. The computer aids in this journey in some essential ways. First, it produces graphs that are speci cally
designed or data analysis. These graphical displays make it easier to observepatterns in data, to identi y important subgroups o the data, and to locate any unusual data points. Second, the computer allows the student to t complexmathematical models to the data and to assess how well the model ts the data by examining the residuals. Finally, the computer is help ul in identi ying an observationthat has an undue infuence on the analysis and in isolating its e ects.
In addition to its use in data analysis, the computer acilitates the simulationapproach to probability that is emphasized in the AP Statistics course. Probabilities o random events, probability distributions o random variables, and samplingdistributions o statistics can be studied conceptually, using simulation. This rees thestudent and teacher rom a narrow approach that depends on a ew simpleprobabilistic models.
Because the computer is central to what statisticians do, it is considered essentialor teaching the AP Statistics course. However, it is not yet possible or students to
have access to a computer during the AP Statistics Exam. Without a computer andunder the conditions o a timed exam, students cannot be asked to per orm theamount o computation that is needed or many statistical investigations. Consequently,standard computer output will be provided as necessary and students will beexpected to interpret it. (See two examples o computer output in the Multiple-ChoiceQuestions section on pages 22 and 24.)
8/8/2019 Ap08 Statistics Coursedesc
http://slidepdf.com/reader/full/ap08-statistics-coursedesc 18/45
2 © 2008 T e C ege B ar . A r g ts reserve . V s t t e C ege B ar t e Web: www.c egeb ar .c .
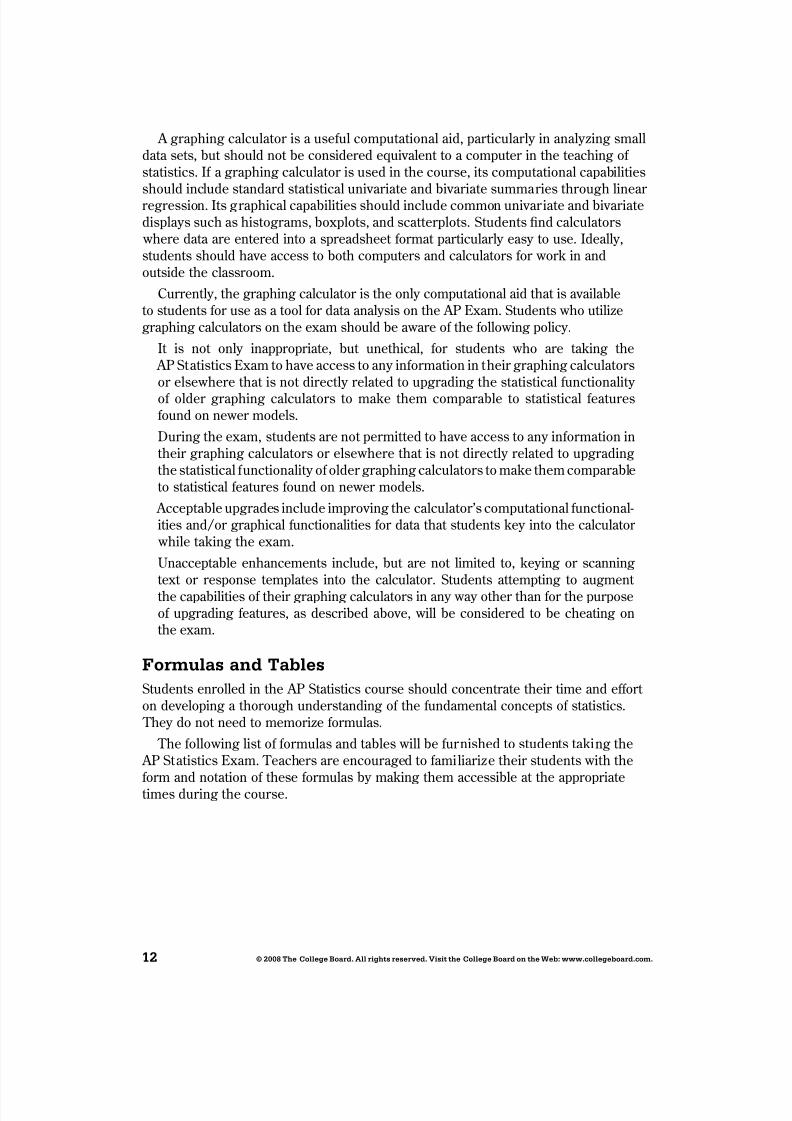
A graphing calculator is a use ul computational aid, particularly in analyzing smalldata sets, but should not be considered equivalent to a computer in the teaching o statistics. I a graphing calculator is used in the course, its computational capabilitiesshould include standard statistical univariate and bivariate summaries through linear regression. Its graphical capabilities should include common univariate and bivariatedisplays such as histograms, boxplots, and scatterplots. Students nd calculators where data are entered into a spreadsheet ormat particularly easy to use. Ideally,students should have access to both computers and calculators or work in andoutside the classroom.
Currently, the graphing calculator is the only computational aid that is availableto students or use as a tool or data analysis on the AP Exam. Students who utilizegraphing calculators on the exam should be aware o the ollowing policy.
It is not only inappropriate, but unethical, or students who are taking the AP Statistics Exam to have access to any in ormation in their graphing calculatorsor elsewhere that is not directly related to upgrading the statistical unctionality o older graphing calculators to make them comparable to statistical eatures
ound on newer models.During the exam, students are not permitted to have access to any in ormation intheir graphing calculators or elsewhere that is not directly related to upgradingthe statistical unctionality o older graphing calculators to make them comparableto statistical eatures ound on newer models. Acceptable upgrades include improving the calculator’s computational unctional-ities and/or graphical unctionalities or data that students key into the calculator while taking the exam.Unacceptable enhancements include, but are not limited to, keying or scanningtext or response templates into the calculator. Students attempting to augment the capabilities o their graphing calculators in any way other than or the purposeo upgrading eatures, as described above, will be considered to be cheating onthe exam.
F r as a Tab esStudents enrolled in the AP Statistics course should concentrate their time and e ort on developing a thorough understanding o the undamental concepts o statistics. They do not need to memorize ormulas.
The ollowing list o ormulas and tables will be urnished to students taking the AP Statistics Exam. Teachers are encouraged to amiliarize their students with the
orm and notation o these ormulas by making them accessible at the appropriatetimes during the course.
8/8/2019 Ap08 Statistics Coursedesc
http://slidepdf.com/reader/full/ap08-statistics-coursedesc 19/45
© 2008 T e C ege B ar . A r g ts reserve . V s t t e C ege B ar t e Web: www.c egeb ar .c .
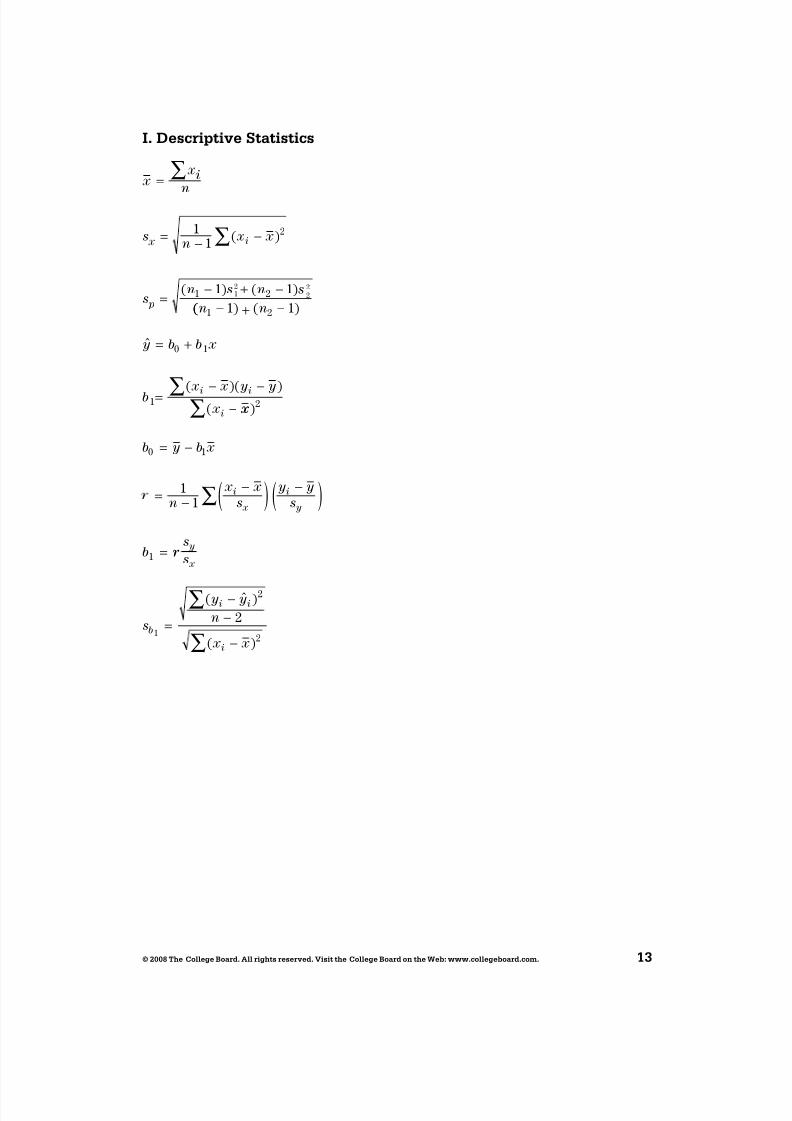
I. descr pt ve Stat st cs
x x i
n
s n x x
s n s n s
x
p
i
=
= − −
=− + −
∑
∑11
1 1
2
1 212
22
( )
( ) ( )(( ) ( )
ˆ
( ) ( )(
n n
y b b x
b x x y y x
i i
i
1 2
0 1
1
1 1− + −
= +
=− −
−∑ x x
b y b x
n x x
sy y
s
b
i
x
i
y
)2
0 1
1
11
∑
∑
= −
= −−( ) −
= r r ss
s
y y n
x x
y
x
b
i i
i
1
2
2
2=
−−
−
∑
∑
( ˆ )
( )
( )
8/8/2019 Ap08 Statistics Coursedesc
http://slidepdf.com/reader/full/ap08-statistics-coursedesc 20/45
© 2008 T e C ege B ar . A r g ts reserve . V s t t e C ege B ar t e Web: www.c egeb ar .c .
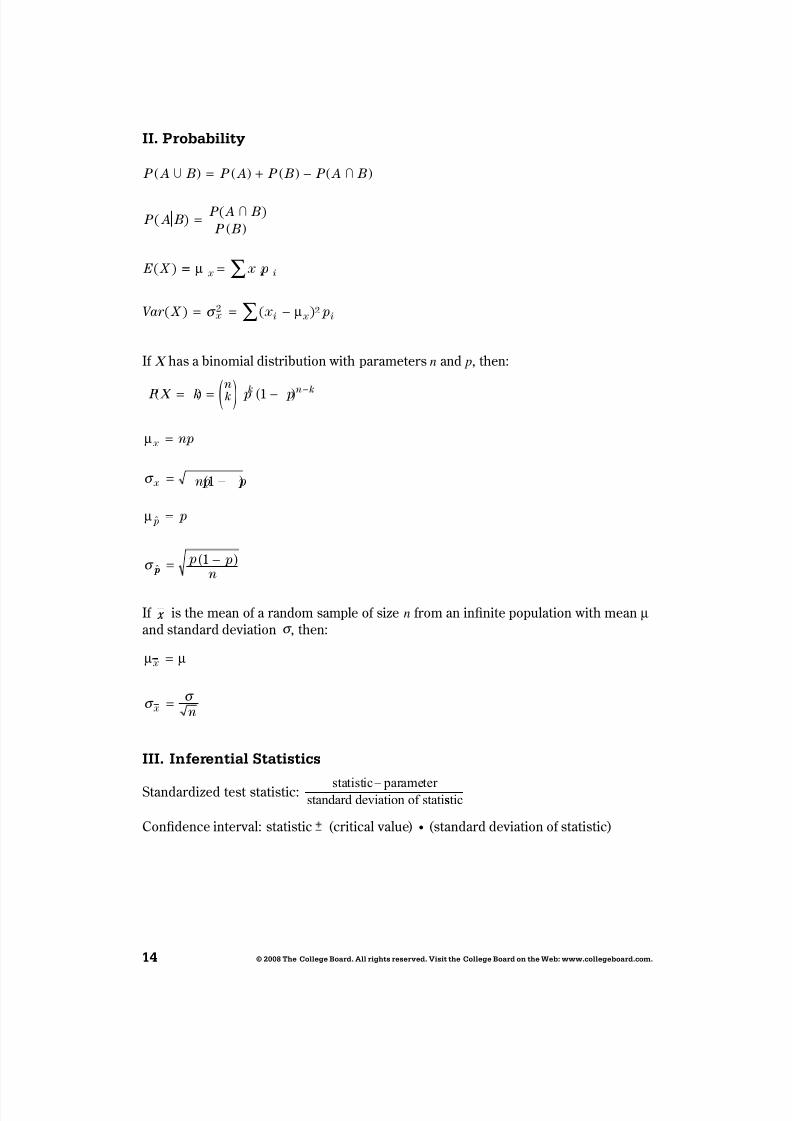
II. Pr bab ty
P A B P A P B P A B
P A BP A B P B
E X
U I
I
( ) = ( ) + ( ) − ( )
=( )
( )( )
( ) == =
= = −
∑
∑
µ
µ
x i i
x i x i
x p
Var X x p( ) ( )σ 2 2
I C has a binomial distribution with parameters n and p , then:
P k p p
np
np p
p
k n
k n k
x
p
C =( ) = ( ) -( )
=
= -( )
=
-1
1
μ
μ
x
σ
σ
ˆ
ˆ p p p p
n= -( )1
I x is the mean o a random sample o size n rom an in nite population with mean μ and standard deviation σ , then:
μ μ x
x n
=
=σ σ
III. I fere t a Stat st cs
Standardized test statistic: statistic – parameter standard deviation of statis stic
Con dence interval: statistic (critical value) • (standard deviation o statistic)
8/8/2019 Ap08 Statistics Coursedesc
http://slidepdf.com/reader/full/ap08-statistics-coursedesc 21/45
© 2008 T e C ege B ar . A r g ts reserve . V s t t e C ege B ar t e Web: www.c egeb ar .c .
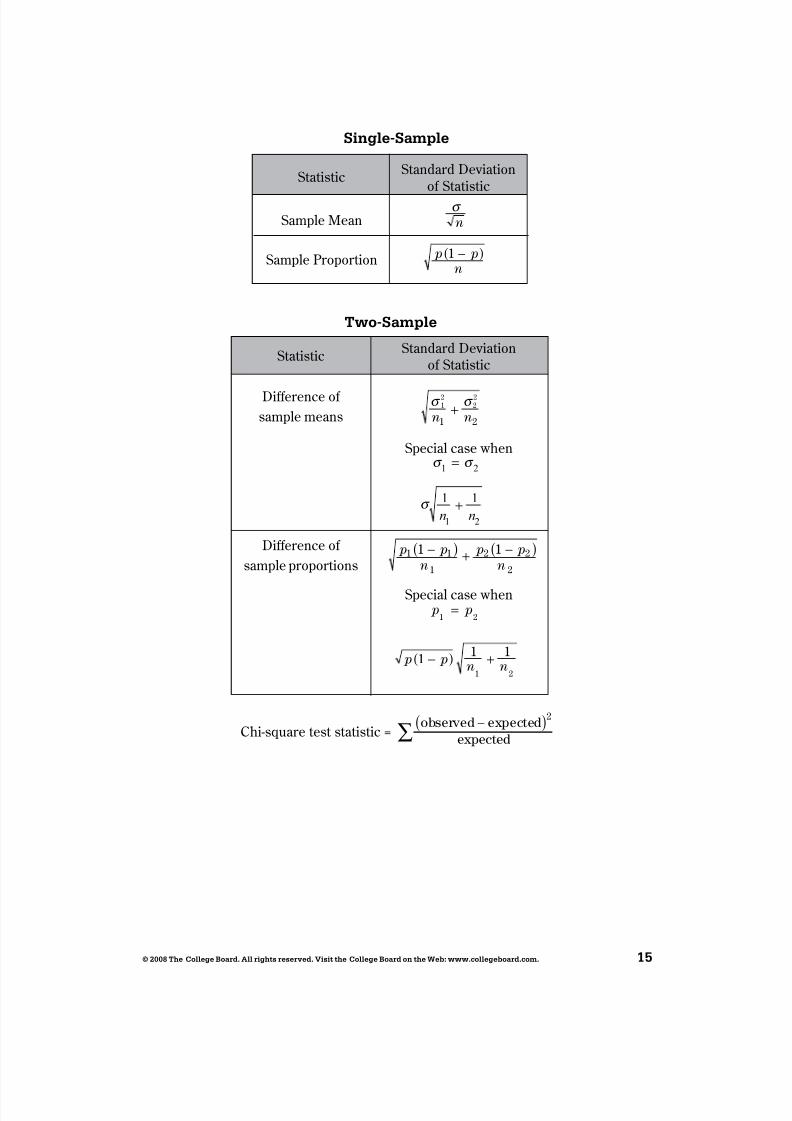
S g e-Sa p e
Tw -Sa p e
Statistic Standard Deviationo Statistic
Di erence o sample means
Special case when
Di erence o sample proportions
Special case when
Statistic Standard Deviationo Statistic
Sample Mean
Sample Proportion
σ n
p p n
1 -( )
σ σ 12
22
1 2 n n+
σ σ
σ
1 2
1 2
1 1
=
+n n
p p n
p p n
1 1
1
2 2
2
1 1-( ) + -( )
p p
p p n n
1 2
1 2
1 1 1
=
-( ) +
Chi-square test statistic =ob d – x d
x d
2( )∑
8/8/2019 Ap08 Statistics Coursedesc
http://slidepdf.com/reader/full/ap08-statistics-coursedesc 22/45
© 2008 T e C ege B ar . A r g ts reserve . V s t t e C ege B ar t e Web: www.c egeb ar .c .
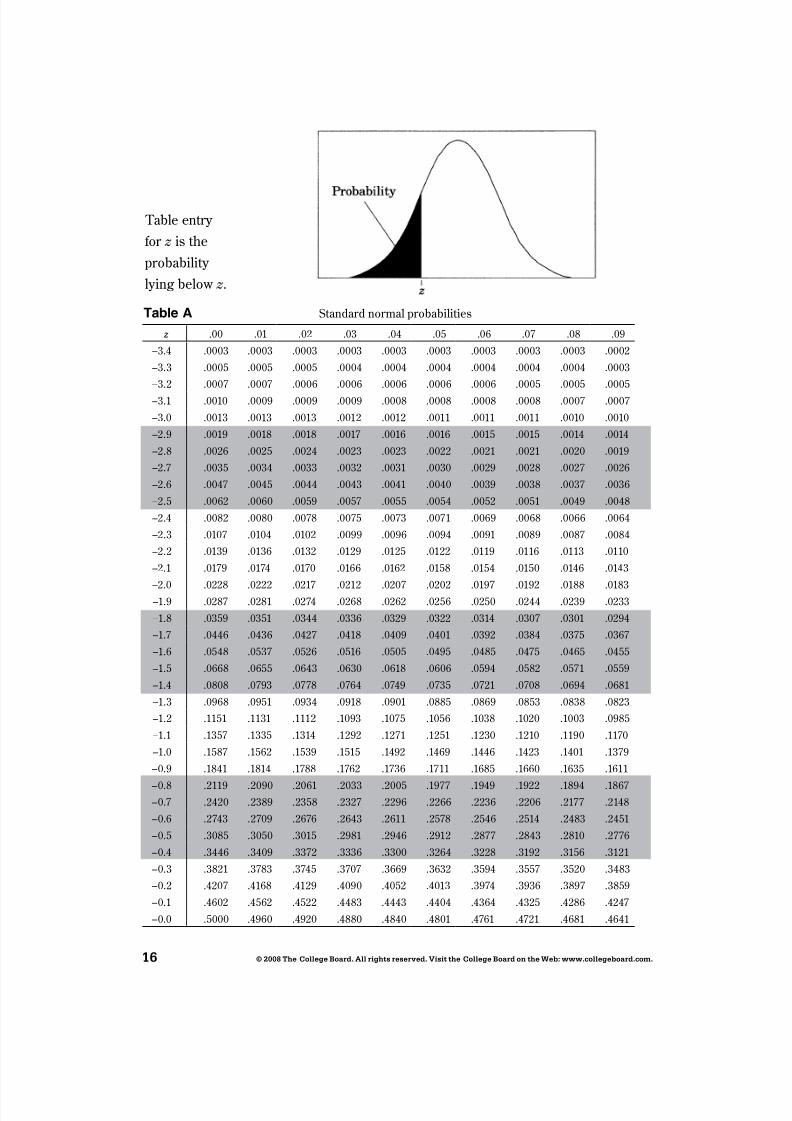
Table entry or z is the
probability lying below z.
Table A Standard normal probabilities
z .00 .01 .02 .03 .04 .05 .06 .07 .08 .09–3.4 .0003 .0003 .0003 .0003 .0003 .0003 .0003 .0003 .0003 .0002–3.3 .0005 .0005 .0005 .0004 .0004 .0004 .0004 .0004 .0004 .0003–3.2 .0007 .0007 .0006 .0006 .0006 .0006 .0006 .0005 .0005 .0005–3.1 .0010 .0009 .0009 .0009 .0008 .0008 .0008 .0008 .0007 .0007–3.0 .0013 .0013 .0013 .0012 .0012 .0011 .0011 .0011 .0010 .0010–2.9 .0019 .0018 .0018 .0017 .0016 .0016 .0015 .0015 .0014 .0014–2.8 .0026 .0025 .0024 .0023 .0023 .0022 .0021 .0021 .0020 .0019–2.7 .0035 .0034 .0033 .0032 .0031 .0030 .0029 .0028 .0027 .0026–2.6 .0047 .0045 .0044 .0043 .0041 .0040 .0039 .0038 .0037 .0036–2.5 .0062 .0060 .0059 .0057 .0055 .0054 .0052 .0051 .0049 .0048–2.4 .0082 .0080 .0078 .0075 .0073 .0071 .0069 .0068 .0066 .0064–2.3 .0107 .0104 .0102 .0099 .0096 .0094 .0091 .0089 .0087 .0084–2.2 .0139 .0136 .0132 .0129 .0125 .0122 .0119 .0116 .0113 .0110–2.1 .0179 .0174 .0170 .0166 .0162 .0158 .0154 .0150 .0146 .0143
–2.0 .0228 .0222 .0217 .0212 .0207 .0202 .0197 .0192 .0188 .0183–1.9 .0287 .0281 .0274 .0268 .0262 .0256 .0250 .0244 .0239 .0233–1.8 .0359 .0351 .0344 .0336 .0329 .0322 .0314 .0307 .0301 .0294–1.7 .0446 .0436 .0427 .0418 .0409 .0401 .0392 .0384 .0375 .0367–1.6 .0548 .0537 .0526 .0516 .0505 .0495 .0485 .0475 .0465 .0455–1.5 .0668 .0655 .0643 .0630 .0618 .0606 .0594 .0582 .0571 .0559–1.4 .0808 .0793 .0778 .0764 .0749 .0735 .0721 .0708 .0694 .0681–1.3 .0968 .0951 .0934 .0918 .0901 .0885 .0869 .0853 .0838 .0823–1.2 .1151 .1131 .1112 .1093 .1075 .1056 .1038 .1020 .1003 .0985–1.1 .1357 .1335 .1314 .1292 .1271 .1251 .1230 .1210 .1190 .1170–1.0 .1587 .1562 .1539 .1515 .1492 .1469 .1446 .1423 .1401 .1379–0.9 .1841 .1814 .1788 .1762 .1736 .1711 .1685 .1660 .1635 .1611
–0.8 .2119 .2090 .2061 .2033 .2005 .1977 .1949 .1922 .1894 .1867–0.7 .2420 .2389 .2358 .2327 .2296 .2266 .2236 .2206 .2177 .2148–0.6 .2743 .2709 .2676 .2643 .2611 .2578 .2546 .2514 .2483 .2451–0.5 .3085 .3050 .3015 .2981 .2946 .2912 .2877 .2843 .2810 .2776–0.4 .3446 .3409 .3372 .3336 .3300 .3264 .3228 .3192 .3156 .3121–0.3 .3821 .3783 .3745 .3707 .3669 .3632 .3594 .3557 .3520 .3483–0.2 .4207 .4168 .4129 .4090 .4052 .4013 .3974 .3936 .3897 .3859–0.1 .4602 .4562 .4522 .4483 .4443 .4404 .4364 .4325 .4286 .4247–0.0 .5000 .4960 .4920 .4880 .4840 .4801 .4761 .4721 .4681 .4641
8/8/2019 Ap08 Statistics Coursedesc
http://slidepdf.com/reader/full/ap08-statistics-coursedesc 23/45
© 2008 T e C ege B ar . A r g ts reserve . V s t t e C ege B ar t e Web: www.c egeb ar .c .
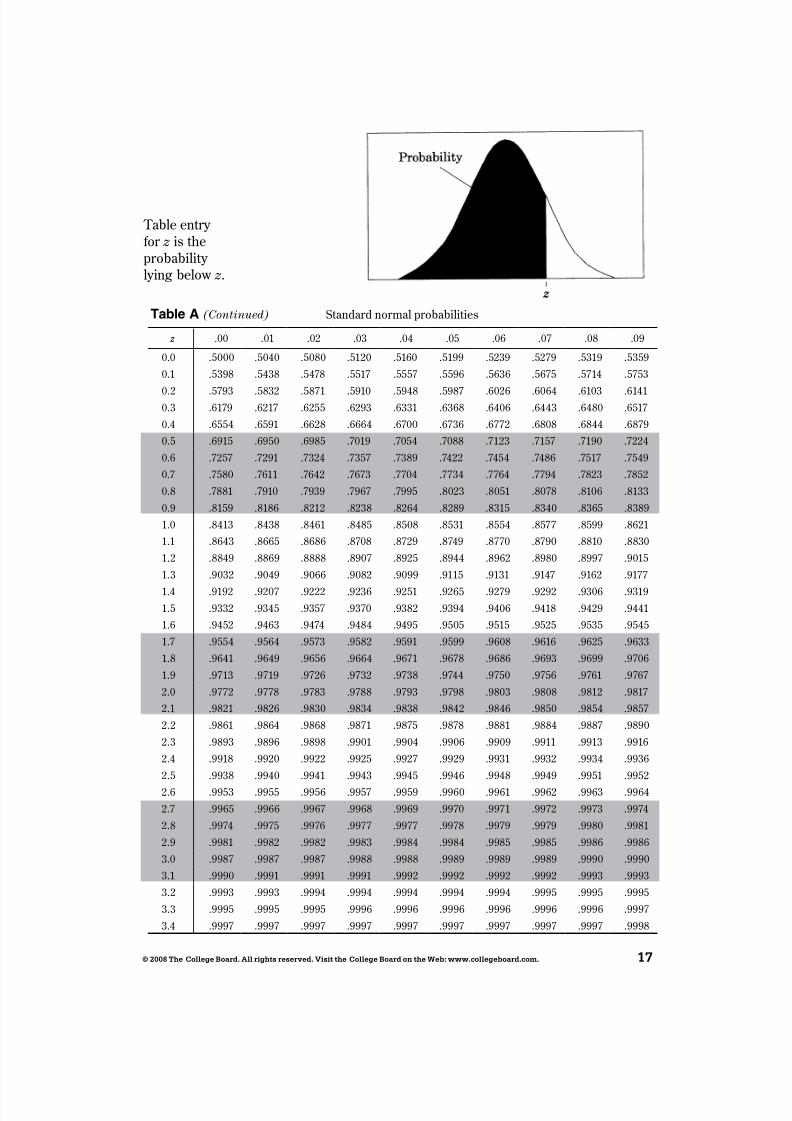
Table A (Continued) Standard normal probabilities
z .00 .01 .02 .03 .04 .05 .06 .07 .08 .09
0.0 .5000 .5040 .5080 .5120 .5160 .5199 .5239 .5279 .5319 .53590.1 .5398 .5438 .5478 .5517 .5557 .5596 .5636 .5675 .5714 .5753
0.2 .5793 .5832 .5871 .5910 .5948 .5987 .6026 .6064 .6103 .61410.3 .6179 .6217 .6255 .6293 .6331 .6368 .6406 .6443 .6480 .65170.4 .6554 .6591 .6628 .6664 .6700 .6736 .6772 .6808 .6844 .68790.5 .6915 .6950 .6985 .7019 .7054 .7088 .7123 .7157 .7190 .72240.6 .7257 .7291 .7324 .7357 .7389 .7422 .7454 .7486 .7517 .75490.7 .7580 .7611 .7642 .7673 .7704 .7734 .7764 .7794 .7823 .78520.8 .7881 .7910 .7939 .7967 .7995 .8023 .8051 .8078 .8106 .81330.9 .8159 .8186 .8212 .8238 .8264 .8289 .8315 .8340 .8365 .83891.0 .8413 .8438 .8461 .8485 .8508 .8531 .8554 .8577 .8599 .86211.1 .8643 .8665 .8686 .8708 .8729 .8749 .8770 .8790 .8810 .88301.2 .8849 .8869 .8888 .8907 .8925 .8944 .8962 .8980 .8997 .90151.3 .9032 .9049 .9066 .9082 .9099 .9115 .9131 .9147 .9162 .9177
1.4 .9192 .9207 .9222 .9236 .9251 .9265 .9279 .9292 .9306 .93191.5 .9332 .9345 .9357 .9370 .9382 .9394 .9406 .9418 .9429 .94411.6 .9452 .9463 .9474 .9484 .9495 .9505 .9515 .9525 .9535 .95451.7 .9554 .9564 .9573 .9582 .9591 .9599 .9608 .9616 .9625 .96331.8 .9641 .9649 .9656 .9664 .9671 .9678 .9686 .9693 .9699 .97061.9 .9713 .9719 .9726 .9732 .9738 .9744 .9750 .9756 .9761 .97672.0 .9772 .9778 .9783 .9788 .9793 .9798 .9803 .9808 .9812 .98172.1 .9821 .9826 .9830 .9834 .9838 .9842 .9846 .9850 .9854 .98572.2 .9861 .9864 .9868 .9871 .9875 .9878 .9881 .9884 .9887 .98902.3 .9893 .9896 .9898 .9901 .9904 .9906 .9909 .9911 .9913 .99162.4 .9918 .9920 .9922 .9925 .9927 .9929 .9931 .9932 .9934 .99362.5 .9938 .9940 .9941 .9943 .9945 .9946 .9948 .9949 .9951 .99522.6 .9953 .9955 .9956 .9957 .9959 .9960 .9961 .9962 .9963 .99642.7 .9965 .9966 .9967 .9968 .9969 .9970 .9971 .9972 .9973 .99742.8 .9974 .9975 .9976 .9977 .9977 .9978 .9979 .9979 .9980 .99812.9 .9981 .9982 .9982 .9983 .9984 .9984 .9985 .9985 .9986 .99863.0 .9987 .9987 .9987 .9988 .9988 .9989 .9989 .9989 .9990 .99903.1 .9990 .9991 .9991 .9991 .9992 .9992 .9992 .9992 .9993 .99933.2 .9993 .9993 .9994 .9994 .9994 .9994 .9994 .9995 .9995 .99953.3 .9995 .9995 .9995 .9996 .9996 .9996 .9996 .9996 .9996 .99973.4 .9997 .9997 .9997 .9997 .9997 .9997 .9997 .9997 .9997 .9998
Table entry or z is the
probability lying below z.
8/8/2019 Ap08 Statistics Coursedesc
http://slidepdf.com/reader/full/ap08-statistics-coursedesc 24/45
8 © 2008 T e C ege B ar . A r g ts reserve . V s t t e C ege B ar t e Web: www.c egeb ar .c .
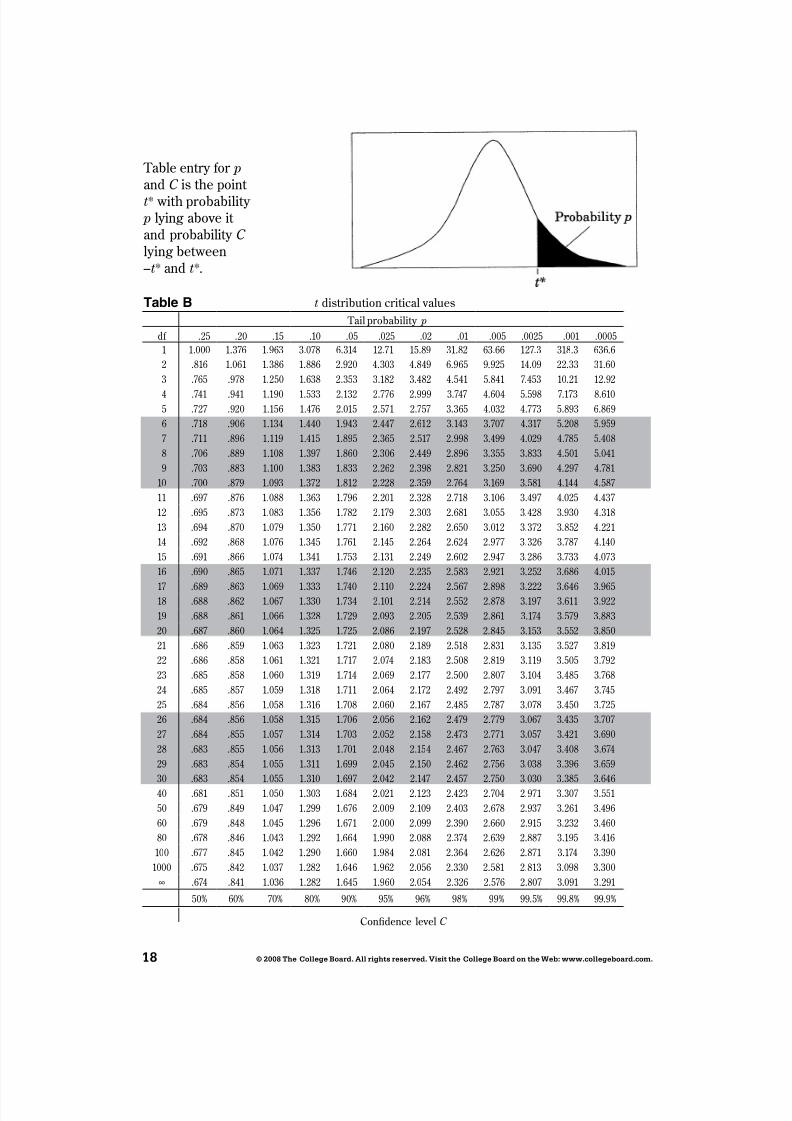
Table entry or p and C is the point t* with probability p lying above it and probability C lying between–t* and t *.
Table B t distribution critical values Tail probability p
df .25 .20 .15 .10 .05 .025 .02 .01 .005 .0025 .001 .0005
1 1.000 1.376 1.963 3.078 6.314 12.71 15.89 31.82 63.66 127.3 318.3 636.6
2 .816 1.061 1.386 1.886 2.920 4.303 4.849 6.965 9.925 14.09 22.33 31.60
3 .765 .978 1.250 1.638 2.353 3.182 3.482 4.541 5.841 7.453 10.21 12.92
4 .741 .941 1.190 1.533 2.132 2.776 2.999 3.747 4.604 5.598 7.173 8.6105 .727 .920 1.156 1.476 2.015 2.571 2.757 3.365 4.032 4.773 5.893 6.869
6 .718 .906 1.134 1.440 1.943 2.447 2.612 3.143 3.707 4.317 5.208 5.959
7 .711 .896 1.119 1.415 1.895 2.365 2.517 2.998 3.499 4.029 4.785 5.408
8 .706 .889 1.108 1.397 1.860 2.306 2.449 2.896 3.355 3.833 4.501 5.041
9 .703 .883 1.100 1.383 1.833 2.262 2.398 2.821 3.250 3.690 4.297 4.781
10 .700 .879 1.093 1.372 1.812 2.228 2.359 2.764 3.169 3.581 4.144 4.587
11 .697 .876 1.088 1.363 1.796 2.201 2.328 2.718 3.106 3.497 4.025 4.437
12 .695 .873 1.083 1.356 1.782 2.179 2.303 2.681 3.055 3.428 3.930 4.318
13 .694 .870 1.079 1.350 1.771 2.160 2.282 2.650 3.012 3.372 3.852 4.221
14 .692 .868 1.076 1.345 1.761 2.145 2.264 2.624 2.977 3.326 3.787 4.140
15 .691 .866 1.074 1.341 1.753 2.131 2.249 2.602 2.947 3.286 3.733 4.073
16 .690 .865 1.071 1.337 1.746 2.120 2.235 2.583 2.921 3.252 3.686 4.015
17 .689 .863 1.069 1.333 1.740 2.110 2.224 2.567 2.898 3.222 3.646 3.96518 .688 .862 1.067 1.330 1.734 2.101 2.214 2.552 2.878 3.197 3.611 3.922
19 .688 .861 1.066 1.328 1.729 2.093 2.205 2.539 2.861 3.174 3.579 3.883
20 .687 .860 1.064 1.325 1.725 2.086 2.197 2.528 2.845 3.153 3.552 3.850
21 .686 .859 1.063 1.323 1.721 2.080 2.189 2.518 2.831 3.135 3.527 3.819
22 .686 .858 1.061 1.321 1.717 2.074 2.183 2.508 2.819 3.119 3.505 3.792
23 .685 .858 1.060 1.319 1.714 2.069 2.177 2.500 2.807 3.104 3.485 3.768
24 .685 .857 1.059 1.318 1.711 2.064 2.172 2.492 2.797 3.091 3.467 3.745
25 .684 .856 1.058 1.316 1.708 2.060 2.167 2.485 2.787 3.078 3.450 3.725
26 .684 .856 1.058 1.315 1.706 2.056 2.162 2.479 2.779 3.067 3.435 3.707
27 .684 .855 1.057 1.314 1.703 2.052 2.158 2.473 2.771 3.057 3.421 3.690
28 .683 .855 1.056 1.313 1.701 2.048 2.154 2.467 2.763 3.047 3.408 3.674
29 .683 .854 1.055 1.311 1.699 2.045 2.150 2.462 2.756 3.038 3.396 3.659
30 .683 .854 1.055 1.310 1.697 2.042 2.147 2.457 2.750 3.030 3.385 3.646
40 .681 .851 1.050 1.303 1.684 2.021 2.123 2.423 2.704 2.971 3.307 3.551
50 .679 .849 1.047 1.299 1.676 2.009 2.109 2.403 2.678 2.937 3.261 3.496
60 .679 .848 1.045 1.296 1.671 2.000 2.099 2.390 2.660 2.915 3.232 3.460
80 .678 .846 1.043 1.292 1.664 1.990 2.088 2.374 2.639 2.887 3.195 3.416
100 .677 .845 1.042 1.290 1.660 1.984 2.081 2.364 2.626 2.871 3.174 3.390
1000 .675 .842 1.037 1.282 1.646 1.962 2.056 2.330 2.581 2.813 3.098 3.300
∞ .674 .841 1.036 1.282 1.645 1.960 2.054 2.326 2.576 2.807 3.091 3.291
50% 60% 70% 80% 90% 95% 96% 98% 99% 99.5% 99.8% 99.9%
Con dence level C
8/8/2019 Ap08 Statistics Coursedesc
http://slidepdf.com/reader/full/ap08-statistics-coursedesc 25/45
© 2008 T e C ege B ar . A r g ts reserve . V s t t e C ege B ar t e Web: www.c egeb ar .c .
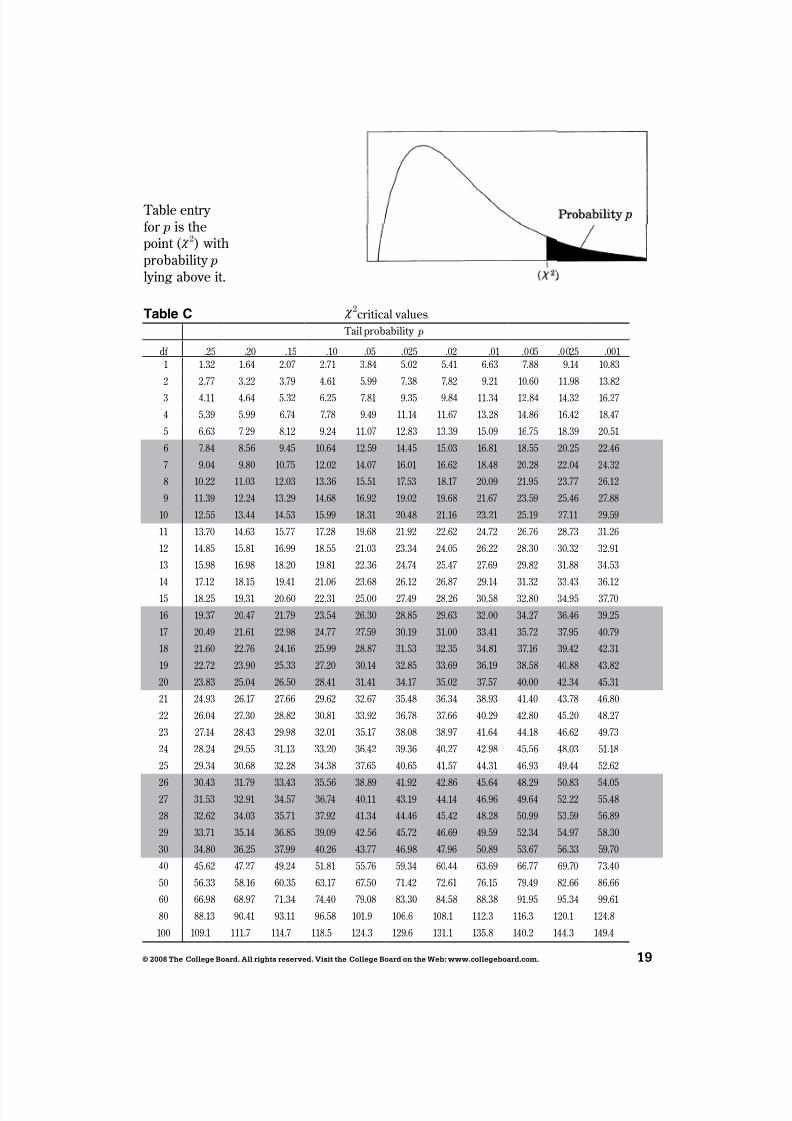
Table C χ 2critical values Tail probability p
df .25 .20 .15 .10 .05 .025 .02 .01 .0 05 .0 025 .001
1 1.32 1.64 2.07 2.71 3.84 5.02 5.41 6.63 7.88 9.14 10.83
2 2.77 3.22 3.79 4.61 5.99 7.38 7.82 9.21 10.60 11.98 13.82
3 4.11 4.64 5.32 6.25 7.81 9.35 9.84 11.34 12.84 14.32 16.27
4 5.39 5.99 6.74 7.78 9.49 11.14 11.67 13.28 14.86 16.42 18.47
5 6.63 7.29 8.12 9.24 11.07 12.83 13.39 15.09 16.75 18.39 20.51
6 7.84 8.56 9.45 10.64 12.59 14.45 15.03 16.81 18.55 20.25 22.46
7 9.04 9.80 10.75 12.02 14.07 16.01 16.62 18.48 20.28 22.04 24.32
8 10.22 11.03 12.03 13.36 15.51 17.53 18.17 20.09 21.95 23.77 26.12
9 11.39 12.24 13.29 14.68 16.92 19.02 19.68 21.67 23.59 25.46 27.88
10 12.55 13.44 14.53 15.99 18.31 20.48 21.16 23.21 25.19 27.11 29.59
11 13.70 14.63 15.77 17.28 19.68 21.92 22.62 24.72 26.76 28.73 31.26
12 14.85 15.81 16.99 18.55 21.03 23.34 24.05 26.22 28.30 30.32 32.91
13 15.98 16.98 18.20 19.81 22.36 24.74 25.47 27.69 29.82 31.88 34.53
14 17.12 18.15 19.41 21.06 23.68 26.12 26.87 29.14 31.32 33.43 36.12
15 18.25 19.31 20.60 22.31 25.00 27.49 28.26 30.58 32.80 34.95 37.70
16 19.37 20.47 21.79 23.54 26.30 28.85 29.63 32.00 34.27 36.46 39.25
17 20.49 21.61 22.98 24.77 27.59 30.19 31.00 33.41 35.72 37.95 40.79
18 21.60 22.76 24.16 25.99 28.87 31.53 32.35 34.81 37.16 39.42 42.31
19 22.72 23.90 25.33 27.20 30.14 32.85 33.69 36.19 38.58 40.88 43.82
20 23.83 25.04 26.50 28.41 31.41 34.17 35.02 37.57 40.00 42.34 45.31
21 24.93 26.17 27.66 29.62 32.67 35.48 36.34 38.93 41.40 43.78 46.80
22 26.04 27.30 28.82 30.81 33.92 36.78 37.66 40.29 42.80 45.20 48.27
23 27.14 28.43 29.98 32.01 35.17 38.08 38.97 41.64 44.18 46.62 49.73
24 28.24 29.55 31.13 33.20 36.42 39.36 40.27 42.98 45.56 48.03 51.18
25 29.34 30.68 32.28 34.38 37.65 40.65 41.57 44.31 46.93 49.44 52.62
26 30.43 31.79 33.43 35.56 38.89 41.92 42.86 45.64 48.29 50.83 54.0527 31.53 32.91 34.57 36.74 40.11 43.19 44.14 46.96 49.64 52.22 55.48
28 32.62 34.03 35.71 37.92 41.34 44.46 45.42 48.28 50.99 53.59 56.89
29 33.71 35.14 36.85 39.09 42.56 45.72 46.69 49.59 52.34 54.97 58.30
30 34.80 36.25 37.99 40.26 43.77 46.98 47.96 50.89 53.67 56.33 59.70
40 45.62 47.27 49.24 51.81 55.76 59.34 60.44 63.69 66.77 69.70 73.40
50 56.33 58.16 60.35 63.17 67.50 71.42 72.61 76.15 79.49 82.66 86.66
60 66.98 68.97 71.34 74.40 79.08 83.30 84.58 88.38 91.95 95.34 99.61
80 88.13 90.41 93.11 96.58 101.9 106.6 108.1 112.3 116.3 120.1 124.8
100 109.1 111.7 114.7 118.5 124.3 129.6 131.1 135.8 140.2 144.3 149.4
Table entry or p is the
point ( χ 2 ) withprobability p lying above it.
8/8/2019 Ap08 Statistics Coursedesc
http://slidepdf.com/reader/full/ap08-statistics-coursedesc 26/45
20
Sample Questions for Stat st cs
© 2008 T e C ege B ar . A r g ts reserve . V s t t e C ege B ar t e Web: www.c egeb ar .c .
T h E E x A m The AP Statistics Exam is three hours long and seeks to determine how well a student has mastered the concepts and techniques o the subject matter o the course.
This paper-and-pencil exam consists o (1) a 90 -minute multiple-choice section testingpro ciency in a wide variety o topics, and (2) a 90-minute ree-response sectionrequiring the student to answer open-ended questions and to complete aninvestigative task involving more extended reasoning. In the determination o thegrade or the exam, the two sections will be given equal weight.
Each student will be expected to bring a graphing calculator with statisticalcapabilities to the exam. The expected computational and graphic eatures or thesecalculators are described in an earlier section. Minicomputers, pocket organizers,electronic writing pads (e.g., Newton), and calculators with qwerty (i.e., typewriter)keyboards will not be allowed. Calculator memories will not be cleared. However,calculator memories may be used only or storing programs, not or storing notes.
During the exam, students are not permitted to have access to any in ormation intheir graphing calculators or elsewhere that is not directly related to upgrading thestatistical unctionality o older graphing calculators to make them comparable tostatistical eatures ound on newer models. Acceptable upgrades include improvingthe calculator’s computational unctionalities and/or graphical unctionalities or data that students key into the calculator while taking the exam. Unacceptableenhancements include, but are not limited to, keying or scanning text or responsetemplates into the calculator. Students attempting to augment the capabilities o their graphing calculators in any way other than or the purpose o upgrading eatures asdescribed above will be considered to be cheating on the exam. A student may bringup to two calculators to the exam.
m t p e-C ce Q est s The ollowing are examples o the kinds o multiple-choice questions ound on the AP Statistics Exam; the answers to these questions ollow question 18. Thedistribution o topics and the levels o di culty are illustrative o the composition o the exam; however, this group o questions does not constitute a complete exam, nor does it show the complete range o questions that appear in an exam.
Students o ten ask whether they should guess on the multiple-choice section.Haphazard or random guessing is unlikely to improve scores, because one- ourth o the number o questions answered incorrectly will be subtracted rom the number o questions answered correctly. However, students who have some knowledge o a question and can eliminate one or more answer choices will usually nd it advantageous to guess rom among the remaining choices.
8/8/2019 Ap08 Statistics Coursedesc
http://slidepdf.com/reader/full/ap08-statistics-coursedesc 27/45
2
Sample Questions for Stat st cs
© 2008 T e C ege B ar . A r g ts reserve . V s t t e C ege B ar t e Web: www.c egeb ar .c .
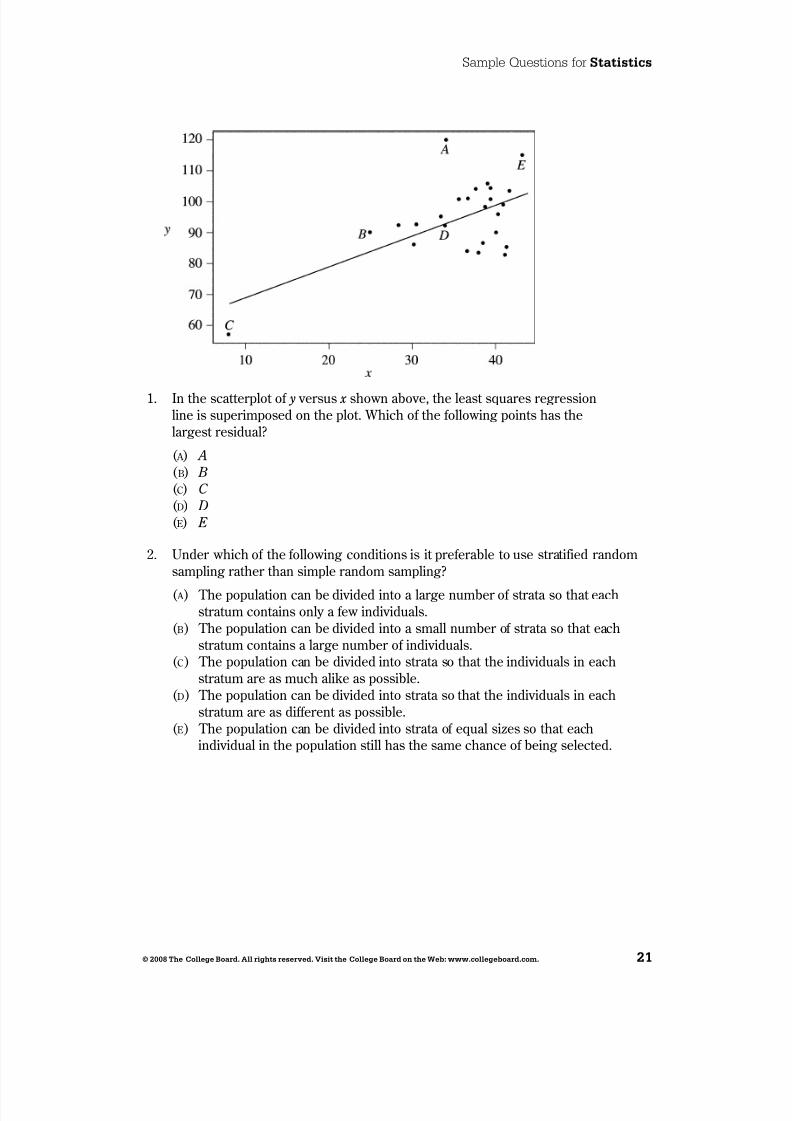
1. In the scatterplot o y versus x shown above, the least squares regressionline is superimposed on the plot. Which o the ollowing points has thelargest residual?
( a ) A( b ) B ( c ) C ( d ) D( e ) E
2. Under which o the ollowing conditions is it pre erable to use strati ied randomsampling rather than simple random sampling?
( a ) The population can be divided into a large number o strata so that eachstratum contains only a ew individuals.
( b ) The population can be divided into a small number o strata so that eachstratum contains a large number o individuals.
( c ) The population can be divided into strata so that the individuals in eachstratum are as much alike as possible.
( d ) The population can be divided into strata so that the individuals in eachstratum are as di erent as possible.
( e ) The population can be divided into strata o equal sizes so that eachindividual in the population still has the same chance o being selected.
8/8/2019 Ap08 Statistics Coursedesc
http://slidepdf.com/reader/full/ap08-statistics-coursedesc 28/45
22
Sample Questions for Stat st cs
© 2008 T e C ege B ar . A r g ts reserve . V s t t e C ege B ar t e Web: www.c egeb ar .c .
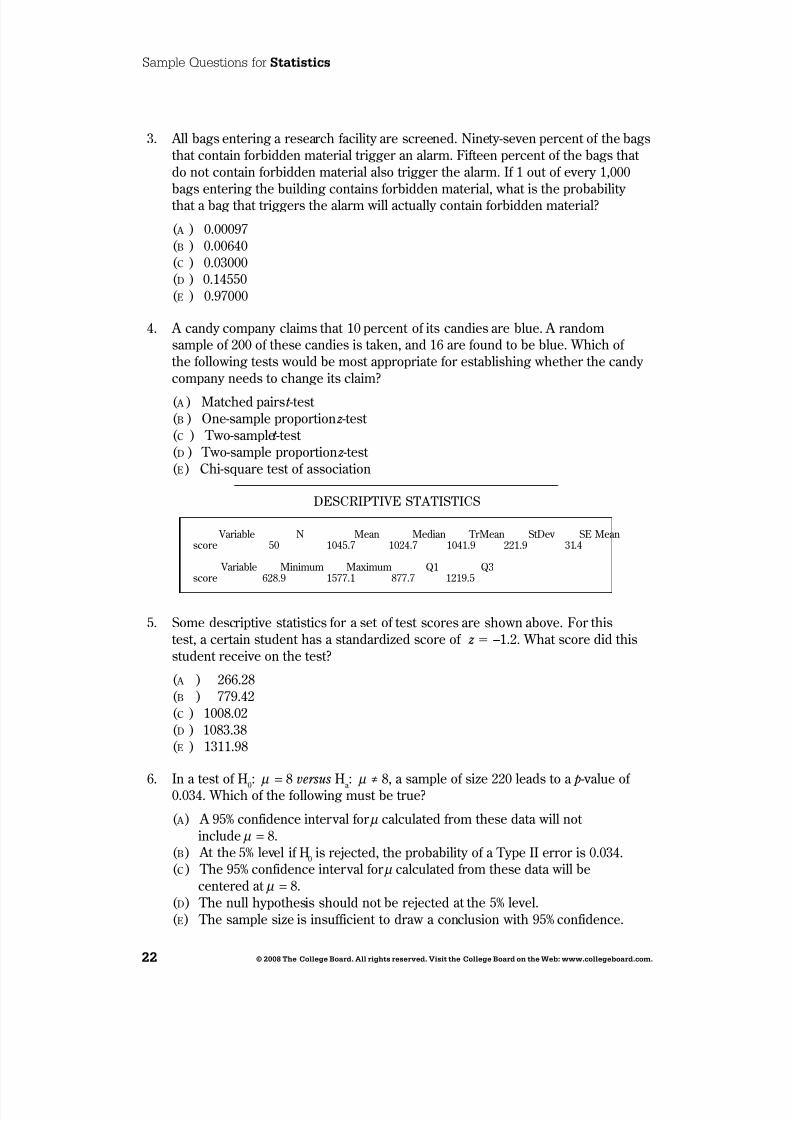
3. All bags entering a research acility are screened. Ninety-seven percent o the bagsthat contain orbidden material trigger an alarm. Fi teen percent o the bags that do not contain orbidden material also trigger the alarm. I 1 out o every 1,000bags entering the building contains orbidden material, what is the probability that a bag that triggers the alarm will actually contain orbidden material?
( a ) 0.00097( b ) 0.00640( c ) 0.03000( d ) 0.14550( e ) 0.97000
4. A candy company claims that 10 percent o its candies are blue. A randomsample o 200 o these candies is taken, and 16 are ound to be blue. Which o the ollowing tests would be most appropriate or establishing whether the candy company needs to change its claim?
( a ) Matched pairs t -test ( b ) One-sample proportion z -test ( c ) Two-samplet -test ( d ) Two-sample proportion z -test ( e ) Chi-square test o association
Descriptive statistics
Variable N Mean Median TrMean StDev SE Meanscore 50 1045.7 1024.7 1041.9 221.9 31.4
Variable Minimum Maximum Q1 Q3score 628.9 1577.1 877.7 1219.5
5. Some descriptive statistics or a set o test scores are shown above. For thistest, a certain student has a standardized score o z = –1.2. What score did thisstudent receive on the test?
( a ) 266.28( b ) 779.42( c ) 1008.02( d ) 1083.38( e ) 1311.98
6. In a test o H0: μ = 8 versus Ha : μ ≠ 8, a sample o size 220 leads to a p-value o 0.034. Which o the ollowing must be true?
( a ) A 95% con idence interval or μ calculated rom these data will not include μ = 8.
( b ) At the 5% level i H0 is rejected, the probability o a Type II error is 0.034.( c ) The 95% con idence interval or μ calculated rom these data will be
centered at μ = 8.( d ) The null hypothesis should not be rejected at the 5% level.( e ) The sample size is insu icient to draw a conclusion with 95% con idence.
8/8/2019 Ap08 Statistics Coursedesc
http://slidepdf.com/reader/full/ap08-statistics-coursedesc 29/45
2
Sample Questions for Stat st cs
© 2008 T e C ege B ar . A r g ts reserve . V s t t e C ege B ar t e Web: www.c egeb ar .c .
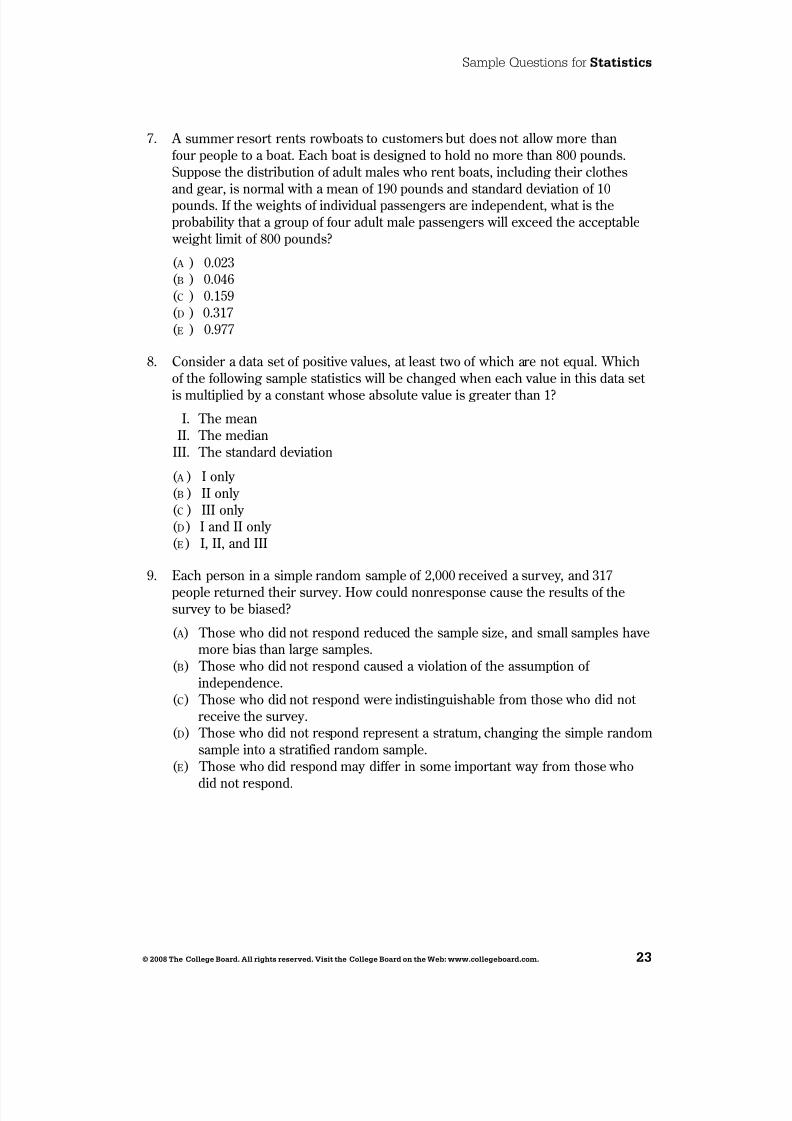
7. A summer resort rents rowboats to customers but does not allow more thanour people to a boat. Each boat is designed to hold no more than 800 pounds.
Suppose the distribution o adult males who rent boats, including their clothesand gear, is normal with a mean o 190 pounds and standard deviation o 10pounds. I the weights o individual passengers are independent, what is theprobability that a group o our adult male passengers will exceed the acceptable weight limit o 800 pounds?
( a ) 0.023( b ) 0.046( c ) 0.159( d ) 0.317( e ) 0.977
8. Consider a data set o positive values, at least two o which are not equal. Whicho the ollowing sample statistics will be changed when each value in this data set is multiplied by a constant whose absolute value is greater than 1?
I. The meanII. The median
III. The standard deviation
( a ) I only ( b ) II only ( c ) III only ( d ) I and II only ( e ) I, II, and III
9. Each person in a simple random sample o 2,000 received a survey, and 317people returned their survey. How could nonresponse cause the results o thesurvey to be biased?
( a ) Those who did not respond reduced the sample size, and small samples havemore bias than large samples.
( b ) Those who did not respond caused a violation o the assumption o independence.
( c ) Those who did not respond were indistinguishable rom those who did not receive the survey.
( d ) Those who did not respond represent a stratum, changing the simple randomsample into a strati ied random sample.
( e ) Those who did respond may di er in some important way rom those who
did not respond.
8/8/2019 Ap08 Statistics Coursedesc
http://slidepdf.com/reader/full/ap08-statistics-coursedesc 30/45
2
Sample Questions for Stat st cs
© 2008 T e C ege B ar . A r g ts reserve . V s t t e C ege B ar t e Web: www.c egeb ar .c .
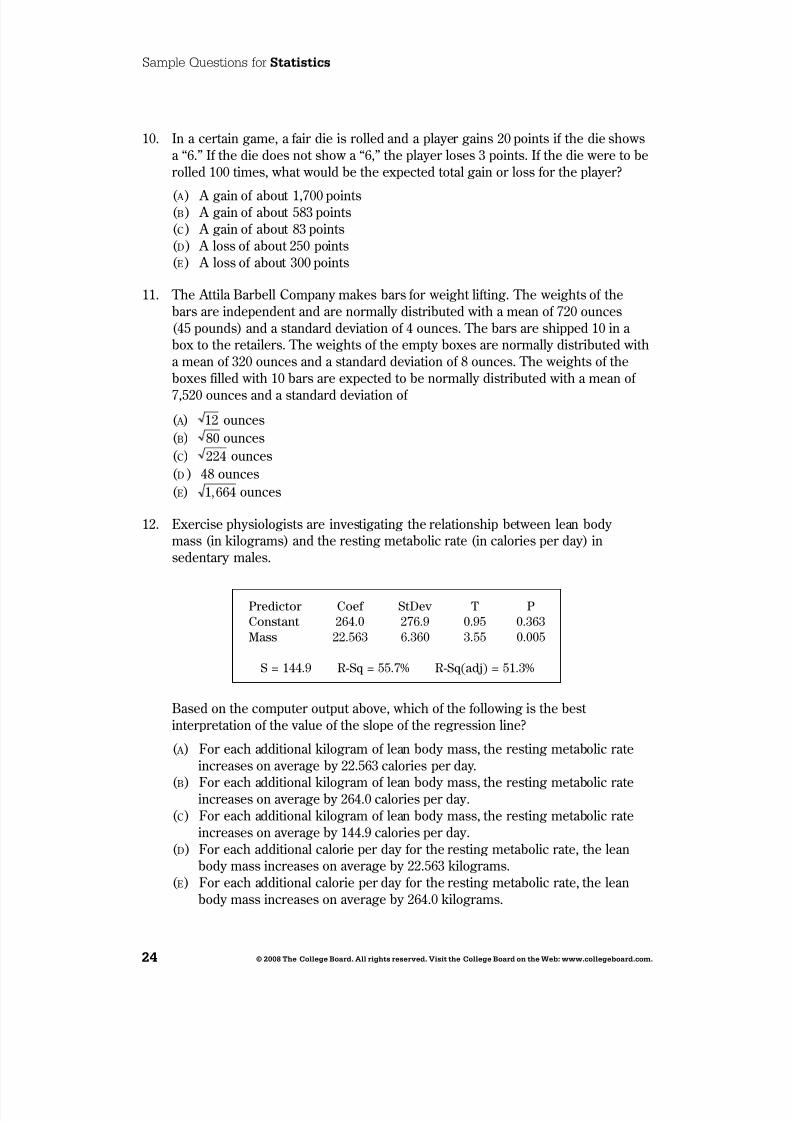
10. In a certain game, a air die is rolled and a player gains 20 points i the die showsa “6.” I the die does not show a “6,” the player loses 3 points. I the die were to berolled 100 times, what would be the expected total gain or loss or the player?
( a ) A gain o about 1,700 points( b ) A gain o about 583 points( c ) A gain o about 83 points( d ) A loss o about 250 points( e ) A loss o about 300 points
11. The Attila Barbell Company makes bars or weight li ting. The weights o thebars are independent and are normally distributed with a mean o 720 ounces(45 pounds) and a standard deviation o 4 ounces. The bars are shipped 10 in a box to the retailers. The weights o the empty boxes are normally distributed witha mean o 320 ounces and a standard deviation o 8 ounces. The weights o theboxes illed with 10 bars are expected to be normally distributed with a mean o 7,520 ounces and a standard deviation o ( a ) 12 ounces( b ) 80 ounces( c ) 224 ounces( d ) 48 ounces( e ) 1 664, ounces
12. Exercise physiologists are investigating the relationship between lean body mass (in kilograms) and the resting metabolic rate (in calories per day) insedentary males.
p d o co f s D t pcon n 264.0 276.9 0.95 0.363M 22.563 6.360 3.55 0.005
s = 144.9 r-sq = 55.7% r-sq( dj) = 51.3%
Based on the computer output above, which o the ollowing is the best interpretation o the value o the slope o the regression line?
( a ) For each additional kilogram o lean body mass, the resting metabolic rateincreases on average by 22.563 calories per day.
( b ) For each additional kilogram o lean body mass, the resting metabolic rateincreases on average by 264.0 calories per day.( c ) For each additional kilogram o lean body mass, the resting metabolic rate
increases on average by 144.9 calories per day.( d ) For each additional calorie per day or the resting metabolic rate, the lean
body mass increases on average by 22.563 kilograms.( e ) For each additional calorie per day or the resting metabolic rate, the lean
body mass increases on average by 264.0 kilograms.
8/8/2019 Ap08 Statistics Coursedesc
http://slidepdf.com/reader/full/ap08-statistics-coursedesc 31/45
2
Sample Questions for Stat st cs
© 2008 T e C ege B ar . A r g ts reserve . V s t t e C ege B ar t e Web: www.c egeb ar .c .
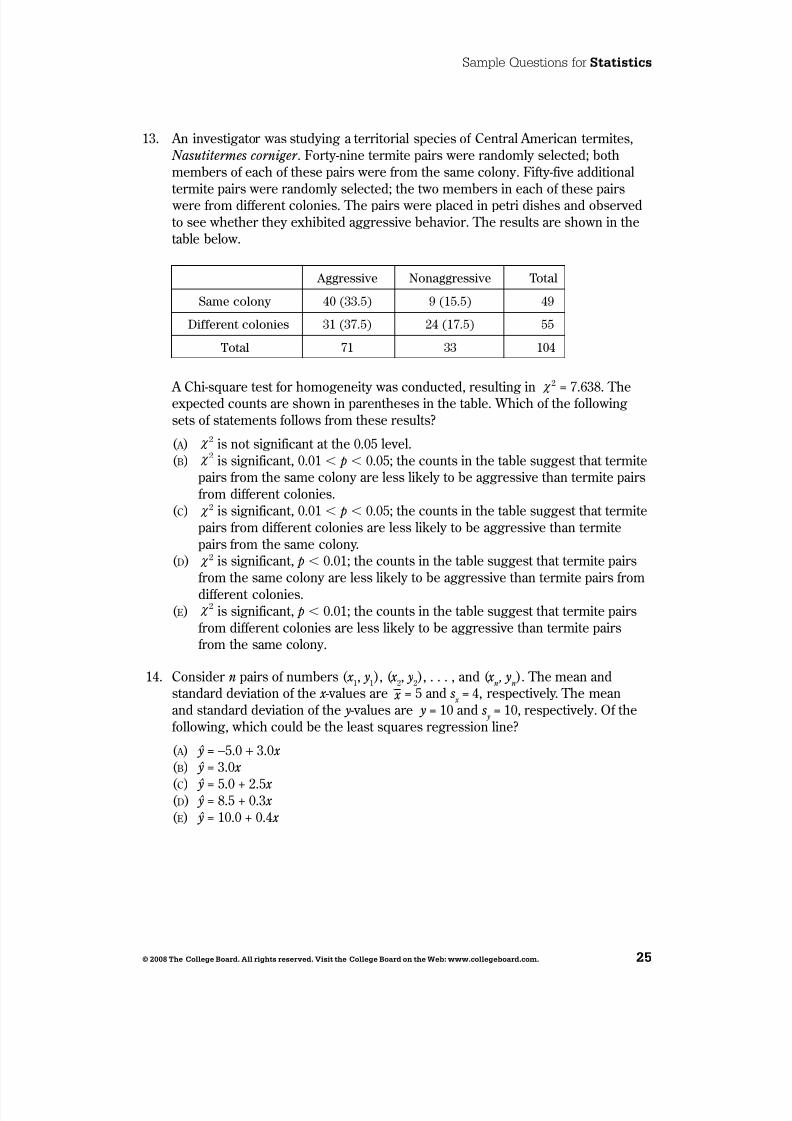
13. An investigator was studying a territorial species o Central American termites, Nasutitermes corniger . Forty-nine termite pairs were randomly selected; bothmembers o each o these pairs were rom the same colony. Fi ty- ive additionaltermite pairs were randomly selected; the two members in each o these pairs were rom di erent colonies. The pairs were placed in petri dishes and observedto see whether they exhibited aggressive behavior. The results are shown in thetable below.
agg Non gg to l
s m olony 40 (33.5) 9 (15.5) 49
D ff n olon 31 (37.5) 24 (17.5) 55
to l 71 33 104
A Chi-square test or homogeneity was conducted, resulting in χ 2
= 7.638. Theexpected counts are shown in parentheses in the table. Which o the ollowingsets o statements ollows rom these results?
( a ) χ 2 is not signi icant at the 0.05 level.( b ) χ 2 is signi icant, 0.01 < p < 0.05; the counts in the table suggest that termite
pairs rom the same colony are less likely to be aggressive than termite pairsrom di erent colonies.
( c ) χ 2 is signi icant, 0.01 < p < 0.05; the counts in the table suggest that termitepairs rom di erent colonies are less likely to be aggressive than termitepairs rom the same colony.
( d ) χ 2 is signi icant, p < 0.01; the counts in the table suggest that termite pairsrom the same colony are less likely to be aggressive than termite pairs rom
di erent colonies.( e ) χ 2 is signi icant, p < 0.01; the counts in the table suggest that termite pairs
rom di erent colonies are less likely to be aggressive than termite pairsrom the same colony.
14. Consider n pairs o numbers ( x 1, y 1 ), ( x 2, y 2 ), . . . , and ( x n, y n ). The mean andstandard deviation o the x -values are x = 5 and s x = 4, respectively. The meanand standard deviation o the y -values are y = 10 and s y = 10, respectively. O the
ollowing, which could be the least squares regression line?
( a ) ˆ y = - 5.0 + 3.0 x ( b ) ˆ y = 3.0 x
( c ) ˆ y = 5.0 + 2.5 x ( d ) ˆ y = 8.5 + 0.3 x ( e ) ˆ y = 10.0 + 0.4 x
8/8/2019 Ap08 Statistics Coursedesc
http://slidepdf.com/reader/full/ap08-statistics-coursedesc 32/45
2
Sample Questions for Stat st cs
© 2008 T e C ege B ar . A r g ts reserve . V s t t e C ege B ar t e Web: www.c egeb ar .c .
15. The mayor o a large city will run or governor i he believes that more than 30percent o the voters in the state already support him. He will have a survey irmask a random sample o n voters whether or not they support him. He will use a large sample test or proportions to test the null hypothesis that the proportiono all voters who support him is 30 percent or less against the alternative that thepercentage is higher than 30 percent. Suppose that 35 percent o all voters in thestate actually support him. In which o the ollowing situations would the power
or this test be highest?
( a ) The mayor uses a signi icance level o 0.01 and n = 250 voters.( b ) The mayor uses a signi icance level o 0.01 and n = 500 voters.( c ) The mayor uses a signi icance level o 0.01 and n = 1,000 voters.( d ) The mayor uses a signi icance level o 0.05 and n = 500 voters.( e ) The mayor uses a signi icance level o 0.05 and n = 1,000 voters.
16. George and Michelle each claimed to have the better recipe or chocolate chipcookies. They decided to conduct a study to determine whose cookies werereally better. They each baked a batch o cookies using their own recipe. Georgeasked a random sample o his riends to taste his cookies and to complete a questionnaire on their quality. Michelle asked a random sample o her riendsto complete the same questionnaire or her cookies. They then compared theresults. Which o the ollowing statements about this study is alse?
( a ) Because George and Michelle have a di erent population o riends, their sampling procedure makes it di icult to compare the recipes.
( b ) Because George and Michelle each used only their own respective recipes,their cooking ability is con ounded with the recipe quality.
( c ) Because George and Michelle each used only the ovens in their houses, the
recipe quality is con ounded with the characteristics o the oven.( d ) Because George and Michelle used the same questionnaire, their results willgeneralize to the combined population o their riends.
( e ) Because George and Michelle each baked one batch, there is no replicationo the cookie recipes.
17. A large company is considering opening a ranchise in St. Louis and wants toestimate the mean household income or the area using a simple random sampleo households. Based on in ormation rom a pilot study, the company assumesthat the standard deviation o household incomes is σ = $7,200. O the ollowing, which is the least number o households that should be surveyed to obtainan estimate that is within $200 o the true mean household income with
95 percent con idence?( a ) 1,375( b ) 1,300( c ) 5,200( d ) 5,500( e ) 7,700
8/8/2019 Ap08 Statistics Coursedesc
http://slidepdf.com/reader/full/ap08-statistics-coursedesc 33/45
2
Sample Questions for Stat st cs
© 2008 T e C ege B ar . A r g ts reserve . V s t t e C ege B ar t e Web: www.c egeb ar .c .
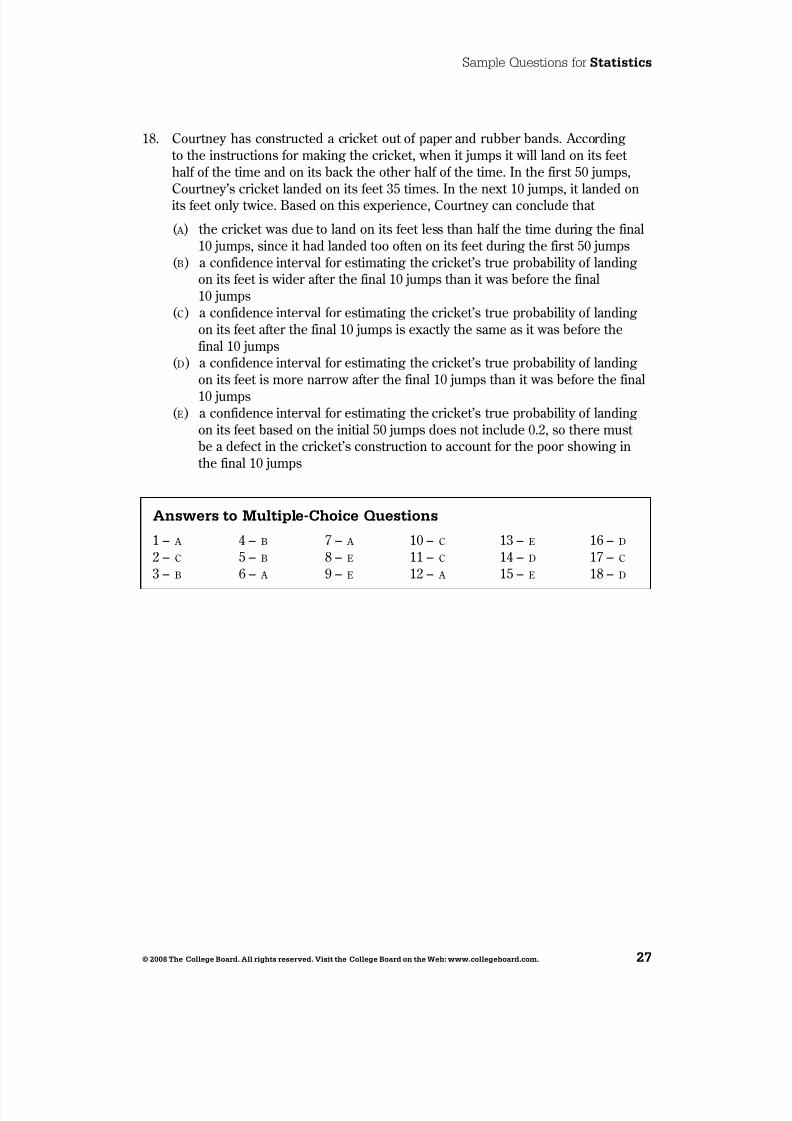
18. Courtney has constructed a cricket out o paper and rubber bands. Accordingto the instructions or making the cricket, when it jumps it will land on its eet hal o the time and on its back the other hal o the time. In the irst 50 jumps,Courtney’s cricket landed on its eet 35 times. In the next 10 jumps, it landed onits eet only twice. Based on this experience, Courtney can conclude that
( a ) the cricket was due to land on its eet less than hal the time during the inal10 jumps, since it had landed too o ten on its eet during the irst 50 jumps
( b ) a con idence interval or estimating the cricket’s true probability o landingon its eet is wider a ter the inal 10 jumps than it was be ore the inal10 jumps
( c ) a con idence interval or estimating the cricket’s true probability o landingon its eet a ter the inal 10 jumps is exactly the same as it was be ore the
inal 10 jumps( d ) a con idence interval or estimating the cricket’s true probability o landing
on its eet is more narrow a ter the inal 10 jumps than it was be ore the inal10 jumps
( e ) a con idence interval or estimating the cricket’s true probability o landingon its eet based on the initial 50 jumps does not include 0.2, so there must be a de ect in the cricket’s construction to account or the poor showing inthe inal 10 jumps
A swers t m t p e-C ce Q est s
1 – a 4 – b 7 – a 10 – c 13 – e 16 – d
2 – c 5 – b 8 – e 11 – c 14 – d 17 – c
3 – b 6 – a 9 – e 12 – a 15 – e 18 – d
8/8/2019 Ap08 Statistics Coursedesc
http://slidepdf.com/reader/full/ap08-statistics-coursedesc 34/45
28
Sample Questions for Stat st cs
© 2008 T e C ege B ar . A r g ts reserve . V s t t e C ege B ar t e Web: www.c egeb ar .c .
Free-Resp se Q est sIn the ree-response section o the AP Statistics Exam, students are asked to answer
ve questions and complete an investigative task. Each question is designed to be
answered in approximately 12 minutes. The longer investigative task is designed tobe answered in approximately 30 minutes.
Statistics is a discipline in which clear and complete communication is an essentialskill. The ree-response questions on the AP Statistics Exam require students to usetheir analytical, organizational, and communication skills to ormulate cogent answers and provide students with an opportunity to:
• Relate two or more di erent content areas (i.e., exploratory data analysis,experimental design and sampling, probability, and statistical in erence)as they ormulate a complete response or solution to a statistics or probability problem.
• Demonstrate their mastery o statistics in a response ormat that permits thestudents to determine how they will organize and present each response.
The purpose o the investigative task is not only to evaluate the student’sunderstanding in several content areas but also to assess his or her ability tointegrate statistical ideas and apply them in a new context or in a nonroutine way.
Sc r g f Free-Resp se Q est s The evaluation o student responses on the ree-response section o the AP StatisticsExam refects the dual importance o statistical knowledge and good communication. The ree-response questions and the investigative task are scored “holistically”; that is, each question’s response is evaluated as “a complete package.” With holistic
scoring, a ter reading through the details o a student’s response, the scorer makes a judgment about the overall quality o the response. This is di erent rom “analytic”scoring, where the individual components to be evaluated in a student’s response arespeci ed in advance, and each component is given a value counting toward the overallscore.
Holistic scoring is well suited or questions where the student is required tosynthesize in ormation and respond at least partially in written paragraphs, and or questions that could potentially generate multiple and diverse, but equally correct,responses. For example, an open-ended question may present data rom a real-li estudy and ask the student not only to analyze the data but also to comment on how the study’s protocol might be improved. Comments on improving the protocol might
ocus on improving the sampling method, controlling con ounding variables, or seeking more power by increasing the sample size. In this context, holistic scoringrepresents a recognition not only o the existence o multiple reasonable approachesto a statistical analysis, but a realization o the existence o a statistical synergy—i.e., that a quality student response is more than just the sum o its parts.
8/8/2019 Ap08 Statistics Coursedesc
http://slidepdf.com/reader/full/ap08-statistics-coursedesc 35/45
2
Sample Questions for Stat st cs
© 2008 T e C ege B ar . A r g ts reserve . V s t t e C ege B ar t e Web: www.c egeb ar .c .
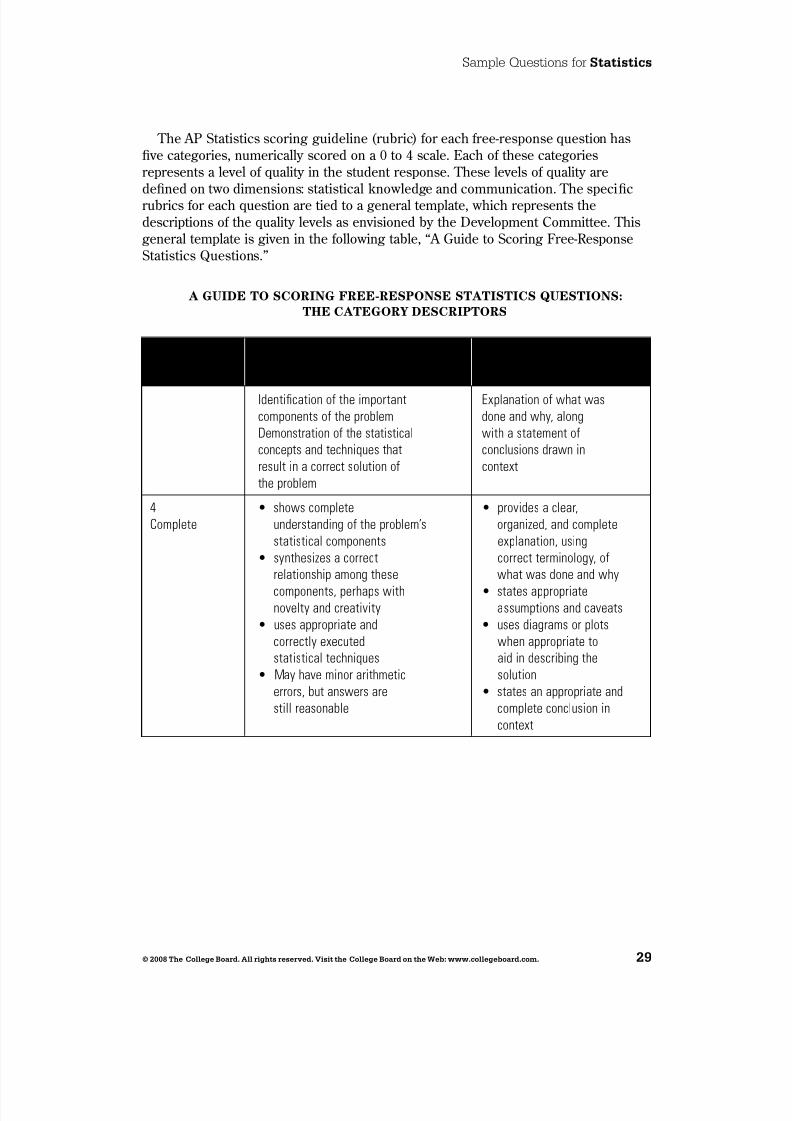
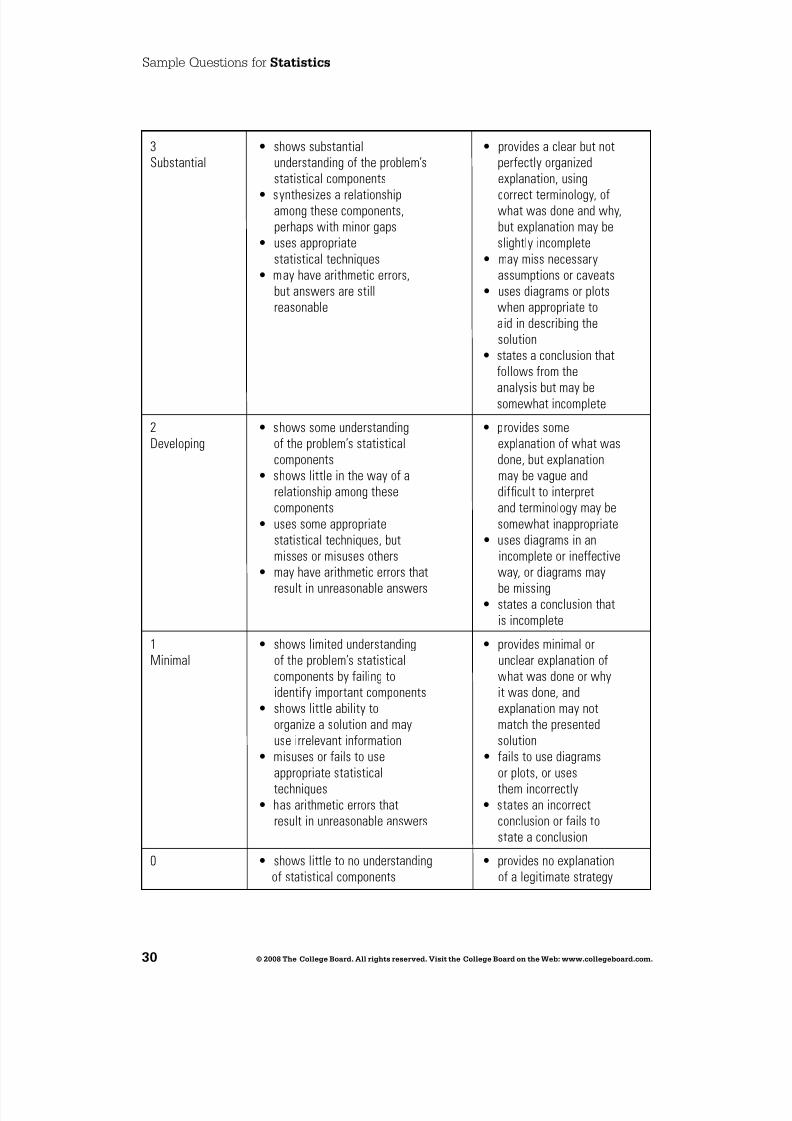
The AP Statistics scoring guideline (rubric) or each ree-response question hasve categories, numerically scored on a 0 to 4 scale. Each o these categories
represents a level o quality in the student response. These levels o quality arede ned on two dimensions: statistical knowledge and communication. The speci crubrics or each question are tied to a general template, which represents thedescriptions o the quality levels as envisioned by the Development Committee. Thisgeneral template is given in the ollowing table, “A Guide to Scoring Free-ResponseStatistics Questions.”
A GUIDE TO SCORING FREE-RESPONSE STATISTICS QUESTIONS:THE CATEGORY DESCRIPTORS
Score Statistical Knowledge CommunicationDescriptors
Identifcation o the important Explanation o what wascomponents o the problem done and why, alongDemonstration o the statistical with a statement oconcepts and techniques that conclusions drawn inresult in a correct solution o contextthe problem
4 • shows complete • provides a clear,Complete understanding o the problem’s organized, and complete
statistical components explanation, using• synthesizes a correct correct terminology, o
relationship among these what was done and whycomponents, perhaps with • states appropriatenovelty and creativity assumptions and caveats
• uses appropriate and • uses diagrams or plotscorrectly executed when appropriate to
statistical techniques aid in describing the• May have minor arithmetic solution
errors, but answers are • states an appropriate andstill reasonable complete conclusion in
context
8/8/2019 Ap08 Statistics Coursedesc
http://slidepdf.com/reader/full/ap08-statistics-coursedesc 36/45
0
Sample Questions for Stat st cs
© 2008 T e C ege B ar . A r g ts reserve . V s t t e C ege B ar t e Web: www.c egeb ar .c .
3 • shows substantial • provides a clear but notSubstantial understanding o the problem’s per ectly organized
statistical components explanation, using
• synthesizes a relationship correct terminology, oamong these components, what was done and why,perhaps with minor gaps but explanation may be
• uses appropriate slightly incompletestatistical techniques • may miss necessary
• may have arithmetic errors, assumptions or caveatsbut answers are still • uses diagrams or plotsreasonable when appropriate to
aid in describing thesolution
•states a conclusion thatollows rom the
analysis but may besomewhat incomplete
2 • shows some understanding • provides someDeveloping o the problem’s statistical explanation o what was
components done, but explanation• shows little in the way o a may be vague and
relationship among these di fcult to interpretcomponents and terminology may be
• uses some appropriate somewhat inappropriatestatistical techniques, but • uses diagrams in an
misses or misuses others incomplete or ine ective• may have arithmetic errors that way, or diagrams may
result in unreasonable answers be missing• states a conclusion that
is incomplete
1 • shows limited understanding • provides minimal orMinimal o the problem’s statistical unclear explanation o
components by ailing to what was done or whyidenti y important components it was done, and
• shows little ability to explanation may notorganize a solution and may match the presenteduse irrelevant in ormation solution
• misuses or ails to use • ails to use diagramsappropriate statistical or plots, or usestechniques them incorrectly
• has arithmetic errors that • states an incorrectresult in unreasonable answers conclusion or ails to
state a conclusion
0 • shows little to no understanding • provides no explanationo statistical components o a legitimate strategy
8/8/2019 Ap08 Statistics Coursedesc
http://slidepdf.com/reader/full/ap08-statistics-coursedesc 37/45
Sample Questions for Stat st cs
© 2008 T e C ege B ar . A r g ts reserve . V s t t e C ege B ar t e Web: www.c egeb ar .c .
Some important points that students should remember when answering ree-responsequestions on the AP Statistics Exam are given below.
1. Read the questions care ully and answer them in context; or example, the
results o a hypothesis test should always be ollowed by a conclusion in context,and a con dence interval should always be ollowed by an interpretation o theinterval in context. Explanations and conclusions in context are always required
or a complete answer.
2. Know the vocabulary o statistics, and use that vocabulary correctly in all written responses.
3. Remember to de ne all symbols. Speci cally, remember to distinguish betweenpopulation parameters and sample statistics.
4. Remember to state and check all necessary assumptions when per orminghypothesis tests and constructing interval estimates.
5. Be able to interpret data displayed in a variety o ways, including graphs andcomputer outputs. Be able to represent data in a variety o orms and basesound statistical arguments on these representations.
AP Central contains ree-response questions, scoring guidelines, and selected student responses rom past AP Statistics Exams. This is an excellent place to become more
amiliar with the content o past ree-response questions and how they were scored. The ollowing questions are examples o ree-response questions. These questions were administered as part o a previous year’s exam.
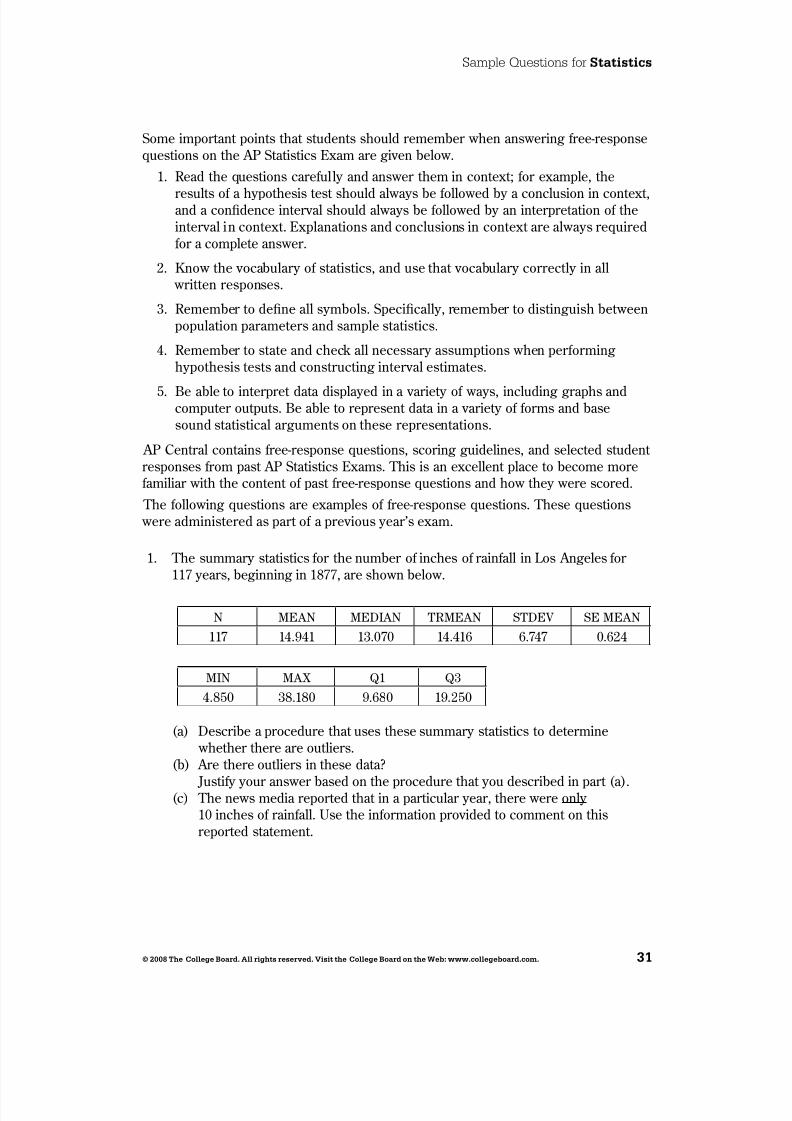
1. The summary statistics or the number o inches o rain all in Los Angeles or 117 years, beginning in 1877, are shown below.
N MeaN MeDiaN trMeaN stDev se MeaN
117 14.941 13.070 14.416 6.747 0.624
MiN MaX Q1 Q3
4.850 38.180 9.680 19.250
(a) Describe a procedure that uses these summary statistics to determine whether there are outliers.
(b) Are there outliers in these data?
Justi y your answer based on the procedure that you described in part (a).( c ) The news media reported that in a particular year, there were only 10 inches o rain all. Use the in ormation provided to comment on thisreported statement.
8/8/2019 Ap08 Statistics Coursedesc
http://slidepdf.com/reader/full/ap08-statistics-coursedesc 38/45
2
Sample Questions for Stat st cs
© 2008 T e C ege B ar . A r g ts reserve . V s t t e C ege B ar t e Web: www.c egeb ar .c .
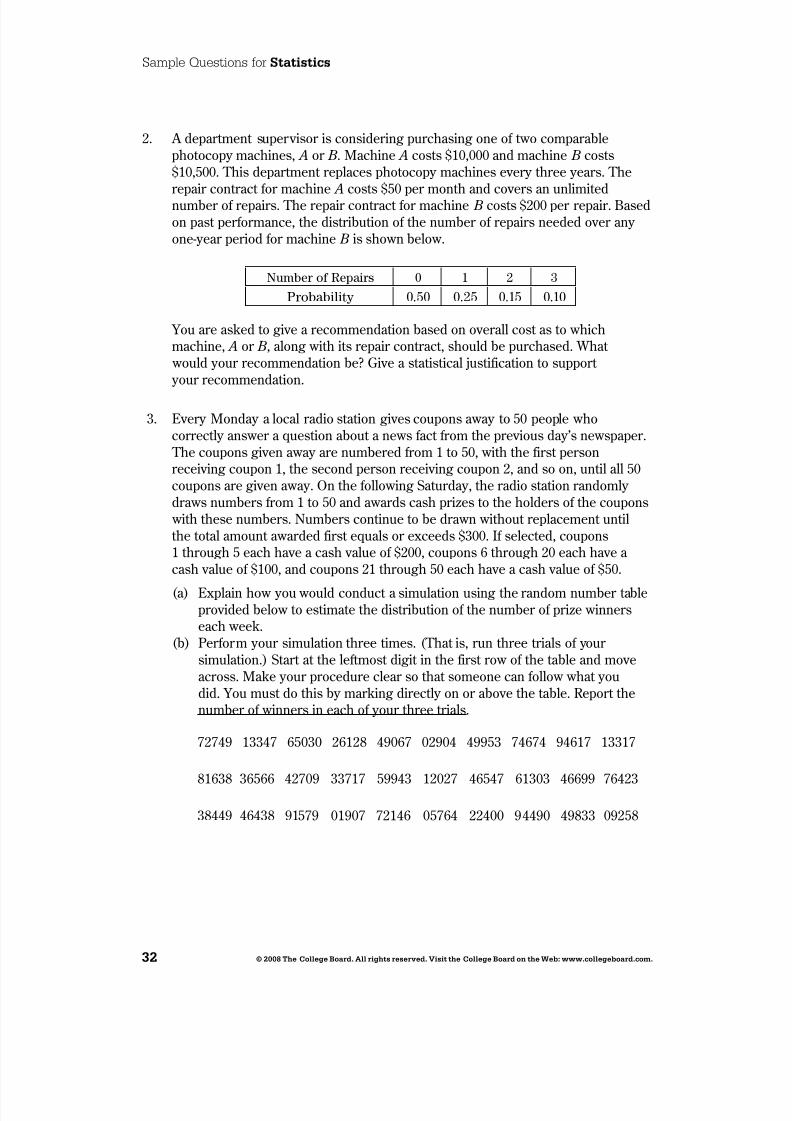
2. A department supervisor is considering purchasing one o two comparablephotocopy machines, A or B . Machine A costs $10,000 and machine B costs$10,500. This department replaces photocopy machines every three years. Therepair contract or machine A costs $50 per month and covers an unlimitednumber o repairs. The repair contract or machine B costs $200 per repair. Basedon past per ormance, the distribution o the number o repairs needed over any one-year period or machine B is shown below.
Numb of r 0 1 2 3
p ob b l y 0.50 0.25 0.15 0.10
You are asked to give a recommendation based on overall cost as to whichmachine, A or B , along with its repair contract, should be purchased. What would your recommendation be? Give a statistical justi ication to support your recommendation.
3. Every Monday a local radio station gives coupons away to 50 people whocorrectly answer a question about a news act rom the previous day’s newspaper. The coupons given away are numbered rom 1 to 50, with the irst personreceiving coupon 1, the second person receiving coupon 2, and so on, until all 50coupons are given away. On the ollowing Saturday, the radio station randomly draws numbers rom 1 to 50 and awards cash prizes to the holders o the coupons with these numbers. Numbers continue to be drawn without replacement untilthe total amount awarded irst equals or exceeds $300. I selected, coupons1 through 5 each have a cash value o $200, coupons 6 through 20 each have a cash value o $100, and coupons 21 through 50 each have a cash value o $50.
(a) Explain how you would conduct a simulation using the random number tableprovided below to estimate the distribution o the number o prize winnerseach week.
(b) Per orm your simulation three times. (That is, run three trials o your simulation.) Start at the le tmost digit in the irst row o the table and moveacross. Make your procedure clear so that someone can ollow what youdid. You must do this by marking directly on or above the table. Report thenumber o winners in each o your three trials.
72749 13347 65030 26128 49067 02904 49953 74674 94617 13317
81638 36566 42709 33717 59943 12027 46547 61303 46699 76423
38449 46438 91579 01907 72146 05764 22400 94490 49833 09258
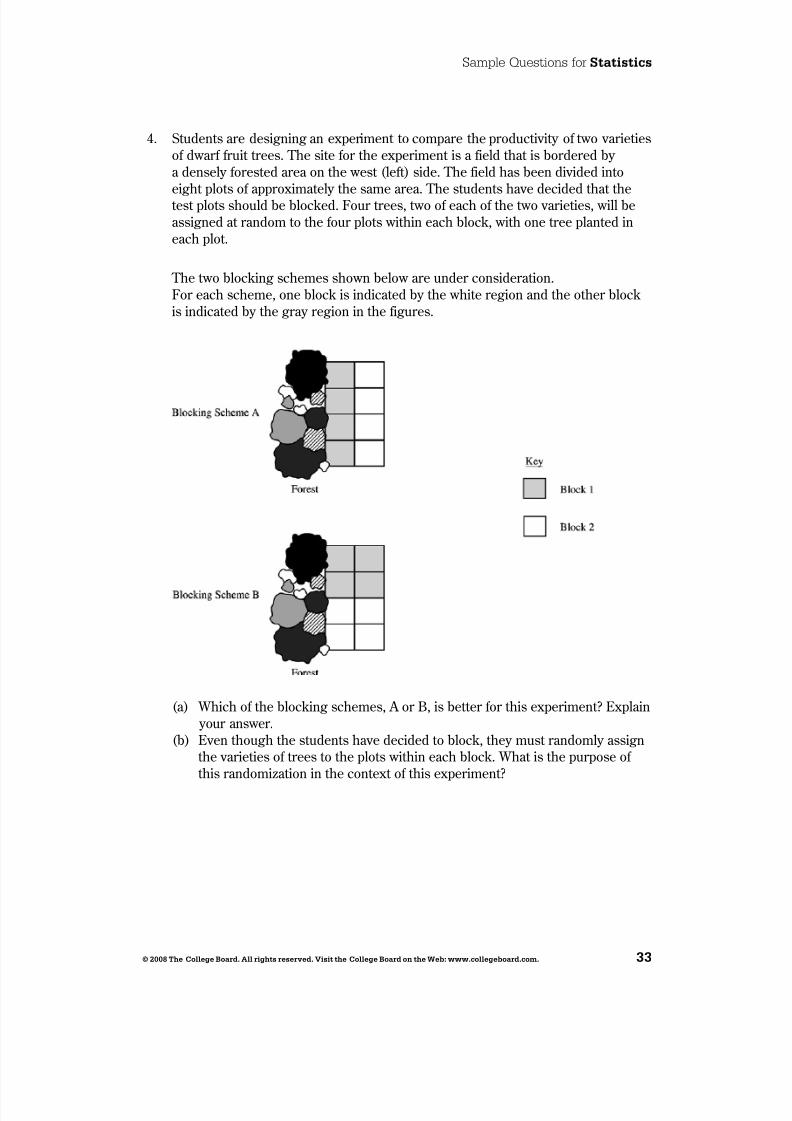
8/8/2019 Ap08 Statistics Coursedesc
http://slidepdf.com/reader/full/ap08-statistics-coursedesc 39/45
Sample Questions for Stat st cs
© 2008 T e C ege B ar . A r g ts reserve . V s t t e C ege B ar t e Web: www.c egeb ar .c .
4. Students are designing an experiment to compare the productivity o two varietieso dwar ruit trees. The site or the experiment is a ield that is bordered by a densely orested area on the west (le t) side. The ield has been divided intoeight plots o approximately the same area. The students have decided that thetest plots should be blocked. Four trees, two o each o the two varieties, will beassigned at random to the our plots within each block, with one tree planted ineach plot.
The two blocking schemes shown below are under consideration.For each scheme, one block is indicated by the white region and the other blockis indicated by the gray region in the igures.
( a ) Which o the blocking schemes, A or B, is better or this experiment? Explain your answer.
( b ) Even though the students have decided to block, they must randomly assignthe varieties o trees to the plots within each block. What is the purpose o this randomization in the context o this experiment?
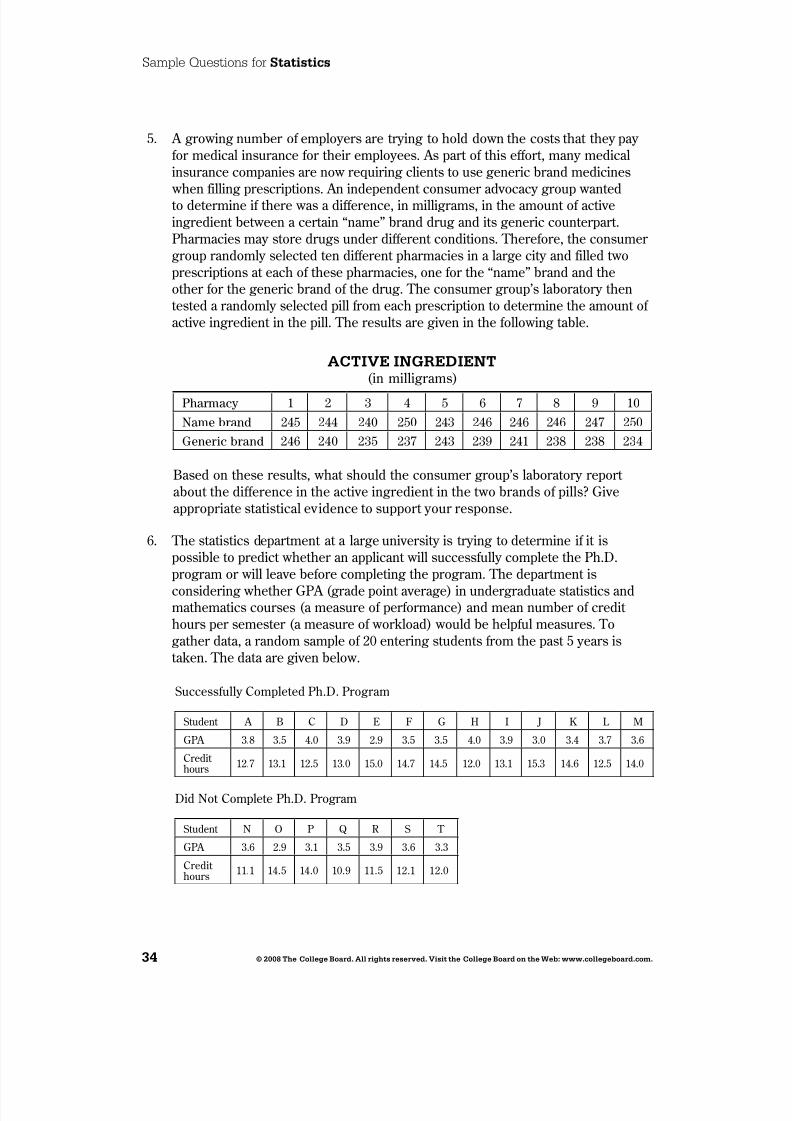
8/8/2019 Ap08 Statistics Coursedesc
http://slidepdf.com/reader/full/ap08-statistics-coursedesc 40/45
Sample Questions for Stat st cs
© 2008 T e C ege B ar . A r g ts reserve . V s t t e C ege B ar t e Web: www.c egeb ar .c .
5. A growing number o employers are trying to hold down the costs that they pay or medical insurance or their employees. As part o this e ort, many medical
insurance companies are now requiring clients to use generic brand medicines when illing prescriptions. An independent consumer advocacy group wantedto determine i there was a di erence, in milligrams, in the amount o activeingredient between a certain “name” brand drug and its generic counterpart.Pharmacies may store drugs under di erent conditions. There ore, the consumer group randomly selected ten di erent pharmacies in a large city and illed twoprescriptions at each o these pharmacies, one or the “name” brand and theother or the generic brand o the drug. The consumer group’s laboratory thentested a randomly selected pill rom each prescription to determine the amount o active ingredient in the pill. The results are given in the ollowing table.
ACTIVE InGREdIEnT(in milligrams)
ph m y 1 2 3 4 5 6 7 8 9 10
N m b nd 245 244 240 250 243 246 246 246 247 250
G n b nd 246 240 235 237 243 239 241 238 238 234 Based on these results, what should the consumer group’s laboratory report about the di erence in the active ingredient in the two brands o pills? Giveappropriate statistical evidence to support your response.
6. The statistics department at a large university is trying to determine i it ispossible to predict whether an applicant will success ully complete the Ph.D.program or will leave be ore completing the program. The department isconsidering whether GPA (grade point average) in undergraduate statistics andmathematics courses (a measure o per ormance) and mean number o credit hours per semester (a measure o workload) would be help ul measures. Togather data, a random sample o 20 entering students rom the past 5 years istaken. The data are given below.
Success ully Completed Ph.D. Program
Student A B C D E F G H I J K L M
GPA 3.8 3.5 4.0 3.9 2.9 3.5 3.5 4.0 3.9 3.0 3.4 3.7 3.6
Credit hours 12.7 13.1 12.5 13.0 15.0 14.7 14.5 12.0 13.1 15.3 14.6 12.5 14.0
Did Not Complete Ph.D. Program
Student N O P Q R S T
GPA 3.6 2.9 3.1 3.5 3.9 3.6 3.3
Credit hours 11.1 14.5 14.0 10.9 11.5 12.1 12.0
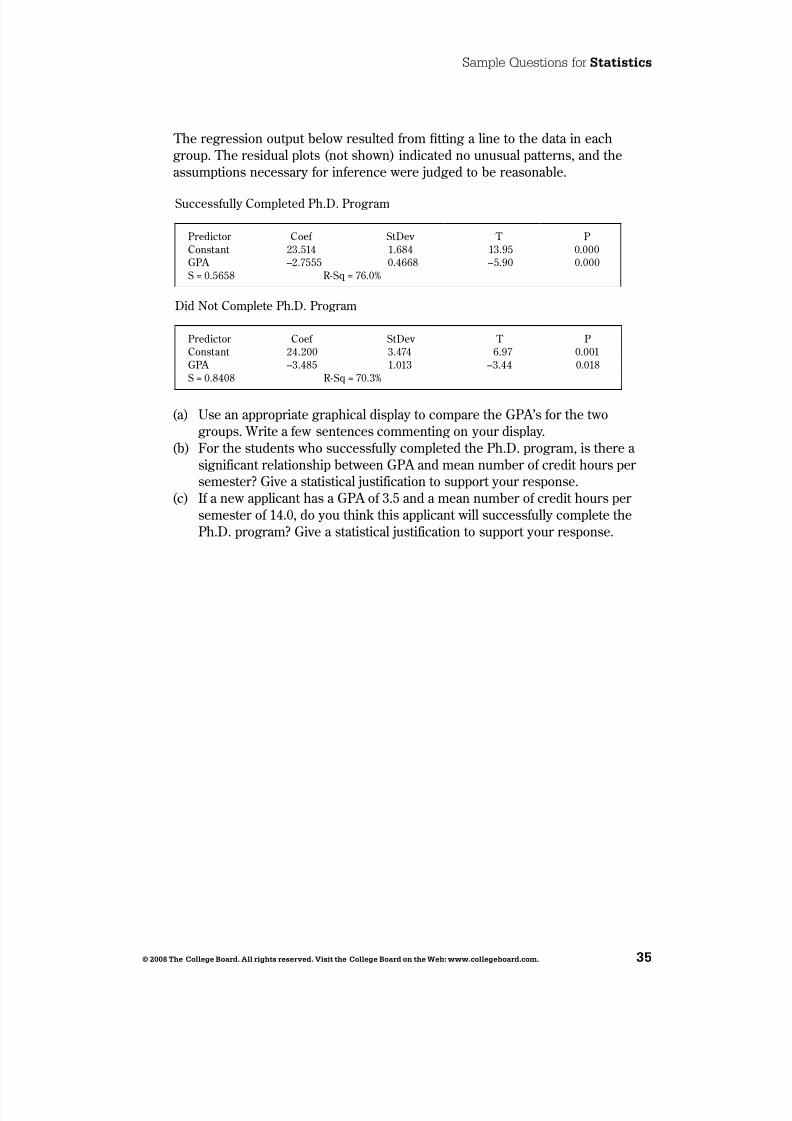
8/8/2019 Ap08 Statistics Coursedesc
http://slidepdf.com/reader/full/ap08-statistics-coursedesc 41/45
Sample Questions for Stat st cs
© 2008 T e C ege B ar . A r g ts reserve . V s t t e C ege B ar t e Web: www.c egeb ar .c .
The regression output below resulted rom tting a line to the data in eachgroup. The residual plots (not shown) indicated no unusual patterns, and theassumptions necessary or in erence were judged to be reasonable.
Success ully Completed Ph.D. Program
Predictor Coe StDev T PConstant 23.514 1.684 13.95 0.000GPA –2.7555 0.4668 –5.90 0.000S = 0.5658 R-Sq = 76.0%
Did Not Complete Ph.D. Program
Predictor Coe StDev T PConstant 24.200 3.474 6.97 0.001GPA –3.485 1.013 –3.44 0.018S = 0.8408 R-Sq = 70.3%
( a ) Use an appropriate graphical display to compare the GPA’s or the twogroups. Write a ew sentences commenting on your display.
( b ) For the students who success ully completed the Ph.D. program, is there a signi icant relationship between GPA and mean number o credit hours per semester? Give a statistical justi ication to support your response.
( c ) I a new applicant has a GPA o 3.5 and a mean number o credit hours per semester o 14.0, do you think this applicant will success ully complete thePh.D. program? Give a statistical justi ication to support your response.

8/8/2019 Ap08 Statistics Coursedesc
http://slidepdf.com/reader/full/ap08-statistics-coursedesc 42/45
8/8/2019 Ap08 Statistics Coursedesc
http://slidepdf.com/reader/full/ap08-statistics-coursedesc 43/45
© 2008 T e C ege B ar . A r g ts reserve . V s t t e C ege B ar t e Web: www.c egeb ar .c .
Teacher Support
AP Ce tra ® (apce tra .c egeb ar .c ) You can nd the ollowing Web resources at AP Central ( ree registration required):
• AP Course Descriptions, AP Exam questions and scoring guidelines, samplesyllabi, and eature articles.
• A searchable Institutes and Workshops database, providing in ormat ion about pro essional development events.
• The Course Home Pages (apcentral.collegeboard.com/coursehomepages), which contain insight ul articles, teaching tips, activities, lab ideas, and other course-speci c content contributed by colleagues in the AP community.
• Moderated electronic discussion groups (EDGs) or each AP course, provided toacilitate the exchange o ideas and practices.
AP P b cat s a ot er Res rcesFree AP resources are available to help students, parents, AP Coordinators, and highschool and college aculty learn more about the AP Program and its courses andexams. Visit apcentral.collegeboard.com/ reepubs.
Teacher’s Guides and Course Descriptions may be downloaded ree o chargerom AP Central; printed copies may be purchased through the College Board Store
(store.collegeboard.com). Released Exams and other priced AP resources areavailable at the College Board Store.
Teac er’s G es
For those about to teach an AP course or the rst time, or or experienced APteachers who would like to get some resh ideas or the classroom, the Teacher’sGuide is an excellent resource. Each Teacher’s Guide contains syllabi developed by high school teachers currently teaching the AP course and college aculty whoteach the equivalent course at colleges and universities. Along with detailed courseoutlines and innovative teaching tips, you’ll also nd extensive lists o suggestedteaching resources.
C rse descr pt sCourse Descriptions are available or each AP subject. They provide an outline o each AP course’s content, explain the kinds o skills students are expected todemonstrate in the corresponding introductory college-level course, and describethe AP Exam. Sample multiple-choice questions with an answer key and sample
ree-response questions are included. (The Course Description or AP Computer Science is available in PDF ormat only.)
Re ease E a sPeriodically the AP Program releases a complete copy o each exam. In addition toproviding the multiple-choice questions and answers, the publication describes theprocess o scoring the ree-response questions and includes examples o students’actual responses, the scoring standards, and commentary that explains why theresponses received the scores they did.
8/8/2019 Ap08 Statistics Coursedesc
http://slidepdf.com/reader/full/ap08-statistics-coursedesc 44/45
National O fceAdvanced Placement Program45 Columbus AvenueNew York, NY 10023-6992212 713-8066E-mail: [email protected]
AP ServicesP.O. Box 6671Princeton, NJ 08541-6671609 771-7300877 274-6474 (toll ree in the U.S.and Canada)E-mail: apexams@in o.collegeboard.org
AP Canada O fce2950 Douglas Street, Suite 550Victoria, BC, Canada V8T 4N4250 472-8561800 667-4548 (toll ree in Canada only)E-mail: [email protected]
AP International O fceServing all countries outside the U.S. and Canada
45 Columbus AvenueNew York, NY 10023-6992212 373-8738E-mail: [email protected]
Middle States Regional O fceServing Delaware, District of Columbia, Maryland,
New Jersey, New York, Pennsylvania, Puerto Rico, and the U.S. Virgin Islands
Two Bala Plaza, Suite 900Bala Cynwyd, PA 19004-1501866 392-3019E-mail: [email protected]
Midwestern Regional O fceServing Illinois, Indiana, Iowa, Kansas,
Michigan, Minnesota, Missouri,
Nebraska, North Dakota, Ohio, South Dakota,West Virginia, and Wisconsin
6111 N. River Road, Suite 550Rosemont, IL 60018-5158866 392-4086E-mail: [email protected]
New England Regional O fceServing Connecticut, Maine, Massachusetts, New
Hampshire, Rhode Island, and Vermont
470 Totten Pond RoadWaltham, MA 02451-1982866 392-4089E-mail: [email protected]
Southern Regional O fceServing Alabama, Florida, Georgia, Kentucky,
Louisiana, Mississippi, North Carolina, South Carolina,Tennessee, and Virginia
3700 Crestwood Parkway NW, Suite 700Duluth, GA 30096-7155866 392-4088E-mail: [email protected]
Southwestern Regional O fceServing Arkansas, New Mexico, Oklahoma, and Texas
4330 South MoPac Expressway, Suite 200Austin, TX 78735-6735866 392-3017E-mail: [email protected]
Western Regional O fceServing Alaska, Arizona, California, Colorado, Hawaii,
Idaho, Montana, Nevada, Oregon, Utah, Washington,
and Wyoming 2099 Gateway Place, Suite 550San Jose, CA 95110-1051866 392-4078E-mail: [email protected]
Contact Us
8/8/2019 Ap08 Statistics Coursedesc
http://slidepdf.com/reader/full/ap08-statistics-coursedesc 45/45
2007-08 Developmen Commi ee nd Chief Re derKenneth Koehler, Iowa State University, Ames, Chair Kathy Fritz, Plano West Senior High School, TexasDorinda Hewit, Diamond Bar High School, California
Chris Olsen, Thomas Jefferson High School, Cedar Rapids, IowaThomas Short, Indiana University of PennsylvaniaJosh Tabor, Canyon del Oro High School, Oro Valley, ArizonaRobert Taylor, Clemson University, South CarolinaChief Reader: Christine Franklin, University of Georgia, Athens
ETS Consultants: Richard Chilcoat, Jeff Haberstroh, Luis Saldivia
apcentral.collegeboard.com
I.N. 070082359