Embed Size (px)
Citation preview
AP Statistics – Summer Packet Upper Moreland High School
What you need to know about this class: This is probably unlike any course
that you have taken. I would say that it is a combination of Math, English, and Science. Communication skills are essential, and there is much more reading and writing than
what you are used to in a math class. It is a very rewarding course and a very
important one, in my opinion, but can be quite difficult at times. Since it is an AP course, it is considered to be college-level. The mathematics required for this course
may not be as difficult as in other advanced math courses, but some of the concepts can be very confusing. In addition, there is a great deal of material that we are expected to
cover by April’s end, so you need to be committed to giving it your absolute best effort day in and day out. Lastly, a TI graphing calculator is an essential tool for this course,
as those calculators have many statistical features we take advantage of.
Purpose of this packet: Not surprisingly, it can be difficult to cover all the
required material for this course and still have time for a desired review period for the AP exam. I believe that completion of this packet might free up a few extra days to
cover the required curriculum, which is significant. It might allow us to spend extra time on the more difficult topics. In addition, this packet will hopefully provide you with a
good introduction to what Statistics (the field and this course) is about so that you can make the decision about whether or not you want to remain signed up for the class.
The assignments in this packet will be due on the first day of school and will count as a major homework grade. You should give yourself at
least a week to complete it. You may choose to respond to the questions by typing them in, or you can write them by hand. If you find something confusing, please email
me ([email protected]) and I will help you to get unstuck. During the summer, I may not be checking my email everyday, however, I will get back to you as fast as I
can. I expect you to give this packet your best shot, but you will not be penalized if you
get an answer “wrong.” We will go over the critical components of this packet in class. As with any assignment, copying answers from another individual or another source is
considered academically dishonest and will result in a grade of a zero.
Lastly, if you are really interested in Statistics and have some extra time, I recommend Outliers by Malcolm Gladwell and Freakonomics by Steven Levitt and Stephen Dubner.
HAVE A GREAT SUMMER AND I LOOK FORWARD TO SEEING
YOU IN SEPTEMBER!
-Mrs. Erb
Part 1: Introduction to Statistics
Sta·tis·tics Etymology: German Statistik: study of political facts and figures, from New Latin statisticus: of politics, from Latin status: state. Date: 1770
1 : a branch of mathematics dealing with the collection, analysis, interpretation, and presentation of masses of numerical data [note: this is for Statistics with a uppercase S]
2 : a collection of quantitative data [note: this is for statistics with a lowercase s] Source: http://www.merriam-webster.com/dictionary/statistics
Answer the following in complete, well written sentences, to the best of your ability:
1) Before you saw this definition, how would you have defined Statistics? Has your definition changed after
reading this?
2) How one collects the data is extremely important. Explain how you would conduct a survey to determine the
percentage of Upper Moreland High School students who are satisfied with the quality of education that they
are receiving. Due to resource constraints, however, you will only be able to ask 100 students.
3) You have worked with data before in your science classes, if nowhere else. Provide one example from your
life in which you have worked with data. How did you collect it? How did you analyze it? How did you
present your findings? What conclusions did you come to?
4) Tell me what you have heard from other people about this class.
5) This class is an elective. So, why did you sign up for it?
6) Find a newspaper or magazine article involving statistics. Bring your article to class on the first day. Write a
summary of your article here:
Read the following to learn more about early uses of statistics… Censuses throughout history Early population counts generally were not concerned with determining the total size of the population or including detailed information about people. Their main goal was to discover who was available for military duty and who held taxable property. These counts usually did not give an accurate number or picture of the population. They often left out large segments of society, such as women and children, men attempting to avoid military service or taxation, and native inhabitants of an area. The earliest known population counts were made thousands of years ago by the ancient Babylonians, Chinese, and Egyptians. Around 2500 B.C., the Babylonians recorded on clay tablets information about the taxpaying part of the population. These tablets included such data as the number of farm animals, farm products, and households for districts within the kingdom. Tax returns from around 2300 B.C. for parts of ancient China indicate some kind of population count. About 1300 B.C., Egypt was divided into administrative districts. The government registered and counted heads of households and members of the households within these districts. The fourth book of Bible, the Book of Numbers, describes the census, or numbering, of the tribes in ancient Israel to determine the number of men of fighting age (Numbers 1: 1-46; Numbers 26: 1-51). In 594 B.C., the Greek lawmaker Solon introduced a form of enumeration and registration to reform tax laws in Greece. The Romans employed census takers known as censors to determine the number of people who were eligible for taxation and military duty. The Roman censor was responsible for officially registering all citizens in a particular area, evaluating their property, collecting revenue, and guarding public morals. Perhaps the best-known Roman census is described in the New Testament story of the birth of Jesus Christ (Luke 2:1-7). This census took place about 5 B.C., when Joseph and Mary traveled to Bethlehem to record their names in a census ordered by the Roman emperor Augustus. The practice of taking censuses declined in Europe after the fall of the West Roman Empire in A.D. 476. One of the few attempts to count people during the Middle Ages occurred in England in 1086. That year, commissioners sent by William the Conqueror traveled the kingdom and recorded, for tax purposes, the names of all English landowners and the value of their lands and houses, tenants, and servants. The resulting document, known as the Domesday Book, provides historians with a censuslike description of England at that time. Through the years, with the rise in trade, the growth of towns, and the development of nations, rulers and government officials increasingly recognized the importance of counting people and goods. In 1665, King Louis XIV of France ordered a census in New France, in what is now Quebec, Canada. This census recorded the name of each person, along with such information as age, marital status, occupation, and relationship to the head of the household. The main purpose of this census was to collect information about the colony's progress, rather than to assess how much military service or tax revenue the colonists might provide. Because of this purpose, census historians generally consider the New France enumeration to be the model for modern censuses. Likewise, in 1703, there was a house-to-house census in Iceland for reasons other than taxation and military service. This census inquired into the effects of economic conditions and natural disasters. The government then used the information to develop programs for economic and social improvement. A number of European countries undertook censuses of individual cities and provinces in the early 1700’s. However, none of these enumerations counted the total population of a nation until 1749. That year, the Swedish government conducted the first national census. The first modern census —one that was complete, direct, and scheduled to be repeated at regular intervals—was the United States census of 1790. In the 1800’s, a number of other countries began taking regular censuses. In 1853, an International Statistical Congress was held in Brussels, Belgium. This conference represented the first attempt to adopt international recommendations and requirements to help in comparing population census data among various countries.
After World War II ended in 1945, censuses became especially important as an aid in planning for the economic reconstruction of countries that had been heavily damaged in the war. In 1946, the United Nations established a separate Population and Statistical Commission, which recognized the need for census statistics. Since then, the United Nations has published a number of principles and recommendations for population and housing censuses to assist countries in the planning of censuses. Following these recommended standards allows for international comparison of collected data. In addition, the United Nations Fund for Population Activities provides many countries with financial and expert assistance for the planning of censuses. Today, most censuses are proclaimed by a government decree or law and planned and executed by a statistical agency, a permanent or semipermanent census bureau, or both. These census acts or laws require every person to answer the questions to the best of his or her knowledge. Refusal to cooperate can result in a fine or even imprisonment. Draaijer, Gera. "Census." World Book Advanced. World Book, 2011. Web. 5 June 2011.
7) After reading this, provide a conjecture for why the word “Statistics” is rooted in the Latin for “state”.
Read the following: The New York Times - August 6, 2009
For Today’s Graduate, Just One Word: Statistics By STEVE LOHR
MOUNTAIN VIEW, Calif. — At Harvard, Carrie Grimes majored in anthropology and archaeology and
ventured to places like Honduras, where she studied Mayan settlement patterns by mapping where artifacts
were found. But she was drawn to what she calls “all the computer and math stuff” that was part of the job.
“People think of field archaeology as Indiana Jones, but much of what you really do is data analysis,” she said.
Now Ms. Grimes does a different kind of digging. She works at Google, where she uses statistical analysis of
mounds of data to come up with ways to improve its search engine.
Ms. Grimes is an Internet-age statistician, one of many who are changing the image of the profession as a place
for dronish number nerds. They are finding themselves increasingly in demand — and even cool.
“I keep saying that the sexy job in the next 10 years will be statisticians,” said Hal Varian, chief economist at
Google. “And I’m not kidding.”
The rising stature of statisticians, who can earn $125,000 at top companies in their first year after getting a
doctorate, is a byproduct of the recent explosion of digital data. In field after field, computing and the Web are
creating new realms of data to explore — sensor signals, surveillance tapes, social network chatter, public
records and more. And the digital data surge only promises to accelerate, rising fivefold by 2012, according to a
projection by IDC, a research firm.
Yet data is merely the raw material of knowledge. “We’re rapidly entering a world where everything can be
monitored and measured,” said Erik Brynjolfsson, an economist and director of the Massachusetts Institute of
Technology’s Center for Digital Business. “But the big problem is going to be the ability of humans to use,
analyze and make sense of the data.”
The new breed of statisticians tackle that problem. They use powerful computers and sophisticated
mathematical models to hunt for meaningful patterns and insights in vast troves of data. The applications are
as diverse as improving Internet search and online advertising, culling gene sequencing information for cancer
research and analyzing sensor and location data to optimize the handling of food shipments.
Even the recently ended Netflix contest, which offered $1 million to anyone who could significantly improve the
company’s movie recommendation system, was a battle waged with the weapons of modern statistics.
Though at the fore, statisticians are only a small part of an army of experts using modern statistical techniques
for data analysis. Computing and numerical skills, experts say, matter far more than degrees. So the new data
sleuths come from backgrounds like economics, computer science and mathematics.
They are certainly welcomed in the White House these days. “Robust, unbiased data are the first step toward
addressing our long-term economic needs and key policy priorities,” Peter R. Orszag, director of the Office of
Management and Budget, declared in a speech in May. Later that day, Mr. Orszag confessed in a blog entry that
his talk on the importance of statistics was a subject “near to my (admittedly wonkish) heart.”
I.B.M., seeing an opportunity in data-hunting services, created a Business Analytics and Optimization Services
group in April. The unit will tap the expertise of the more than 200 mathematicians, statisticians and other
data analysts in its research labs — but that number is not enough. I.B.M. plans to retrain or hire 4,000 more
analysts across the company.
In another sign of the growing interest in the field, an estimated 6,400 people are attending the statistics
profession’s annual conference in Washington this week, up from around 5,400 in recent years, according to
the American Statistical Association. The attendees, men and women, young and graying, looked much like any
other crowd of tourists in the nation’s capital. But their rapt exchanges were filled with talk of randomization,
parameters, regressions and data clusters. The data surge is elevating a profession that traditionally tackled
less visible and less lucrative work, like figuring out life expectancy rates for insurance companies.
Ms. Grimes, 32, got her doctorate in statistics from Stanford in 2003 and joined Google later that year. She is
now one of many statisticians in a group of 250 data analysts. She uses statistical modeling to help improve the
company’s search technology.
For example, Ms. Grimes worked on an algorithm to fine-tune Google’s crawler software, which roams the Web
to constantly update its search index. The model increased the chances that the crawler would scan frequently
updated Web pages and make fewer trips to more static ones.
The goal, Ms. Grimes explained, is to make tiny gains in the efficiency of computer and network use. “Even an
improvement of a percent or two can be huge, when you do things over the millions and billions of times we do
things at Google,” she said.
It is the size of the data sets on the Web that opens new worlds of discovery. Traditionally, social sciences
tracked people’s behavior by interviewing or surveying them. “But the Web provides this amazing resource for
observing how millions of people interact,” said Jon Kleinberg, a computer scientist and social networking
researcher at Cornell.
For example, in research just published, Mr. Kleinberg and two colleagues followed the flow of ideas across
cyberspace. They tracked 1.6 million news sites and blogs during the 2008 presidential campaign, using
algorithms that scanned for phrases associated with news topics like “lipstick on a pig.”
The Cornell researchers found that, generally, the traditional media leads and the blogs follow, typically by 2.5
hours. But a handful of blogs were quickest to quotes that later gained wide attention.
The rich lode of Web data, experts warn, has its perils. Its sheer volume can easily overwhelm statistical
models. Statisticians also caution that strong correlations of data do not necessarily prove a cause-and-effect
link.
For example, in the late 1940s, before there was a polio vaccine, public health experts in America noted that
polio cases increased in step with the consumption of ice cream and soft drinks, according to David Alan Grier,
a historian and statistician at George Washington University. Eliminating such treats was even recommended
as part of an anti-polio diet. It turned out that polio outbreaks were most common in the hot months of
summer, when people naturally ate more ice cream, showing only an association, Mr. Grier said.
If the data explosion magnifies longstanding issues in statistics, it also opens up new frontiers.
“The key is to let computers do what they are good at, which is trawling these massive data sets for something
that is mathematically odd,” said Daniel Gruhl, an I.B.M. researcher whose recent work includes mining
medical data to improve treatment. “And that makes it easier for humans to do what they are good at — explain
those anomalies.”
What is Statistics? by Jordan Neus (from http://www.fiu.edu/~neusj/whatisstatistics.html)
Statistics is becoming increasingly more important in modern society with passing time. We are constantly being
bombarded with charts, graphs, and statistics of various types in an attempt to provide us with succinct information to
make decisions. Sometimes this information is presented in a manner so as to sway us toward a particular view. As
consumers and decision makers we must be aware of this. Which drug should we take? Which car should we buy?
Where will the economy go? Who is infected with a particular deadly disease? These are all examples of questions
which are usually relegated to the statistician for analysis and dissemination. This lecture will attempt to introduce the
beginning to student some of the reasoning behind the necessity of statistical inference.
In order to realistically understand the subject of Statistics it is important to appreciate the rationale behind why
and how Statistics is used by the world, at large. That is, why do we need Statistics anyway? This, perhaps, is a bit
philosophical, yet I can not over emphasize the need for thinking along these lines. Without proper perspective, Statistics
becomes a mere mathematical exercise, diverging from the true nature of the subject.
In order to begin our analysis as to why Statistics is a necessary type of reasoning we must begin by addressing
the nature of science and experimentation. A characteristic method used by scientists is to study a relatively small
collection of objects, say 2500 people, and a characteristic, say longevity, and through experimentation or observation,
draw a conclusion appropriate for the entire class of objects (i.e. people, in general). For example, suppose a study
published results suggesting people who own pets live longer. Would this mean that all people who own pets are likely to
live long lives? Does owning a pet cause longevity? Suppose the people in the study, by chance, were on the whole, very
healthy people, and therefore lived long lives: Would this invalidate the researcher’s assertion that people who own pets
live longer? The obvious problem with this type of reasoning is that these issues can never be proved absolutely. This
type of scientific reasoning is called inductive reasoning and is inherently flawed. One can never study a sample and
expect conclusions to hold true for the entire population with absolute certainty. This is exactly why Statistics is needed.
In contrast to the lack of certainty associated with inductive reasoning, the type of logic used in Mathematics is
absolutely certain. The mathematician begins with general principles and logically concludes more specific relationships.
This type of reasoning from the general to the particular is called deductive reasoning. A rather simplistic (but
nevertheless correct) example is based on the principle that two numbers can be added in any order, thereby giving the
same sum. This is called the axiom of commutativity. An example of deductive reasoning would be to assert that since
this holds for any two numbers, surely this must hold for the numbers two and three, in particular. We are, therefore,
absolutely certain that 2 + 3 = 3 + 2, given the axiom of commutativity.
In its applied form, Statistics then becomes a bridge between the inductive uncertainty of science and the
deductive certainty of Mathematics. In his classic book, The Design of Experiments, Sir Ronald A. Fisher expresses this
idea beautifully:
We may at once admit that any inference from the particular to the general must be attended with some degree of
uncertainty, but this is not the same as to admit that such inference cannot be absolutely rigorous, for the nature and
degree of the uncertainty may itself be capable of rigorous expression.
Statistics, therefore, is the mathematical method by which the uncertainty inherent in the scientific method is
rigorously quantified.
8) React to the above pieces in at least three paragraphs:
Part 2: Data and Its Context + Reading Comprehension Involving Statistics
Read the following…
“Teen Automobile Crash Rates Are Higher When School Starts Earlier”
ScienceDaily (June 10, 2010) — Earlier school start times are associated with increased teenage car crash rates, according
to a research abstract presented June 9, 2010, in San Antonio, Texas, at SLEEP 2010, the 24th annual meeting of the
Associated Professional Sleep Societies LLC.
Results indicate that in 2008 the teen crash rate was about 41 percent higher in Virginia Beach, Va., where high school
classes began at 7:20 a.m., than in adjacent Chesapeake, Va., where classes started more than an hour later at 8:40 a.m.
There were 65.4 automobile crashes for every 1,000 teen drivers in Virginia Beach, and 46.2 crashes for every 1,000 teen
drivers in Chesapeake.
"We were concerned that Virginia Beach teens might be sleep restricted due to their early rise times and that this could
eventuate in an increased crash rate," said lead author Robert Vorona, MD, associate professor of internal medicine at
Eastern Virginia Medical School in Norfolk, Va. "The study supported our hypothesis, but it is important to note that this
is an association study and does not prove cause and effect."
The study involved data provided by the Virginia Department of Motor Vehicles. In Virginia Beach there were 12,916
drivers between 16 and 18 years of age in 2008, and these teen drivers were involved in 850 crashes. In Chesapeake there
were 8,459 teen drivers and 394 automobile accidents. The researchers report that the two adjoining cities have similar
demographics, including racial composition and per-capita income.
1) Answer the following questions regarding the above excerpt:
a) Who is being studied?
b) What about those individuals is being recorded / analyzed (i.e. what are the variables?)? Do you think the
variables are categorical or quantitative in nature?
c) When was the data collected?
d) Where was the data collected (more accurately: what geographical area is associated with the data)?
e) Why do you think this data was collected and analyzed?
f) How was the data collected and analyzed? In other words, what methods were used?
g) Why do you think the authors of the study mentioned that “it is important to note that this is an association
study and does not prove cause and effect?”
2) Answer the same questions in (a) – (f) above, except now do it for the article that you found regarding
statistics:
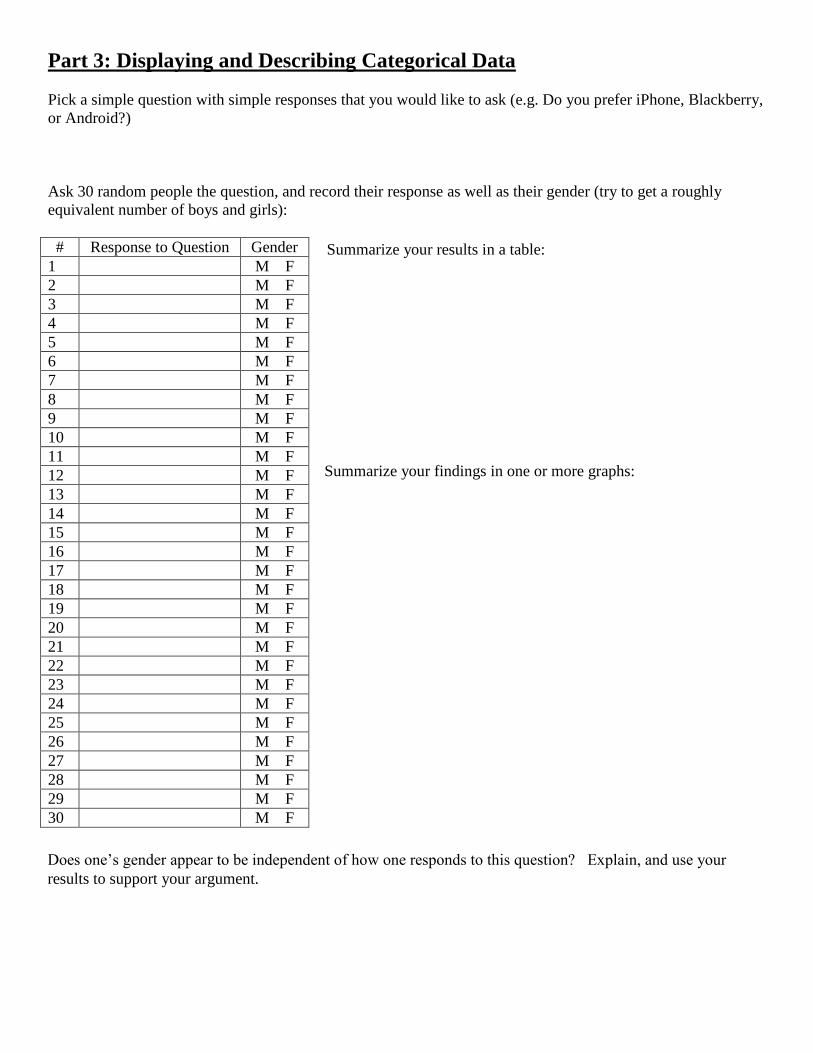
Part 3: Displaying and Describing Categorical Data
Pick a simple question with simple responses that you would like to ask (e.g. Do you prefer iPhone, Blackberry,
or Android?)
Ask 30 random people the question, and record their response as well as their gender (try to get a roughly
equivalent number of boys and girls):
# Response to Question Gender
1 M F
2 M F
3 M F
4 M F
5 M F
6 M F
7 M F
8 M F
9 M F
10 M F
11 M F
12 M F
13 M F
14 M F
15 M F
16 M F
17 M F
18 M F
19 M F
20 M F
21 M F
22 M F
23 M F
24 M F
25 M F
26 M F
27 M F
28 M F
29 M F
30 M F
Summarize your results in a table:
Summarize your findings in one or more graphs:
Does one’s gender appear to be independent of how one responds to this question? Explain, and use your
results to support your argument.
Part 4: Displaying and Describing Quantitative Data
Consider the following data set: {-2, 0, 4, 2, 2}
Find the mean (average) (show work)
Find the median (middle value) (show work):
Identify the mode:
If the number 20 was added to the data set, what would the new mean be? (show work)
If the number 20 was added to the data set, what would the new median be? (show work)
Which one changed more?
If you had 50 numbers arranged in numerical order, the median would be the average of the ___ and ___
numbers.
If you had 49 numbers arranged in numerical order, the median would be located at the ___ number.
Part 5: Combinatorics and Probability
Show how you arrived at each answer. If you are having difficulty with these, check out the tutorials on this
site: http://www.intmath.com/counting-probability/counting-probability-intro.php (there are many other good
tutorial sites as well)
1) If there are 3 appetizers, 3 entrees, and 2 desserts available, how many different three course meals are
possible?
2) Suppose three coins are tossed, and each time, they turn up heads. What is the probability that the next
toss will be heads?
3) How many ways are there to arrange the first five letters of the alphabet (no repetition of characters)?
4) How many 4 digit PINs (personal identification numbers) are possible if repetition of digits is allowed?
5) There are three slots available per day for oral presentations in a hypothetical class. If there are 25
students in the class, how many ways can the presentations be arranged on the first day?
6) For two standard 6 sided dice,
a. What is the probability of rolling two sixes?
b. Of not rolling two sixes?
c. Of rolling a sum of three?
7) Two cards are drawn from a standard 52 card deck. What is the probability that they’re both aces?
8) 7 people (4 boys and 3 girls) are available to play basketball. How many 5 person teams are possible if
each team must have 3 boys and 2 girls on it?
9) Let’s say a person makes 3 out of every 4 free-throws, on average. If they shoot four shots, what is the
probability that they will make exactly three?
Part 6: Algebra Review
1) Evaluate z if x
z
and x = 20, µ = 10, and σ = 2. (If you don’t know already, µ is the Greek lowercase “m”
(we say “mu” (like myoo)) and σ is the Greek lowercase “s” (we say “sigma”).)
2) Solve x
z
for σ, then for μ
3) Solve 20.5
0.05 1.96n
for n.
4) If 60
1.64
and
951.96
, solve for µ and σ.
5) Find the equation of the line in slope intercept (y = mx + b) form that goes through the points (-2, 4) and
(5, 7).
Read the following and answer the questions at the end:
Highlights from the AP Statistics Course Description (from http://apcentral.collegeboard.com/apc/public/repository/ap-statistics-course-description.pdf)
Introduction
The Advanced Placement Program offers a course description and exam in statistics to secondary school
students who wish to complete studies equivalent to a one semester, introductory, non-calculus-based, college
course in statistics.
Statistics and mathematics educators who serve as members of the AP Statistics Development
Committee have prepared the Course Description and exam to reflect the content of a typical introductory
college course in statistics. The exam is representative of such a course and therefore is considered appropriate
for the measurement of skills and knowledge in the field of introductory statistics.
In colleges and universities, the number of students who take a statistics course is almost as large as the
number of students who take a calculus course. A July 2002 article in the Chronicle of Higher Education
reports that the enrollment in statistics courses from 1990 to 2000 increased by 45 percent — one testament to
the growth of statistics in those institutions. An introductory statistics course, similar to the AP Statistics course,
is typically required for majors such as social sciences, health sciences and business. Every semester about
236,000 college and university students enroll in an introductory statistics course offered by a mathematics or
statistics department. In addition, a large number of students enroll in an introductory statistics course offered
by other departments. Science, engineering and mathematics majors usually take an upper-level calculus-based
course in statistics, for which the AP Statistics course is effective preparation.
The Course
The purpose of the AP course in statistics is to introduce students to the major concepts and tools for collecting,
analyzing and drawing conclusions from data. Students are exposed to four broad conceptual themes:
1. Exploring Data: Describing patterns and departures from patterns
2. Sampling and Experimentation: Planning and conducting a study
3. Anticipating Patterns: Exploring random phenomena using probability and simulation
4. Statistical Inference: Estimating population parameters and testing hypotheses
AP Statistics Course Content Overview
The topics for AP Statistics are divided into four major themes: exploratory analysis (20–30 percent of the
exam), planning and conducting a study (10–15 percent of the exam), probability (20–30 percent of the exam),
and statistical inference (30–40 percent of the exam).
I. Exploratory analysis of data makes use of graphical and numerical techniques to study patterns and
departures from patterns. In examining distributions of data, students should be able to detect important
characteristics, such as shape, location, variability and unusual values. From careful observations of patterns in
data, students can generate conjectures about relationships among variables. The notion of how one variable
may be associated with another permeates almost all of statistics, from simple comparisons of proportions
through linear regression. The difference between association and causation must accompany this conceptual
development throughout.
II. Data must be collected according to a well-developed plan if valid information is to be obtained. If data
are to be collected to provide an answer to a question of interest, a careful plan must be developed. Both the
type of analysis that is appropriate and the nature of conclusions that can be drawn from that analysis depend in
a critical way on how the data was collected. Collecting data in a reasonable way, through either sampling or
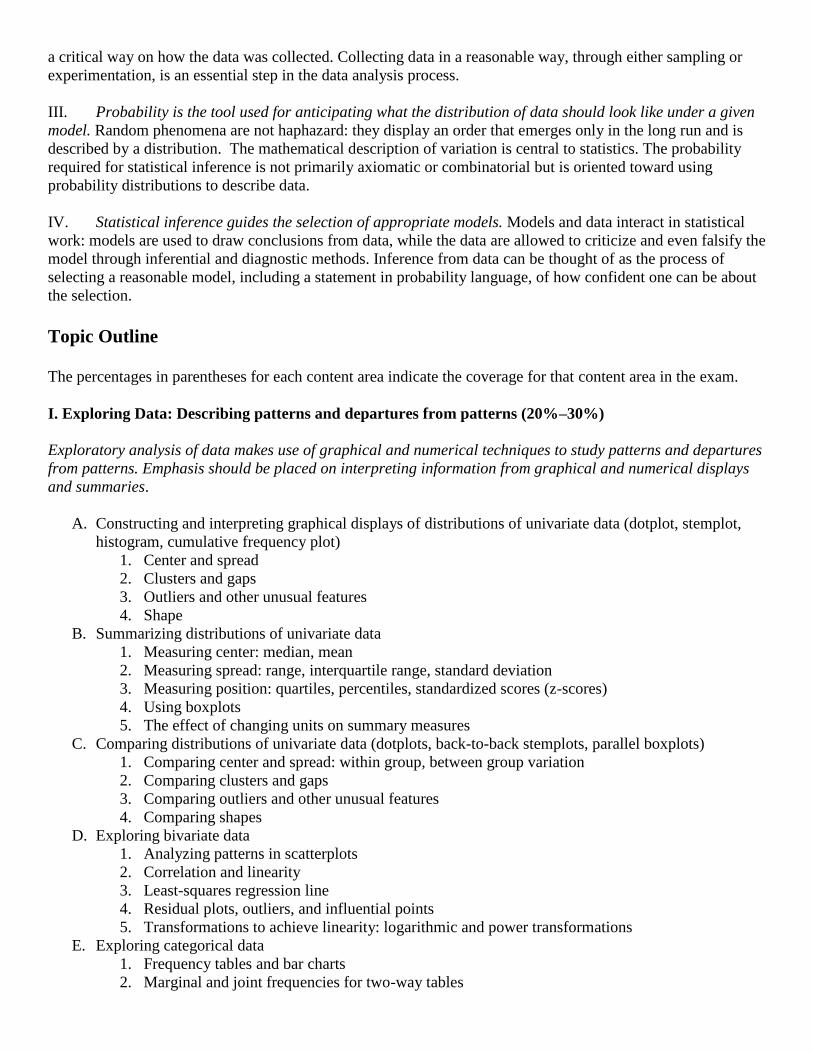
experimentation, is an essential step in the data analysis process.
III. Probability is the tool used for anticipating what the distribution of data should look like under a given
model. Random phenomena are not haphazard: they display an order that emerges only in the long run and is
described by a distribution. The mathematical description of variation is central to statistics. The probability
required for statistical inference is not primarily axiomatic or combinatorial but is oriented toward using
probability distributions to describe data.
IV. Statistical inference guides the selection of appropriate models. Models and data interact in statistical
work: models are used to draw conclusions from data, while the data are allowed to criticize and even falsify the
model through inferential and diagnostic methods. Inference from data can be thought of as the process of
selecting a reasonable model, including a statement in probability language, of how confident one can be about
the selection.
Topic Outline
The percentages in parentheses for each content area indicate the coverage for that content area in the exam.
I. Exploring Data: Describing patterns and departures from patterns (20%–30%)
Exploratory analysis of data makes use of graphical and numerical techniques to study patterns and departures
from patterns. Emphasis should be placed on interpreting information from graphical and numerical displays
and summaries.
A. Constructing and interpreting graphical displays of distributions of univariate data (dotplot, stemplot,
histogram, cumulative frequency plot)
1. Center and spread
2. Clusters and gaps
3. Outliers and other unusual features
4. Shape
B. Summarizing distributions of univariate data
1. Measuring center: median, mean
2. Measuring spread: range, interquartile range, standard deviation
3. Measuring position: quartiles, percentiles, standardized scores (z-scores)
4. Using boxplots
5. The effect of changing units on summary measures
C. Comparing distributions of univariate data (dotplots, back-to-back stemplots, parallel boxplots)
1. Comparing center and spread: within group, between group variation
2. Comparing clusters and gaps
3. Comparing outliers and other unusual features
4. Comparing shapes
D. Exploring bivariate data
1. Analyzing patterns in scatterplots
2. Correlation and linearity
3. Least-squares regression line
4. Residual plots, outliers, and influential points
5. Transformations to achieve linearity: logarithmic and power transformations
E. Exploring categorical data
1. Frequency tables and bar charts
2. Marginal and joint frequencies for two-way tables
3. Conditional relative frequencies and association
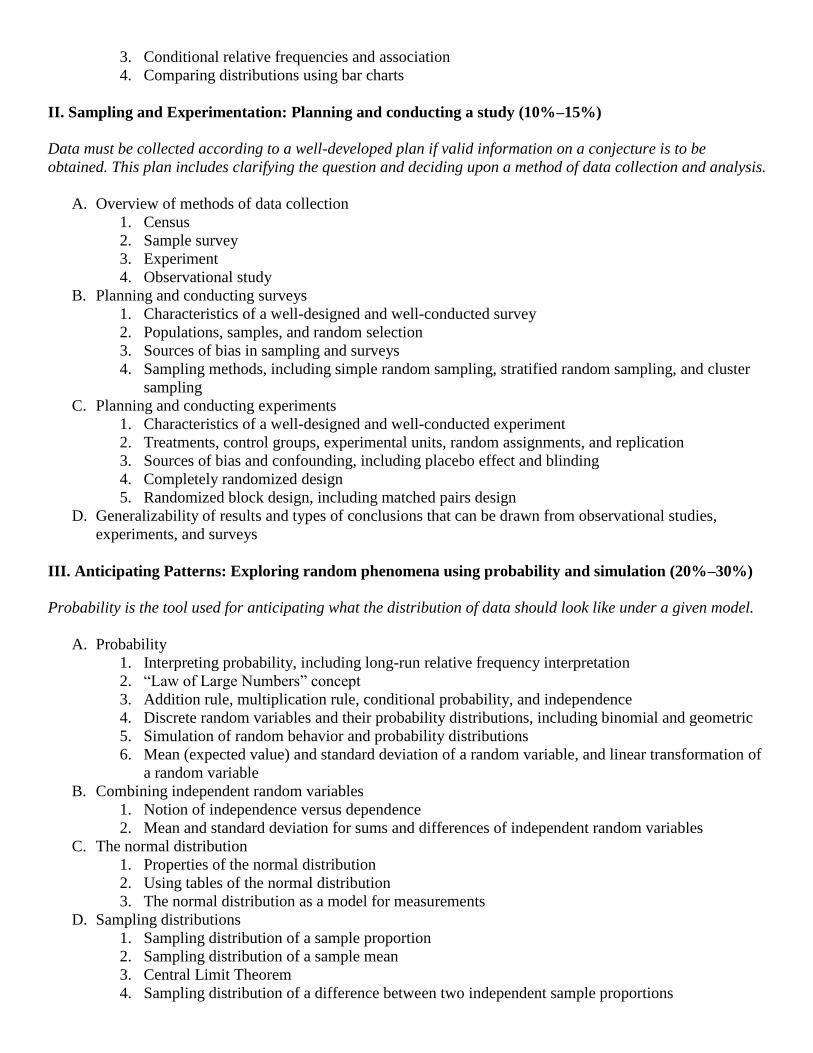
4. Comparing distributions using bar charts
II. Sampling and Experimentation: Planning and conducting a study (10%–15%)
Data must be collected according to a well-developed plan if valid information on a conjecture is to be
obtained. This plan includes clarifying the question and deciding upon a method of data collection and analysis.
A. Overview of methods of data collection
1. Census
2. Sample survey
3. Experiment
4. Observational study
B. Planning and conducting surveys
1. Characteristics of a well-designed and well-conducted survey
2. Populations, samples, and random selection
3. Sources of bias in sampling and surveys
4. Sampling methods, including simple random sampling, stratified random sampling, and cluster
sampling
C. Planning and conducting experiments
1. Characteristics of a well-designed and well-conducted experiment
2. Treatments, control groups, experimental units, random assignments, and replication
3. Sources of bias and confounding, including placebo effect and blinding
4. Completely randomized design
5. Randomized block design, including matched pairs design
D. Generalizability of results and types of conclusions that can be drawn from observational studies,
experiments, and surveys
III. Anticipating Patterns: Exploring random phenomena using probability and simulation (20%–30%)
Probability is the tool used for anticipating what the distribution of data should look like under a given model.
A. Probability
1. Interpreting probability, including long-run relative frequency interpretation
2. “Law of Large Numbers” concept
3. Addition rule, multiplication rule, conditional probability, and independence
4. Discrete random variables and their probability distributions, including binomial and geometric
5. Simulation of random behavior and probability distributions
6. Mean (expected value) and standard deviation of a random variable, and linear transformation of
a random variable
B. Combining independent random variables
1. Notion of independence versus dependence
2. Mean and standard deviation for sums and differences of independent random variables
C. The normal distribution
1. Properties of the normal distribution
2. Using tables of the normal distribution
3. The normal distribution as a model for measurements
D. Sampling distributions
1. Sampling distribution of a sample proportion
2. Sampling distribution of a sample mean
3. Central Limit Theorem
4. Sampling distribution of a difference between two independent sample proportions
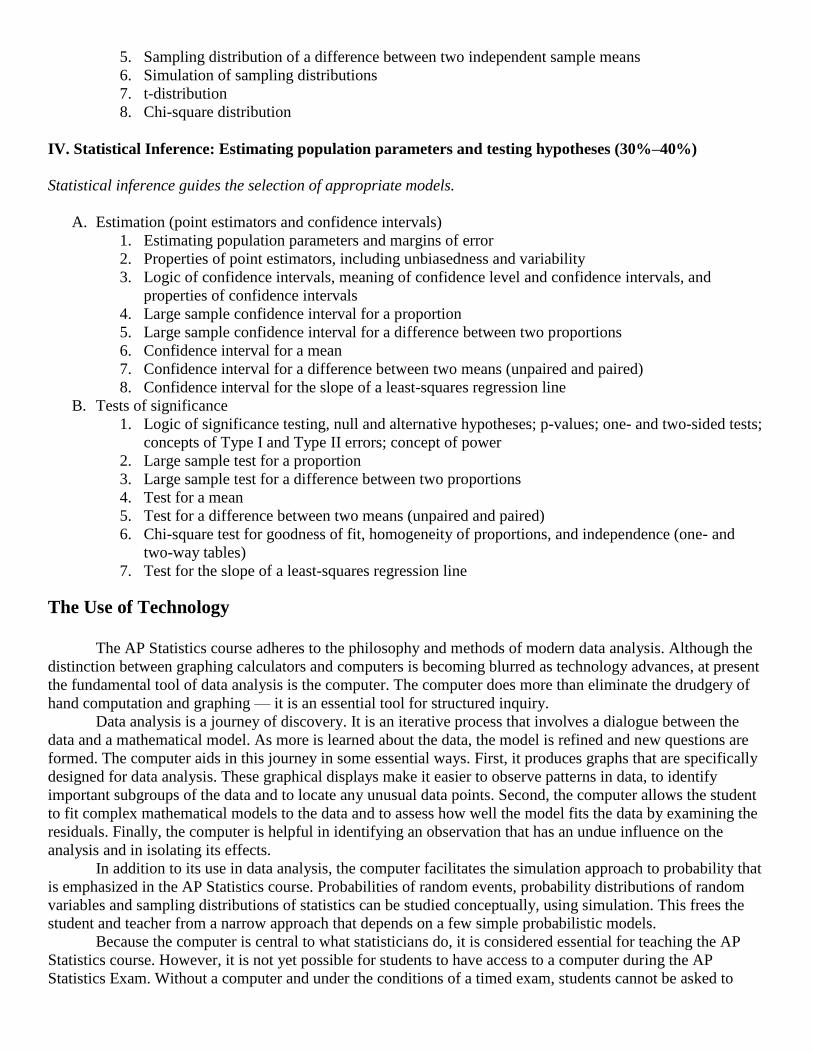
5. Sampling distribution of a difference between two independent sample means
6. Simulation of sampling distributions
7. t-distribution
8. Chi-square distribution
IV. Statistical Inference: Estimating population parameters and testing hypotheses (30%–40%)
Statistical inference guides the selection of appropriate models.
A. Estimation (point estimators and confidence intervals)
1. Estimating population parameters and margins of error
2. Properties of point estimators, including unbiasedness and variability
3. Logic of confidence intervals, meaning of confidence level and confidence intervals, and
properties of confidence intervals
4. Large sample confidence interval for a proportion
5. Large sample confidence interval for a difference between two proportions
6. Confidence interval for a mean
7. Confidence interval for a difference between two means (unpaired and paired)
8. Confidence interval for the slope of a least-squares regression line
B. Tests of significance
1. Logic of significance testing, null and alternative hypotheses; p-values; one- and two-sided tests;
concepts of Type I and Type II errors; concept of power
2. Large sample test for a proportion
3. Large sample test for a difference between two proportions
4. Test for a mean
5. Test for a difference between two means (unpaired and paired)
6. Chi-square test for goodness of fit, homogeneity of proportions, and independence (one- and
two-way tables)
7. Test for the slope of a least-squares regression line
The Use of Technology
The AP Statistics course adheres to the philosophy and methods of modern data analysis. Although the
distinction between graphing calculators and computers is becoming blurred as technology advances, at present
the fundamental tool of data analysis is the computer. The computer does more than eliminate the drudgery of
hand computation and graphing — it is an essential tool for structured inquiry.
Data analysis is a journey of discovery. It is an iterative process that involves a dialogue between the
data and a mathematical model. As more is learned about the data, the model is refined and new questions are
formed. The computer aids in this journey in some essential ways. First, it produces graphs that are specifically
designed for data analysis. These graphical displays make it easier to observe patterns in data, to identify
important subgroups of the data and to locate any unusual data points. Second, the computer allows the student
to fit complex mathematical models to the data and to assess how well the model fits the data by examining the
residuals. Finally, the computer is helpful in identifying an observation that has an undue influence on the
analysis and in isolating its effects.
In addition to its use in data analysis, the computer facilitates the simulation approach to probability that
is emphasized in the AP Statistics course. Probabilities of random events, probability distributions of random
variables and sampling distributions of statistics can be studied conceptually, using simulation. This frees the
student and teacher from a narrow approach that depends on a few simple probabilistic models.
Because the computer is central to what statisticians do, it is considered essential for teaching the AP
Statistics course. However, it is not yet possible for students to have access to a computer during the AP
Statistics Exam. Without a computer and under the conditions of a timed exam, students cannot be asked to
perform the amount of computation that is needed for many statistical investigations. Consequently, standard
computer output will be provided as necessary and students will be expected to interpret it.
Currently, the graphing calculator is the only computational aid that is available to students for use as a
tool for data analysis on the AP Exam.
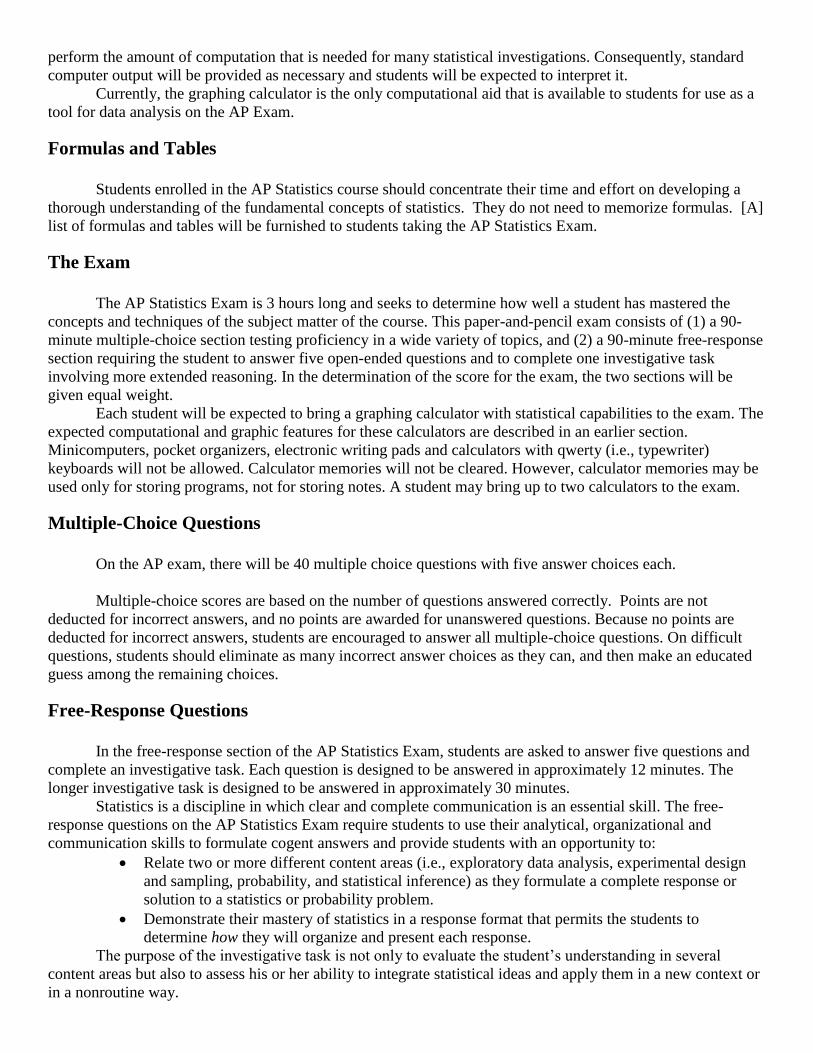
Formulas and Tables
Students enrolled in the AP Statistics course should concentrate their time and effort on developing a
thorough understanding of the fundamental concepts of statistics. They do not need to memorize formulas. [A]
list of formulas and tables will be furnished to students taking the AP Statistics Exam.
The Exam
The AP Statistics Exam is 3 hours long and seeks to determine how well a student has mastered the
concepts and techniques of the subject matter of the course. This paper-and-pencil exam consists of (1) a 90-
minute multiple-choice section testing proficiency in a wide variety of topics, and (2) a 90-minute free-response
section requiring the student to answer five open-ended questions and to complete one investigative task
involving more extended reasoning. In the determination of the score for the exam, the two sections will be
given equal weight.
Each student will be expected to bring a graphing calculator with statistical capabilities to the exam. The
expected computational and graphic features for these calculators are described in an earlier section.
Minicomputers, pocket organizers, electronic writing pads and calculators with qwerty (i.e., typewriter)
keyboards will not be allowed. Calculator memories will not be cleared. However, calculator memories may be
used only for storing programs, not for storing notes. A student may bring up to two calculators to the exam.
Multiple-Choice Questions
On the AP exam, there will be 40 multiple choice questions with five answer choices each.
Multiple-choice scores are based on the number of questions answered correctly. Points are not
deducted for incorrect answers, and no points are awarded for unanswered questions. Because no points are
deducted for incorrect answers, students are encouraged to answer all multiple-choice questions. On difficult
questions, students should eliminate as many incorrect answer choices as they can, and then make an educated
guess among the remaining choices.
Free-Response Questions
In the free-response section of the AP Statistics Exam, students are asked to answer five questions and
complete an investigative task. Each question is designed to be answered in approximately 12 minutes. The
longer investigative task is designed to be answered in approximately 30 minutes.
Statistics is a discipline in which clear and complete communication is an essential skill. The free-
response questions on the AP Statistics Exam require students to use their analytical, organizational and
communication skills to formulate cogent answers and provide students with an opportunity to:
Relate two or more different content areas (i.e., exploratory data analysis, experimental design
and sampling, probability, and statistical inference) as they formulate a complete response or
solution to a statistics or probability problem.
Demonstrate their mastery of statistics in a response format that permits the students to
determine how they will organize and present each response.
The purpose of the investigative task is not only to evaluate the student’s understanding in several
content areas but also to assess his or her ability to integrate statistical ideas and apply them in a new context or
in a nonroutine way.
Scoring of Free-Response Questions
The evaluation of student responses on the free-response section of the AP Statistics Exam reflects the
dual importance of statistical knowledge and good communication. The free-response questions and the
investigative task are scored “holistically”; that is, each question’s response is evaluated as “a complete
package.” With holistic scoring, after reading through the details of a student’s response, the scorer makes a
judgment about the overall quality of the response. This is different from “analytic” scoring, where the
individual components to be evaluated in a student’s response are specified in advance, and each component is
given a value counting toward the overall score.
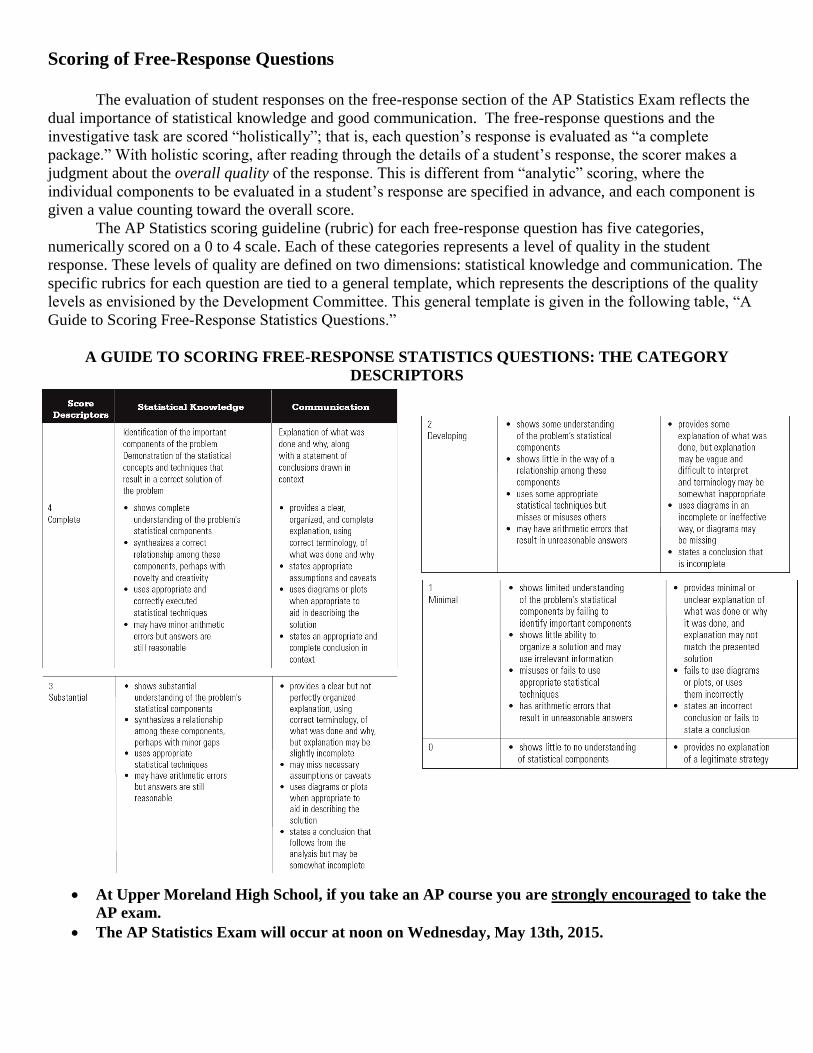
The AP Statistics scoring guideline (rubric) for each free-response question has five categories,
numerically scored on a 0 to 4 scale. Each of these categories represents a level of quality in the student
response. These levels of quality are defined on two dimensions: statistical knowledge and communication. The
specific rubrics for each question are tied to a general template, which represents the descriptions of the quality
levels as envisioned by the Development Committee. This general template is given in the following table, “A
Guide to Scoring Free-Response Statistics Questions.”
A GUIDE TO SCORING FREE-RESPONSE STATISTICS QUESTIONS: THE CATEGORY
DESCRIPTORS
At Upper Moreland High School, if you take an AP course you are strongly encouraged to take the
AP exam.
The AP Statistics Exam will occur at noon on Wednesday, May 13th, 2015.
QUESTIONS
1) Name the four main content areas in AP Statistics and next to each, place the percentage of the exam that
corresponds to that area
a)
b)
c)
d)
2) The AP Statistics exam is ___ hours long, in total.
3) 50% of your score on the exam comes from the __________________ section and the remaining 50% comes
from the _____________________ section.
4) There are ____ multiple choice questions and you have ___ minutes to complete them.
5) There are ___ standard free response questions followed by a larger free response question, called the
_________________________.
6) True or False: Formulas are provided for you on the AP exam. TRUE FALSE
7) Free responses questions are scored out of __ points.
8) True or False: It is possible to receive full credit on a free response question if a minor mathematical error is
present in your response. TRUE FALSE
9) True or False: There is a ¼ point penalty for each incorrect multiple choice answer given. TRUE FALSE
10) True or False: AP Statistics is a calculus-based course. TRUE FALSE
11) True or False: Students are expected to know how to read and interpret computer output on the AP
Statistics exam. TRUE FALSE
12) The fee to take an AP exam is $ ___.
13) True or False: Calculator programs are allowed on the AP Statistics exam. TRUE FALSE