Embed Size (px)
Citation preview
Copyright © 2017 National Math + Science Initiative, Dallas, Texas. All rights reserved. Visit us online at www.nms.org
AP Statistics
Normal Distributions & Sampling Distributions
Student Handout
2017-2018 EDITION

Copyright © 2017 National Math + Science Initiative, Dallas, Texas. All rights reserved. Visit us online at www.nms.org 1
Normal Distributions & Sampling Distributions
A free response question dealing with the normal distributions or sampling distributions will
expect calculation work shown AND the context of the prompt included in your answer.
Reminders about content and communication:
• Always show work for any calculations.
• Always include the context of the prompt in your answer
• Using and showing the formula for a normal calculation will always earn credit.
• When using calculator speak, all parameters must be clearly identified.
• A sketch of the normal curve with the appropriate values clearly labeled and shading of the
relevant area may be counted as some work. Most important, a sketch will keep you focused
on the correct direction and area of concern in the problem.
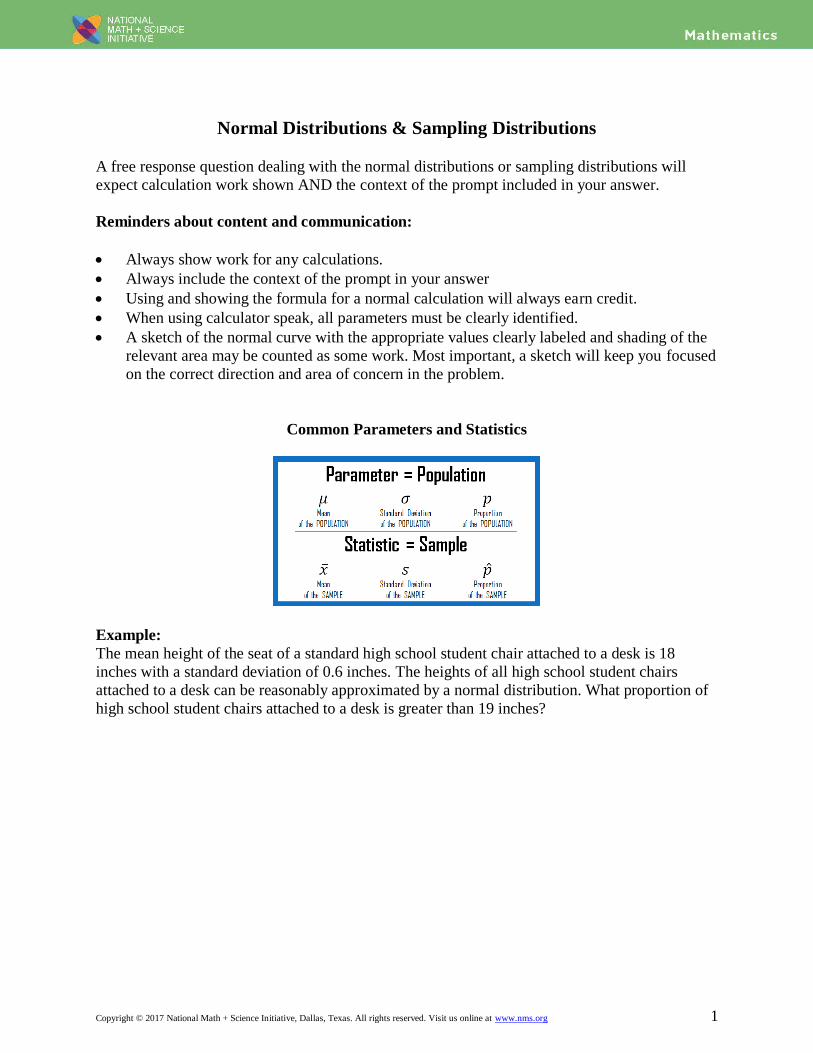
Common Parameters and Statistics
Example:
The mean height of the seat of a standard high school student chair attached to a desk is 18
inches with a standard deviation of 0.6 inches. The heights of all high school student chairs
attached to a desk can be reasonably approximated by a normal distribution. What proportion of
high school student chairs attached to a desk is greater than 19 inches?
2 Copyright © 2017 National Math + Science Initiative, Dallas, Texas. All rights reserved. Visit us online at www.nms.org
Sample Problems Group 1
A) The mean weight of a domestic house cat is 8.9 pounds with a standard deviation of 1.1
pounds. The distribution of domestic house cat weights can reasonably be approximated by a
normal distribution. What proportion of domestic house cats weigh less than 7 pounds?
B) The number of minutes students arrive at Loy Norrix High School before the first class begins
is approximately normally distributed with a mean of 20 minutes and a standard deviation of 8
minutes. What proportion of students arrive at Loy Norrix High School at least 30 minutes
before the first class begins?
C) A sloth is the world’s slowest mammal and appears to be sleeping much of the time. But in
reality, wild sloths sleep a mean of 9 hours each day with a standard deviation of 0.4 hours.
Sleep times may be approximated by a normal distribution. What proportion of sloths sleep
between 8 and 8.5 hours like human children? (Fun fact: ancient sloths could grow as big
as elephants.)
Copyright © 2017 National Math + Science Initiative, Dallas, Texas. All rights reserved. Visit us online at www.nms.org 3
Sample Problems Group 2
A) An article in a health magazine suggested getting a dog to encourage more regular walking. A
researcher for the article found that the distribution of time spent walking dogs was
approximately normally distributed with a mean of 38 minutes per day. However, he also found
that 13% of dog owners walk their dogs for less than 20 minutes per day. What is the standard
deviation of the time, in minutes, dog owners walk their dog per day?
B) Bolivian adult females are much shorter than U.S. females although the standard deviation of
their heights is about the same at 2.3 inches. Only 4.1% of Bolivian females are at least five feet
tall (60 inches). What is the mean height of adult Bolivian women assuming their heights are
approximately normally distributed?
C) The speeds cars travel on the Highway 183 toll road are normally distributed with a mean of
71 mph. The actual posted speed limit is 75mph, however at least 25% of the cars at any given
time are traveling faster than the limit. What is the standard deviation of the speeds cars travel on
Highway 183?
4 Copyright © 2017 National Math + Science Initiative, Dallas, Texas. All rights reserved. Visit us online at www.nms.org
Sample Problems Group 3
A) The distribution of the number of gallons of water used for taking a shower in the United
States is skewed right. Some people take long showers using as much as 63 gallons compared to
the average of 17.2 gallons. A conservationist is interested in the mean number of gallons of
water used in college apartments housing 4 students. Assuming a standard deviation of 4.2
gallons for all US showers, what is the probability that a random sample of 30 college student
showers will have a mean water usage of more than 19 gallons of water?
B) According to Greenpeace, 80% of all pollination is performed by bees. Biologists across the
country randomly select a total of 60 plants to be monitored by camera to determine how they
are pollinated. What is the probability that less than 75% of the monitored plants are pollinated
by bees? (We know! Randomly selecting 60 plants from around the country would be tough but
let's go with it.)
C) The owner of Nikki's Nitch, a café specializing in locally grown food, is interested in how
much time it takes to close down the restaurant after the last customer leaves. Her data over the
last few years shows that the mean is 52 minutes with a standard deviation of 5 minutes. An
employee believes that the mean time for closing is now more than an hour. He randomly selects
35 days and records the closing times. If the mean time for closing is 52 minutes, what is the
probability the mean closing time for his sample is more than 60 minutes?
Copyright © 2017 National Math + Science Initiative, Dallas, Texas. All rights reserved. Visit us online at www.nms.org 5
Multiple Choice Questions
1. Lauren is enrolled in a very large college calculus class. On the first exam, the class mean was
75 and the standard deviation was 10. On the second exam, the class mean was 70 and the
standard deviation was 15. Lauren scored 85 on both exams. Assuming the scores on each
exam were approximately normally distributed, on which exam did Lauren score better
relative to the rest of the class?
A) She scored much better on the first exam.
B) She scored much better on the second exam.
C) She scored about equally well on both exams.
D) It is impossible to tell because the class size is not given.
E) It is impossible to tell because the correlation between the two sets of exam scores is not
given.
2. Let X represent a random variable whose distribution is normal, with a mean of 100 and a
standard deviation of 10. Which of the following is equivalent to P(X > 115)?
A) P(X < 115)
B) P(X 115)
C) P(X < 85)
D) P(85 < X < 115)
E) 1 P(X < 85)
3. The heights of a population of adult male red kangaroos are approximately normally
distributed with a mean height of 1.20 meters and a standard deviation of 0.10 meters. The
heights of a population of adult male grey kangaroos are approximately normally distributed
with a mean height of 1.75 meters and a standard deviation of 0.25 meters. A certain adult
male grey kangaroo is 2.15 meters tall. This kangaroo would have the same standardized
height (z-score) as an adult male red kangaroo whose height, in meters, is equal to which of
the following?
A. 1.08
B. 1.20
C. 1.30
D. 1.36
E. 1.45
6 Copyright © 2017 National Math + Science Initiative, Dallas, Texas. All rights reserved. Visit us online at www.nms.org
4. The distribution of heights of a simple random sample of 400 young children is
approximately normal and produced the following summary statistics.
Mean 47 inches
Median 47 inches
Standard deviation 2 inches
First Quartile 45.7 inches
Third Quartile 48.3 inches
Which of the following statements is false?
A) About 64 children in the sample have heights that are greater than 49 inches.
B) About 200 children in the sample have heights that are between 45 and 49 inches.
C) About 200 children in the sample have heights that are greater than 47 inches.
D) About 336 children in the sample have heights that are greater than 45 inches.
E) About 380 children in the sample have heights that are between 43 and 51 inches
5. Suppose the distribution of weights of adult dogs of a particular breed is strongly skewed
right with a mean of 15 pounds and a standard deviation of 4 pounds. Describe the sampling
distribution of sample means for a random sample of 40 dogs from the population.
A) The sampling distribution will be strongly skewed right with a mean of 15 pounds and a
standard deviation of 4 pounds.
B) The sampling distribution will be strongly skewed right with a mean of 15 pounds and a
standard deviation of 0.632 pounds.
C) The sampling distribution will be approximately normally distributed with a mean of 15
pounds and standard deviation of 4 pounds.
D) The sampling distribution will be approximately normally distributed with a mean of 15
pounds and standard deviation of 0.1 pounds.
E) The sampling distribution will be approximately normally distributed with a mean of 15
pounds and standard deviation of 0.632 pounds.
6. Forty-five percent of households in a large metropolitan area have at least one pet. What is
the approximate probability of obtaining a random sample of 100 households in the area, in
which 35 or less have at least one pet?
A) 0.011
B) 0.018
C) 0.022
D) 0.978
E) 0.982
Copyright © 2017 National Math + Science Initiative, Dallas, Texas. All rights reserved. Visit us online at www.nms.org 7
7. The distribution of the diameters of a particular variety of cantaloupe is approximately
normal with a standard deviation of 0.7 inches. If the diameter of a cantaloupe is at the 73rd
percentile, how does this diameter compare to the mean?
A) 0.511 inches below the mean
B) 0.429 inches below the mean
C) 0.511 inches above the mean
D) 0.429 inches above the mean
E) 0.610 inches above the mean
8. The weights of adult male Chinook salmon caught in the rivers along the western coast of
Washington are normally distributed with a mean of 25 kilograms and standard deviation 8
kilograms. Suppose regulations require that only 3 salmon can be caught per day by any one
fisherman. Assuming that on his next trip Jim catches three salmon, what is the approximate
probability that the average weight of the fish on his stringer is at least 30 kilograms?
A) 0.03
B) 0.14
C) 0.27
D) 0.41
E) 0.45
9. Suppose that public opinion in a large city is 72 percent in favor of allowing a large recycling
plant to be constructed using taxpayer funds and 28 percent against such a build. If a random
sample of 300 people from this city is interviewed, what is the approximate probability that
more than 100 of these people will be against increasing taxes?
A. 100 200
300(0.72) (0.28)
100
D. 0.33 0.28
(0.33)(0.67)
300
P z
B. 100 200
300(0.28) (0.72)
100
E. 0.33 0.28
(0.28)(0.72)
300
P z
C. 0.33 0.72
(0.72)(0.28)
300
P z
8 Copyright © 2017 National Math + Science Initiative, Dallas, Texas. All rights reserved. Visit us online at www.nms.org
10. The heights of mature maple trees are approximately normally distributed with a mean of 80
feet and standard deviation 12.5 feet. What proportion of mature maple trees are between 65
and 90 feet tall?
A) 0.1151
B) 0.2119
C) 0.6731
D) 0.7881
E) 0.8849
11. Golf balls must meet a certain standard of distance traveled in order to be used in a
professional tournament. When the ball is hit by a mechanical device, under specific
calibration, the ball may not travel farther than 291.2 yards in the air. From past data, a
certain manufacturer has determined that the distances traveled for the balls it produces are
normally distributed with a mean of 290 yards. What standard deviation, in yards, should the
manufacturer require if they want 99% of balls they manufacture to meet the tournament
standard?
A) 0.47
B) 0.52
C) 0.94
D) 1.04
E) 1.20
Copyright © 2017 National Math + Science Initiative, Dallas, Texas. All rights reserved. Visit us online at www.nms.org 9
Free Response
1. Trucks carry barrels of crude oil from a port in Texas to a distributer in New Mexico on long
trailers. Filling equipment is used to fill the barrels with the oil. When functioning properly,
the actual volume of oil loaded into each barrel by the filling equipment at the port is
approximately normally distributed with a mean of 55 gallons and a standard deviation of 0.5
gallons. If the mean is greater than 55.4 gallons, the filling mechanism is overfilling.
(a) If the filling equipment is functioning properly, what is the probability that the volume of
oil in a randomly selected barrel will be 55.4 gallons or more? Show your work.
(b) Suppose that the volume of oil in a randomly selected barrel is 55.4 gallons. Would that
fact make you suspect that the filling mechanism is overfilling the barrels? Justify your
answer.
(c) If the filling equipment is functioning properly, what is the probability that a random
sample of 15 barrels have a mean volume of 55.4 gallons or more? Show your work.
(d) Based on your answer in part (c), if a random sample of 15 barrels had a mean oil volume
55.4 gallons, would you suspect that the filling mechanism was overfilling the barrels?
Justify your answer.
10 Copyright © 2017 National Math + Science Initiative, Dallas, Texas. All rights reserved. Visit us online at www.nms.org
2. A local radio station plays 40 rock-and-roll songs during each 4-hour show. The program
director at the station needs to know the total amount of airtime for the 40 songs so that time
can also be programmed during the show for news and advertisements. The distribution of
the lengths of rock-and-roll songs, in minutes, is roughly symmetric with a mean length of
3.9 minutes and a standard deviation of 1.1 minutes.
(a) Describe the sampling distribution of the sample mean song lengths for random samples
of 40 rock-and-roll songs.
(b) If the program manager schedules 80 minutes of news and advertisements for the 4-hour
(240-minute) show, only 160 minutes are available for music. Approximately what is the
probability that the total amount of time needed to play 40 randomly selected
rock-and-roll songs exceeds the available airtime?
Copyright © 2017 National Math + Science Initiative, Dallas, Texas. All rights reserved. Visit us online at www.nms.org 11
Normal Distribution & Sampling Distribution Notes
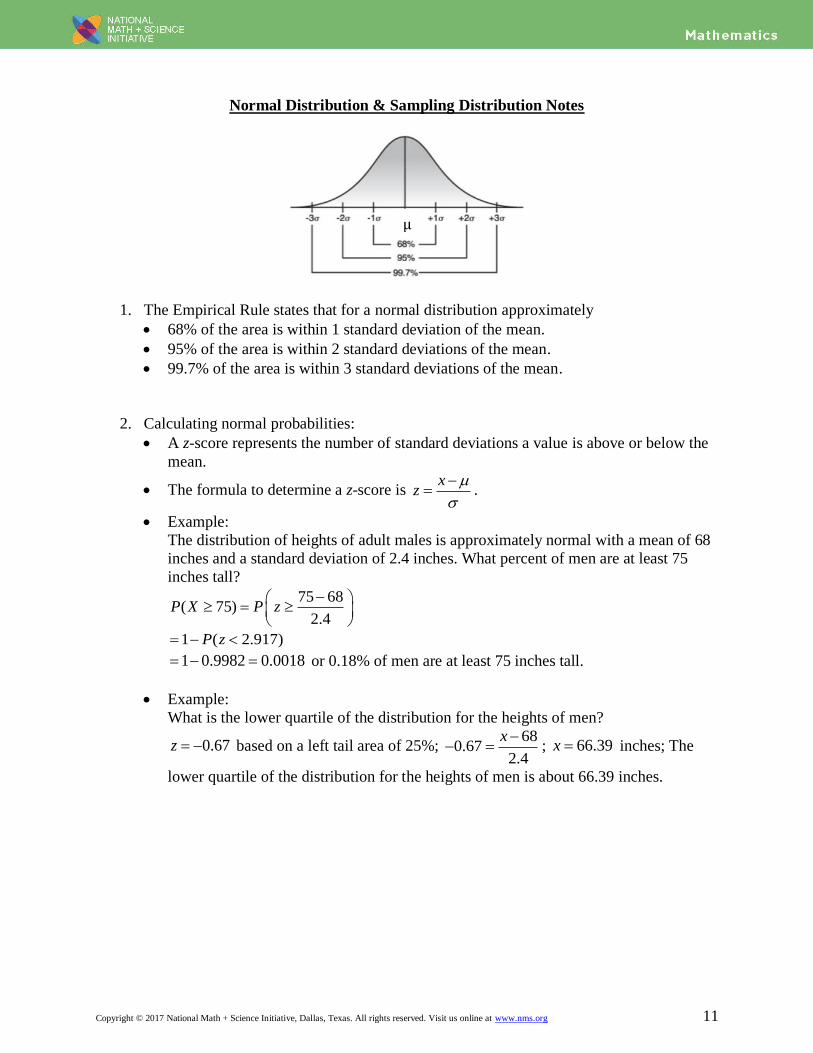
1. The Empirical Rule states that for a normal distribution approximately
• 68% of the area is within 1 standard deviation of the mean.
• 95% of the area is within 2 standard deviations of the mean.
• 99.7% of the area is within 3 standard deviations of the mean.
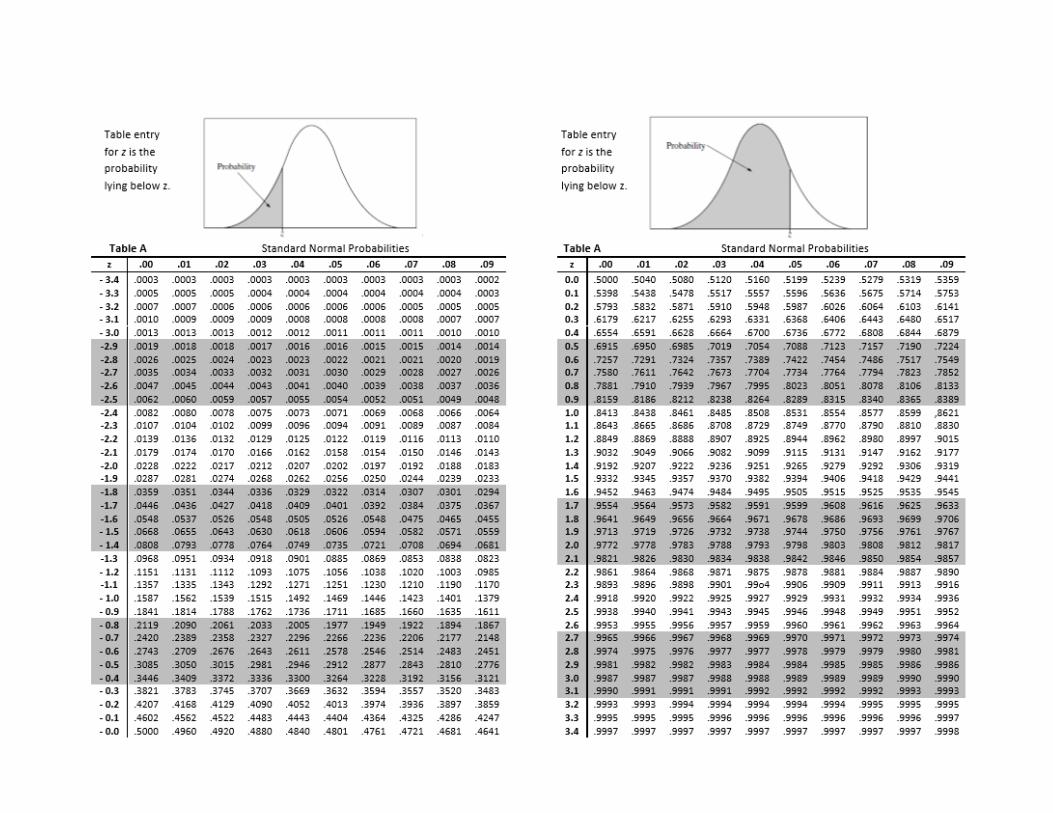
2. Calculating normal probabilities:
• A z-score represents the number of standard deviations a value is above or below the
mean.
• The formula to determine a z-score is x
z
.
• Example:
The distribution of heights of adult males is approximately normal with a mean of 68
inches and a standard deviation of 2.4 inches. What percent of men are at least 75
inches tall?
75 68( 75)
2.4P X P z
1 ( 2.917)P z
1 0.9982 0.0018 or 0.18% of men are at least 75 inches tall.
• Example:
What is the lower quartile of the distribution for the heights of men?
0.67z based on a left tail area of 25%; 68
0.672.4
x ; 66.39x inches; The
lower quartile of the distribution for the heights of men is about 66.39 inches.
µ
12 Copyright © 2017 National Math + Science Initiative, Dallas, Texas. All rights reserved. Visit us online at www.nms.org
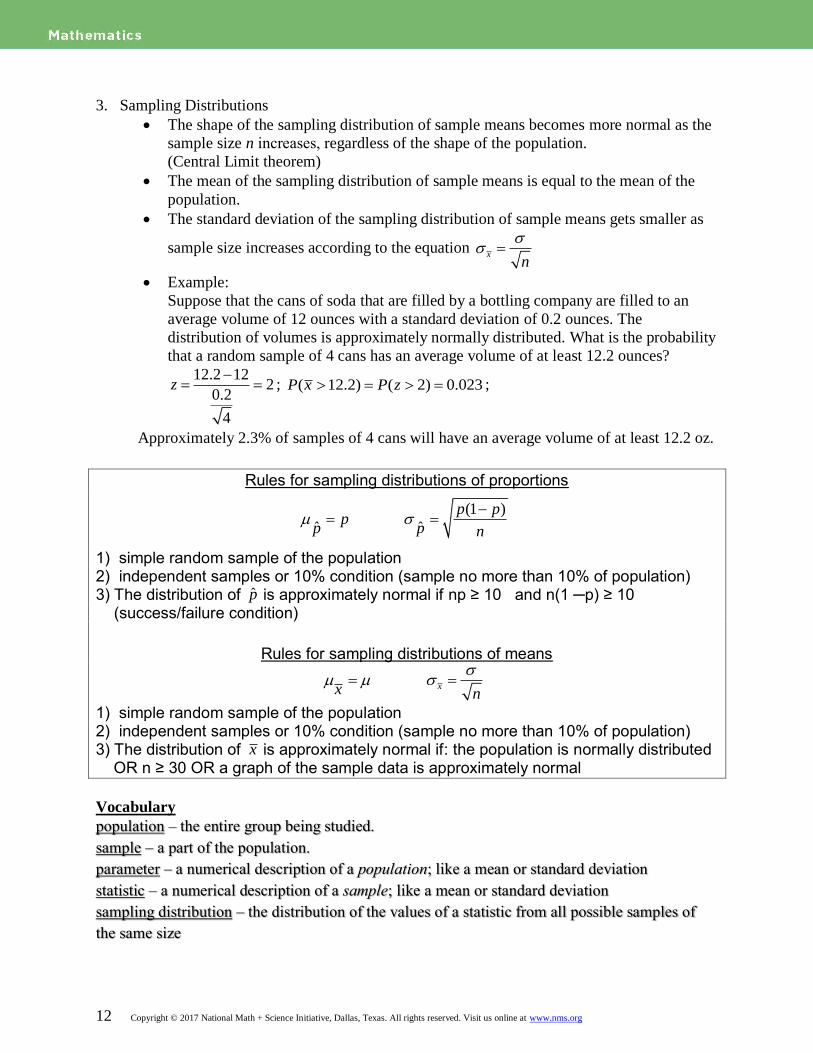
3. Sampling Distributions
• The shape of the sampling distribution of sample means becomes more normal as the
sample size n increases, regardless of the shape of the population.
(Central Limit theorem)
• The mean of the sampling distribution of sample means is equal to the mean of the
population.
• The standard deviation of the sampling distribution of sample means gets smaller as
sample size increases according to the equation x
n
• Example:
Suppose that the cans of soda that are filled by a bottling company are filled to an
average volume of 12 ounces with a standard deviation of 0.2 ounces. The
distribution of volumes is approximately normally distributed. What is the probability
that a random sample of 4 cans has an average volume of at least 12.2 ounces?
12.2 122
0.2
4
z
; ( 12.2) ( 2) 0.023P x P z ;
Approximately 2.3% of samples of 4 cans will have an average volume of at least 12.2 oz.
Rules for sampling distributions of proportions
1) simple random sample of the population
2) independent samples or 10% condition (sample no more than 10% of population)
3) The distribution of is approximately normal if np ≥ 10 and n(1 ─p) ≥ 10 (success/failure condition)
Rules for sampling distributions of means
1) simple random sample of the population
2) independent samples or 10% condition (sample no more than 10% of population)
3) The distribution of is approximately normal if: the population is normally distributed OR n ≥ 30 OR a graph of the sample data is approximately normal
Vocabulary
population – the entire group being studied.
sample – a part of the population.
parameter – a numerical description of a population; like a mean or standard deviation
statistic – a numerical description of a sample; like a mean or standard deviation
sampling distribution – the distribution of the values of a statistic from all possible samples of
the same size
p̂
(1 )
ˆ ˆ
p pp
p p n
x
xx n
Copyright © 2016 National Math + Science Initiative, Dallas, Texas. All rights reserved. Visit us online at www.nms.org