Embed Size (px)
Citation preview
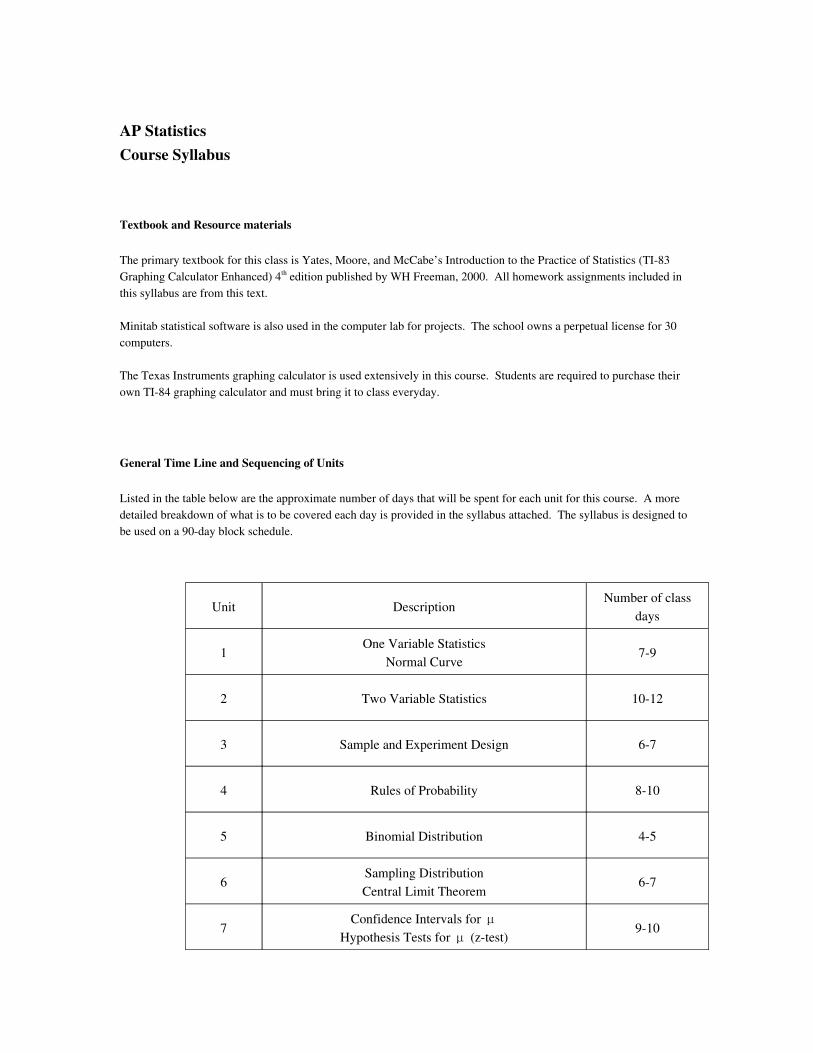
AP StatisticsCourse Syllabus
Textbook and Resource materials
The primary textbook for this class is Yates, Moore, and McCabe’s Introduction to the Practice of Statistics (TI83 Graphing Calculator Enhanced) 4th edition published by WH Freeman, 2000. All homework assignments included in this syllabus are from this text.
Minitab statistical software is also used in the computer lab for projects. The school owns a perpetual license for 30 computers.
The Texas Instruments graphing calculator is used extensively in this course. Students are required to purchase their own TI84 graphing calculator and must bring it to class everyday.
General Time Line and Sequencing of Units
Listed in the table below are the approximate number of days that will be spent for each unit for this course. A more detailed breakdown of what is to be covered each day is provided in the syllabus attached. The syllabus is designed to be used on a 90day block schedule.
Unit DescriptionNumber of class
days
1One Variable Statistics
Normal Curve79
2 Two Variable Statistics 1012
3 Sample and Experiment Design 67
4 Rules of Probability 810
5 Binomial Distribution 45
6Sampling DistributionCentral Limit Theorem
67
7Confidence Intervals for μ
Hypothesis Tests for (ztest)μ910
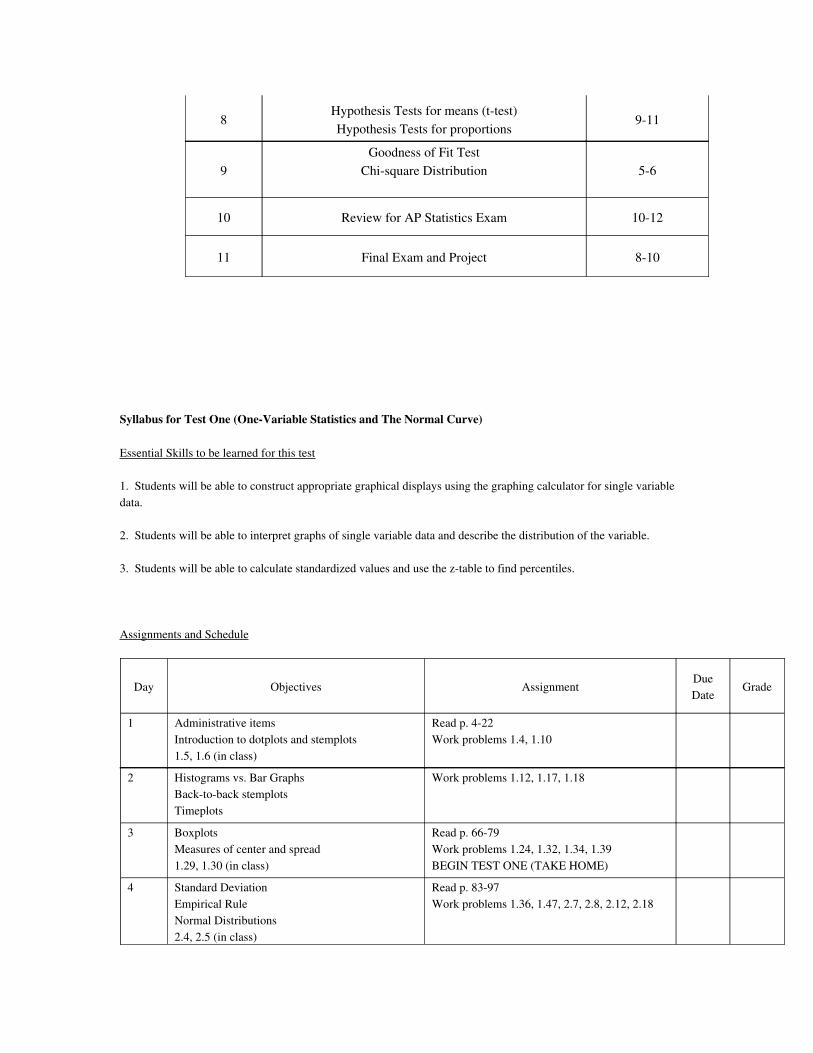
8Hypothesis Tests for means (ttest)Hypothesis Tests for proportions
911
9Goodness of Fit Test
Chisquare Distribution 56
10 Review for AP Statistics Exam 1012
11 Final Exam and Project 810
Syllabus for Test One (OneVariable Statistics and The Normal Curve)
Essential Skills to be learned for this test
1. Students will be able to construct appropriate graphical displays using the graphing calculator for single variable data.
2. Students will be able to interpret graphs of single variable data and describe the distribution of the variable.
3. Students will be able to calculate standardized values and use the ztable to find percentiles.
Assignments and Schedule
Day Objectives Assignment Due Date Grade
1 Administrative items Introduction to dotplots and stemplots1.5, 1.6 (in class)
Read p. 422Work problems 1.4, 1.10
2 Histograms vs. Bar GraphsBacktoback stemplots Timeplots
Work problems 1.12, 1.17, 1.18
3 BoxplotsMeasures of center and spread1.29, 1.30 (in class)
Read p. 6679Work problems 1.24, 1.32, 1.34, 1.39BEGIN TEST ONE (TAKE HOME)
4 Standard DeviationEmpirical RuleNormal Distributions2.4, 2.5 (in class)
Read p. 8397Work problems 1.36, 1.47, 2.7, 2.8, 2.12, 2.18
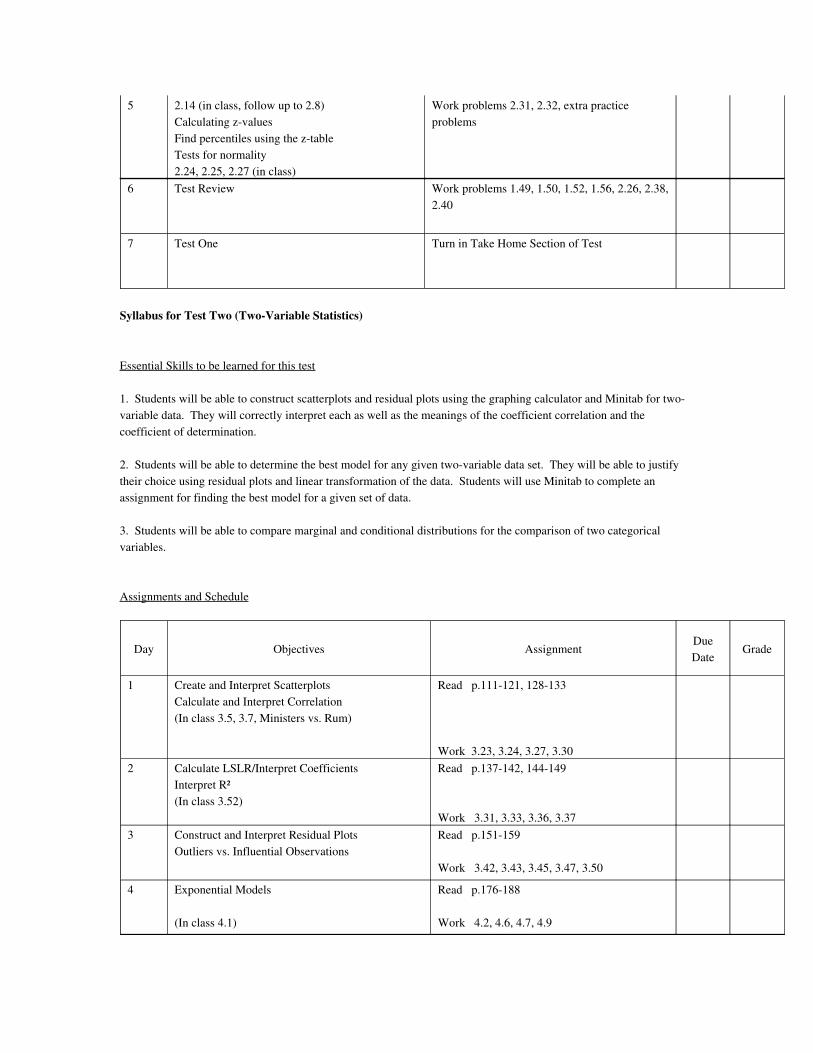
5 2.14 (in class, follow up to 2.8)Calculating zvaluesFind percentiles using the ztableTests for normality2.24, 2.25, 2.27 (in class)
Work problems 2.31, 2.32, extra practice problems
6 Test Review Work problems 1.49, 1.50, 1.52, 1.56, 2.26, 2.38, 2.40
7 Test One Turn in Take Home Section of Test
Syllabus for Test Two (TwoVariable Statistics)
Essential Skills to be learned for this test
1. Students will be able to construct scatterplots and residual plots using the graphing calculator and Minitab for twovariable data. They will correctly interpret each as well as the meanings of the coefficient correlation and the coefficient of determination.
2. Students will be able to determine the best model for any given twovariable data set. They will be able to justify their choice using residual plots and linear transformation of the data. Students will use Minitab to complete an assignment for finding the best model for a given set of data.
3. Students will be able to compare marginal and conditional distributions for the comparison of two categorical variables.
Assignments and Schedule
Day Objectives Assignment Due Date Grade
1 Create and Interpret ScatterplotsCalculate and Interpret Correlation(In class 3.5, 3.7, Ministers vs. Rum)
Read p.111121, 128133
Work 3.23, 3.24, 3.27, 3.302 Calculate LSLR/Interpret Coefficients
Interpret R²(In class 3.52)
Read p.137142, 144149
Work 3.31, 3.33, 3.36, 3.373 Construct and Interpret Residual Plots
Outliers vs. Influential ObservationsRead p.151159
Work 3.42, 3.43, 3.45, 3.47, 3.50
4 Exponential Models
(In class 4.1)
Read p.176188
Work 4.2, 4.6, 4.7, 4.9
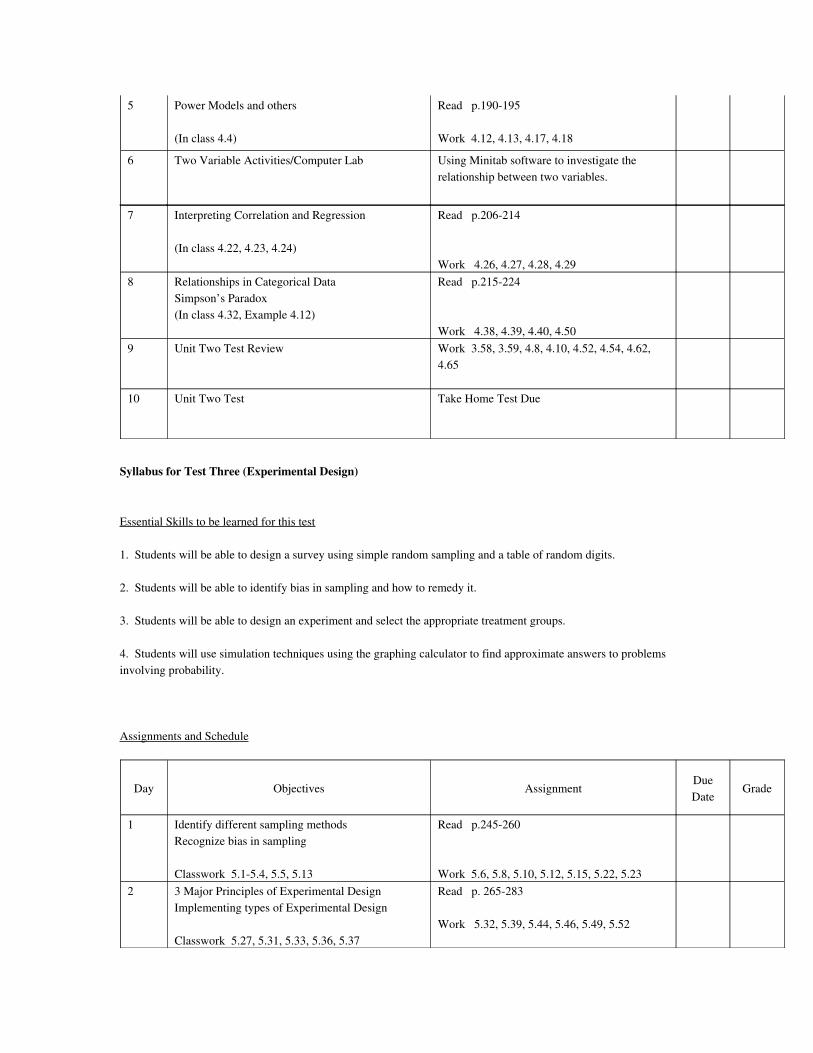
5 Power Models and others
(In class 4.4)
Read p.190195
Work 4.12, 4.13, 4.17, 4.18
6 Two Variable Activities/Computer Lab Using Minitab software to investigate therelationship between two variables.
7 Interpreting Correlation and Regression
(In class 4.22, 4.23, 4.24)
Read p.206214
Work 4.26, 4.27, 4.28, 4.298 Relationships in Categorical Data
Simpson’s Paradox(In class 4.32, Example 4.12)
Read p.215224
Work 4.38, 4.39, 4.40, 4.509 Unit Two Test Review Work 3.58, 3.59, 4.8, 4.10, 4.52, 4.54, 4.62,
4.65
10 Unit Two Test Take Home Test Due
Syllabus for Test Three (Experimental Design)
Essential Skills to be learned for this test
1. Students will be able to design a survey using simple random sampling and a table of random digits.
2. Students will be able to identify bias in sampling and how to remedy it.
3. Students will be able to design an experiment and select the appropriate treatment groups.
4. Students will use simulation techniques using the graphing calculator to find approximate answers to problems involving probability.
Assignments and Schedule
Day Objectives Assignment Due Date Grade
1 Identify different sampling methodsRecognize bias in sampling
Classwork 5.15.4, 5.5, 5.13
Read p.245260
Work 5.6, 5.8, 5.10, 5.12, 5.15, 5.22, 5.232 3 Major Principles of Experimental Design
Implementing types of Experimental Design
Classwork 5.27, 5.31, 5.33, 5.36, 5.37
Read p. 265283
Work 5.32, 5.39, 5.44, 5.46, 5.49, 5.52
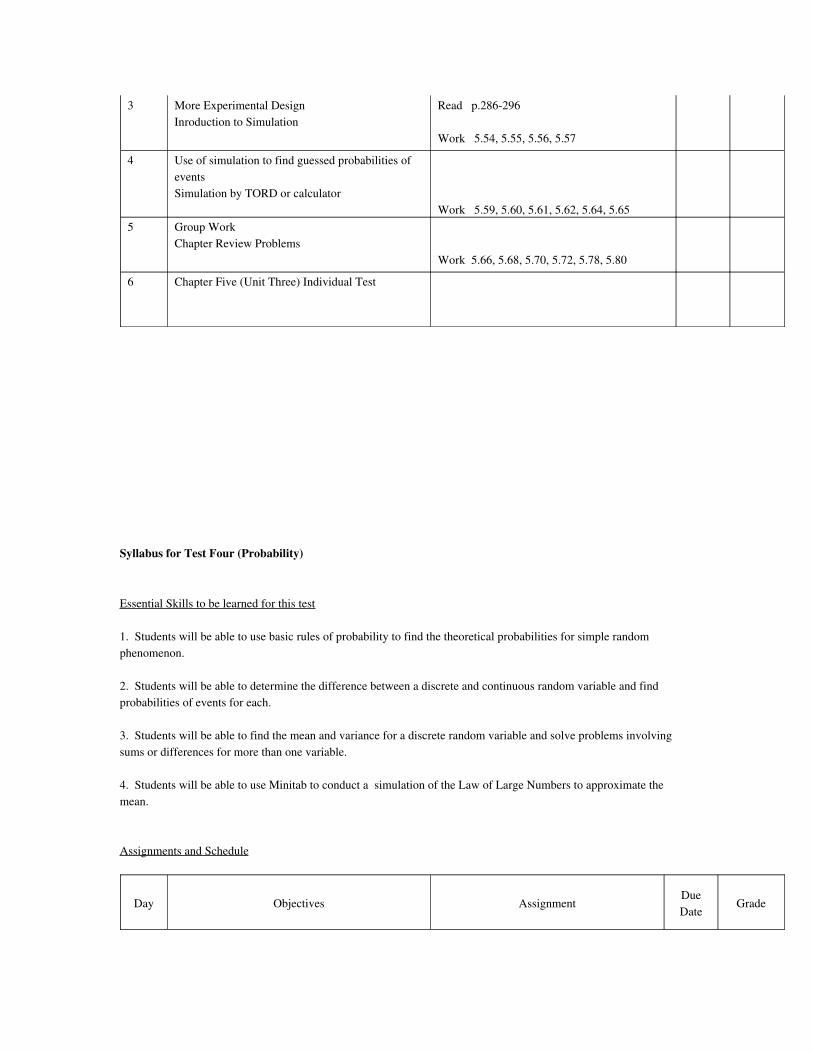
3 More Experimental DesignInroduction to Simulation
Read p.286296
Work 5.54, 5.55, 5.56, 5.57
4 Use of simulation to find guessed probabilities of eventsSimulation by TORD or calculator
Work 5.59, 5.60, 5.61, 5.62, 5.64, 5.655 Group Work
Chapter Review ProblemsWork 5.66, 5.68, 5.70, 5.72, 5.78, 5.80
6 Chapter Five (Unit Three) Individual Test
Syllabus for Test Four (Probability)
Essential Skills to be learned for this test
1. Students will be able to use basic rules of probability to find the theoretical probabilities for simple random phenomenon.
2. Students will be able to determine the difference between a discrete and continuous random variable and find probabilities of events for each.
3. Students will be able to find the mean and variance for a discrete random variable and solve problems involving sums or differences for more than one variable.
4. Students will be able to use Minitab to conduct a simulation of the Law of Large Numbers to approximate the mean.
Assignments and Schedule
Day Objectives Assignment Due Date Grade
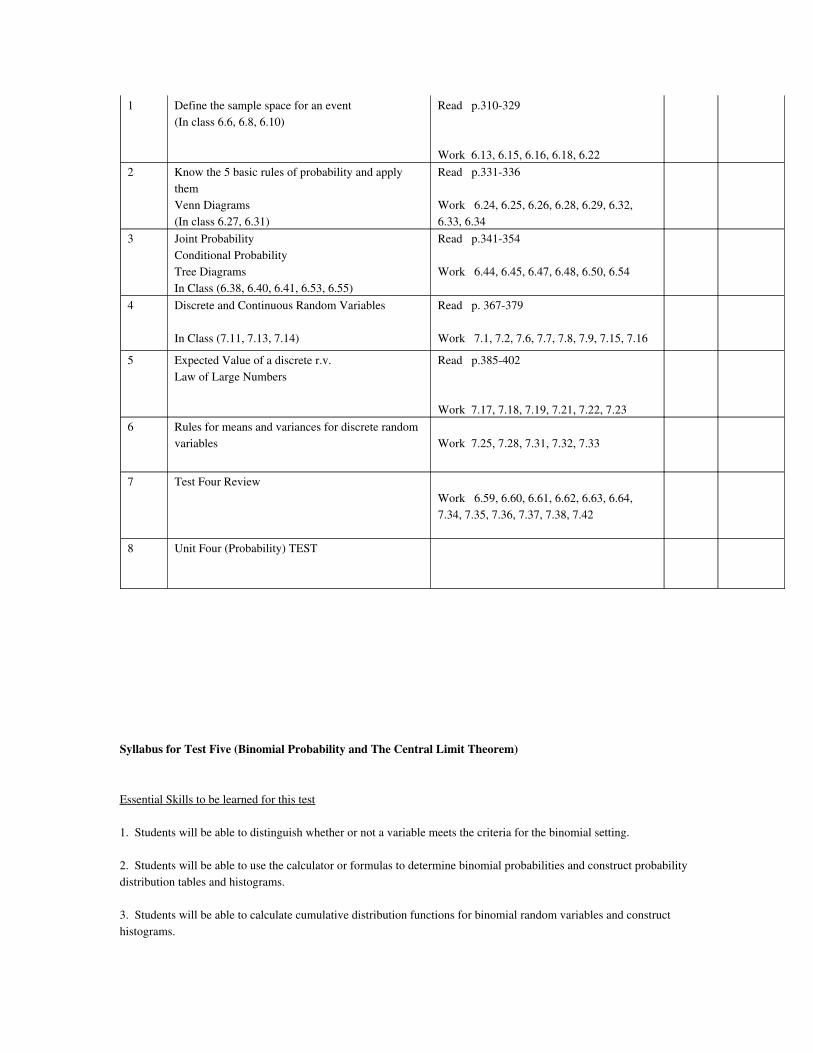
1 Define the sample space for an event(In class 6.6, 6.8, 6.10)
Read p.310329
Work 6.13, 6.15, 6.16, 6.18, 6.222 Know the 5 basic rules of probability and apply
themVenn Diagrams(In class 6.27, 6.31)
Read p.331336
Work 6.24, 6.25, 6.26, 6.28, 6.29, 6.32, 6.33, 6.34
3 Joint ProbabilityConditional Probability Tree DiagramsIn Class (6.38, 6.40, 6.41, 6.53, 6.55)
Read p.341354
Work 6.44, 6.45, 6.47, 6.48, 6.50, 6.54
4 Discrete and Continuous Random Variables
In Class (7.11, 7.13, 7.14)
Read p. 367379
Work 7.1, 7.2, 7.6, 7.7, 7.8, 7.9, 7.15, 7.16
5 Expected Value of a discrete r.v.Law of Large Numbers
Read p.385402
Work 7.17, 7.18, 7.19, 7.21, 7.22, 7.236 Rules for means and variances for discrete random
variables Work 7.25, 7.28, 7.31, 7.32, 7.33
7 Test Four ReviewWork 6.59, 6.60, 6.61, 6.62, 6.63, 6.64, 7.34, 7.35, 7.36, 7.37, 7.38, 7.42
8 Unit Four (Probability) TEST
Syllabus for Test Five (Binomial Probability and The Central Limit Theorem)
Essential Skills to be learned for this test
1. Students will be able to distinguish whether or not a variable meets the criteria for the binomial setting.
2. Students will be able to use the calculator or formulas to determine binomial probabilities and construct probability distribution tables and histograms.
3. Students will be able to calculate cumulative distribution functions for binomial random variables and construct histograms.
4. Students will be able to calculate means (expected values) and standard deviations for binomial random variables.
5. Students will be given a Minitab assignment that will help them to recognize the fact of sampling variability: a statistic will take different values when you repeat a sample or experiment
6. Students will be able to find the mean and standard deviation of a sample proportion pˆ for an SRS of size
n from a population having population proportion p.
7. Students will be able to recognize when you can use the normal approximation to the sampling distribution of pˆ (rules of thumb 1 and 2) and use normal approximation to calculate probabilities that concern pˆ.
8. Students will be able to find the mean and standard deviation of a sample mean x from an SRS of size nˉ when the mean and standard deviation of the population are known.μ σ
9. Students will understand that x has approximately a normal distribution when the sample is largeˉ (central limit theorem). Use this normal distribution to calculate probabilities that concern x .ˉ
Assignments and Schedule
Day Objectives Assignment Due Date Grade
1 Identify the binomial setting
Calculate binomial probabilities using formulae and calculator
Classwork 8.18.4
Read p.415432
Work 8.5, 8.6, 8.8, 8.9, 8.10, 8.13, 8.14, 8.15, 8.16
2 Finding cumulative probabilities for binomial variables
Calculating mean and standard deviations for binomials
Work 8.19, 8.20, 8.21, 8.22, 8.23
3 Chapter 8 Review 8.37, 8.38, 8.39, 8.40
Day Objectives Assignment Due Date Grade
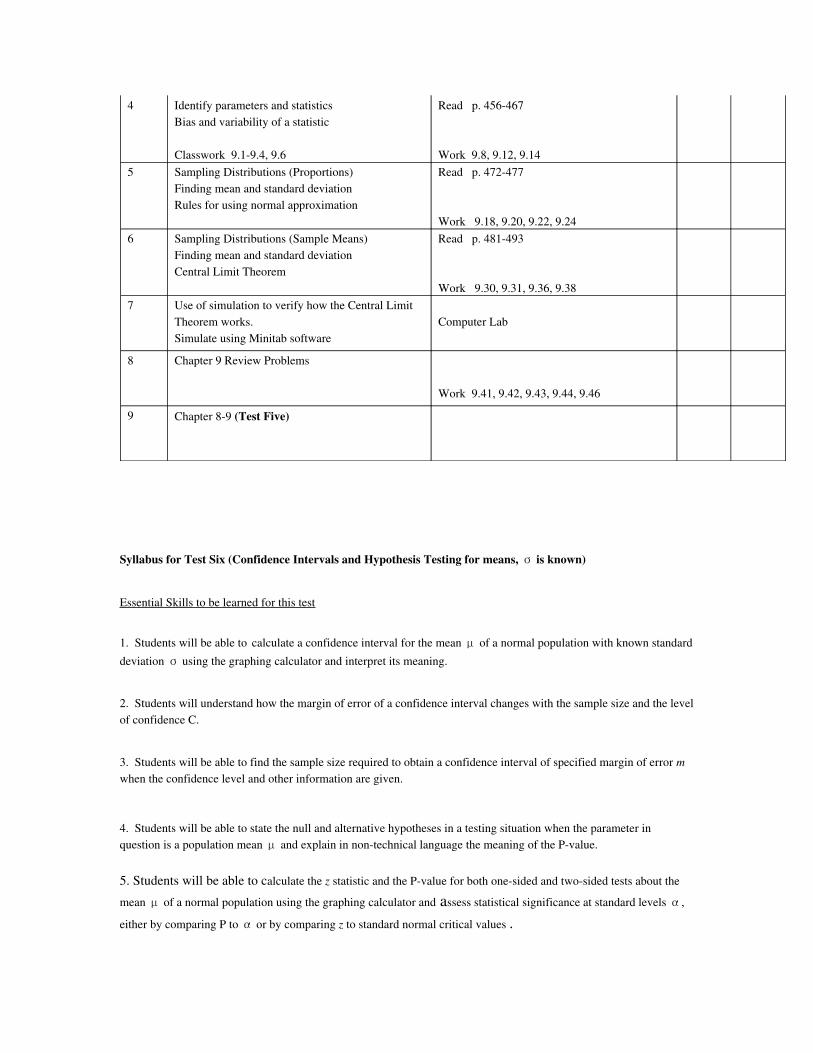
4 Identify parameters and statisticsBias and variability of a statistic
Classwork 9.19.4, 9.6
Read p. 456467
Work 9.8, 9.12, 9.145 Sampling Distributions (Proportions)
Finding mean and standard deviationRules for using normal approximation
Read p. 472477
Work 9.18, 9.20, 9.22, 9.246 Sampling Distributions (Sample Means)
Finding mean and standard deviationCentral Limit Theorem
Read p. 481493
Work 9.30, 9.31, 9.36, 9.387 Use of simulation to verify how the Central Limit
Theorem works.Simulate using Minitab software
Computer Lab
8 Chapter 9 Review Problems
Work 9.41, 9.42, 9.43, 9.44, 9.46
9 Chapter 89 (Test Five)
Syllabus for Test Six (Confidence Intervals and Hypothesis Testing for means, is known)σ
Essential Skills to be learned for this test
1. Students will be able to calculate a confidence interval for the mean of a normal population with known standardμ deviation using the graphing calculator and interpret its meaning.σ
2. Students will understand how the margin of error of a confidence interval changes with the sample size and the level of confidence C.
3. Students will be able to find the sample size required to obtain a confidence interval of specified margin of error m when the confidence level and other information are given.
4. Students will be able to state the null and alternative hypotheses in a testing situation when the parameter in question is a population mean and explain in nontechnical language the meaning of the Pvalue.μ
5. Students will be able to calculate the z statistic and the Pvalue for both onesided and twosided tests about the
mean of a normal population using the graphing calculator andμ assess statistical significance at standard levels ,α
either by comparing P to or by comparing α z to standard normal critical values .
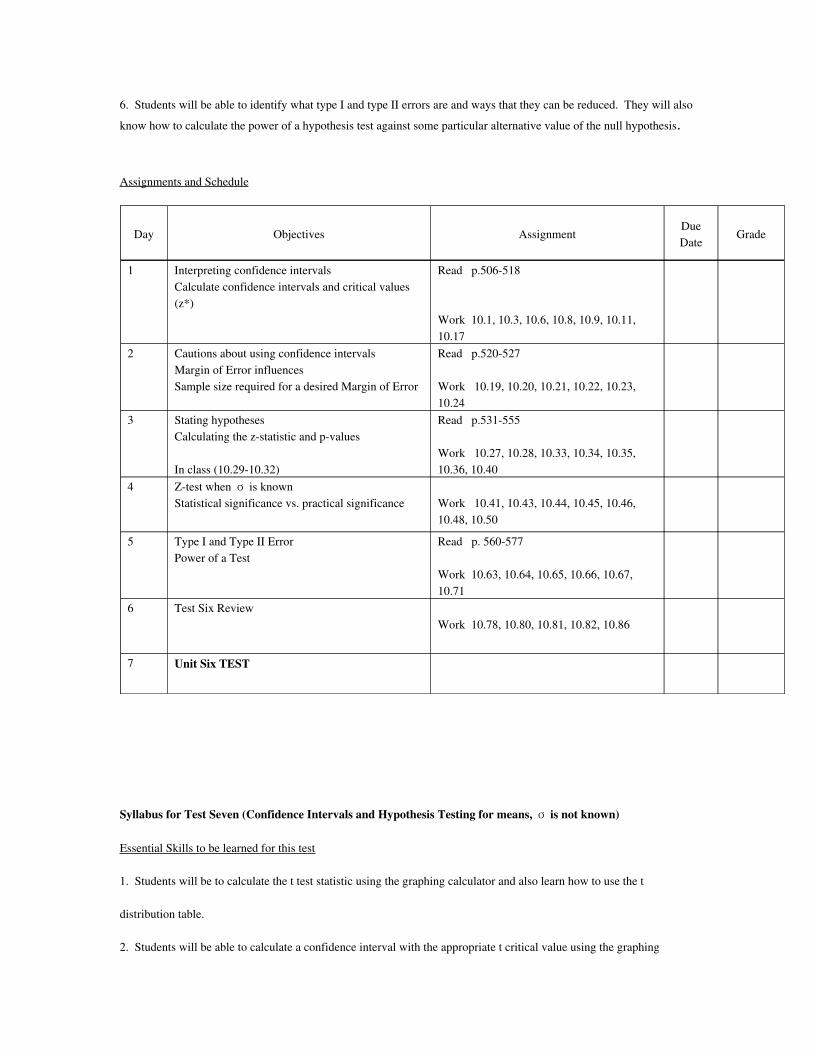
6. Students will be able to identify what type I and type II errors are and ways that they can be reduced. They will also
know how to calculate the power of a hypothesis test against some particular alternative value of the null hypothesis.
Assignments and Schedule
Day Objectives Assignment Due Date Grade
1 Interpreting confidence intervalsCalculate confidence intervals and critical values (z*)
Read p.506518
Work 10.1, 10.3, 10.6, 10.8, 10.9, 10.11, 10.17
2 Cautions about using confidence intervalsMargin of Error influencesSample size required for a desired Margin of Error
Read p.520527
Work 10.19, 10.20, 10.21, 10.22, 10.23, 10.24
3 Stating hypothesesCalculating the zstatistic and pvalues
In class (10.2910.32)
Read p.531555
Work 10.27, 10.28, 10.33, 10.34, 10.35, 10.36, 10.40
4 Ztest when is knownσStatistical significance vs. practical significance Work 10.41, 10.43, 10.44, 10.45, 10.46,
10.48, 10.50
5 Type I and Type II ErrorPower of a Test
Read p. 560577
Work 10.63, 10.64, 10.65, 10.66, 10.67, 10.71
6 Test Six ReviewWork 10.78, 10.80, 10.81, 10.82, 10.86
7 Unit Six TEST
Syllabus for Test Seven (Confidence Intervals and Hypothesis Testing for means, is not known)σ
Essential Skills to be learned for this test
1. Students will be to calculate the t test statistic using the graphing calculator and also learn how to use the t
distribution table.
2. Students will be able to calculate a confidence interval with the appropriate t critical value using the graphing
calculator.
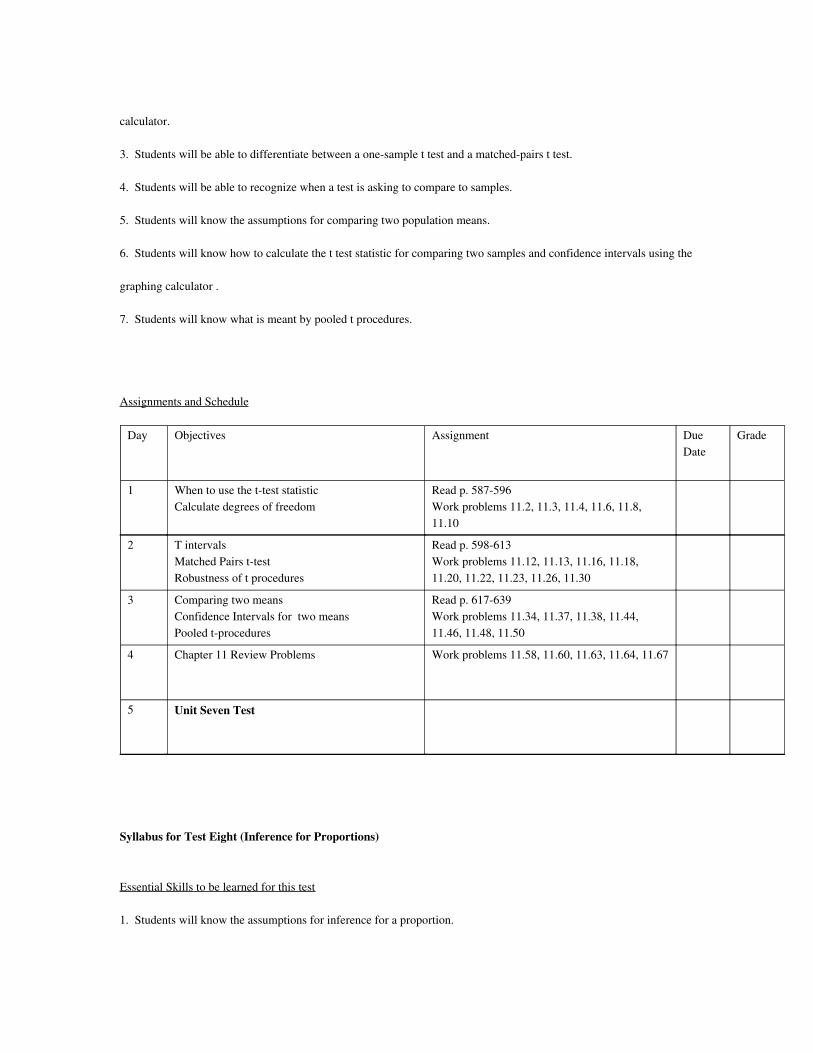
3. Students will be able to differentiate between a onesample t test and a matchedpairs t test.
4. Students will be able to recognize when a test is asking to compare to samples.
5. Students will know the assumptions for comparing two population means.
6. Students will know how to calculate the t test statistic for comparing two samples and confidence intervals using the
graphing calculator .
7. Students will know what is meant by pooled t procedures.
Assignments and Schedule
Day Objectives Assignment Due Date
Grade
1 When to use the ttest statisticCalculate degrees of freedom
Read p. 587596Work problems 11.2, 11.3, 11.4, 11.6, 11.8, 11.10
2 T intervalsMatched Pairs ttestRobustness of t procedures
Read p. 598613Work problems 11.12, 11.13, 11.16, 11.18, 11.20, 11.22, 11.23, 11.26, 11.30
3 Comparing two meansConfidence Intervals for two meansPooled tprocedures
Read p. 617639Work problems 11.34, 11.37, 11.38, 11.44, 11.46, 11.48, 11.50
4 Chapter 11 Review Problems Work problems 11.58, 11.60, 11.63, 11.64, 11.67
5 Unit Seven Test
Syllabus for Test Eight (Inference for Proportions)
Essential Skills to be learned for this test
1. Students will know the assumptions for inference for a proportion.
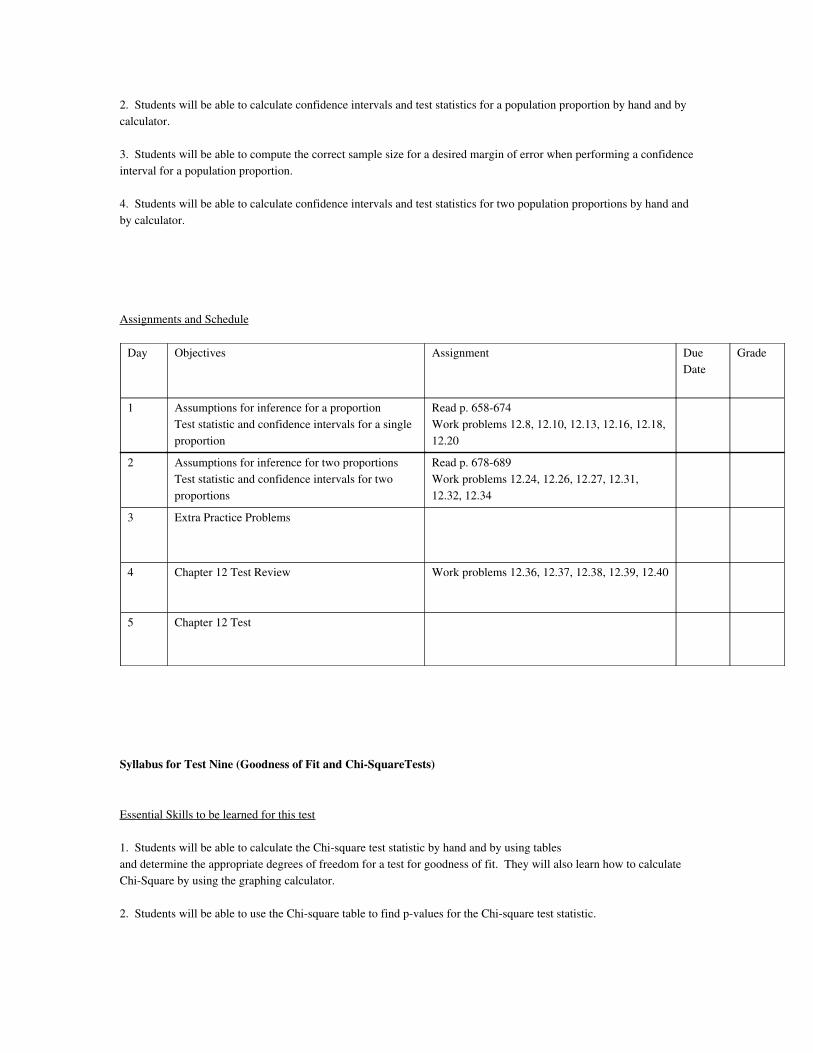
2. Students will be able to calculate confidence intervals and test statistics for a population proportion by hand and by calculator.
3. Students will be able to compute the correct sample size for a desired margin of error when performing a confidence interval for a population proportion.
4. Students will be able to calculate confidence intervals and test statistics for two population proportions by hand and by calculator.
Assignments and Schedule
Day Objectives Assignment Due Date
Grade
1 Assumptions for inference for a proportionTest statistic and confidence intervals for a single proportion
Read p. 658674Work problems 12.8, 12.10, 12.13, 12.16, 12.18, 12.20
2 Assumptions for inference for two proportionsTest statistic and confidence intervals for two proportions
Read p. 678689Work problems 12.24, 12.26, 12.27, 12.31, 12.32, 12.34
3 Extra Practice Problems
4 Chapter 12 Test Review Work problems 12.36, 12.37, 12.38, 12.39, 12.40
5 Chapter 12 Test
Syllabus for Test Nine (Goodness of Fit and ChiSquareTests)
Essential Skills to be learned for this test
1. Students will be able to calculate the Chisquare test statistic by hand and by using tablesand determine the appropriate degrees of freedom for a test for goodness of fit. They will also learn how to calculate ChiSquare by using the graphing calculator.
2. Students will be able to use the Chisquare table to find pvalues for the Chisquare test statistic.
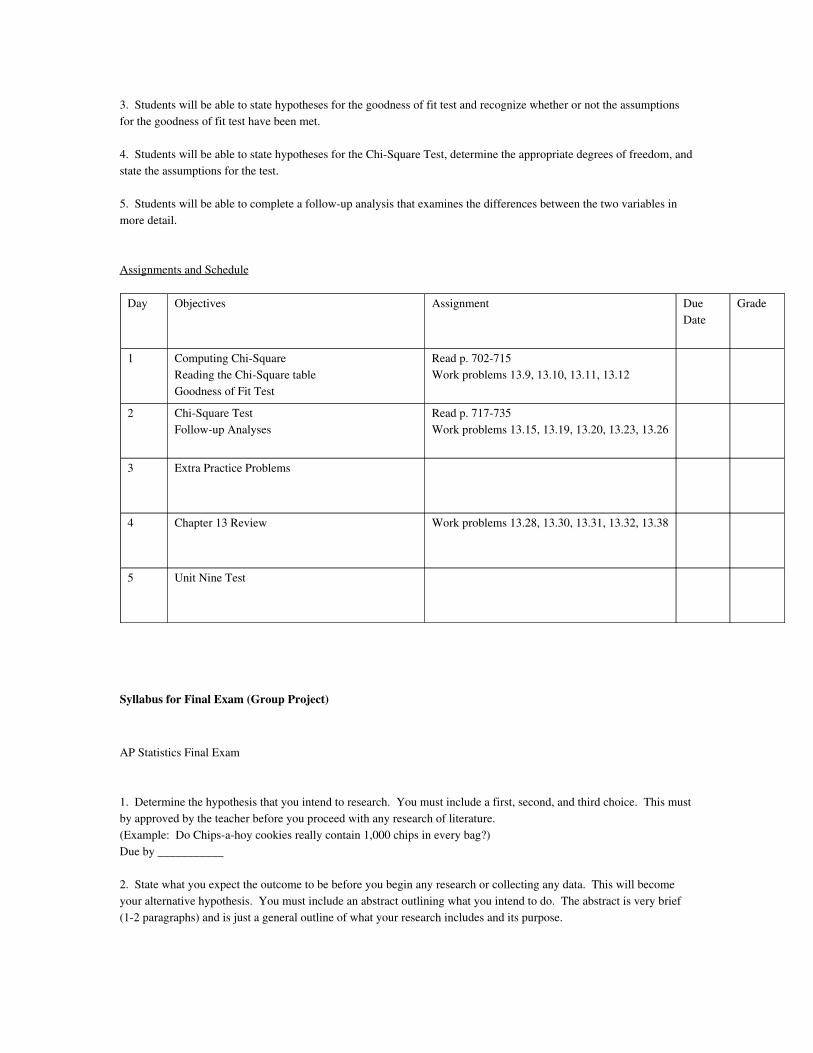
3. Students will be able to state hypotheses for the goodness of fit test and recognize whether or not the assumptions for the goodness of fit test have been met.
4. Students will be able to state hypotheses for the ChiSquare Test, determine the appropriate degrees of freedom, and state the assumptions for the test.
5. Students will be able to complete a followup analysis that examines the differences between the two variables in more detail.
Assignments and Schedule
Day Objectives Assignment Due Date
Grade
1 Computing ChiSquareReading the ChiSquare tableGoodness of Fit Test
Read p. 702715Work problems 13.9, 13.10, 13.11, 13.12
2 ChiSquare TestFollowup Analyses
Read p. 717735Work problems 13.15, 13.19, 13.20, 13.23, 13.26
3 Extra Practice Problems
4 Chapter 13 Review Work problems 13.28, 13.30, 13.31, 13.32, 13.38
5 Unit Nine Test
Syllabus for Final Exam (Group Project)
AP Statistics Final Exam
1. Determine the hypothesis that you intend to research. You must include a first, second, and third choice. This must by approved by the teacher before you proceed with any research of literature.(Example: Do Chipsahoy cookies really contain 1,000 chips in every bag?)Due by ___________
2. State what you expect the outcome to be before you begin any research or collecting any data. This will become your alternative hypothesis. You must include an abstract outlining what you intend to do. The abstract is very brief (12 paragraphs) and is just a general outline of what your research includes and its purpose.
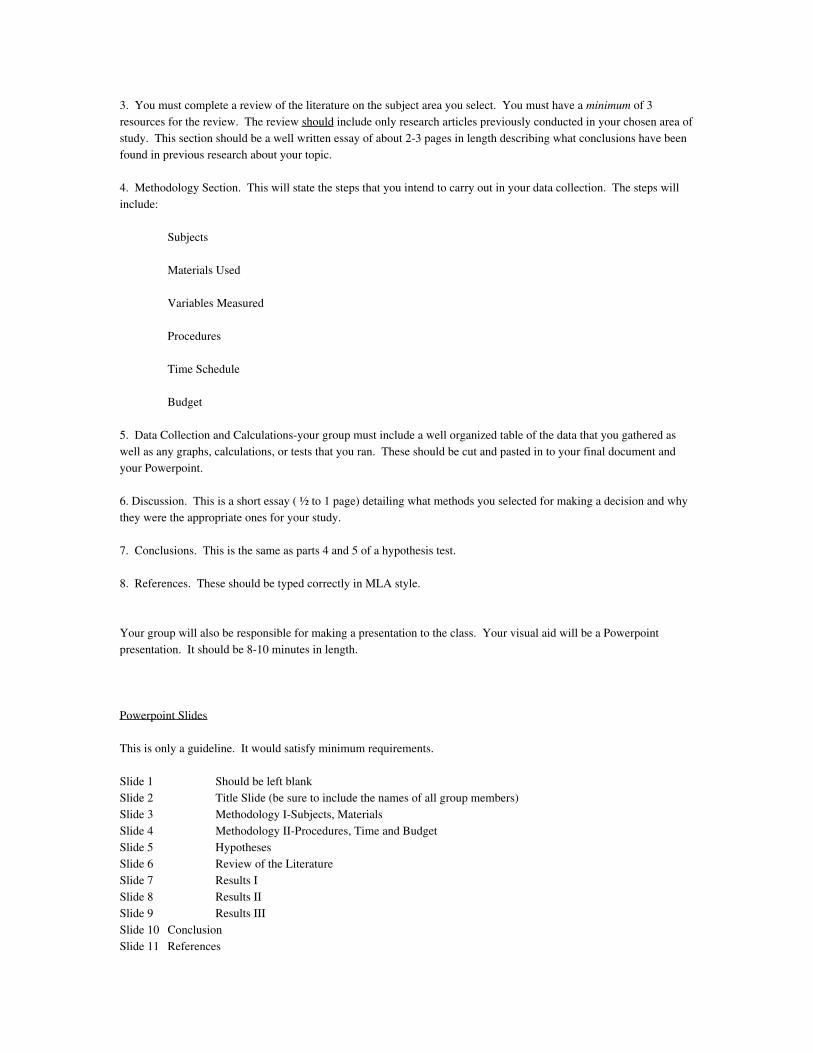
3. You must complete a review of the literature on the subject area you select. You must have a minimum of 3 resources for the review. The review should include only research articles previously conducted in your chosen area of study. This section should be a well written essay of about 23 pages in length describing what conclusions have been found in previous research about your topic.
4. Methodology Section. This will state the steps that you intend to carry out in your data collection. The steps will include:
Subjects
Materials Used
Variables Measured
Procedures
Time Schedule
Budget
5. Data Collection and Calculationsyour group must include a well organized table of the data that you gathered as well as any graphs, calculations, or tests that you ran. These should be cut and pasted in to your final document and your Powerpoint.
6. Discussion. This is a short essay ( ½ to 1 page) detailing what methods you selected for making a decision and why they were the appropriate ones for your study.
7. Conclusions. This is the same as parts 4 and 5 of a hypothesis test.
8. References. These should be typed correctly in MLA style.
Your group will also be responsible for making a presentation to the class. Your visual aid will be a Powerpoint presentation. It should be 810 minutes in length.
Powerpoint Slides
This is only a guideline. It would satisfy minimum requirements.
Slide 1 Should be left blankSlide 2 Title Slide (be sure to include the names of all group members)Slide 3 Methodology ISubjects, MaterialsSlide 4 Methodology IIProcedures, Time and BudgetSlide 5 HypothesesSlide 6 Review of the LiteratureSlide 7 Results ISlide 8 Results IISlide 9 Results IIISlide 10 ConclusionSlide 11 References

Your group will make an oral presentation in class the duration of which should not exceed 10 minutes.
![AP Studio Art: 2-D Design: Syllabus 4 [Photography, …secure-media.collegeboard.org/digitalServices/pdf/ap/ap...AP® Studio Art: 2-D Design Syllabus 4 [Photography, Digital] Syllabus](https://img.pdfslide.us/doc/110x75/5eb750bc8ec38707903c81f7/ap-studio-art-2-d-design-syllabus-4-photography-secure-media-ap-studio.jpg)