Embed Size (px)
Citation preview
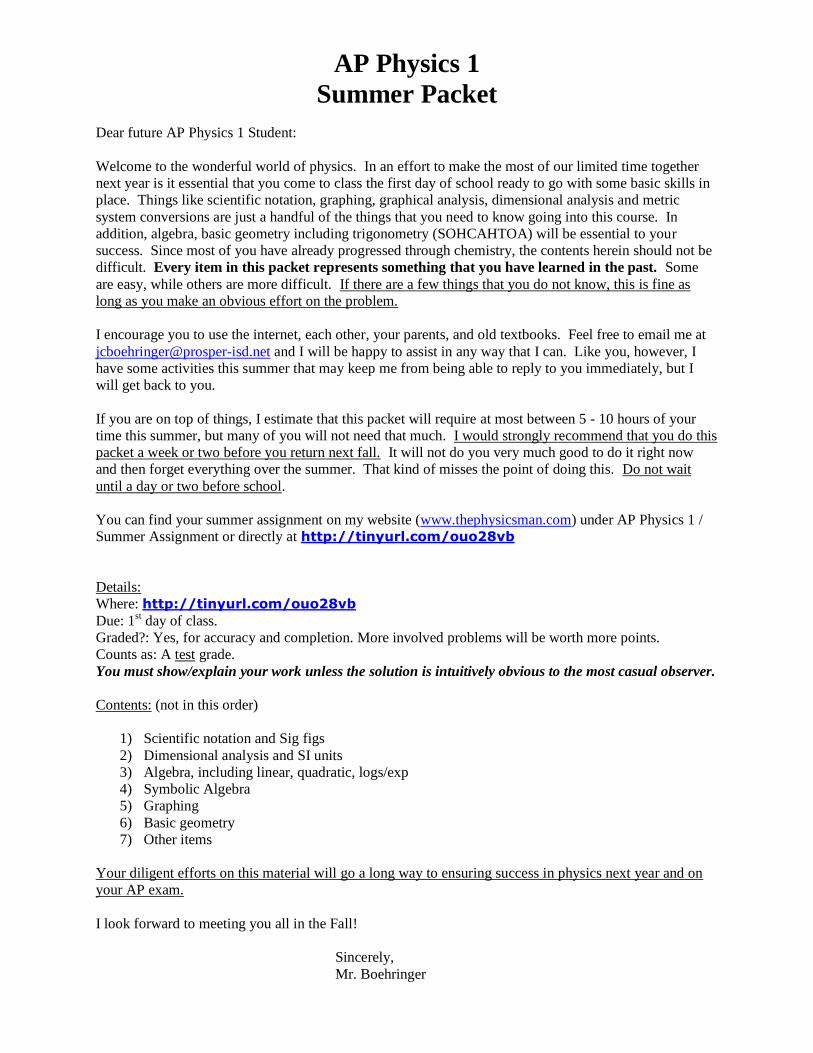
AP Physics 1
Summer Packet
Dear future AP Physics 1 Student:
Welcome to the wonderful world of physics. In an effort to make the most of our limited time together
next year is it essential that you come to class the first day of school ready to go with some basic skills in
place. Things like scientific notation, graphing, graphical analysis, dimensional analysis and metric
system conversions are just a handful of the things that you need to know going into this course. In
addition, algebra, basic geometry including trigonometry (SOHCAHTOA) will be essential to your
success. Since most of you have already progressed through chemistry, the contents herein should not be
difficult. Every item in this packet represents something that you have learned in the past. Some
are easy, while others are more difficult. If there are a few things that you do not know, this is fine as
long as you make an obvious effort on the problem.
I encourage you to use the internet, each other, your parents, and old textbooks. Feel free to email me at
[email protected] and I will be happy to assist in any way that I can. Like you, however, I
have some activities this summer that may keep me from being able to reply to you immediately, but I
will get back to you.
If you are on top of things, I estimate that this packet will require at most between 5 - 10 hours of your
time this summer, but many of you will not need that much. I would strongly recommend that you do this
packet a week or two before you return next fall. It will not do you very much good to do it right now
and then forget everything over the summer. That kind of misses the point of doing this. Do not wait
until a day or two before school.
You can find your summer assignment on my website (www.thephysicsman.com) under AP Physics 1 /
Summer Assignment or directly at http://tinyurl.com/ouo28vb
Details:
Where: http://tinyurl.com/ouo28vb
Due: 1st day of class.
Graded?: Yes, for accuracy and completion. More involved problems will be worth more points.
Counts as: A test grade.
You must show/explain your work unless the solution is intuitively obvious to the most casual observer.
Contents: (not in this order)
1) Scientific notation and Sig figs
2) Dimensional analysis and SI units
3) Algebra, including linear, quadratic, logs/exp
4) Symbolic Algebra
5) Graphing
6) Basic geometry
7) Other items
Your diligent efforts on this material will go a long way to ensuring success in physics next year and on
your AP exam.
I look forward to meeting you all in the Fall!
Sincerely,
Mr. Boehringer
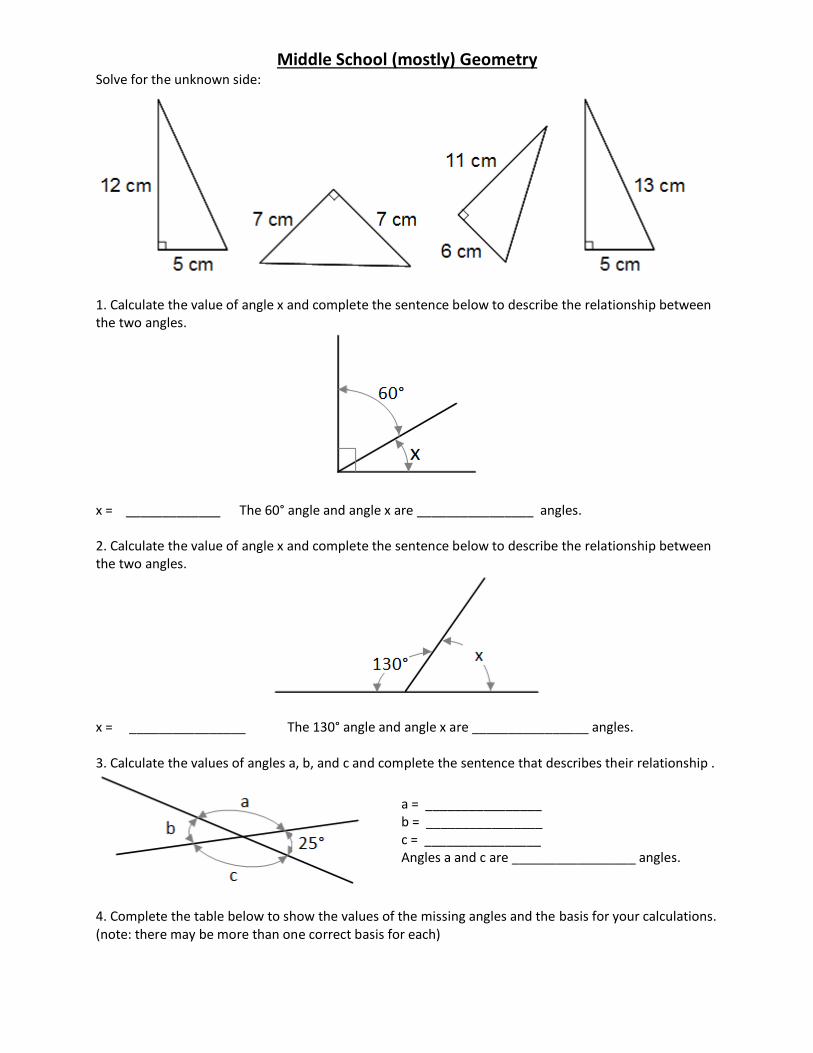
Middle School (mostly) Geometry Solve for the unknown side:
1. Calculate the value of angle x and complete the sentence below to describe the relationship between the two angles.
x = _____________ The 60° angle and angle x are ________________ angles. 2. Calculate the value of angle x and complete the sentence below to describe the relationship between the two angles.
x = ________________ The 130° angle and angle x are ________________ angles. 3. Calculate the values of angles a, b, and c and complete the sentence that describes their relationship .
a = ________________ b = ________________ c = ________________ Angles a and c are _________________ angles.
4. Complete the table below to show the values of the missing angles and the basis for your calculations. (note: there may be more than one correct basis for each)
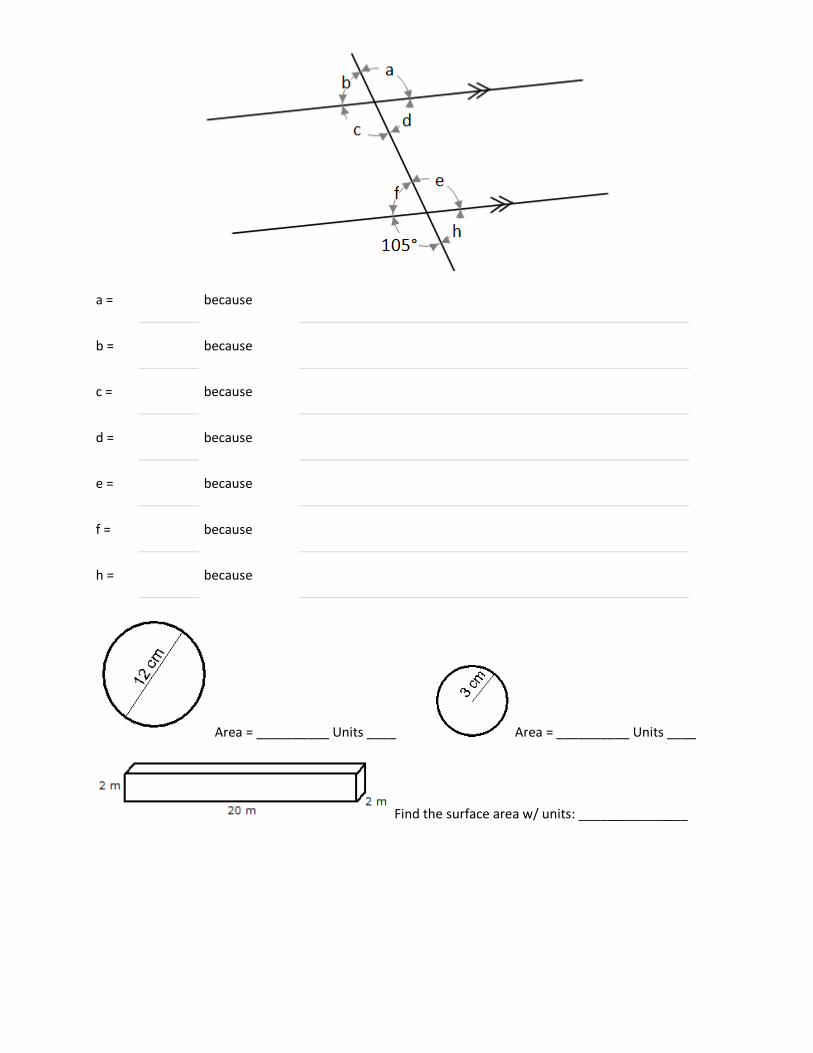
a =
because
b =
because
c =
because
d =
because
e =
because
f =
because
h =
because
Area = __________ Units ____ Area = __________ Units ____
Find the surface area w/ units: _______________
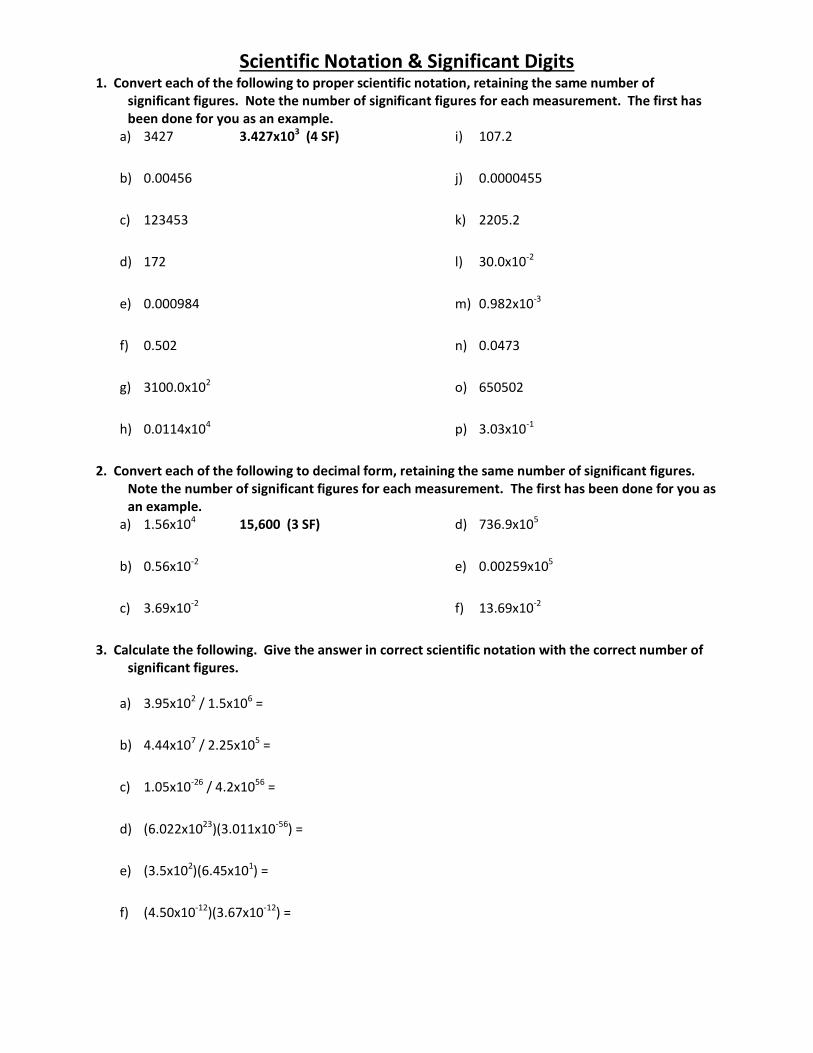
Scientific Notation & Significant Digits 1. Convert each of the following to proper scientific notation, retaining the same number of
significant figures. Note the number of significant figures for each measurement. The first has been done for you as an example.
a) 3427 3.427x10³ (4 SF)
b) 0.00456
c) 123453
d) 172
e) 0.000984
f) 0.502
g) 3100.0x102
h) 0.0114x10⁴
i) 107.2
j) 0.0000455
k) 2205.2
l) 30.0x10⁻²
m) 0.982x10⁻³
n) 0.0473
o) 650502
p) 3.03x10⁻¹
2. Convert each of the following to decimal form, retaining the same number of significant figures. Note the number of significant figures for each measurement. The first has been done for you as an example.
a) 1.56x10⁴ 15,600 (3 SF)
b) 0.56x10⁻²
c) 3.69x10⁻²
d) 736.9x10⁵
e) 0.00259x10⁵
f) 13.69x10⁻²
3. Calculate the following. Give the answer in correct scientific notation with the correct number of significant figures.
a) 3.95x10² / 1.5x106 =
b) 4.44x10⁷ / 2.25x105 =
c) 1.05x10⁻²⁶ / 4.2x1056 =
d) (6.022x10²³)(3.011x10-56) =
e) (3.5x10²)(6.45x101) =
f) (4.50x10⁻¹²)(3.67x10⁻¹²) =
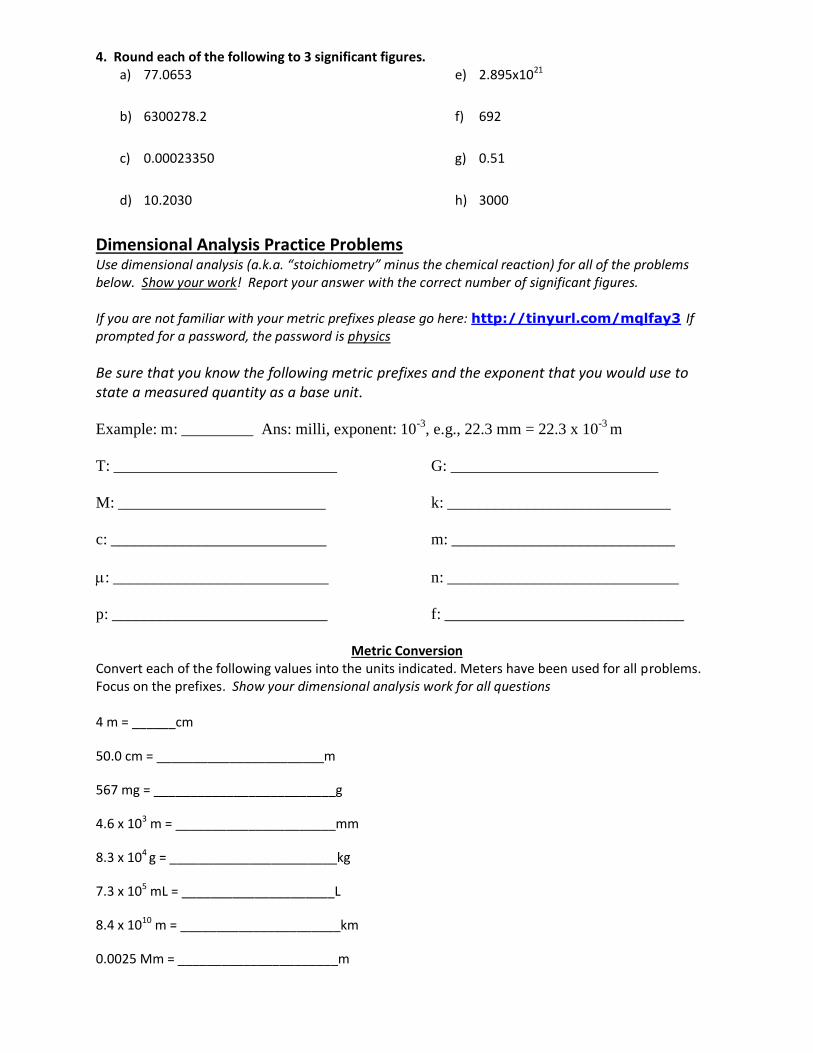
4. Round each of the following to 3 significant figures. a) 77.0653
b) 6300278.2
c) 0.00023350
d) 10.2030
e) 2.895x10²¹
f) 692
g) 0.51
h) 3000
Dimensional Analysis Practice Problems Use dimensional analysis (a.k.a. “stoichiometry” minus the chemical reaction) for all of the problems below. Show your work! Report your answer with the correct number of significant figures. If you are not familiar with your metric prefixes please go here: http://tinyurl.com/mqlfay3 If prompted for a password, the password is physics
Be sure that you know the following metric prefixes and the exponent that you would use to state a measured quantity as a base unit.
Example: m: _________ Ans: milli, exponent: 10-3
, e.g., 22.3 mm = 22.3 x 10⁻³
m
T: ____________________________ G: __________________________
M: __________________________ k: ____________________________
c: ___________________________ m: ____________________________
: ___________________________ n: _____________________________
p: ___________________________ f: ______________________________
Metric Conversion
Convert each of the following values into the units indicated. Meters have been used for all problems. Focus on the prefixes. Show your dimensional analysis work for all questions 4 m = ______cm
50.0 cm = _______________________m
567 mg = _________________________g
4.6 x 10³ m = ______________________mm
8.3 x 10⁴ g = _______________________kg
7.3 x 10⁵ mL = _____________________L
8.4 x 10¹⁰ m = ______________________km
0.0025 Mm = ______________________m
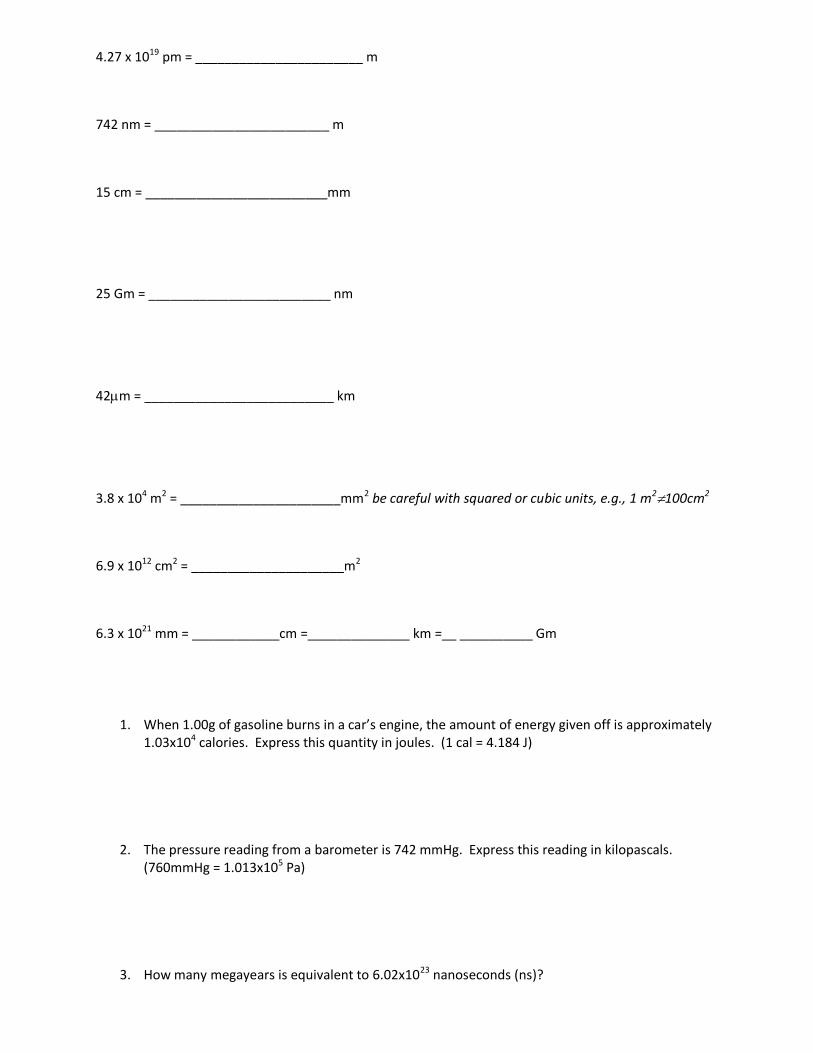
4.27 x 10¹⁹ pm = _______________________ m
742 nm = ________________________ m
15 cm = _________________________mm
25 Gm = _________________________ nm
42m = __________________________ km
3.8 x 10⁴ m2 = ______________________mm2 be careful with squared or cubic units, e.g., 1 m2100cm2
6.9 x 1012 cm2 = _____________________m2
6.3 x 1021 mm = ____________cm =______________ km =__ __________ Gm
1. When 1.00g of gasoline burns in a car’s engine, the amount of energy given off is approximately 1.03x10⁴ calories. Express this quantity in joules. (1 cal = 4.184 J)
2. The pressure reading from a barometer is 742 mmHg. Express this reading in kilopascals.
(760mmHg = 1.013x10⁵ Pa)
3. How many megayears is equivalent to 6.02x10²³ nanoseconds (ns)?
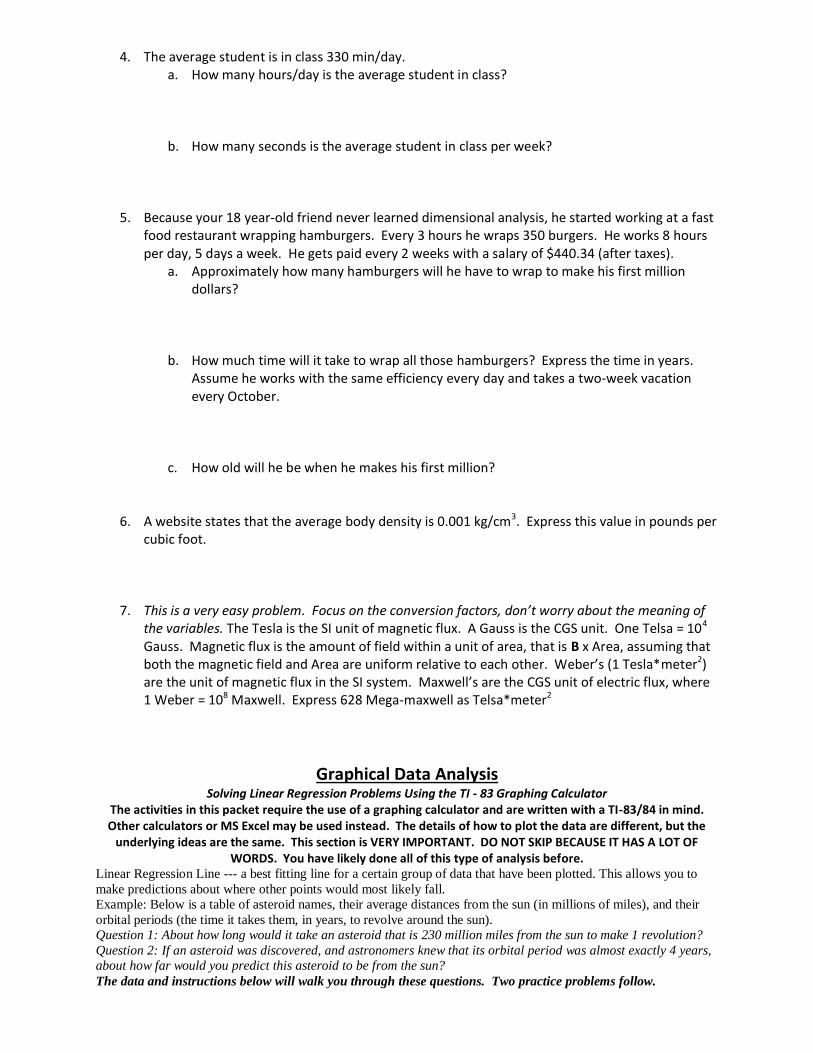
4. The average student is in class 330 min/day. a. How many hours/day is the average student in class? b. How many seconds is the average student in class per week?
5. Because your 18 year-old friend never learned dimensional analysis, he started working at a fast
food restaurant wrapping hamburgers. Every 3 hours he wraps 350 burgers. He works 8 hours per day, 5 days a week. He gets paid every 2 weeks with a salary of $440.34 (after taxes).
a. Approximately how many hamburgers will he have to wrap to make his first million dollars?
b. How much time will it take to wrap all those hamburgers? Express the time in years.
Assume he works with the same efficiency every day and takes a two-week vacation every October.
c. How old will he be when he makes his first million?
6. A website states that the average body density is 0.001 kg/cm3. Express this value in pounds per cubic foot.
7. This is a very easy problem. Focus on the conversion factors, don’t worry about the meaning of the variables. The Tesla is the SI unit of magnetic flux. A Gauss is the CGS unit. One Telsa = 104 Gauss. Magnetic flux is the amount of field within a unit of area, that is B x Area, assuming that both the magnetic field and Area are uniform relative to each other. Weber’s (1 Tesla*meter2) are the unit of magnetic flux in the SI system. Maxwell’s are the CGS unit of electric flux, where 1 Weber = 108 Maxwell. Express 628 Mega-maxwell as Telsa*meter2
Graphical Data Analysis Solving Linear Regression Problems Using the TI - 83 Graphing Calculator
The activities in this packet require the use of a graphing calculator and are written with a TI-83/84 in mind. Other calculators or MS Excel may be used instead. The details of how to plot the data are different, but the
underlying ideas are the same. This section is VERY IMPORTANT. DO NOT SKIP BECAUSE IT HAS A LOT OF WORDS. You have likely done all of this type of analysis before.
Linear Regression Line --- a best fitting line for a certain group of data that have been plotted. This allows you to
make predictions about where other points would most likely fall.
Example: Below is a table of asteroid names, their average distances from the sun (in millions of miles), and their
orbital periods (the time it takes them, in years, to revolve around the sun).
Question 1: About how long would it take an asteroid that is 230 million miles from the sun to make 1 revolution?
Question 2: If an asteroid was discovered, and astronomers knew that its orbital period was almost exactly 4 years,
about how far would you predict this asteroid to be from the sun?
The data and instructions below will walk you through these questions. Two practice problems follow.
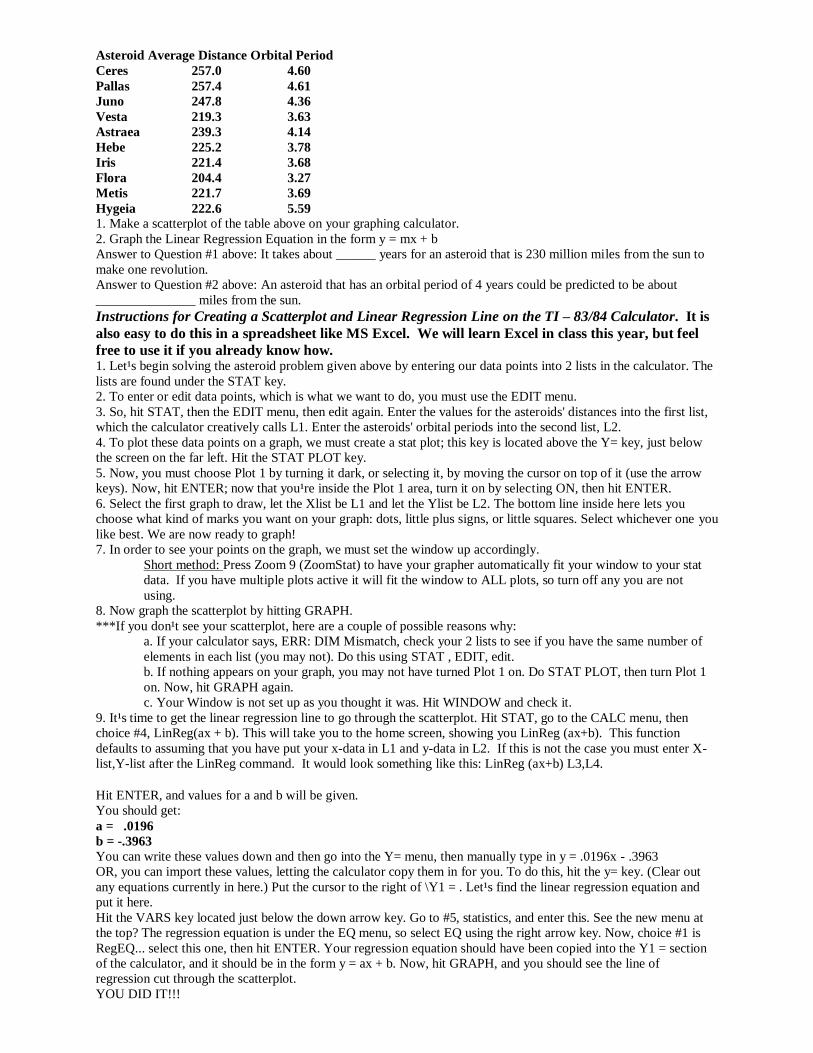
Asteroid Average Distance Orbital Period
Ceres 257.0 4.60
Pallas 257.4 4.61
Juno 247.8 4.36
Vesta 219.3 3.63
Astraea 239.3 4.14
Hebe 225.2 3.78
Iris 221.4 3.68
Flora 204.4 3.27
Metis 221.7 3.69
Hygeia 222.6 5.59 1. Make a scatterplot of the table above on your graphing calculator.
2. Graph the Linear Regression Equation in the form y = mx + b
Answer to Question #1 above: It takes about ______ years for an asteroid that is 230 million miles from the sun to
make one revolution.
Answer to Question #2 above: An asteroid that has an orbital period of 4 years could be predicted to be about
_______________ miles from the sun.
Instructions for Creating a Scatterplot and Linear Regression Line on the TI – 83/84 Calculator. It is
also easy to do this in a spreadsheet like MS Excel. We will learn Excel in class this year, but feel
free to use it if you already know how. 1. Let¹s begin solving the asteroid problem given above by entering our data points into 2 lists in the calculator. The
lists are found under the STAT key.
2. To enter or edit data points, which is what we want to do, you must use the EDIT menu.
3. So, hit STAT, then the EDIT menu, then edit again. Enter the values for the asteroids' distances into the first list,
which the calculator creatively calls L1. Enter the asteroids' orbital periods into the second list, L2.
4. To plot these data points on a graph, we must create a stat plot; this key is located above the Y= key, just below
the screen on the far left. Hit the STAT PLOT key.
5. Now, you must choose Plot 1 by turning it dark, or selecting it, by moving the cursor on top of it (use the arrow
keys). Now, hit ENTER; now that you¹re inside the Plot 1 area, turn it on by selecting ON, then hit ENTER.
6. Select the first graph to draw, let the Xlist be L1 and let the Ylist be L2. The bottom line inside here lets you
choose what kind of marks you want on your graph: dots, little plus signs, or little squares. Select whichever one you
like best. We are now ready to graph!
7. In order to see your points on the graph, we must set the window up accordingly.
Short method: Press Zoom 9 (ZoomStat) to have your grapher automatically fit your window to your stat
data. If you have multiple plots active it will fit the window to ALL plots, so turn off any you are not
using.
8. Now graph the scatterplot by hitting GRAPH.
***If you don¹t see your scatterplot, here are a couple of possible reasons why:
a. If your calculator says, ERR: DIM Mismatch, check your 2 lists to see if you have the same number of
elements in each list (you may not). Do this using STAT , EDIT, edit.
b. If nothing appears on your graph, you may not have turned Plot 1 on. Do STAT PLOT, then turn Plot 1
on. Now, hit GRAPH again.
c. Your Window is not set up as you thought it was. Hit WINDOW and check it.
9. It¹s time to get the linear regression line to go through the scatterplot. Hit STAT, go to the CALC menu, then
choice #4, LinReg(ax + b). This will take you to the home screen, showing you LinReg (ax+b). This function
defaults to assuming that you have put your x-data in L1 and y-data in L2. If this is not the case you must enter X-
list,Y-list after the LinReg command. It would look something like this: LinReg (ax+b) L3,L4.
Hit ENTER, and values for a and b will be given.
You should get:
a = .0196
b = -.3963
You can write these values down and then go into the Y= menu, then manually type in y = .0196x - .3963
OR, you can import these values, letting the calculator copy them in for you. To do this, hit the y= key. (Clear out
any equations currently in here.) Put the cursor to the right of \Y1 = . Let¹s find the linear regression equation and
put it here.
Hit the VARS key located just below the down arrow key. Go to #5, statistics, and enter this. See the new menu at
the top? The regression equation is under the EQ menu, so select EQ using the right arrow key. Now, choice #1 is
RegEQ... select this one, then hit ENTER. Your regression equation should have been copied into the Y1 = section
of the calculator, and it should be in the form y = ax + b. Now, hit GRAPH, and you should see the line of
regression cut through the scatterplot.
YOU DID IT!!!
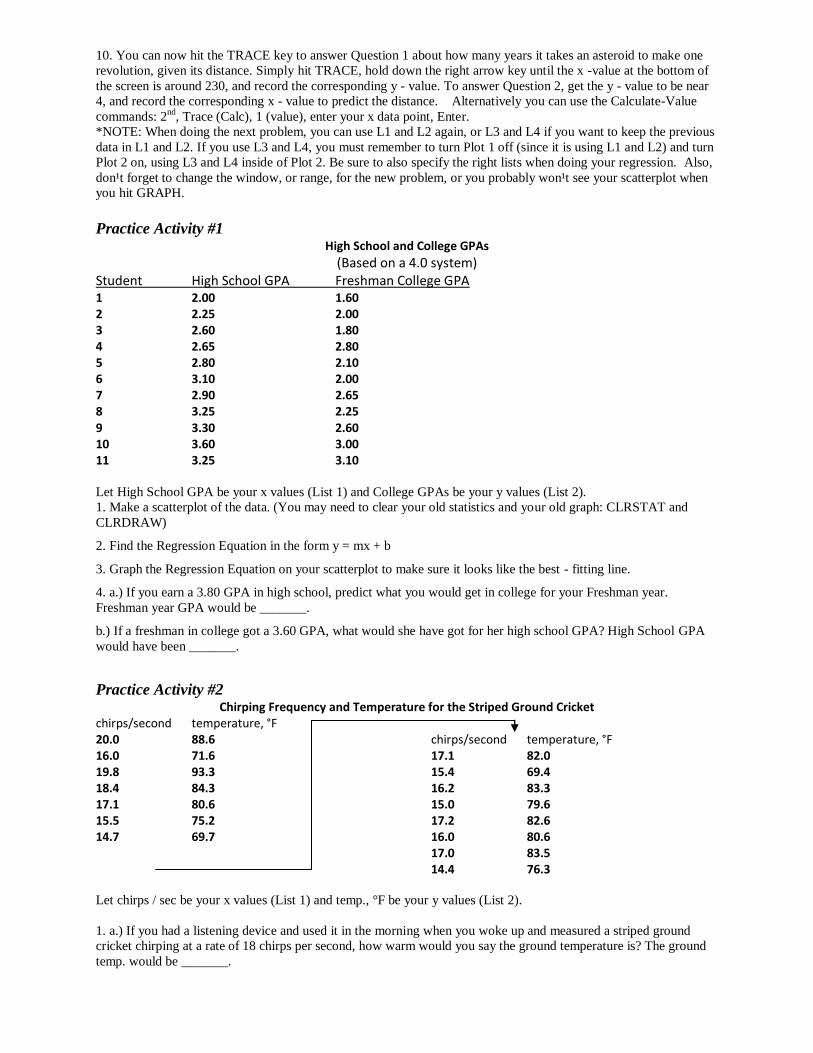
10. You can now hit the TRACE key to answer Question 1 about how many years it takes an asteroid to make one
revolution, given its distance. Simply hit TRACE, hold down the right arrow key until the x -value at the bottom of
the screen is around 230, and record the corresponding y - value. To answer Question 2, get the y - value to be near
4, and record the corresponding x - value to predict the distance. Alternatively you can use the Calculate-Value
commands: 2nd
, Trace (Calc), 1 (value), enter your x data point, Enter.
*NOTE: When doing the next problem, you can use L1 and L2 again, or L3 and L4 if you want to keep the previous
data in L1 and L2. If you use L3 and L4, you must remember to turn Plot 1 off (since it is using L1 and L2) and turn
Plot 2 on, using L3 and L4 inside of Plot 2. Be sure to also specify the right lists when doing your regression. Also,
don¹t forget to change the window, or range, for the new problem, or you probably won¹t see your scatterplot when
you hit GRAPH.
Practice Activity #1 High School and College GPAs
(Based on a 4.0 system) Student High School GPA Freshman College GPA
1 2.00 1.60 2 2.25 2.00 3 2.60 1.80 4 2.65 2.80 5 2.80 2.10 6 3.10 2.00 7 2.90 2.65 8 3.25 2.25 9 3.30 2.60 10 3.60 3.00 11 3.25 3.10 Let High School GPA be your x values (List 1) and College GPAs be your y values (List 2).
1. Make a scatterplot of the data. (You may need to clear your old statistics and your old graph: CLRSTAT and
CLRDRAW)
2. Find the Regression Equation in the form y = mx + b
3. Graph the Regression Equation on your scatterplot to make sure it looks like the best - fitting line.
4. a.) If you earn a 3.80 GPA in high school, predict what you would get in college for your Freshman year.
Freshman year GPA would be _______.
b.) If a freshman in college got a 3.60 GPA, what would she have got for her high school GPA? High School GPA
would have been _______.
Practice Activity #2 Chirping Frequency and Temperature for the Striped Ground Cricket
chirps/second temperature, °F 20.0 88.6 16.0 71.6 19.8 93.3 18.4 84.3 17.1 80.6 15.5 75.2 14.7 69.7
chirps/second temperature, °F 17.1 82.0 15.4 69.4 16.2 83.3 15.0 79.6 17.2 82.6 16.0 80.6 17.0 83.5 14.4 76.3
Let chirps / sec be your x values (List 1) and temp., °F be your y values (List 2).
1. a.) If you had a listening device and used it in the morning when you woke up and measured a striped ground
cricket chirping at a rate of 18 chirps per second, how warm would you say the ground temperature is? The ground
temp. would be _______.
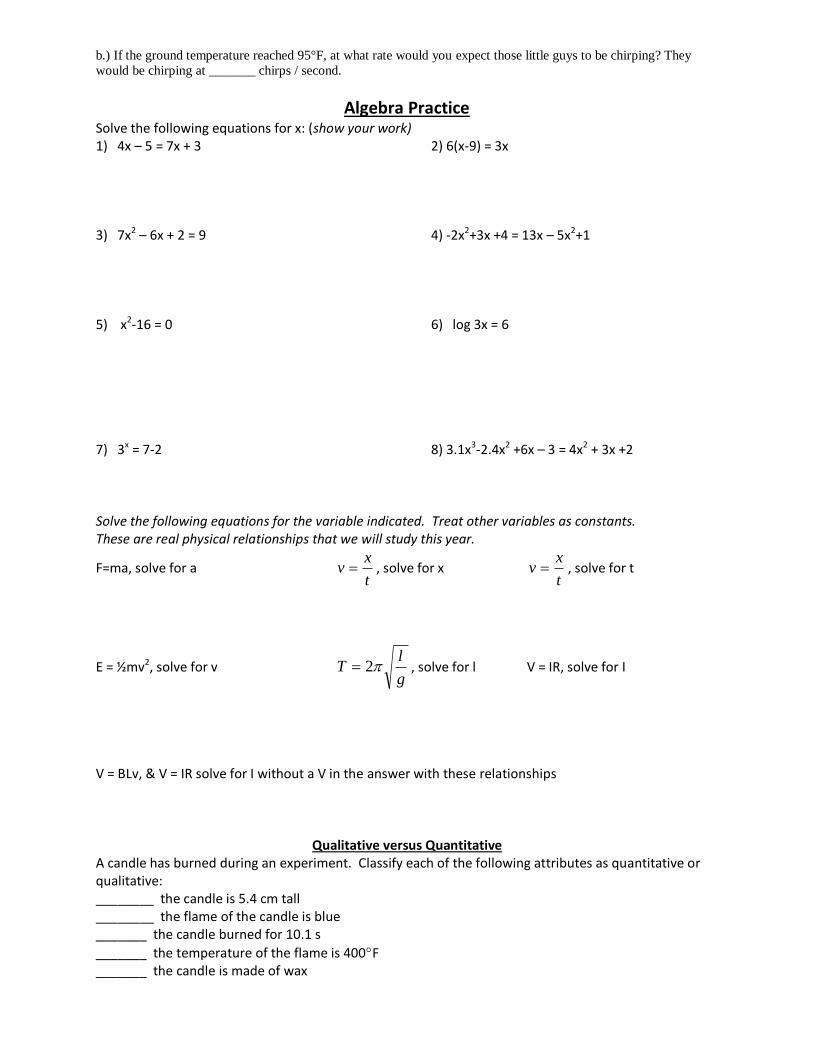
b.) If the ground temperature reached 95°F, at what rate would you expect those little guys to be chirping? They
would be chirping at _______ chirps / second.
Algebra Practice Solve the following equations for x: (show your work) 1) 4x – 5 = 7x + 3 2) 6(x-9) = 3x 3) 7x2 – 6x + 2 = 9 4) -2x2+3x +4 = 13x – 5x2+1 5) x2-16 = 0 6) log 3x = 6 7) 3x = 7-2 8) 3.1x3-2.4x2 +6x – 3 = 4x2 + 3x +2 Solve the following equations for the variable indicated. Treat other variables as constants. These are real physical relationships that we will study this year.
F=ma, solve for a t
xv , solve for x
t
xv , solve for t
E = ½mv2, solve for v g
lT 2 , solve for l V = IR, solve for I
V = BLv, & V = IR solve for I without a V in the answer with these relationships
Qualitative versus Quantitative A candle has burned during an experiment. Classify each of the following attributes as quantitative or qualitative: ________ the candle is 5.4 cm tall ________ the flame of the candle is blue _______ the candle burned for 10.1 s
_______ the temperature of the flame is 400F _______ the candle is made of wax
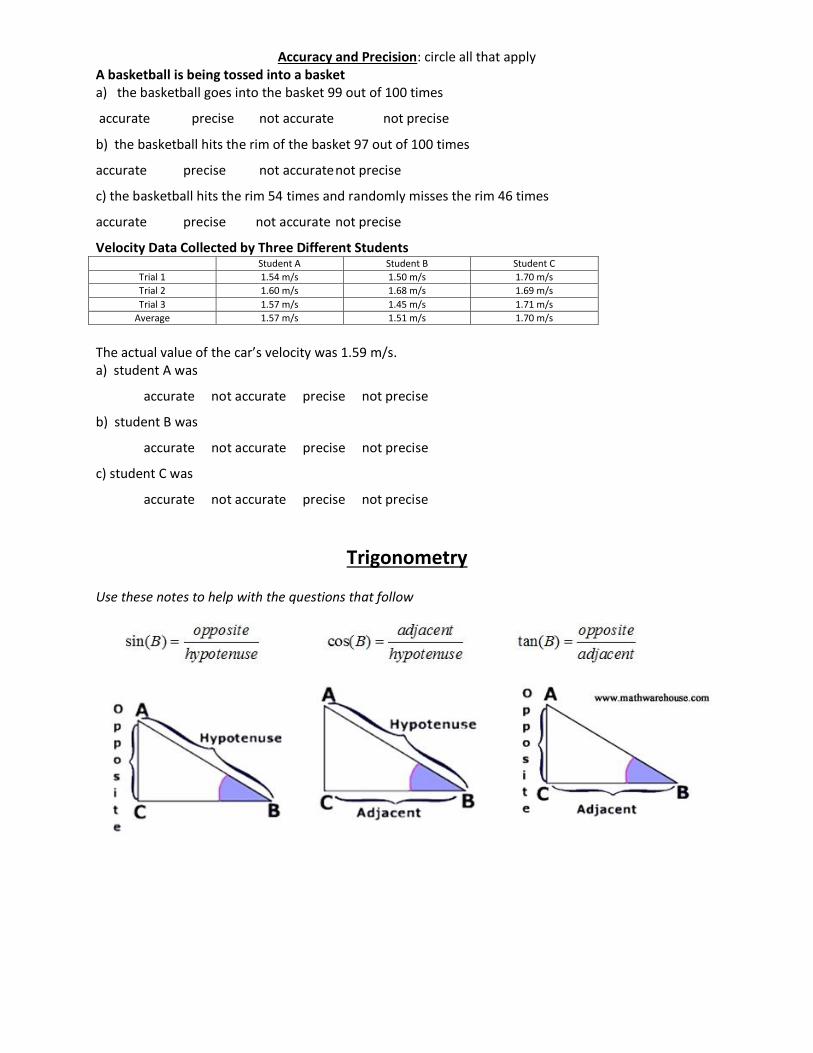
Accuracy and Precision: circle all that apply A basketball is being tossed into a basket a) the basketball goes into the basket 99 out of 100 times
accurate precise not accurate not precise
b) the basketball hits the rim of the basket 97 out of 100 times
accurate precise not accurate not precise
c) the basketball hits the rim 54 times and randomly misses the rim 46 times
accurate precise not accurate not precise
Velocity Data Collected by Three Different Students Student A Student B Student C
Trial 1 1.54 m/s 1.50 m/s 1.70 m/s
Trial 2 1.60 m/s 1.68 m/s 1.69 m/s
Trial 3 1.57 m/s 1.45 m/s 1.71 m/s
Average 1.57 m/s 1.51 m/s 1.70 m/s
The actual value of the car’s velocity was 1.59 m/s. a) student A was
accurate not accurate precise not precise
b) student B was
accurate not accurate precise not precise
c) student C was
accurate not accurate precise not precise
Trigonometry Use these notes to help with the questions that follow
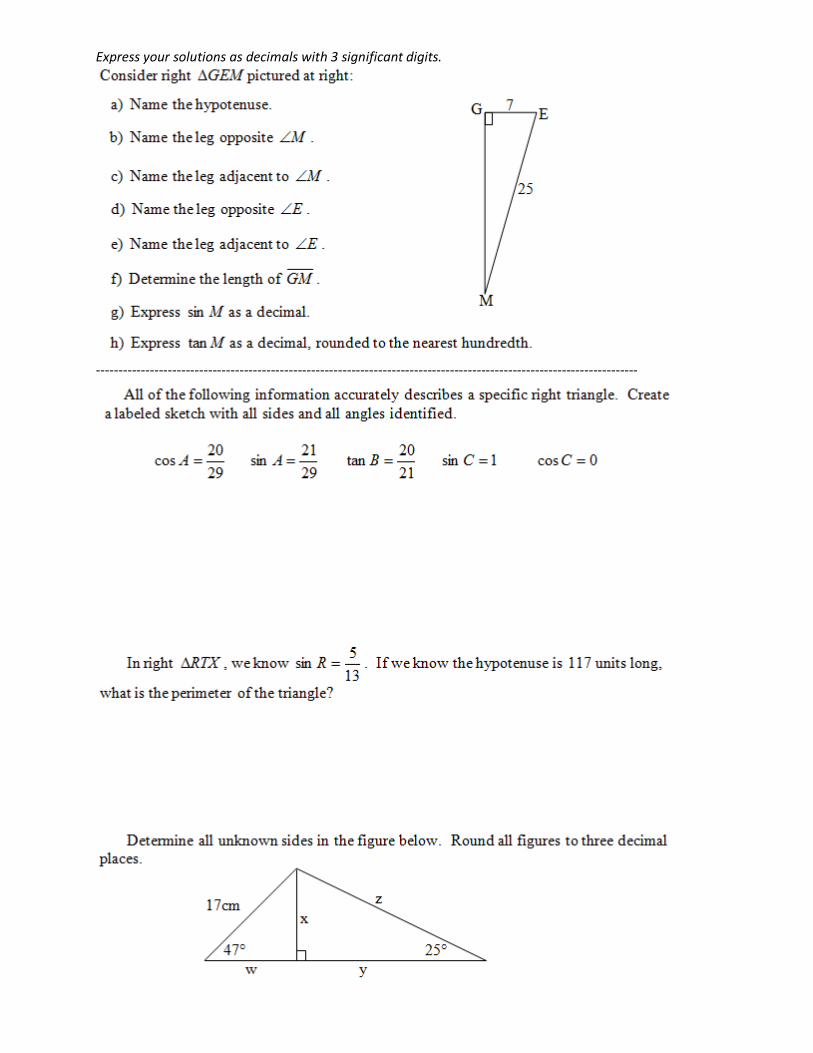
Express your solutions as decimals with 3 significant digits.
-------------------------------------------------------------------------------------------------------------------------