Embed Size (px)
Citation preview
AP Macroeconomics
Business cycles, Unemployment, inflation,
interest rates
Use map for business cycle
What are business cycles?
• Alternating periods of economic growth & contraction.
• Commonly called “business fluctuations” because they are not easily predicted.

Expansion
Period of recovery from a recession
Continues until a new peak is reached
Peak
Point where Real GDP stops going up
RecessionPeriod of decline in Real GDP
Slow expansion (Below 3%) results in GROWTH RECESSION
Must decline for 2 consecutive quarters
Trough
Point where Real GDP stops doing down
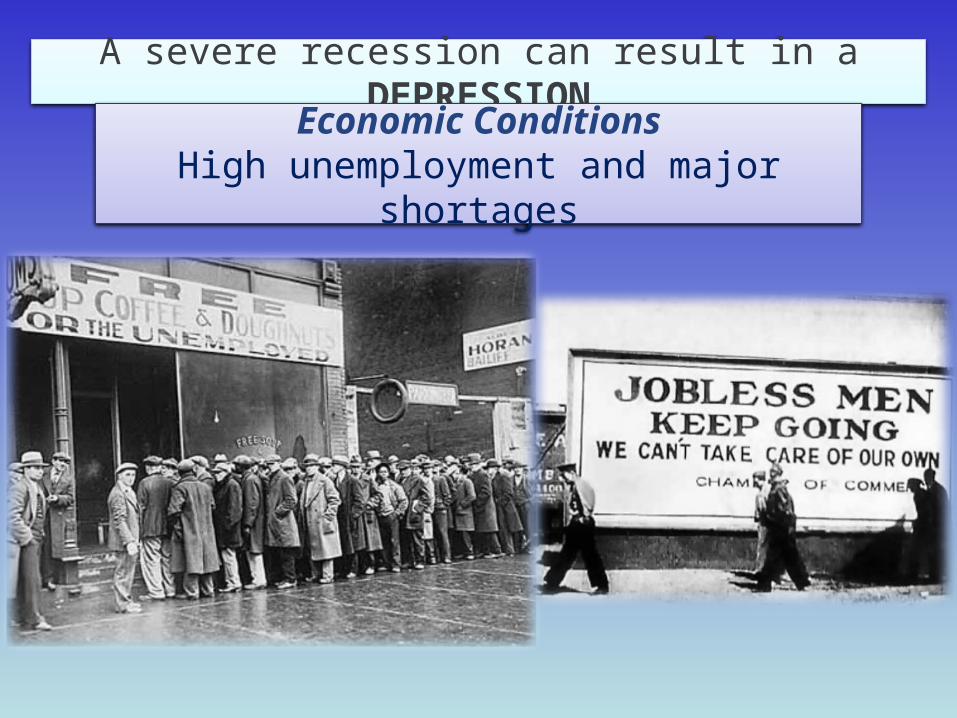
A severe recession can result in a DEPRESSION
Economic ConditionsHigh unemployment and major
shortages
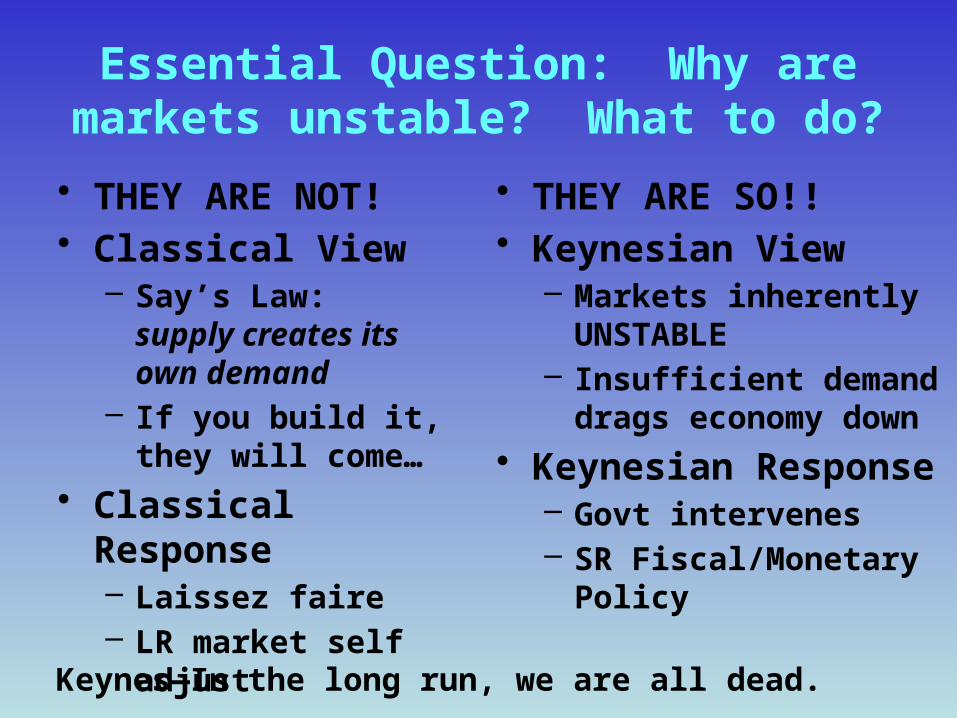
Essential Question: Why are markets unstable? What to do?
• THEY ARE NOT!• Classical View
– Say’s Law: supply creates its own demand
– If you build it, they will come…
• Classical Response– Laissez faire– LR market self
adjust
• THEY ARE SO!!• Keynesian View
– Markets inherently UNSTABLE
– Insufficient demand drags economy down
• Keynesian Response– Govt intervenes– SR Fiscal/Monetary
PolicyKeynes—In the long run, we are all dead.
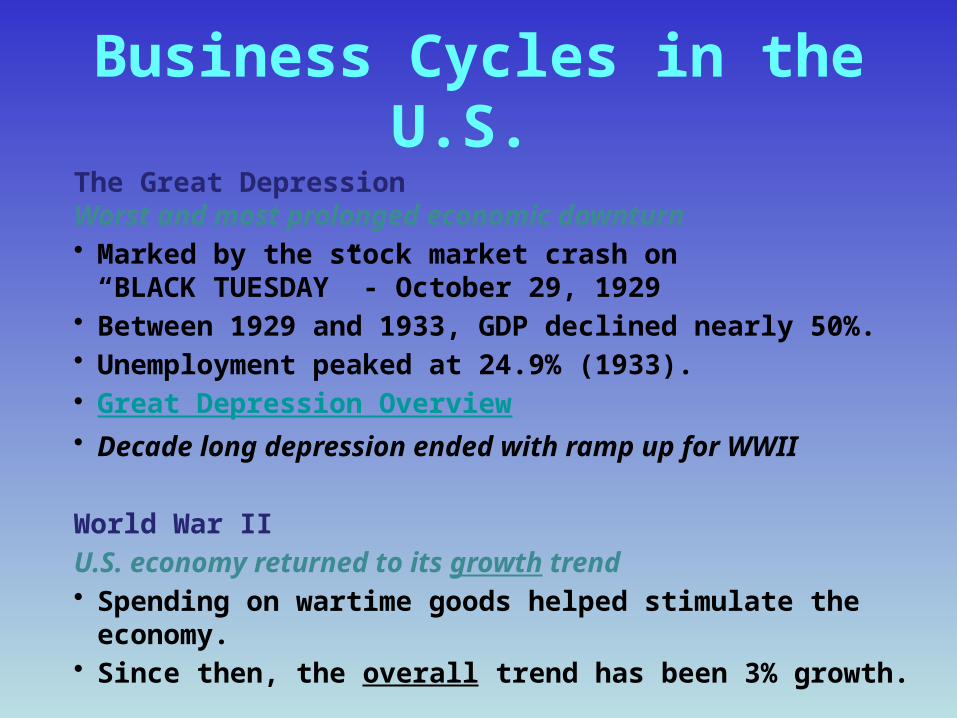
Business Cycles in the U.S.
The Great DepressionWorst and most prolonged economic downturn• Marked by the stock market crash on
“BLACK TUESDAY” - October 29, 1929 • Between 1929 and 1933, GDP declined nearly 50%.• Unemployment peaked at 24.9% (1933).• Great Depression Overview• Decade long depression ended with ramp up for
WWII
World War IIU.S. economy returned to its growth trend• Spending on wartime goods helped stimulate the
economy.• Since then, the overall trend has been 3% growth.

A Model of the Macro Economy
Internal market forces
External shocks
Policy levers
DETERMINANTS
Output
Jobs
Prices
Growth
International balances
OUTCOMES
MACROECONOMY
LO1
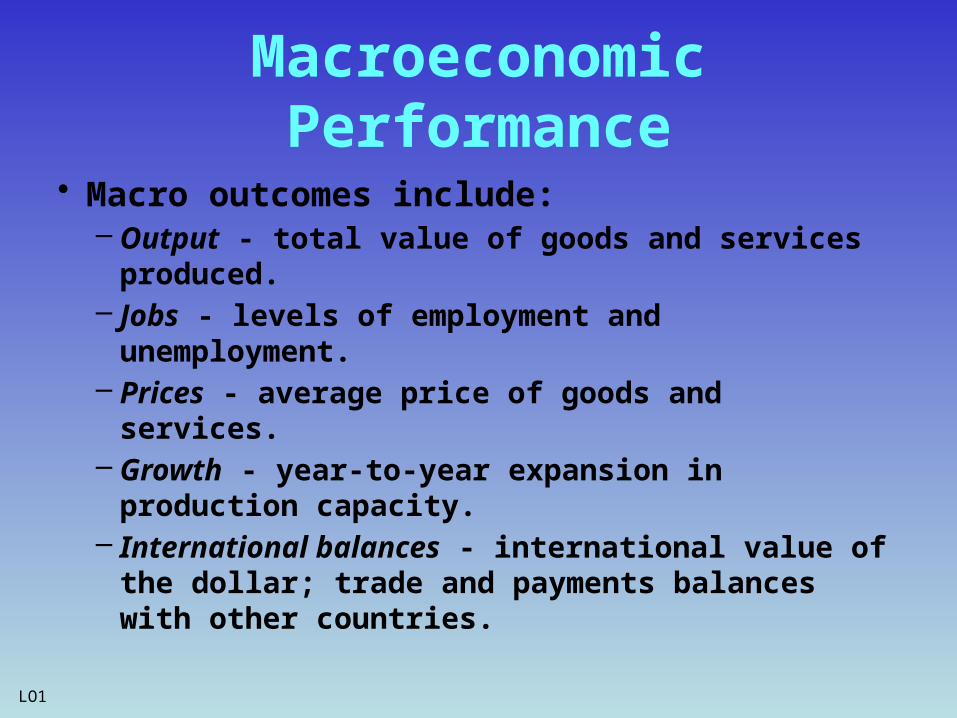
Macroeconomic Performance
• Macro outcomes include:– Output - total value of goods and services
produced.– Jobs - levels of employment and
unemployment.– Prices - average price of goods and
services.– Growth - year-to-year expansion in
production capacity.– International balances - international value
of the dollar; trade and payments balances with other countries.
LO1
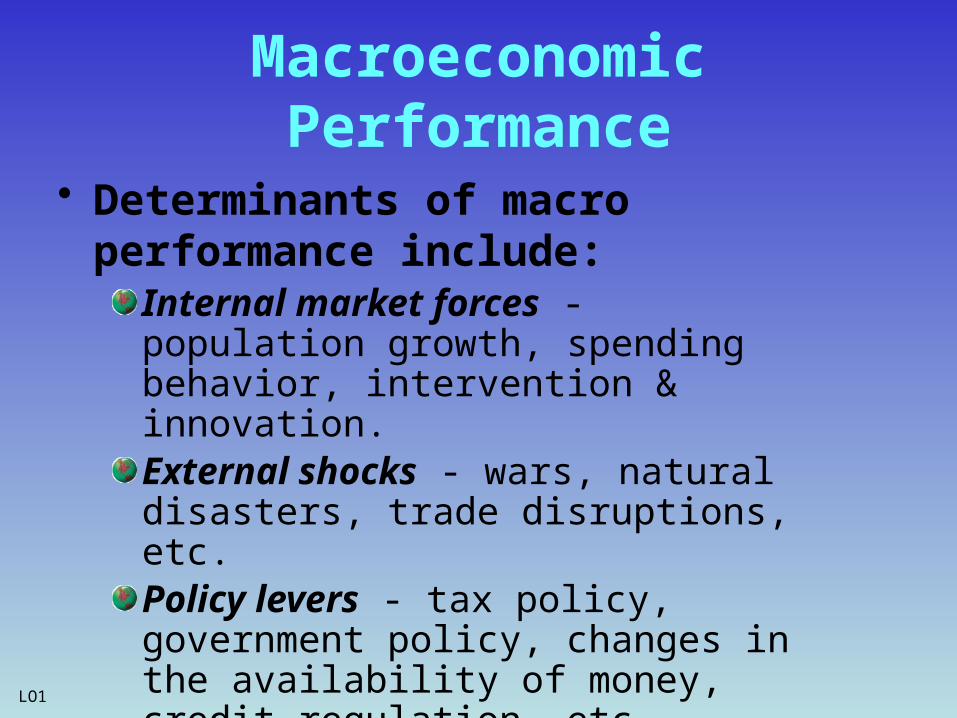
Macroeconomic Performance
• Determinants of macro performance include:
Internal market forces - population growth, spending behavior, intervention & innovation.External shocks - wars, natural disasters, trade disruptions, etc.Policy levers - tax policy, government policy, changes in the availability of money, credit regulation, etc.
LO1
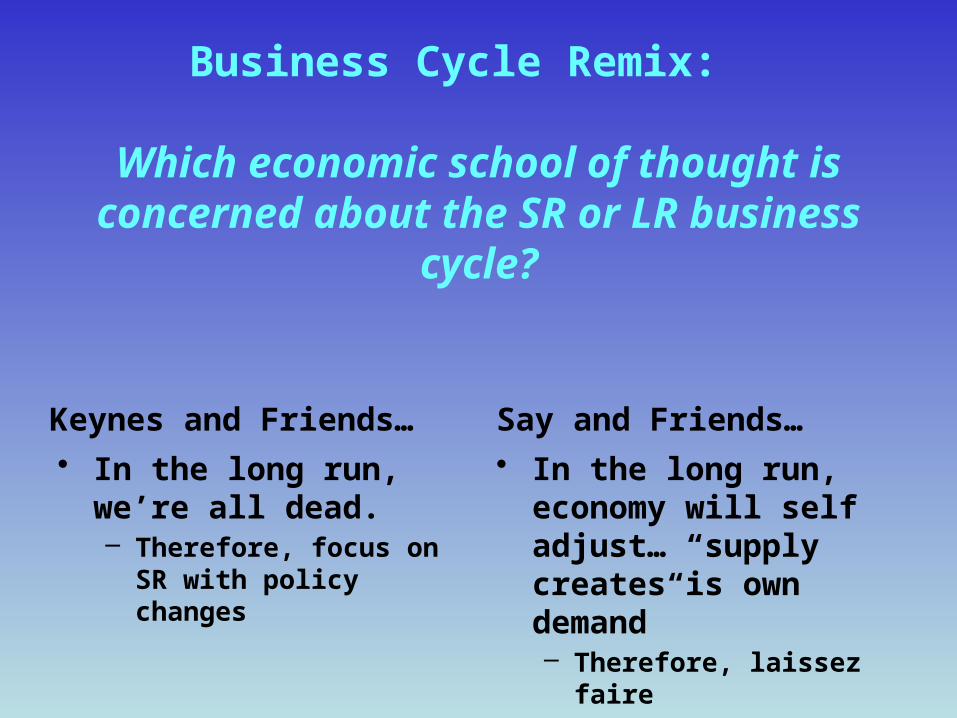
Business Cycle Remix:
Which economic school of thought is concerned about the SR or LR
business cycle?
Keynes and Friends… Say and Friends…• In the long run,
we’re all dead.– Therefore, focus on
SR with policy changes
• In the long run, economy will self adjust… “supply creates is own demand”– Therefore, laissez
faire
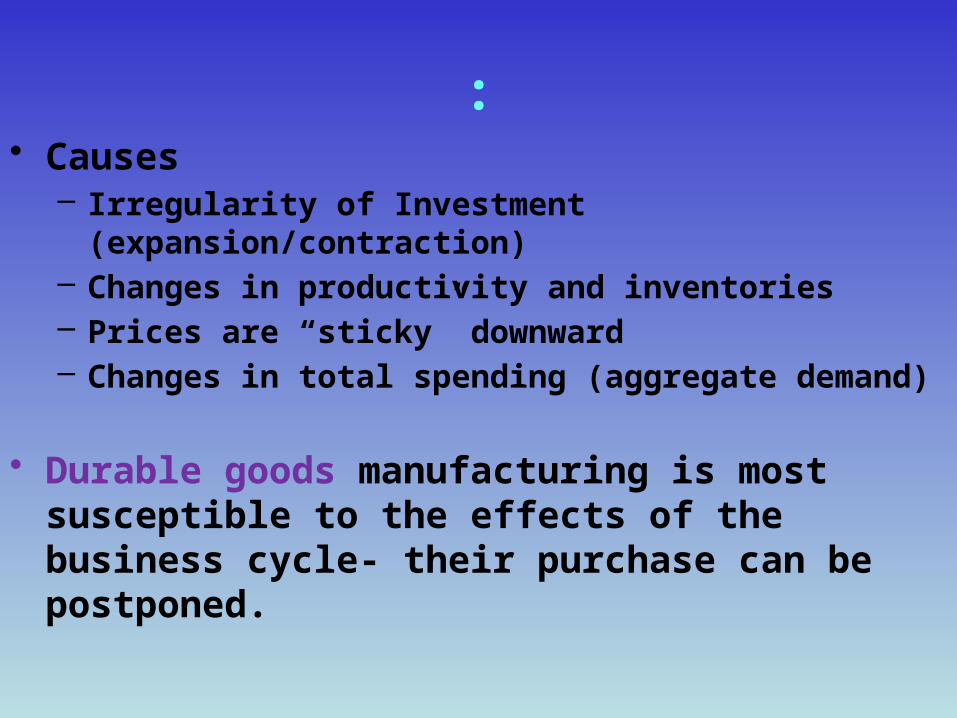
:• Causes
– Irregularity of Investment (expansion/contraction)
– Changes in productivity and inventories– Prices are “sticky” downward– Changes in total spending (aggregate demand)
• Durable goods manufacturing is most susceptible to the effects of the business cycle- their purchase can be postponed.

Unemployment Terms
Population – the number of people in a country
Civilian Labor Force – People aged 16-65 who are either working or actively seeing work – doesn’t include the armed forces, institutionalized, disabled, those not seeking work
Labor Force Participation Rate – percent or working age population in the labor force - US is 66%
Employed – 16 or over with a job – can be either part or full time (at least 1 hour every 2 weeks)
Unemployed – over 16 who don’t have a job but have actively searched in the last two weeks
Unemployment rate – number of unemployed /# of people in the labor force
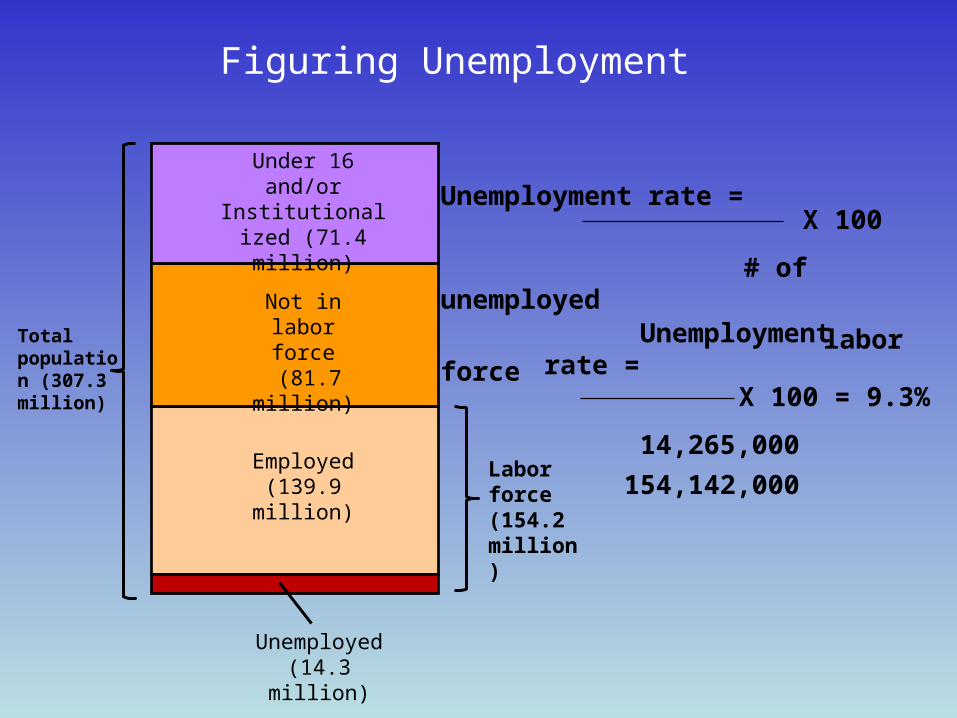
Under 16and/or
Institutionalized (71.4 million)
Not inlaborforce
(81.7 million)
Employed(139.9 million)
Unemployed(14.3 million)
Total population (307.3 million)
Labor force (154.2 million)
Unemployment rate =
14,265,000
154,142,000
X 100 = 9.3%
Unemployment rate =
# of unemployed
labor force
X 100
Figuring Unemployment
Unemployment
This is one of the problems associated with a declining economy. The Bureau of Census identified unemployed persons in their monthly sample. They then turn over their information to the Bureau of Labor Statistics. The official unemployment rate is the result.
Limitations of the Unemployment Rate
• The unemployment rate understates employment conditions for two reasons. – First, the unemployment rate does not count
those who have become too frustrated or discouraged to look for work.
– Second, people are considered employed even when they hold part-time jobs; being employed is not the same as being fully employed.
– are you unemployed?
• Frictional.
• Structural
• Seasonal
• Cyclical
• Watch the video and take notes!
• Types of Unemployment
Kinds of Unemployment
• This can only occur when there is not any cyclical unemployment in the economy, but…….full employment does not mean zero unemployment.
• Associate this with the NRU (natural rate of unemployment). This is the level of u when the economy is producing at full potential. US NRU is about 4-5%.
• FE is found on the PPC, LRAS, and LRPC (we will learn about this!)
Full Employment
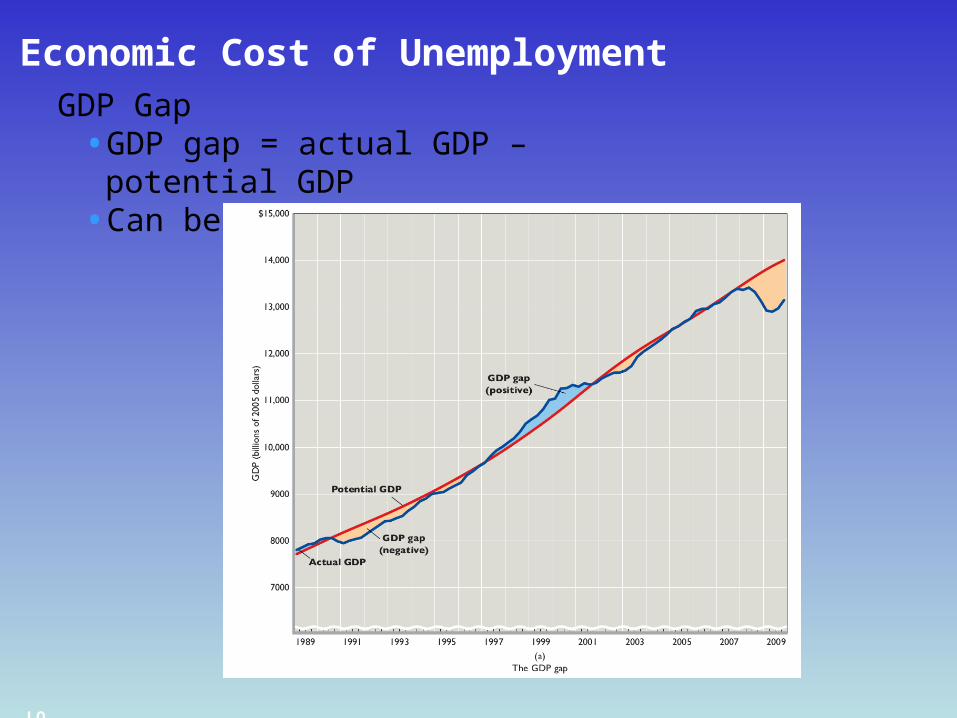
GDP Gap• GDP gap = actual GDP – potential GDP• Can be negative or positive
LO3
Economic Cost of Unemployment
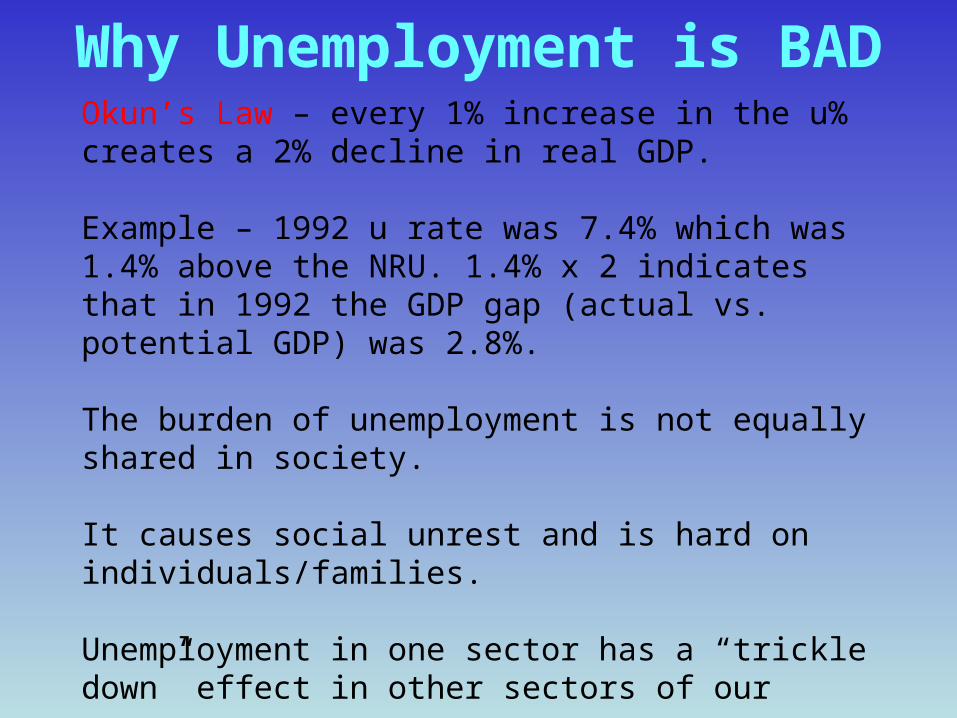
Why Unemployment is BAD
Okun’s Law – every 1% increase in the u% creates a 2% decline in real GDP. Example – 1992 u rate was 7.4% which was 1.4% above the NRU. 1.4% x 2 indicates that in 1992 the GDP gap (actual vs. potential GDP) was 2.8%.
The burden of unemployment is not equally shared in society.
It causes social unrest and is hard on individuals/families.
Unemployment in one sector has a “trickle down” effect in other sectors of our economy.
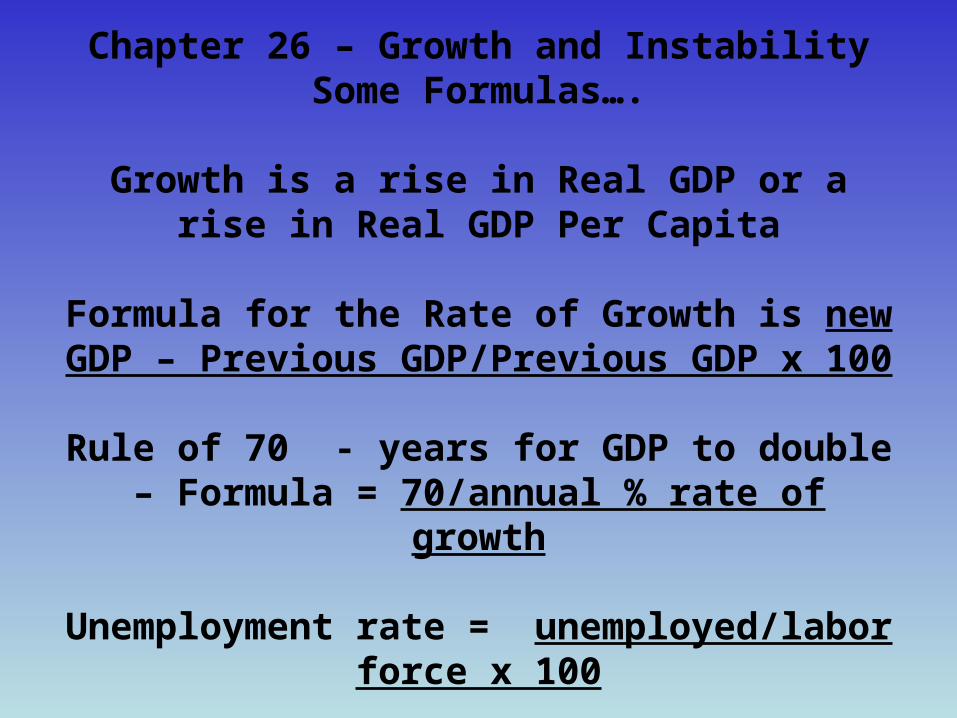
Chapter 26 – Growth and InstabilitySome Formulas….
Growth is a rise in Real GDP or a rise in
Real GDP Per Capita
Formula for the Rate of Growth is new GDP – Previous GDP/Previous GDP x 100
Rule of 70 - years for GDP to double – Formula = 70/annual % rate of growth
Unemployment rate =
unemployed/labor force x 100
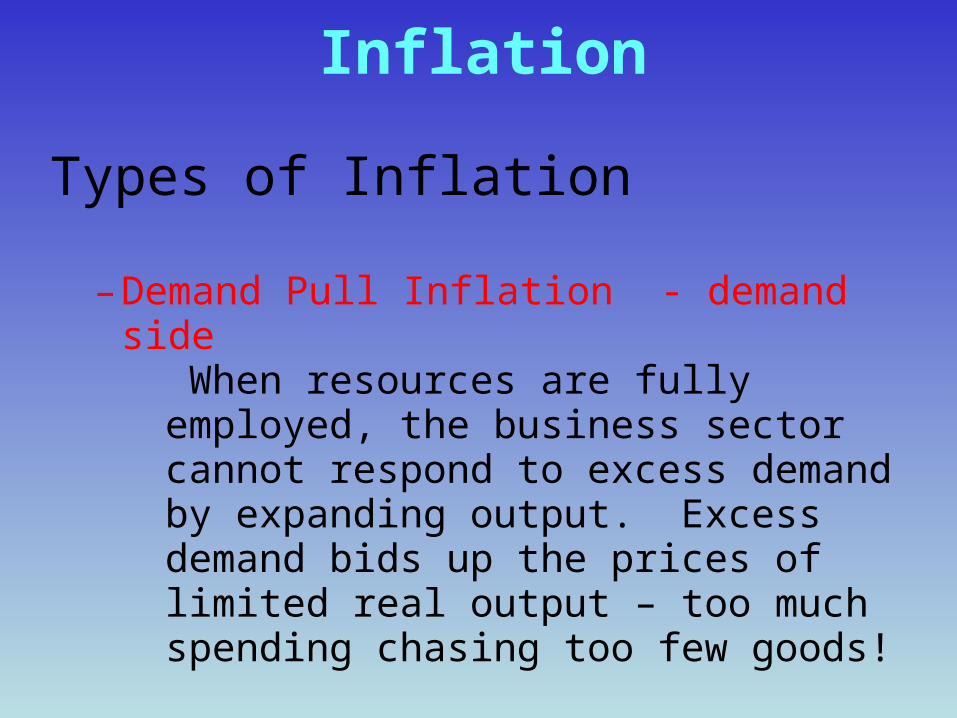
Inflation
Types of Inflation
– Demand Pull Inflation - demand side When resources are fully employed, the business sector cannot respond to excess demand by expanding output. Excess demand bids up the prices of limited real output – too much spending chasing too few goods!
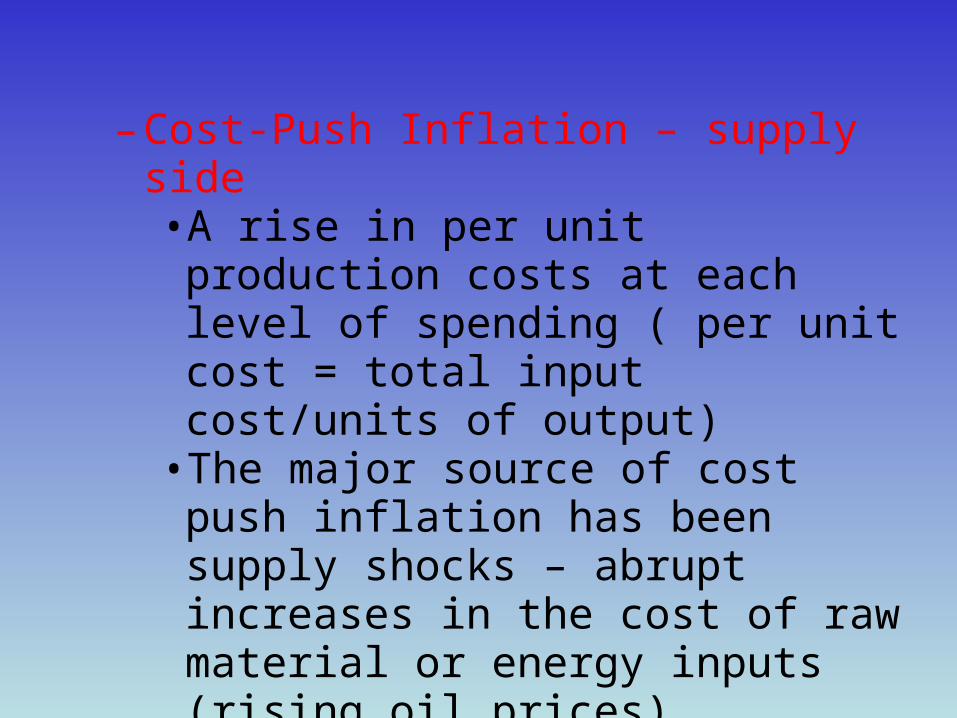
– Cost-Push Inflation – supply side• A rise in per unit production costs at
each level of spending ( per unit cost = total input cost/units of output)
• The major source of cost push inflation has been supply shocks – abrupt increases in the cost of raw material or energy inputs (rising oil prices)
• Reduces real output
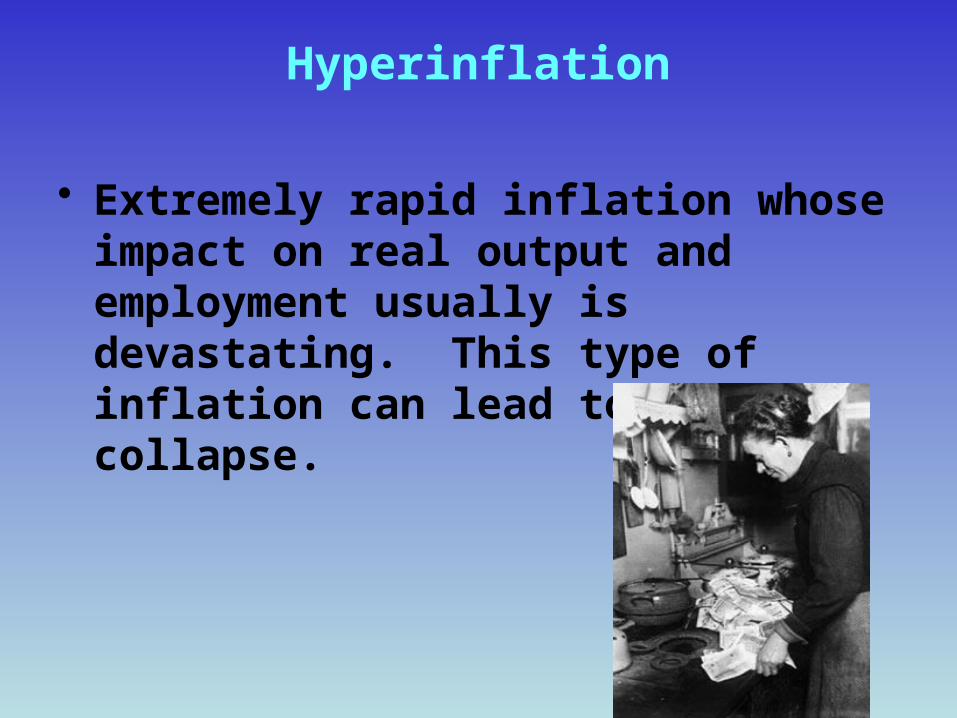
Hyperinflation
• Extremely rapid inflation whose impact on real output and employment usually is devastating. This type of inflation can lead to economic collapse.

Redistributive Effects of Inflation– Nominal Income – number of dollars
received as wages, rent, interest, or profits– Real Income – measure of the amounts of
goods and services nominal income can buy (income adjusted for inflation)
Real Income = Nominal Income / price index (in hundredths)
– Anticipations• Anticipated Inflation – we can reduce
effects of inflation on real income• Unanticipated Inflation – unexpected
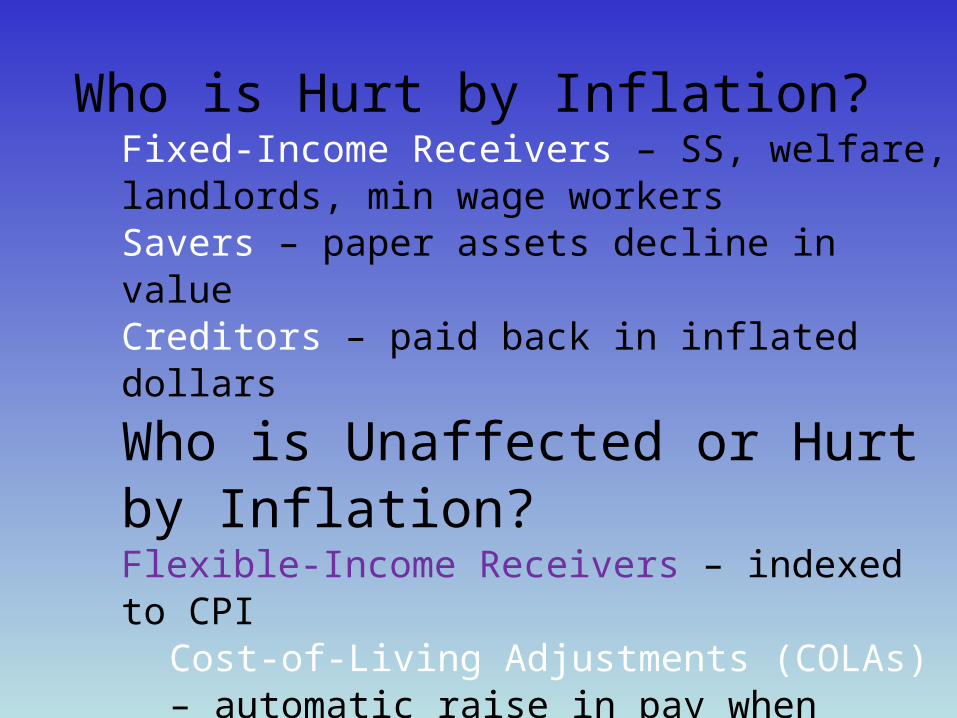
Who is Hurt by Inflation?Fixed-Income Receivers – SS, welfare, landlords, min wage workersSavers – paper assets decline in valueCreditors – paid back in inflated dollars
Who is Unaffected or Hurt by Inflation?Flexible-Income Receivers – indexed to CPI
Cost-of-Living Adjustments (COLAs) – automatic raise in pay when inflation sets in
Debtors – borrowers (Fed govt paying back loans by issuing new ones)
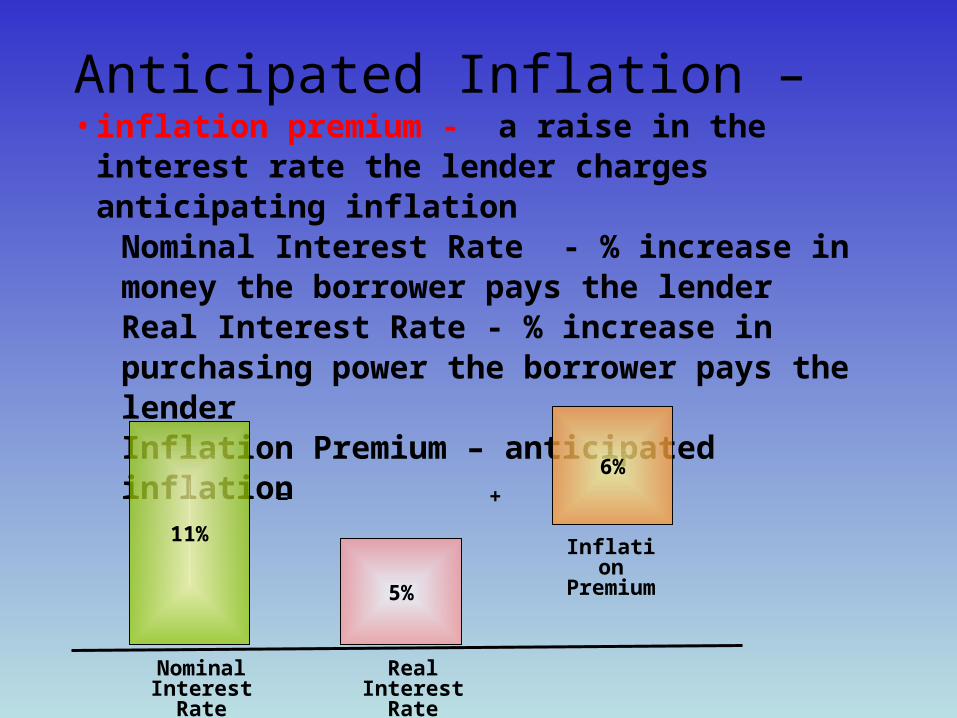
Anticipated Inflation – • inflation premium - a raise in the interest rate the
lender charges anticipating inflationNominal Interest Rate - % increase in money the borrower pays the lenderReal Interest Rate - % increase in purchasing power the borrower pays the lenderInflation Premium – anticipated inflation
NominalInterest
Rate
RealInterest
Rate
InflationPremium
11%
5%
6%
= +
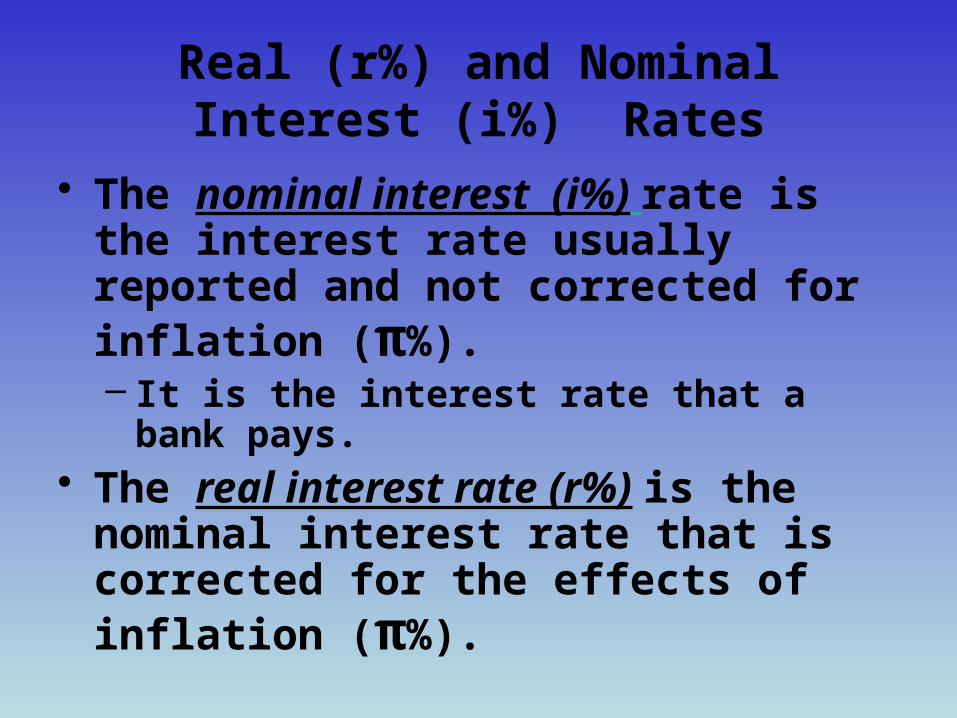
• The nominal interest (i%) rate is the interest rate usually reported and not corrected for inflation (π%). – It is the interest rate that a bank
pays.• The real interest rate (r%) is the
nominal interest rate that is corrected for the effects of inflation (π%).
Real (r%) and Nominal Interest (i%) Rates
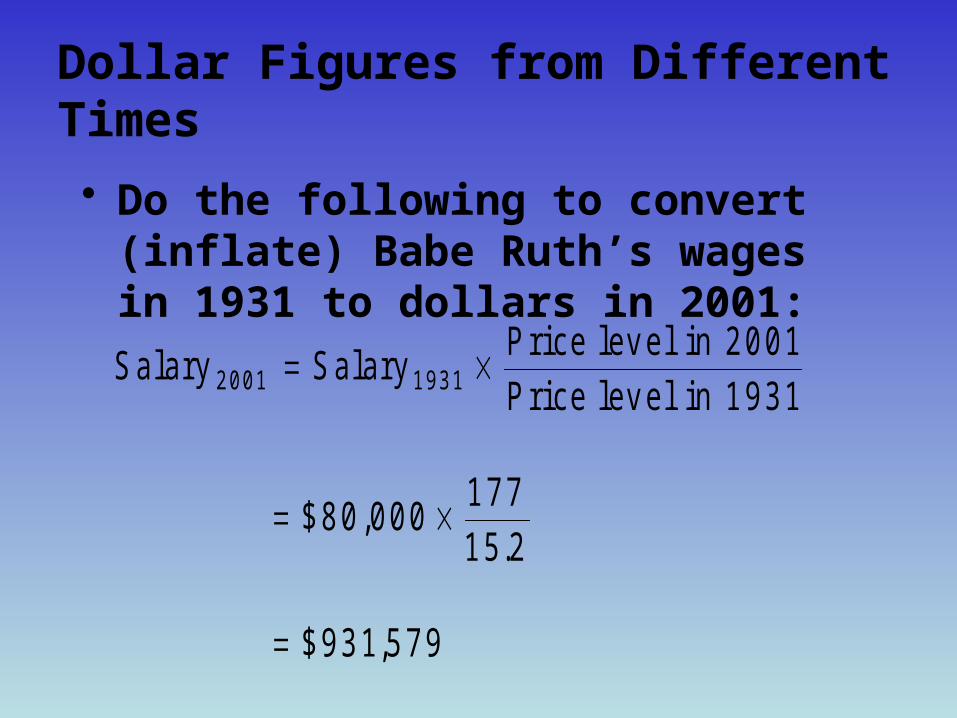
Dollar Figures from Different Times
• Do the following to convert (inflate) Babe Ruth’s wages in 1931 to dollars in 2001:
S alary S ala ryP rice lev e l in 2 0 0 1
P rice lev e l in 1 9 3 12 0 0 1 1 9 3 1
$ 8 0 ,.
$ 9 3 1,
0 0 01 7 7
1 5 2
5 7 9
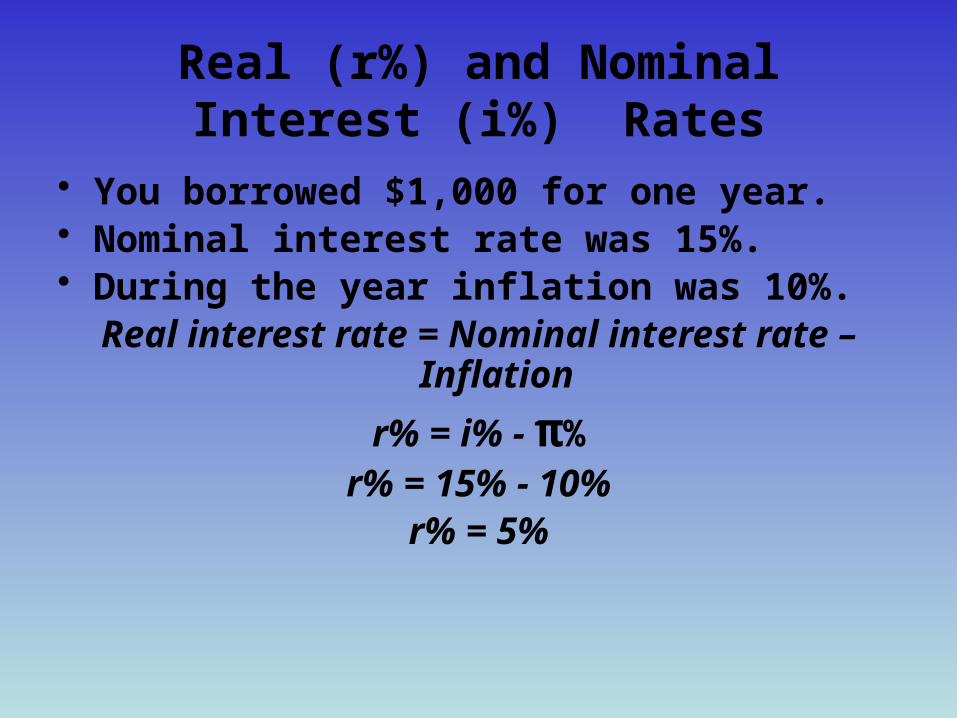
• You borrowed $1,000 for one year.• Nominal interest rate was 15%. • During the year inflation was 10%.
Real interest rate = Nominal interest rate – Inflation
r% = i% - π%r% = 15% - 10%
r% = 5%
Real (r%) and Nominal Interest (i%) Rates
Summary
• The consumer price index shows the cost of a basket of goods and services relative to the cost of the same basket in the base year.
• The index is used to measure the overall level of prices in the economy.
• The percentage change in the CPI measures the inflation rate.
Summary
• The consumer price index is an imperfect measure of the cost of living for the following three reasons: substitution bias, the introduction of new goods, and unmeasured changes in quality.
• Because of measurement problems, the CPI overstates annual inflation by about 1 percentage point.
Summary
• The GDP deflator differs from the CPI because it includes goods and services produced rather than goods and services consumed.
• In addition, the CPI uses a fixed basket of goods, while the GDP deflator automatically changes the group of goods and services over time as the composition of GDP changes.
Summary
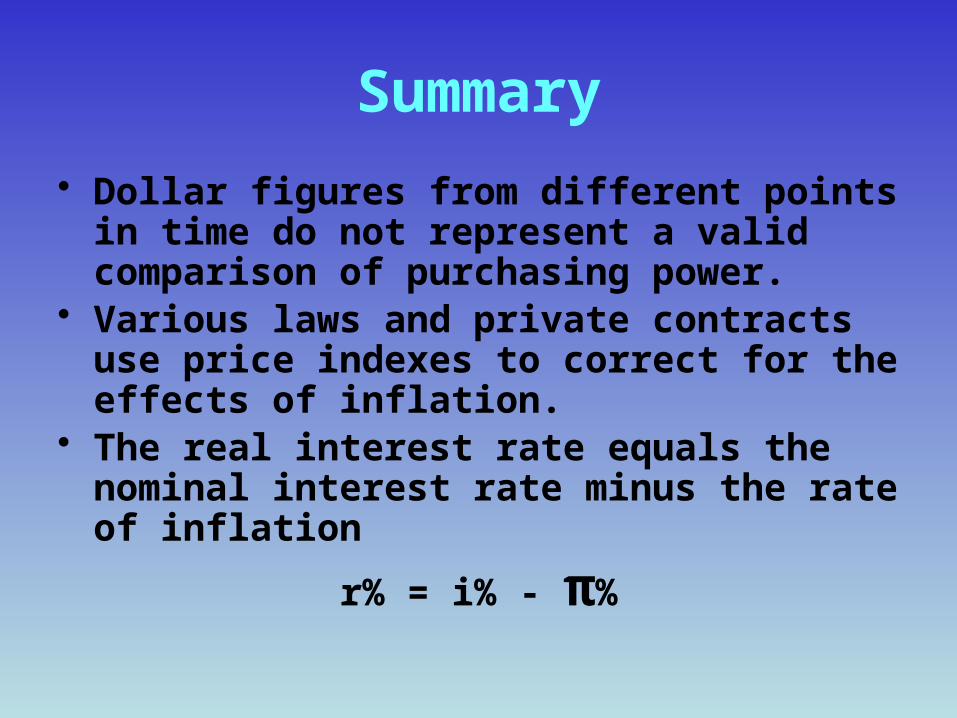
• Dollar figures from different points in time do not represent a valid comparison of purchasing power.
• Various laws and private contracts use price indexes to correct for the effects of inflation.
• The real interest rate equals the nominal interest rate minus the rate of inflation
r% = i% - π%