Embed Size (px)
Citation preview
AP Chemistry
Laboratory
Manual
Bethlehem Central High School
Delmar, New York
(2015-2016)


-i-
Table of Contents
** Indicates lab activities that must be done completely on your own time. Page
How to Keep a Laboratory Notebook ----------------------------------------------------------- ii
How to Write a Formal Laboratory Report ---------------------------------------------------- iii
Laboratory Safety: Precautions and Practices ------------------------------------------------ iv
** Lab-1: Graphing in Microsoft Excel ------------------------------------------------------- 1
Lab-2: Accuracy and Precision ------------------------------------------------------------- 13
Lab-3: Density of an Unknown Solid [A Guided Inquiry Activity] ---------------------- 15
Lab-4: Empirical Formula of a Compound ------------------------------------------------- 17
Lab-5: Paper Chromatography ------------------------------------------------------------- 19
Lab-6: Quantitative Analysis of a Chemical Reaction ----------------------------------- 23
Lab-7: Qualitative Analysis of a Solution [A Guided Inquiry Activity] ---------------- 25
Lab-8: Heat of Neutralization ------------------------------------------------------------- 27
Lab-9: Law of Dulong and Petit ------------------------------------------------------------ 31
Lab-10: Precipitation Titration ------------------------------------------------------------- 33
Lab-11: Activity Series of Selected Metals ----------------------------------------------- 35
Lab-12: Molar Mass of an Unknown Volatile Liquid -------------------------------------- 37
Lab-13: Activity Series of the Halogens --------------------------------------------------- 39
Lab-14: Heat of Solution [A Guided Inquiry Activity] ------------------------------------ 41
Lab-15: Catalysis ----------------------------------------------------------------------------- 43
Lab-16: Chemical Kinetics ------------------------------------------------------------------- 47
Lab-17: Chemical Equilibrium and Le Chatelier’s Principle [A Guided Inquiry Activity] -- 53
Lab-18: Hydrolysis of Salts [A Guided Inquiry Activity] -------------------------------- 55
Lab-19: Buffers ------------------------------------------------------------------------------ 57
Lab-20: The Ksp of a Slightly Soluble Salt ------------------------------------------------ 61
Lab-21: Acid-Base Titration ---------------------------------------------------------------- 63
Lab-22: Redox Titration [A Guided Inquiry Activity] ------------------------------------ 65
Lab-23: Reactions of Acids and Bases ----------------------------------------------------- 69
Lab-24: Spectrophotometry ----------------------------------------------------------------- 73
Lab-25: The Electrolytic Cell --------------------------------------------------------------- 75
Lab-26: Unit Cells: The Crystalline Structure of Metallic Solids ----------------------- 79
Lab-27: Freezing Point Depression and Molar Mass Determination ---------------------- 83
Lab-28: Esterification ----------------------------------------------------------------------- 85

-ii-
How to Keep a Laboratory Notebook
In science, as in most endeavors, the facility for making accurate observations and recording them in
comprehensible fashion is of central importance. The bridge between laboratory observations and
subsequent understanding of them is the observer’s notebook.
Individual scientists, after some experience with this process, develop methods of record keeping which
are uniquely suited to their purposes and inclinations. A criterion one should apply to one’s notebook
keeping is that another investigator with a reasonable degree of familiarity with the field should be able
to reproduce your work using your notebook as a guide.
As a starting point for your record keeping you may find the following observations and suggestions on
notebooks useful.
(1) Good notebook writers acquire their ability through thoughtful practice not inheritance.
(2) Most useful notebooks have the following characteristics:
a) A full name and address of the owner inside or on the front cover.
b) An index of experiments near the front.
c) Numbered and initialed pages.
d) A title for each experiment with a date and a full signature of the investigator.
e) A consistent and clear organization or format for the recording of data and observations.
f) Concise and legible handwriting.
(3) Promptness in recording experimental observations in the notebook enhances their accuracy.
Ideally the notebook is a record of what you observed and not a record of what you thought
you should have observed or of what you observed colored by your expectations. This
difficult aspect of recording observations calls for the utmost in personal honesty. If you
succeed in being honest, you will find your reasoning and understanding of what you are
doing will be continually challenged as you seek the whys and wherefores underlying the
observations.
(4) The notebook should be a bound hard-covered book. Spiral or loose-leaf notebooks are not
recommended, and the keeping of experimental observations on loose sheets or paper scraps
is not acceptable. If corrections are necessary, these should be made with additional notes
rather than erasures.
(5) All data, calculations, notes and doodles pertinent to the experiment should be in the
notebook. A convenient and highly recommended way of accomplishing this end while
preserving order is to use the left hand of the pages of the notebook for calculations, tables of
physical constants that pertain to the experiment and that are imported from sources such as
the CRC, rough copies of chromatograms and/or any other instrument tracings, flowcharts or
other schematic drawings, safety cautions, and other reminders, and to use the right hand
pages for the actual record of the experiment.
(6) The right hand side of your notebook should be concise, legible, and have clear and labeled
sections. You should skip a line or two in between the sections.
a) A title for the experiment with the date and your full signature.
b) A brief statement of the objective of the experiment in a section clearly titled “Purpose”.
c) During the experiment, you should record what you did and what you observed at the
time in a section clearly titled “Procedures and Data” (you may want to keep rough notes
and data on the left side and then to write a coherent record of what you did soon after,
including data and observations, on the right side). Do not rewrite the procedure from
the lab handout. Instead tell, in the briefest possible way, what materials you handled
and what data and/or observations you obtained, so that someone else familiar with the
subject could reproduce your work.
A laboratory notebook should never be confused with a formal laboratory report which is a much more
polished piece of work and which contains an introductory section that includes background information
about the experiment as well as a final section on the discussion and conclusion of the results.
-iii-
How to Write a Formal Laboratory Report
Although there are many different and specific ways to write a formal lab report, there are certain
general guidelines that are common to all. For this class, use the following guidelines.
Make your report concise. Type your report. On the first page, use the class heading and title your
report.
Arrange your report logically. Use the following format and subtitle each section with these
headings:
- Introduction: You should have a paragraph which introduces and gives background to the
experiment. The last sentence of the introduction section should have a clear statement of the
purpose or purposes of the experiment.
- Materials and Methods: You may list the materials (equipment and supplies) used. You should
write the procedure in paragraph from. Be concise, but include enough detail so that anyone could
repeat the experiment as you performed it. Use the passive voice in this section of the report.
- Results and Discussion: In the “Results and Discussion” section, you are to talk about your data
and observations. For each and every Table and Figure you include, you must refer to it somehow
and someplace in this section. In other words, “walk” the reader through your results. What do
your Tables “tell” you that you want the reader to be aware of? Are there any observations or any
other information that you want the reader to know about that would help explain the data in the
Tables? Did you use any equations to produce results from data? What were the equations?
What do your graphs “tell” you that you want the reader to be aware of? Does the plotted data
suggest a trend or pattern, what is that trend or pattern, and what might the trend or pattern mean?
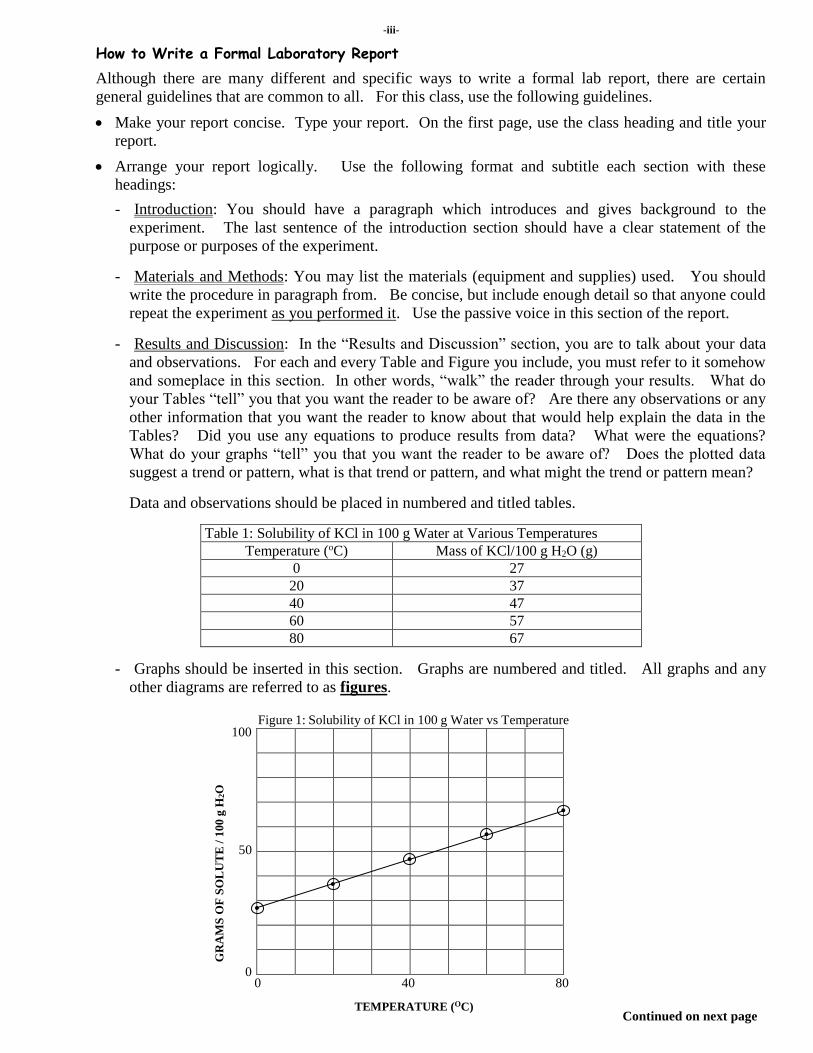
Data and observations should be placed in numbered and titled tables.
Table 1: Solubility of KCl in 100 g Water at Various Temperatures
Temperature (oC) Mass of KCl/100 g H2O (g)
0 27
20 37
40 47
60 57
80 67
- Graphs should be inserted in this section. Graphs are numbered and titled. All graphs and any
other diagrams are referred to as figures.
Continued on next page
TEMPERATURE (OC)
GR
AM
S O
F S
OL
UT
E /
100
g H
2O
0 0
80 40
100
50
Figure 1: Solubility of KCl in 100 g Water vs Temperature
∙
∙
∙
∙
∙

-iv-
- Conclusion: In this section, you wrap up the report. Did you or did you not accomplish your goal
or goals. Did you find something that was unusual or unexpected? In your conclusion, you may
pose a question or problem for a future experiment. For example: “The data suggest that the
solubility of KCl in water is directly related to temperature between 0oC and 80oC. (1) Would this
relationship continue from 80oC up to 100oC? (2) It would be interesting to determine whether
the solubility of other salts in water also have a direct linear relationship with respect to
temperature.”
Laboratory Safety: Precautions and Practices
1) Before coming to the laboratory, read the through the experiment and note any safety warnings.
2) Complete any “Questions for Thought” questions in the introduction portion of the experiment.
3) When necessary, write out lab procedures in your notebook BEFORE your come to lab. ANY
LAB PROCEDURE THAT YOU DEVELOP MUST BE APPROVED BY YOUR TEACHER
BEFORE YOU BEGIN.
4) Shoes must be worn in the laboratory. No open toed shoes are allowed. Avoid wearing overly
bulky or loose fitting clothes. Remove dangling jewelry. Long hair should always be pulled back.
5) Wear a laboratory apron and safety goggles at all times while performing lab.
6) Know the locations of the eye wash stations, the safety showers, the fire extinguisher, and the fire
blanket, and know how to use them.
7) Be aware of all the exits from the laboratory.
8) Do not chew gum, eat food, or drink in the laboratory. Do not apply make-up or lip balm in the
laboratory. Never taste any chemicals and keep your hands away from your face when handling
chemicals. Wash your hands after handling chemicals.
9) Listen to all directions given by your teacher during the pre-lab discussion period.
10) Make sure know how to properly and safely use all laboratory equipment during an experiment.
11) Conduct only assigned experiments and only when your teacher is present.
12) Read and understand each step of the experiment completely before performing it. Ask for help
from your teacher if you have any questions or concerns about a step in the procedure.
13) Keep your workspace clear of any nonessential materials.
14) Check all glassware for chips or cracks before using them and notify the teacher if you discover
any.
15) When using a Bunsen burner be sure that long hair is pulled back and that loose or flowing clothing
is secure. Never leave a lit Bunsen burner unattended.
16) Never use a Bunsen burner when a flammable liquid is being used.
17) Read the label on any chemicals or solutions that are being used to be sure that you have the correct
chemical or solution.
18) Notify the teacher immediately of any spills, breakage, burns, cuts, or any other accidents.
19) To avoid contamination, never return chemicals or solutions to their containers after you have
dispensed them.
20) When diluting an acid, always pour the acid slowly into water while stirring to dissipate the heat.
21) When heating a liquid in a test tube, turn the mouth of the test tube away from yourself and others.
22) Return all materials to their proper place at the end of each experiment.
23) Properly dispose of all unused chemicals or solutions at the end of the experiment. Your teacher
will instruct you as to the proper disposal.
24) Leave your work area clean at the end of each experiment.
25) Wash your hands with soap and water at the end of each experiment.
-1-
Lab-1: Graphing in Microsoft Excel
Introduction:
In many chemical and physical changes, one characteristic changes as a result of a change in another
characteristic. Data concerning changing characteristics is collected and usually placed in a table for
analysis. However, it is very difficult to visualize the magnitude of the dependence of one variable upon
another by looking at a table. A more descriptive way of displaying data is by the use of a graph.
Why data is graphed:
When an experiment generates many measurements, it can be difficult to make sense of or see patterns in
all the information. Graphing the results of an experiment involving two variables helps to make the
relationship of the variables more obvious. A graph can help analyze data and clarify patterns.
How to plot a scientific graph:
Scientific graphs show the relationship between experimental variables. One variable is called the
independent variable. The independent variable is the one that the experimenter changes in the
experiment. The independent variable is plotted on the horizontal, or "x", axis of the graph. The second
variable, called the dependent variable, is plotted on the vertical, or "y", axis of the graph. The dependent
variable is the one that responds to changes in the independent variable. The independent variable is the
variable that is usually known and can usually be determined (preset) before the start of the experiment.
The independent variable is INDEPENDENT of the experiment BECAUSE it can usually be determined
before the start of the experiment. The dependent variable is the variable that is unknown and must be
determined by running the experiment. The dependent variable is DEPENDENT on the experiment
BECAUSE it can only be determined by running the experiment.
How to title a scientific graph:
Scientific graphs are titled using the titles of the axes. When titling a graph you mention the y-axis first
(the dependent variable) and then you mention the x-axis (the independent variable).
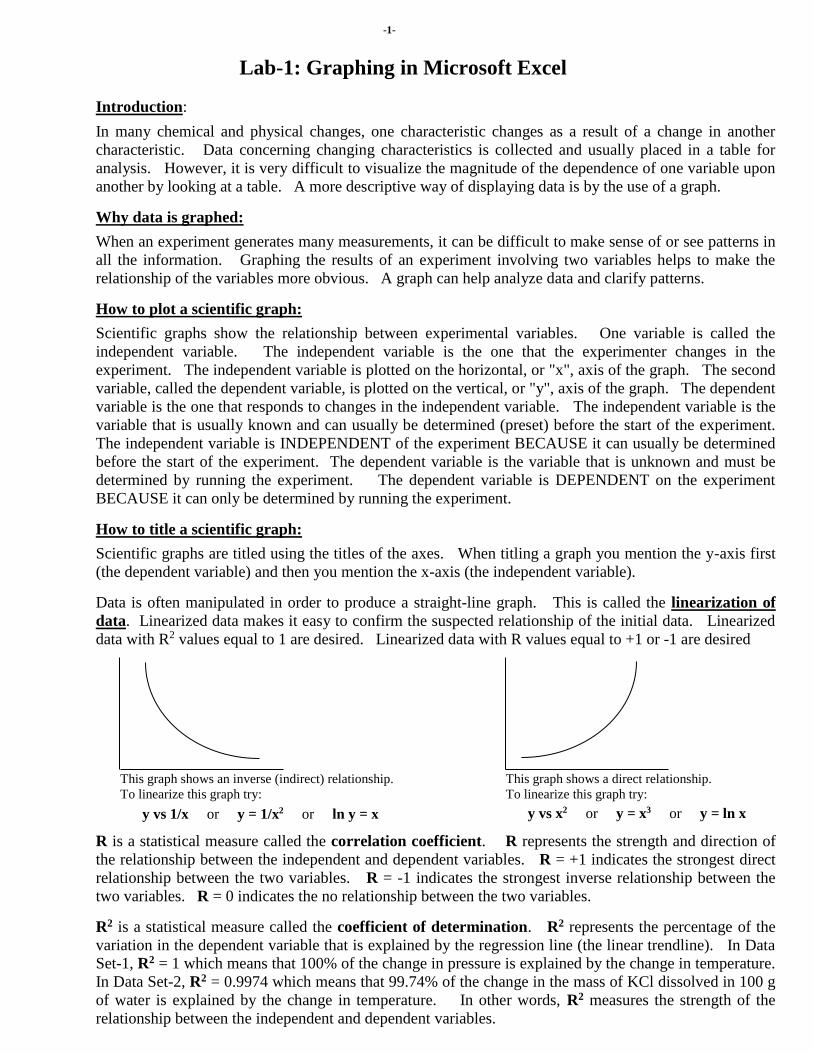
Data is often manipulated in order to produce a straight-line graph. This is called the linearization of
data. Linearized data makes it easy to confirm the suspected relationship of the initial data. Linearized
data with R2 values equal to 1 are desired. Linearized data with R values equal to +1 or -1 are desired
R is a statistical measure called the correlation coefficient. R represents the strength and direction of
the relationship between the independent and dependent variables. R = +1 indicates the strongest direct
relationship between the two variables. R = -1 indicates the strongest inverse relationship between the
two variables. R = 0 indicates the no relationship between the two variables.
R2 is a statistical measure called the coefficient of determination. R2 represents the percentage of the
variation in the dependent variable that is explained by the regression line (the linear trendline). In Data
Set-1, R2 = 1 which means that 100% of the change in pressure is explained by the change in temperature.
In Data Set-2, R2 = 0.9974 which means that 99.74% of the change in the mass of KCl dissolved in 100 g
of water is explained by the change in temperature. In other words, R2 measures the strength of the
relationship between the independent and dependent variables.
This graph shows an inverse (indirect) relationship.
To linearize this graph try:
y vs 1/x or y = 1/x2 or ln y = x
This graph shows a direct relationship.
To linearize this graph try:
y vs x2 or y = x3 or y = ln x

-2-
Purpose: To learn to graph data in Microsoft Excel.
BELOW IS A PROCEDURE FOR GRAPHING IN MICROSOFT EXCEL 2013.
AT HOME, SOME OF YOU MAY HAVE MICROSOFT EXCEL 2010, MICROSOFT EXCEL 2007, OR
EVEN MICROSOFT EXCEL 2003. EACH IS SLIGHTLY DIFFERNT FROM MICROSOFT EXCEL
2013. IF YOU HAVE MICROSOFT EXCEL 2010 OR MICROSOFT EXCEL 2003 AT HOME, THERE
ARE PROCEDURES FOR THESE VERSIONS LATER IN THIS WORKSHEET. HOWEVER, IF YOU
HAVE MICROSOFT EXCEL 2007 AT HOME, YOU WILL NEED TO FIGURE IT OUT BY STUDYING
BOTH OF THE PROCEDURES FOR MICROSOFT EXCEL 2010 AND MICROSOFT EXCEL 2003.
Procedure-1: [using Microsoft Excel 2013]
1) Open Microsoft Excel 2013. In column A, fill in the data for the independent variable. In column
B, fill in the data for the dependent variable. In a two column data table, it is traditional that the
data for the independent variable is in the left hand column and that the data for the dependent
variable is in the right hand column.
2) Highlight the data in the data table and then click on “Insert” at the top of the screen.
3) In the “Charts” section at the top of the screen, find and click on the icon for “Insert Scatter (X,Y) or
Bubble Chart” and then click on the first icon under scatter.
4) Click on the big + on the upper right of the chart to reveal “Chart Elements” and then click on
“Axes”, “Axis Titles”, “Chart Title”, and “Gridlines”. Hold mouse arrow on the word “Gridlines”
until a grey arrow appears on the right. Click on arrow and then click on all four boxes.
5) Click on “Chart Title” and title your graph using the format: Dependent Variable Name versus
Independent Variable Name.
6) Then label your axes. Include units in parentheses after your label. Example: Pressure (atm),
Mass (g), Time (min). For temperature, write the unit as (oC). To superscript the “o”, highlight
the “o” symbol and then click on “Home” at the top of the screen. Then click on small arrow under
the “Font” section and then click on “superscript” and then OK.
7) At this point, your graph is unfinished and is going to need some formatting.
8) Lengthen your graph by dragging down the bottom until the graph appears as 8.5 by 11 inch page
(all graph will be printed “in portrait”.
9) To manually scale the x-axis, right click on any number of the x-axis and then click on “Format
Axis”. Then in the “Bounds” section, type in the minimum value and the maximum value for the x-
axis.
10) You will have to then type in values for the major and minor increments. You may need to adjust
these major and minor units so that the entire x-axis begins and ends where you want it to!
The “Minor unit” should be , , , or of the “Major unit”.
11) You may need to click “axis value” under the section “Vertical axis crosses” to set the value to be
the same as the minimum value in the “Bounds” section.
12) Repeat for the y-axis.
If you want to connect-the-points: (if not, skip to step-14)
13) To connect-the-points, right click on one of the plotted data points from a data set and then click on
“Format Data Series”. Then click on the “paint can” icon and then click on “solid line”. Under
“Line”, adjust style and weight and change color to black. Your graph should now be done!
-3-
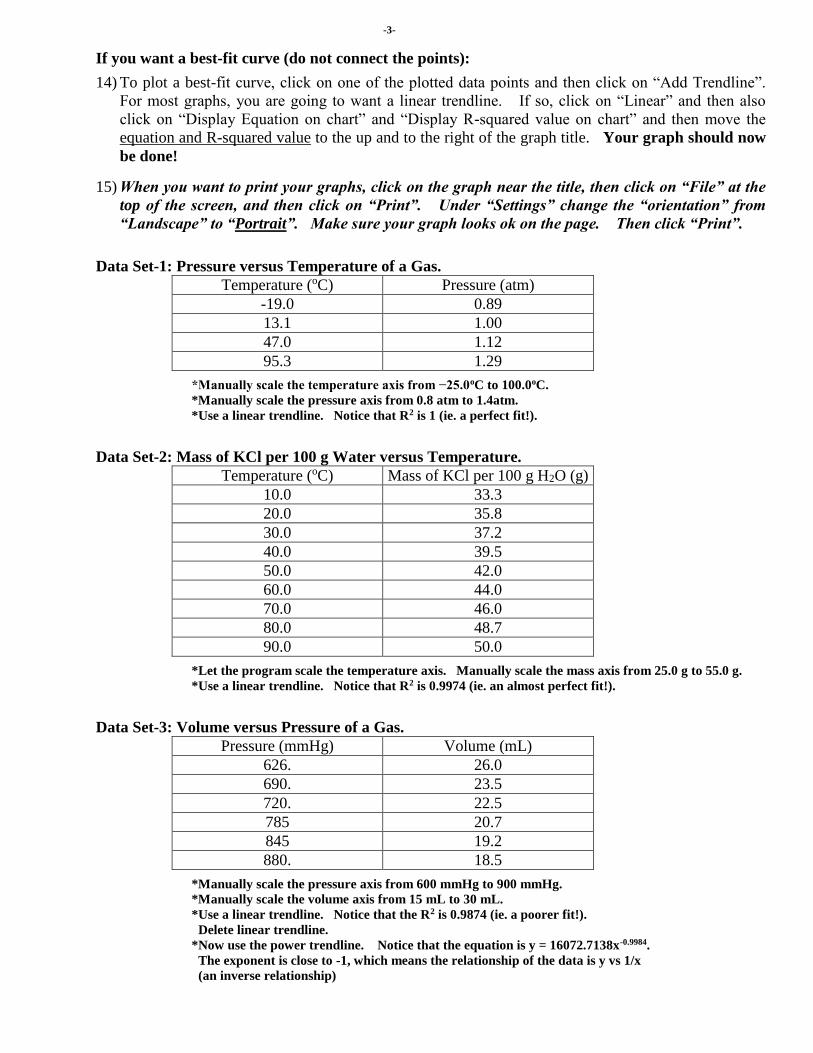
If you want a best-fit curve (do not connect the points):
14) To plot a best-fit curve, click on one of the plotted data points and then click on “Add Trendline”.
For most graphs, you are going to want a linear trendline. If so, click on “Linear” and then also
click on “Display Equation on chart” and “Display R-squared value on chart” and then move the
equation and R-squared value to the up and to the right of the graph title. Your graph should now
be done!
15) When you want to print your graphs, click on the graph near the title, then click on “File” at the
top of the screen, and then click on “Print”. Under “Settings” change the “orientation” from
“Landscape” to “Portrait”. Make sure your graph looks ok on the page. Then click “Print”.
Data Set-1: Pressure versus Temperature of a Gas.
Temperature (oC) Pressure (atm)
-19.0 0.89
13.1 1.00
47.0 1.12
95.3 1.29
*Manually scale the temperature axis from −25.0oC to 100.0oC.
*Manually scale the pressure axis from 0.8 atm to 1.4atm.
*Use a linear trendline. Notice that R2 is 1 (ie. a perfect fit!).
Data Set-2: Mass of KCl per 100 g Water versus Temperature.
Temperature (oC) Mass of KCl per 100 g H2O (g)
10.0 33.3
20.0 35.8
30.0 37.2
40.0 39.5
50.0 42.0
60.0 44.0
70.0 46.0
80.0 48.7
90.0 50.0
*Let the program scale the temperature axis. Manually scale the mass axis from 25.0 g to 55.0 g.
*Use a linear trendline. Notice that R2 is 0.9974 (ie. an almost perfect fit!).
Data Set-3: Volume versus Pressure of a Gas.
Pressure (mmHg) Volume (mL)
626. 26.0
690. 23.5
720. 22.5
785 20.7
845 19.2
880. 18.5
*Manually scale the pressure axis from 600 mmHg to 900 mmHg.
*Manually scale the volume axis from 15 mL to 30 mL.
*Use a linear trendline. Notice that the R2 is 0.9874 (ie. a poorer fit!).
Delete linear trendline.
*Now use the power trendline. Notice that the equation is y = 16072.7138x-0.9984.
The exponent is close to -1, which means the relationship of the data is y vs 1/x
(an inverse relationship)

-4-
LINEARIZING DATA
You are now going to linearize the data from Data Set-3. Calculate the inverse pressures for the
pressures in Data Set-3. Round you values to the nearest hundred thousandths place (the nearest
0.00001) and record the values in the data table below.
Data Set-4: Volume versus Inverse Pressure of a Gas.
Inverse Pressure (mmHg-1) Volume (mL)
26.0
23.5
22.5
20.7
19.2
18.5
*Manually scale the inverse pressure axis from 0.00110 mmHg-1 to 0.00170 mmHg-1.
*Manually scale the volume axis from 15 mL to 30 mL.
*Use linear trendline. Notice that the R2 is 0.9997 (ie. an almost perfect fit!).
GRAPHING TWO DATA SETS ON THE SAME GRAPH
1) In column A, fill in the independent variable for the first data set. In column B, fill in the dependent
variable for the first data set. In column C, fill in the independent variable for the second data set.
In column D, fill in the dependent variable for the second data set.
2) Highlight the data for the first data set in the data table and then click on “Insert” at the top of the
screen.
3) In the “Charts” section at the top of the screen, find and click on the icon for “Insert Scatter (X,Y) or
Bubble Chart” and then click on the first icon under scatter. A graph should appear.
4) Click on the big + on the upper right of the new graph to reveal “Chart Elements” and then click on
“Axes”, “Axis Titles”, “Chart Title”, “Gridlines” AND “Legend”.
5) While still in this section, hold mouse arrow on the word “Gridlines” until a grey arrow appears on
the right. Click on arrow and then click on all four boxes.
6) The first data set will be referred to as Series1. Right Click on “Series1” and then click on “Select
Data” and then click on “Edit”. Type in a series name for the first data set (Series1) and then click
OK, and then click OK again.
7) Right Click on “Series1” and then click on “Select Data” and THEN click on the “Add” button.
Type a name in for the second data set (Series2).
8) NOW click in the space right below “Name” called “X Values” and THEN highlight the data from
column C. Some gobbledygook should appear in the “X Values” space!
9) Now delete the {1} from the space below “X Values called “Y Values” and THEN highlight the data
from column D. Some gobbledygook should appear in the “Y Values” space! NOW click OK. At
this point, both data sets should be graphed but your graph is going to need some formatting.
10) Lengthen your graph by dragging down the bottom until the graph appears square.
11) Click on “Chart Title” and title your graph using the format: Dependent Variable Name versus
Independent Variable Name.
12) Click on “Axis Title” for the x-axis and type in a label for the x-axis axis including units. For
example: Pressure (atm), Mass (g), Time (min). For temperature, write the unit as (oC). To
superscript the “o”, highlight the “o” symbol and then click on “Home” at the top of the screen.
Then click on small arrow under the “Font” section and then click on “superscript” and then OK.
-5-
13) Repeat for the y-axis.
14) To manually scale the x-axis, right click on any number of the x-axis and then click on “Format Axis”.
Then in the “Bounds” section, type in the minimum value and the maximum value for the x-axis.
15) You will have to then type in values for the major and minor increments. You may need to adjust
these major and minor units so that the entire x-axis begins and ends where you want it to!
The “Minor unit” should be , , , or of the “Major unit”.
16) You may need to click “axis value” under the section “Vertical axis crosses” to set the value to be the
same as the minimum value in the “Bounds” section.
17) Repeat for the y-axis.
18) Right click on one of the plotted data points in the first data set and then click on “Format Data
Series”. A window will appear at the right. Click on the Paint Can” icon, then on “Marker”, and
then click on “Marker Options”. Under “Marker Options” you can change the size and/or customize
the style of your data points by clicking on “Built in”. Now you change the size and/or customize the
style of you data points.
19) ALL DATA POINTS SHOULD BE BLACK! Right click on one of the plotted data points in the
first data set and then click on “Format Data Series”. A window will appear at the right. Click on
the Paint Can” icon, then on “Marker”. Under the “Fill” section change the color to black. Under
the “Border” section change the color to black.
If you want to connect-the-points: (if not, skip to step-21)
20) To connect-the-points, right click on one of the plotted data points from a data set and then click on
“Format Data Series”. At the very top, click on the pencil icon called “outline” and then change the
color to black. To adjust the weight of the line click on the pencil icon called “outline” and then near
the bottom you can change the weight of the line. Repeat for the other data set. Your graph should
now be done!
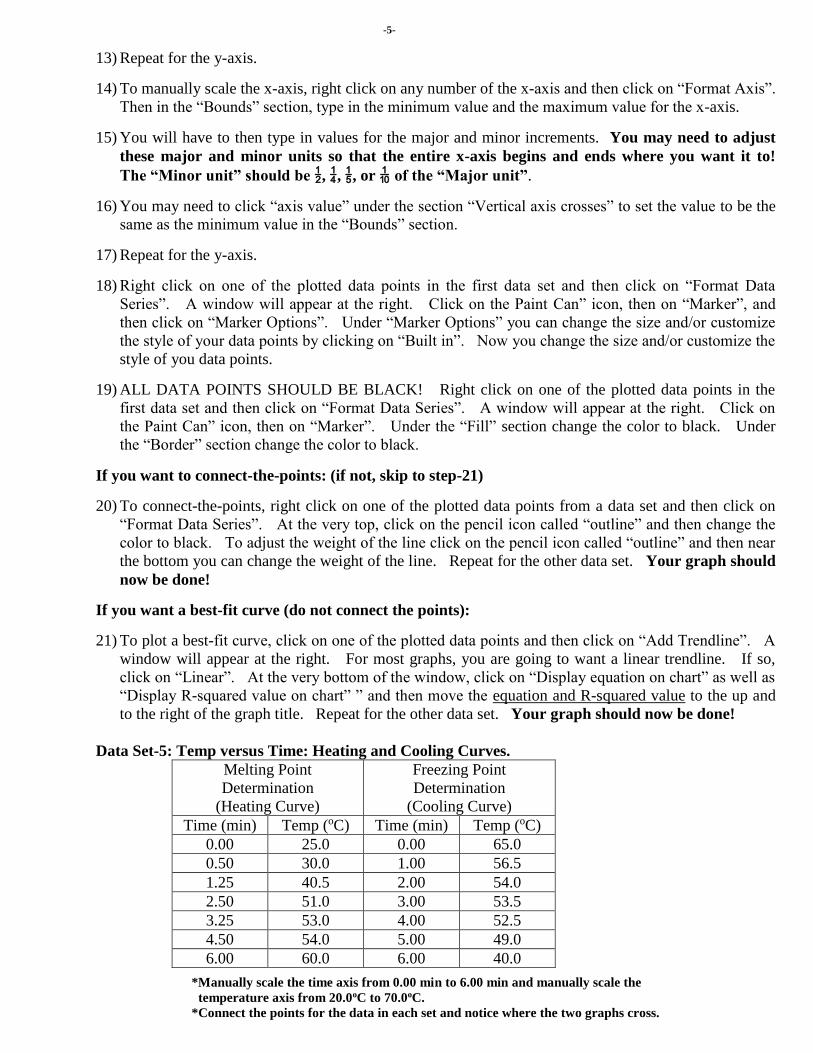
If you want a best-fit curve (do not connect the points):
21) To plot a best-fit curve, click on one of the plotted data points and then click on “Add Trendline”. A
window will appear at the right. For most graphs, you are going to want a linear trendline. If so,
click on “Linear”. At the very bottom of the window, click on “Display equation on chart” as well as
“Display R-squared value on chart” ” and then move the equation and R-squared value to the up and
to the right of the graph title. Repeat for the other data set. Your graph should now be done!
Data Set-5: Temp versus Time: Heating and Cooling Curves.
Melting Point
Determination
(Heating Curve)
Freezing Point
Determination
(Cooling Curve)
Time (min) Temp (oC) Time (min) Temp (oC)
0.00 25.0 0.00 65.0
0.50 30.0 1.00 56.5
1.25 40.5 2.00 54.0
2.50 51.0 3.00 53.5
3.25 53.0 4.00 52.5
4.50 54.0 5.00 49.0
6.00 60.0 6.00 40.0
*Manually scale the time axis from 0.00 min to 6.00 min and manually scale the
temperature axis from 20.0oC to 70.0oC.
*Connect the points for the data in each set and notice where the two graphs cross.

-6-
Procedure-2: [using Microsoft Excel 2010]
1) Open Microsoft Excel 2010. In column A, fill in the data for the independent variable. In column B,
fill in the data for the dependent variable. In a two column data table, it is traditional that the data
for the independent variable is in the left hand column and that the data for the dependent variable is
in the right hand column. (See Data Set-1 on the next page.)
2) Highlight the data in columns A and B. Click on “Insert” at the top of the screen. Next click on the
“Scatter” icon found at the top of the screen and then click on the drop down choice that looks exactly
like the “Scatter” icon. This should produce a scatter graph of the data.
3) You are now in a tab called “Chart Tools”. Click on the “layout-1” icon found under the “Design”
sub-tab of the “Chart Tools” tab.
4) To title your graph and label your axes, click on the textbox for each and type in the graph title or axis
name. For titles, use the format: Dependent Variable Name versus Independent Variable Name.
For axes include units in parentheses after your label. Example: Pressure (atm), Mass (g), Time
(min). For temperature, initially write the unit as (oC). To superscript the “o”, highlight the “o” and
then click on the “Home” tab. Then click on the drop down button in the lower right of the “Font”
section. Under “Effects”, you can click on “Superscript”. Then click OK.
5) To add in gridlines, click on the “Layout” tab found under the “Chart Tool” tab and then click on the
“Gridlines” tab. Then click on “Primary Horizontal Gridlines” and then click on “Major and Minor
Gridlines” for the x-axis. Repeat for the y-axis by clicking on “Primary Vertical Gridlines” and then
click on “Major and Minor Gridlines”.
6) Lengthen your graph by dragging down the bottom until the graph appears square.
7) If you are graphing only one set of data on your graph, click on and then delete the box to the right of
the graph, “Series 1”.
8) To manually scale the x-axis, right click on the x-axis and then click on “Format Axis”. Then click
“Fixed” on ALL four options: “Minimum”, “Maximum”, “Major unit”, and “Minor unit”. Also click
on “Axis Value” under “Vertical axis crosses”. THEN, manually fill in the values for these options.
The value for “Axis Value” under “Vertical axis crosses” must be the same as “Minimum”. The
“Minor unit” should be , , , or of the “Major unit”. Repeat for the y-axis.
If you want to connect-the-points: (if not skip to step-10)
9) To connect-the-points, right click on one of the plotted data points from a data set and then click on
“Format Data Series”. Under “Line Color”, click “Solid line” and then change the color to black.
Click “Close” when done. Your graph should now be done!
If you want a best-fit curve (do not connect the points):
10) To plot a best-fit curve, click on one of the plotted data points and then click on “Add Trendline”.
For most graphs, you are going to want a linear trendline, which is the default trendline.
11) In the “Format Trendline” popup box click on “Display equation on chart” as well as “Display R-
squared value on chart” and then close. Then move the equation and R-squared value to the up and to
the right of the graph title. Your graph should now be done!
12) When you want to print your graphs, click on the graph near the title and then click on print
preview. Click on “set-up” and change the “orientation” from “Landscape” to “Portrait”. Then
click OK. Then click “Print”.
13) Now create graphs for Data Set-2, Data Set-3, and Data Set-4.
-7-
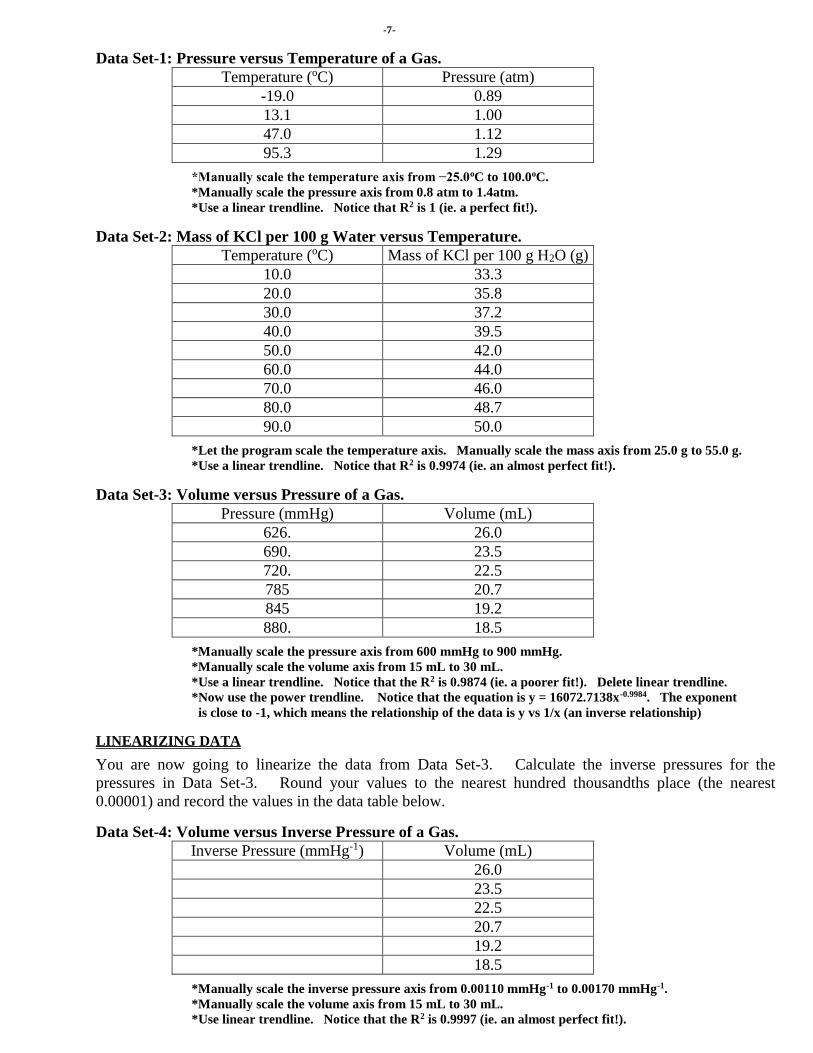
Data Set-1: Pressure versus Temperature of a Gas.
Temperature (oC) Pressure (atm)
-19.0 0.89
13.1 1.00
47.0 1.12
95.3 1.29
*Manually scale the temperature axis from −25.0oC to 100.0oC.
*Manually scale the pressure axis from 0.8 atm to 1.4atm.
*Use a linear trendline. Notice that R2 is 1 (ie. a perfect fit!).
Data Set-2: Mass of KCl per 100 g Water versus Temperature.
Temperature (oC) Mass of KCl per 100 g H2O (g)
10.0 33.3
20.0 35.8
30.0 37.2
40.0 39.5
50.0 42.0
60.0 44.0
70.0 46.0
80.0 48.7
90.0 50.0
*Let the program scale the temperature axis. Manually scale the mass axis from 25.0 g to 55.0 g.
*Use a linear trendline. Notice that R2 is 0.9974 (ie. an almost perfect fit!).
Data Set-3: Volume versus Pressure of a Gas.
Pressure (mmHg) Volume (mL)
626. 26.0
690. 23.5
720. 22.5
785 20.7
845 19.2
880. 18.5
*Manually scale the pressure axis from 600 mmHg to 900 mmHg.
*Manually scale the volume axis from 15 mL to 30 mL.
*Use a linear trendline. Notice that the R2 is 0.9874 (ie. a poorer fit!). Delete linear trendline.
*Now use the power trendline. Notice that the equation is y = 16072.7138x-0.9984. The exponent
is close to -1, which means the relationship of the data is y vs 1/x (an inverse relationship)
LINEARIZING DATA
You are now going to linearize the data from Data Set-3. Calculate the inverse pressures for the
pressures in Data Set-3. Round your values to the nearest hundred thousandths place (the nearest
0.00001) and record the values in the data table below.
Data Set-4: Volume versus Inverse Pressure of a Gas.
Inverse Pressure (mmHg-1) Volume (mL)
26.0
23.5
22.5
20.7
19.2
18.5
*Manually scale the inverse pressure axis from 0.00110 mmHg-1 to 0.00170 mmHg-1.
*Manually scale the volume axis from 15 mL to 30 mL.
*Use linear trendline. Notice that the R2 is 0.9997 (ie. an almost perfect fit!).

-8-
GRAPHING TWO DATA SETS ON THE SAME GRAPH (SEE DATA BELOW)
Data Set-5: Temp versus Time: Heating and Cooling Curves.
Melting Point
Determination
(Heating Curve)
Freezing Point
Determination
(Cooling Curve)
Time (min) Temp (oC) Time (min) Temp (oC)
0.00 25.0 0.00 65.0
0.50 30.0 1.00 56.5
1.25 40.5 2.00 54.0
2.50 51.0 3.00 53.5
3.25 53.0 4.00 52.5
4.50 54.0 5.00 49.0
6.00 60.0 6.00 40.0
*Manually scale the time axis from 0.00 min to 6.00 min and manually scale the
temperature axis from 20.0oC to 70.0oC.
*Connect the points for the data in each set and notice where the two graphs cross.
1) FIRST DATA SET: Fill in the data for the independent variable in column A and fill in the data for
the dependent variable in column B. SECOND DATA SET: Fill in the data for the independent
variable in column C and fill in the data for the dependent variable in column D.
2) Highlight the data in columns A and B. Click on “Insert” at the top of the screen. Click on the
“Scatter” icon found at the top of the screen and then click on the choice that looks exactly like the
“Scatter” icon. This should produce a scatter graph of the first data set.
3) Click on the “layout-1” icon found in “Chart Layouts” of the “Design” sub-tab of the “Chart Tools”
tab. Temporary titles for the graph and axes will appear.
4) To title your graph and label your axes, click on the textbox for each and type in the graph title or axis
name. For titles, use the format: Dependent Variable Name versus Independent Variable Name.
For axes include units in parentheses after your label. Example: Pressure (atm), Mass (g), Time
(min). For temperature, initially write the unit as (oC). To superscript the “o”, highlight the “o” and
then click on the “Home” tab. Then click on the drop down button in the lower right of the “Font”
section. Under “Effects”, you can click on “Superscript”. Then click OK.
5) To add in gridlines, click on the “Layout” tab found under the “Chart Tool” tab and then click on the
“Gridlines” tab. Then click on “Primary Horizontal Gridlines” and then click on “Major and Minor
Gridlines” for the x-axis. Repeat for the y-axis by clicking on “Primary Vertical Gridlines” and then
click on “Major and Minor Gridlines”.
6) Lengthen your graph by dragging down the bottom until the graph appears square.
7) Since you will soon be adding a second data set to you graph, you will need to name each data set.
Right click on area of the scatter graph near the box labeled “Series1”. Then click on “Select Data”.
Rename Series1 by clicking on the “Edit” button and then rename the series in the box labeled “Series
name”. Then click OK.
8) Now to add the second at set, click on the “Add” button. Name the second series of data in the box
labeled “Series name”. Then click on the box labeled “Series X values” and then highlight the data
from column C. Some gobbledygook should appear in the “Series X values” box.
9) In the box below labeled “Series Y Values”, keep the equal sign but delete the {1} and THEN
highlight the data from column D. Some gobbledygook should appear in the “Series Y Values”
space! Then click OK. Then click OK again. You should now have both sets of data on the graph.

-9-
10) Right click on the box with the two series names and then click on “Top” found under “Legend
Position:” and then close. The names of the two data sets should now be under the title.
11) To manually scale either axis, follow the directions in step-8 on the first page.
If you want to connect-the-points: (if not skip to step-13)
12) To connect-the-points, right click on one of the plotted data points from a data set and then click on
“Format Data Series”. Under “Line Color”, click “Solid line” and then change the color to black.
Click “Close” when done. Your graph should now be done!
If you want a best-fit curve (do not connect the points):
13) To plot a best-fit curve, right click on a plotted data points and then click on “Add Trendline”. For
most graphs, you are going to want a linear trendline. If so, click on “Linear” and then click OK.
14) Now right click on the newly graphed trendline and then click on “Format Trendline”. Under
“Options”, click on “Display equation on chart” as well as “Display R-squared value on chart” and
then move the equation and R-squared value to the up and to the right of the graph title. Your graph
should now be done!
IF YOU HAVE MICROSOFT EXCEL 2007 AT HOME, YOU CAN FIGURE IT OUT BY STUDYING THE
PROCEDURES FOR BOTH MICROSOFT EXCEL 2010 AND MICROSOFT EXCEL 2003.
Procedure-3: [using Microsoft Excel 2003]
1) Open Microsoft Excel 2003. In column A, fill in the data for the independent variable. In column B,
fill in the data for the dependent variable. In a two column data table, it is traditional that the data
for the independent variable is in the left hand column and that the data for the dependent variable is
in the right hand column. (See Data Set-1 on the next page.)
2) Highlight the data in the data table and then click on the “Chart Wizard” icon in the tool bar. If the
icon is not in the tool bar, it can be found in “Insert” at the top of the screen.
3) On Step 1 of 4, click on XY (Scatter) and then click on next. Skip Step 2 of 4 by clicking on next.
4) On Step 3 of 4, click on “Titles”. Title your graph using the format: Dependent Variable Name versus
Independent Variable Name. Then label your axes. Include units in parentheses after your label.
Example: Pressure (atm), Mass (g), Time (min). For temperature, write the unit as (oC). You will
be able to superscript the “o” in step 9.
5) Still on Step 3 of 4 under “Gridlines”, click on major and minor gridlines for both the x-axis and y-
axis. The click on next. Skip step 4 of 4 by clicking finish.
6) At this point, your graph is unfinished and is going to need some formatting.
7) Lengthen your graph by dragging down the bottom until the graph appears square.
8) If you are graphing only one set of data on your graph, click on and then delete the box to the right of
the graph, “Series 1”.
9) If either of your axes includes the degree symbol “o”, highlight the “o” symbol and then right click on
it. Then click on “Format Axis Title”. Under “effect”, click on “superscript” and then OK.
-10-
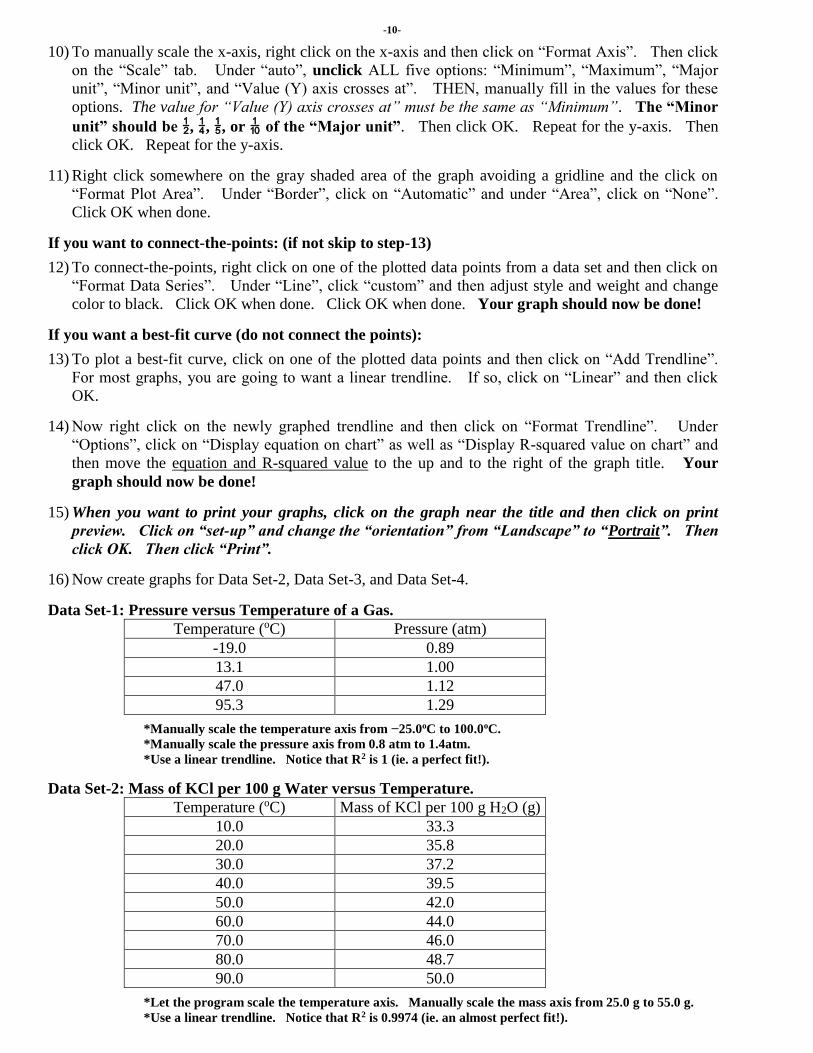
10) To manually scale the x-axis, right click on the x-axis and then click on “Format Axis”. Then click
on the “Scale” tab. Under “auto”, unclick ALL five options: “Minimum”, “Maximum”, “Major
unit”, “Minor unit”, and “Value (Y) axis crosses at”. THEN, manually fill in the values for these
options. The value for “Value (Y) axis crosses at” must be the same as “Minimum”. The “Minor
unit” should be , , , or of the “Major unit”. Then click OK. Repeat for the y-axis. Then
click OK. Repeat for the y-axis.
11) Right click somewhere on the gray shaded area of the graph avoiding a gridline and the click on
“Format Plot Area”. Under “Border”, click on “Automatic” and under “Area”, click on “None”.
Click OK when done.
If you want to connect-the-points: (if not skip to step-13)
12) To connect-the-points, right click on one of the plotted data points from a data set and then click on
“Format Data Series”. Under “Line”, click “custom” and then adjust style and weight and change
color to black. Click OK when done. Click OK when done. Your graph should now be done!
If you want a best-fit curve (do not connect the points):
13) To plot a best-fit curve, click on one of the plotted data points and then click on “Add Trendline”.
For most graphs, you are going to want a linear trendline. If so, click on “Linear” and then click
OK.
14) Now right click on the newly graphed trendline and then click on “Format Trendline”. Under
“Options”, click on “Display equation on chart” as well as “Display R-squared value on chart” and
then move the equation and R-squared value to the up and to the right of the graph title. Your
graph should now be done!
15) When you want to print your graphs, click on the graph near the title and then click on print
preview. Click on “set-up” and change the “orientation” from “Landscape” to “Portrait”. Then
click OK. Then click “Print”.
16) Now create graphs for Data Set-2, Data Set-3, and Data Set-4.
Data Set-1: Pressure versus Temperature of a Gas.
Temperature (oC) Pressure (atm)
-19.0 0.89
13.1 1.00
47.0 1.12
95.3 1.29
*Manually scale the temperature axis from −25.0oC to 100.0oC.
*Manually scale the pressure axis from 0.8 atm to 1.4atm.
*Use a linear trendline. Notice that R2 is 1 (ie. a perfect fit!).
Data Set-2: Mass of KCl per 100 g Water versus Temperature.
Temperature (oC) Mass of KCl per 100 g H2O (g)
10.0 33.3
20.0 35.8
30.0 37.2
40.0 39.5
50.0 42.0
60.0 44.0
70.0 46.0
80.0 48.7
90.0 50.0
*Let the program scale the temperature axis. Manually scale the mass axis from 25.0 g to 55.0 g.
*Use a linear trendline. Notice that R2 is 0.9974 (ie. an almost perfect fit!).
-11-
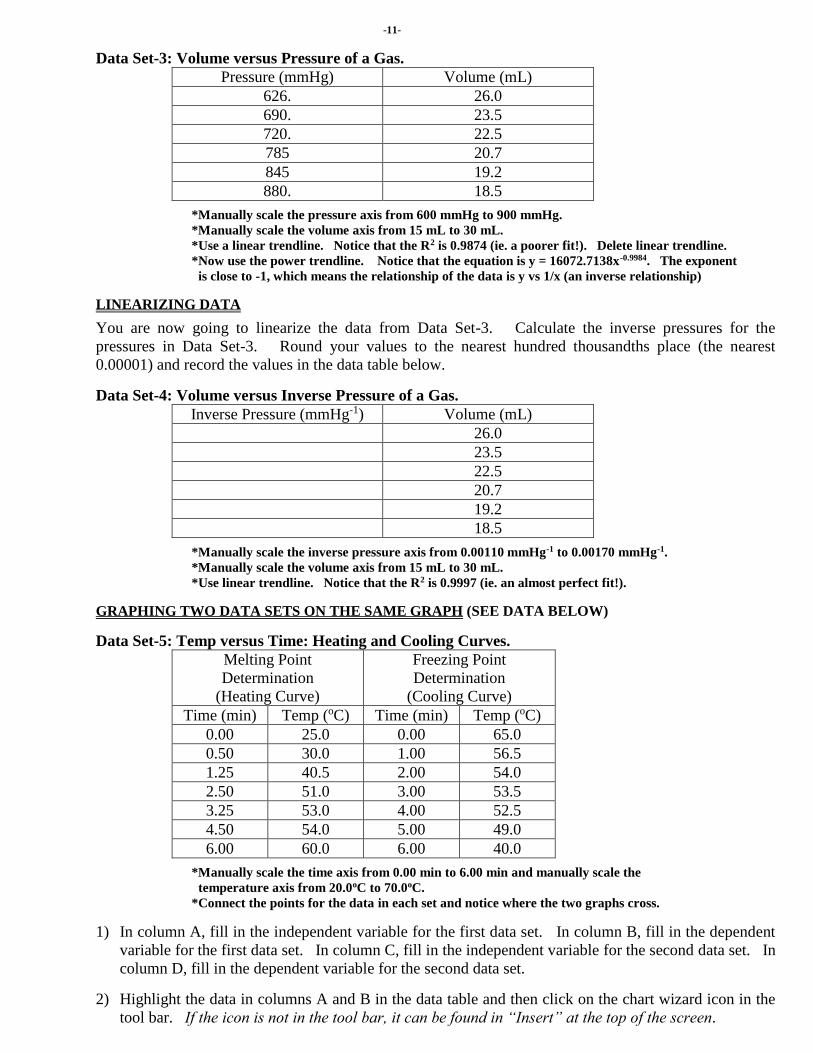
Data Set-3: Volume versus Pressure of a Gas.
Pressure (mmHg) Volume (mL)
626. 26.0
690. 23.5
720. 22.5
785 20.7
845 19.2
880. 18.5
*Manually scale the pressure axis from 600 mmHg to 900 mmHg.
*Manually scale the volume axis from 15 mL to 30 mL.
*Use a linear trendline. Notice that the R2 is 0.9874 (ie. a poorer fit!). Delete linear trendline.
*Now use the power trendline. Notice that the equation is y = 16072.7138x-0.9984. The exponent
is close to -1, which means the relationship of the data is y vs 1/x (an inverse relationship)
LINEARIZING DATA
You are now going to linearize the data from Data Set-3. Calculate the inverse pressures for the
pressures in Data Set-3. Round your values to the nearest hundred thousandths place (the nearest
0.00001) and record the values in the data table below.
Data Set-4: Volume versus Inverse Pressure of a Gas.
Inverse Pressure (mmHg-1) Volume (mL)
26.0
23.5
22.5
20.7
19.2
18.5
*Manually scale the inverse pressure axis from 0.00110 mmHg-1 to 0.00170 mmHg-1.
*Manually scale the volume axis from 15 mL to 30 mL.
*Use linear trendline. Notice that the R2 is 0.9997 (ie. an almost perfect fit!).
GRAPHING TWO DATA SETS ON THE SAME GRAPH (SEE DATA BELOW)
Data Set-5: Temp versus Time: Heating and Cooling Curves.
Melting Point
Determination
(Heating Curve)
Freezing Point
Determination
(Cooling Curve)
Time (min) Temp (oC) Time (min) Temp (oC)
0.00 25.0 0.00 65.0
0.50 30.0 1.00 56.5
1.25 40.5 2.00 54.0
2.50 51.0 3.00 53.5
3.25 53.0 4.00 52.5
4.50 54.0 5.00 49.0
6.00 60.0 6.00 40.0
*Manually scale the time axis from 0.00 min to 6.00 min and manually scale the
temperature axis from 20.0oC to 70.0oC.
*Connect the points for the data in each set and notice where the two graphs cross.
1) In column A, fill in the independent variable for the first data set. In column B, fill in the dependent
variable for the first data set. In column C, fill in the independent variable for the second data set. In
column D, fill in the dependent variable for the second data set.
2) Highlight the data in columns A and B in the data table and then click on the chart wizard icon in the
tool bar. If the icon is not in the tool bar, it can be found in “Insert” at the top of the screen.
-12-
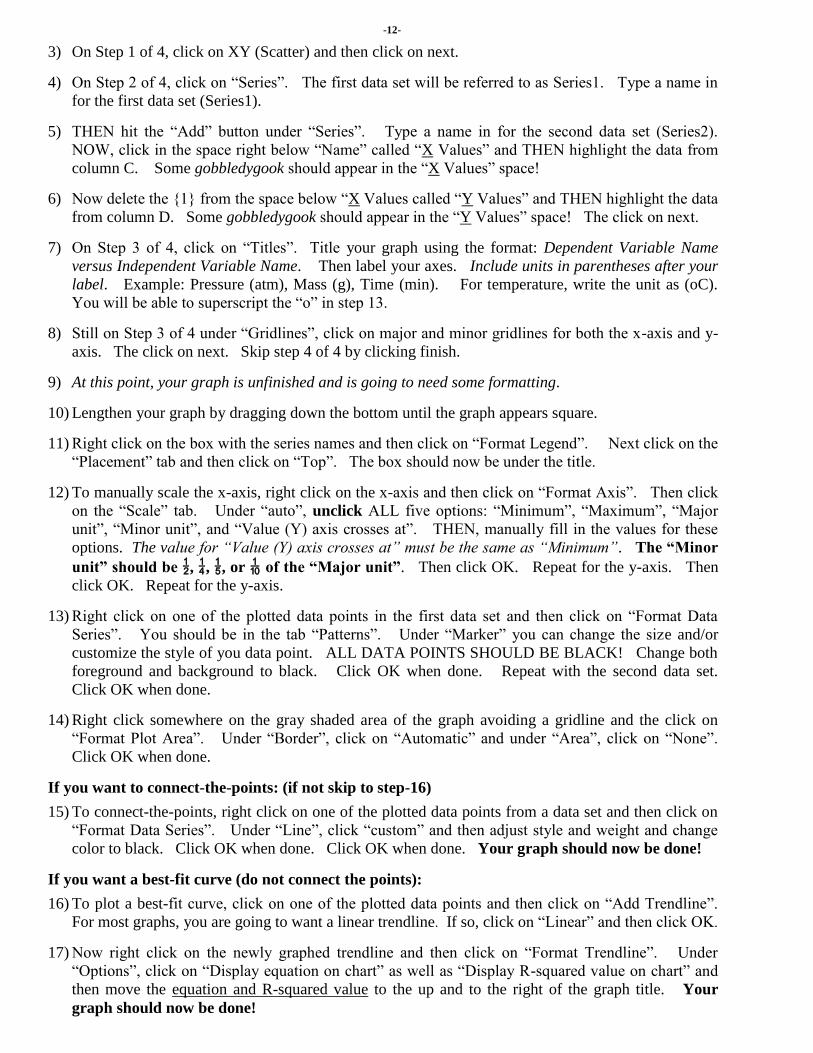
3) On Step 1 of 4, click on XY (Scatter) and then click on next.
4) On Step 2 of 4, click on “Series”. The first data set will be referred to as Series1. Type a name in
for the first data set (Series1).
5) THEN hit the “Add” button under “Series”. Type a name in for the second data set (Series2).
NOW, click in the space right below “Name” called “X Values” and THEN highlight the data from
column C. Some gobbledygook should appear in the “X Values” space!
6) Now delete the {1} from the space below “X Values called “Y Values” and THEN highlight the data
from column D. Some gobbledygook should appear in the “Y Values” space! The click on next.
7) On Step 3 of 4, click on “Titles”. Title your graph using the format: Dependent Variable Name
versus Independent Variable Name. Then label your axes. Include units in parentheses after your
label. Example: Pressure (atm), Mass (g), Time (min). For temperature, write the unit as (oC).
You will be able to superscript the “o” in step 13.
8) Still on Step 3 of 4 under “Gridlines”, click on major and minor gridlines for both the x-axis and y-
axis. The click on next. Skip step 4 of 4 by clicking finish.
9) At this point, your graph is unfinished and is going to need some formatting.
10) Lengthen your graph by dragging down the bottom until the graph appears square.
11) Right click on the box with the series names and then click on “Format Legend”. Next click on the
“Placement” tab and then click on “Top”. The box should now be under the title.
12) To manually scale the x-axis, right click on the x-axis and then click on “Format Axis”. Then click
on the “Scale” tab. Under “auto”, unclick ALL five options: “Minimum”, “Maximum”, “Major
unit”, “Minor unit”, and “Value (Y) axis crosses at”. THEN, manually fill in the values for these
options. The value for “Value (Y) axis crosses at” must be the same as “Minimum”. The “Minor
unit” should be , , , or of the “Major unit”. Then click OK. Repeat for the y-axis. Then
click OK. Repeat for the y-axis.
13) Right click on one of the plotted data points in the first data set and then click on “Format Data
Series”. You should be in the tab “Patterns”. Under “Marker” you can change the size and/or
customize the style of you data point. ALL DATA POINTS SHOULD BE BLACK! Change both
foreground and background to black. Click OK when done. Repeat with the second data set.
Click OK when done.
14) Right click somewhere on the gray shaded area of the graph avoiding a gridline and the click on
“Format Plot Area”. Under “Border”, click on “Automatic” and under “Area”, click on “None”.
Click OK when done.
If you want to connect-the-points: (if not skip to step-16)
15) To connect-the-points, right click on one of the plotted data points from a data set and then click on
“Format Data Series”. Under “Line”, click “custom” and then adjust style and weight and change
color to black. Click OK when done. Click OK when done. Your graph should now be done!
If you want a best-fit curve (do not connect the points):
16) To plot a best-fit curve, click on one of the plotted data points and then click on “Add Trendline”.
For most graphs, you are going to want a linear trendline. If so, click on “Linear” and then click OK.
17) Now right click on the newly graphed trendline and then click on “Format Trendline”. Under
“Options”, click on “Display equation on chart” as well as “Display R-squared value on chart” and
then move the equation and R-squared value to the up and to the right of the graph title. Your
graph should now be done!

-13-
Lab-2: Accuracy and Precision
Introduction:
Since all measurements contain an estimated digit, all measurements some contain uncertainty (error).
Scientists try to limit the uncertainty (error) as much as possible but they cannot eliminate it. There are
three main reasons for uncertainty in measurements.
a) Reasons for Uncertainty (Error):
i) Instrumental Error:
All measuring instruments have error. The more sensitive and precise the instrument is, the
lower the amount of error will be.
ii) Observer Error:
An instrument is only as good as the person using it! Persons who have more experience and
who take more precautions will generally record measurements with less error.
iii) Procedural Error:
Measurements can have error due to faulty experimental procedure.
b) How to Measure Error:
In an experiment, it is important to be able to state the level of confidence of one’s data. This is
done through statistical analysis. Often this analysis is quite involved. However, for this course we
will use two simple tests for error.
i) A test for Accuracy:
Accuracy measures how close a measured value is to the accepted value. A test for accuracy
uses the equation for Percent (%) Error
% Error = Measured Value – Accepted Value 100
Accepted Value
% Error can be positive or negative! In this course, a % Error of less than |5%| will represent
high accuracy. A % Error between |5%| and |10%| will represent moderate accuracy. A %
Error greater than |10%| will represent low accuracy.
ii) A test for Precision:
Precision measures how close several measured trials are to one another. The calculations to
determine precision are complicated and will not be used in this course. Instead, we will use the
“eyeball test” – do the data appear closely bunched?
high precision high precision
low precision moderate precision

-14-
Graduated cylinders are not always the most accurate instruments. The graduated markings are printed
on by machine and can have an error range of 5% or more. However, since you will simply want to
use the graduated cylinder to measure “change in volume”, the absolute accuracy of the markings
themselves is not a problem as long as the increments of the markings are accurate (or accurate enough).
It is known, that the laboratory burets accurately dispense a known amount of liquid. In this
investigation, you will use a buret to test the accuracy of a graduated cylinder.
Good technique is needed when measuring volume. Be sure to read the bottom of the meniscus in both
the buret and the graduated cylinder at eye level.
Procedure: GOGGLES AND APRONS ARE TO BE WORN AT ALL TIMES!
1) Obtain a 50-mL buret and stand. Obtain a 100-mL graduated cylinder.
2) Using a 100-mL beaker, fill the 50-mL buret above the zero mark. Let out some of the water in
order to “charge” the value and tip of the buret. Make sure your buret reads zero.
3) Dispense exactly 10-mL of water to the graduated cylinder from the buret. Read and record
graduated cylinder.
4) Dispense exactly a second 10-mL of water to the graduated cylinder from the buret (the buret
should now read 20-mL). Read and record graduated cylinder.
5) Repeat until all 40-mL of water has been dispensed from the buret into the graduated cylinder.
6) Repeat the entire procedure twice more.
Trial 1 Trial 1 Trial 1 Average Volume of
Water
Dispensed
by the
buret
(mL)
Volume of
Water in
the
Graduated
Cylinder
(mL)
Volume of
Water
Dispensed
by the
buret
(mL)
Volume of
Water in
the
Graduated
Cylinder
(mL)
Volume of
Water
Dispensed
by the
Buret (
mL)
Volume of
Water in
the
Graduated
Cylinder
(mL)
Volume of
Water
Dispensed
by the
Buret
(mL)
Volume of
Water in
the
Graduated
Cylinder
(mL)
10.0 10.0 10.0 10.0
20.0 20.0 20.0 20.0
30.0 30.0 30.0 30.0
40.0 40.0 40.0 40.0
In this lab, you will be making a graph of Average Volume of Water in the Graduated Cylinder versus
Volume of Water Dispensed by the Buret. A graph’s title is always in the form of Y-axis versus X-
axis. Thus when you create your graph, the graduated cylinder volume will be on the Y-axis and the
buret volume will be on the X-axis. Include the linear fit equation as well as the coefficient of
determination (R2) value. Print your graph in portrait!

-15-
Lab-3: Density of an Unknown Solid
Introduction:
Density is an important physical property because it is intensive and thus can be used to help identify an
unknown. Density is the ratio of a material’s mass to its volume. Neither mass nor volume alone are
intensive properties and thus neither can separately be use to help identify an unknown. Because most
materials change volume when they are heated or cooled, their densities are temperature dependent.
When reporting a density value, the temperature should be specified.
Good technique is needed when measuring volume with a graduated cylinder. Be sure to read the bottom
of the meniscus in the graduated cylinder at eye level. In order to obtain volume data with 3 significant
figures when using a graduated cylinder, it is necessary to be measuring 10.0 mL or more. Also, in this
lab activity you will learn how to use the electronic balances.
Purpose:
In this experiment you will determine the density of an unknown solid.
Materials:
100-mL graduated cylinder, electronic balance, pieces of unknown solid
Procedure: GOGGLES AND APRONS ARE TO BE WORN AT ALL TIMES!
This will probably not be the first density lab that you have performed. However, this may be the first
lab activity that you will have had to write your own procedure.
YOU AND YOUR PARTNER MUST HAND IN A DRAFT OF YOUR PROCEDURE AND HAVE
IS OKAYED BEFORE YOU MAY PROCEED WITH ANY LAB WORK.
Please write out your procedure in steps (example: Step-1: Put on goggles and apron. Step-2: Obtain a
sample of the unknown solid.)
Please include a data table (Table-1) for your qualitative data – observations about your unknown solid.
Please include a data table (Table-2) for your quantitative data. Since you will be creating a graph whose
slope is “mass over volume”, you will want to have data points consisting of (1) a small mass and volume
, (2) a medium mass and volume, and (3) a large mass and volume. YOUR SMALLEST VOLUME
OF UNKNOWN SOLID SHOULD BE AT LEAST 10.0 mL.
Think about how many trials you should run. Normally you would want to run multiple trials. However,
due to time constraints run only one trial for the small sample, medium sample, and large sample. Thus,
it is important to make your measurements carefully.
____________________________________________________________________________________
____________________________________________________________________________________
____________________________________________________________________________________
____________________________________________________________________________________
____________________________________________________________________________________
____________________________________________________________________________________
____________________________________________________________________________________
____________________________________________________________________________________
____________________________________________________________________________________
____________________________________________________________________________________

-16-
____________________________________________________________________________________
____________________________________________________________________________________
____________________________________________________________________________________
____________________________________________________________________________________
____________________________________________________________________________________
____________________________________________________________________________________
____________________________________________________________________________________
____________________________________________________________________________________
____________________________________________________________________________________
____________________________________________________________________________________
____________________________________________________________________________________
____________________________________________________________________________________
____________________________________________________________________________________
____________________________________________________________________________________
____________________________________________________________________________________
____________________________________________________________________________________
____________________________________________________________________________________
____________________________________________________________________________________
____________________________________________________________________________________
Data Tables:
In this lab, you will be making a graph of your mass and volume. A graph’s title is always in the form
of Y-axis versus X-axis. You will want the slope of your graph to be equal to density. Thus when you
create your graph, mass will be on the Y-axis and volume will be on the X-axis. Include the linear fit
equation as well as the coefficient of determination (R2) value. Print your graph in portrait!

-17-
Lab-4: The Empirical Formula of a Compound
Introduction:
A compound is a substance that is composed of two or more elements bonded in a definite mole ratio
(proportion). A specific compound will always contain the same elements in the same definite ratio
(proportion). This is known as the Law of Constant Composition. By mass, the definite ratio is
given as percentages. Water is a compound of hydrogen and oxygen with the definite ratio of 2 moles
hydrogen to 1 mole oxygen. By mass, the ratio is 11.2% hydrogen to 89.8% oxygen for water.
Hydrogen peroxide is a compound of hydrogen and oxygen with the definite ratio of 1 mole hydrogen to
1 mole oxygen. By mass, the ratio is 5.9% hydrogen to 94.1% oxygen for hydrogen peroxide.
The Law of Constant Composition, among others, convinced John Dalton of the atomic nature of matter
and led him to outline his atomic theory in these four postulates:
(1) Elements are composed of tiny particles called atoms.
(2) Atoms of the same element are exactly alike and have the same set of properties, but the
atoms of one element are different from the atoms of all other elements.
(3) Atoms of an element cannot be created, destroyed, or changed into atoms of another element.
(4) Compounds are formed when atoms of two or more elements are chemically combined in a
fixed small whole number ratio.
A compound's empirical formula is the formula showing the simplest (most reduced) ratio of the
elements in the compound. For water (H2O), the empirical formula is H2O. For hydrogen peroxide
(H2O2), the empirical formula is HO. For glucose (C6H12O6), the empirical formula is (CH2O). If the
masses of the elements (or the percent by mass values of the elements) in a compound are known, the
empirical formula for the compound can be easily calculated.
In 1778, Lavoisier concluded that combustion was a reaction of oxygen in the air with a sample of
matter. He realized that the substance burned gained mass, the same mass lost from the surrounding air.
A great deal of chemical knowledge has been amassed by using simple combustion experiments
conducted with crucibles, burners, and balances.
Magnesium reacts vigorously when heated in the presence of air. The magnesium-oxygen reaction is
energetic enough to allow some of the magnesium to react with nitrogen from the air. Although there is
a higher percentage of N2 gas in the air than O2 gas, the O2 gas is more reactive and magnesium oxide
forms in greater amount than magnesium nitride.
Mg(s) + O2(g) + N2(g) → MgO(s) + Mg3N2(s) [unbalanced]
The magnesium nitride can be easily converted to magnesium oxide by adding water, which converts it
to magnesium hydroxide and ammonia gas. If this mixture is heated to dryness, the ammonia gas is
driven off and the magnesium hydroxide is converted to magnesium oxide.
Mg3N2(s) + 6 H2O(ℓ) → 3 Mg(OH)2(s) + 2 NH3(g) [balanced]
Mg(OH)2(s) → MgO(s) + H2O(ℓ) [balanced]
A compound’s empirical formula may or may not be its actual chemical formula. A compound’s actual
chemical formula is called its molecular formula. Additional information besides percent composition
is needed in order to determine a compound’s molecular formula.
-18-
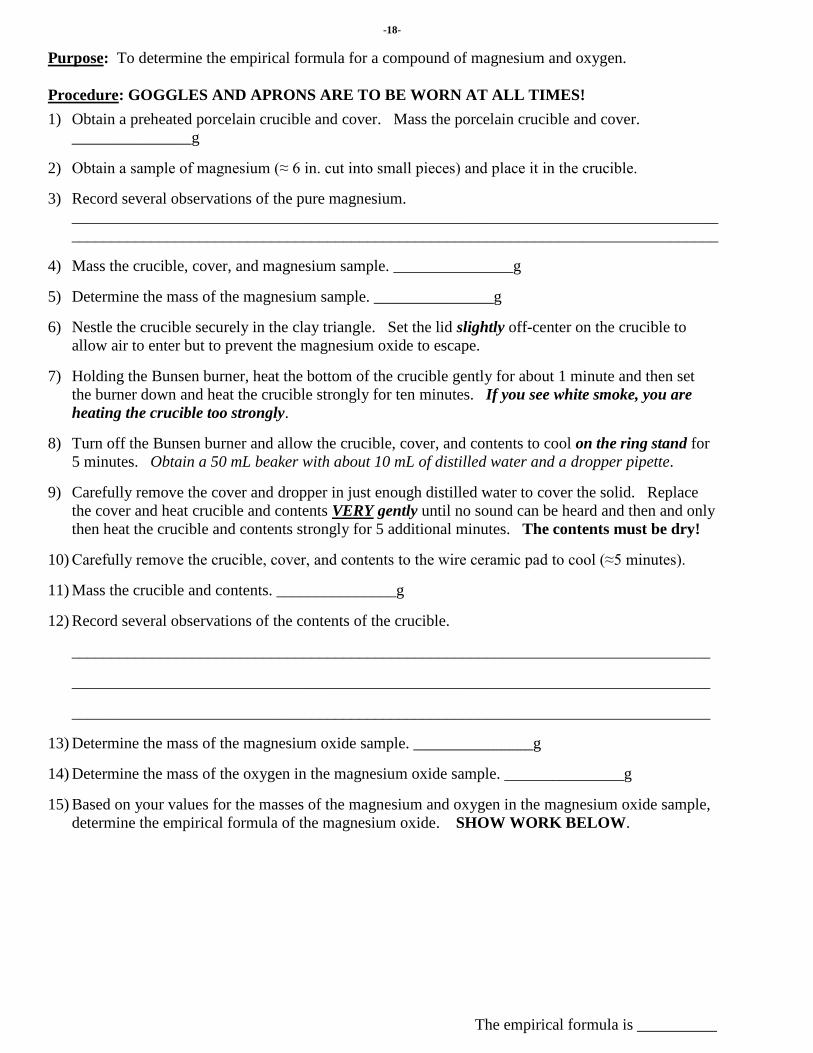
Purpose: To determine the empirical formula for a compound of magnesium and oxygen.
Procedure: GOGGLES AND APRONS ARE TO BE WORN AT ALL TIMES!
1) Obtain a preheated porcelain crucible and cover. Mass the porcelain crucible and cover.
_______________g
2) Obtain a sample of magnesium (≈ 6 in. cut into small pieces) and place it in the crucible.
3) Record several observations of the pure magnesium.
_________________________________________________________________________________
_________________________________________________________________________________
4) Mass the crucible, cover, and magnesium sample. _______________g
5) Determine the mass of the magnesium sample. _______________g
6) Nestle the crucible securely in the clay triangle. Set the lid slightly off-center on the crucible to
allow air to enter but to prevent the magnesium oxide to escape.
7) Holding the Bunsen burner, heat the bottom of the crucible gently for about 1 minute and then set
the burner down and heat the crucible strongly for ten minutes. If you see white smoke, you are
heating the crucible too strongly.
8) Turn off the Bunsen burner and allow the crucible, cover, and contents to cool on the ring stand for
5 minutes. Obtain a 50 mL beaker with about 10 mL of distilled water and a dropper pipette.
9) Carefully remove the cover and dropper in just enough distilled water to cover the solid. Replace
the cover and heat crucible and contents VERY gently until no sound can be heard and then and only
then heat the crucible and contents strongly for 5 additional minutes. The contents must be dry!
10) Carefully remove the crucible, cover, and contents to the wire ceramic pad to cool (≈5 minutes).
11) Mass the crucible and contents. _______________g
12) Record several observations of the contents of the crucible.
________________________________________________________________________________
________________________________________________________________________________
________________________________________________________________________________
13) Determine the mass of the magnesium oxide sample. _______________g
14) Determine the mass of the oxygen in the magnesium oxide sample. _______________g
15) Based on your values for the masses of the magnesium and oxygen in the magnesium oxide sample,
determine the empirical formula of the magnesium oxide. SHOW WORK BELOW.
The empirical formula is __________

-19-
Lab-5: Paper Chromatography
Introduction:
Mixtures can be separated into their individual component parts by various methods. Differences in
physical properties such as mass, particle size, molecular polarity, boiling and freezing points, and
solubility determine the best method to be used when separating a particular mixture.
1) Filtration:
Filtration is used to separate a water soluble solid from a water insoluble solid (#1). A mixture of
the two solids is placed into a beaker and water is added. The water soluble solid dissolves into the
solvent (#2). A piece of filter paper is placed in a funnel and the mixture is poured through the
funnel where the filter traps the water insoluble solid while allowing the dissolved water soluble
solid to pass through with the water (#3). The substances are now separated (4a & 4b)
Examples of Mixtures: (1) sand and NaCl(aq) (2) CaCl2(aq and CaCO3(s)
2) Distillation:
Distillation is used to separate a soluble solid solute from a liquid solvent (#1). The solution is
boiled. The liquid solvent evaporates leaving the now solid solute behind (#2). The solvent's
vapor is collected, cooled and condensed back to a now pure liquid (#3). This is how distilled
water is made!
Distillation can also be used to separate a soluble liquid solute from a liquid solvent (#1). The
solution is boiled. The liquid with the lower boiling point evaporates leaving the liquid with the
higher boiling point behind (#2). The vapor of the lower boiling point liquid is collected, cooled
and condensed back to a now pure liquid (#3). This liquid-liquid distillation only works if the
two liquids' boiling points are different by at least 5oC. The thermometer is used to know when the
first liquid has been separated. As the first liquid is being separated the temperature remains
constant. When there is a sudden rise in temperature, this means that the second liquid is now
evaporating and it is time to switch the collection beaker. This is how distilled liquors are made!
Examples of Mixtures: (1) salt water, (2) alcohol and water [C2H5OH(aq)]
#1
distillation
flask
#3
vapor
condenser
#2
thermometer
#1 #2 #3 #4b #4a
Filter paper
-20-
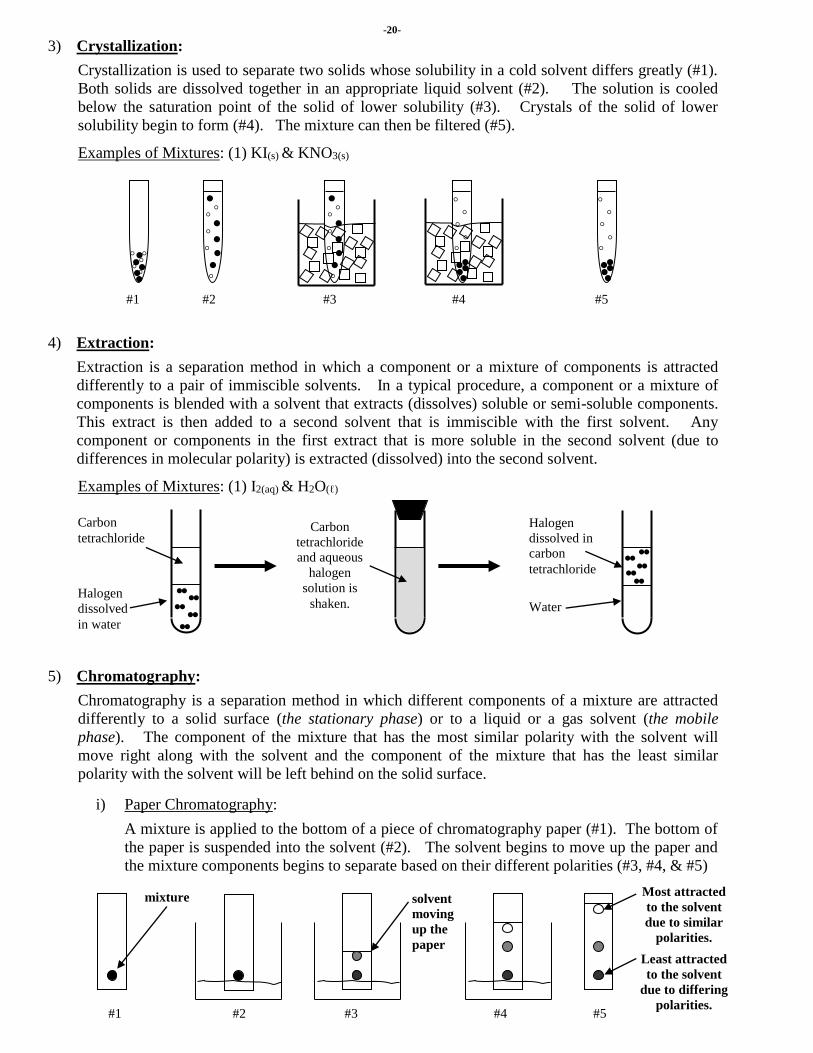
3) Crystallization:
Crystallization is used to separate two solids whose solubility in a cold solvent differs greatly (#1).
Both solids are dissolved together in an appropriate liquid solvent (#2). The solution is cooled
below the saturation point of the solid of lower solubility (#3). Crystals of the solid of lower
solubility begin to form (#4). The mixture can then be filtered (#5).
Examples of Mixtures: (1) KI(s) & KNO3(s)
4) Extraction:
Extraction is a separation method in which a component or a mixture of components is attracted
differently to a pair of immiscible solvents. In a typical procedure, a component or a mixture of
components is blended with a solvent that extracts (dissolves) soluble or semi-soluble components.
This extract is then added to a second solvent that is immiscible with the first solvent. Any
component or components in the first extract that is more soluble in the second solvent (due to
differences in molecular polarity) is extracted (dissolved) into the second solvent.
Examples of Mixtures: (1) I2(aq) & H2O(ℓ)
5) Chromatography:
Chromatography is a separation method in which different components of a mixture are attracted
differently to a solid surface (the stationary phase) or to a liquid or a gas solvent (the mobile
phase). The component of the mixture that has the most similar polarity with the solvent will
move right along with the solvent and the component of the mixture that has the least similar
polarity with the solvent will be left behind on the solid surface.
i) Paper Chromatography:
A mixture is applied to the bottom of a piece of chromatography paper (#1). The bottom of
the paper is suspended into the solvent (#2). The solvent begins to move up the paper and
the mixture components begins to separate based on their different polarities (#3, #4, & #5)
#1 #2 #3 #4 #5
mixture solvent
moving
up the
paper
Most attracted
to the solvent
due to similar
polarities.
Least attracted
to the solvent
due to differing
polarities. #1 #2 #3 #4 #5
Water
Halogen
dissolved in
carbon
tetrachloride
Halogen
dissolved
in water
Carbon
tetrachloride Carbon
tetrachloride
and aqueous
halogen
solution is
shaken.
-21-
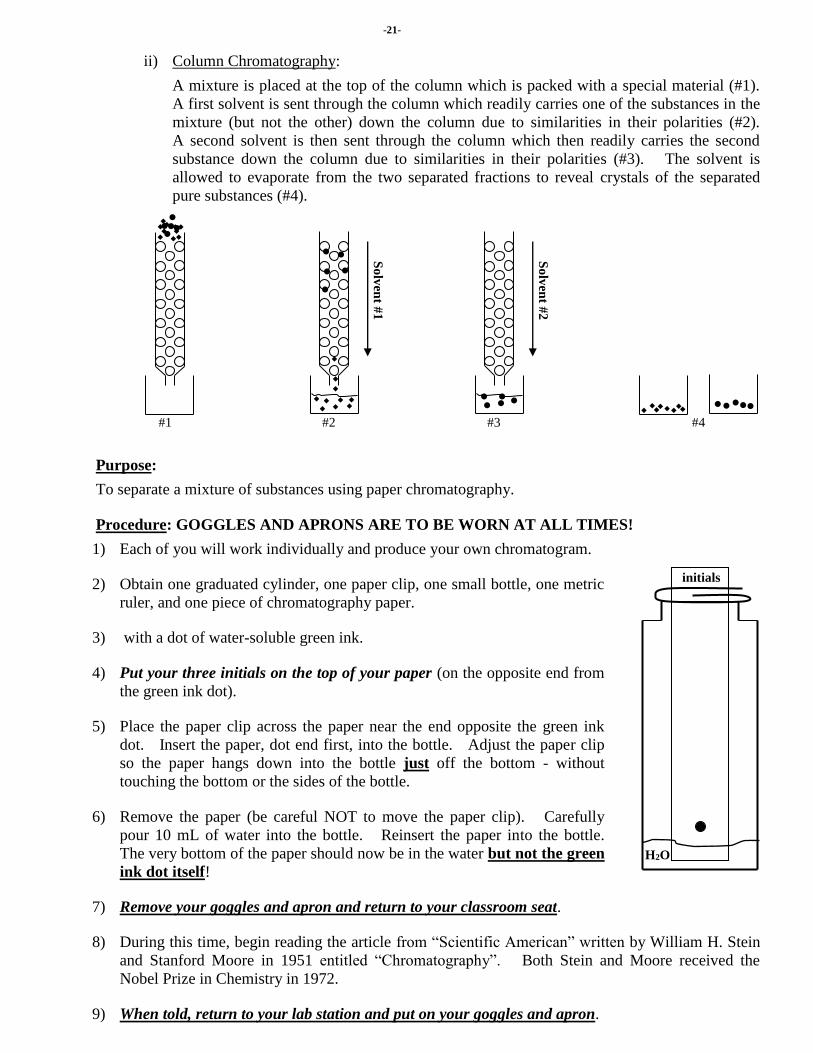
ii) Column Chromatography:
A mixture is placed at the top of the column which is packed with a special material (#1).
A first solvent is sent through the column which readily carries one of the substances in the
mixture (but not the other) down the column due to similarities in their polarities (#2).
A second solvent is then sent through the column which then readily carries the second
substance down the column due to similarities in their polarities (#3). The solvent is
allowed to evaporate from the two separated fractions to reveal crystals of the separated
pure substances (#4).
Purpose:
To separate a mixture of substances using paper chromatography.
Procedure: GOGGLES AND APRONS ARE TO BE WORN AT ALL TIMES!
1) Each of you will work individually and produce your own chromatogram.
2) Obtain one graduated cylinder, one paper clip, one small bottle, one metric
ruler, and one piece of chromatography paper.
3) with a dot of water-soluble green ink.
4) Put your three initials on the top of your paper (on the opposite end from
the green ink dot).
5) Place the paper clip across the paper near the end opposite the green ink
dot. Insert the paper, dot end first, into the bottle. Adjust the paper clip
so the paper hangs down into the bottle just off the bottom - without
touching the bottom or the sides of the bottle.
6) Remove the paper (be careful NOT to move the paper clip). Carefully
pour 10 mL of water into the bottle. Reinsert the paper into the bottle.
The very bottom of the paper should now be in the water but not the green
ink dot itself!
7) Remove your goggles and apron and return to your classroom seat.
8) During this time, begin reading the article from “Scientific American” written by William H. Stein
and Stanford Moore in 1951 entitled “Chromatography”. Both Stein and Moore received the
Nobel Prize in Chemistry in 1972.
9) When told, return to your lab station and put on your goggles and apron.
H2O
initials
So
lven
t #2
flow
#3
#1
So
lven
t #1
flow
#2
#4
-22-
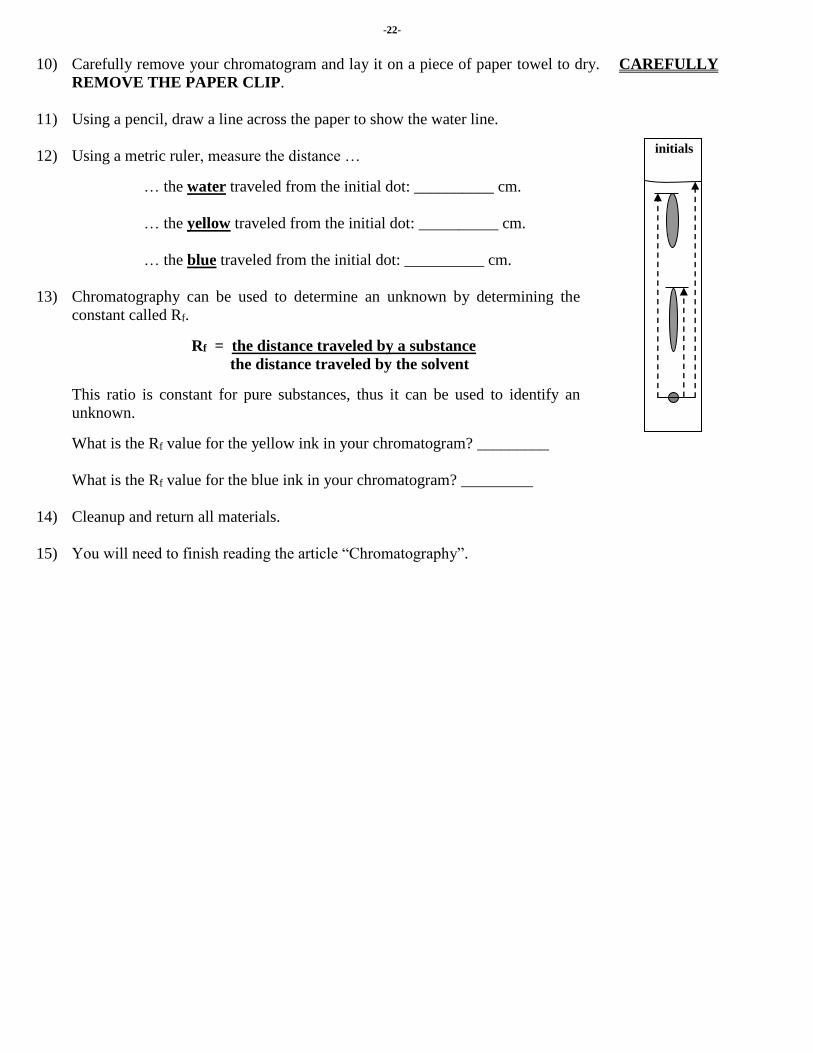
10) Carefully remove your chromatogram and lay it on a piece of paper towel to dry. CAREFULLY
REMOVE THE PAPER CLIP.
11) Using a pencil, draw a line across the paper to show the water line.
12) Using a metric ruler, measure the distance …
… the water traveled from the initial dot: __________ cm.
… the yellow traveled from the initial dot: __________ cm.
… the blue traveled from the initial dot: __________ cm.
13) Chromatography can be used to determine an unknown by determining the
constant called Rf.
Rf = the distance traveled by a substance
the distance traveled by the solvent
This ratio is constant for pure substances, thus it can be used to identify an
unknown.
What is the Rf value for the yellow ink in your chromatogram? _________
What is the Rf value for the blue ink in your chromatogram? _________
14) Cleanup and return all materials.
15) You will need to finish reading the article “Chromatography”.
initials
-23-
Lab-6: Quantitative Analysis of a Chemical Reaction
Introduction:
The Law of Conservation of Matter states that “matter can be neither created nor destroyed.” Thus the
total mass of the reactants must be equal to the total mass of the products. However, this is only true for
physical and chemical reactions.
In a balanced equation for a chemical reaction, the coefficients of the substances represent the relative
number of moles of each substance in the reaction. In the laboratory, the determination of the masses of
substances used or produced can be used to find the number of moles of each and, if successful, the
coefficients for the substances in the equation.
Purpose:
Write a balanced equation for the reaction that occurs between solid iron metal and an aqueous solution
of copper (II) chloride dihydrate.
Procedure: GOGGLES AND APRONS ARE TO BE WORN AT ALL TIMES!
1) Clean the surface of the iron sample with emery cloth to remove any rust or dirt.
2) Determine the mass of a clean watch glass to the nearest 0.0001 g. __________________________g
3) Determine the mass of the iron sample and watch glass to the nearest 0.0001 g.
__________________________ g
4) Determine the mass of a clean 250-mL beaker to the nearest 0.0001 g. ______________________ g
5) Pour about 40.0 mL of 0.300 M copper salt solution into a 50-mL the beaker. Place the clean iron
sample into the clean massed 250-mL beaker and add the 40-mL of 0.300 M copper salt solution.
6) Allow the beaker to stand undisturbed for about 20 minutes. Every few minutes carefully stir the
beaker. (Complete the “Questions for Thought” on the back.)
7) After about 20 minutes, record any evidence of a chemical reaction.
_______________________________________________________________________________
_______________________________________________________________________________
_______________________________________________________________________________
8) Carefully remove the iron sample from the solution and hold it above the solution. Carefully rinse
any remaining solution or product off the iron sample and into the beaker, using steady jet of
distilled water from a wash bottle. Make sure that the iron sample is completely rinsed.
9) Place the iron sample onto the watch glass and put it into the drying oven for 15 minutes to dry.
Go to step 12.
10) Determine the mass of the iron sample to the nearest 0.0001 g. __________________________ g
(The sample may be heavier because it has some of the solid reaction product clinging to it.)
11) Completely wash and dry the iron sample. Then again place the iron sample on the watch glass and
put it into a drying oven to completely dry. Determine (later) the mass of the iron sample to the
nearest 0.0001 g. _______________________ g (The sample may now be lighter than before
because some of the solid reaction product was cleaned off of it.)
12) Carefully and slowly decant the liquid portion of the contents of the beaker in order to leave behind
the solid reaction product. Carefully rinse the remaining solid reaction product with distilled water
using the wash bottle and decant once more. Repeat twice more or until all remaining reactant
solution or product solution has been removed. Place the beaker in a spot to dry as indicated.
13) After the solid reaction product has been completely dried in the drying oven, determine (later) the
mass of the beaker and solid reaction product. __________________________ g
14) Observe the solid reaction product. __________________________________________________
_________________________________________________________________________________

-24-
Questions for Thought:
1) Write the chemical formula for solid copper (II) chloride dihydrate.
2) When pure solid iron reacts with aqueous copper (II) chloride, what possible aqueous iron product(s)
may form? Write the chemical formula(s).
3) When pure solid iron reacts with aqueous copper (II) chloride, what solid product(s) may form?
Write the chemical formula(s).
4) What evidence might you observe to support your answer to question-3?
5) Using your answer(s) from question-2 and question-3, write a balanced equation(s) to represent the
chemical reaction(s) that may takes place when pure solid iron reacts with aqueous copper (II)
chloride.
6) Classify the chemical reaction(s) you wrote in question-5
7) Based on the Activity Series of Metals in Aqueous Solution found in your textbook (Table 4.5),
would you expect the equation(s) you wrote in question-5 to be spontaneous. Explain.

-25-
Lab-7: Qualitative Analysis of a Solution
Introduction:
The process of determining the composition of a sample of matter by conduction chemical tests is called
qualitative analysis. An Unknown solution can be subjected to a series of chemical and physical tests
and the results are logically analyzed in order to determine the composition of the solution. The tests can
include: flame testing, conductivity testing (electrolyte or nonelectrolyte), and reagent testing. Reagent
testing uses a number of known solutions (reagents) to determine the identity of an unknown solution.
In reagent testing, one can look for the formation of a precipitate. Knowledge of the solubility rules
and/or an analysis scheme helps to detect the presences of various ions in solution. Solutions of
compounds containing Ag1+, Pb2+, or Hg22+ ions can be detected by adding HCl and observing for the
precipitation of white crystals.
In reagent testing, one can look for the evolution of a gas. Solutions of compounds containing NH4+ ions
can be detected by adding a strong base and smelling for the presence of NH3(g). Solutions of compounds
containing CO32- ions can be detected by adding a strong acid and observing for the presence of CO2(g).
In reagent testing, one can look for a specific color change due to the formation of a complex ion.
Solutions of compounds containing Cu2+ ion turn from light blue to dark blue when NH3(aq) is added.
Solutions of compounds containing Fe3+ ions turns from orange to dark red when SCN-(aq) is added.
Your knowledge of the solubility rules and the flame test colors is essential for qualitative analysis.
Ions that form
Soluble
Compounds
Exceptions
Ions that form
Insoluble
Compounds
Exceptions
Group-1 cations &
NH41+
CO32- Group-1 cations & NH4
1+
NO31- S2- Group-1 cations & NH4
1+
C2H3O21- [CH3COO1-] PO4
3- Group-1 cations & NH41+
HCO31-
CrO42-
Group-1 cations & NH41+,
& Mg2+, Ca2+ ClO31- & ClO4
1-
Cl1-, Br1-, I1- Ag1+, Pb2+, Hg22+
OH1- Group-1 cations & NH4
1+,
& Ca2+, Sr2+, Ba2+ SO42-
Ag1+, Pb2+, Ca2+,
Sr2+, Ba2+
Flame Test Colors for Some Alkali Metal Ions & Alkaline Earth Metal Ions
Metal Ion Na1+ Li1+ K1+ Ca2+ Sr2+ Ba2+
Color Dark Yellow Red (Crimson) Violet (Lilac) Orange-Red Red-Scarlet Yellowish Green
Purpose:
In this experiment, you will determine the identity of two sets of unknown solutions. The dropper bottles
in the first set of unknown solutions are labeled Q, R, and S. Each bottle contains one of the following
solutions: 1.0M Pb(NO3)2, 1.0M NaCl, and 1.0M K2CO3. The dropper bottles in the second set of
unknown solutions are labeled X and Y. Each bottle contains one of the following solutions: 1.0M
AgNO3 and 1.0M BaCl2.

-26-
Procedure: GOGGLES AND APRONS ARE TO BE WORN AT ALL TIMES!
Part I: Caution, AgNO3(aq) will stain your skin black. Wash your hands frequently.
1) Combine a drop of solution Q and a drop of solution X. Record your observation in Data Table 1.
2) Combine a drop of solution Q and a drop of solution Y. Record your observation in Data Table 1.
3) Based on your observations, determine the identity if solution Q (______________________).
4) Combine a drop of solution Q and a drop of solution R. Record your observation in Data Table 1.
5) Combine a drop of solution Q and a drop of solution S. Record your observation in Data Table 1.
6) Based on your observations, determine the identity if solution R (______________________) and
solution S (______________________).
Data Table 1
Combination of
Solutions Q and X
Combination of
Solutions Q and Y
Combination of
Solutions Q and R
Combination of
Solutions Q and S
Part II:
7) Using your conclusions from Part I, determine and write a procedure to identify solution X and
solution Y by using one or more of the identified solutions from Part I. Be sure to describe the
observations that would allow you to distinguish between the solutions X and Y.
____________________________________________________________________________
____________________________________________________________________________
____________________________________________________________________________
____________________________________________________________________________
____________________________________________________________________________
____________________________________________________________________________
____________________________________________________________________________
8) Perform your procedure and record your observations in Data Table 2, which you will make below
(neatly... “Mr. Reed neatly”).
9) Solution X is ______________ and solution Y is ______________.
Part III:
10) Obtain a nichrome loop and 50 mL of distilled water.
11) Dip the loop into the solution of Q. Place the wet loop into the Bunsen burner flame for a few
seconds. Repeat as many times as necessary to observe flame color. Record color below. Rinse
the loop very well in the distilled water and repeat the process with the other solutions.
Q: _______________________ R: _______________________ S: _______________________
X: _______________________ Y: _______________________
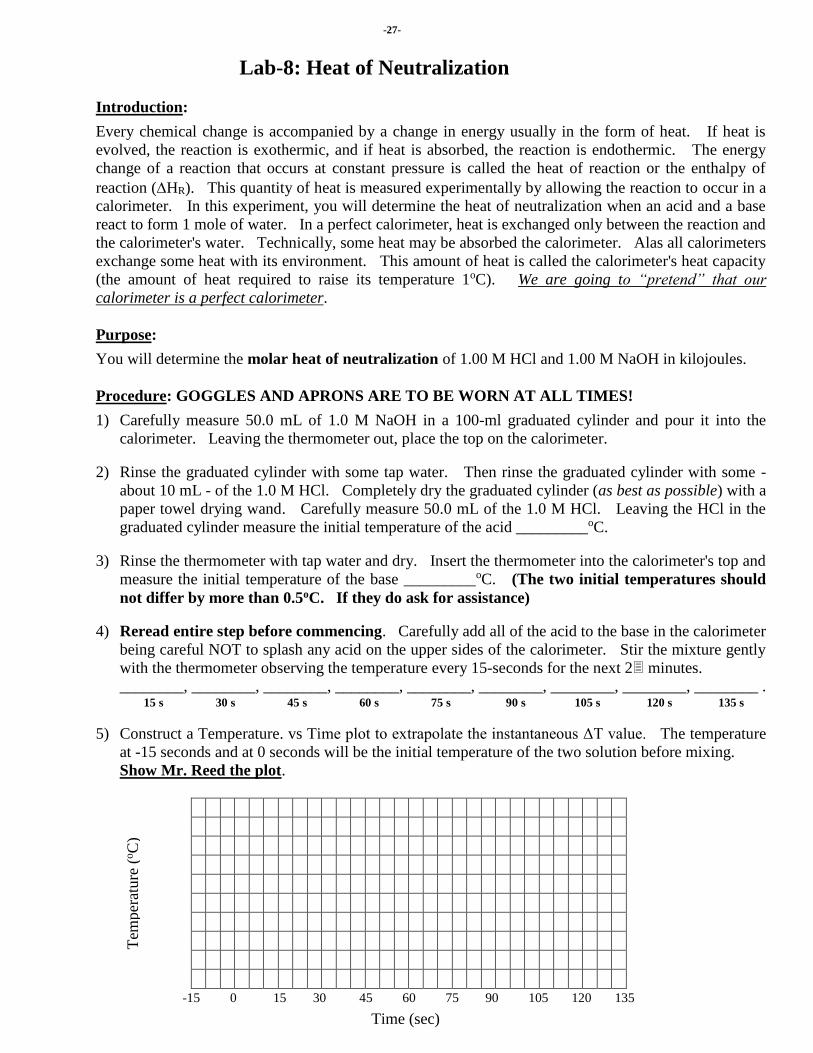
-27-
Lab-8: Heat of Neutralization
Introduction:
Every chemical change is accompanied by a change in energy usually in the form of heat. If heat is
evolved, the reaction is exothermic, and if heat is absorbed, the reaction is endothermic. The energy
change of a reaction that occurs at constant pressure is called the heat of reaction or the enthalpy of
reaction (HR). This quantity of heat is measured experimentally by allowing the reaction to occur in a
calorimeter. In this experiment, you will determine the heat of neutralization when an acid and a base
react to form 1 mole of water. In a perfect calorimeter, heat is exchanged only between the reaction and
the calorimeter's water. Technically, some heat may be absorbed the calorimeter. Alas all calorimeters
exchange some heat with its environment. This amount of heat is called the calorimeter's heat capacity
(the amount of heat required to raise its temperature 1oC). We are going to “pretend” that our
calorimeter is a perfect calorimeter.
Purpose:
You will determine the molar heat of neutralization of 1.00 M HCl and 1.00 M NaOH in kilojoules.
Procedure: GOGGLES AND APRONS ARE TO BE WORN AT ALL TIMES!
1) Carefully measure 50.0 mL of 1.0 M NaOH in a 100-ml graduated cylinder and pour it into the
calorimeter. Leaving the thermometer out, place the top on the calorimeter.
2) Rinse the graduated cylinder with some tap water. Then rinse the graduated cylinder with some -
about 10 mL - of the 1.0 M HCl. Completely dry the graduated cylinder (as best as possible) with a
paper towel drying wand. Carefully measure 50.0 mL of the 1.0 M HCl. Leaving the HCl in the
graduated cylinder measure the initial temperature of the acid _________oC.
3) Rinse the thermometer with tap water and dry. Insert the thermometer into the calorimeter's top and
measure the initial temperature of the base _________oC. (The two initial temperatures should
not differ by more than 0.5oC. If they do ask for assistance)
4) Reread entire step before commencing. Carefully add all of the acid to the base in the calorimeter
being careful NOT to splash any acid on the upper sides of the calorimeter. Stir the mixture gently
with the thermometer observing the temperature every 15-seconds for the next 2 minutes.
________, ________, ________, ________, ________, ________, ________, ________, ________ . 15 s 30 s 45 s 60 s 75 s 90 s 105 s 120 s 135 s
5) Construct a Temperature. vs Time plot to extrapolate the instantaneous ΔT value. The temperature
at -15 seconds and at 0 seconds will be the initial temperature of the two solution before mixing.
Show Mr. Reed the plot.
Time (sec)
Tem
per
ature
(oC
)
((se
c)
-15 0 15 30 45 60 75 90 105 120 135
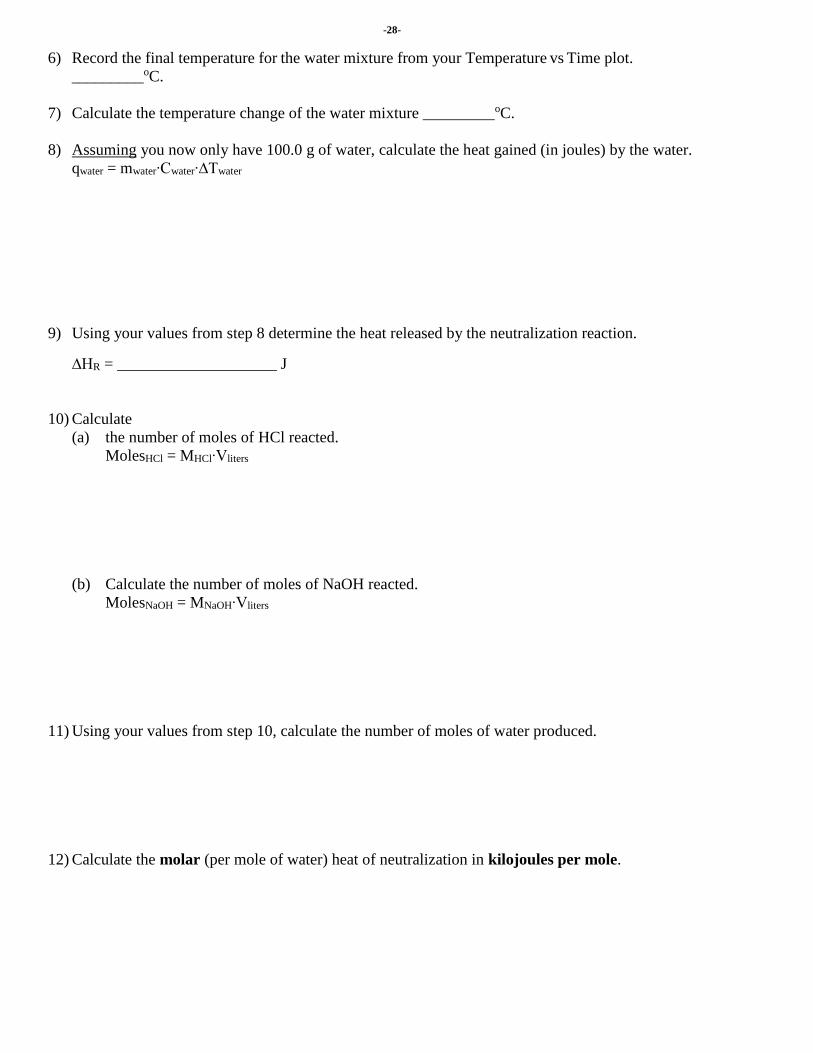
-28-
6) Record the final temperature for the water mixture from your Temperature vs Time plot.
_________oC.
7) Calculate the temperature change of the water mixture _________oC.
8) Assuming you now only have 100.0 g of water, calculate the heat gained (in joules) by the water.
qwater = mwater∙Cwater∙∆Twater
9) Using your values from step 8 determine the heat released by the neutralization reaction.
∆HR = ____________________ J
10) Calculate
(a) the number of moles of HCl reacted.
MolesHCl = MHCl∙Vliters
(b) Calculate the number of moles of NaOH reacted.
MolesNaOH = MNaOH∙Vliters
11) Using your values from step 10, calculate the number of moles of water produced.
12) Calculate the molar (per mole of water) heat of neutralization in kilojoules per mole.

-29-
Repeat the procedure to collect data for a 2nd trial.
Clean and dry both the calorimeter and thermometer very well! WASH! WASH! DRY! DRY!
13) Carefully measure 50.0 mL of 1.0 M NaOH in a 100-ml graduated cylinder and pour it into the
calorimeter. Leaving the thermometer out, place the top on the calorimeter.
14) Rinse the graduated cylinder with some tap water. Then rinse the graduated cylinder with some -
about 10 mL - of the 1.0 M HCl. Dry the graduated cylinder (as best as possible) with a paper
towel drying wand. Carefully measure 50.0 mL of the 1.0 M HCl. Leaving the HCl in the
graduated cylinder measure the initial temperature of the acid _________oC.
15) Rinse the thermometer with tap water and dry. Insert the thermometer into the calorimeter's top and
measure the initial temperature of the base _________oC. (The two initial temperatures should
not differ by more than 0.5oC. If they do ask for assistance)
16) Reread entire step before commencing. Carefully add all of the acid to the base in the calorimeter
being careful NOT to splash any acid on the upper sides of the calorimeter. Stir the mixture gently
with the thermometer observing the temperature every 15-seconds for the next 2 minutes.
________, ________, ________, ________, ________, ________, ________, ________, ________. 15 s 30 s 45 s 60 s 75 s 90 s 105 s 120 s 135 s
17) Construct a Temp. vs Time plot to extrapolate the instantaneous ΔT value and extrapolate the data as
Mr. Reed showed you how in the first trial.
18) Record the final temperature for the water mixture from your Temperature vs Time plot.
_________oC.
19) Calculate the temperature change of the water mixture _________oC.
20) Assuming you now only have 100.0 g of water, calculate the heat gained (in joules) by the water.
qwater = mwater∙Cwater∙∆Twater
21) Using your values from step 20 determine the heat released by the neutralization reaction.
∆HR = ____________________ J
Time (sec)
Tem
per
ature
(oC
)
((se
c)
-15 0 15 30 45 60 75 90 105 120 135

-30-
22) Calculate
(a) the number of moles of HCl reacted.
MolesHCl = MHCl∙Vliters
(b) Calculate the number of moles of NaOH reacted.
MolesNaOH = MNaOH∙Vliters
23) Using your values from step 22, calculate the number of moles of water produced.
24) Calculate the molar (per mole of water) heat of neutralization in kilojoules per mole.
25) Write the "molecular" neutralization equation for the reaction between HCl and NaOH.
__________________________________________________________________________
26) Write the net ionic equation for the reaction that occurs between HCl and NaOH.
__________________________________________________________________________

-31-
Lab-9: The Law of Dulong and Petit
Introduction:
The first direct approach to the determination of atomic masses was proposed in 1819 by two
Frenchmen, Pierre Dulong and Alexis Petit. They assumed that the amount of heat required to raise the
temperature of one atom of a solid element by 1oC should be independent of the type of atom … since
atoms are atoms! In their words, "the atoms of all simple bodies have the same capacity for heat."
Since one mole of every element contains the same number of atoms, a fixed amount of heat should then
be required to raise the temperature of one mole of a solid at constant pressure by 1oC. This amount of
heat is called the molar heat capacity (Cp) and Dulong and Petit set this value at about 25 J/moloC.
Cp = H/T 25 J/moloC
The Law of Dulong and Petit is expressed most simply in terms of the property called specific heat (cp).
Specific heat is the amount of heat needed to raise the temperature of 1 gram of a substance at constant
pressure by 1oC.
cp = q/mT
By the Law of Dulong and Petit, the product of the molar mass (MM or M) of a solid element multiplied
by its specific heat (cp) is approximately equal to the molar heat capacity constant of 25 J/moloC.
M cp 25 J/moloC
thus
M (25 J/moloC) (cp)
This was a relatively crude approach but remember that it was 1819!
Purpose:
In this experiment you will determine the specific heat of an unknown metallic element. Using your
experimental value for the unknown’s specific heat and the Law of Dulong and Petit, you will
approximate the molar mass for the unknown element.
Procedure: GOGGLES AND APRONS ARE TO BE WORN AT ALL TIMES!
DATA TABLE ON BACK!
1) STUDENT-1: Find and record the mass of the unknown metallic element. Give metal to student-2.
2) STUDENT-2: Place enough water in a large beaker to cover the unknown metallic element [do not
put the unknown metallic element in the water at this time]. Bring water to a boil.
3) STUDENT-1: Mass the empty calorimeter. Fill the calorimeter with JUST ENOUGH tap water to
completely cover the unknown metallic element. Carefully read and record the mass of the
calorimeter and the water. DO NOT SPILL THE WATER!
4) STUDENT-1: Read and record the initial temperature of the water in the calorimeter.
5) STUDENT-2: Carefully place the unknown metallic element in the boiling water with the tongs.
Allow several minutes for the boiling water and the unknown metallic element to reach the same
temperature. While touching the unknown metallic element with the thermometer’s bulb, read and
record the initial temperature of the hot unknown metallic element in the calorimeter (which is also
the temperature of the boiling water).
6) STUDENT-2: Carefully and quickly transfer the unknown to the calorimeter. Don’t splash water!
Carefully stir the water and record the final temperature of the water in the calorimeter (which is also
the final temperature of the unknown). This will occur in 60 seconds.
7) Repeat steps 2 – 6 twice more. Empty, dry, and use new water in the calorimeter each time!
8) Calculate the specific heat of the unknown metallic element for each trial and then the average
specific heat for unknown metallic element.
9) Using the average calculated specific heat values and the Law of Dulong and Petit, determine the
molar mass of the unknown metallic element.
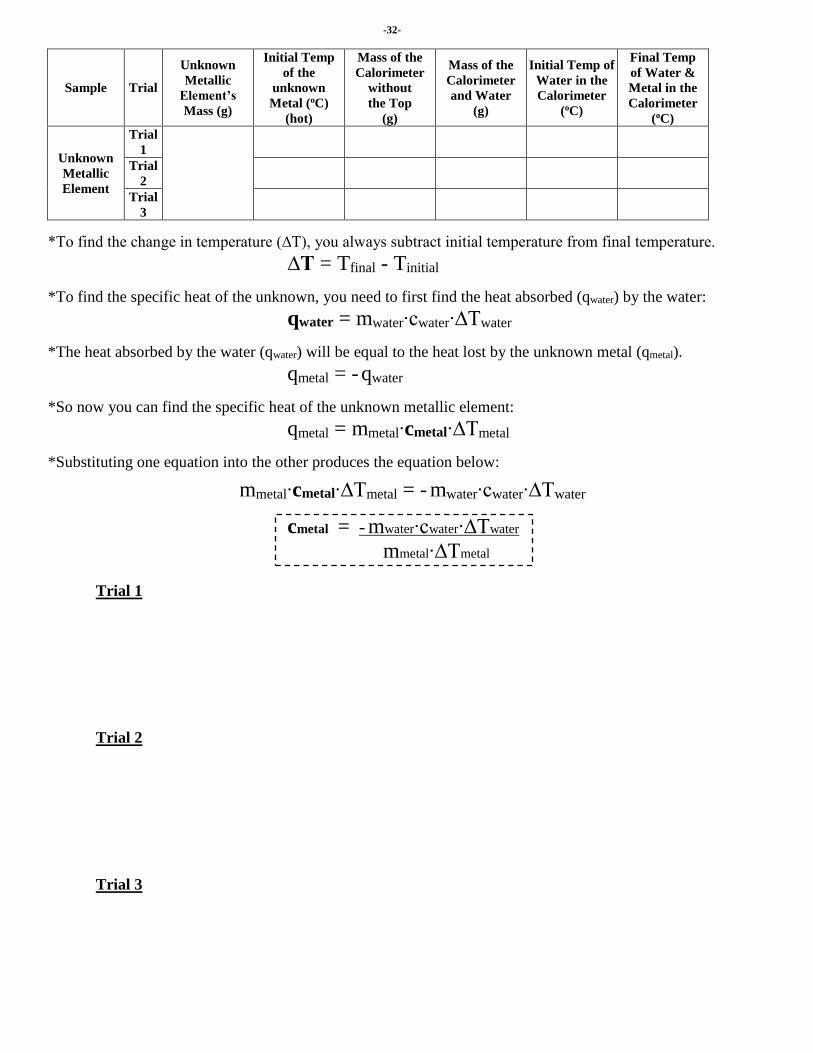
-32-
Sample Trial
Unknown
Metallic
Element’s
Mass (g)
Initial Temp
of the
unknown
Metal (oC)
(hot)
Mass of the
Calorimeter
without
the Top
(g)
Mass of the
Calorimeter
and Water
(g)
Initial Temp of
Water in the
Calorimeter
(oC)
Final Temp
of Water &
Metal in the
Calorimeter
(oC)
Unknown
Metallic
Element
Trial
1
Trial
2
Trial
3
*To find the change in temperature (∆T), you always subtract initial temperature from final temperature.
∆T = Tfinal - Tinitial
*To find the specific heat of the unknown, you need to first find the heat absorbed (qwater) by the water:
qwater = mwater∙cwater∙∆Twater
*The heat absorbed by the water (qwater) will be equal to the heat lost by the unknown metal (qmetal).
qmetal = - qwater
*So now you can find the specific heat of the unknown metallic element:
qmetal = mmetal∙cmetal∙∆Tmetal
*Substituting one equation into the other produces the equation below:
mmetal∙cmetal∙∆Tmetal = - mwater∙cwater∙∆Twater
cmetal = - mwater∙cwater∙∆Twater
mmetal∙∆Tmetal
Trial 1
Trial 2
Trial 3

-33-
Lab-10: Precipitation Titrations
Introduction:
The process of a reaction between an observed volume of solution of unknown concentration with an
observed volume of solution of known concentration (a standard solution) is called titration. When
pairs of ions, that compose very insoluble ionic compounds, appear in solution together, precipitation
generally occurs. If the concentration of one of the ions is known, then the amount of the other ion
(necessary for “complete precipitation”) can be determined through precipitation titration.
The concentration of the ions needed to trigger precipitation is governed by the ionic compound’s Ksp
value. The Ksp for a compound represents the maximum value that the ion-product (P) may be for a
pair of ions in solution.
A solution’s ion-product value (P) is determined by multiplying the molar concentration of the cation by
the molar concentration of the anion each raised to a power equal to its coefficient in the solubility
equation.
For CaCO3: CaCO3(s) Ca2+(aq) + CO3
2-(aq) P = [Ca2+][CO3
2-]
For PbCl2: PbCl2(s) Pb2+(aq) + 2 Cl1-
(aq) P = [Pb2+][Cl1-]2
To determine whether precipitation will occur, it is necessary to calculate the ion-product value (P) for a
particular solution and then to compare the solution’s P value to the compound’s Ksp value.
If the solution’s P < the compound’s Ksp, then no precipitation will occur.
If the solution’s P > the compound’s Ksp, then precipitation will occur.
If the solution’s P = the compound’s Ksp, then the solution is just saturated.
Questions For Thought:
1) If a solution contains [Ca2+] = 8.110-5 M and [CO3
2-] = 1.610-5 M, then will precipitation occur if
the Ksp for CaCO3 is 4.510-9?
a) Write the solubility equation. _____________________________________________________
b) Determine the value of P.
2) If a solution contains [Pb2+] = 9.510-2 M and [Cl1-] = 7.310-2
M, then will precipitation occur if
the Ksp for PbCl2 is 1.710-5?
a) Write the solubility equation. _____________________________________________________
b) Determine the value of P.

-34-
The chloride ion concentration of a solution may be determined by titrating a sample with a silver nitrate
solution of known concentration. A white precipitate of silver chloride forms. The indicator used to
signal to end point is a dilute solution of potassium chromate. When all the chloride ions have reacted
(precipitated), any excess silver ions added will react with the chromate ions to form a red-brown
precipitate of silver chromate. This procedure is known as Mohr’s method.
Titration before end point: Ag1+(aq) + excess Cl1-
(aq) → AgCl(s) (white)
Titration at end point: Ag1+(aq) + just runs out Cl1-
(aq)
Titration just after end point: Ag1+(aq) + CrO4
2-(aq) → Ag2CrO4(s) (red-brown)
Purpose:
In this laboratory activity, you will determine the molar concentration of chloride ions in a water sample
[Mohr’s Method] by titrating it with a silver nitrate solution of known concentration (0.10 M).
Procedure: GOGGLES AND APRONS ARE TO BE WORN AT ALL TIMES!
1) Create a data table in the space below in the “Data and Observations” section.
2) Obtain about 30 mL of “seawater” in a 50 mL beaker. Pipette 20 mL of the “seawater” into a 100
mL graduated cylinder. Dilute the “seawater” up to the 100 mL mark.
3) Fill the burets with the diluted “seawater and the 0.10 M silver nitrate solution. Read the initial
volumes of the burets. Caution: Exposure to AgNO3(aq) will turn skin black. Wash your hands
frequently.
4) Put about 10 mL (it doesn't have to be exactly 10 mL - just about 10 mL) of the diluted “seawater”
in the Erlenmeyer flask. Add 1 mL of chromate indicator to the Erlenmeyer flask.
5) Begin adding drops of the silver nitrate solution to the Erlenmeyer flask. Swirl the Erlenmeyer flask
after every few drops of silver nitrate solution that are added. Continue to add silver nitrate solution
until the solution turns pink (a mixture of white and red-brown). If you add too much of the silver
nitrate solution and the solution turns dark red-brown, then add some more diluted “seawater” until the
pink color is obtained.
6) Read the final volumes for the diluted “seawater” and silver nitrate solutions and record them in the
data table.
7) Wash and very carefully "shake dry" the Erlenmeyer flask.
8) Repeat steps 2 - 5 two more times.
Data and Observations: Create your data table here!
↑ pink
↓

-35-
Lab-11: Activity Series of Selected Metals
Introduction:
An activity series is a ranking of elements based on their ease of reaction. In the case of metals, an
activity series is based on their ease of oxidation and the metals are listed from the most reactive to the
least reactive. When metals are oxidized, their atoms lose one or more electrons. An activity series
can be used to predict whether or not a particular reaction will or will not occur. As a general rule,
metallic ions will spontaneously be displaced from solution by another metal higher on the activity
series. Hydrogen gas is considered with the metals in the metallic activity series.
Purpose:
To rank, from highest to lowest, the activity of the four pure metals based on your observations.
Procedure: GOGGLES AND APRONS ARE TO BE WORN AT ALL TIMES!
1) Obtain 7 pieces of metal-A, metal-B, metal-C, and metal-D. HANDLE WITH FORCEPS ONLY!
2) Place a small piece of each metal in the wells as shown in the diagram below. The 7th piece of each
metal is to be used as a control.
Hot H2O HCl CaCl2 AlCl3 FeCl2 CuCl2
3) In column-1, add enough drops of hot distilled water to almost fill each well. Observe each well for
any evidence of a reaction and the level of that reaction. You may have to re-observe several times.
_________________________________________________________________________________
_________________________________________________________________________________
_________________________________________________________________________________
_________________________________________________________________________________
_________________________________________________________________________________
_________________________________________________________________________________
4) In column-2 add enough drops of 1.0 M HCl to almost fill each well. Caution: 1.0 M HCl is
caustic and corrosive. Observe each well for any evidence of a reaction and the level of that
reaction. You may have to re-observe several times.
_________________________________________________________________________________
_________________________________________________________________________________
_________________________________________________________________________________
_________________________________________________________________________________
_________________________________________________________________________________
_________________________________________________________________________________
A A A A A A
B B B B B B
C C C C C C
D D D D D D

-36-
5) In column-3, add enough drops of 0.10 M CaCl2 to almost fill each well. Observe each well for any
evidence of a reaction and the level of that reaction. You may have to re-observe several times.
_________________________________________________________________________________
_________________________________________________________________________________
_________________________________________________________________________________
_________________________________________________________________________________
_________________________________________________________________________________
_________________________________________________________________________________
6) In column-4, add enough drops of 0.10 M AlCl3 to almost fill each well. Observe each well for any
evidence of a reaction and the level of that reaction. You may have to re-observe several times.
_________________________________________________________________________________
_________________________________________________________________________________
_________________________________________________________________________________
_________________________________________________________________________________
_________________________________________________________________________________
_________________________________________________________________________________
7) In column-5, add enough drops of 0.10 M FeCl2 to almost fill each well. Observe each well for any
evidence of a reaction and the level of that reaction. You may have to re-observe several times.
_________________________________________________________________________________
_________________________________________________________________________________
_________________________________________________________________________________
_________________________________________________________________________________
_________________________________________________________________________________
_________________________________________________________________________________
8) In column-6, add enough drops of 0.10 M CuCl2 to almost fill each well. Observe each well for any
evidence of a reaction and the level of that reaction. You may have to re-observe several times.
_________________________________________________________________________________
_________________________________________________________________________________
_________________________________________________________________________________
_________________________________________________________________________________
_________________________________________________________________________________
_________________________________________________________________________________
9) Carefully rinse your well plate in the dilute baking soda bath. Make sure all the metal samples are
dumped into this bath.
10) Carefully rinse your well plate with hot/warm water in the sink in the prep room.
11) Thoroughly clean the well plate. Use a cotton swab to scrub clean each well in the well plate and
dry the well plate with paper towel.
12) Tentatively rank, from highest to lowest, the activity of the four metals based on your observations.
________ > ________ > ________ > ________

-37-
Lab-12: Molar Mass of an Unknown Volatile Liquid
Introduction:
Volatile liquids evaporate at a high rate at room temperature and thus have high vapor pressures. When
heated to a high temperature, a volatile liquid will quickly evaporate and expand to fill the container.
The amount of vapor that will fill the container depends on the container's volume, the temperature of
the vapor, and the prevailing atmospheric pressure. Any excess vapor will be expelled from the
container. Once equilibrium between the amount of vapor in the container and the prevailing
conditions has been reached, the system can cool, the vapor can condense and its mass can be
determined. Using the density form of the universal gas law (dRT = MMP), it is possible to determine
the molar mass (MM) of an unknown volatile liquid, where d is density (g/L), R is 0.0821 L∙atm/mol∙K,
T is temperature (K), and P is pressure (atm).
This procedure will work with any volatile liquid since equal numbers of vapor molecules with occupy
the same volume under the same conditions of temperature and pressure. This is known as Avogadro’s
Law (or Avogadro’s Hypothesis):
n PV T
This eventually led to the combined gas law:
P1V1 = P2V2
n1T1 n2T2
The combined gas law eventually led to the universal gas law:
n = PV
RT
or
PV = nRT
Since molar mass (MM) is equal to the ratio of mass (m) to moles (n), then moles (n) is equal to the ratio
of mass (m) to molar mass (MM).
n = m/MM
Substituting in the universal gas law, one gets
MMPV = mRT
Dividing both sides by volume, one gets
MMP = mRT
V
Since the ratio of m/V is equal to density, the equation becomes
dRT = MMP
or
MM = dRT
P
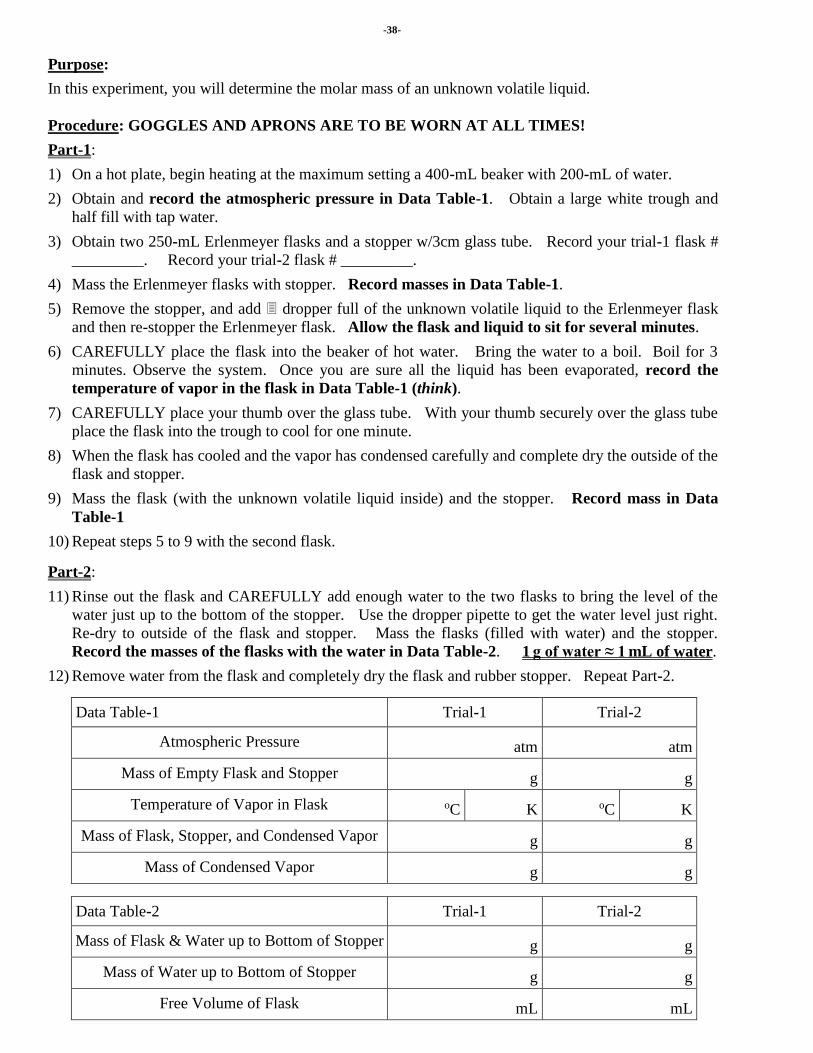
-38-
Purpose:
In this experiment, you will determine the molar mass of an unknown volatile liquid.
Procedure: GOGGLES AND APRONS ARE TO BE WORN AT ALL TIMES!
Part-1:
1) On a hot plate, begin heating at the maximum setting a 400-mL beaker with 200-mL of water.
2) Obtain and record the atmospheric pressure in Data Table-1. Obtain a large white trough and
half fill with tap water.
3) Obtain two 250-mL Erlenmeyer flasks and a stopper w/3cm glass tube. Record your trial-1 flask #
_________. Record your trial-2 flask # _________.
4) Mass the Erlenmeyer flasks with stopper. Record masses in Data Table-1.
5) Remove the stopper, and add dropper full of the unknown volatile liquid to the Erlenmeyer flask
and then re-stopper the Erlenmeyer flask. Allow the flask and liquid to sit for several minutes.
6) CAREFULLY place the flask into the beaker of hot water. Bring the water to a boil. Boil for 3
minutes. Observe the system. Once you are sure all the liquid has been evaporated, record the
temperature of vapor in the flask in Data Table-1 (think).
7) CAREFULLY place your thumb over the glass tube. With your thumb securely over the glass tube
place the flask into the trough to cool for one minute.
8) When the flask has cooled and the vapor has condensed carefully and complete dry the outside of the
flask and stopper.
9) Mass the flask (with the unknown volatile liquid inside) and the stopper. Record mass in Data
Table-1
10) Repeat steps 5 to 9 with the second flask.
Part-2:
11) Rinse out the flask and CAREFULLY add enough water to the two flasks to bring the level of the
water just up to the bottom of the stopper. Use the dropper pipette to get the water level just right.
Re-dry to outside of the flask and stopper. Mass the flasks (filled with water) and the stopper.
Record the masses of the flasks with the water in Data Table-2. 1 g of water ≈ 1 mL of water.
12) Remove water from the flask and completely dry the flask and rubber stopper. Repeat Part-2.
Data Table-1 Trial-1 Trial-2
Atmospheric Pressure atm atm
Mass of Empty Flask and Stopper g g
Temperature of Vapor in Flask oC K oC K
Mass of Flask, Stopper, and Condensed Vapor g g
Mass of Condensed Vapor g g
Data Table-2 Trial-1 Trial-2
Mass of Flask & Water up to Bottom of Stopper g g
Mass of Water up to Bottom of Stopper g g
Free Volume of Flask mL mL
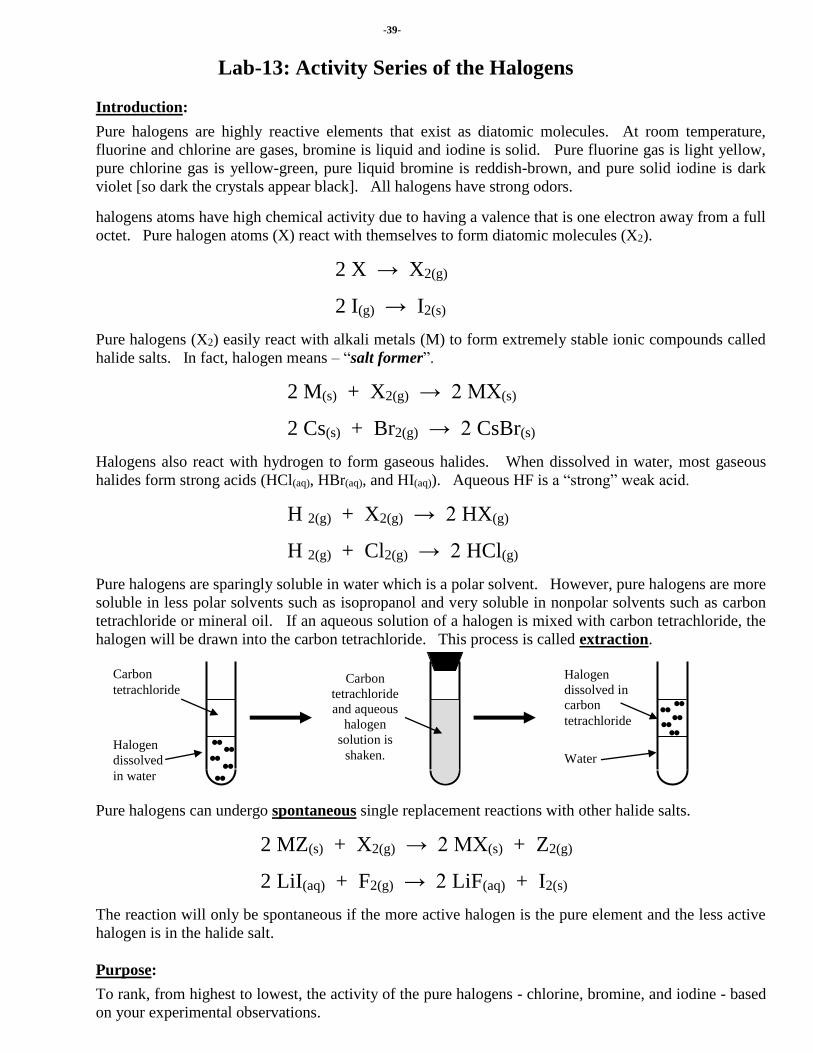
-39-
Lab-13: Activity Series of the Halogens
Introduction:
Pure halogens are highly reactive elements that exist as diatomic molecules. At room temperature,
fluorine and chlorine are gases, bromine is liquid and iodine is solid. Pure fluorine gas is light yellow,
pure chlorine gas is yellow-green, pure liquid bromine is reddish-brown, and pure solid iodine is dark
violet [so dark the crystals appear black]. All halogens have strong odors.
halogens atoms have high chemical activity due to having a valence that is one electron away from a full
octet. Pure halogen atoms (X) react with themselves to form diatomic molecules (X2).
2 X → X2(g)
2 I(g) → I2(s)
Pure halogens (X2) easily react with alkali metals (M) to form extremely stable ionic compounds called
halide salts. In fact, halogen means – “salt former”.
2 M(s) + X2(g) → 2 MX(s)
2 Cs(s) + Br2(g) → 2 CsBr(s)
Halogens also react with hydrogen to form gaseous halides. When dissolved in water, most gaseous
halides form strong acids (HCl(aq), HBr(aq), and HI(aq)). Aqueous HF is a “strong” weak acid.
H 2(g) + X2(g) → 2 HX(g)
H 2(g) + Cl2(g) → 2 HCl(g)
Pure halogens are sparingly soluble in water which is a polar solvent. However, pure halogens are more
soluble in less polar solvents such as isopropanol and very soluble in nonpolar solvents such as carbon
tetrachloride or mineral oil. If an aqueous solution of a halogen is mixed with carbon tetrachloride, the
halogen will be drawn into the carbon tetrachloride. This process is called extraction.
Pure halogens can undergo spontaneous single replacement reactions with other halide salts.
2 MZ(s) + X2(g) → 2 MX(s) + Z2(g)
2 LiI(aq) + F2(g) → 2 LiF(aq) + I2(s)
The reaction will only be spontaneous if the more active halogen is the pure element and the less active
halogen is in the halide salt.
Purpose:
To rank, from highest to lowest, the activity of the pure halogens - chlorine, bromine, and iodine - based
on your experimental observations.
Water
Halogen
dissolved in
carbon
tetrachloride
Halogen
dissolved
in water
Carbon
tetrachloride Carbon
tetrachloride
and aqueous
halogen
solution is
shaken.

-40-
Procedure: GOGGLES AND APRONS ARE TO BE WORN AT ALL TIMES!
1) Set up a well plate as shown below.
2) In row-1, half fill each well with bromine water (pure bromine dissolved in water).
Observe the color of bromine water. ______________________________________________
3) In row-2, half fill each well with chlorine water (pure chlorine dissolved in water).
Observe the color of chlorine water. ______________________________________________
4) In row-3, half fill each well with iodine water (pure iodine dissolved in water).
Observe the color of iodine water. ______________________________________________
5) LEAVE COLUMN-1 AS A CONTROL.
6) In column-2, using the spatula add a small amount (lentil size) of solid NaBr crystals each well.
7) One by one, stir each well with a toothpick.
8) After a few minutes, observe and record the final color of the mixtures in column-2.
Row-1 ________________________________________ Did a color change occur? __________
Row-2 ________________________________________ Did a color change occur? __________
Row-3 ________________________________________ Did a color change occur? __________
9) In column-3, using the spatula add a small amount (lentil size) of solid NaCl crystals each well.
10) One by one, stir each well with a toothpick.
11) After a few minutes, observe and record the final color of the mixtures in column-3.
Row-1 ________________________________________ Did a color change occur? __________
Row-2 ________________________________________ Did a color change occur? __________
Row-3 ________________________________________ Did a color change occur? __________
12) In column-4, using the spatula add a small amount (lentil size) of solid NaI crystals each well.
13) One by one, stir each well with a toothpick.
14) After a few minutes, observe and record the final color of the mixtures in column-4.
Row-1 ________________________________________ Did a color change occur? __________
Row-2 ________________________________________ Did a color change occur? __________
Row-3 ________________________________________ Did a color change occur? __________
15) CAREFULLY PLACE THE WELL PLATE INTO THE BIN OF SOAPY WATER.
Row-1
Row-2
Row-3
Column-1
Column-2
Column-3
Column-4
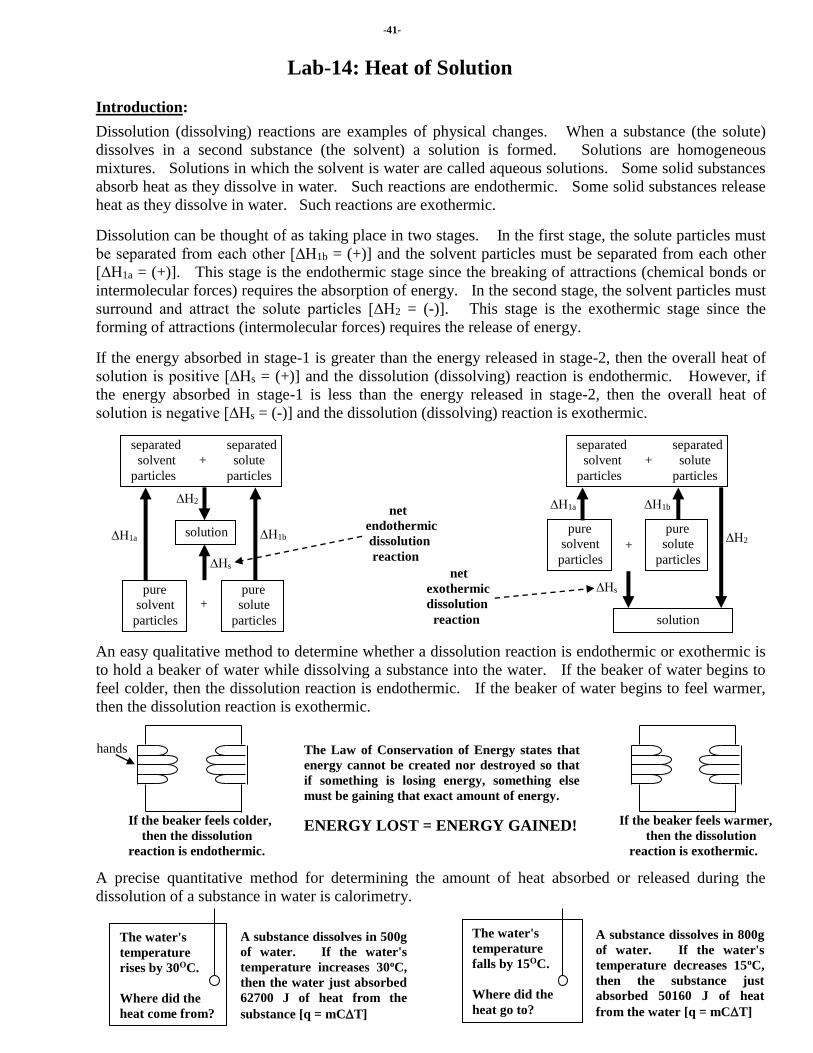
-41-
Lab-14: Heat of Solution
Introduction:
Dissolution (dissolving) reactions are examples of physical changes. When a substance (the solute)
dissolves in a second substance (the solvent) a solution is formed. Solutions are homogeneous
mixtures. Solutions in which the solvent is water are called aqueous solutions. Some solid substances
absorb heat as they dissolve in water. Such reactions are endothermic. Some solid substances release
heat as they dissolve in water. Such reactions are exothermic.
Dissolution can be thought of as taking place in two stages. In the first stage, the solute particles must
be separated from each other [∆H1b = (+)] and the solvent particles must be separated from each other
[∆H1a = (+)]. This stage is the endothermic stage since the breaking of attractions (chemical bonds or
intermolecular forces) requires the absorption of energy. In the second stage, the solvent particles must
surround and attract the solute particles [∆H2 = (-)]. This stage is the exothermic stage since the
forming of attractions (intermolecular forces) requires the release of energy.
If the energy absorbed in stage-1 is greater than the energy released in stage-2, then the overall heat of
solution is positive [∆Hs = (+)] and the dissolution (dissolving) reaction is endothermic. However, if
the energy absorbed in stage-1 is less than the energy released in stage-2, then the overall heat of
solution is negative [∆Hs = (-)] and the dissolution (dissolving) reaction is exothermic.
An easy qualitative method to determine whether a dissolution reaction is endothermic or exothermic is
to hold a beaker of water while dissolving a substance into the water. If the beaker of water begins to
feel colder, then the dissolution reaction is endothermic. If the beaker of water begins to feel warmer,
then the dissolution reaction is exothermic.
A precise quantitative method for determining the amount of heat absorbed or released during the
dissolution of a substance in water is calorimetry.
The water's
temperature
rises by 30OC.
Where did the
heat come from?
The water's
temperature
falls by 15OC.
Where did the
heat go to?
A substance dissolves in 500g
of water. If the water's
temperature increases 30oC,
then the water just absorbed
62700 J of heat from the
substance [q = mCT]
A substance dissolves in 800g
of water. If the water's
temperature decreases 15oC,
then the substance just
absorbed 50160 J of heat
from the water [q = mCT]
If the beaker feels warmer,
then the dissolution
reaction is exothermic.
The Law of Conservation of Energy states that
energy cannot be created nor destroyed so that
if something is losing energy, something else
must be gaining that exact amount of energy.
ENERGY LOST = ENERGY GAINED! If the beaker feels colder,
then the dissolution
reaction is endothermic.
hands
∆Hs
∆H1b ∆H1a
pure
solvent
particles
separated separated
solvent + solute
particles particles
solution
∆H2 solution ∆H1a
∆Hs
∆H1b
separated separated
solvent + solute
particles particles
pure
solvent
particles
∆H2
net
exothermic
dissolution
reaction
net
endothermic
dissolution
reaction
pure
solute
particles
+
pure
solute
particles +

-42-
Purpose: To experimentally determine the molar heat of solution for two the substances, CaCl2
and NH4Cl, in kJ/mol.
Procedure: GOGGLES AND APRONS ARE TO BE WORN AT ALL TIMES!
Write a step-by-step procedure for this experiment. Your procedure MUST be approved by your
teacher BEFORE you begin.
__________________________________________________________________________________
__________________________________________________________________________________
__________________________________________________________________________________
__________________________________________________________________________________
__________________________________________________________________________________
__________________________________________________________________________________
__________________________________________________________________________________
__________________________________________________________________________________
__________________________________________________________________________________
__________________________________________________________________________________
__________________________________________________________________________________
__________________________________________________________________________________
__________________________________________________________________________________
__________________________________________________________________________________
__________________________________________________________________________________
__________________________________________________________________________________
__________________________________________________________________________________
__________________________________________________________________________________
__________________________________________________________________________________
__________________________________________________________________________________
__________________________________________________________________________________
__________________________________________________________________________________
__________________________________________________________________________________
__________________________________________________________________________________
__________________________________________________________________________________
__________________________________________________________________________________
__________________________________________________________________________________
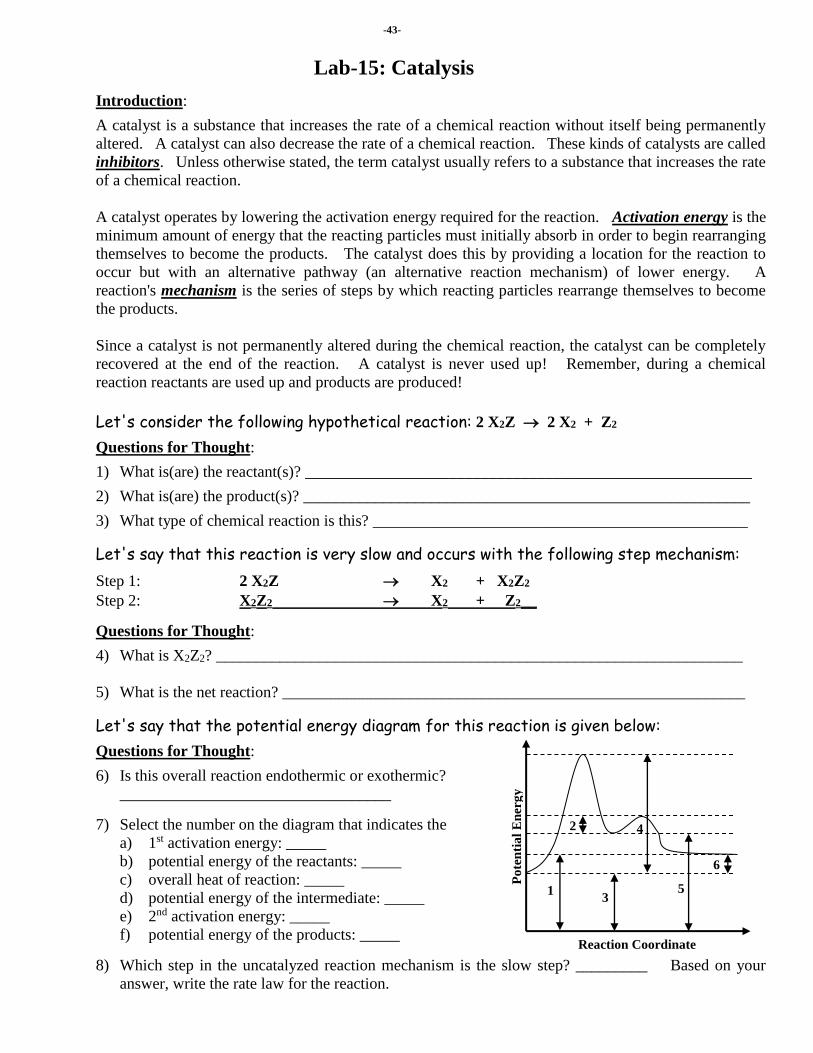
-43-
Lab-15: Catalysis
Introduction:
A catalyst is a substance that increases the rate of a chemical reaction without itself being permanently
altered. A catalyst can also decrease the rate of a chemical reaction. These kinds of catalysts are called
inhibitors. Unless otherwise stated, the term catalyst usually refers to a substance that increases the rate
of a chemical reaction.
A catalyst operates by lowering the activation energy required for the reaction. Activation energy is the
minimum amount of energy that the reacting particles must initially absorb in order to begin rearranging
themselves to become the products. The catalyst does this by providing a location for the reaction to
occur but with an alternative pathway (an alternative reaction mechanism) of lower energy. A
reaction's mechanism is the series of steps by which reacting particles rearrange themselves to become
the products.
Since a catalyst is not permanently altered during the chemical reaction, the catalyst can be completely
recovered at the end of the reaction. A catalyst is never used up! Remember, during a chemical
reaction reactants are used up and products are produced!
Let's consider the following hypothetical reaction: 2 X2Z 2 X2 + Z2
Questions for Thought:
1) What is(are) the reactant(s)? ________________________________________________________
2) What is(are) the product(s)? ________________________________________________________
3) What type of chemical reaction is this? _______________________________________________
Let's say that this reaction is very slow and occurs with the following step mechanism:
Step 1: 2 X2Z X2 + X2Z2
Step 2: X2Z2 X2 + Z2__
Questions for Thought:
4) What is X2Z2? __________________________________________________________________
5) What is the net reaction? __________________________________________________________
Let's say that the potential energy diagram for this reaction is given below:
Questions for Thought:
6) Is this overall reaction endothermic or exothermic?
__________________________________
7) Select the number on the diagram that indicates the
a) 1st activation energy: _____
b) potential energy of the reactants: _____
c) overall heat of reaction: _____
d) potential energy of the intermediate: _____
e) 2nd activation energy: _____
f) potential energy of the products: _____
8) Which step in the uncatalyzed reaction mechanism is the slow step? _________ Based on your
answer, write the rate law for the reaction.
2
6
4
5 1 3
Po
ten
tia
l E
ner
gy
Reaction Coordinate

-44-
Let's consider introducing the catalyst, "E", into the system and let's say that the
catalyzed reaction is now faster and occurs with the following two step mechanism:
Step 1: 2 X2Z + E 2 XZ1- + X2E1+
Step 2: 2 XZ1- + X2E1+ 2 X2 + Z2 + E
Questions for Thought:
9) How many moles of catalyst, E, is introduced in Step 1? _____
10) How many moles of catalyst, E, is produced by Step 2? _____
11) What is XZ1- ? __________________________________________________________________
12) What is X2E1+ ? __________________________________________________________________
13) What is the net reaction? __________________________________________________________
14) Why doesn't E appear in the net reaction? ____________________________________________
______________________________________________________________________________
Let's say that the potential energy diagram for the catalyzed reaction is given below:
Questions for Thought:
15) Select the number on the diagram that indicates the
a) 1st activation energy: _____
b) potential energy of the reactants: _____
c) overall heat of reaction: _____
d) potential energy of the intermediate: _____
e) 2nd activation energy: _____
f) potential energy of the products: _____
16) Is the heat of reaction for the catalyzed reaction more, less,
or the same as the heat of reaction for the uncatalyzed reaction?
___________________________
17) Which step in the catalyzed reaction mechanism is the slow step? _________ Based on your
answer, write the rate law for the reaction.
The presence of the catalysts has created an alternative mechanism, which has lower activation energy.
Notice that the catalyst does not appear in the net reaction equation, nor is it consumed by the reaction
(1 mole of E was added at the beginning of the reaction and 1 moles of E was left at the end of the
reaction). In a reaction equation, a catalyst can usually be identified as a substance that appears at the
very beginning of the reaction and again at the very end of the reaction.
Notice that in both the uncatalyzed reaction and in the catalyzed reaction the intermediates were
produced in the first step of the mechanism and used up in the second step of the mechanism.
18) What is the overall reaction order of the uncatalyzed reaction? _________
19) What is the overall reaction order of the catalyzed reaction? _________
20) Does an increase in the concentration of the catalyst change the reaction of the reaction? Explain.
_________________________________________________________________________________
_________________________________________________________________________________
1
2
3
4 6 5
Po
ten
tia
l E
ner
gy
Reaction Coordinate
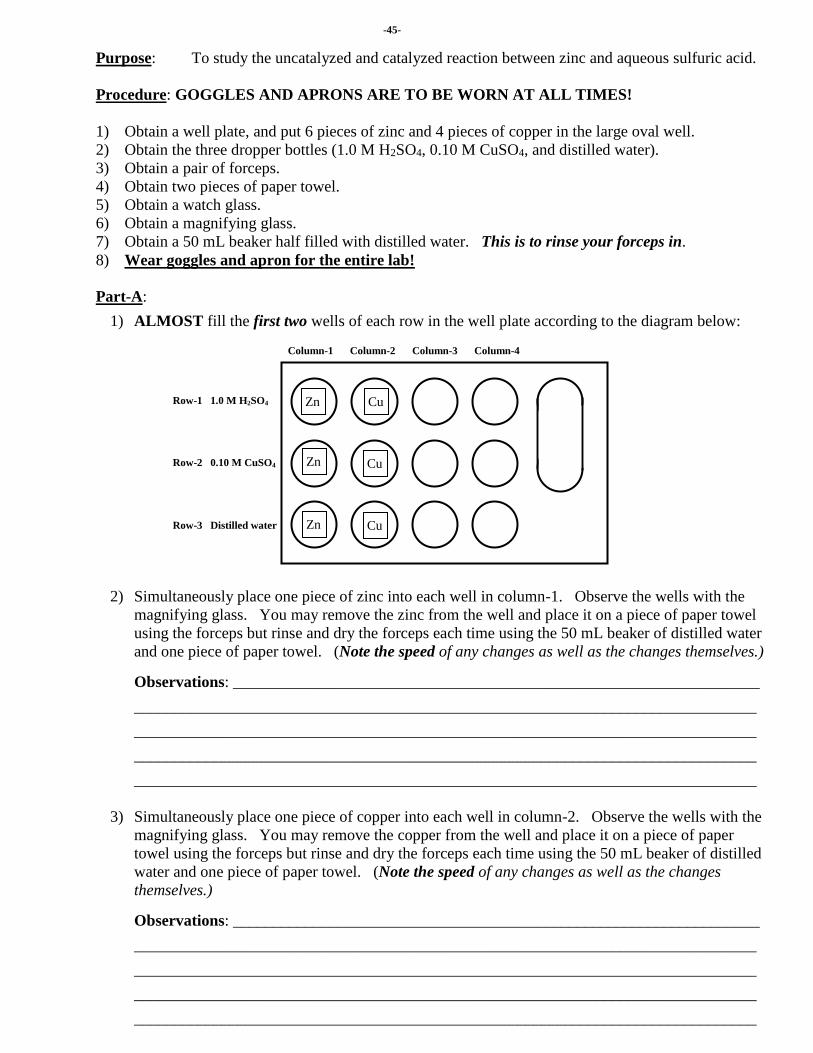
-45-
Purpose: To study the uncatalyzed and catalyzed reaction between zinc and aqueous sulfuric acid.
Procedure: GOGGLES AND APRONS ARE TO BE WORN AT ALL TIMES!
1) Obtain a well plate, and put 6 pieces of zinc and 4 pieces of copper in the large oval well.
2) Obtain the three dropper bottles (1.0 M H2SO4, 0.10 M CuSO4, and distilled water).
3) Obtain a pair of forceps.
4) Obtain two pieces of paper towel.
5) Obtain a watch glass.
6) Obtain a magnifying glass.
7) Obtain a 50 mL beaker half filled with distilled water. This is to rinse your forceps in.
8) Wear goggles and apron for the entire lab!
Part-A:
1) ALMOST fill the first two wells of each row in the well plate according to the diagram below:
2) Simultaneously place one piece of zinc into each well in column-1. Observe the wells with the
magnifying glass. You may remove the zinc from the well and place it on a piece of paper towel
using the forceps but rinse and dry the forceps each time using the 50 mL beaker of distilled water
and one piece of paper towel. (Note the speed of any changes as well as the changes themselves.)
Observations: __________________________________________________________________
______________________________________________________________________________
______________________________________________________________________________
______________________________________________________________________________
______________________________________________________________________________
3) Simultaneously place one piece of copper into each well in column-2. Observe the wells with the
magnifying glass. You may remove the copper from the well and place it on a piece of paper
towel using the forceps but rinse and dry the forceps each time using the 50 mL beaker of distilled
water and one piece of paper towel. (Note the speed of any changes as well as the changes
themselves.)
Observations: __________________________________________________________________
______________________________________________________________________________
______________________________________________________________________________
______________________________________________________________________________
______________________________________________________________________________
Row-1 1.0 M H2SO4
Row-2 0.10 M CuSO4
Row-3 Distilled water
Column-1
Column-2
Column-3
Column-4
Zn
Zn
Zn
Cu
Cu
Cu

-46-
Part-B:
4) Fill the wells of Column-4 in the well plate according to the diagram below: NOTE: NOT ALL
OF THE WELLS ARE SET UP THE SAME! ROW-3 IS DIFFERENT!
5) Mass the watch glass. ____________________ g
6) Mass the watch glass with the piece of copper on it. ____________________ g
Determine the mass of the copper. ____________________ g
7) Carefully fold the piece of copper in half while wrapping it around one of the pieces of zinc. Be
sure to press the copper very tightly around the piece of zinc.
8) Simultaneously place the metal pieces into each well of Column-4 as shown above.
9) Observe the wells with the magnifying glass. You may remove the metals from their wells and
place them on a piece of paper towel using the forceps but rinse and dry the forceps each time
using the 50 mL beaker of distilled water and one piece of paper towel. (Note the speed of any
changes as well as the changes themselves. In which do the bubbles appear the fastest?
Slowest?)
Observations: __________________________________________________________________
______________________________________________________________________________
______________________________________________________________________________
______________________________________________________________________________
______________________________________________________________________________
______________________________________________________________________________
______________________________________________________________________________
______________________________________________________________________________
10) Remove the piece of copper wrapped zinc from the well of Row-2, Column-4. Carefully remove
the copper. Rinse the piece of copper in distilled water. Completely dry the piece of copper and
then mass it on the watch glass. _____________________ g Determine the mass of the copper.
_____________________ g Within reason, did the mass of the copper change? __________
11) Write the reaction that takes place between the zinc and the sulfuric acid.
______________________________________________________________________________
12) Write the reaction that takes place between the zinc and the copper (II) sulfate.
______________________________________________________________________________
Row-1 ½ full of 1.0 M H2SO4
& ½ full of distilled water
Row-2 ½ full of 1.0 M H2SO4
& ½ full of distilled water
Row-3 ½ full of 1.0 M H2SO4
& ½ full of 0.10 CuSO4 & ½ full of distilled water
Column-1
Column-2
Column-3
Column-4
Zn
Zn
Zn Cu
Tightly fold
the copper
piece around
the zinc piece.

-47-
Lab-16: Chemical Kinetics
Introduction:
A chemical reaction occurs when reacting particles (the reactants) rearrange themselves to form new
particles (the products). Bonds between initial atom groupings must be broken, the atoms must be
rearranged, and new bonds between new atom groupings must be formed.
In order for a chemical reaction to occur, the reacting particles (the reactants) must collide with
sufficient energy and in a proper orientation (angle) in space. This is known as the Collision Theory.
The rate of a chemical reaction is affected by (1) the frequency and (2) the effectiveness of these particle
collisions.
The frequency of particle collisions can be affected by (1) the speed of the reacting particles (which is
related to temperature) and (2) the concentration of the reacting particles.
Questions for Thought:
1) What affects the speed of a group of particles in an aqueous solution?
_______________________________________________________________________________
_______________________________________________________________________________
2) What affects the concentration of a group of particles in an aqueous solution?
_______________________________________________________________________________
_______________________________________________________________________________
3) State the relationship between the speed of the reacting particles and the frequency of particle
collisions.
_______________________________________________________________________________
_______________________________________________________________________________
4) State the relationship between the concentration of the reacting particles and the frequency of
particle collisions.
_______________________________________________________________________________
_______________________________________________________________________________
Effective particle collisions are ones that result in change. NOT ALL COLLISIONS ARE EFFICTIVE!
Effective particle collisions can be affected by (1) the energy of the collision between reacting particles
and (2) the ability to get a proper orientation (angle) of the collision between reacting particles.
Questions for Thought:
5) What affects the energy of a collision between reacting particles?
_______________________________________________________________________________
_______________________________________________________________________________
6) What affects the ability to get a proper orientation (angle) of a collision between reacting particles?
_______________________________________________________________________________
_______________________________________________________________________________
7) State the relationship between the energy of a collision between reacting particles and the
effectiveness of the collision.
_______________________________________________________________________________
_______________________________________________________________________________
8) State the relationship between the ability to get a proper orientation of a collision between reacting
particles and the effectiveness of the collision.
_______________________________________________________________________________
_______________________________________________________________________________

-48-
Other factors such as the nature of the reactants and the reaction mechanism can also effects the rate
of a reaction. Reactions in which few (or no) bonds need to be broken between the atoms of the
reactants before rearrangement can occur are usually faster than reactions in which many bonds
need to be broken before rearrangement can occur. But reactions in which many bonds (usually
covalent) need to be broken between the atoms of the reactants before rearrangement can occur are
usually slower. Also, reactions with many steps in their reaction mechanism tend to be slower than
reactions with few steps. In a reaction, the slowest step in the mechanism is called the rate-
determining step. Simple reactions between aqueous ions are usually fast because the reactants are
already separated into free moving ions. Complex reactions between aqueous ions can be slower if
there are more complicated rearrangements between the atoms and if there are numerous steps in the
reaction mechanism. A reaction such as photosynthesis: 6 CO2 + 6 H2O → C6H12O6 + 6 CO2 is very
slow because of the complex rearrangement of the atoms. A Catalyst can increase the rate of a reaction
by lowering the activation energy.
Determining the Rate Law of a “Sulfur Clock” Reaction:
Purpose: To determine the rate law for the reaction between hydrochloric acid, HCl, and sodium
thiosulfate, Na2S2O3.
2 HCl(aq) + Na2S2O3(aq) → S(s) + SO2(aq) + H2O(ℓ) + 2 NaCl(aq)
The rate law with be written in the form of
Rate = k[HCl]m[Na2S2O3]n
In Part-A, the HCl concentration will be held constant while the Na2S2O3 concentration is varied. In
Part-B, the HCl concentration will be varied while the Na2S2O3 concentration is held constant.
Reaction times will be measured by monitoring the appearance of sulfur.
As solid sulfur is produced in the reaction, the reaction mixture will become clouded with yellow
precipitate. The reaction time will be measured by noting the time at which it is no longer possible to
see through the mixture.
The time recorded is the time it takes for a certain concentration of sulfur [S] to appear which obscures
the on the paper below the Erlenmeyer flask. Thus the average rate of the reaction is equal to
Rate = [S]
Reaction Time
It is important that you are consistently observing the moment in time it takes to just
obscure the from view.
Paper with the on it visible.
50 mL
Erlenmeyer
flask
Paper with on it just completely obscured.
50 mL
Erlenmeyer
flask
Reaction Time

-49-
Procedure: GOGGLES AND APRONS ARE TO BE WORN AT ALL TIMES!
1) Obtain 50 mL of 1.00 M HCl in the 150 mL beaker. (CAUTION: HCl IS CORROSIVE TO EYES.
WEAR YOUR GOGGLES AT ALL TIMES.)
2) Obtain 50 mL of 0.30 M Na2S2O3 in the 100 mL beaker.
3) Obtain 25 mL of distilled water in the 50 mL beaker.
Part A:
4) Set up your lab station as shown by the diagram below:
5) Student-1: Put 4 mL of the 1.0 M HCl solution into the red based graduated cylinder and wait for
student-2 to complete step 6.
6) Student-2: Put 3 mL of the 0.30 M Na2S2O3 solution into the yellow based graduated cylinder.
Then CAREFULLY add 3 mL of distilled water into the same yellow based graduated cylinder until
the total volume is 6 mL. Pour this diluted Na2S2O3 solution into the 50 mL Erlenmeyer flask and
swirl to thoroughly mix the distilled water and the Na2S2O3 solution. Put the 50 mL Erlenmeyer
flask onto the paper over the .
Student-2 you are going to time the reaction with the stop watch. Start the time when student-1
adds the HCl solution to the 50 mL Erlenmeyer flask. Stop the time the moment that you can no
longer see the when looking straight down into the Erlenmeyer flask. Record the time, in
seconds, in the Experiment-1/Trial-1 section of the data table below.
7) Student-1: Quickly but CAREFULLY add the 4 mL of the HCl solution into the 50 mL Erlenmeyer
flask and swirl once to thoroughly mix the diluted Na2S2O3 solution and the HCl solution. MAKE
SURE THAT THE ERLENMEYER FLASK IS OVER THE ON THE PAPER.
Student-1: When the reaction is over, empty the contents of the Erlenmeyer flask down the sink.
Thoroughly wash and dry the Erlenmeyer flask.
8) Repeat steps 5, 6 and 7 two more times for Experiment-1.
9) Repeat steps 5, 6 and 7 three times for Experiment-2. Notice the different volumes used.
Experiment Student 1 Student 2 Reaction Time in Seconds (to the nearest tenth)
mL HCl mL H2O mL Na2S2O3 Trial 1 Trial 2 Trial 3 Average
1 4.0 3.0 3.0
2 4.0 0.0 6.0
sink 150 mL
beaker
HCl
100 mL
beaker
Na2S2O3
50 mL
beaker
H2O
o
paper with o
red based
graduated
cylinder
yellow
based
graduated
cylinder 50 mL
Erlenmeyer
flask
Student-1 Student-2
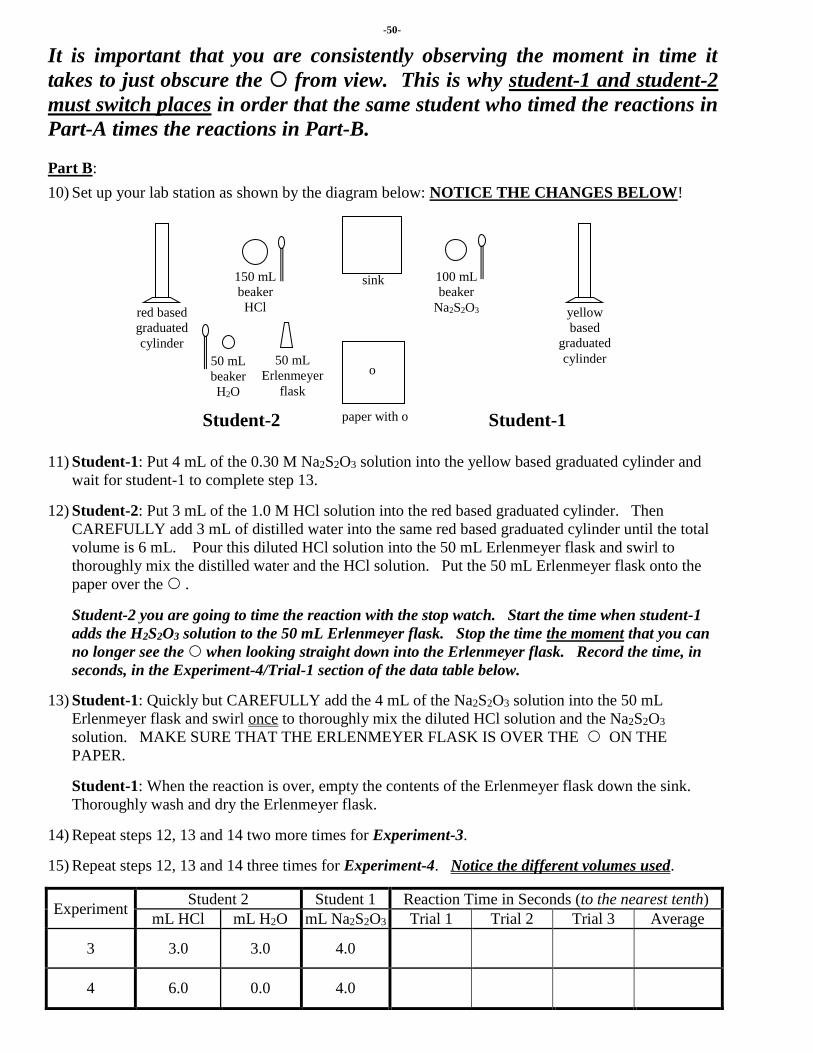
-50-
It is important that you are consistently observing the moment in time it
takes to just obscure the from view. This is why student-1 and student-2
must switch places in order that the same student who timed the reactions in
Part-A times the reactions in Part-B.
Part B:
10) Set up your lab station as shown by the diagram below: NOTICE THE CHANGES BELOW!
11) Student-1: Put 4 mL of the 0.30 M Na2S2O3 solution into the yellow based graduated cylinder and
wait for student-1 to complete step 13.
12) Student-2: Put 3 mL of the 1.0 M HCl solution into the red based graduated cylinder. Then
CAREFULLY add 3 mL of distilled water into the same red based graduated cylinder until the total
volume is 6 mL. Pour this diluted HCl solution into the 50 mL Erlenmeyer flask and swirl to
thoroughly mix the distilled water and the HCl solution. Put the 50 mL Erlenmeyer flask onto the
paper over the .
Student-2 you are going to time the reaction with the stop watch. Start the time when student-1
adds the H2S2O3 solution to the 50 mL Erlenmeyer flask. Stop the time the moment that you can
no longer see the when looking straight down into the Erlenmeyer flask. Record the time, in
seconds, in the Experiment-4/Trial-1 section of the data table below.
13) Student-1: Quickly but CAREFULLY add the 4 mL of the Na2S2O3 solution into the 50 mL
Erlenmeyer flask and swirl once to thoroughly mix the diluted HCl solution and the Na2S2O3
solution. MAKE SURE THAT THE ERLENMEYER FLASK IS OVER THE ON THE
PAPER.
Student-1: When the reaction is over, empty the contents of the Erlenmeyer flask down the sink.
Thoroughly wash and dry the Erlenmeyer flask.
14) Repeat steps 12, 13 and 14 two more times for Experiment-3.
15) Repeat steps 12, 13 and 14 three times for Experiment-4. Notice the different volumes used.
Experiment Student 2 Student 1 Reaction Time in Seconds (to the nearest tenth)
mL HCl mL H2O mL Na2S2O3 Trial 1 Trial 2 Trial 3 Average
3 3.0 3.0 4.0
4 6.0 0.0 4.0
sink 150 mL
beaker
HCl
100 mL
beaker
Na2S2O3
50 mL
beaker
H2O
o
paper with o
red based
graduated
cylinder
yellow
based
graduated
cylinder 50 mL
Erlenmeyer
flask
Student-2 Student-1

-51-
Data Analysis:
In order to complete the data table on the next page, you must determine the initial concentrations of the
two reactants at the moment of mixing by using the dilution equation, McVc = MdVd, and solve for Md.
Recall that the HCl solution was initially 1.0 M and that the Na2S2O3 solution was initially 0.30 M and
that the final volume for both solutions was 10.0 mL. SHOW WORK BELOW.
Experiment-1: HCl Na2S2O3
Experiment-2: HCl Na2S2O3
Experiment-3: HCl Na2S2O3
Experiment-4: HCl Na2S2O3
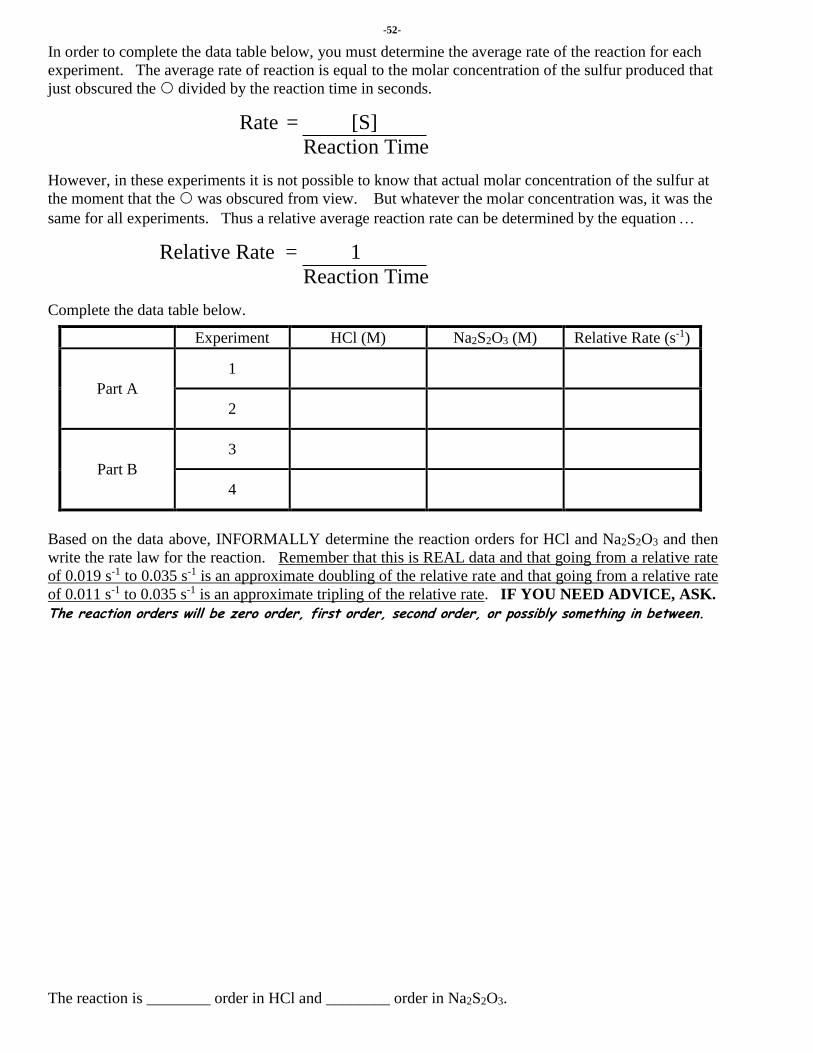
-52-
In order to complete the data table below, you must determine the average rate of the reaction for each
experiment. The average rate of reaction is equal to the molar concentration of the sulfur produced that
just obscured the divided by the reaction time in seconds.
Rate = [S]
Reaction Time
However, in these experiments it is not possible to know that actual molar concentration of the sulfur at
the moment that the was obscured from view. But whatever the molar concentration was, it was the
same for all experiments. Thus a relative average reaction rate can be determined by the equation
Relative Rate = 1
Reaction Time
Complete the data table below.
Experiment HCl (M) Na2S2O3 (M) Relative Rate (s-1)
Part A
1
2
Part B
3
4
Based on the data above, INFORMALLY determine the reaction orders for HCl and Na2S2O3 and then
write the rate law for the reaction. Remember that this is REAL data and that going from a relative rate
of 0.019 s-1 to 0.035 s-1 is an approximate doubling of the relative rate and that going from a relative rate
of 0.011 s-1 to 0.035 s-1 is an approximate tripling of the relative rate. IF YOU NEED ADVICE, ASK.
The reaction orders will be zero order, first order, second order, or possibly something in between.
The reaction is ________ order in HCl and ________ order in Na2S2O3.
-53-
Lab-17: Le Chatelier’s Principle
Introduction:
Many chemical reactions are reversible - reactants produce products and then the products produce the
reactants back again. In a closed system, a state of equilibrium is eventually reached - reactants
produce products as fast as the products produce the reactants back again. Once equilibrium is reached,
the concentrations of the reactants and products remain constant. Consider the system at equilibrium:
2 A2(g) + B2(g) 2 A2B(g) + Heat
As fast as two A2 particles react with one B2 particle to make two A2B particles, somewhere else in the
system two A2B particles are reacting with each other to produces two A2 particles and one B2 particle
back again. The rate of the forward reaction is equal to the rate of the reverse reaction! As long as this
situation continues, the concentrations of A2, B2, and A2B in the system will not change!
To make a change in the concentrations of A2, B2, and A2B in the system, it is necessary to disturb the
system. The disturbance will cause a temporary imbalance between the rates of the forward and reverse
reactions. When something happens that disturbs a system at equilibrium, chemists say that the system
has been subjected to a "stress"! There are three types of stresses that can disturb a system at
equilibrium:
1) A change in concentration: If the concentration of one or more of the substances taking part in the
reaction changes, the equilibrium will be disturbed. Consider the system at equilibrium:
2 A2(g) + B2(g) 2 A2B(g) + Heat
If some more A2 is added to the system then the forward reaction can suddenly proceed faster that
the reverse reaction (greater chance of collisions between A2 and B2). More A2B will be produced
faster than A2 and B2. This situation will last only so long because the amount of A2 and B2 will
become scarce slowing down the forward reaction. Simultaneously, the amount of A2B will
become more abundant speeding up the reverse reaction. At some point in time the two reactions
will again proceed at the same rate and a new equilibrium will be established! However, at this
new equilibrium there will be more A2B than before and less A2 and B2.
2) A change in temperature: If the temperature of the equilibrium system changed the equilibrium is
disturbed. Consider the system at equilibrium:
2 A2(g) + B2(g) 2 A2B(g) + Heat
If the temperature of the system is increased, then the reverse reaction can suddenly proceed faster
that the forward reaction. The reverse reaction is endothermic and the presence of more heat will
increase the rate of an endothermic reaction more than it will increase the rate of an exothermic
reaction. More A2 and B2 will be produced faster than A2B. This situation will last only so long
because the amount of A2B will become scarce slowing down the reverse reaction.
Simultaneously, the amount of A2 and B2 will become more abundant speeding up the forward
reaction. At some point in time the two reactions will again proceed at the same rate and a new
equilibrium will be established! However, at this new equilibrium there will be more A2 and B2
than before and less A2B.
3) A change in volume: If the volume of the equilibrium system changed the equilibrium is disturbed.
Consider the system at equilibrium:
2 A2(g) + B2(g) 2 A2B(g) + Heat
If the volume on the system is decreased then the forward reaction can suddenly proceed faster that
the reverse reaction because the system’s decreased volume will create a greater likelihood of
collisions between two A2 particles and a B2 particle than between two A2B particles! This
situation will last only so long because the amount of A2 and B2 will become scarce slowing down
the forward reaction. Simultaneously, the amount of A2B will become more abundant speeding up
the reverse reaction. At some point in time the two reactions will again proceed at the same rate
and a new equilibrium will be established! However, at this new equilibrium there will be more
A2B than before and less A2 and B2.

-54-
In the very late 19th century, Henri Louis Le Chatelier developed his principle by studying equilibrium
systems. He came up with the following rule: When a system at equilibrium is stressed, then the
system will respond in such a way as to relieve (reduce) the stress.
If the concentration of a substance is increased, then the equilibrium will "shift" in the direction that
will decrease it and vice versa. An increase in a substance favors the reaction that uses it up!
If a system’s temperature is increased (because more heat is added to the system), then the
equilibrium will "shift" in the direction of the endothermic reaction (because some of the added heat
will be absorbed) and vice versa. An increase in temperature favors the endothermic reaction!
If a gaseous system’s volume is decreased (pressure is increased), then the equilibrium will "shift" in
the direction that will produce fewer moles of gas (because fewer moles of gas lowers pressure) and
vice versa. A decrease in volume favors the reaction that produces fewer moles of gas!
Purpose:
In this laboratory activity, you will study an aqueous Co2+ equilibrium system and how it responds when
subjected to various stresses. Co2+(aq) = [Co(H2O)6]2+
(aq)
Procedure: GOGGLES AND APRONS ARE TO BE WORN AT ALL TIMES!
1) Put 50 mL of water in a 50 mL Erlenmeyer flask and place on a hot plate. Heat water so that it is
hot but not boiling. This is now the “Hot Water Bath”.
2) Put 50 mL of water in a 100 mL beaker and add ice. This is now the “Cold Water Bath”.
3) Set up a test tube rack with eight test tubes as shown below.
4) Obtain 10 mL of the 1 M CoCl2 solution in a 50 mL Erlenmeyer flask. The color is ___________.
5) Quarter-fill test tube-1 with the 1 M cobalt (II) chloride solution. This is control solution-1.
6) Obtain 20 mL of 12 M HCl in a 50 mL Erlenmeyer flask.
7) Add just enough 12 M HCl drop-by-drop to the 1 M cobalt (II) chloride solution in the 50-mL
Erlenmeyer flask to turn it to dark blue.
8) Quarter-fill test tube-8 with the dark blue solution. This is control solution-2.
9) Obtain 25 mL of distilled water in a 50 mL beaker. Add just enough water, drop-by-drop, into the
50 mL Erlenmeyer flask of the dark blue solution to turn it to violet.
10) Quarter-fill test tube-2 with the violet solution. This is control solution-3.
11) Quarter-fill test tube-3, test tube-4, test tube-5, test tube-6, and test tube-7, with the violet solution.
The equation below represents the equilibrium system of the violet solution with the point of
equilibrium in the middle (neither shifted far to the left nor shifted far to the right).
[Co(H2O)6]2+
(aq) + 4 Cl1-(aq) + HEAT [Co(Cl)4]
2-(aq) + 6 H2O(ℓ)
Pink Blue
Now that you have five test tubes (#3 - #7) with the equilibrium somewhere in the middle, devise 4 tests
to stress the system. You may ask for a solution that has not been mentioned! Write a procedure and
include what color changes you expect to see. Have your procedure approved. Record your results.
12) ________________________________________________________________________________
___________________________________________________________________________________
13) ________________________________________________________________________________
___________________________________________________________________________________
14) ________________________________________________________________________________
___________________________________________________________________________________
15) ________________________________________________________________________________
___________________________________________________________________________________
1 2 3 4 5 6 7 8
-55-
Lab-18: Hydrolysis of Salts
Introduction:
A salt is an ionic compound that is produced by an acid and a base. The hydrolysis of a salt is a
chemical reaction in which a salt’s cation or anion reacts chemically with water to produce an acidic or
basic solution.
A salt can be classified as acidic, basic, or neutral depending on how it affects the pH of the water.
A salt that lowers the pH of water is classified as acidic.
A salt that raises the pH of water is classified as basic.
A salt that does not change the pH of water is classified as neutral.
A salt can also be classified as acidic, basic, or neutral depending on its "parents".
A salt that is produced from a strong acid and a weak base is classified as acidic.
A salt that is produced from a weak acid and a strong base is classified as basic.
A salt that is produced from a strong acid and a strong base is classified as neutral.
A salt that is produced from a weak acid and a weak base is classified based on the Ka and Kb values
of the weak acid and weak base. If the Ka > Kb, then the salt is acidic. If the Ka < Kb, then the salt
is basic. If the Ka = Kb, then the salt is neutral.
Some salts hydrolyze when dissolved in water and some salts do not hydrolyze when dissolved in water.
Neutral salts of strong acids and strong bases DO NOT hydrolyze (a chemical reaction) when
dissolved in water. They simply dissolve (a physical reaction) in the water.
Acidic salts, basic salts, and neutral salts of weak acids and weak bases DO hydrolyze (a chemical
reaction) when dissolved in water.
Neutralization: Acid + Base → Salt + Water
Hydrolysis: Salt + Water Acid + Base
Questions for Thought:
1) What is the Ka of HC2H3O2? ______________________________
2) What is the Kb of NH3 (NH4OH)? ______________________________
3) Based on each salt’s parent acid and base, determine whether the salt is acidic, basic, or neutral.
Salt Parent Acid Parent Base Type of Salt
SnCl2
FeSO4
Sr(NO3)2
Na2SO3
Li2CO3
NH4C2H3O2
KBr
Purpose: To determine the pH of various salt-water solutions in order to classify the salts as acidic,
basic, or neutral.
You’re determining
the type of salt
based on theory.

-56-
Procedure: GOGGLES AND APRONS ARE TO BE WORN AT ALL TIMES!
1) Put on your goggles and aprons.
2) Using a piece of the universal pH paper (≈ ½ inch in length), test the distilled water. Wait 30
seconds. Using the forceps, remove the piece of the universal pH paper and lay it on the paper
towel. Using the pH color card, best match the color of the piece of the universal pH paper to the
pH color card to determine the pH of the distilled water and record your observation in your data
table. If the color of the piece of the universal pH paper is between two of the colors on the
pH color card record the pH in between (ex: 6.5 or 7.5)! You are doing this to obtain a baseline
reading for the water that was used to make the solutions.
Now write a procedure to collect data on how various salts (shown in the table on the front) affect the
pH of water. Be sure to have your procedure approved BEFORE you being work. Create a data
table in the space below. Record all pH values to the nearest 0.5.
____________________________________________________________________________________
____________________________________________________________________________________
____________________________________________________________________________________
____________________________________________________________________________________
____________________________________________________________________________________
____________________________________________________________________________________
____________________________________________________________________________________
____________________________________________________________________________________
____________________________________________________________________________________
____________________________________________________________________________________
____________________________________________________________________________________
____________________________________________________________________________________
____________________________________________________________________________________
____________________________________________________________________________________
____________________________________________________________________________________
____________________________________________________________________________________
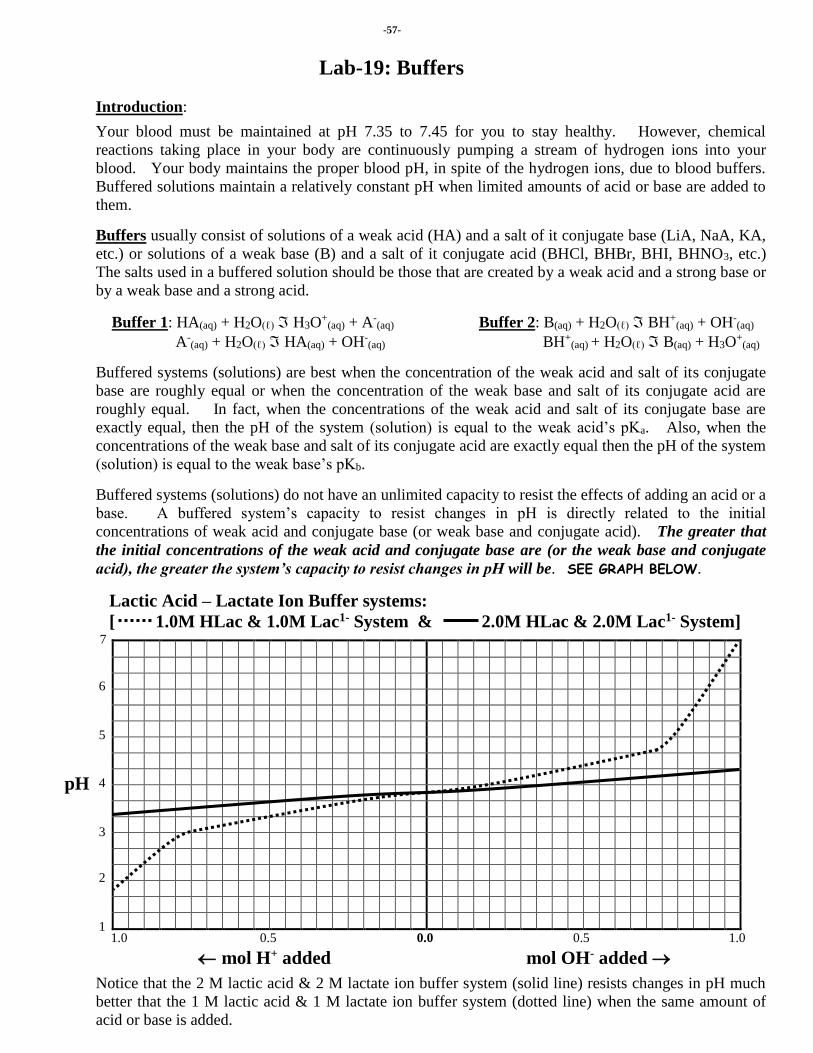
-57-
Lab-19: Buffers
Introduction:
Your blood must be maintained at pH 7.35 to 7.45 for you to stay healthy. However, chemical
reactions taking place in your body are continuously pumping a stream of hydrogen ions into your
blood. Your body maintains the proper blood pH, in spite of the hydrogen ions, due to blood buffers.
Buffered solutions maintain a relatively constant pH when limited amounts of acid or base are added to
them.
Buffers usually consist of solutions of a weak acid (HA) and a salt of it conjugate base (LiA, NaA, KA,
etc.) or solutions of a weak base (B) and a salt of it conjugate acid (BHCl, BHBr, BHI, BHNO3, etc.)
The salts used in a buffered solution should be those that are created by a weak acid and a strong base or
by a weak base and a strong acid.
Buffer 1: HA(aq) + H2O(ℓ) H3O+
(aq) + A-(aq) Buffer 2: B(aq) + H2O(ℓ) BH+
(aq) + OH-(aq)
A-(aq) + H2O(ℓ) HA(aq) + OH-
(aq) BH+(aq) + H2O(ℓ) B(aq) + H3O
+(aq)
Buffered systems (solutions) are best when the concentration of the weak acid and salt of its conjugate
base are roughly equal or when the concentration of the weak base and salt of its conjugate acid are
roughly equal. In fact, when the concentrations of the weak acid and salt of its conjugate base are
exactly equal, then the pH of the system (solution) is equal to the weak acid’s pKa. Also, when the
concentrations of the weak base and salt of its conjugate acid are exactly equal then the pH of the system
(solution) is equal to the weak base’s pKb.
Buffered systems (solutions) do not have an unlimited capacity to resist the effects of adding an acid or a
base. A buffered system’s capacity to resist changes in pH is directly related to the initial
concentrations of weak acid and conjugate base (or weak base and conjugate acid). The greater that
the initial concentrations of the weak acid and conjugate base are (or the weak base and conjugate
acid), the greater the system’s capacity to resist changes in pH will be. SEE GRAPH BELOW.
Lactic Acid – Lactate Ion Buffer systems:
[ 1.0M HLac & 1.0M Lac1- System & 2.0M HLac & 2.0M Lac1- System]
Notice that the 2 M lactic acid & 2 M lactate ion buffer system (solid line) resists changes in pH much
better that the 1 M lactic acid & 1 M lactate ion buffer system (dotted line) when the same amount of
acid or base is added.
1.0 0.5 0.0 0.5 1.0
mol H+ added mol OH- added
7
1
2
3
4
5
6
pH

-58-
The pH of a buffer system can be calculated by using the Henderson-Hasselbach equation.
For buffers that consist of a weak acid and a salt of its conjugate base, the equation is
pH = pKa + log [A1-]/[HA]
For buffers that consist of a weak base and a salt of its conjugate acid, the equation is
pOH = pKb + log [HB1+]/[B]
Technically, the ratios [A1-]/[HA] and [HB1+]/[B] are molarity ratios. However, since they are ratios
and since the volume will be the same for both molarities in the ratio, then only the moles of the weak
acid and the moles of the salt of its conjugate base (or the moles of the weak base and the moles of the
salt of its conjugate acid) need to be in the ratio. It’s a short cut!
Questions for Thought:
1) What is the pH of a buffer system that is composed of 0.0450 M H2CO3 and 0.0550 M Na2CO3?
(Ka for H2CO3 = 4.210-7)
2) What is the pH of a 500 mL buffer system that is composed of 3.00 g NaHCO3 and 3.50 g Na2CO3?
(Ka for HCO31- = 4.810-11)
3) A NH3−NH4Cl buffer solution is to be prepared with a pH of 9.00. What must be the value of the
[HB1+]/[B] ratio? (Kb for NH3 = 1.810-5)
4) What is the pH of the buffer system in question-2 after the addition of 6 mL of 1.00 M NaOH?

-59-
Purpose: To measure the pH changes that occur when acids and bases are added to buffered and
unbuffered distilled water.
Procedure: GOGGLES AND APRONS ARE TO BE WORN AT ALL TIMES!
Part-I:
(1) Put on your goggles and aprons.
(2) Obtain
1-clean well plate,
2-dropper pipettes,
1-dropper bottle with 1.0 M HCl, CAUTION: 1.0 M HCl IS CAUSTIC AND CORROSIVE!
1-50 mL beaker half filled with 1.00 M HC2H3O2
1-50 mL beaker half filled with 1.00 M NaC2H3O2,
1-50 mL beaker half filled with distilled water,
1-roll of pHydrion paper,
1-pair of forceps,
Several sheets of paper towel.
(3) Make 12 1-inch pieces of pHydrion paper.
(4) Set up the well plate as shown below. BE CAREFUL WHEN ADDING THE DROPS.
IF YOU MAKE A MISTAKE YOU WILL NEED TO REDO THAT STEP LATTER.
(5) Once the well plate is set up, one at a time dip a piece of pHydrion paper into each well. Use
the paper to gently stir the mixture. Leave the pHydrion paper in the well for 10 to 20 seconds.
Remove the pHydrion paper to a piece of paper towel and read the pH to the nearest ½. Record
the pH in the appropriate well above. Repeat until all the pH’s of the wells have been read and
recorded.
(6) Wash and dry the well plate. If you need to repeat any of the experiments, do it now. Wash
and dry the well plate again.
Question for Thought: Using the Henderson-Hasselbalch equation, calculate the theoretical initial pH
for both buffer systems. Remember that each solution dilutes the other.
pH = 4.74 + log[NaC2H3O2]/[HC2H3O2]
6 drops of 1.00 M HC2H3O2 &
6 drops 1.00 M NaC2H3O2
pH with 0
total drops
HCl Added
pH with 3
total drops
HCl Added
pH with 6
total drops
HCl Added
pH with 9
total drops
HCl Added
2 drops of 1.00 M HC2H3O2 &
2 drops 1.00 M NaC2H3O2 and
8 drops of distilled water
12 drops of distilled water

-60-
Part-II:
(1) Put on your goggles and aprons.
(2) Obtain
1-clean well plate,
2-dropper pipettes,
1-dropper bottle with 1.0 M NaOH, CAUTION: 1.0 M NaOH IS CAUSTIC AND CORROSIVE!
1-50 mL beaker half filled with 1.00 M HC2H3O2
1-50 mL beaker half filled with 1.00 M NaC2H3O2
1-50 mL beaker half filled with distilled water,
1-roll of pHydrion paper,
1-pair of forceps,
Several sheets of paper towel.
(3) Make 12 1-inch pieces of pHydrion paper.
(4) Set up the well plate as shown below. BE CAREFUL WHEN ADDING THE DROPS.
IF YOU MAKE A MISTAKE YOU WILL NEED TO REDO THAT STEP LATTER.
(5) Once the well plate is set up, one at a time dip a piece of pHydrion paper into each well. Use
the paper to gently stir the mixture. Leave the pHydrion paper in the well for 10 to 20 seconds.
Remove the pHydrion paper to a piece of paper towel and read the pH to the nearest ½. Record
the pH in the appropriate well above. Repeat until all the pH’s of the wells have been read and
recorded.
(6) Wash and dry the well plate. If you need to repeat any of the experiments, do it now. Wash
and dry the well plate again.
Question for Thought: If both buffers started out at approximately the same pH, then why was one
more effective at resisting changes in pH than the other?
____________________________________________________________________________________
____________________________________________________________________________________
____________________________________________________________________________________
____________________________________________________________________________________
____________________________________________________________________________________
____________________________________________________________________________________
____________________________________________________________________________________
____________________________________________________________________________________
6 drops of 1.00 M HC2H3O2 &
6 drops 1.00 M NaC2H3O2
pH with 0
total drops
NaOH
Added
pH with 3
total drops
NaOH
Added
pH with 6
total drops
NaOH
Added
pH with 9
total drops
NaOH
Added
2 drops of 1.00 M HC2H3O2 &
2 drops 1.00 M NaC2H3O2, and
8 drops of distilled water
12 drops of distilled water
-61-
Lab-20: Ksp of a Slightly Soluble Salt
Introduction:
From everyday life experiences you are familiar with several substances that are very soluble in water.
Table sugar [C12H22O11] and table salt [NaCl] are examples of soluble substances. Many other
substances, such as limestone [CaCO3] and gasoline are quite insoluble in water. Solubility and
insolubility are relative terms, however. Almost all substances have at least a slight solubility in water.
Once a substance achieves it maximum solubility in a sample of water [saturates a sample of water], a
state of dynamic equilibrium is established between the dissolved substance and its undissolved solid.
At equilibrium, the rate of dissolution of ions from the solid equals the rate of precipitation of the ions
from the solution.
Ionic Solid Aqueous Cations + Aqueous Anions
The product of the equilibrium ion concentrations raised to their molar dissolution coefficients is a
temperature specific constant that is called the solubility product constant [Ksp].
The equilibrium expression for AgCl is Ksp = [Ag1+][Cl1-]
The equilibrium expression for Mg(OH)2 is Ksp = [Mg2+][OH1-]2
The equilibrium expression for Ca3(PO4)2 is Ksp = [Ca2+]3[PO43-]2
The greater the value of an ionic solid’s solubility product constant [Ksp], the more soluble the ionic
solid is in pure water. See the generalizations below:
An ionic solid with a Ksp value greater than 1 is considered to be soluble in pure water.
An ionic solid with a Ksp value greater than or equal to 1 10-4 but less than 1 is generally
considered to be slightly soluble in pure water.
An ionic solid with a Ksp value less than 1 10-4 is generally considered to be insoluble in
pure water.
In this experiment, you will gravimetrically determine the Ksp of the slightly soluble salt – Li2CO3.
A gravimetric determination is one that uses weight measurements.
Questions for thought:
1) What is the equilibrium dissolution-precipitation reaction for the saturated Li2CO3 system?
________________________________________________________
2) What is the equilibrium expression for the saturated Li2CO3 system above? Remember that only
saturated solutions are at equilibrium.
Ksp = ___________________________________
For this experiment you will be making several assumptions:
(1) In a saturated solution of a slightly soluble salt, the volume
of the solution is the same as the volume of the water itself.
(2) 1.0 gram of water is equal to 1.0 mL of water.
You will determine the saturated solution’s molarity by determining the mass of the solution and then by
determining the mass of the solid alone after all the water has been allowed to evaporate as well as the
mass of the water that evaporated. Once you know the mass of the salt, you can determine the moles of
salt present in the original solution. Once you know the mass of the water, you can determine the
volume in liters of the original solution.
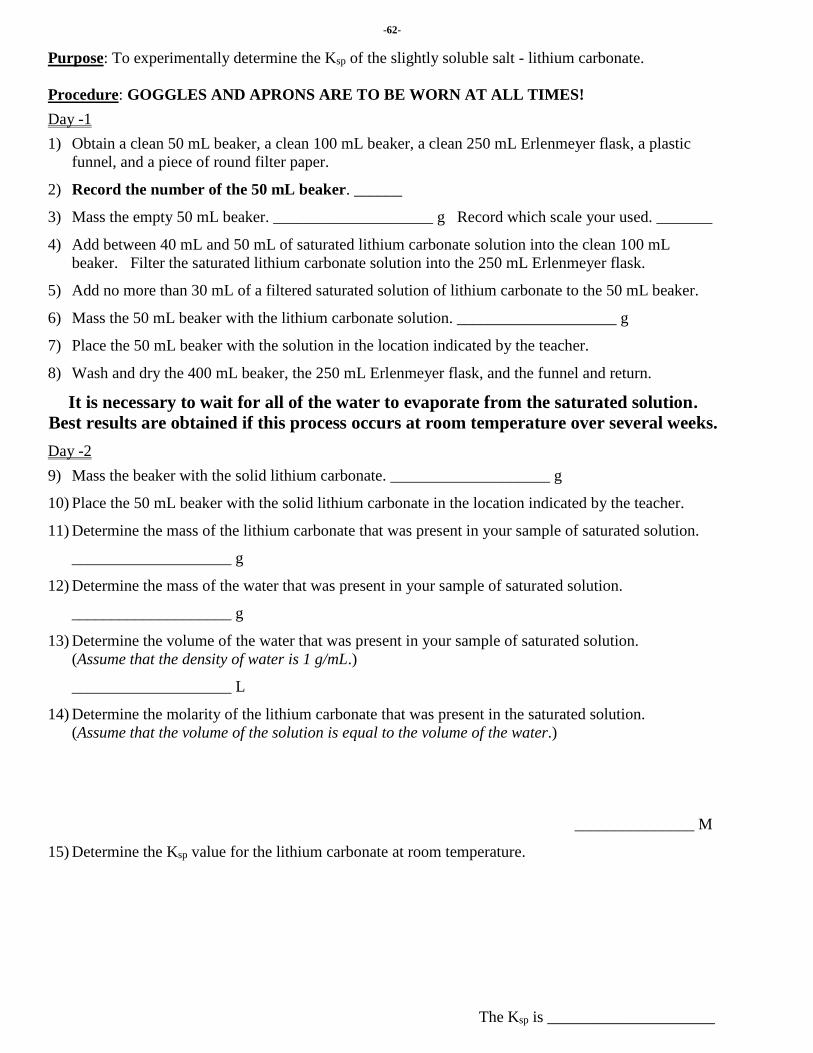
-62-
Purpose: To experimentally determine the Ksp of the slightly soluble salt - lithium carbonate.
Procedure: GOGGLES AND APRONS ARE TO BE WORN AT ALL TIMES!
Day -1
1) Obtain a clean 50 mL beaker, a clean 100 mL beaker, a clean 250 mL Erlenmeyer flask, a plastic
funnel, and a piece of round filter paper.
2) Record the number of the 50 mL beaker. ______
3) Mass the empty 50 mL beaker. ____________________ g Record which scale your used. _______
4) Add between 40 mL and 50 mL of saturated lithium carbonate solution into the clean 100 mL
beaker. Filter the saturated lithium carbonate solution into the 250 mL Erlenmeyer flask.
5) Add no more than 30 mL of a filtered saturated solution of lithium carbonate to the 50 mL beaker.
6) Mass the 50 mL beaker with the lithium carbonate solution. ____________________ g
7) Place the 50 mL beaker with the solution in the location indicated by the teacher.
8) Wash and dry the 400 mL beaker, the 250 mL Erlenmeyer flask, and the funnel and return.
It is necessary to wait for all of the water to evaporate from the saturated solution.
Best results are obtained if this process occurs at room temperature over several weeks.
Day -2
9) Mass the beaker with the solid lithium carbonate. ____________________ g
10) Place the 50 mL beaker with the solid lithium carbonate in the location indicated by the teacher.
11) Determine the mass of the lithium carbonate that was present in your sample of saturated solution.
____________________ g
12) Determine the mass of the water that was present in your sample of saturated solution.
____________________ g
13) Determine the volume of the water that was present in your sample of saturated solution.
(Assume that the density of water is 1 g/mL.)
____________________ L
14) Determine the molarity of the lithium carbonate that was present in the saturated solution.
(Assume that the volume of the solution is equal to the volume of the water.)
_______________ M
15) Determine the Ksp value for the lithium carbonate at room temperature.
The Ksp is _____________________

-63-
Lab-21: Acid-Base Titration
Introduction: Titration is a laboratory technique that is used to determine the concentration of a
solution by reacting it with a standard solution. A standard solution is a solution of
known concentration. An indicator is usually used to signal the end of the reaction
which is called the end point – the point in the titration when the indicator begins to
change color. When an appropriate indicator is used the end point will correctly signal
the equivalence point – the point in the titration when the moles of H+ are equal to the
moles of OH-.
It is important to choose an appropriate indicator when conducting an acid-base titration.
The chart below shows six common acid-base indicators and the type of reactions for
which they are appropriate.
Type of
Reaction
pH at Equivalence
Point
Appropriate Acid-Base Indicator
Color Change And pH Range of
Color Change
strong acid -
weak base Below 7
methyl orange red to orange (3.2-4.4)
bromcresol green yellow to blue (3.8-5.4)
strong acid -
strong base Equal to 7
bromthymol blue yellow to blue (6.0-7.6)
Litmus red to blue (5.5-8.2)
weak acid -
strong base Above 7
phenolphthalein colorless to pink (8.2-10)
thymol blue yellow to blue (8.0-9.6)
A Buret is a piece of equipment that is used for titration. It is a long graduated cylinder
with a valve at the bottom. Unlike a normal graduated cylinder, which is used to
measure the volume of liquid put in, a buret is used to measure the volume of liquid
removed. Also, a buret is incremented from the top to the bottom (see diagram).
Questions for Thought:
1) What is the volume of the solution in the buret before any liquid was removed?
________mL
2) What is the volume of the solution in the buret after some liquid was removed?
________mL
3) What is the volume of the solution in the buret that was removed? ________mL
The following equation can be used for acid-base titration data: AMAVA = BMBVB where A is the
number of H+ per unit acid, MA is the molarity of acid , VA is the volume (in liters) of the acid, B is the
number of OH- per unit base, MB is the molarity of base, and VB is the volume (in liters) of the base.
The data collected from a weak acid-strong base titration can be used to determine the Ka value of the
weak acid. The pH of the acid-base mixture halfway to neutralization is equal to the weak acid’s pKa.
Purpose:
I) To determine the molar concentration of an acetic acid [HC2H3O2] solution by titrating it with a
base [NaOH] of known concentration (0.150 M).
II) To plot the curve for the titration of acetic acid and sodium hydroxide and the use the curve to
estimate the Ka value of acetic acid.
0
2
1
Buret before
liquid was
removed
0
2
1
Buret after
liquid was
removed
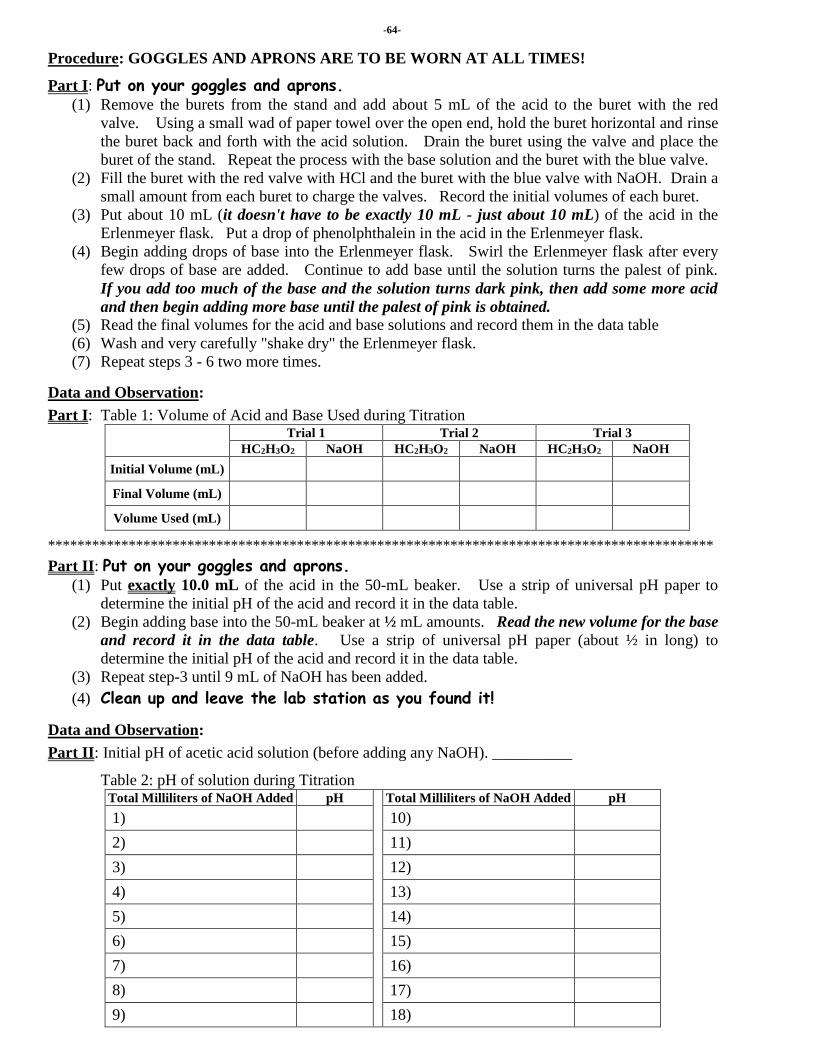
-64-
Procedure: GOGGLES AND APRONS ARE TO BE WORN AT ALL TIMES!
Part I: Put on your goggles and aprons.
(1) Remove the burets from the stand and add about 5 mL of the acid to the buret with the red
valve. Using a small wad of paper towel over the open end, hold the buret horizontal and rinse
the buret back and forth with the acid solution. Drain the buret using the valve and place the
buret of the stand. Repeat the process with the base solution and the buret with the blue valve.
(2) Fill the buret with the red valve with HCl and the buret with the blue valve with NaOH. Drain a
small amount from each buret to charge the valves. Record the initial volumes of each buret.
(3) Put about 10 mL (it doesn't have to be exactly 10 mL - just about 10 mL) of the acid in the
Erlenmeyer flask. Put a drop of phenolphthalein in the acid in the Erlenmeyer flask.
(4) Begin adding drops of base into the Erlenmeyer flask. Swirl the Erlenmeyer flask after every
few drops of base are added. Continue to add base until the solution turns the palest of pink.
If you add too much of the base and the solution turns dark pink, then add some more acid
and then begin adding more base until the palest of pink is obtained. (5) Read the final volumes for the acid and base solutions and record them in the data table
(6) Wash and very carefully "shake dry" the Erlenmeyer flask.
(7) Repeat steps 3 - 6 two more times.
Data and Observation:
Part I: Table 1: Volume of Acid and Base Used during Titration
Trial 1 Trial 2 Trial 3
HC2H3O2 NaOH HC2H3O2 NaOH HC2H3O2 NaOH
Initial Volume (mL)
Final Volume (mL)
Volume Used (mL)
*******************************************************************************************
Part II: Put on your goggles and aprons.
(1) Put exactly 10.0 mL of the acid in the 50-mL beaker. Use a strip of universal pH paper to
determine the initial pH of the acid and record it in the data table.
(2) Begin adding base into the 50-mL beaker at ½ mL amounts. Read the new volume for the base
and record it in the data table. Use a strip of universal pH paper (about ½ in long) to
determine the initial pH of the acid and record it in the data table.
(3) Repeat step-3 until 9 mL of NaOH has been added.
(4) Clean up and leave the lab station as you found it!
Data and Observation:
Part II: Initial pH of acetic acid solution (before adding any NaOH). __________
Table 2: pH of solution during Titration Total Milliliters of NaOH Added pH
Total Milliliters of NaOH Added pH
1) 10)
2) 11)
3) 12)
4) 13)
5) 14)
6) 15)
7) 16)
8) 17)
9) 18)

-65-
Lab-22: Redox Titration
Introduction:
Redox reactions typically go to completion.
A redox titration is a procedure that can be used to determine the concentration of a reactant.
The goal is to the find the moles of titrant needed to bring the reaction to completion. Then, using
stoichiometry, the goal is to find the moles of the unknown.
Often, no outside indicator is needed for a redox titration because one of the reactants will serve as
the indicator. If an extra drop of titrant is added at the titration’s endpoint [when the reactants are at
their stoichiometric ratio], then a color change would be observed because the extra added titrant has
nothing with which to react.
In this experiment, a purple/pink permanganate solution will be added to a colorless oxalate solution.
At first all of the added pink permanganate is completely reacted by the colorless oxalate to produce
all colorless products. Eventually, all the oxalate is reacted and the pink color remains. This
indicates that the titration has gone too far. Thus back titration is required until a pale yellow is
achieved – END POINT!
This reaction is slow at room temperature. You will need to create a hot water bath in which to heat
the oxalate solution before you begin to titrate it with the potassium permanganate solution. Do this
by half-filling a 250-mL Erlenmeyer flask with water and place it on the hot plate. Heat the water
so that it is hot but not boiling (≈ 90oC). The oxalate solution must be kept warm throughout the
titration. Thus, you may need to reheat the test tube part way through the titration.
This reaction has one oddity! One of the products, aqueous manganese (II) ions, is a catalyst for
the reaction. At the start, there is no aqueous manganese (II) ions present and the disappearance of
the pink color is slow. But after each addition of permanganate ions, the disappearance of the pink
color accelerates due to the presence of more and more aqueous manganese (II) ions.
Questions for Thought:
1) What is the formula for potassium permanganate? __________________________
2) What is the oxidation number for the manganese in the permanganate ion? ______
3) What is the formula for sodium oxalate? __________________________
4) What is the oxidation number for the carbon in the oxalate ion? ______
5) What is the formula for manganese (II) ions? __________________________
Purpose: To determine the molar concentration of a potassium permanganate solution (based on
three trials of data) by titrating it with a solution of 0.00200 M sodium oxalate that has
been acidified with sulfuric acid.
Materials: A large test tube (25 mm 200 mm), a 250-mL Erlenmeyer flask, a hot plate, two burets
with buret stand, two 50-mL beakers (to hold the 0.00200 M sodium oxalate solution and
the unknown potassium permanganate solution), and paper towel (to make drying wands
for the large test tube).

-66-
Procedure: GOGGLES AND APRON ARE THE WORN AT ALL TIMES!
Write a step-by-step procedure for this experiment. Your procedure MUST be approved by the teacher
BEFORE you begin. Remember, Step-1 is to put on goggles and apron.
__________________________________________________________________________________
__________________________________________________________________________________
__________________________________________________________________________________
__________________________________________________________________________________
__________________________________________________________________________________
__________________________________________________________________________________
__________________________________________________________________________________
__________________________________________________________________________________
__________________________________________________________________________________
__________________________________________________________________________________
__________________________________________________________________________________
__________________________________________________________________________________
__________________________________________________________________________________
__________________________________________________________________________________
__________________________________________________________________________________
__________________________________________________________________________________
__________________________________________________________________________________
__________________________________________________________________________________
__________________________________________________________________________________
__________________________________________________________________________________
After you have your approved procedure, create a data table below that can receive your data.

-67-
6) The reaction between the potassium permanganate and the acidified sodium oxalate produces
manganese (II) ions and carbon dioxide. Assuming that the potassium and the sodium ions are
spectator ions, write a balanced net ionic equation for the redox reaction that takes place.
Keep in mind that this is a redox reaction that is taking place in an acidified environment.
YOU MUST COMPLETE THIS STEP BEFORE YOU CAN MOVE ON TO STEPS 2 – 4!
7) Using the volumes used, calculate the moles of oxalate (0.00200 M) titrated in each of the trials.
Trial 1
___________________________________________________________________________________
Trial 2
___________________________________________________________________________________
Trial 3

-68-
8) Using stoichiometry, calculate the moles of permanganate used in each of the trials.
Trial 1
___________________________________________________________________________________
Trial 2
___________________________________________________________________________________
Trial 3
9) Using the volumes used, calculate the molar concentration of the potassium permanganate
solution in each of the trials.
Trial 1
___________________________________________________________________________________
Trial 2
___________________________________________________________________________________
Trial 3
10) The average molar concentration of the potassium permanganate solution is ________________M

-69-
Lab-23: Reactions of Acids and Bases
Introduction:
Acids and bases are two classes of compounds with distinct properties. Some of these properties are
directly observable while other properties are instead based on an interpretation of the facts.
A Compound's formula can usually indicate whether it is an acid or base.
Compound How to Recognize an Acid or Base Compound from its Formula
Acids Acid formulas usually start with hydrogen (H). (i.e. HCl, H2SO4 )
Organic acid formulas will end with the carboxyl group, (COOH) (i.e. CH3COOH)
Bases
Ionic base formulas start with a metal or a (+)P.A.I. and end with the (-)P.A.I.
hydroxide (OH-). (i.e. NaOH, Ba(OH)2)
Covalent base formulas can have the general formula R-NH2, where R is a single
hydrogen atom or a group of carbon and hydrogen atoms. (i.e. NH3, CH3CH2NH2)
Below are some directly observable properties of acids and bases.
Properties of Acids based on Direct Observation Properties of Bases based on Direct Observation
1) Acids taste sour. (not a safe test!) 1) Bases taste bitter. (not a safe test!)
2) Acids react with many metals to produce H2(g). 2) Bases feel slippery.
3) Acids react with carbonate salts and hydrogen
carbonate (bicarbonate) salts to produce CO2(g).
3) Bases react with ammonium salts to produce
NH3(g).
4) Acids are caustic and corrosive. 4) Bases are caustic and corrosive.
5) Acids turn blue litmus red, etc. 5) Bases turn red litmus blue, etc.
6) Aqueous acid solutions will conduct electricity. 6) Aqueous base solutions will conduct electricity.
7) Acids neutralize bases. 7) Bases neutralize acids.
Below are some properties of acids and bases based on interpretation of facts.
Properties of Acids based on Interpretation Properties of Bases based on Interpretation
1) Acids provide free moving ions when
dissolved in water. Acids are electrolytes.
1) Bases provide free moving ions when
dissolved in water. Bases are electrolytes.
2) Acids ionize in water. Strong acids ionize
nearly 100% in H2O whereas weak acids do not.
2) Ionic bases will dissociate in water whereas
covalent bases ionize in water.
3) Acids produce hydronium ions (H3O+) as the
only positive ions in water according to the
Arrhenius Theory. [H3O+(aq) ≈ H+
(aq)]
3) Bases produce hydroxide ions (OH-) as the
only negative ions in water according to the
Arrhenius Theory.
4) Acids are proton (H+) donors according to the
Bronsted-Lowry Theory.
4) Bases are proton (H+) acceptors according to
the Bronsted-Lowry Theory.
5) Acids are electron (e-) acceptors according to
the Lewis Theory.
5) Bases are electron (e-) donors according to the
Lewis Theory.
In water, nonmetallic binary oxides act as acids. In water, metallic binary oxides act as bases.
Binary
Oxides
Nonmetallic oxides will ionize and form acidic solutions when dissolved in water.
Metallic oxides will ionize and form basic solutions when dissolved in water.
H1+
A1-
HA HA
A1-
H1+
HA
HA HA
H1+
H1+
H1+ X1-
X1-
H1+
X1-
X1-
H1+
H1+
X1- X1-
HX
A beaker contains the STRONG
acid HX dissolved in water.
Notice that almost 100% of the
HX molecules ionized as they
dissolved in the water.
A beaker contains the WEAK
acid HA dissolved in water.
Notice that very few of the
HA molecules ionized as they
dissolved in the water.
Many ions Few ions

-70-
Purpose:
In this laboratory activity, you will observe the reactions of a strong acid with several metals and with a
carbonate and a hydrogen carbonate. You will identify any gas emitted by these reactions. You will
observe the reaction of calcium oxide with water and its effect on the pH of the water. You will
observe the reaction of carbon dioxide with water and its effect on the pH of the water. You will
observe the reaction of a strong base with an ammonium salt. You will identify the gas emitted by this
reaction. You will observe the reaction of HCl gas with NH3 gas. You will write the net ionic
equations for all observed reactions.
Procedure: GOGGLES AND APRONS ARE TO BE WORN AT ALL TIMES!
1) Set up a test tube rack with test tubes as shown in the diagram below.
2) Quarter fill test tube-1 with 0.10 M HCl. Quarter fill test tube-2 with 0.10 M HCl. Quarter fill test
tube-3 with 0.10 M HCl. Quarter fill test tube-4 with 0.10 M HCl. Quarter fill test tube-5 with
distilled water. Quarter fill test tube-6 with distilled water. Quarter fill test tube-7 with 0.10 M
NaOH. Quarter fill test tube-8 with 0.10 M NH3 and then stopper the test tube.
3) In test tube-1, place a piece of copper. Stopper test tube for 1 minute and observe. Carefully
remove the stopper and hold a lit wooden splint just inside the mouth of the test tube. Observe.
________________________________________________________________________________
________________________________________________________________________________
________________________________________________________________________________
________________________________________________________________________________
________________________________________________________________________________
4) In test tube-2, place a piece of zinc. Stopper test tube for 1 minute and observe. Carefully remove
the stopper and hold a lit wooden splint just inside the mouth of the test tube. Observe.
________________________________________________________________________________
________________________________________________________________________________
________________________________________________________________________________
________________________________________________________________________________
________________________________________________________________________________
5) In test tube-3, place a pea sized amount of sodium carbonate (washing soda). Stopper test tube for
1 minute and observe. Carefully remove the stopper and hold a lit wooden splint just inside the
mouth of the test tube. Observe.
________________________________________________________________________________
________________________________________________________________________________
________________________________________________________________________________
________________________________________________________________________________
________________________________________________________________________________
1 2 3 4 5 6 7 8

-71-
6) In test tube-4, place a pea sized amount of sodium hydrogen carbonate (baking soda). Stopper test
tube for 1 minute and observe. Carefully remove the stopper and hold a lit wooden splint just
inside the mouth of the test tube.
________________________________________________________________________________
________________________________________________________________________________
________________________________________________________________________________
________________________________________________________________________________
________________________________________________________________________________
7) In test tube-5, carefully add several drops of bromthymol blue into the water. Observe. Place a
pea sized amount of calcium oxide. Stopper test tube for several minutes. Observe.
________________________________________________________________________________
________________________________________________________________________________
________________________________________________________________________________
________________________________________________________________________________
________________________________________________________________________________
8) In test tube-6, carefully add several drops of bromthymol blue into the water. Observe. Using a
straw, carefully blow into the test tube for several minutes. Observe.
________________________________________________________________________________
________________________________________________________________________________
________________________________________________________________________________
________________________________________________________________________________
________________________________________________________________________________
9) In test tube-7, place a pea sized amount of ammonium chloride. Stopper test tube for 1 minute and
observe. Carefully remove the stopper and waft toward your nose. Observe.
________________________________________________________________________________
________________________________________________________________________________
________________________________________________________________________________
________________________________________________________________________________
________________________________________________________________________________
10) Move test tube-8 and hold its mouth right next to the mouth of test tube-1. Remove the stopper
from test tube-8 and observe.
________________________________________________________________________________
________________________________________________________________________________
________________________________________________________________________________
________________________________________________________________________________
________________________________________________________________________________
-72-
11) Write the net ionic equation for the reaction that occurred in step-3. If no reaction occurred, then
write “No reaction occurred.”
________________________________________________________________________________
12) Write the net ionic equation for the reaction that occurred in step-4. If no reaction occurred, then
write “No reaction occurred.”
________________________________________________________________________________
13) Write the net ionic equation for the reaction that occurred in step-5. If no reaction occurred, then
write “No reaction occurred.”
________________________________________________________________________________
14) Write the net ionic equation for the reaction that occurred in step-6. If no reaction occurred, then
write “No reaction occurred.”
________________________________________________________________________________
15) Write the net ionic equation for the reaction that occurred in step-7. If no reaction occurred, then
write “No reaction occurred.”
________________________________________________________________________________
16) Write the net ionic equation for the reaction that occurred in step-8. If no reaction occurred, then
write “No reaction occurred.”
________________________________________________________________________________
17) Write the net ionic equation for the reaction that occurred in step-9. If no reaction occurred, then
write “No reaction occurred.”
________________________________________________________________________________
18) Write the net ionic equation for the reaction that occurred in step-10. If no reaction occurred, then
write “No reaction occurred.”
________________________________________________________________________________
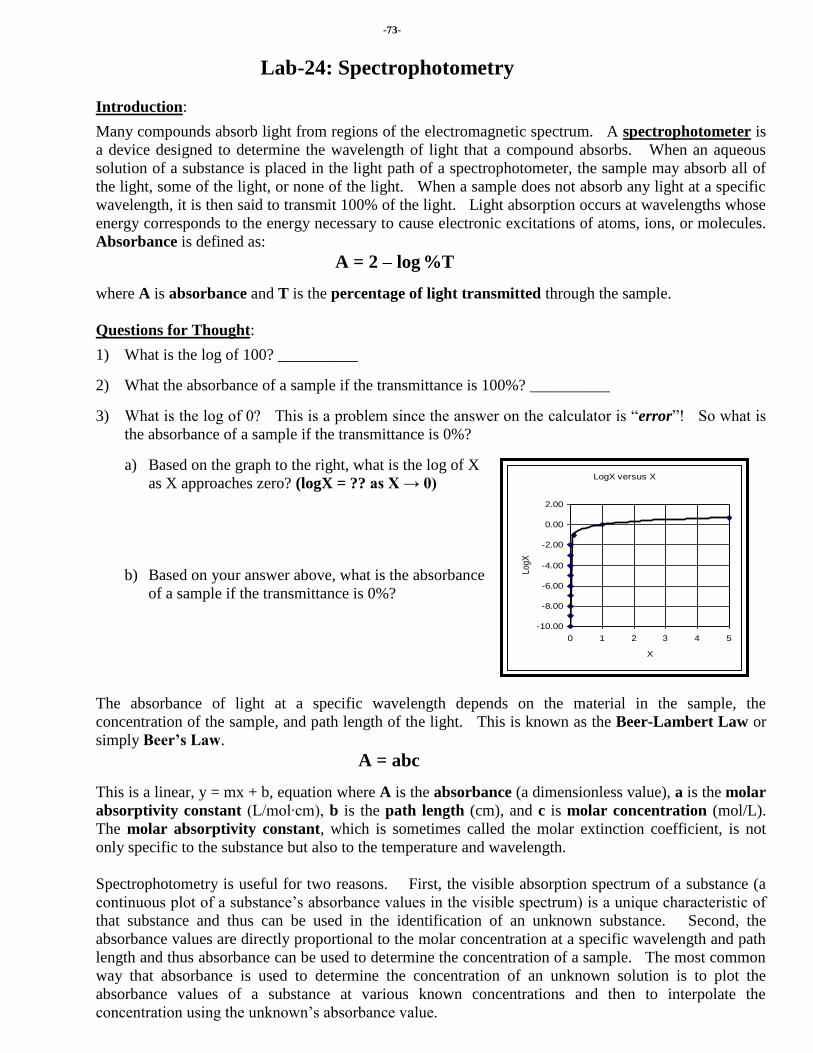
-73-
Lab-24: Spectrophotometry
Introduction:
Many compounds absorb light from regions of the electromagnetic spectrum. A spectrophotometer is
a device designed to determine the wavelength of light that a compound absorbs. When an aqueous
solution of a substance is placed in the light path of a spectrophotometer, the sample may absorb all of
the light, some of the light, or none of the light. When a sample does not absorb any light at a specific
wavelength, it is then said to transmit 100% of the light. Light absorption occurs at wavelengths whose
energy corresponds to the energy necessary to cause electronic excitations of atoms, ions, or molecules.
Absorbance is defined as:
A = 2 – log %T
where A is absorbance and T is the percentage of light transmitted through the sample.
Questions for Thought:
1) What is the log of 100? __________
2) What the absorbance of a sample if the transmittance is 100%? __________
3) What is the log of 0? This is a problem since the answer on the calculator is “error”! So what is
the absorbance of a sample if the transmittance is 0%?
a) Based on the graph to the right, what is the log of X
as X approaches zero? (logX = ?? as X → 0)
b) Based on your answer above, what is the absorbance
of a sample if the transmittance is 0%?
The absorbance of light at a specific wavelength depends on the material in the sample, the
concentration of the sample, and path length of the light. This is known as the Beer-Lambert Law or
simply Beer’s Law.
A = abc
This is a linear, y = mx + b, equation where A is the absorbance (a dimensionless value), a is the molar
absorptivity constant (L/mol∙cm), b is the path length (cm), and c is molar concentration (mol/L).
The molar absorptivity constant, which is sometimes called the molar extinction coefficient, is not
only specific to the substance but also to the temperature and wavelength.
Spectrophotometry is useful for two reasons. First, the visible absorption spectrum of a substance (a
continuous plot of a substance’s absorbance values in the visible spectrum) is a unique characteristic of
that substance and thus can be used in the identification of an unknown substance. Second, the
absorbance values are directly proportional to the molar concentration at a specific wavelength and path
length and thus absorbance can be used to determine the concentration of a sample. The most common
way that absorbance is used to determine the concentration of an unknown solution is to plot the
absorbance values of a substance at various known concentrations and then to interpolate the
concentration using the unknown’s absorbance value.
LogX versus X
-10.00
-8.00
-6.00
-4.00
-2.00
0.00
2.00
0 1 2 3 4 5
X
LogX

-74-
Purpose:
To plot a standard absorption curve at a specific wavelength for a known solution of KMnO4 and then to
use the curve to determine the molar concentration of an unknown solution of KMnO4. To determine
the molar absorptivity constant for a KMnO4 solution at a specified wavelength.
Procedure: GOGGLES AND APRONS ARE TO BE WORN AT ALL TIMES!
1) Obtain 40 mL of the known KMnO4 solution and 40 mL of distilled water in 50 mL beakers.
2) Fill buret-1 with the KMnO4 solution of known concentration and fill buret-2 with distilled water.
3) Below, record the concentration of the KMnO4 solution of known concentration in g/L.
4) Set up a test tube rack with cuvettes as shown in the diagram below.
5) Add 5 mL of distilled water into cuvette-1.
6) Add 1 mL of the KMnO4 solution of known concentration into cuvette-2 and then add 4 mL of
distilled water into the cuvette-2. Stopper cuvette-2 and then invert to mix.
7) Add 2 mL of the KMnO4 solution of known concentration into cuvette-3 and then add 3 mL of
distilled water into the cuvette-3. Stopper cuvette-3 and then invert to mix.
8) Add 3 mL of the KMnO4 solution of known concentration into cuvette-4 and then add 2 mL of
distilled water into the cuvette-4. Stopper cuvette-4 and then invert to mix.
9) Add 4 mL of the KMnO4 solution of known concentration into cuvette-5 and then add 1 mL of
distilled water into the cuvette-5. Stopper cuvette-5 and then invert to mix.
10) Add 5 mL of the KMnO4 solution of known concentration into cuvette-6.
11) Wipe off any fingerprints from all test tubes with lens paper (fingerprints with absorb light and thus
give false absorbance readings). ---------------------------------------------------------------------------------------------------------------------------------------------------------------------------------------------
12) Below, record the wavelength of light being used in the spectroscope.
13) Set the spectroscope so that it measures transmittance. Place cuvette-1 into the spectroscope.
Adjust the spectroscope so that is reads 100% transmittance. Set the spectroscope so that it now
measures absorbance. Read the absorbance value of cuvette-1 (it should be zero!). Record below.
14) One by one, place cuvette-2 through cuvette-6 into the spectroscope. Read the absorbance values.
Record below. ---------------------------------------------------------------------------------------------------------------------------------------------------------------------------------------------
15) Empty and dry cuvette-1. Half-fill cuvette-1 with the solution of KMnO4 of unknown concentration.
16) Place cuvette-1 into the spectroscope and read the absorbance values. Record below.
17) Empty and thoroughly rinse the cuvettes and burettes.
18) Create a standard absorption curve in Microsoft Excel: Absorbance versus Concentration (M)
Data and Observations:
1) The concentration of the known solution of KMnO4 is _______________________ g/mL.
2) The wavelength of light being used is __________ nm
3) Table 1: Absorbance Values Test Tube Percentage of Known KMnO4 Concentration (g/L) Concentration (M) Absorbance Value
1 0%
2 20%
3 40%
4 60%
5 80%
6 100%
4) The absorbance of the unknown solution of KMnO4 is __________
1 2 3 4 5 6 Please be careful. Each
cuvette costs about $10!
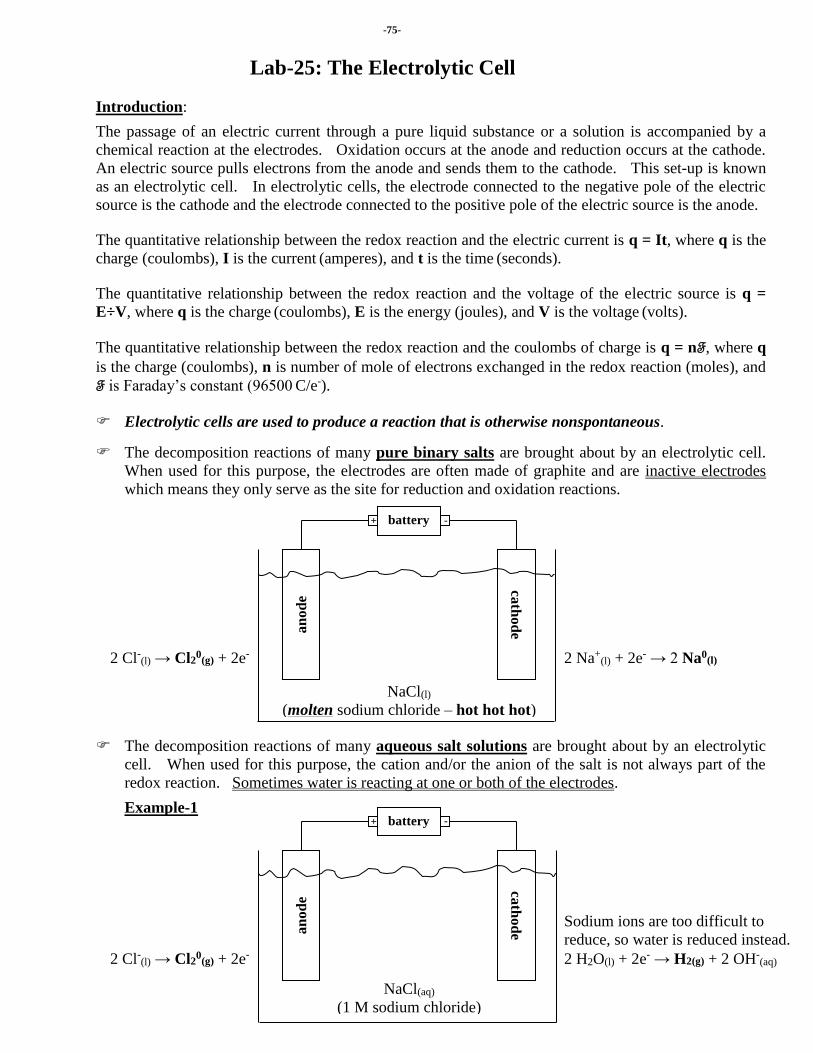
-75-
Lab-25: The Electrolytic Cell
Introduction:
The passage of an electric current through a pure liquid substance or a solution is accompanied by a
chemical reaction at the electrodes. Oxidation occurs at the anode and reduction occurs at the cathode.
An electric source pulls electrons from the anode and sends them to the cathode. This set-up is known
as an electrolytic cell. In electrolytic cells, the electrode connected to the negative pole of the electric
source is the cathode and the electrode connected to the positive pole of the electric source is the anode.
The quantitative relationship between the redox reaction and the electric current is q = It, where q is the
charge (coulombs), I is the current (amperes), and t is the time (seconds).
The quantitative relationship between the redox reaction and the voltage of the electric source is q =
E÷V, where q is the charge (coulombs), E is the energy (joules), and V is the voltage (volts).
The quantitative relationship between the redox reaction and the coulombs of charge is q = nF, where q
is the charge (coulombs), n is number of mole of electrons exchanged in the redox reaction (moles), and
F is Faraday’s constant (96500 C/e-).
Electrolytic cells are used to produce a reaction that is otherwise nonspontaneous.
The decomposition reactions of many pure binary salts are brought about by an electrolytic cell.
When used for this purpose, the electrodes are often made of graphite and are inactive electrodes
which means they only serve as the site for reduction and oxidation reactions.
The decomposition reactions of many aqueous salt solutions are brought about by an electrolytic
cell. When used for this purpose, the cation and/or the anion of the salt is not always part of the
redox reaction. Sometimes water is reacting at one or both of the electrodes.
Example-1
NaCl(l)
(molten sodium chloride – hot hot hot)
battery + -
cath
od
e an
od
e
2 Na+(l) + 2e- → 2 Na0
(l) 2 Cl-
(l) → Cl20
(g) + 2e-
battery + -
NaCl(aq)
(1 M sodium chloride)
cath
od
e an
od
e
Sodium ions are too difficult to
reduce, so water is reduced instead.
2 H2O(l) + 2e- → H2(g) + 2 OH-(aq)
2 Cl-(l) → Cl2
0(g) + 2e-

-76-
Example-2
The decomposition of water is brought about by an electrolytic cell. When used for this purpose, a
small amount of an electrolyte is needed to conduct the electric current.
Electrolytic cells are also used as electroplating apparatuses.
A thin coating of metal is deposited on a surface usually to enhance the beauty of the surface or to
protect the surface from corrosion. In electroplating, the surface to be plated is set up as the cathode in
the electrolytic cell and a piece of the plating metal is used as the anode. When used for this purpose,
the electrodes are active which means they take part in the reaction.
When electroplating a surface with a metal, there are some basic rules which must be followed:
The object to be plated must always be the cathode in the electrolytic cell.
The cathode must always be connected to the negative pole of the electric source.
The anode in the electrolytic cell must be made from the plating metal.
The electrolyte used in the electrolytic cell must contain the cation of the plating metal.
battery + -
c
op
per
met
al
Cu2+(aq) + 2e- → Cu0
(s) Cu0(s) → Cu2+
(aq) + 2e-
CuSO4(aq)
(aqueous cupric sulfate )
battery + -
H2O
Small amount of H2SO4(aq)
(to act as an electrolyte)
cath
od
e an
od
e
4 H2O(l) + 4e- → 2 H2(g) + 4 OH-(aq)
2 H2O → O2(g) + 4 H+ + 4 e-
battery + -
Ni(NO3)2(aq)
(1 M nickel nitrate)
cath
od
e an
od
e
2 Ni2+ + 4e- → 2 Ni(aq)
Nitrate ions are too
difficult to oxidize,
so water is oxidized
instead.
2 H2O → O2(g) + 4 H+ + 4 e-
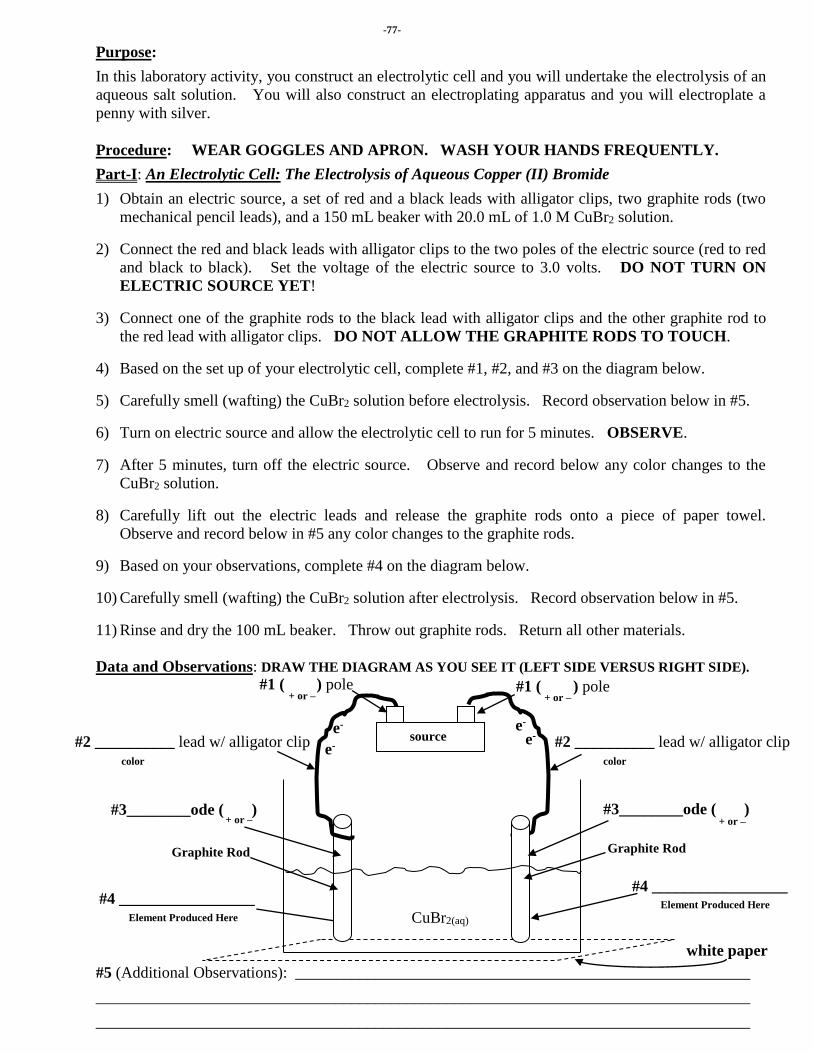
-77-
Purpose:
In this laboratory activity, you construct an electrolytic cell and you will undertake the electrolysis of an
aqueous salt solution. You will also construct an electroplating apparatus and you will electroplate a
penny with silver.
Procedure: WEAR GOGGLES AND APRON. WASH YOUR HANDS FREQUENTLY.
Part-I: An Electrolytic Cell: The Electrolysis of Aqueous Copper (II) Bromide
1) Obtain an electric source, a set of red and a black leads with alligator clips, two graphite rods (two
mechanical pencil leads), and a 150 mL beaker with 20.0 mL of 1.0 M CuBr2 solution.
2) Connect the red and black leads with alligator clips to the two poles of the electric source (red to red
and black to black). Set the voltage of the electric source to 3.0 volts. DO NOT TURN ON
ELECTRIC SOURCE YET!
3) Connect one of the graphite rods to the black lead with alligator clips and the other graphite rod to
the red lead with alligator clips. DO NOT ALLOW THE GRAPHITE RODS TO TOUCH.
4) Based on the set up of your electrolytic cell, complete #1, #2, and #3 on the diagram below.
5) Carefully smell (wafting) the CuBr2 solution before electrolysis. Record observation below in #5.
6) Turn on electric source and allow the electrolytic cell to run for 5 minutes. OBSERVE.
7) After 5 minutes, turn off the electric source. Observe and record below any color changes to the
CuBr2 solution.
8) Carefully lift out the electric leads and release the graphite rods onto a piece of paper towel.
Observe and record below in #5 any color changes to the graphite rods.
9) Based on your observations, complete #4 on the diagram below.
10) Carefully smell (wafting) the CuBr2 solution after electrolysis. Record observation below in #5.
11) Rinse and dry the 100 mL beaker. Throw out graphite rods. Return all other materials.
Data and Observations: DRAW THE DIAGRAM AS YOU SEE IT (LEFT SIDE VERSUS RIGHT SIDE).
#5 (Additional Observations): _________________________________________________________
__________________________________________________________________________________
__________________________________________________________________________________
#4 _________________
#2 __________ lead w/ alligator clip
#2 __________ lead w/ alligator clip
#4 _________________
Graphite Rod
source e-
CuBr2(aq) Element Produced Here
Element Produced Here
e- e-
e-
#1 ( ) pole #1 ( ) pole
#3________ode ( ) #3________ode ( )
color color
Graphite Rod
white paper
+ or – + or –
+ or – + or –

-78-
Part-II: An Electrolytic Cell: The Electroplating of a Penny with Silver
1) Put on your goggles and apron.
2) Obtain a clean acid-washed penny.
3) Mass the penny. ________________ g
4) Attach the penny to the paper clip as shown below.
5) Connect the paper clip with the penny to one end of the black lead with alligator clip and then
connect the other end of the black lead with alligator clip to the negative pole of the electric source.
6) Obtain a silver strip with emery cloth. Clean the silver strip with the emery cloth.
7) Connect the silver strip to one end of the red lead with alligator clip and then connect the other end
of the red lead with alligator clip to the positive pole of the electric source.
8) Set the voltage of the electric source to 3.0 volts. DO NOT TURN ON YET!
9) Half fill the small plastic container with the silver nitrate/potassium cyanide solution. BEWARE.
DO NOT TOUCH THIS SOLUTION. WASH YOUR HANDS FREQUENTLY.
10) Turn on electric source. Hold the penny and the silver strip into the silver nitrate/potassium
cyanide solution for 60 seconds. PLEASE, DO NOT PUT THE ALLIGATOR CLIPS INTO
THE SILVER NITRATE SOLUTION! Turn off electric source.
11) Turn on the faucet to a slow gentle flow of water. Without touching the wet penny/paper clip or
silver strip, rinse them in flowing water and then drop them onto a piece of paper towel, and
carefully pat them both dry. WASH YOUR HANDS.
12) Carefully remove the paper clip and mass the penny (BE SURE THAT THE PENNY IS DRY).
Trial-1: Mass the penny. ______________ g
13) Reattach the penny to a new paper clip. Re-clean the silver strip with the emery cloth. Repeat
steps 7 to 12 twice more.
Trial-2: Mass the penny. ______________ g Trial-3: Mass the penny. _______________ g
14) Throw out all use paper clips.
15) Retie and return the set of red and a black leads with alligator clips.
16) Return the used silver nitrate/potassium cyanide solution. DO NOT POUR DOWN THE SINK!
17) Using silver polish, clean your penny.
18) Wipe down your lab area with a wet paper towel. WASH YOUR HANDS.
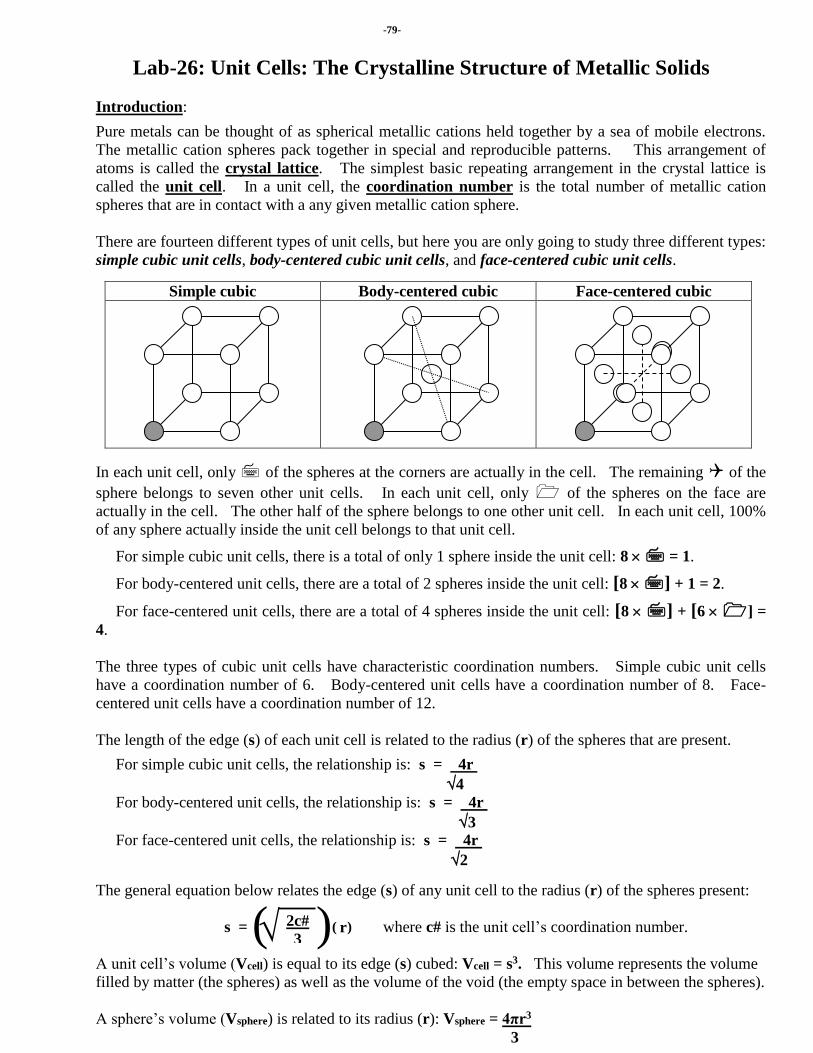
-79-
Lab-26: Unit Cells: The Crystalline Structure of Metallic Solids
Introduction:
Pure metals can be thought of as spherical metallic cations held together by a sea of mobile electrons.
The metallic cation spheres pack together in special and reproducible patterns. This arrangement of
atoms is called the crystal lattice. The simplest basic repeating arrangement in the crystal lattice is
called the unit cell. In a unit cell, the coordination number is the total number of metallic cation
spheres that are in contact with a any given metallic cation sphere.
There are fourteen different types of unit cells, but here you are only going to study three different types:
simple cubic unit cells, body-centered cubic unit cells, and face-centered cubic unit cells.
Simple cubic Body-centered cubic Face-centered cubic
In each unit cell, only of the spheres at the corners are actually in the cell. The remaining of the
sphere belongs to seven other unit cells. In each unit cell, only of the spheres on the face are
actually in the cell. The other half of the sphere belongs to one other unit cell. In each unit cell, 100%
of any sphere actually inside the unit cell belongs to that unit cell.
For simple cubic unit cells, there is a total of only 1 sphere inside the unit cell: 8 = 1.
For body-centered unit cells, there are a total of 2 spheres inside the unit cell: [8 ] + 1 = 2.
For face-centered unit cells, there are a total of 4 spheres inside the unit cell: [8 ] + [6 ] =
4.
The three types of cubic unit cells have characteristic coordination numbers. Simple cubic unit cells
have a coordination number of 6. Body-centered unit cells have a coordination number of 8. Face-
centered unit cells have a coordination number of 12.
The length of the edge (s) of each unit cell is related to the radius (r) of the spheres that are present.
For simple cubic unit cells, the relationship is: s = 4r
4
For body-centered unit cells, the relationship is: s = 4r
3
For face-centered unit cells, the relationship is: s = 4r
2
The general equation below relates the edge (s) of any unit cell to the radius (r) of the spheres present:
where c# is the unit cell’s coordination number.
A unit cell’s volume (Vcell) is equal to its edge (s) cubed: Vcell = s3. This volume represents the volume
filled by matter (the spheres) as well as the volume of the void (the empty space in between the spheres).
A sphere’s volume (Vsphere) is related to its radius (r): Vsphere = 4πr3
3
( )( ) 2c#
3 s = r


-80-
The three types of cubic unit cells have characteristic percents of the cube filled by matter. Simple
cubic unit cells are 52.36% filled by matter. Body-centered cubic unit cells are 68.02% filled by matter.
Face-centered cubic unit cells are 74.04% filled by matter.
These percentages are equal to # spheres per cell Vsphere 100
Vcell
The greater the percentage of the unit cell that is filled by matter, the greater the efficiency is of the
packing of the unit cell. Of the three types of cubic unit cells, face-centered cubic unit cells have the
highest packing efficiency. Pure metals such as aluminum, copper, lead, nickel, platinum, and silver
have face-centered cubic unit cells. Pure metals such as chromium, iron, niobium, and vanadium have
body-centered cubic unit cells. Oddly, plutonium is the only pure metal that has a simple cubic unit cell
structure!
The density of a metal (in g/cm3) is related its type of unit cell.
d = [Molar Mass (g/mol)] x [# of Atoms per Unit Cell (# atoms)]
[Volume of unit cell (cm3)] x [Avogadro’s Number (# atoms/mol)]
Purpose: To build a unit cell and to verify the relationship between the atomic radius and the
length of the edge of the unit cell. To verify the percent of the unit cell volume filled
by atoms.
Procedure:
Part I: Determining the edge length of unit cells based on sphere radius.
1) Measure the diameter of one of the spheres and use it to find the radius of the spheres.
Diameter - _______________ cm Radius - _______________ cm
2) Calculate the edge length of a simple cubic unit cell based on the sphere radius.
_______________ cm
3) Calculate the edge length of a body-centered cubic unit cell based on the sphere radius.
_______________ cm
4) Calculate the edge length of a face-centered cubic unit cell based on the sphere radius.
_______________ cm

-81-
Part II: Determining the edge length of unit cells based on direct measurement.
5) Build each cubit unit cell and measure the edge length of each cubic unit cell. Be sure to measure
from the center of sphere to sphere when measuring the edge length of each cubic unit cell. SEE
BELOW.
The edge length of a simple cubic unit cell: _______________ cm
The edge length of a body-centered cubic unit cell: _______________ cm
The edge length of a face-centered cubic unit cell: _______________ cm
Part III: Determining the percent of unit cell volume filled by atoms in for each of the unit cells.
6) Calculate the volume of a simple cubic unit cell based on the direct measurement of the cell edge.
_______________ cm3
7) Calculate the volume of a body-centered cubic unit cell based on the direct measurement of the cell
edge.
_______________ cm3
8) Calculate the volume of a face-centered cubic unit cell based on the direct measurement of the cell
edge.
_______________ cm3
9) Calculate the volume of a sphere, based on the radius you determined from the direct measurement
of the sphere diameter.
_______________ cm3
Edge Length

-82-
10) Based on the number of spheres in a simple cubic unit cell, calculate the volume taken up by those
spheres.
_______________ cm3
11) Based on the number of spheres in a body-centered cubic unit cell, calculate the volume taken up by
those spheres.
_______________ cm3
12) Based on the number of spheres in a face-centered cubic unit cell, calculate the volume taken up by
those spheres.
_______________ cm3
13) Based on your values from step-6 and step-10, calculate percent of volume filled by spheres in a
simple cubic unit cell.
_______________ %
14) Based on your values from step-7 and step-11, calculate percent of volume filled by spheres in a
body-centered cubic unit cell.
_______________ %
15) Based on your values from step-8 and step-12, calculate percent of volume filled by spheres in a
face-centered cubic unit cell.
_______________ %

-83-
Lab-27: Freezing Point Depression and Molar Mass Determination
Introduction:
Solutions are homogeneous mixtures that contain two or more substances. The major component is
called the solvent, and the minor component is called the solute. Since the solution is composed
primarily of solvent, the physical properties of a solution resemble those of the solvent. Some of these
properties, called colligative properties, are independent of the nature of the solute and depend only on
the concentration of the solute.
Freezing point depression is one of the colligative properties. A solution will freeze below the normal
freezing point of the pure solvent in direct proportion to the molal concentration of the solute. This
relationship is expressed by the equation:
Tf = Kfmi
where Tf is the lowering of the freezing point, Kf is the molal freezing point constant of the solvent, m
is the molal concentration of the solute, and i is the van't Hoff factor of the solute. The van't Hoff
factor for a nonelectrolyte solute is always equal to one (i = 1) because one mole of a nonelectrolyte will
form one mole of dissolved solute particles. The van't Hoff factor for an electrolyte solute is ideally
equal to the number of ions that compose the electrolyte. However, the actual van't Hoff factor for an
electrolyte is always somewhat less than its ideal value. This is due to ionic interactions that exist in the
solution which cause cations and anions to behave as a single dissolved particle instead of separate
dissolved particles. This effect becomes more pronounced as the concentration of the solute in the
solvent increases.
A practical application of the freezing point depression effect is addition of antifreeze into the water in
car radiators. The function of a car’ radiator is to cool the engine. The alcohol, ethylene glycol -
C2H4(OH)2, is antifreeze. Early in the automobile industry, engineers needed to find something to add
to the water in the radiator that would greatly lower the freezing point without damaging the radiator
itself. An alcohol such as ethylene glycol is a good choice for several reasons. (1) It is a
nonelectrolyte. (2) It is fairly nonvolatile (has a fairly low vapor pressure). (3) It is highly miscible in
water. (4) It is non-corrosive to metal.
A second practical application of the freezing point depression effect is addition of salt to icy sidewalks
and roads. Traditionally, halite (NaCl) was used. When spread onto icy sidewalks or roads, it begins
to dissolve into the water and lower the water’s freezing point. Thus the ice melts and stays liquid even
below zero degrees celsius. Halite is an electrolyte with an ideal van't Hoff factor of two. One mole of
Halite ideally produces two moles of ions when dissolved in water. Halite’s solubility in water is fairly
constant, even at temperatures at or below zero degrees celsius.
Today, a product known as supermelt (CaCl2) is used on many sidewalks. Supermelt is an electrolyte
with an ideal van't Hoff factor of three. One mole of supermelt ideally produces three moles of ions
when dissolved in water. Mole for mole, supermelt lowers the freezing point more that halite.
A third practical application of the freezing point depression effect is ability to determine an unknown
substance’s molar mass. Using a known amount of a known solvent, you can determine the molar mass
of a known amount of an unknown solute by measuring the freezing point depression of the known
solvent.
One drawback to this method of determining molar mass is the relatively small change in the freezing
point and the limitation of the thermometer. It is necessary to form an almost saturated solution and
then to make the thermometer readings very carefully.

-84-
Purpose:
In this experiment, you will determine the molar mass of an unknown sugar.
Procedure: GOGGLES AND APRONS ARE TO BE WORN AT ALL TIMES!
Part 1: DETERMINING THE FREEZING POINT OF THE DISTILLED WATER
1) Obtain supermelt in a 600 mL beaker.
2) Obtain a plastic container. Fill the container half-full with ice and then pour the supermelt over the
ice to create an ice bath with a temperature below minus 8 degrees celsius. [thermometer #1] Add
more ice if necessary.
3) Measure out 30 mL of distilled water into a graduated cylinder and then add it to the large test tube.
4) Determine the freezing point temperature of distilled water. [thermometer #2] This occurs when
“slushy” ice crystals appear in the test tube. ________oC
Part 2: DETERMINING THE FREEZING POINT DEPRESSION OF THE SUGAR-WATER SOLUTION
1) Obtain and mass a second large dry test tube and 250 mL beaker. ______________ g
2) Add about 8 g of unknown sugar to test tube [about 2 level spoonfuls]. It need not be exact but it
should be close.
3) Mass the sugar, test tube, and 250 mL beaker. ______________ g (The mass of sugar in the test tube should be somewhere between 8g and 9g.)
4) Measure out 30 mL of distilled water into a graduated cylinder.
5) Insert the thermometer into the test tube with the sugar. Wiggle the thermometer down into the
bottom of the test tube.
6) Add the 30 mL of water to the test tube with sugar. IMMEDIATELY, begin stirring the sugar water
mixture. DO NOT ALLOW THE SUGAR TO SIT OR IT WILL HARDEN. KEEP
STIRRING. THIS MAY TAKE 5 TO 8 MINUTES OF STIRRING TO DISSOLVE ALL OF
THE SUGAR.
7) Mass sugar, water, test tube, and 250 mL beaker. ______________ g
8) Make sure ice bath has a temperature below minus 8 degrees celsius. [thermometer #1]
9) Determine the freezing point temperature of sugar-water solution. [thermometer #2] This occurs
when “slushy” ice crystals appear in the test tube. ________oC
10) Thoroughly wash all equipment. Sugar and supermelt require a lot of water to rinse off. Return all
equipment.
11) Molality is defined as the moles of ________________ per the kilograms of ___________________!
12) Based on your data, determine the molar mass of the unknown sugar. SHOW WORK BELOW.
The molar mass is _______________ g/mol
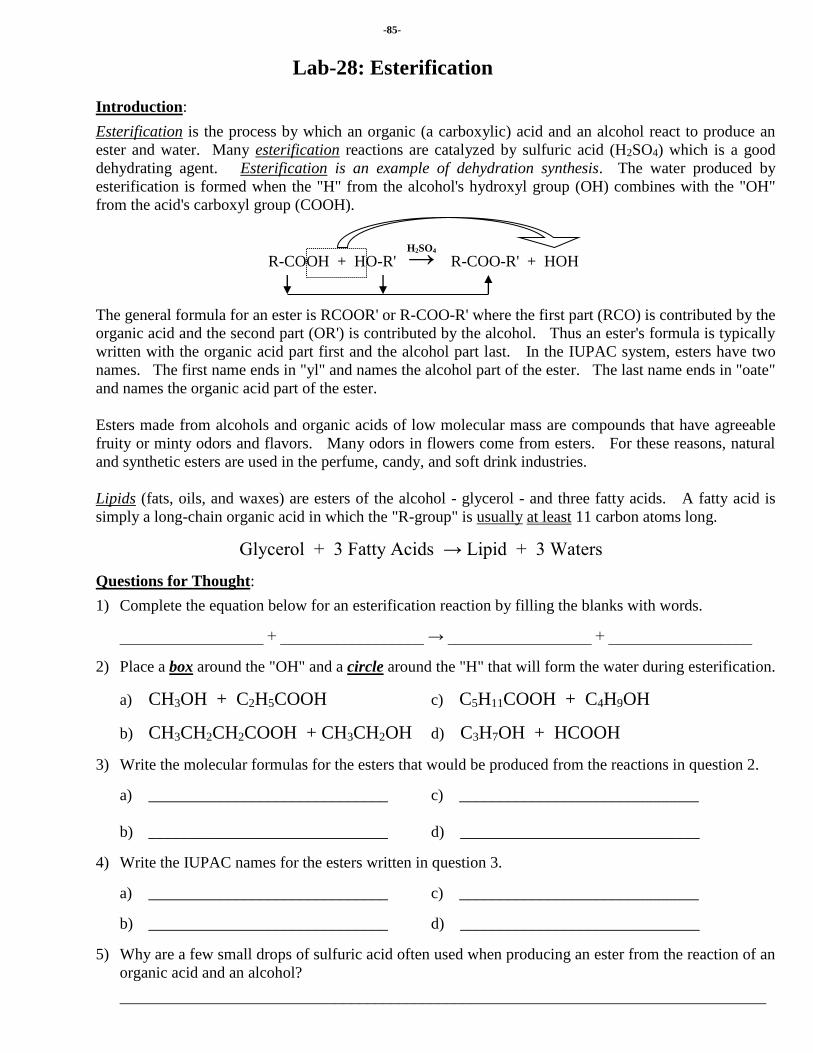
-85-
Lab-28: Esterification
Introduction:
Esterification is the process by which an organic (a carboxylic) acid and an alcohol react to produce an
ester and water. Many esterification reactions are catalyzed by sulfuric acid (H2SO4) which is a good
dehydrating agent. Esterification is an example of dehydration synthesis. The water produced by
esterification is formed when the "H" from the alcohol's hydroxyl group (OH) combines with the "OH"
from the acid's carboxyl group (COOH).
The general formula for an ester is RCOOR' or R-COO-R' where the first part (RCO) is contributed by the
organic acid and the second part (OR') is contributed by the alcohol. Thus an ester's formula is typically
written with the organic acid part first and the alcohol part last. In the IUPAC system, esters have two
names. The first name ends in "yl" and names the alcohol part of the ester. The last name ends in "oate"
and names the organic acid part of the ester.
Esters made from alcohols and organic acids of low molecular mass are compounds that have agreeable
fruity or minty odors and flavors. Many odors in flowers come from esters. For these reasons, natural
and synthetic esters are used in the perfume, candy, and soft drink industries.
Lipids (fats, oils, and waxes) are esters of the alcohol - glycerol - and three fatty acids. A fatty acid is
simply a long-chain organic acid in which the "R-group" is usually at least 11 carbon atoms long.
Glycerol + 3 Fatty Acids → Lipid + 3 Waters
Questions for Thought:
1) Complete the equation below for an esterification reaction by filling the blanks with words.
__________________ + __________________ → __________________ + __________________
2) Place a box around the "OH" and a circle around the "H" that will form the water during esterification.
a) CH3OH + C2H5COOH c) C5H11COOH + C4H9OH
b) CH3CH2CH2COOH + CH3CH2OH d) C3H7OH + HCOOH
3) Write the molecular formulas for the esters that would be produced from the reactions in question 2.
a) ______________________________ c) ______________________________
b) ______________________________ d) ______________________________
4) Write the IUPAC names for the esters written in question 3.
a) ______________________________ c) ______________________________
b) ______________________________ d) ______________________________
5) Why are a few small drops of sulfuric acid often used when producing an ester from the reaction of an
organic acid and an alcohol?
_________________________________________________________________________________
R-COOH + HO-R' → R-COO-R' + HOH H2SO4
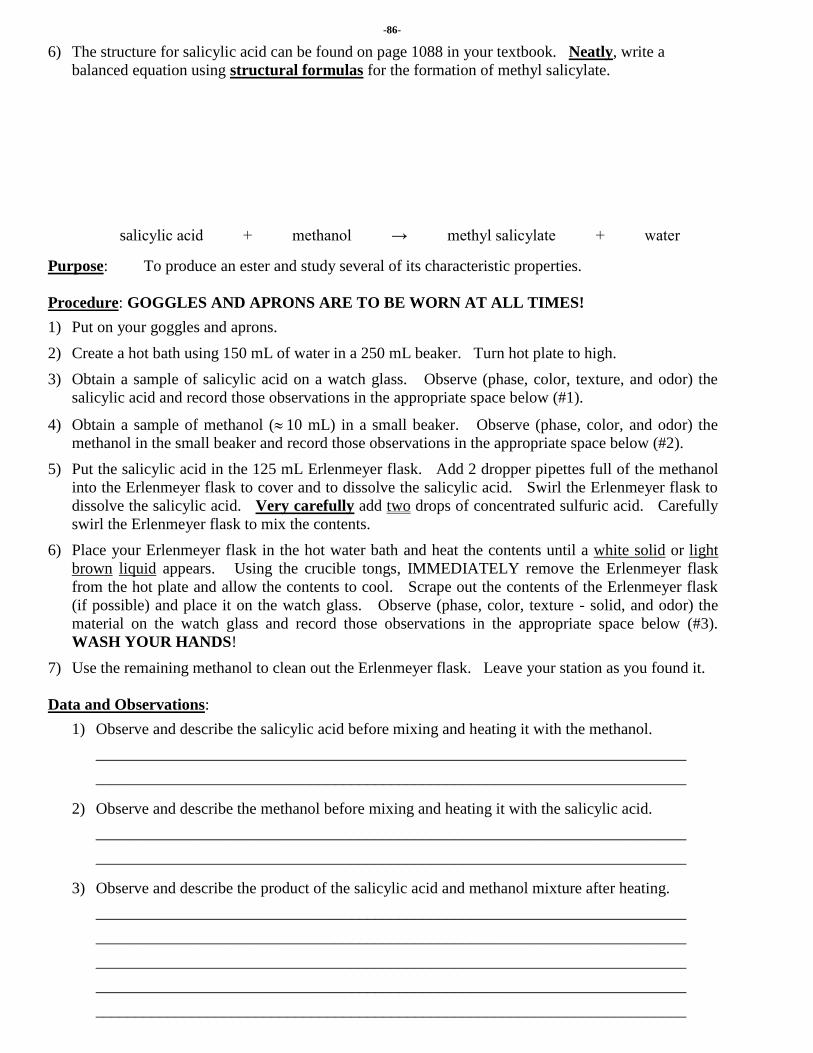
-86-
6) The structure for salicylic acid can be found on page 1088 in your textbook. Neatly, write a
balanced equation using structural formulas for the formation of methyl salicylate.
salicylic acid + methanol → methyl salicylate + water
Purpose: To produce an ester and study several of its characteristic properties.
Procedure: GOGGLES AND APRONS ARE TO BE WORN AT ALL TIMES!
1) Put on your goggles and aprons.
2) Create a hot bath using 150 mL of water in a 250 mL beaker. Turn hot plate to high.
3) Obtain a sample of salicylic acid on a watch glass. Observe (phase, color, texture, and odor) the
salicylic acid and record those observations in the appropriate space below (#1).
4) Obtain a sample of methanol ( 10 mL) in a small beaker. Observe (phase, color, and odor) the
methanol in the small beaker and record those observations in the appropriate space below (#2).
5) Put the salicylic acid in the 125 mL Erlenmeyer flask. Add 2 dropper pipettes full of the methanol
into the Erlenmeyer flask to cover and to dissolve the salicylic acid. Swirl the Erlenmeyer flask to
dissolve the salicylic acid. Very carefully add two drops of concentrated sulfuric acid. Carefully
swirl the Erlenmeyer flask to mix the contents.
6) Place your Erlenmeyer flask in the hot water bath and heat the contents until a white solid or light
brown liquid appears. Using the crucible tongs, IMMEDIATELY remove the Erlenmeyer flask
from the hot plate and allow the contents to cool. Scrape out the contents of the Erlenmeyer flask
(if possible) and place it on the watch glass. Observe (phase, color, texture - solid, and odor) the
material on the watch glass and record those observations in the appropriate space below (#3).
WASH YOUR HANDS!
7) Use the remaining methanol to clean out the Erlenmeyer flask. Leave your station as you found it.
Data and Observations:
1) Observe and describe the salicylic acid before mixing and heating it with the methanol.
__________________________________________________________________________
__________________________________________________________________________
2) Observe and describe the methanol before mixing and heating it with the salicylic acid.
__________________________________________________________________________
__________________________________________________________________________
3) Observe and describe the product of the salicylic acid and methanol mixture after heating.
__________________________________________________________________________
__________________________________________________________________________
__________________________________________________________________________
__________________________________________________________________________
__________________________________________________________________________

-87-