Embed Size (px)
Citation preview
AP Biology
Ecosystems Ecology Part 1
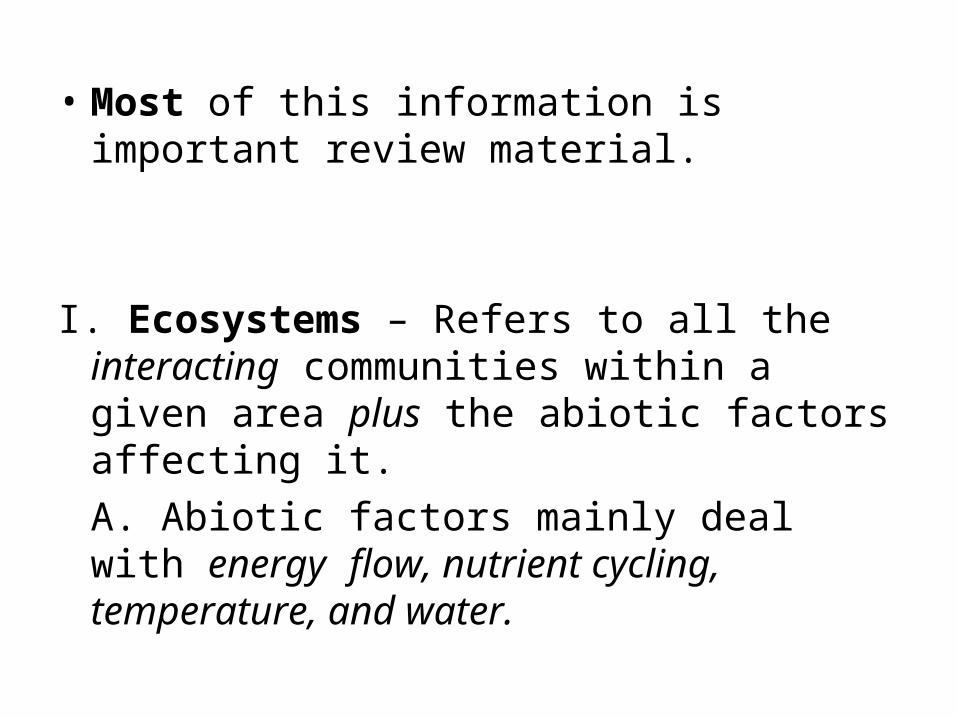
• Most of this information is important review material.
I. Ecosystems – Refers to all the interacting communities within a given area plus the abiotic factors affecting it.A. Abiotic factors mainly deal with energy flow, nutrient cycling, temperature, and water.
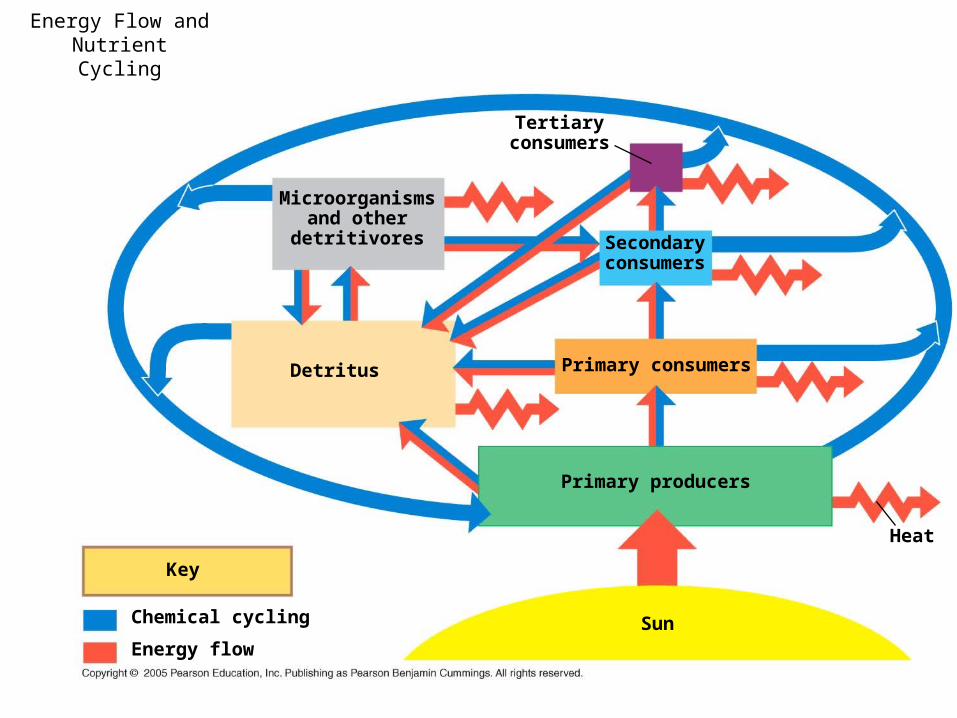
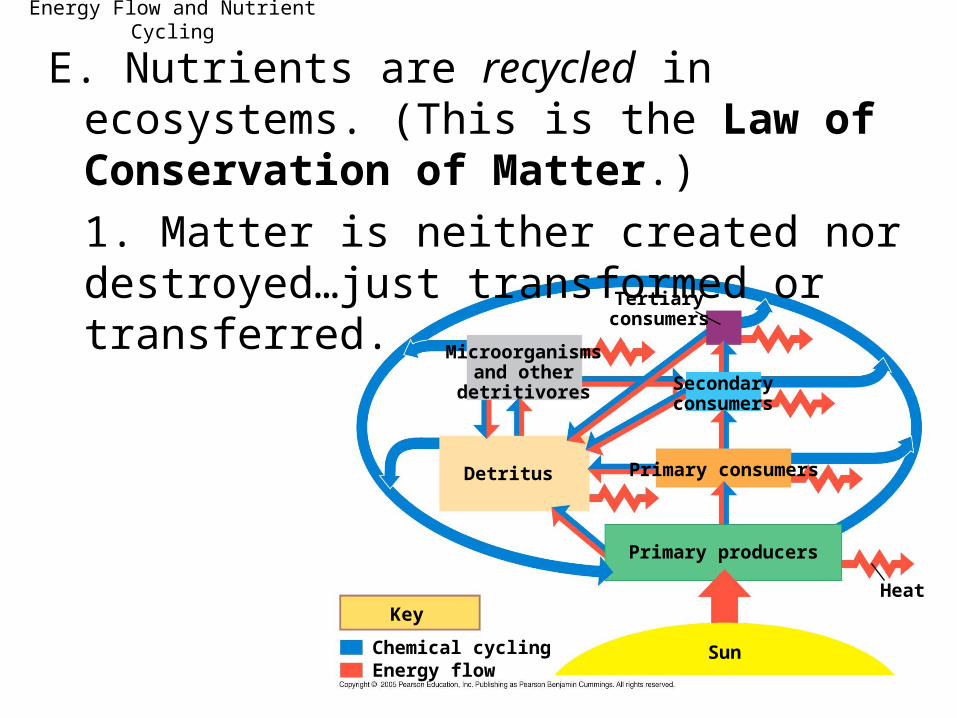
Energy Flow and Nutrient Cycling
Microorganismsand other
detritivores
Tertiaryconsumers
Secondaryconsumers
Detritus Primary consumers
Sun
Primary producers
Heat
Key
Chemical cycling
Energy flow
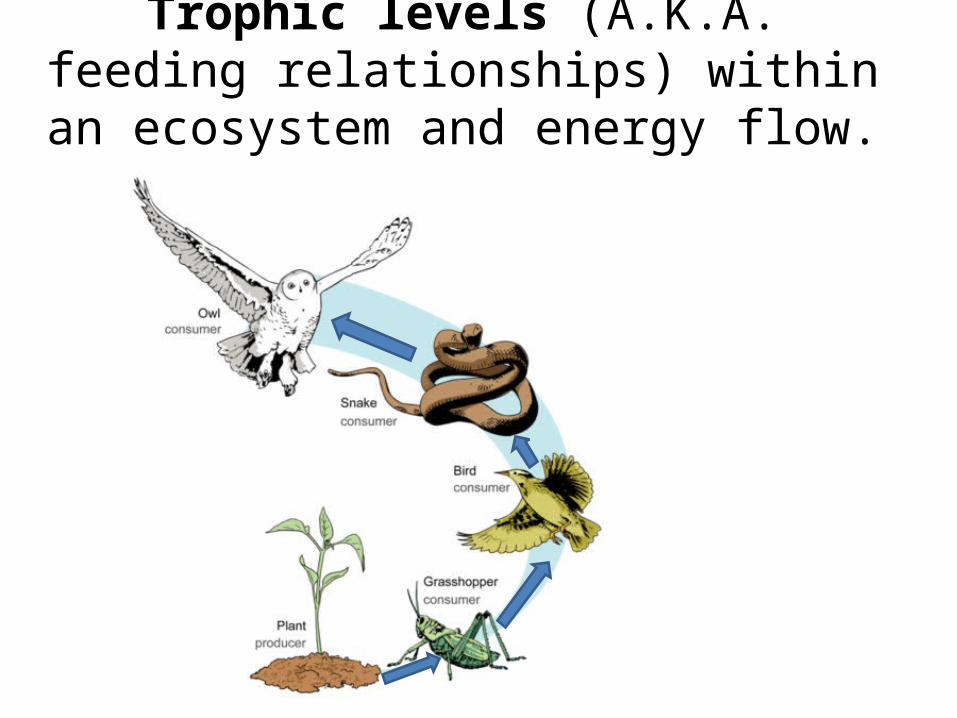
Trophic levels (A.K.A. feeding relationships) within an ecosystem and
energy flow.
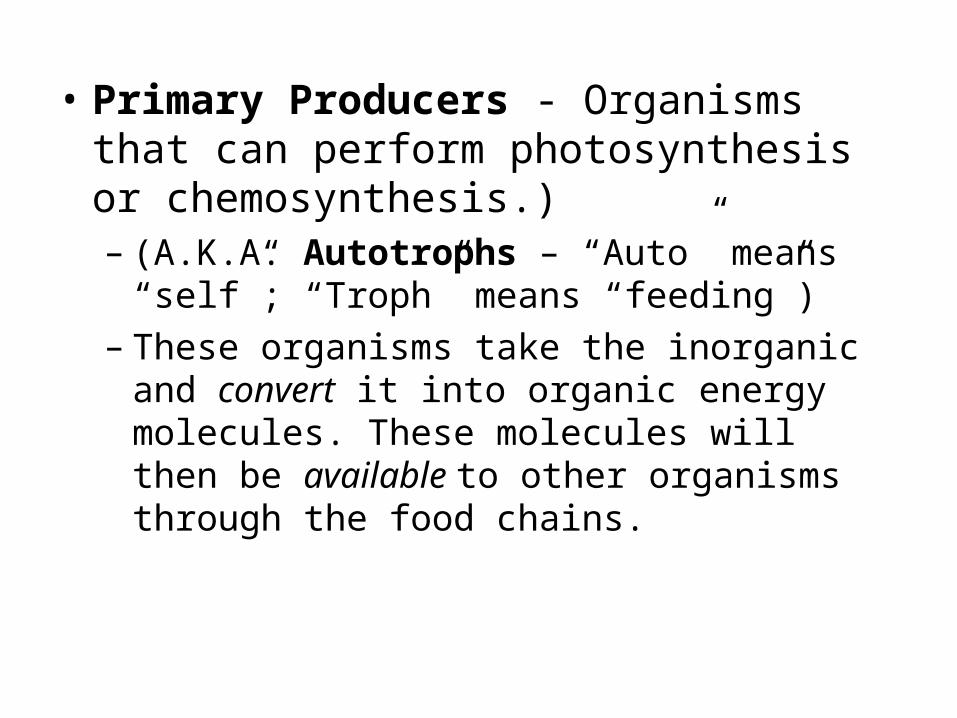
• Primary Producers - Organisms that can perform photosynthesis or chemosynthesis.)– (A.K.A. Autotrophs – “Auto” means “self”;
“Troph” means “feeding”)– These organisms take the inorganic and convert it
into organic energy molecules. These molecules will then be available to other organisms through the food chains.
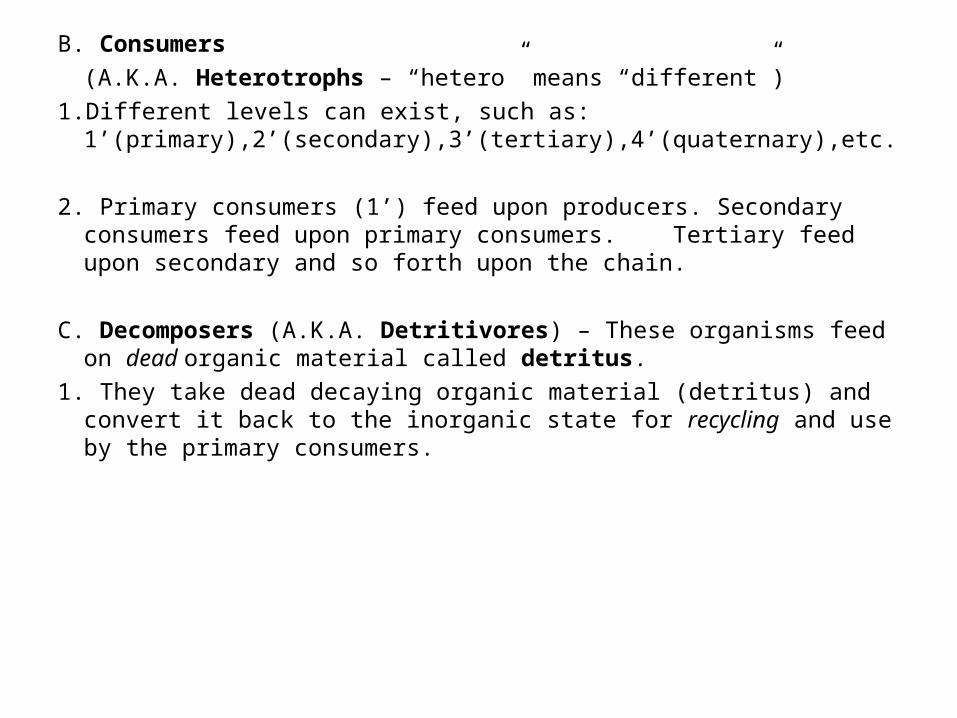
B. Consumers (A.K.A. Heterotrophs – “hetero” means “different”)
1.Different levels can exist, such as: 1’(primary),2’(secondary),3’(tertiary),4’(quaternary),etc.
2. Primary consumers (1’) feed upon producers. Secondary consumers feed upon primary consumers. Tertiary feed upon secondary and so forth upon the chain.
C. Decomposers (A.K.A. Detritivores) – These organisms feed on dead organic material called detritus.
1. They take dead decaying organic material (detritus) and convert it back to the inorganic state for recycling and use by the primary consumers.
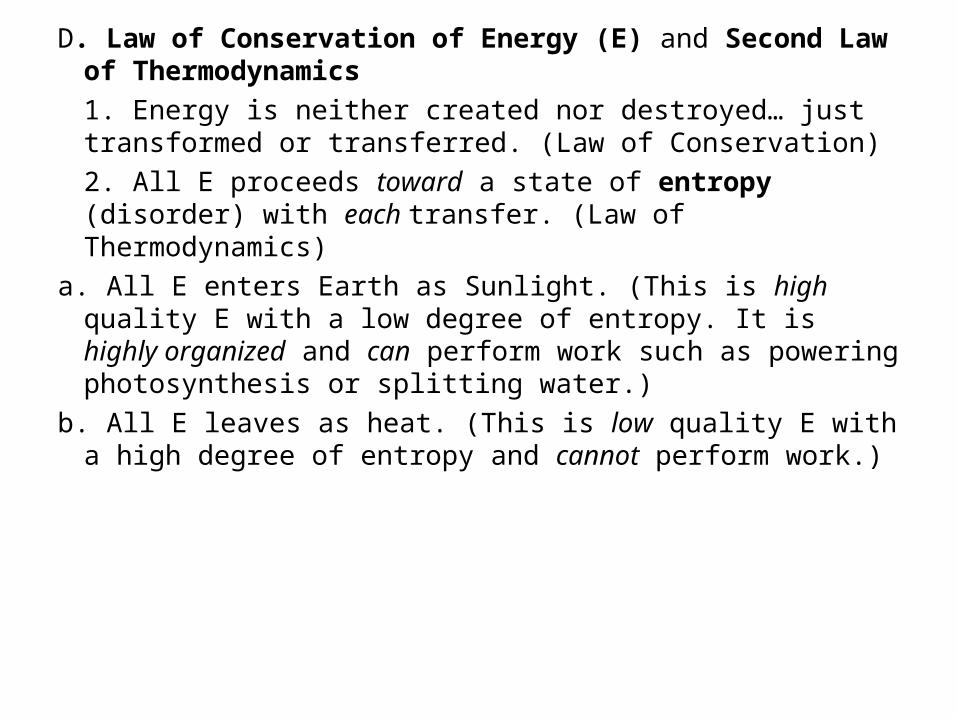
D. Law of Conservation of Energy (E) and Second Law of Thermodynamics1. Energy is neither created nor destroyed… just transformed or transferred. (Law of Conservation)2. All E proceeds toward a state of entropy (disorder) with each transfer. (Law of Thermodynamics)
a. All E enters Earth as Sunlight. (This is high quality E with a low degree of entropy. It is highly organized and can perform work such as powering photosynthesis or splitting water.)
b. All E leaves as heat. (This is low quality E with a high degree of entropy and cannot perform work.)
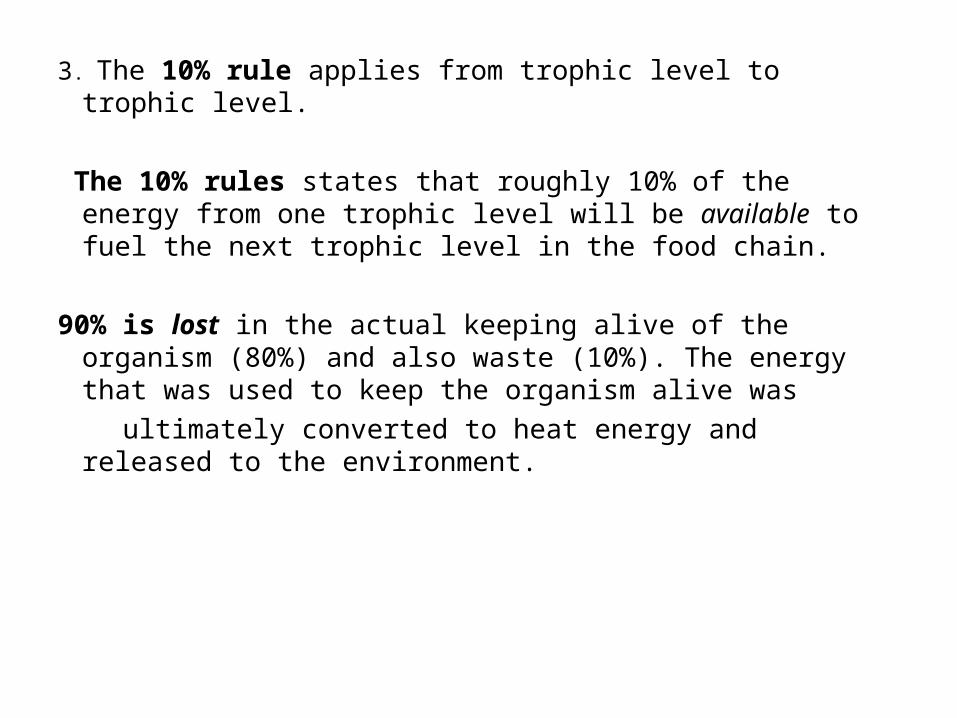
3. The 10% rule applies from trophic level to trophic level.
The 10% rules states that roughly 10% of the energy from one trophic level will be available to fuel the next trophic level in the food chain.
90% is lost in the actual keeping alive of the organism (80%) and also waste (10%). The energy that was used to keep the organism alive was
ultimately converted to heat energy and released to the environment.
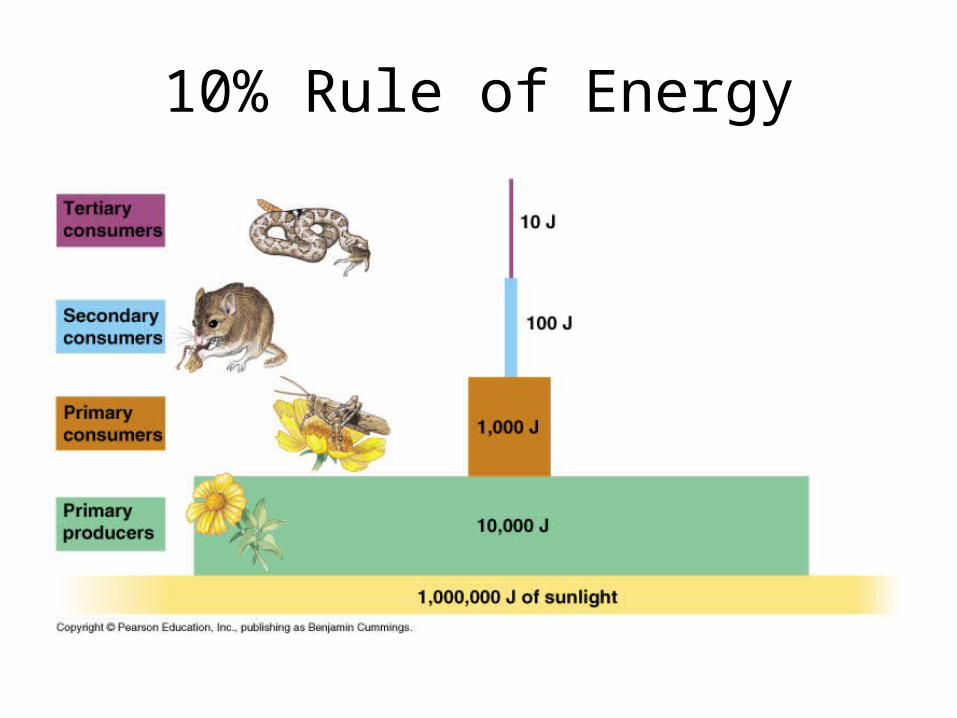
10% Rule of Energy
Microorganismsand other
detritivores
Tertiaryconsumers
Secondaryconsumers
Detritus Primary consumers
Sun
Primary producers
HeatKey
Chemical cyclingEnergy flow
Energy Flow and Nutrient Cycling
E. Nutrients are recycled in ecosystems. (This is the Law of Conservation of Matter.)1. Matter is neither created nor destroyed…just transformed or transferred.
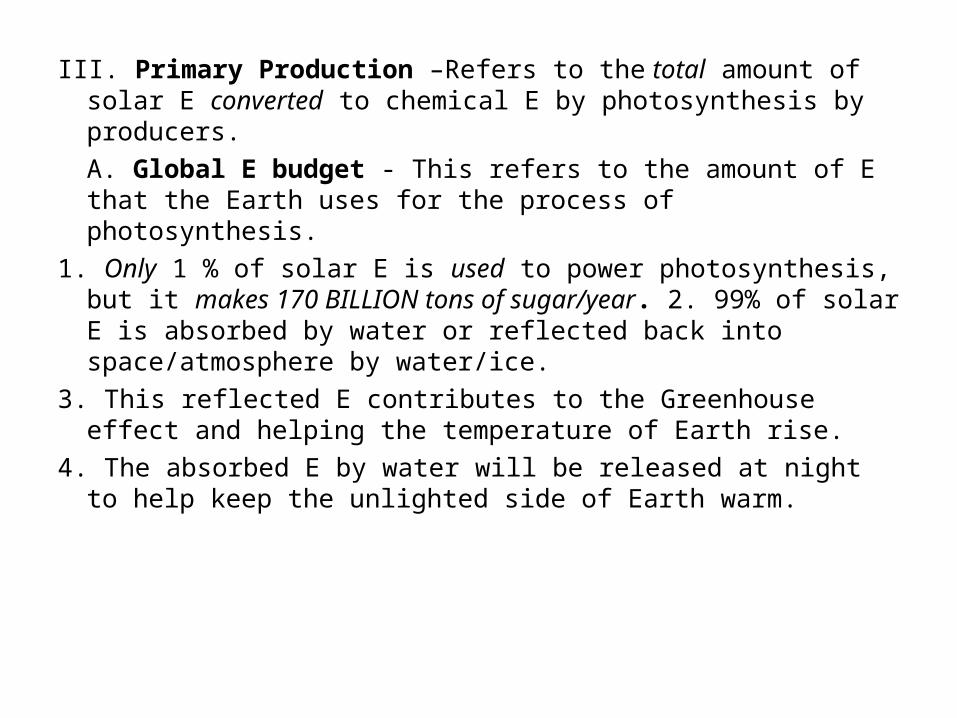
III. Primary Production –Refers to the total amount of solar E converted to chemical E by photosynthesis by producers.A. Global E budget - This refers to the amount of E that the Earth uses for the process of photosynthesis.
1. Only 1 % of solar E is used to power photosynthesis, but it makes 170 BILLION tons of sugar/year. 2. 99% of solar E is absorbed by water or reflected back into space/atmosphere by water/ice.
3. This reflected E contributes to the Greenhouse effect and helping the temperature of Earth rise.
4. The absorbed E by water will be released at night to help keep the unlighted side of Earth warm.
B. Gross Primary Production (GPP) – This is the amount of chemical E produced before any use by those autotrophic organisms that made it over a certain period of time.
C. Net Primary Production (NPP) 1. This is the amount of E left after self preservation (R) of those autotrophs occurs. a. Self- preservation includes items such as Cellular respiration, Homeostasis, growth, repair.b. NPP is the E that will be available to the next trophic level; usually 10 %. (The 10% rule.)
2. NPP = GPP – R– Energy/unit area/time – biomass/unit area/time
New biomass added within a given period of time is used to
measure NPP
• D. Biomass – This is the dry weight of the material of life. It is mostly in the form of proteins.– Energy converted to new biomass (growth
or offspring)
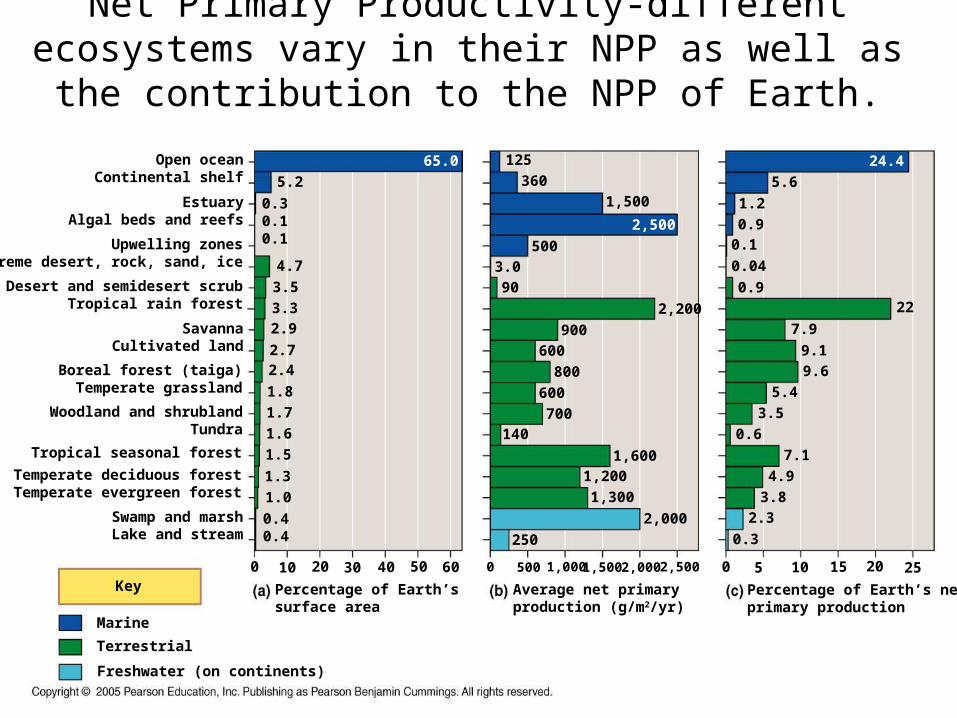
Net Primary Productivity-different ecosystems vary in their NPP as well as the contribution to the NPP of Earth.
Open oceanContinental shelf
Upwelling zonesExtreme desert, rock, sand, ice
Swamp and marshLake and stream
Desert and semidesert scrubTropical rain forest
Temperate deciduous forestTemperate evergreen forest
Tropical seasonal forest
SavannaCultivated land
EstuaryAlgal beds and reefs
Boreal forest (taiga)Temperate grassland
Woodland and shrublandTundra
0.40.4
1.0
1.3
1.5
1.6
1.7
1.8
2.42.7
2.93.3
3.5
4.7
0.30.10.1
5.2
65.0
Freshwater (on continents)
Terrestrial
Marine
Key Percentage of Earth’ssurface area
Average net primaryproduction (g/m2/yr)
6050403020100 2,5002,0001,5001,0005000
Percentage of Earth’s netprimary production
2520151050
125
2,500
360
1,500
500
3.0
90
900
600
800
2,200
600
250
1,6001,200
1,300
2,000
700140
0.3
7.9
9.1
9.6
5.4
3.5
0.6
7.1
4.9
3.8
2.3
24.4
5.6
1.2
0.90.1
0.04
0.922
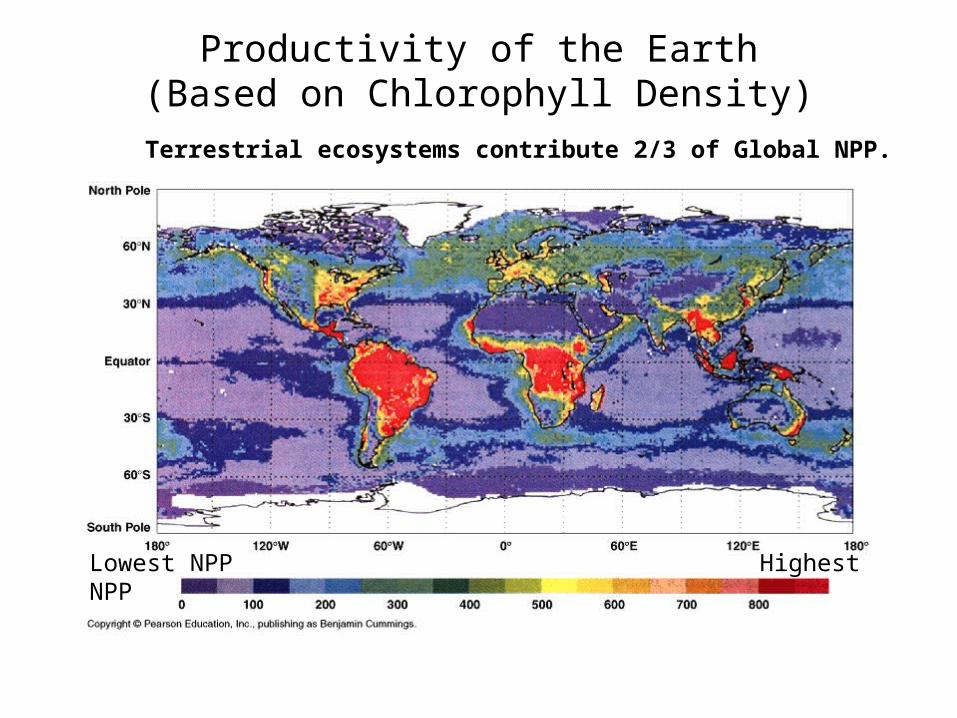
Productivity of the Earth(Based on Chlorophyll Density)
Lowest NPP Highest NPP
Terrestrial ecosystems contribute 2/3 of Global NPP.
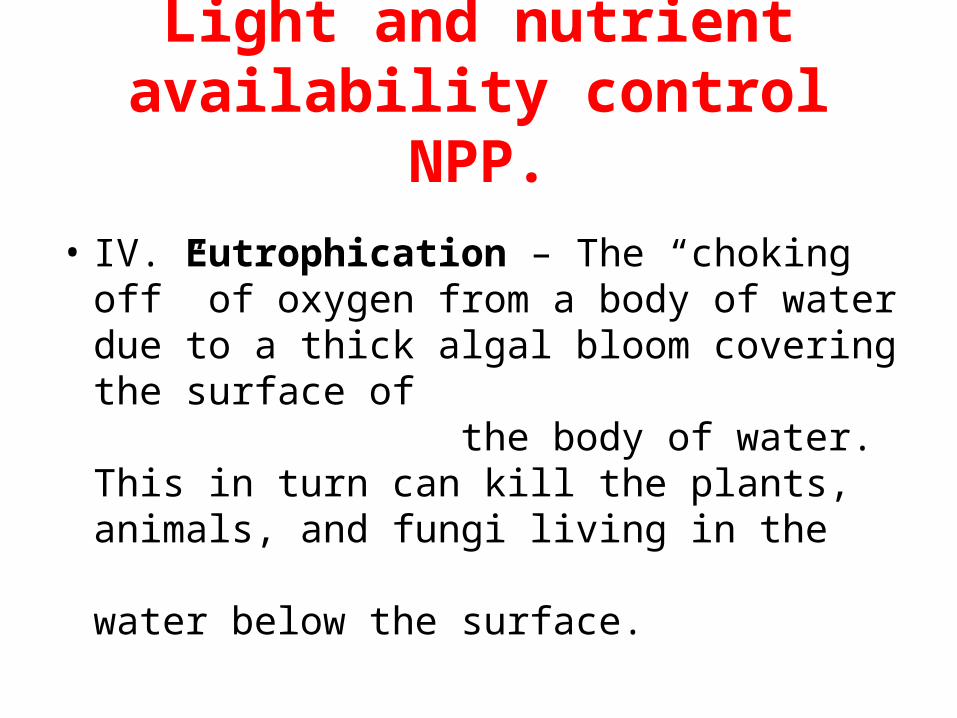
Light and nutrient availability control NPP.
• IV. Eutrophication – The “choking off” of oxygen from a body of water due to a thick algal bloom covering the surface of the body of water. This in turn can kill the plants, animals, and fungi living in the water below the surface.
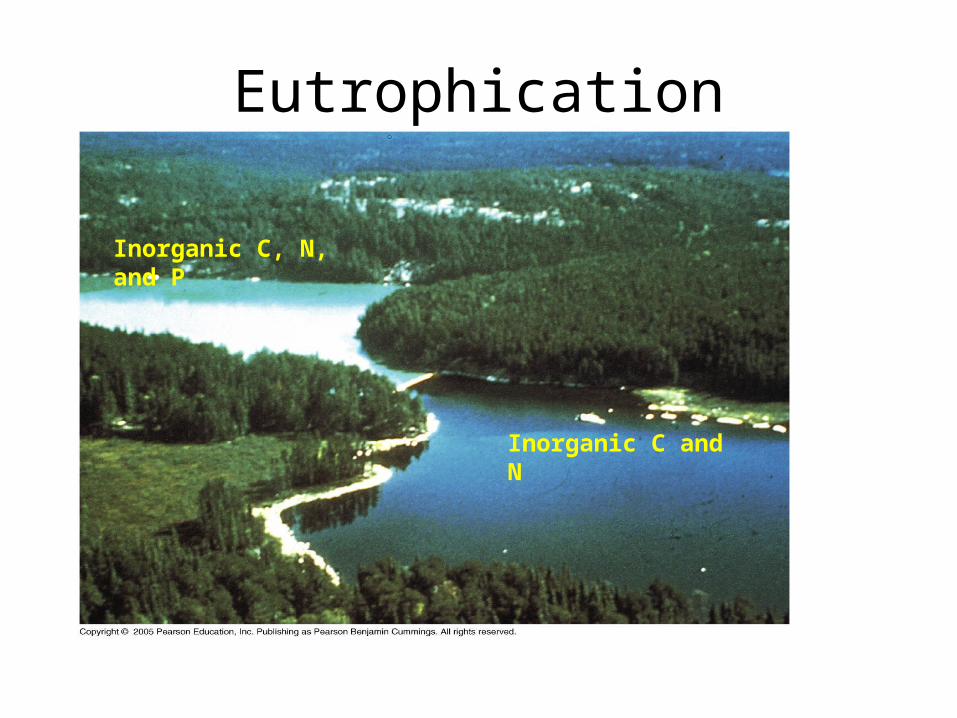
Eutrophication
Inorganic C, N, and P
Inorganic C and N
• Cultural Eutrophication- This is the result of sewage and fertilizers (P mainly, N, or K) being put into the body of water by runoff or dumping.
• The book Silent Spring by R. Carson talked extensively about this problem and the effects of it on the environment. The book was written in the 1960’s but it’s principles are still important today.

Rachel Carson
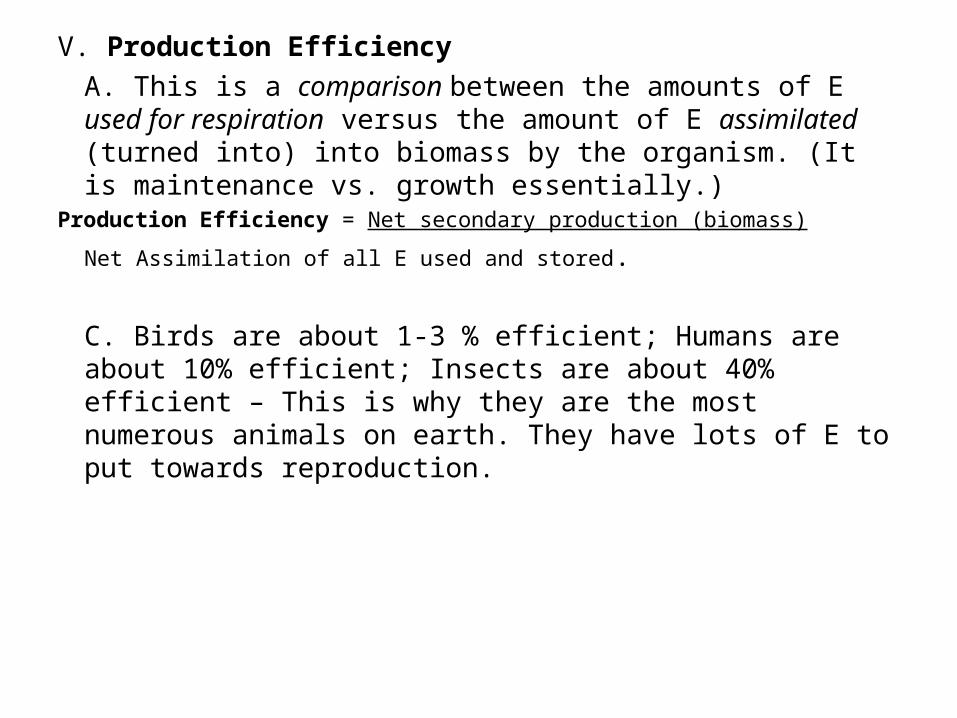
V. Production Efficiency A. This is a comparison between the amounts of E used for respiration versus the amount of E assimilated (turned into) into biomass by the organism. (It is maintenance vs. growth essentially.)
Production Efficiency = Net secondary production (biomass)
Net Assimilation of all E used and stored.
C. Birds are about 1-3 % efficient; Humans are about 10% efficient; Insects are about 40% efficient – This is why they are the most numerous animals on earth. They have lots of E to put towards reproduction.
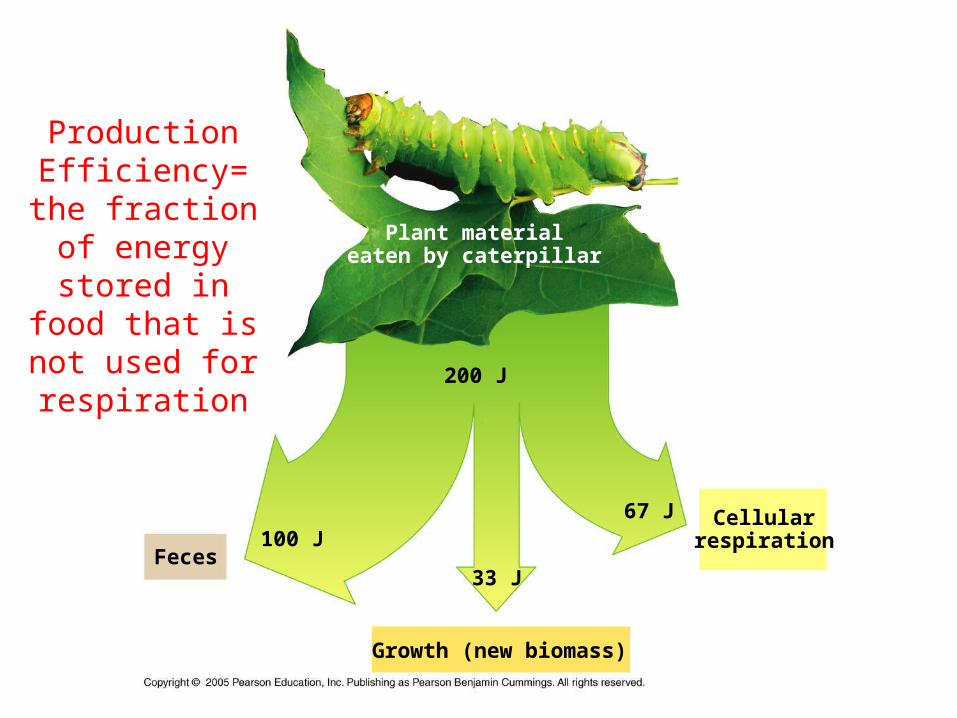
Production Efficiency= the
fraction of energy stored in food that
is not used for respiration
Growth (new biomass)
Cellularrespiration
Feces100 J
33 J
67 J
200 J
Plant materialeaten by caterpillar
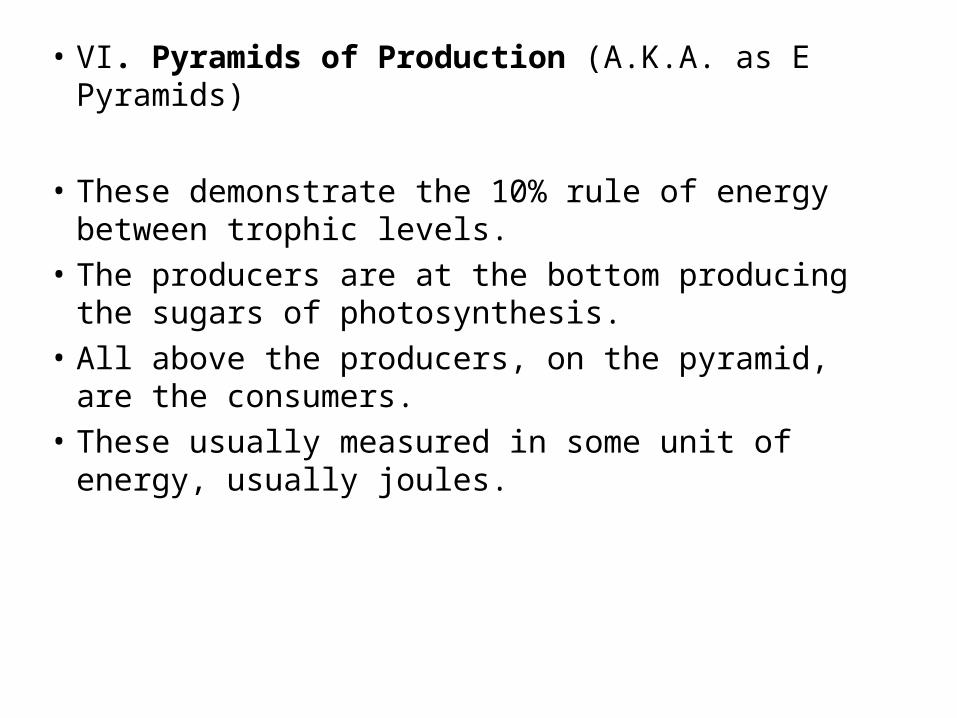
• VI. Pyramids of Production (A.K.A. as E Pyramids)
• These demonstrate the 10% rule of energy between trophic levels.
• The producers are at the bottom producing the sugars of photosynthesis.
• All above the producers, on the pyramid, are the consumers.
• These usually measured in some unit of energy, usually joules.
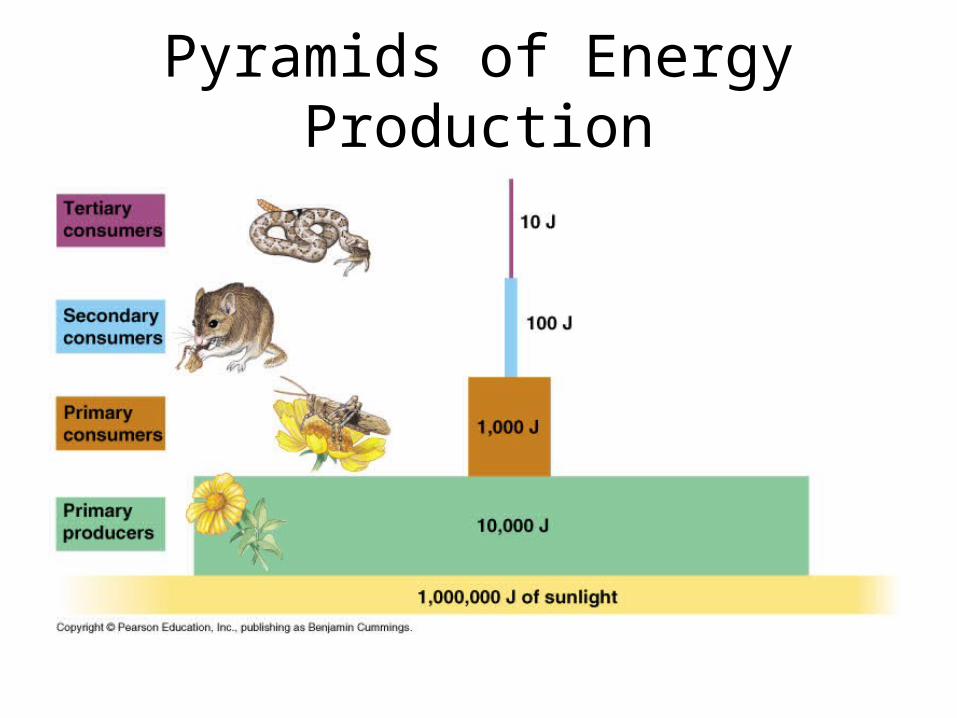
Pyramids of Energy Production
VII. Pyramids of Biomass - These, remember, are based on the total dry weight of the trophic level. – In terrestrial (land systems), the producers usually
outnumber, in biomass, the consumers trophic levels. • This creates the traditional shaped pyramid.
– In aquatic (water systems) such as the open ocean, the producers (phytoplankton) maybe outnumbered by the consumers such as whales and large fish.
• This creates an inverted (upside down) pyramid.
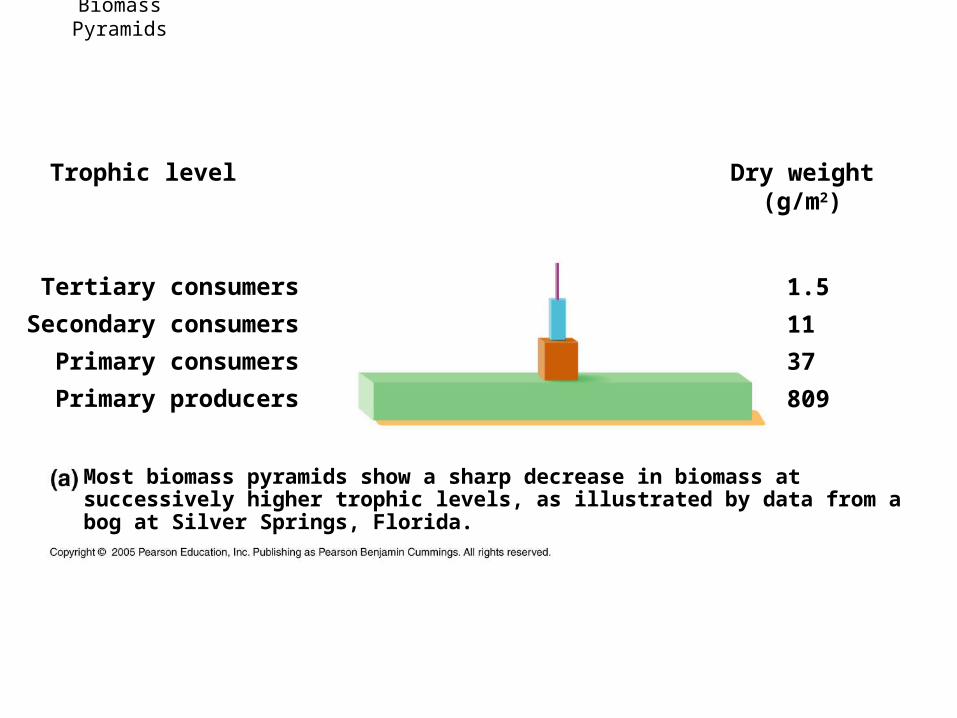
Biomass Pyramids
Trophic level Dry weight(g/m2)
Tertiary consumers
Secondary consumers
Primary consumers
Primary producers
1.5
11
37
809
Most biomass pyramids show a sharp decrease in biomass at successively higher trophic levels, as illustrated by data from a bog at Silver Springs, Florida.
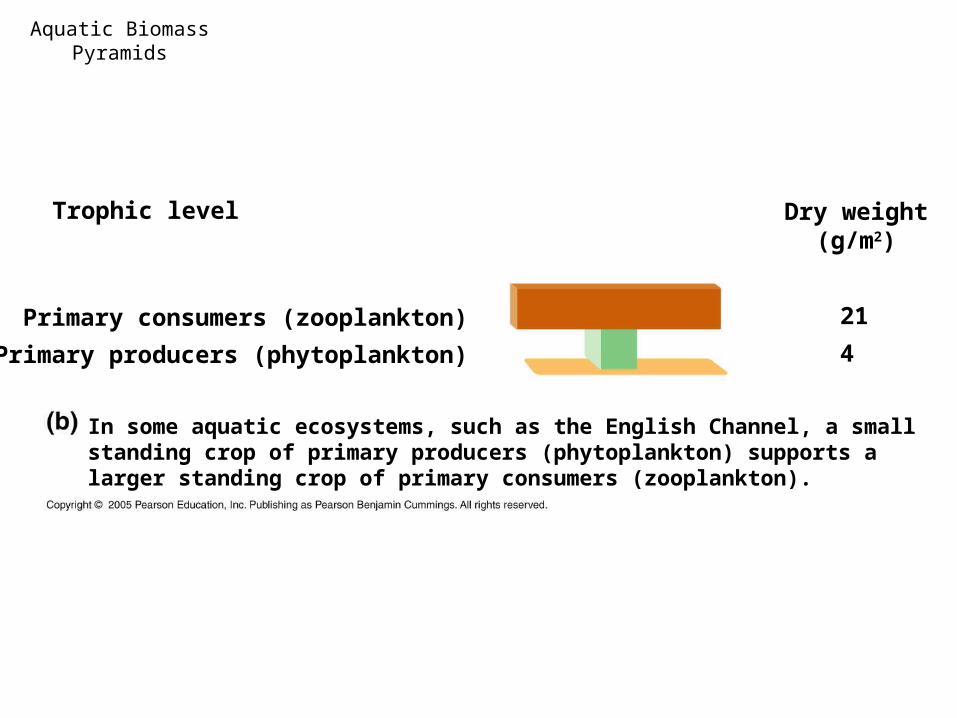
Aquatic Biomass Pyramids
Trophic level Dry weight(g/m2)
Primary consumers (zooplankton)
Primary producers (phytoplankton)
21
4
In some aquatic ecosystems, such as the English Channel, a small standing crop of primary producers (phytoplankton) supports a larger standing crop of primary consumers (zooplankton).
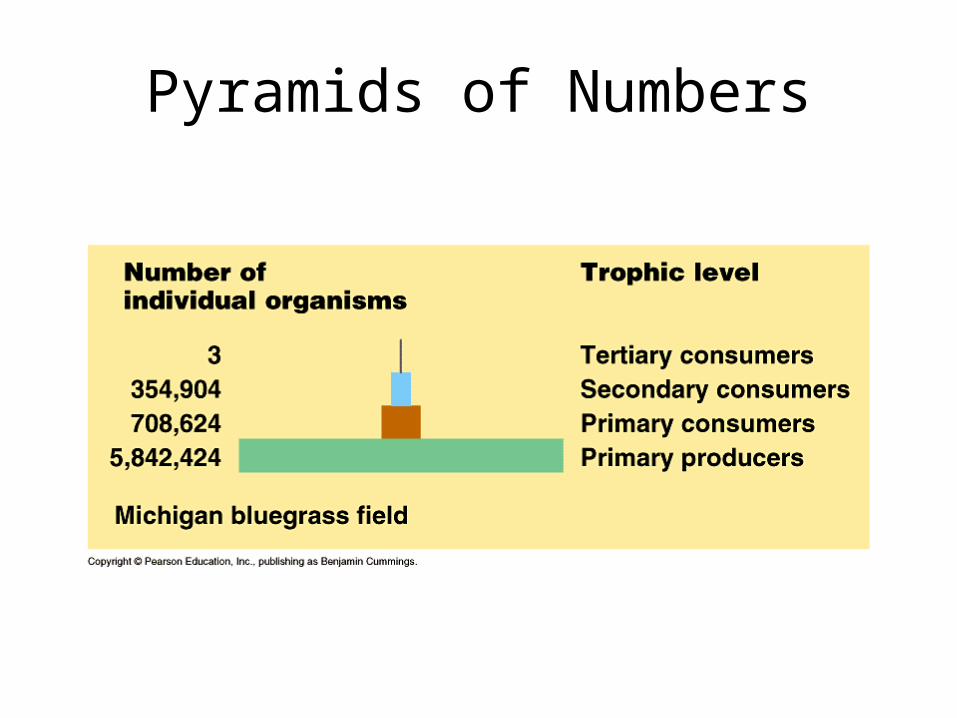
VIII. Pyramids of Numbers - These are created using population numbers. – The producers outnumber the consumers.– There will be less secondary consumers when
compared to primary consumers. – Each higher level in the pyramid will have fewer
numbers because of the ten percent rule limiting the energy available to support life.
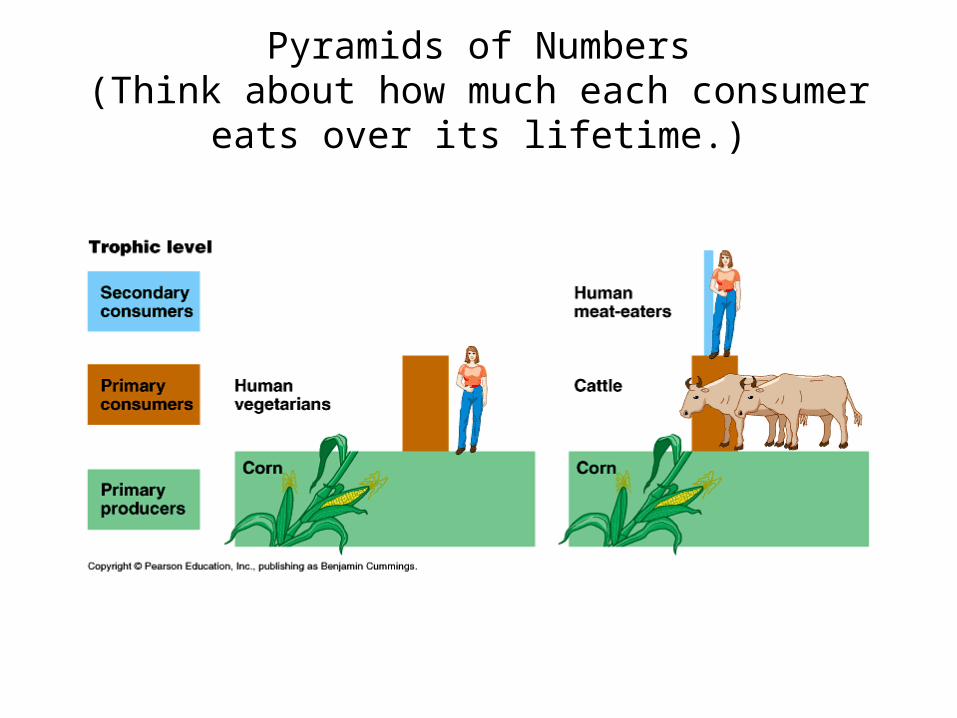
Pyramids of Numbers(Think about how much each consumer eats over its
lifetime.)
Pyramids of Numbers