Embed Size (px)
Citation preview

Contents
01 Financial Highlights
02 Chairman’s Statement
03 Chief Executive’s Review
06 Operating and Financial Review
22 Board of Directors
24 Directors’ Report
26 Report of the Directors on Corporate Governance
31 Report of the Directors on Remuneration
35 Independent Auditors’ Report
36 Income and Expenditure Accounts
37 Statements of Total Recognised Gains and Losses
37 Note of Historical Cost Profits and Losses
38 Group Balance Sheet
39 Society Balance Sheet
40 Consolidated Cash Flow Statement
41 Statement of Accounting Policies
45 Notes to the Accounts
79 Annual Business Statement
84 Index
We’re different because we’re abuilding society. We’re run for thebenefit of our members, and take pridein championing the rights of consumers.
Our principles of fairness, honestyand openness enable us to offer betterrates, fewer charges and an excellentlevel of service.
We’re committed to remaininga building society so that we cancontinue to offer these benefits tomembers now and in the future.
AN
NU
AL
RE
PO
RT
AN
D A
CC
OU
NT
S 2
00
4N
AT
ION
WID
E B
UIL
DIN
G S
OC
IET
Y
Nationwide Building Society, Head Office, Nationwide House, Pipers Way, Swindon SN38 1NW
©Nationwide Building Society
www.nationwide.co.uk
ANNUAL REPORT AND ACCOUNTS 2004
‘Our members are at the heart of our business’ Philip Williamson, Chief Executive

AN
NU
AL
RE
PO
RT
AN
D A
CC
OU
NT
S 2
00
4N
AT
ION
WID
E B
UIL
DIN
G S
OC
IET
Y
Nationwide Building Society, Head Office, Nationwide House, Pipers Way, Swindon SN38 1NW
©Nationwide Building Society
www.nationwide.co.uk
ANNUAL REPORT AND ACCOUNTS 2004
‘Our members are at the heart of our business’Philip Williamson, Chief Executive
We’re different because we’re a building society. We’re run for the benefit of our members, and take pride in championing the rights of consumers.
Our principles of fairness, honesty and openness enable us to offer better rates, fewer charges and an excellent level of service.
We’re committed to remaining a building society so that we can continue to offer these benefits to members now and in the future.
Contents
01 Financial Highlights
02 Chairman’s Statement
03 Chief Executive’s Review
06 Operating and Financial Review
22 Board of Directors
24 Directors’ Report
26 Report of the Directors on Corporate Governance
31 Report of the Directors on Remuneration
35 Independent Auditors’ Report
36 Income and Expenditure Accounts
37 Statements of Total Recognised Gains and Losses
37 Note of Historical Cost Profits and Losses
38 Group Balance Sheet
39 Society Balance Sheet
40 Consolidated Cash Flow Statement
41 Statement of Accounting Policies
45 Notes to the Accounts
79 Annual Business Statement
84 Index

Printed on Sovereign Silk, a triple coated, high white with Totally Chlorine Free virgin pulp from sustainable forests. Printed by wace, using production facilities certified by ISO 14001 and ISO 9000/2000.
We are the fourth largest provider of mortgages in the UK.
We are the third largest home for people’s savings in the UK.
Total assets passed the £100 billion mark in February 2004.
As a modern building society we deliver valuable benefits Nationwide. Proud to be different
to our members.
Total pricing benefits delivered since 1996 of nearly £3 billion.
The top financial services provider in the PressWatch Company Rankings survey for the third consecutive year.
0
10
20
30
40
50
60
70
00 01 02 03 040.0
0.2
0.4
0.6
0.8
1.0
1.2
00 01 02 03 040
10
20
30
40
50
60
70
80
90
00 01 02 03 04
Total assets over £100bn
£426.8m
of £588m
for the 15th
12.8%
2.7m
8%
Profit before tax
Pricing benefits
Efficiency improved
consecutive year
share of net residential mortgage advances
Over current accounts
Member savings increased by
Member savings Loans and advances Cost as a percentage balances (£bn) to customers (£bn) of mean total assets (%)

Financial Highlights
2000 2001 2002 2003 2004
Total assets (£m) 64,010.0 71,075.5 74,454.9 85,417.7 101,428.4
Loans and advances to customers (£m) 47,818.4 53,124.4 56,664.7 65,733.4 80,706.2
Total reserves (£m) 3,256.8 3,636.2 3,888.6 4,186.1 4,553.0
Costs as a percentage of mean total assets (%) 1.10 1.06 1.04 1.01 0.93
Member savings balances (£m) 41,646.4 49,672.7 55,460.8 60,952.2 65,943.9
Total capital (£m) 3,774.2 4,154.8 4,377.2 5,102.2 6,186.4
• Total assets up 19% from £85.4 billion to £101.4 billion.
• Costs as a percentage of mean total assets down for the 15th consecutive year to 0.93%.
• Gross capital rose to £6.2 billion from £5.1 billion.
• Loans and advances to customers up 23% from £65.7 billion to £80.7 billion.
• Retained £317.9 million of profit during the year to support the growth of the business.
0
20
40
60
80
100
120
00 01 02 03 040
1
2
3
4
5
6
7
00 01 02 03 040.0
0.5
1.0
1.5
2.0
2.5
3.0
3.5
4.0
4.5
5.0
00 01 02 03 04
Total assets (£bn) Total capital (£bn) Total reserves (£bn)
Nationwide Annual Report and Accounts 2004 1
2 Nationwide Annual Report and Accounts 20042 Nationwide Annual Report and Accounts 2004
Nationwide Annual Report and Accounts 2004 – Chairman’s Statement
Our total assets now exceed £101 billion and oursolvency ratio remains strong at 11.7%.
Chairman’s Statement
Last year the Society delivered £588 million of
pricing benefits to members and achieved post
tax profits of £317.9 million, a record total of
£906 million of member value. Our total assets
now exceed £101 billion and our solvency ratio
remains strong at 11.7%. We are the second
largest high street taker of retail savings
in an highly competitive market. By retaining
existing customers and attracting good quality
new business, we achieved a market share
of net mortgage lending of 12.8%, compared
with an historic market share of 7.9%, and are
now the fourth largest mortgage provider.
We aim to provide very competitive pricing on
our products, during the last twelve months,
our products appeared in ‘best buy’ tables in
newspapers over 1,500 times.
Jonathan Agnew, Chairman
As a mutual, we not only deliver financial value to our
members; we also seek to provide them with a high
level of service. Independent surveys show that in
most areas we achieve this. We continue, however,
to look for improvements in service and, when we
receive complaints, we try to deal with them in a fair
and sympathetic way.
We intend to continue to deliver value to our
members and have resolved to improve the efficiency
of our business over the next five years through
a challenging plan to contain the increase in the
Society’s costs to a significantly lower growth rate
than that of its income. During the year, we have
done, and we continue to do, a considerable amount
of work to control and reduce risk in the business.
Our successes in the year are attributable to the
commitment and professionalism of our employees,
led by our management, in meeting the needs
of members. The Board thanks them, on your behalf,
for their contribution and congratulates them on
the results.
Jonathan Agnew
Chairman
19 May 2004
We achieved a market share of netmortgage lending of 12.8%, compared with an historic market share of 7.9%.

Nationwide Annual Report and Accounts 2004 3
Chief Executive’s Review
It has been another outstanding year at
Nationwide, with members coming to, and
staying with us in record numbers. We have
demonstrated that as a modern mutual we can
achieve a strong financial performance while
still being able to deliver consistently good
value products and services to our members.
Great value productsDuring the year, we have continued to expand our
range of products and services. We launched two
fixed rate bonds – both of which offered exceptional
value and were exclusively available to those who
have been members for three years or more.
In the summer, we celebrated 50 years since the
Coronation with the launch of our Members’
Coronation Bond. It was followed later in the year
with our Members’ Christmas Bond. Both bonds
offered market-leading rates.
We have improved our hugely popular internet
savings account – e-Savings – by adding a guarantee
that the interest rate will match or better the Bank of
England base rate until the end of March 2005.
In response to feedback from our members, we’ve
also increased the maximum amount that can be
invested in e-Savings from £50,000 to £2 million.
The value we can offer as a mutual has been
recognised again this year by industry experts.
Over the past 12 months, we have picked up a string
of awards, including ‘Best Building Society’ from
Your Mortgage magazine, ‘Best Remortgage Lender’
from Mortgage magazine, and ‘Best Direct ISA
Provider’, ‘Best Direct Credit Card’ and ‘Best Direct
Travel Insurance Provider (family)’ from Your Money.
Fairness and transparencyAs well as delivering long-term good value, we
have continued to champion the cause of our
members. Our approach to mortgage pricing is a
prime example of how we’ve led by example –
making our full range of mortgage products equally
available to all borrowers. Recently, the Miles report
highlighted the iniquity that is common practice in
the mortgage market of loyal borrowers subsidising
new customers – confirming what we concluded
three years ago.
As the number of ‘convenience’ cash machines in
corner shops and other retail outlets has continued
to grow, our campaign on behalf of consumers
generally means that all such cash machines must
now display an early warning message when people
use them.
Philip Williamson, Chief Executive
The value we can offer as a mutualhas been recognised again this year by industry experts.
As a modern mutual we can achieve a strong financialperformance while still being able to deliver consistentlygood value products and services.

4 Nationwide Annual Report and Accounts 2004
Nationwide Annual Report and Accounts 2004 – Chief Executive’s Review
In October, we became the first financial services
organisation in the UK to publish a Summary Box on
all of our credit card literature. The new table
outlines key rates and charges, making it easier
for consumers to compare credit cards from
different providers.
World-class serviceOur reputation for providing good service was
underlined when we were ranked top by the
National Complaints Culture Survey, a report
endorsed by the Institute of Customer Service.
Furthermore, we were ranked as ‘world class’
in 10 out of 15 separate categories. The survey
canvassed the opinion of customers throughout
the UK and employees from over 40 organisations.
We handle in excess of 50 million transactions each
month, and regrettably there are occasions when
we don’t get things right, and sometimes complaints
arise. Even then, our continuing commitment to
delivering exceptional service and our attitude
towards complaints are such that we were able
to resolve over three quarters of them without
involving the Financial Ombudsman Service.
Improving accessWe continue to believe that our members should
be able to choose how they do business with us –
whether it’s by phone or post, online or in one of our
branches. One in five of our sales is now online or
over the telephone, and a quarter of our current
account holders use our internet banking service.
However, we remain committed to maintaining our
branch network and have invested £8.5 million in
refurbishing 19 branches and opening a new branch
in Halesowen. We’ve also opened nine new local
agencies in small towns and villages where a full
branch wouldn’t be financially viable, taking our
total number of agencies to 198.
To make it easier for people to move their current
account to Nationwide, we launched our ‘Switcher
Pack’. Branded ‘the 10-minute current account
cure’ – it only takes a few minutes to complete the
simple application form. From then on, we do
the rest, including contacting our member’s existing
bank, setting up standing orders and informing
the Direct Debit companies.
We’ve worked hard to make sure it’s as easy as
possible for our members to do business with us,
whatever their needs as an individual. Subject
to planning permission and where reasonably
practicable, all our branches will have level access by
October this year, when the Disability Discrimination
Act comes fully into force. Every time we refurbish
a branch we make sure it has a ground floor
interview room accessible for wheelchair users
and that the signage is suitable for partially sighted
members. To meet the needs of our members
whose first language is not English, our branches in
west London will soon be trialling a number of
initiatives, including wearing name badges and
displaying posters in languages that reflect their
local communities.
Member involvementWe have continued to listen to our members and,
where possible, make improvements based upon
their views and opinions. Last year alone, over
120,000 members were personally invited to attend
a series of Member TalkBack events, at which they
could discuss the issues that affect the running of
their Society with our executive and divisional
directors. For the benefit of the increasing number of
members who do business with us over the internet,
we also held two live debates online.
We now contact over 34,000 members every month
to ask them about the service and products they
receive from us, and their general perceptions of
Nationwide. In addition, our employees have
recorded over 120,000 pieces of member feedback
– from casual remarks to formal complaints – at the
point of engagement, helping us to understand and
respond to their views. For example, we have
improved our Bonus Saver account to allow
members to withdraw the annual bonus in the
month that it is paid, without affecting the
following year’s bonus.
Chief Executive’s Review (continued)
One in five of our sales is now onlineor over the telephone, and a quarterof our current account holders use our internet banking service.

Nationwide Annual Report and Accounts 2004 5
In the National Complaints Culture Survey, we were ranked as ‘world class’ in
10 out of 15 separate categories.
Our Annual General Meeting is another example
of how we have reacted to our members’ views.
Many of them told us that they would like to see the
meeting moved away from London to a more central
location, and therefore we will be holding this year’s
meeting in Birmingham.
Social and environmentalresponsibilityFollowing the publication last summer of our first
Sustainability Report, we have made good progress
in managing our impact on the environment and
the communities in which we serve. We now print
almost 80% of our marketing literature on recycled
paper and are piloting Fairtrade coffee at our main
administration centres. We have also significantly
reduced our carbon emissions by buying, supply
permitting, electricity from renewable sources.
We will be publishing our second Sustainability
Report on our website – www.nationwide.co.uk –
this summer.
We have continued to support many worthy causes,
including our flagship charity – Macmillan. Through
events such as ‘The World’s Biggest Coffee Morning’
and ‘The Big Hush’, employees and members have
raised more than £3 million for the cancer charity
since 1993. Our partnership with the Local Heritage
Initiative is now helping over 800 groups investigate,
explain and care for their local landscape, landmarks
and traditions. Most of the projects bring together
over 100 members in each community, and three
quarters of them involve young people.
Since the inception of our associated charity,
The Nationwide Foundation, six years ago, it has
supported charities and ‘not for profit’ groups with
donations of more than £15 million. In particular,
it has continued to support the New Generation
Initiative, a collaborative project involving five
national charities that seeks to address many of
the difficult issues of parenting.
Our peopleWe are particularly pleased with the development
of our culture at Nationwide and that, having
continued to invest in our employees, we moved up to
18th in the list of the ‘100 Best Companies to Work
For’, published in The Sunday Times. We were the
highest placed financial services provider for the third
year running – an achievement that was particularly
satisfying because 80% of our total score was based
on what our employees said about what it is like to
work for Nationwide. We will publish further details
about our performance as an employer in our
Sustainability Report.
In contrast to the current trend for relocating call
centres abroad, we remain committed to keeping
Nationwide’s in the UK. Our call centres in Swindon,
Northampton and Swansea employ around 800
people between them, reinforcing our links with the
communities from which we have grown. Such is
our commitment to safeguarding jobs in this country
that we are opening another call centre in Sheffield
this summer.
Finally, I would like to add my thanks to those
expressed by the Chairman and the Board to our
employees. It is their energy, enthusiasm and desire
to deliver best value for the benefit of all our
members that are at the heart of our continued
success. I consider myself very fortunate to work
with such a great group of people.
Philip Williamson
Chief Executive
19 May 2004
We moved up to 18th in the list of the‘100 Best Companies to Work For’,published in The Sunday Times.
Nationwide Annual Report and Accounts 2004 – Operating and Financial Review
6 Nationwide Annual Report and Accounts 2004
Operating and Financial Review
We have continued to develop our distribution
channels and this has been a major factor in
increasing our market share of net mortgage lending.
During the year we refurbished 19 branches (2003 –
17) and opened a new branch office in Halesowen.
The strength of Nationwide’s retail franchise is key to
our strategy and enabled us to continue to increase
our level of retail funding.
MortgagesThe Nationwide Group achieved an exceptional
£13.2 billion of net lending in 2003/04, representing
a market share of 12.8% against a par market share
of 7.9%. During the year we overtook Barclays
to become the fourth largest lender in the UK.
• The UK experienced a strong mortgage market
driven by an increase in re-mortgaging by
existing homeowners. Over £285 billion was
lent to borrowers with re-mortgaging accounting
for nearly 45%. The growth in re-mortgaging
reflected the intense competition in the market,
with consumers being more willing to move
providers in search of a better deal.
• The Society’s gross lending was £22.5 billion,
an estimated market share of 7.9%. The
Society was particularly successful in attracting
re-mortgage business, gaining an estimated
share of 9.5% of the re-mortgage market.
• We were highly successful in retaining borrowers.
This excellent performance was partly driven by
our policy of charging between 0.75% to 1.00%
less interest on our standard variable rate
mortgage compared with our competitors. Good
service and an active policy of customer contact
also helped us to retain borrowers with maturing
fixed rate and tracker rate mortgage products.
Our 6.1% market share of principal repaid in the
Group was well below our mortgage par share
of 7.9%. We estimate this excellent retention
performance contributed £4.5 billion to our total
net mortgage lending.
Nationwide achieved its strategic goals of
delivering value to its membership, combined
with a healthy profit to support continued
investment in the Society and the future growth
of the balance sheet. Our success in delivering
a broad range of financial services products
enabled us to increase total assets by 19% from
£85.4 billion last year to £101.4 billion and
generated a Profit Before Tax of £426.8 million
(2003 – £353.3 million).
During the year we generated over £588 million in
the form of pricing benefit to our members by
offering better rates and by charging lower fees and
charges than our competitors. Over the medium term
we aim to fund our growth through retained profits.
This year we retained £317.9 million, an increase of
21% on last year, to support the strong 19% growth
in our assets over the year. We also invested in
our infrastructure and in our people to develop a
modern business.
Our member base grew by 370,000 during the year
to 11 million. Our members’ crossholdings of product
groups improved from 1.64 last year to 1.70.
Graham Beale, Group Finance Director
Our success in delivering a broad range of financialservices products enabled us to increase total assetsby 19% from £85.4 billion last year to £101.4 billion.
Operating Review

Nationwide Annual Report and Accounts 2004 7
• UCB Home Loans, the Society’s specialist mortgage
lender, also recorded a strong performance with
gross mortgage advances of £1.9 billion (2003 –
£1.6 billion). UCBHL deals mainly with self
certified mortgages, for borrowers who find it
difficult to obtain loans from mainstream lenders,
and with Buy to Let applications.
We provide a comprehensive range of very
competitive mortgage products both directly,
through branches, over the phone, via the internet,
and through intermediaries. Unlike the majority of
other lenders all of our mortgage products are
available to both existing and to new customers. We
believe it is unfair to offer attractive deals to new
customers which are not available to long standing
existing customers, a view recently endorsed by
Professor David Miles.
Asset quality remains very strong. Our responsible
approach to lending has ensured that our arrears
levels are better than industry averages.
The average loan to value (LTV) of new residential
mortgage lending was 52%, while the estimated
LTV of our total book is 38%.
LTV Band % of book Cumulative
0%-50% 57.5% 57.5%
51%-75% 32.8% 90.3%
76%-90% 9.0% 99.3%
91%-95% 0.7% 100.0%
96%-100% 0.0%
Total 100.0%
Mortgage arrears (3 months or more) reduced by
28% from £10.5 million to £7.6 million over the past
twelve months. The analysis of the residential
mortgage book by arrears time band is:
Number of cases 2003/04 2002/03
No arrears 97.7% 96.8%
0 – 3 months arrears 2.0% 2.7%
3 – 6 months arrears 0.2% 0.3%
6+ months arrears 0.1% 0.2%
Total 100.0% 100.0%
At 4 April 2004 we had only 56 properties in
possession (2003 – 139) out of a total of 1,145,000
mortgage cases.
SavingsThe competition for retail funds intensified during
the year amongst savings providers, including
National Savings. Despite this increased competition,
we achieved a 6.9% share of the overall increase
in UK retail savings (2003 – 10.4%), representing
£5.0 billion (2003 – £5.5 billion) with total retail
member deposits as at 4 April 2004 amounting to
£65.9 billion (2003 – £60.9 billion).
The great majority of our retail funding is in the form
of UK retail member deposits. In addition, we accept
offshore deposits and deposits which do not convey
member status. We are the third largest deposit
taker in the UK (second largest high street provider),
and our savings accounts were, on average, 0.43%
better priced that those of our competitors.
Strong savings flows were primarily driven by our
e-Savings and fixed rate bond products. We also
launched two special bonds available only to existing
members: a Coronation Bond at a fixed rate of 4.50%
and a Christmas Bond at a fixed rate of 5.25%.
Banking & Consumer Lending –Personal LoansPersonal loans are offered through the Society’s
personal loans subsidiary, Nationwide Trust Limited.
Gross advances amounted to £929 million (2003 –
£763 million), driven by our strategy of offering keener
pricing combined in a single rate available to all
borrowers irrespective of the amount borrowed. Loans
are sold through our retail network, over the telephone
and through the internet. Nationwide Trust has in
excess of 230,000 unsecured personal loan customers.
A national trend during 2003/04 was the continued
growth in unsecured debt, which is at record levels.
While the low interest rate, low unemployment
environment means that the debt service burden is
currently very manageable, the rate at which debt is
being accumulated is less sustainable. There is clearly
The Nationwide Group achieved an exceptional£13.2 billion of net lending in 2003/04, representing amarket share of 12.8% against a par market share of 7.9%.
Asset quality remains very strong. Our responsible approach to lendinghas ensured that our arrears levels arebetter than industry averages.

Nationwide Annual Report and Accounts 2004 – Operating and Financial Review
8 Nationwide Annual Report and Accounts 2004
Operating and Financial Review (continued)
customers now regularly use our internet banking
service and over 1.7 million members are registered
to use Nationwide’s online banking service.
The Society opened over 508,000 new FlexAccounts
during the year (2003 – 382,000) taking the total
number of accounts held to 2.7 million, an increase in
the year of 17%.
General InsuranceDuring the year over 529,000 general insurance
covers were sold and our general insurance book
stood at over 1.6 million covers as at 4 April 2004.
The primary general insurance products we sell are:
• buildings and contents insurance;
• travel insurance;
• payment protection policies;
• motor and personal accident insurance.
We typically use leading insurers as third-party
underwriters. This provides us with an important
source of non-interest income and in 2003/04 we
earned £75.5 million (2003 – £71.6 million) from
commission and profit share.
Life InsuranceWe underwrite two types of insurance product;
term life assurance and critical illness cover.
Over 96,000 life products were sold during the year
representing a 14% increase over last year (2003 –
84,000 products).
We also provide our customers with a range of
personal investment products, including, unit trusts,
pension contracts, guaranteed equity bonds and
equity individual savings accounts (ISAs). At 4 April
2004 our range of unit trust investment products
held by our customers had a market value of
approximately £1.7 billion (2003 – £1.2 billion).
Our life insurance subsidiary is consolidated in the
Group using the embedded value method. The
change in the value of the long term life assurance
business is included within other operating income
and was similar to last year at £44.8 million (2003 –
£43.7 million).
a responsibility on lenders to apply prudent criteria
and make sensible lending decisions, but individuals
need to be realistic too. We adopt a cautious
approach to all of our lending activities, particularly
unsecured lending. Last year we rejected one in
every two unsecured loan applications received and
our credit assessment process looks at the impact of
an assumed increase in interest rates to determine a
borrower’s ability to service their debt in more
difficult economic conditions.
Banking & Consumer Lending –Credit Cards We issued 222,000 new credit card accounts (2003 –
178,000) taking total cards in issue to 868,000
(2003 – 631,000). Balances outstanding on credit
cards as at 4 April 2004 amounted to £472 million
(2003 – £392 million).
With over 1,300 brands available in the UK, offering
a variety of rates, fees, terms and conditions, the
credit card market is complex. As part of our drive
for greater transparency, Nationwide was the first
UK card provider to publish a credit card comparison
table to help consumers make an informed choice
and successfully lobbied for it to be adopted by all
card providers.
Banking & Consumer Lending –Current AccountsThe Society’s current account, FlexAccount, is a key
product in developing and retaining customer
relationships. We offer a highly competitive account
with a range of good value features including up to
2.25% credit interest. More than 23% of FlexAccount
Nationwide was the first UK card provider to publish a credit cardcomparison table to help consumers make an informed choiceand successfully lobbied for it to beadopted by all card providers.

Nationwide Annual Report and Accounts 2004 9
Commercial LendingCommercial mortgage lending accounted for 14%
of our total lending as at 4 April 2004, with balances
outstanding of £12.1 billion (2003 – £10.6 billion).
Gross advances of £4.1 billion reflected a record year
in all three business units which deal with loans:
• to U.K. registered social landlords secured on
residential property;
• secured on commercial property; and
• to support Private Finance Initiatives.
Asset quality remains strong. Commercial lending
arrears levels of three months or more have improved
year on year from 167 to 87 cases. Arrears balances
were £3.8 million (2003 – £4.5 million) representing
a 16% decrease, equivalent to 0.03% of the total
book (2003 – 0.04%).
We are one of the largest lenders to U.K. registered
social landlords by amount of assets lent. The
number of registered social landlords continued to
increase during the year, as local government
transfer their municipal housing stocks to private
organisations.
Private Finance Initiative (PFI) schemes are being used
to fund improvements to local authority housing
stock and the development of new social housing, as
well as for other initiatives such as the development
of new schools and hospitals. We saw an increase in
PFI business during the year and this is expected to
grow further next year. Advances on PFI loans
amounted to £251 million (2003 – £143 million) as
Nationwide establishes itself as a major player in this
emerging market.
TreasuryTotal wholesale funding was increased by £9.4 billion,
mainly in support of lending growth. At 4 April 2004,
wholesale balances stood at £26.8 billion (2003 –
£17.4 billion) representing a funding ratio of 28.9%.
During the year the Society has enjoyed a strong
appetite from wholesale funding investors and has
operated successful Medium Term Note (MTN)
programmes in the Dollar, Euro and Sterling markets.
In addition to raising wholesale funds we also raised
capital in the year:
• £341.9 million of subordinated debt (within
the US MTN programme);
• £400 million of Permanent Interest Bearing
Shares (PIBS).
Liquidity balances totalled £17.4 billion at 4 April
2004 (2003 – £17 billion) representing 18.8% of
shares and borrowings (2003 – 21.7%).
Pricing BenefitThe Pricing Benefit we generate for our members
is calculated by comparing the price of each of
our products (including interest rates, fees and
charges) against the equivalent products of our
main competitors.
Pricing Benefit distributed
to members 2003/04 2002/03
£m £m
Benefit to borrowers 223 220
Benefit to savers 236 200
Benefit to members
with other products 129 90
Total 588 510
The measurement of the pricing benefit includes
the benefits arising from fixed and tracker rate
mortgage and fixed interest savings products. This
reflects the growing popularity and importance of
these products to our savers and borrowers. In
2002/03 and previous years we have excluded the
pricing benefits attaching to these products.
As a mutual organisation our strategy and policiesare designed to put our members first, to maintain
our financial strength and to safeguard our assets.

Nationwide Annual Report and Accounts 2004 – Operating and Financial Review
10 Nationwide Annual Report and Accounts 2004
RegulationAs a mutual organisation our strategy and policies
are designed to put our members first, to maintain
our financial strength and to safeguard our assets.
We aim to maintain a relatively low risk profile
and to comply fully with all relevant rules and
regulations.
A key theme of our regulator is ‘treating customers
fairly’ and we strive to ensure that we remain ahead
of our competitors in this regard. In particular, we
welcome the introduction of new regulation of
mortgages later in 2004 and general insurance early
in 2005 and we are actively preparing for the
necessary changes that this will entail.
International AccountingStandards (IAS)The Group, in common with other listed institutions in
the European Union, is required to prepare its Annual
Report and Accounts under International Financial
Reporting Standards (also referred to as International
Accounting Standards) for accounting periods
commencing on or after 1 January 2005.
A key theme of our regulator is‘treating customers fairly’ and we strive to ensure that we remain aheadof our competitors in this regard.
Operating and Financial Review (continued)
We are making good progress in our preparation to
produce IAS compliant Annual Accounts. Necessary
systems changes are being implemented and revised
accounting policies under IAS are currently
being drafted.
Basel 2We have made significant investment to ensure
we are compliant with the Basel 2 Capital Accord
when it is introduced in 2007. Ongoing work
includes the development of risk management
systems that will form the core element of our future
management information systems and reporting.
We believe the composition of our business and the
quality of our asset base will lead to Nationwide
potentially benefiting from a lower regulatory capital
requirement under the new regime.
Nationwide Annual Report and Accounts 2004 11
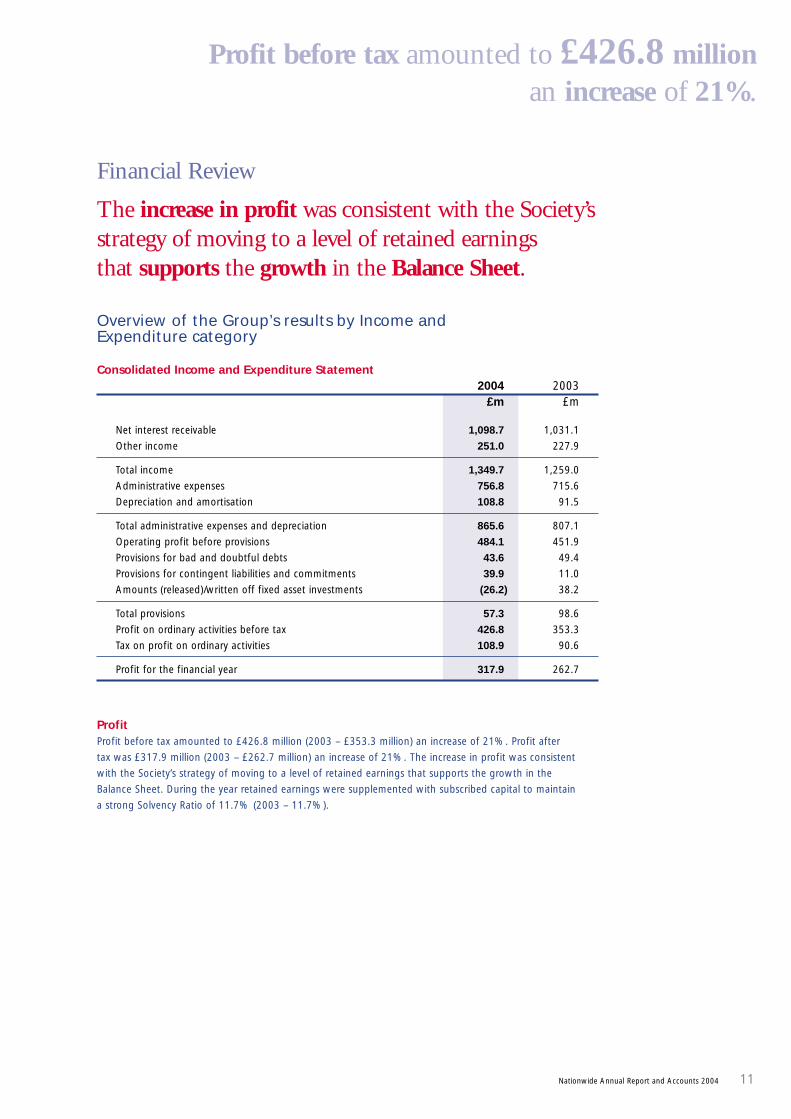
Overview of the Group’s results by Income andExpenditure category
Consolidated Income and Expenditure Statement2004 2003
£m £m
Net interest receivable 1,098.7 1,031.1
Other income 251.0 227.9
Total income 1,349.7 1,259.0
Administrative expenses 756.8 715.6
Depreciation and amortisation 108.8 91.5
Total administrative expenses and depreciation 865.6 807.1
Operating profit before provisions 484.1 451.9
Provisions for bad and doubtful debts 43.6 49.4
Provisions for contingent liabilities and commitments 39.9 11.0
Amounts (released)/written off fixed asset investments (26.2) 38.2
Total provisions 57.3 98.6
Profit on ordinary activities before tax 426.8 353.3
Tax on profit on ordinary activities 108.9 90.6
Profit for the financial year 317.9 262.7
ProfitProfit before tax amounted to £426.8 million (2003 – £353.3 million) an increase of 21%. Profit after
tax was £317.9 million (2003 – £262.7 million) an increase of 21%. The increase in profit was consistent
with the Society’s strategy of moving to a level of retained earnings that supports the growth in the
Balance Sheet. During the year retained earnings were supplemented with subscribed capital to maintain
a strong Solvency Ratio of 11.7% (2003 – 11.7%).
Financial Review
The increase in profit was consistent with the Society’sstrategy of moving to a level of retained earningsthat supports the growth in the Balance Sheet.
Profit before tax amounted to £426.8 million an increase of 21%.
Nationwide Annual Report and Accounts 2004 – Operating and Financial Review
12 Nationwide Annual Report and Accounts 2004
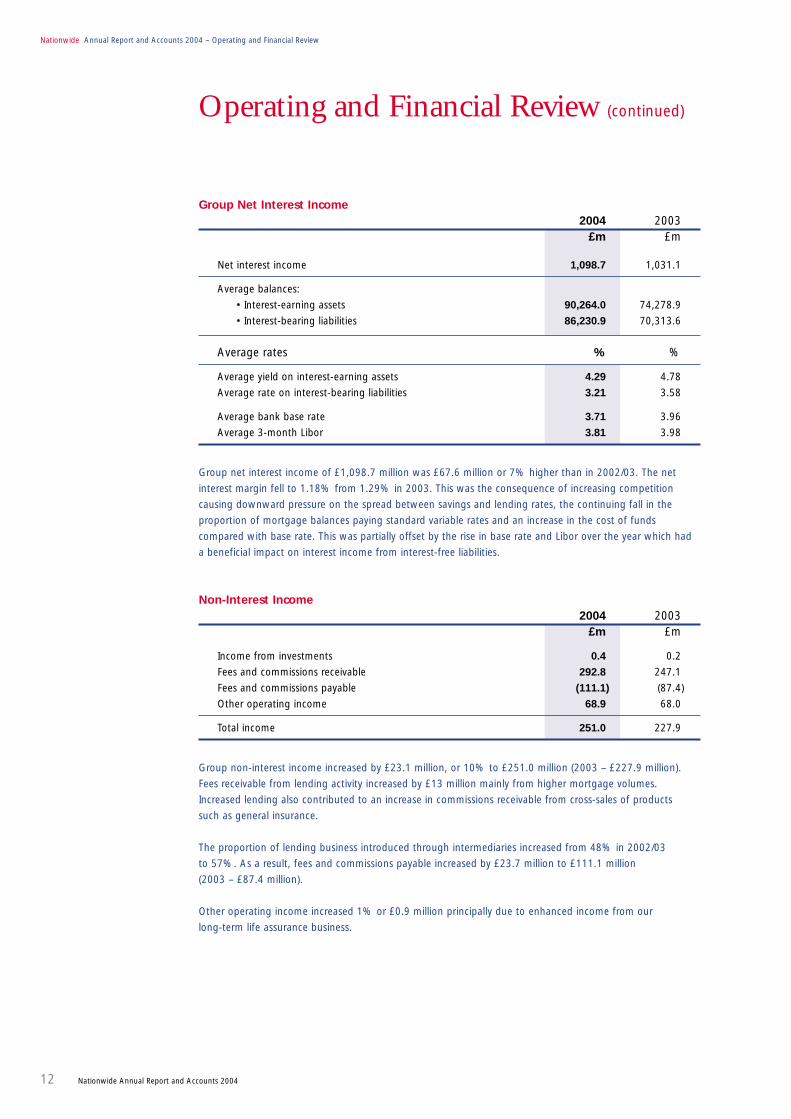
Group Net Interest Income2004 2003
£m £m
Net interest income 1,098.7 1,031.1
Average balances:
• Interest-earning assets 90,264.0 74,278.9
• Interest-bearing liabilities 86,230.9 70,313.6
Average rates % %
Average yield on interest-earning assets 4.29 4.78
Average rate on interest-bearing liabilities 3.21 3.58
Average bank base rate 3.71 3.96
Average 3-month Libor 3.81 3.98
Group net interest income of £1,098.7 million was £67.6 million or 7% higher than in 2002/03. The net
interest margin fell to 1.18% from 1.29% in 2003. This was the consequence of increasing competition
causing downward pressure on the spread between savings and lending rates, the continuing fall in the
proportion of mortgage balances paying standard variable rates and an increase in the cost of funds
compared with base rate. This was partially offset by the rise in base rate and Libor over the year which had
a beneficial impact on interest income from interest-free liabilities.
Non-Interest Income2004 2003
£m £m
Income from investments 0.4 0.2
Fees and commissions receivable 292.8 247.1
Fees and commissions payable (111.1) (87.4)
Other operating income 68.9 68.0
Total income 251.0 227.9
Group non-interest income increased by £23.1 million, or 10% to £251.0 million (2003 – £227.9 million).
Fees receivable from lending activity increased by £13 million mainly from higher mortgage volumes.
Increased lending also contributed to an increase in commissions receivable from cross-sales of products
such as general insurance.
The proportion of lending business introduced through intermediaries increased from 48% in 2002/03
to 57%. As a result, fees and commissions payable increased by £23.7 million to £111.1 million
(2003 – £87.4 million).
Other operating income increased 1% or £0.9 million principally due to enhanced income from our
long-term life assurance business.
Operating and Financial Review (continued)
Nationwide Annual Report and Accounts 2004 13
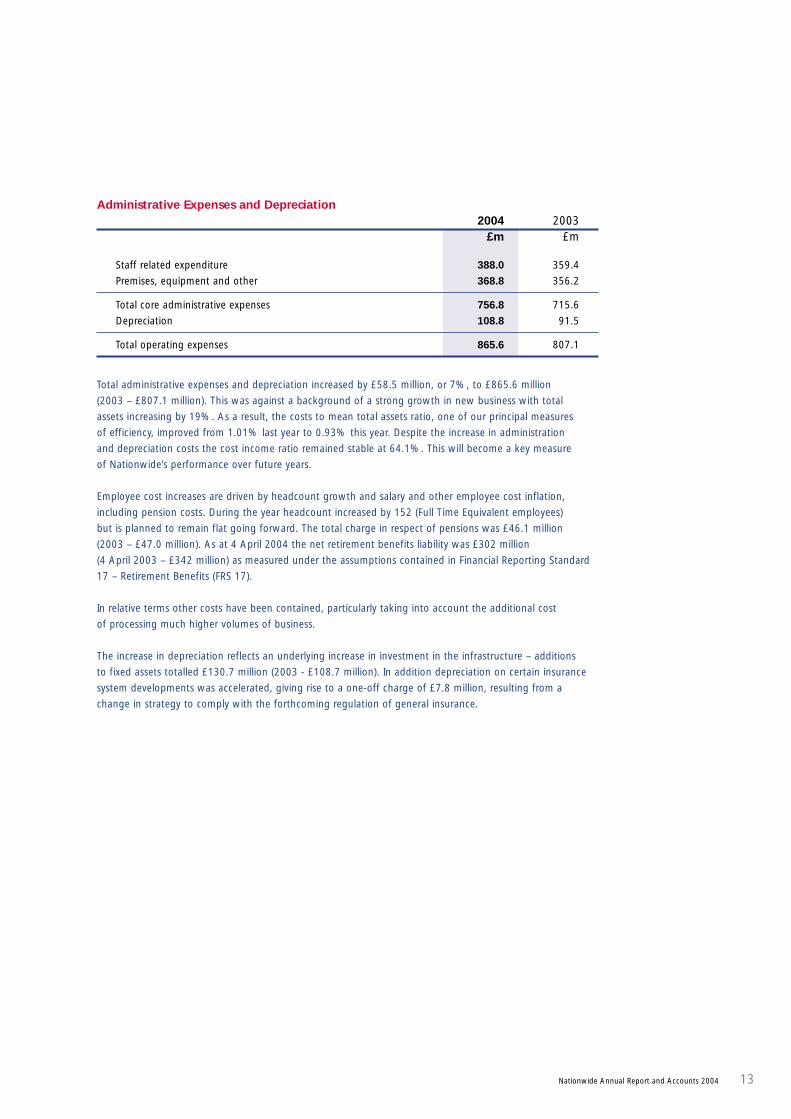
Administrative Expenses and Depreciation2004 2003
£m £m
Staff related expenditure 388.0 359.4
Premises, equipment and other 368.8 356.2
Total core administrative expenses 756.8 715.6
Depreciation 108.8 91.5
Total operating expenses 865.6 807.1
Total administrative expenses and depreciation increased by £58.5 million, or 7%, to £865.6 million
(2003 – £807.1 million). This was against a background of a strong growth in new business with total
assets increasing by 19%. As a result, the costs to mean total assets ratio, one of our principal measures
of efficiency, improved from 1.01% last year to 0.93% this year. Despite the increase in administration
and depreciation costs the cost income ratio remained stable at 64.1%. This will become a key measure
of Nationwide’s performance over future years.
Employee cost increases are driven by headcount growth and salary and other employee cost inflation,
including pension costs. During the year headcount increased by 152 (Full Time Equivalent employees)
but is planned to remain flat going forward. The total charge in respect of pensions was £46.1 million
(2003 – £47.0 million). As at 4 April 2004 the net retirement benefits liability was £302 million
(4 April 2003 – £342 million) as measured under the assumptions contained in Financial Reporting Standard
17 – Retirement Benefits (FRS 17).
In relative terms other costs have been contained, particularly taking into account the additional cost
of processing much higher volumes of business.
The increase in depreciation reflects an underlying increase in investment in the infrastructure – additions
to fixed assets totalled £130.7 million (2003 - £108.7 million). In addition depreciation on certain insurance
system developments was accelerated, giving rise to a one-off charge of £7.8 million, resulting from a
change in strategy to comply with the forthcoming regulation of general insurance.
Nationwide Annual Report and Accounts 2004 – Operating and Financial Review
14 Nationwide Annual Report and Accounts 2004
Operating and Financial Review (continued)
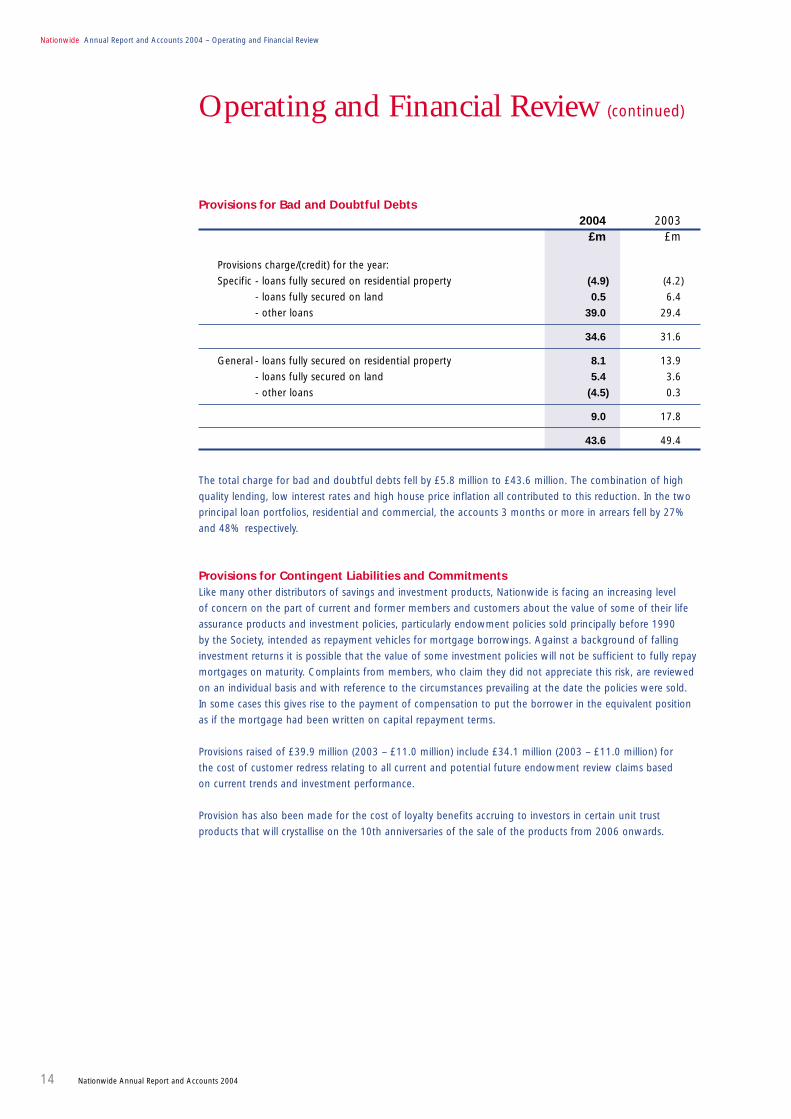
Provisions for Bad and Doubtful Debts2004 2003
£m £m
Provisions charge/(credit) for the year:
Specific - loans fully secured on residential property (4.9) (4.2)
- loans fully secured on land 0.5 6.4
- other loans 39.0 29.4
34.6 31.6
General - loans fully secured on residential property 8.1 13.9
- loans fully secured on land 5.4 3.6
- other loans (4.5) 0.3
9.0 17.8
43.6 49.4
The total charge for bad and doubtful debts fell by £5.8 million to £43.6 million. The combination of high
quality lending, low interest rates and high house price inflation all contributed to this reduction. In the two
principal loan portfolios, residential and commercial, the accounts 3 months or more in arrears fell by 27%
and 48% respectively.
Provisions for Contingent Liabilities and CommitmentsLike many other distributors of savings and investment products, Nationwide is facing an increasing level
of concern on the part of current and former members and customers about the value of some of their life
assurance products and investment policies, particularly endowment policies sold principally before 1990
by the Society, intended as repayment vehicles for mortgage borrowings. Against a background of falling
investment returns it is possible that the value of some investment policies will not be sufficient to fully repay
mortgages on maturity. Complaints from members, who claim they did not appreciate this risk, are reviewed
on an individual basis and with reference to the circumstances prevailing at the date the policies were sold.
In some cases this gives rise to the payment of compensation to put the borrower in the equivalent position
as if the mortgage had been written on capital repayment terms.
Provisions raised of £39.9 million (2003 – £11.0 million) include £34.1 million (2003 – £11.0 million) for
the cost of customer redress relating to all current and potential future endowment review claims based
on current trends and investment performance.
Provision has also been made for the cost of loyalty benefits accruing to investors in certain unit trust
products that will crystallise on the 10th anniversaries of the sale of the products from 2006 onwards.
Nationwide Annual Report and Accounts 2004 15
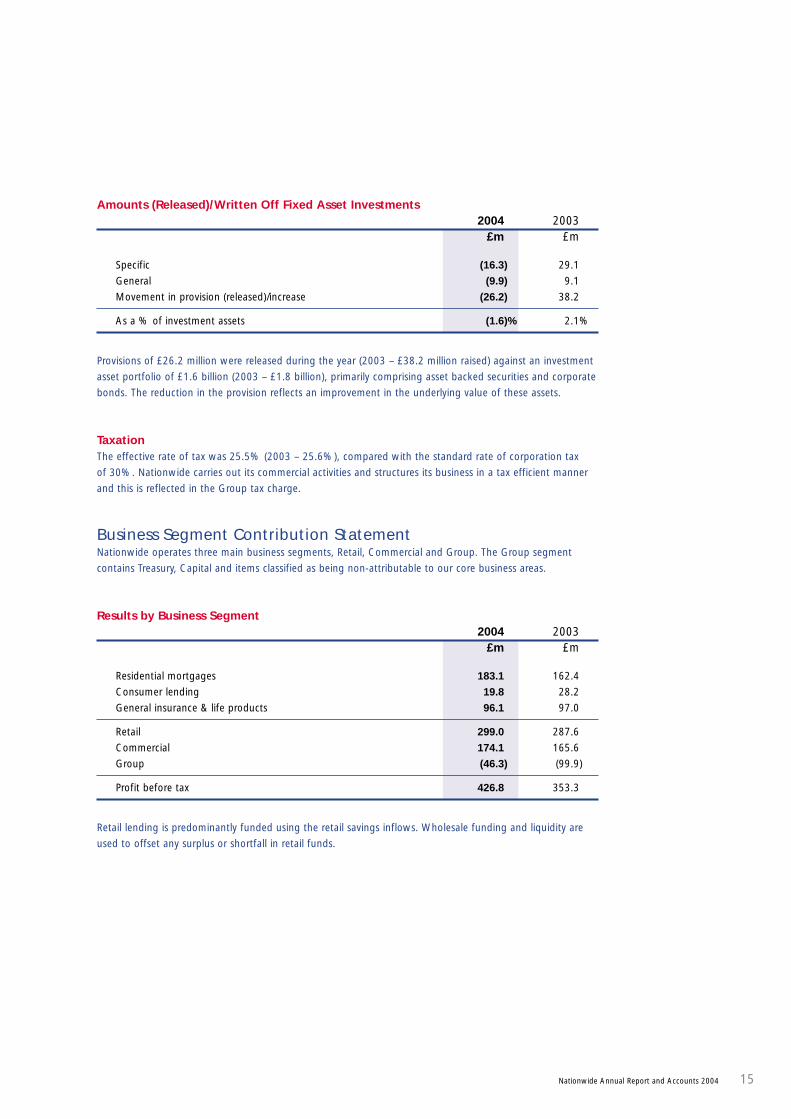
Amounts (Released)/Written Off Fixed Asset Investments2004 2003
£m £m
Specific (16.3) 29.1
General (9.9) 9.1
Movement in provision (released)/increase (26.2) 38.2
As a % of investment assets (1.6)% 2.1%
Provisions of £26.2 million were released during the year (2003 – £38.2 million raised) against an investment
asset portfolio of £1.6 billion (2003 – £1.8 billion), primarily comprising asset backed securities and corporate
bonds. The reduction in the provision reflects an improvement in the underlying value of these assets.
TaxationThe effective rate of tax was 25.5% (2003 – 25.6%), compared with the standard rate of corporation tax
of 30%. Nationwide carries out its commercial activities and structures its business in a tax efficient manner
and this is reflected in the Group tax charge.
Business Segment Contribution StatementNationwide operates three main business segments, Retail, Commercial and Group. The Group segment
contains Treasury, Capital and items classified as being non-attributable to our core business areas.
Results by Business Segment2004 2003
£m £m
Residential mortgages 183.1 162.4
Consumer lending 19.8 28.2
General insurance & life products 96.1 97.0
Retail 299.0 287.6
Commercial 174.1 165.6
Group (46.3) (99.9)
Profit before tax 426.8 353.3
Retail lending is predominantly funded using the retail savings inflows. Wholesale funding and liquidity are
used to offset any surplus or shortfall in retail funds.

Nationwide Annual Report and Accounts 2004 – Operating and Financial Review
16 Nationwide Annual Report and Accounts 2004
Operating and Financial Review (continued)
Retail Contribution by Income and Expenditure Category2004 2003
£m £m
Net interest income 931.7 858.7
Non-interest income 195.0 173.6
Total income 1,126.7 1,032.3
Operating expenses (749.9) (693.8)
Bad debt provisions (37.9) (39.9)
Provisions for contingent liabilities and commitments (39.9) (11.0)
Profit before tax 299.0 287.6
Retail contribution has increased 4% from £287.6 million to £299.0 million. Residential mortgage
contribution has increased by 13% driven by the strong growth in mortgage lending of 15% offset by
increased wholesale funding costs. The contribution of our mortgage business was enhanced by containing
the costs of securing new business and by strong retention of customers coming to the end of fixed
rate and tracker deals. The high quality asset base, low arrears and falling provisions have also
enhanced contribution.
Consumer lending performance has been strong with high levels of business in the year. Contribution
has fallen primarily due to keener pricing on personal loans where the rate on unsecured lending fell from
7.9% at the start of the year to 6.7%. We also improved our credit card pricing with a 0% introductory
rate on purchases and balance transfers for new credit cards.
General insurance and life business performance was supported by the strong mortgage business although
contribution from the life business reduced due to provisions made for the cost of loyalty benefits accruing
to investors in certain unit trust products.
The contribution of our mortgage business wasenhanced by containing the costs of securing newbusiness and by strong retention of customers comingto the end of fixed rate and tracker deals.

Nationwide Annual Report and Accounts 2004 17
Commercial Contribution by Income and Expenditure Category2004 2003
£m £m
Net interest margin 174.6 170.9
Non-interest income 46.0 47.1
Total income 220.6 218.0
Administrative expenses (40.8) (42.9)
Provisions for bad debts (5.7) (9.5)
Profit before tax 174.1 165.6
Nationwide Building Society has been active in commercial lending since the 1980s and has established
a high quality portfolio of commercial and Housing Association loans totalling in excess of £12 billion by
the year end. The contribution from this activity is used to supplement our mutual agenda.
During the year the margin narrowed due to a combination of competitive pressures in the market place and
borrowers refinancing at lower rates. However, the increased volumes of new business bolstered net income.
Costs and provisions have been contained below last year’s level to give an overall improvement in
contribution from £165.6 million to £174.1 million.
The commercial contribution includes at.home nationwide, a wholly owned subsidiary that specialises in high
quality residential property rental. The income from at.home nationwide is included in the non-interest
income element (2004 £16.8 million; 2003 £17.4 million).
Nationwide Building Society has established a high quality portfolio of commercial and Housing Association
loans totalling in excess of £12 billion by the year end.

Nationwide Annual Report and Accounts 2004 – Operating and Financial Review
18 Nationwide Annual Report and Accounts 2004
Operating and Financial Review (continued)
Group Contribution by Income and Expenditure Category2004 2003
£m £m
Net interest income (7.6) 1.4
Non-interest income 10.0 7.2
Total income 2.4 8.6
Operating expenses (74.9) (70.3)
Amounts released/(written off) 26.2 (38.2)
fixed asset investments
Net cost before tax (46.3) (99.9)
Net interest income has reduced due to the requirement to increase wholesale and capital funding to support
the strong growth in lending volumes.
Non-interest income includes income not core to the Group, for example, rental income from residential
property associated with retail premises.
Operating expenses includes costs which are not appropriate to allocate to the business segments,
for example brand advertising.
The amounts released from provisions against fixed asset investments have supported Group contribution.
Capital StructureTotal capital stood at £6.2 billion (2003 – £5.1 billion) with the Group’s total solvency ratio remaining strong
at 11.7% (2003 – 11.7%). The Tier 1 solvency ratio stood at 9.3% (2003 – 9.6%). Both ratios remain well
in excess of the minimum established by the Society’s regulator.
2004 2003£m £m
Capital: Tier 1 4,905.8 4,217.0
Tier 2 1,308.5 914.2
Deductions (27.9) (29.0)
Total capital 6,186.4 5,102.2
Total risk weighted assets 52,765.1 43,694.9
Risk asset ratios:
Total capital 11.7% 11.7%
Tier 1 9.3% 9.6%

Nationwide Annual Report and Accounts 2004 19
Group’s Profit Ratios2004 2003
% %
Post tax return on capital 5.63 5.55
Post tax return on mean assets 0.34 0.33
Post tax return on mean risk weighted assets 0.66 0.64
We were very successful in raising both Tier 1 (£400 million of PIBS) and Tier 2 (£341.9 million) capital in the
year. The capital was raised to fund the strong growth in the Balance Sheet. There was, and remains,
substantial appetite for our credit in the European and US markets. The work undertaken in recent years in
developing these sources of funds has proved highly beneficial in enabling the Group to raise the required
wholesale funding and additional capital at an attractive rate.
OutlookWe expect higher interest rates to dampen house price and mortgage lending growth over the next year.
Equity withdrawal will also become more subdued, although remortgage activity will remain strong. Overall
UK net mortgage lending is expected to reduce modestly compared with 2003. Our target is to exceed our
par share of net lending for the second consecutive year.
The savings market will remain strong with continuing uncertainty over the strength of the recovery in equity
prices. Competition will also remain strong both from National Savings and from a number of lenders who
need to raise their share of retail funding to support their net mortgage lending.
The combined competition in the mortgage and savings markets will continue to put downward pressure on
interest margins. We expect a number of increases in the Bank of England Base Rate throughout the year,
taking it to 4.75-5.00% by the year end. The current position of Libor relative to Base Rate will help mitigate
some of the margin squeeze.
We will work hard to deliver another set of excellent results with good growth in all of our key markets,
further improvement in our efficiency and stringent control over asset quality. This should lead to the delivery
of increased profits while maintaining the distribution of substantial pricing benefits to our members.
We will work hard to deliver another set of excellent results with good growth in all of our
key markets, further improvement in our efficiency and stringent control over asset quality.

Nationwide Annual Report and Accounts 2004 – Operating and Financial Review
20 Nationwide Annual Report and Accounts 2004
Operating and Financial Review (continued)
Risk Management and Control
OverviewThe purpose of risk management is to monitor and
control the size and concentration of risks arising from
our activities. The principal categories of financial risk
inherent to our business are:
• liquidity risk;
• market risk, including interest rate risk and
foreign currency risk;
• credit risk, including settlement risk; and
• operational risk.
We designed our risk management policy to analyse
these risks and set appropriate limits that are
consistent with the strengths of our organisation,
and we continually monitor these risks and limits
by using developed risk management systems.
Management of financial risk is fundamental to our
business. We have a formal structure for managing
risk, including a risk assessment methodology,
established risk limits, reporting lines, mandates, a
new product approval process and other control
procedures. The Board has delegated specific risk
monitoring and control responsibilities to the Audit
Committee, the Assets and Liabilities Committee
(ALCO), the Credit Committee (Retail) and the Credit
Committee (Commercial & Treasury).
The Treasury Division is responsible for the day-to-
day management and control of a significant portion
of our financial risks and of the risks relating to
the Treasury Division’s activities, ensuring that those
risks and activities are within the parameters set
by our Board of Directors, ALCO and the Credit
Committees. The Treasury Division reports and
makes recommendations to ALCO and the Credit
Committees.
Liquidity RiskThe objective of our liquidity policy is to enable us
to maintain sufficient liquid resources to cover cash
flow imbalances and fluctuations in funding, to
maintain full public confidence in our business and
to enable us to meet our financial obligations. The
development and implementation of policy is the
responsibility of ALCO.
The day-to-day management of liquidity is the
responsibility of Treasury, which provides funding to,
and takes surplus funds from each of the Group’s
businesses as required. Liquidity policy is approved by
the Board and agreed within a framework established
by the Financial Services Authority. Regulatory
guidelines drive the scope and nature of the Group’s
holdings of readily realisable liquid assets.
Credit RiskCredit risk is the risk that a customer or counterparty
will not be able to meet its obligations to us as they
become due. Credit risk primarily occurs in loans,
investment assets and derivative contracts.
The Credit Committee (Commercial & Treasury) and
the Credit Committee (Retail) set our credit risk
management policy, and the Risk Management
Division manages it. Generally, we have distanced the
credit decision from our sales force and now make
these decisions centrally. We accomplish this by
developing, maintaining and using automated credit
scoring systems that differentiate credit risks for
residential mortgage loans and other consumer
products and services. The Risk Management Division
assesses the risk profile of large loans. Loans above
certain levels also require approval from the relevant
Credit Committee or our Board of Directors.
The Risk Management Division also approves and
monitors counterparty, industry and country credit
limits for all transactions undertaken by the Treasury
Division. We constantly monitor and manage our
credit exposure to ensure that it remains within
authorised credit limits. Breaches of credit limits are
reported to the relevant Credit Committee.

Nationwide Annual Report and Accounts 2004 21
Equity RiskWe offer certain investment products where we
guarantee customers' principal investment, and their
return depends on the performance of stock market
indices. Our policy is to hedge this risk fully through
derivatives.
Operational RiskOperational risk is the risk of direct or indirect loss
resulting from inadequate or failed internal processes
or systems, human error or external events.
The Group’s business units manage this risk through
appropriate controls and loss mitigation actions,
including insurance. These actions include a balance
of policies, appropriate procedures and internal
controls to ensure compliance with laws and
regulations.
DerivativesWe only use derivative instruments, in accordance
with the Building Societies Act, to limit the extent
to which we will be affected by changes in interest
rates, exchange rates or other factors defined by the
Building Societies Act. In addition we do not use
derivatives for speculative purposes.
Graham Beale
Group Finance Director
19 May 2004
We designed our credit risk management policy to
control the quality of our loan and investment
portfolios. We review several key risks in managing
the portfolios to ensure that credit quality is, and
remains, acceptable. All credit policies covering
lending and counterparty exposure limits are reviewed
and approved annually by the Board.
Market RiskMarket risk is the risk that changes in the level of
interest rates, foreign currency rates, asset prices or
other financial contracts, including derivatives, will
adversely impact the result of our operations or our
financial condition. Our general activities expose us
to market risk, primarily interest rate risk.
We offer numerous mortgage, savings and other
financial services products with varying interest rate
features and maturities which create interest rate risk
exposures. Interest rate risk arises as a result of
timing differences on the re-pricing of assets and
liabilities and imperfect correlation of interest rates
between different financial instruments. Treasury is
responsible for managing this exposure within the
operational limits set out in the Group’s policies.
Currency RiskWe encounter currency risk as a result of activity
undertaken by the Group in order to manage
borrowing costs and investment returns. The Group
raises and invests funds in currencies other than
Sterling. As with interest rate risk, Treasury is
responsible for managing this exposure within the
limits as set out in the Group’s policies.
Currency risk is managed primarily through the use
of currency swaps and forward foreign exchange
contracts. The risk is also managed, when
appropriate, by foreign exchange currency liabilities
being matched with assets denominated in the
same foreign currency.

Nationwide Annual Report and Accounts 2004 – Board of Directors
22 Nationwide Annual Report and Accounts 2004
Board of DirectorsFor the year ended 4 April 2004
Brian Walsh Bernard Simpson Stuart Bernau
Graham BealePhilip WilliamsonJonathan Agnew
Jonathan Agnew (62)Chairman
Jonathan Agnew was appointed to the Board
in 1997 and became Chairman in 2002. During
his career he has been a Managing Director of
Morgan Stanley, Group Chief Executive of Kleinwort
Benson and Chairman of Limit and of Gerrard Group.
He is now Chairman of Beazley Group and,
since November of last year, a non-executive
Director of Jarvis.
Brian Walsh (59)Deputy Chairman
Brian Walsh joined the Board in 1999 and became
Deputy Chairman in 2002. He is also Chairman
of the Society’s Audit Committee. His background
is in industry and finance, most recently as Vice-
Chairman and Finance Director of TI Group plc.
Previous positions include Finance Director, GKN plc
and executive Director, Credit Suisse First Boston.
Philip Williamson (56)Chief Executive
Philip Williamson was appointed to the Board in
April 1996 and was appointed Chief Executive
on 1 January 2002. Prior to his appointment as
Chief Executive, he held roles as Retail Operations
Director and as Marketing & Commercial Director.
Before joining Nationwide he held senior
appointments within the banking and
property industries.
Bernard Simpson (56)Deputy Chief Executive & Chief Operating Officer
Bernard Simpson joined the Society in 1989.
He was appointed a Director in 1994, Deputy
Chief Executive in December 1999 and additionally
Chief Operating Officer in 2002. His responsibilities
include technology, retail and marketing as well
as central administration of all savings, mortgages
and insurance.
Graham Beale (45)Group Finance Director
Graham Beale joined the Society in 1985 and has
worked extensively in the finance function and
other parts of the Group. He was appointed to the
Board on 5 April 2003 with executive responsibility
for finance and planning, risk management, legal
compliance, internal audit and lending control.
Stuart Bernau (52)Commercial & Treasury Director
Stuart Bernau joined the Society in 1990 and
was appointed a Director in 1996. His current
responsibilities include treasury operations,
commercial lending, personnel and development
and communications. He is also Chairman of the
Society’s life insurance and unit trust subsidiaries.

Nationwide Annual Report and Accounts 2004 23
Stella David Ruth Evans Robert Walther
John Engestrom Richard Handover Jim Willens
Stella David (41)Non-executive Director
Stella David joined the Board on 16 April 2003.
Her expertise is in marketing and she is Managing
Director of Bacardi-Martini Limited having joined
its Board in 1996. She is also President of the
Supervisory Board of Bacardi Netherlands NV.
Before joining Bacardi she held senior appointments
at Golden Wonder.
John Engestrom (62)Non-executive Director
John Engestrom was appointed a Director in 1997.
He is also a Director of the Society’s life insurance
and unit trust subsidiaries. He is Chairman of the
Society’s Remuneration Committee. He was
previously Group Chief Executive of Mercantile &
General Reinsurance, Chief Executive of Liberty Re
and ACE Tempest Reinsurance Ltd. He is currently
a Director of Wellington Underwriting plc.
Ruth Evans (46)Non-executive Director
Ruth Evans joined the Board as a non-executive
Director on 1 April 2002. She is a lay member
of the General Medical Council and Chair of the
Standards Committee. Prior to this she was a Director
of the National Consumer Council. She also chairs
the Independent Inquiry into Drug Testing at Work,
is Deputy Chair of the Consumer Panel of Ofcom
and holds a number of other public appointments.
Richard Handover (57)Non-executive Director
Richard Handover was appointed to the Board
in 2000. He is Chairman of WHSmith plc, having
previously been Chief Executive. He is also
Vice-Chairman of Business in the Community,
Chairman of the Adult Learning Inspectorate and
a non-executive Director of the Royal Mail.
Robert Walther (60)Non-executive Director
Robert Walther joined the Board as a non-executive
Director on 1 July 2002. He was Chief Executive
of Clerical Medical from 1995 to 2001, which he
joined in 1965. He is currently Chairman of JP
Morgan Fleming Claverhouse Investment Trust plc
and Fidelity European Values plc.
Jim Willens (47)Retail Operations Director
Jim Willens joined the Society in 1978 and became
a Director on 1 January 2002. He has executive
responsibility for our branches, call centres, online
internet services and intermediary business. He is
also a Director of the Society’s life insurance and
unit trust subsidiaries and its specialist lending
business, UCB Home Loans. Before joining
Nationwide, he worked for two major banks.

Nationwide Annual Report and Accounts 2004 – Directors’ Report
24 Nationwide Annual Report and Accounts 2004
The Directors have pleasure in presenting their Annual Report
and Accounts for the year ended 4 April 2004.
Business objectivesThe main aim of the Society and its subsidiaries (the ‘Group’)
is to provide a full range of top value, quality financial services
that are widely available and delivered with speed, courtesy and
reliability. This aim is backed by the key values of fairness,
honesty, employee importance and corporate responsibility.
Business review and future developmentsThe Group's business and future plans are reviewed by the
Chairman and Chief Executive on pages 2 to 5 and the Operating
and Financial Review on pages 6 to 21.
Profits and capitalProfit before tax was £426.8 million (2003 – £353.3 million).
The profit after tax transferred to the general reserve was
£317.9 million (2003 – £262.7 million).
Total Group reserves at 4 April 2004 were £4,553.0 million
(2003 – £4,186.1 million) after taking into account the
revaluation reserve of £211.9 million (2003 – £165.1 million).
Gross capital at 4 April 2004 was £6,170.3 million (2003 –
£5,076.5 million) including £925.6 million (2003 – £594.0 million)
of subordinated debt and £691.7 million (2003 – £296.4 million)
of subscribed capital. The ratio of gross capital as a percentage
of shares and borrowings at 4 April 2004 was 6.7% (2003 – 6.5%)
and the free capital ratio was 5.9% (2003 – 5.7%). The total
solvency ratio at 4 April 2004 was 11.7% (2003 – 11.7%)
and the Tier 1 solvency ratio was 9.3% (2003 – 9.6%).
Mortgage arrearsThe mortgage portfolio at 4 April 2004 included 571 mortgage
accounts (2003 – 798), including those in possession, where
payments were more than 12 months in arrears. The total
amount of principal loans outstanding in these cases was
£32.1 million (2003 – £47.2 million). The total amount of arrears
in these cases was £5.4 million (2003 – £8.9 million) or 0.01%
(2003 – 0.01%) of total mortgage balances.
Charitable and political donationsDuring the year the Group made charitable donations of
£1,296,965 (2003 – £2,645,239) including £1,000,000
(2003 - £2,100,000) to The Nationwide Foundation.
No contributions were made for political purposes. However,
as a result of the Political Parties, Elections and Referendums
Act 2000 time allowed to employees to carry out civic duties
can amount to a donation. The Group supports a very small
number of employees in this way.
Creditor payment policyThe Group’s policy is to agree the terms of payment with
suppliers at the start of trading, ensure that suppliers are
aware of the terms of payment and pay in accordance with its
contractual and other legal obligations.The Group’s policy is to
settle the supplier’s invoice for the complete provision of goods
and services (unless there is an express provision for stage
payments), when in full conformity with the terms and conditions
of the purchase, within the agreed payment terms.
The Society’s creditor days were 24 days at 4 April 2004
(2003 – 19 days).
EmployeesDuring the financial year the Society has maintained and
developed systems for the provision of information to employees.
The Society has continued to consult actively with the Nationwide
Group Staff Union. In addition, meetings, team briefings,
circulars, newsletters and the Society’s intranet ensure employees
are aware of the Society’s performance and objectives and the
business environment in which it operates.
It is the Society’s policy to afford access to training, career
development and promotion opportunities equally to all
employees regardless of their race, creed, sex, marital status,
age, physical or mental disability. Should employees become
disabled, it is the Society’s policy to continue their employment
where possible with appropriate training and redeployment
where necessary.
Directors’ responsibilities in respect of thepreparation of the Annual AccountsThis statement which should be read in conjunction with the
statement of the auditors on page 35, is made by the Directors
to explain their responsibilities in relation to the preparation
of the Annual Accounts, the Directors’ Emoluments disclosures
within the Report of the Directors on Remuneration, the Annual
Business Statement and the Directors' Report.
The Directors are required by the Building Societies Act 1986
(the ‘Act’) to prepare, for each financial year, Annual Accounts
which give a true and fair view of the income and expenditure
of the Society and the Group for the financial year and of the
state of the affairs of the Society and the Group as at the end
of the financial year and which provide details of Directors’
emoluments in accordance with Part VIII of the Act and
regulations made under it. In preparing those Annual Accounts,
the Directors are required to:
Directors’ ReportFor the year ended 4 April 2004

• select appropriate accounting policies and apply them
consistently;
• make judgements and estimates that are reasonable and
prudent;
• state whether applicable accounting standards have been
followed, subject to any material departures disclosed
and explained in the Annual Accounts; and
• prepare the Annual Accounts on the going concern basis,
unless it is inappropriate to presume that the Group will
continue in business.
In addition to the Annual Accounts, the Act requires the Directors
to prepare, for each financial year, an Annual Business Statement
and a Directors' Report, each containing prescribed information
relating to the business of the Society and its connected
undertakings.
Directors’ responsibilities in respect of AccountingRecords and Internal ControlThe Directors are responsible for ensuring that the Society and its
connected undertakings:
• keep accounting records which disclose with reasonable
accuracy the financial position of the Society and the Group
and which enable them to ensure that the Annual Accounts
comply with the Act; and
• establish and maintain systems of control of its business
and records, and of inspection and report.
The Directors have general responsibility for safeguarding the
assets of the Group and for taking reasonable steps for the
prevention and detection of fraud and other irregularities.
Going concernThe Directors are satisfied that the Group has adequate resources
to continue in business for the foreseeable future and that it is,
therefore, appropriate to adopt the going concern basis in
preparing the Annual Accounts.
DirectorsThe following served as Directors of the Society during the year:
J G W Agnew MA (Chairman)
B A Walsh MSc (Econ), FCMA, CIMgt (Deputy Chairman)
P F Williamson BA (Econ), FCIB (Chief Executive)
B K Simpson MIMIS, FRSA (Deputy Chief Executive
and Chief Operating Officer)
S D M Bernau BSc (Econ), FCIB, MCT (Commercial
and Treasury Director)
G J Beale BSc, ACA (Group Finance Director)
J H Willens MBA, DMS, ACIB (Retail Operations Director)
Mrs S J David MA Cantab
J Engestrom MBA
Ms R E Evans MA
R G Handover
R P Walther MA, FIA
Mrs A J Carnwath BA, ACA
G J Beale was appointed Group Finance Director on 5 April 2003
and Mrs S J David was appointed a non-executive Director on
16 April 2003.
Mrs A J Carnwath retired on 24 July 2003.
G J Beale, Mrs S J David, R G Handover and B K Simpson, will
retire at the Annual General Meeting on 22 July 2004, and they
will all stand for election.
None of the Directors has any beneficial interest in shares in,
or debentures of, any connected undertaking of the Society.
The auditorsA resolution to reappoint PricewaterhouseCoopers LLP as auditors
will be proposed at the Annual General Meeting.
J G W Agnew
Chairman
19 May 2004
Nationwide Annual Report and Accounts 2004 25
Nationwide Annual Report and Accounts 2004 – Report of the Directors on Corporate Governance
26 Nationwide Annual Report and Accounts 2004
The Board of Directors is committed to best practice in corporate
governance. This Report on Corporate Governance explains
how the Society applies the principles in the Combined Code
(the ‘Code’) on Corporate Governance issued by the Financial
Reporting Council in 2003 as well as meeting guidance for
building societies issued by the Financial Services Authority
(the ‘FSA’). Although the Code is intended to apply to listed
companies’ reporting years beginning on or after 1 November
2003, following a thorough review and the introduction of some
changes in its corporate governance arrangements during the
year the Board considers that the Society now complies with
all the Code provisions unless the contrary is stated.
DirectorsThe Board
Code Principle: Every company should be headed by an effective
Board, which is collectively responsible for the success of
the company.
Board comment: The Board’s terms of reference are published
on the Society’s website. The principal functions of the Board
are to determine the strategy and policies of the Group, to set
out the guidelines within which the business is managed and
to review business performance. The Board has a general duty to
ensure that the Group operates within the Society’s constitution
and relevant legislation and regulation and that proper
accounting records and effective systems of business control are
established, maintained, documented and audited. The Board’s
terms of reference include a list of specific matters reserved to
the Board and a High Level Business Control Manual sets out the
structure of delegation of authority by the Board to management.
The Board has three main Committees. These are the Audit
Committee, the Nomination Committee and the Remuneration
Committee (the latter two Committees having been established
with effect from January 2004 in succession to the former
combined Senior Appointments & Remuneration Committee (the
‘SARC’) which has ceased to exist). Each Committee comprises
only non-executive Directors and each Committee has a different
Chairman. The terms of reference of each Committee are
published on the Society’s website. The composition of the
Committees is shown in the Annexe to this Report. The Deputy
Chairman is the Senior Independent Director.
The Board meets as often as necessary for the proper conduct of
business, and there are usually at least ten formal Board meetings
each year. In addition the non-executive Directors meet without
executive Directors present, at least once a year. The attendance
record during the year of members at formal meetings of the
Board and its Committees is shown in the Annexe.
All Board members have the benefit of appropriate liability
insurance at the Society’s expense. All Board members have
access to independent legal advice if required.
Chairman and Chief Executive
Code Principle: There should be a clear division of responsibilities
at the head of the company between the running of the Board
and the executive responsibility for the running of the company’s
business. No one individual should have unfettered powers
of decision.
Board comment: The offices of Chairman and Chief Executive are
distinct and held by different people. The role of each is set out
in their terms of appointment or contract respectively and in their
individual performance agreement. The Chairman is responsible
for leading the Board and communicating with the Society’s
members on behalf of the Board. The Chief Executive
is responsible for managing the Society’s business within the
parameters set by the Board.
Board Balance and Independence
Code Principle: The Board should include a balance of executive
and non-executive Directors (and in particular independent
non-executive Directors) such that no individual or small group
of individuals can dominate the Board’s decision taking.
Board comment: The Board comprises five executives and seven
non-executives (including the Chairman). Apart from the
Chairman, for whom the test of independence is considered
inappropriate, all non-executive Directors are considered by
the Board to be independent in character and judgement and
free of any relationship or circumstances which could materially
interfere with the exercise of their judgement.
Appointment to the Board
Code Principle: There should be a formal, rigorous and
transparent procedure for the appointment of new Directors
to the Board.
Board comment: Prior to its dissolution the SARC considered,
and following its establishment the Nomination Committee now
considers, the balance of skills and experience on the Board and
the requirements of the business. The Board has an agreed Board
Composition and Succession Plan which is published on the
Society’s website. Appointments to the Board are made on
merit and against objective criteria. Candidates for non-executive
Directorship are identified in a variety of ways, including the
use of external search consultants by the Board, and in addition
members of the Society have the right under the Society’s Rules
to nominate candidates for election to the Board. All Directors
Report of the Directors on Corporate Governance For the year ended 4 April 2004

must meet the tests of fitness and propriety laid down by the
FSA and all Directors are required to be registered with the FSA
as an Approved Person in order to fulfil their Controlled Function
as a Director.
The service contracts of executive Directors and the letters
of appointment of non-executives are available for inspection
on request from the Secretary.
Information and Professional Development
Code Principle: The Board should be supplied in a timely manner
with information in a form and of a quality appropriate to enable
it to discharge its duties. All Directors should receive induction on
joining the Board and should regularly update and refresh their
skills and knowledge.
Board comment: The Chairman ensures that the Board receives
information sufficient to enable it to fulfil its responsibilities.
All new Directors undergo formal induction and any training or
development needs are identified during this process and in the
course of subsequent annual evaluations of the Board’s and
individual Directors’ performance and effectiveness.
Performance Evaluation
Code Principle: The Board should undertake a formal and
rigorous annual evaluation of its own performance and that
of its Committees and individual Directors.
Board comment: During the year the Board has adopted new
methodology to evaluate the performance and effectiveness of
individual Directors and of the Board as a whole. Each Director
has a Performance Agreement and Personal Development Plan
tailored to their individual circumstances (e.g. as Chairman, other
non-executive Director, or executive Director). The non-executive
Directors are evaluated by the Chairman, taking into account the
views of other Directors; the Chairman is evaluated by the non-
executive Directors facilitated by the senior independent Director
and taking into account the views of the executive Directors;
and the Board evaluates its own overall performance. Executive
Directors are evaluated within the performance evaluation
framework for employees generally and by the Remuneration
Committee in context of their remuneration.
Re-election
Code Principle: All Directors should be submitted for re-election
at regular intervals, subject to continued satisfactory
performance. The Board should ensure planned and progressive
refreshing of the Board.
Board comment: The Society’s Rules require that all Directors
are submitted for election at the Annual General Meeting
(the ‘AGM’) following their first appointment to the Board,
except where their appointment occurs in the period between the
end of the Society’s financial year and the AGM itself, in which
case they must seek election at the AGM in the following year,
and all Directors are required to seek re-election every three years
after first being elected.
The Board’s general policy is that non-executive Directors should
not expect to serve more than two full three year terms.
The Nomination Committee considers and recommends to
the Board whether a non-executive Director should be submitted
for re-election. Any term lasting beyond the normal six years
will be subject to particularly rigorous review and any term
lasting beyond nine years will be approved by the Board only
in exceptional circumstances and then only on the basis of annual
re-election. Currently, two non-executive Directors have served
more than two full three year terms; they are Jonathan Agnew
(Chairman) and John Engestrom (Chairman of the Remuneration
Committee). Mr Engestrom does not expect to stand for
re-election for a further term. Mr Agnew expects to retire about
the time of the AGM in 2007 by which time he will have served
for five years as Chairman as envisaged at the time of his
appointment by the Board as Chairman.
Nationwide Annual Report and Accounts 2004 27

Nationwide Annual Report and Accounts 2004 – Report of the Directors on Corporate Governance
28 Nationwide Annual Report and Accounts 2004
RemunerationThe Report of the Directors on Remuneration (on pages 31 to 34)
explains how the Society applies the Code principles and its
compliance with the Code provisions relating to remuneration.
Accountability and auditFinancial Reporting
Code Principle: The Board should present a balanced and
understandable assessment of the company’s position
and prospects.
Board comment: The responsibilities of the Directors in relation
to the preparation of the Society’s accounts and a statement that
the Society’s business is a going concern are to be found within
the Directors’ Report (on pages 24 and 25).
Internal Control
Code Principle: The Board should maintain a sound system
of internal control to safeguard shareholders’ investment and
the company’s assets.
Board comment: The Board is responsible for determining
strategies for risk management and control. Senior management
are responsible for designing, operating and monitoring risk
management and internal control processes, and the Audit
Committee, on behalf of the Board, is responsible for reviewing
the adequacy of these processes. The Society has a strong
compliance culture. The system of internal control is designed
to enable the Society to achieve its corporate objectives within a
managed risk profile, not to eliminate risk. The Risk Management
Division ensures that appropriate risk management systems exist
across the spectrum of the Group’s operations, and that in
particular there is an ongoing process for identifying, evaluating
and managing significant risks faced by the Group. This process
has operated throughout the year and the process is regularly
reviewed at Board level. The Group Internal Audit function
provides independent and objective assurance that these
processes are appropriate and effectively applied.
The Board has approved a Group Risk Appetite Statement and
both the Board and the Audit Committee regularly review the
Group Risk Profile in the context of the Group’s risk appetite.
The Group Risk Profile is compiled by the Risk Management
Division based on risk assessment submissions from divisional
directors and other senior executives throughout the Group
in relation to the areas of the Group’s business for which they
are responsible. The key risk categories are identified together
with the ongoing status in relation to each risk and any actions
deemed necessary being taken or planned to mitigate such risks.
In particular, the principal categories of financial risk inherent
in the Group’s business are described in greater detail in
the Operating and Financial Review under the heading Risk
Management and Control (on pages 20 and 21) together with
an explanation of the structure adopted within the Group for
managing financial risk (including the roles of the Credit
Committees and the Assets and Liabilities Committee). The
Chief Executive’s Committee, which comprises all executive
Directors and all divisional directors, is the principal risk
management committee. It reviews the Group Risk Profile on
a regular monthly basis and facilitates an integrated approach
to risk management across the business as a whole.
The Board has ultimate responsibility for ensuring the
effectiveness of the Society’s systems of risk management and
internal control, and following review by the Audit Committee
it is satisfied that the Society’s systems are effective and meet
the requirements of the Code and the supplementary
Turnbull guidance.
Audit Committee and auditors
Code Principle: The Board should establish formal and transparent
arrangements for considering how they should apply the financial
reporting and internal control principles and for maintaining an
appropriate relationship with the company’s auditors.
Board comment: The Board has an Audit Committee comprising
four non-executive Directors chaired by the Deputy Chairman,
all of whom are independent. The Chairman of the Board is not
a member of the Committee although he is usually invited to
attend meetings of the Committee. The Board is satisfied that
at least one member of the Committee has recent and relevant
financial experience. The Chairman and all members of the
Committee receive supplementary fees in recognition of their
additional responsibilities. The terms of reference of the Audit
Committee are available on request from the Secretary and
are published on the Society’s website.
The role of the Audit Committee is to review the integrity of
the financial statements, to review the effectiveness of internal
controls and risk management systems, to monitor and review
the effectiveness of the internal audit function, to consider
and recommend to the Board (for approval by the members)
the appointment or reappointment of the external auditors and
to oversee the relationship with the external auditors, including
the development of policy on the engagement of the external
auditors for non-audit services.
Report of the Directors on Corporate Governance (continued) For the year ended 4 April 2004
The policy developed by the Committee on the engagement of
the external auditors for non-audit work includes a requirement
that the engagement of the auditors for non-audit services
requires prior approval of the Committee where the level of
fees payable for non-audit services would exceed set threshold
proportions of the audit fee, differentiating between non-
discretionary services (i.e. those required by external rules to
be carried out by the auditors) and discretionary services (i.e.
any other services). The Committee is unlikely to sanction any
engagement of the auditors for non-audit services where the
aggregate fees for all non-audit services would exceed a limit
set as a proportion of the audit fee.
The Committee is also responsible for ensuring that there are
effective whistleblowing arrangements to enable employees to
raise, in confidence, any concerns about possible improprieties
in matters of financial reporting or other matters and effective
arrangements for investigation of any such concerns raised.
The Audit Committee usually meets six times a year. The
Committee usually excludes all executives from part of its
meetings and the Committee periodically meets with only the
external auditors. By invitation of the Committee, executives
and others regularly attending part of its meetings include the
Head of Group Audit, the Deputy Chief Executive and Chief
Operating Officer, the Group Finance Director, the Divisional
Director Risk Management and the external auditors. Minutes
of the Committee’s meetings are routinely distributed to all
Board members and the Chairman of the Committee reports
to the Board at each regular meeting of the Board following
a meeting of the Committee.
During the past year the Audit Committee has adopted
new methodology to evaluate annually the performance
and effectiveness of the Committee and its compliance with
the requirements of the Code and the supplementary Smith
guidance, although the new methodology has not yet completed
its first annual cycle. The evaluation process includes the
completion of a standard review proforma by members of the
Committee and by the Head of Group Audit and a report for
agreement by the Committee and submission to the Board.
Nationwide Annual Report and Accounts 2004 29
Relations with shareholdersDialogue with Institutional Shareholders
Code Principle: There should be a dialogue with shareholders
based on the mutual understanding of objectives. The Board
as a whole has responsibility for ensuring that a satisfactory
dialogue with shareholders takes place.
Board comment: As a mutual body, the Society has a
membership composed almost exclusively of (currently over
11 million) individuals (rather than institutions), all of whom
are the Society’s customers. The Society proactively seeks the
views of members in a variety of ways. Every month the Society
invites 30,000 members to complete a Member Perception
Questionnaire and comment on the service they receive.
Member TalkBack events (both face to face and via the internet)
give members an opportunity to put questions or points to a
Director or senior executive. The Member Suggestion Scheme
enables members to express their views on an ongoing basis,
and a Feedback Log allows employees to record immediately any
ad hoc comments from members on any aspect of its business.
The Society conducts market research on a regular basis via
telephone surveys, group discussions and conversations, in
order to elicit feedback on a wide range of issues. In addition,
members’ participation in its Usability Centre enables the Society
to obtain members’ comments on a range of practical measures
and initiatives.
Constructive Use of the AGM
Code Principle: The Board should use the AGM to communicate
with investors and to encourage their participation.
Board comment: Each year the Society sends details of the AGM
and the Postal Ballot for the election of Directors to (currently
over 6 million) members who are eligible to vote. Members are
sent Voting Forms and are encouraged to vote in the Postal Ballot
and to appoint a proxy to vote for them at the AGM if they
cannot, or choose not to, attend the AGM. All postal ballot votes
and all proxy votes are counted under independent scrutiny.
A poll is called in relation to each resolution at the AGM and all
proxy votes cast are included in the published results of voting.
All members of the Board are present at the AGM each year
(unless exceptionally their absence is unavoidable) and the
Chairmen of the Audit and the Remuneration Committees are
therefore available to answer questions.

Nationwide Annual Report and Accounts 2004 – Report of the Directors on Corporate Governance
30 Nationwide Annual Report and Accounts 2004
Report of the Directors on Corporate Governance (continued) For the year ended 4 April 2004
ANNEXE
Board and Committee membership attendance recordAgainst each Director’s name is shown the number of meetings of the Board and its Committees at which the Director was present
and in brackets the number of such meetings that the Director was eligible as a member of the Board or Committee to attend
during the year.
Director Board Audit SARC Nomination Remuneration
Committee Committee Committee
J G W Agnew Chairman of Board and the Nomination Committee 10 (10) – 2 (2) 1 (1) 1 (1)
G J Beale 10 (10) – – – –
S D M Bernau 10 (10) – – – –
Mrs A J Carnwath 3 (4) 2 (3) 1 (1) – –
Mrs S J David 10 (10) – 2 (2) 1 (1) 1 (1)
J Engestrom Chairman of the Remuneration Committee 9 (10) 7 (7) 2 (2) 1 (1) 1 (1)
Ms R E Evans 9 (10) – 2 (2) – 1 (1)
R G Handover 7 (10) 1 (2) 1 (2) – 1 (1)
B K Simpson 10 (10) – – – –
R P Walther 8 (10) 6 (7) 2 (2) – 1 (1)
B A Walsh Deputy Chairman, Chairman of the Audit Committee 10 (10) 7 (7) 2 (2) 1 (1) 1 (1)
and Senior Independent Director
J H Willens 10 (10) – – – –
P F Williamson 10 (10) – – – –
J G W Agnew
Chairman
19 May 2004

Nationwide Annual Report and Accounts 2004 31
The Board is committed to best practice in its remuneration
policy for Directors. This Report of the Directors on Remuneration
explains how the Society applies the principles in the Combined
Code on Corporate Governance relating to remuneration.
The Society complies with all the Code provisions unless
the contrary is stated. In addition, insofar as it is possible for
the Society as a mutual organisation without equity share capital
to comply with such requirements, this Report addresses the
statutory disclosure requirements for listed companies in relation
to Directors’ remuneration.
The Level and Make-up of RemunerationCode Principle: Levels of remuneration should be sufficient
to attract, retain and motivate Directors of the quality to run the
company successfully, but a company should avoid paying more
than is necessary for this purpose. A significant proportion of
executive Directors’ remuneration should be structured so as
to link rewards to corporate and individual performance.
Board Comment: The Society’s remuneration policy is
to reward Directors through salaries which are regularly
compared with salaries for jobs carrying similar responsibilities in
comparable organisations, and through other benefits including
a bonus scheme designed to recognise corporate and personal
performance on an annual basis and an additional incentive
plan designed to recognise medium-term corporate performance.
Executive Directors’ Emoluments• The remuneration arrangements for executive Directors,
in force during the period covered by the Annual Report
and Accounts, are as described in this Report (and where
any change in arrangements is envisaged this is stated).
Details of executive Directors’ emoluments for the year
are set out in Table 1.
• Remuneration is assessed by reference to jobs carrying similar
responsibilities in comparable organisations. The principal
comparator group consists of financial organisations with
a similar level of complexity and diversity to the Society.
A secondary comparator group including organisations
outside financial services is also taken into account.
• Rewards are in three parts and are based on market data
from comparator groups. These are basic salary, an annual
cash bonus scheme to reward success at the end of the
financial year and a medium-term cash incentive scheme
by which reward for business success is paid over rolling
three-year periods. Payments made as a result of the annual
bonus scheme or the medium-term incentive scheme are not
pensionable. The Society has no share option scheme and
none of the Directors has any beneficial interest in, or any
rights to subscribe for, shares in or debentures of any
connected undertaking of the Society.
• Basic salaries are normally reviewed annually by reference
to jobs carrying similar responsibilities in comparable
organisations and in the light of market conditions generally.
• The annual bonus scheme is based on achievement
against key corporate performance measures, such as
the achievement of financial targets (e.g. in relation to costs,
net mortgage lending and profit) and the achievement of
operational targets (e.g. in relation to growth in product
holdings per member).
For 2003/04, the scheme was designed to deliver a basic
bonus award of 14% of basic salary for executive Directors
(17.5% in the case of the Chief Executive) for on-target
performance up to a possible maximum of 32% (40% in the
case of the Chief Executive) and a possible further payment
of up to 25% based on personal performance. For 2004/05,
the scheme has been designed to deliver a basic bonus
award of 16% of basic salary for executive Directors (20%
in the case of the Chief Executive) for on-target performance,
with a possible maximum of 40% (49% in the case of the
Chief Executive), and a possible further payment of up to
25% (30% in the case of the Chief Executive) based on
personal performance.
• The purpose of the medium-term incentive plan is to reward
success in achieving corporate performance targets over
a longer time scale.
The plan was redesigned with effect from 2003/04 onwards
so that performance is rewarded according to the cumulative
increase in total member value, comprising retained post-tax
profit and aggregate pricing benefits delivered to members,
and also (as a result of a recent change) improvement in the
Society’s cost:income ratio, over rolling three-year periods.
The target bonus for the first three year period (2003/06) is
30% of basic salary (36% in the case of the Chief Executive)
with a maximum for exceptional performance of 50% (60%
in the case of the Chief Executive). The target bonus for the
second three year period (2004/07) is 35% of basic salary
(40% in the case of the Chief Executive) with a maximum for
exceptional performance of 58% (67% in the case of the
Chief Executive).
During the three-year transitional period, any bonus awards
payable under the plan in 2004/05 and 2005/06 will be
based on the previous deferred bonus formula which was
designed to pay a total bonus in any one year (consisting of
instalments from the previous three years) in the region of
24% of basic salary for successful performance with
payments of around 40% for exceptional performance.
• Executive Directors are members of the Nationwide Pension
Fund, details of which are set out in the Notes to the
Report of the Directors on Remuneration For the year ended 4 April 2004

Nationwide Annual Report and Accounts 2004 – Report of the Directors on Remuneration
32 Nationwide Annual Report and Accounts 2004
Report of the Directors on Remuneration (continued) For the year ended 4 April 2004
• Board Comment: The Board established a Remuneration
Committee (the ‘RemCo’) and a Nomination Committee
in January 2004 to replace the former combined Senior
Appointments & Remuneration Committee (the ‘SARC’)
which has now ceased to exist. The RemCo comprises all
the non-executive Directors (identified in Table 1) and is
chaired by Mr Engestrom. The SARC also comprised all
non-executive Directors and was chaired by the Chairman of
the Board. The terms of reference of the RemCo are available
on request from the Secretary and are published on the
Society’s website.
• The RemCo has taken over responsibility from the SARC for
the Society’s policy on the remuneration of Directors and the
top layer of management beneath the Board. By invitation
of the Committee, executives and others regularly attending
all or part of its meetings include the Chief Executive, the
Divisional Director Personnel and Development and an adviser
from the Committee’s external remuneration consultant Hay
Group Ltd (which also advises the Society’s management in
relation to remuneration matters generally). Minutes of the
Committee’s meeting are routinely distributed to all Board
members and the Chairman of the Committee reports at
each Board meeting following a meeting of the Committee.
• The RemCo is responsible for setting the remuneration
of the executive Directors, the Chairman and the divisional
directors (who principally comprise the top layer of
management below the Board). The Chairman of the Board
is not present during any discussion of his own remuneration.
During the year, the SARC reviewed with Hay Group Ltd the
results of recent surveys of comparator groups of financial
organisations and public limited companies providing similar
services to the Society and was satisfied with the approach
and the data. Similar reviews are carried out annually and
the process is reviewed every two years.
• The RemCo is not responsible for the remuneration of
non-executive Directors (other than the Chairman). Instead,
with effect from January 2004, a panel comprising the
executive Directors and the Chairman now determines
the level of fees for non-executive Directors, with advice
from Hay Group Ltd. The panel uses benchmarks from similar
comparator groups as used by the RemCo. Until December
2003 the panel comprised the Chief Executive, the Divisional
Director Personnel & Development and the Secretary, with
advice from an independent consultant, Sir Leonard Peach,
and recommended the level of fees for non-executive
Directors to the Board for decision.
Accounts, and the Nationwide Executive Pension Scheme
(‘the Executive Scheme’). The Executive Scheme is a funded
approved scheme, the purpose of which is to provide an
accelerated pension accrual, subject to a maximum of
two-thirds of basic salary. The Society’s contribution rate
to the Executive Scheme is 15%. The Group also has a
funded unapproved pension scheme for executive Directors,
the purpose of which is to provide that part (if any) of an
executive Director’s pension which cannot be provided
by approved pension arrangements due to Inland Revenue
restrictions. The contributions to this scheme are
recommended by the scheme’s independent actuaries.
Table 2 shows the value of executive Directors’ pension
benefits, including those arising from unapproved schemes.
• Executive Directors receive other taxable benefits including
a car or car allowance, healthcare provision and a mortgage
allowance. The aggregate amount of these benefits is
included in Table 1.
Executive Directors’ Contractual Terms• The standard terms for new executive Director appointments
include a contractual notice period of 12 months. Four
executive Directors have contracts on this basis; they are
(with the date of their contract) P F Williamson (5 April 1996),
S D M Bernau (1 November 1996), J H Willens (1 January
2002) and G J Beale (3 March 2003). Any contractual
termination payment will not exceed 12 months’ salary and
accrued benefits. One executive Director, B K Simpson, has a
contract which was entered into on 16 April 1992, before the
current standard terms were introduced, which is terminable
by him on three months’ notice or by the Society on payment
of an amount equivalent to two years’ basic salary.
Non-executive Directors• The level of fees payable to non-executive Directors
is assessed using benchmarks from a comparator group
comprising converted and continuing building societies
and a secondary group of public limited companies providing
comparable services to the Society, including banks and
retailers. Details of non-executive Directors’ emoluments
are set out in Table 1.
• There are no bonus schemes for the Chairman and other
non-executive Directors and non-executive Directors do
not qualify for pension entitlement.
The Procedure for Determining RemunerationCode Principle: There should be a formal and transparent
procedure for developing policy on executive remuneration
and for fixing the remuneration packages of individual
Directors. No Director should be involved in deciding his
or her own remuneration.
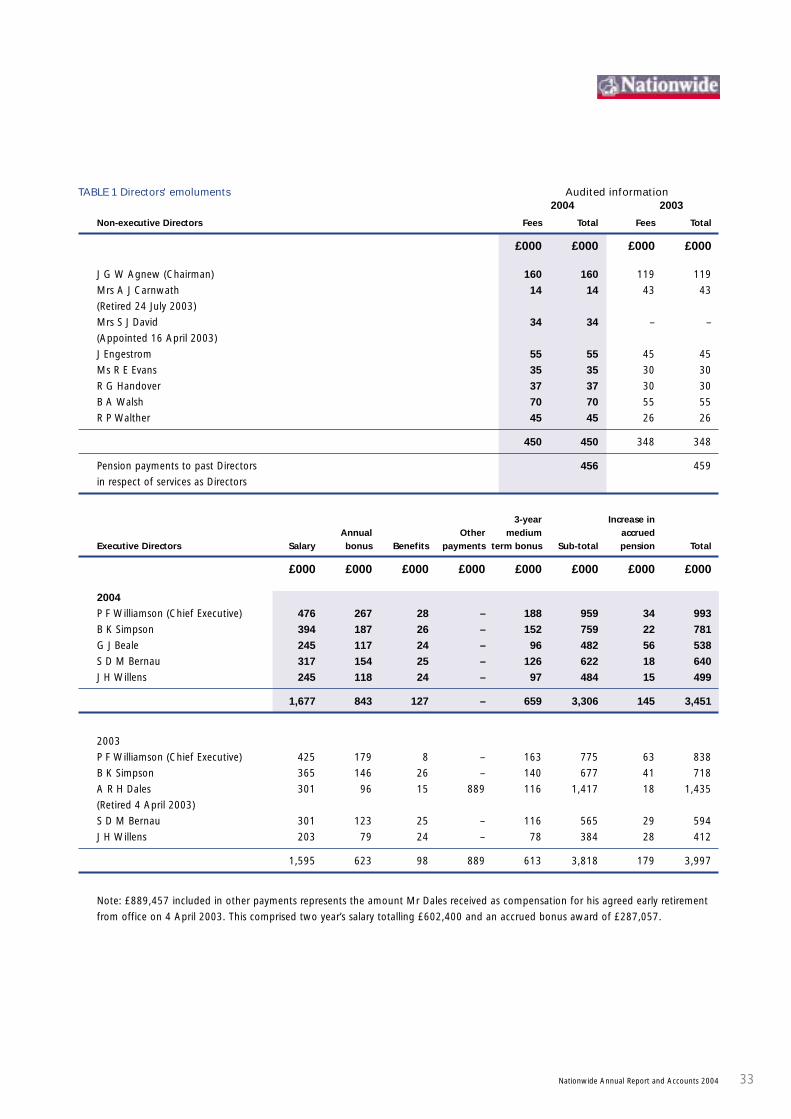
Nationwide Annual Report and Accounts 2004 33
TABLE 1 Directors' emoluments2004 2003
Non-executive Directors Fees Total Fees Total
£000 £000 £000 £000
J G W Agnew (Chairman) 160 160 119 119
Mrs A J Carnwath 14 14 43 43
(Retired 24 July 2003)
Mrs S J David 34 34 – –
(Appointed 16 April 2003)
J Engestrom 55 55 45 45
Ms R E Evans 35 35 30 30
R G Handover 37 37 30 30
B A Walsh 70 70 55 55
R P Walther 45 45 26 26
450 450 348 348
Pension payments to past Directors 456 459
in respect of services as Directors
3-year Increase inAnnual Other medium accrued
Executive Directors Salary bonus Benefits payments term bonus Sub-total pension Total
£000 £000 £000 £000 £000 £000 £000 £000
2004
P F Williamson (Chief Executive) 476 267 28 – 188 959 34 993
B K Simpson 394 187 26 – 152 759 22 781
G J Beale 245 117 24 – 96 482 56 538
S D M Bernau 317 154 25 – 126 622 18 640
J H Willens 245 118 24 – 97 484 15 499
1,677 843 127 – 659 3,306 145 3,451
2003
P F Williamson (Chief Executive) 425 179 8 – 163 775 63 838
B K Simpson 365 146 26 – 140 677 41 718
A R H Dales 301 96 15 889 116 1,417 18 1,435
(Retired 4 April 2003)
S D M Bernau 301 123 25 – 116 565 29 594
J H Willens 203 79 24 – 78 384 28 412
1,595 623 98 889 613 3,818 179 3,997
Note: £889,457 included in other payments represents the amount Mr Dales received as compensation for his agreed early retirement
from office on 4 April 2003. This comprised two year’s salary totalling £602,400 and an accrued bonus award of £287,057.
Audited information
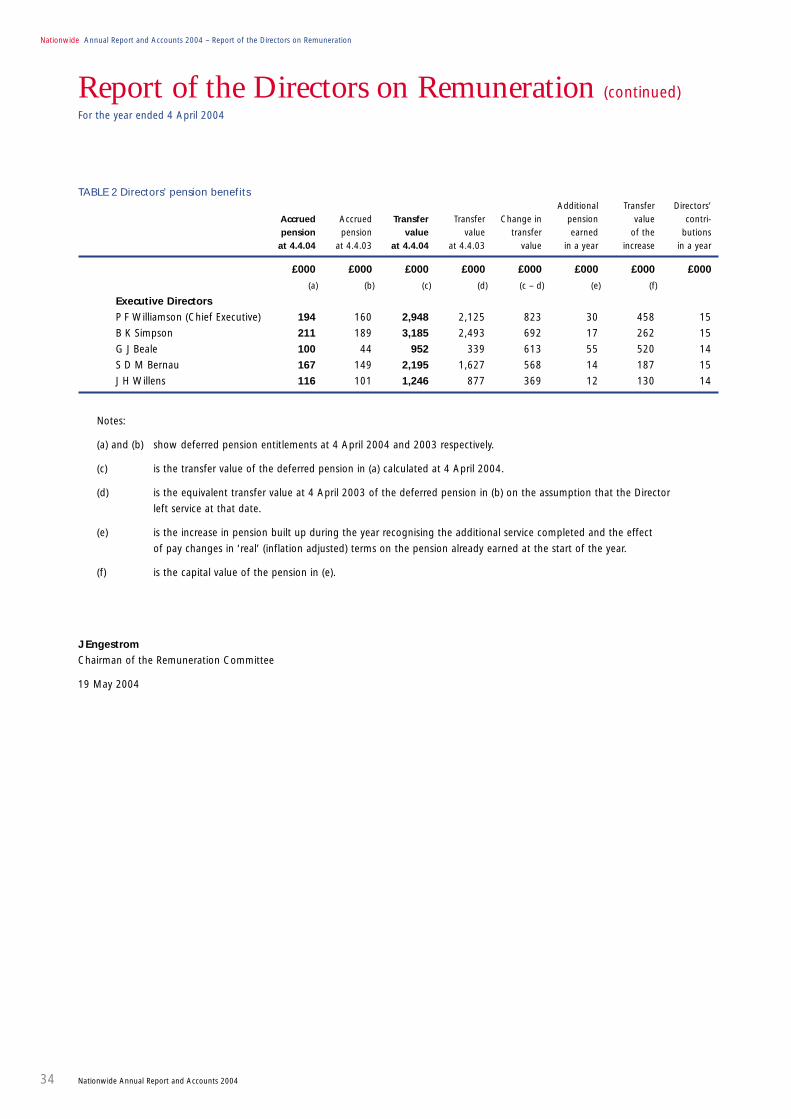
Nationwide Annual Report and Accounts 2004 – Report of the Directors on Remuneration
34 Nationwide Annual Report and Accounts 2004
Report of the Directors on Remuneration (continued) For the year ended 4 April 2004
TABLE 2 Directors’ pension benefitsAdditional Transfer Directors’
Accrued Accrued Transfer Transfer Change in pension value contri-pension pension value value transfer earned of the butions
at 4.4.04 at 4.4.03 at 4.4.04 at 4.4.03 value in a year increase in a year
£000 £000 £000 £000 £000 £000 £000 £000
(a) (b) (c) (d) (c – d) (e) (f)
Executive Directors
P F Williamson (Chief Executive) 194 160 2,948 2,125 823 30 458 15
B K Simpson 211 189 3,185 2,493 692 17 262 15
G J Beale 100 44 952 339 613 55 520 14
S D M Bernau 167 149 2,195 1,627 568 14 187 15
J H Willens 116 101 1,246 877 369 12 130 14
Notes:
(a) and (b) show deferred pension entitlements at 4 April 2004 and 2003 respectively.
(c) is the transfer value of the deferred pension in (a) calculated at 4 April 2004.
(d) is the equivalent transfer value at 4 April 2003 of the deferred pension in (b) on the assumption that the Director
left service at that date.
(e) is the increase in pension built up during the year recognising the additional service completed and the effect
of pay changes in ‘real’ (inflation adjusted) terms on the pension already earned at the start of the year.
(f) is the capital value of the pension in (e).
J Engestrom
Chairman of the Remuneration Committee
19 May 2004
Independent Auditors’ ReportTo the members of Nationwide Building Society
We have audited the Annual Accounts which comprise
the income and expenditure accounts, the balance sheets,
the cash flow statement, the statements of total recognised gains
and losses and the related notes which have been prepared under
the historical cost convention (as modified by the revaluation
of certain fixed assets and investment properties and the
valuation of the long term life assurance business), and
the accounting policies set out in the statement of accounting
policies. We have also audited the disclosures required by the
applicable requirements of Part VIII of the Building Societies
Act 1986 and regulations made under it contained in the
Report of the Directors on Remuneration (‘the auditable part’).
In addition we have examined the Annual Business Statement
(other than the details of Directors and Officers upon which
we are not required to report) and the Directors’ Report.
Respective responsibilities of Directors and AuditorsThe Directors’ responsibilities for the preparation of the Annual
Report include responsibilities for the Annual Accounts, the
Report of the Directors on Remuneration, the Annual Business
Statement and the Directors’ Report and are set out in the
Directors’ Report on pages 24 to 25.
Our responsibility is to audit the Annual Accounts in accordance
with relevant legal and regulatory requirements and United
Kingdom Auditing Standards issued by the Auditing Practices
Board. This report, including the opinion, has been prepared for
and only for the Society’s members as a body in accordance with
Section 78 of the Building Societies Act 1986 and for no other
purpose. We do not, in giving this opinion, accept or assume
responsibility for any other purpose or to any other person to
whom this report is shown or in to whose hands it may come
save where expressly agreed by our prior consent in writing.
We report to you our opinion as to whether the Annual Accounts
give a true and fair view, whether the Annual Accounts and the
auditable part of the Report of the Directors on Remuneration
have been properly prepared in accordance with the applicable
requirements of Part VIII of the Building Societies Act 1986 and
regulations made under it, on certain information included within
the Annual Business Statement, and on whether the Directors’
Report is consistent with the accounting records and the Annual
Accounts. We also report to you if in our opinion we have not
received all the information and explanations we require for our
audit, or if the Annual Accounts are not in agreement with the
accounting records.
We read the other information contained in the Annual Report
and consider the implications for our report if we become aware
of any apparent misstatements or material inconsistencies with
the Annual Accounts, the Annual Business Statement or
the Directors’ Report. The other information contained in the
Annual Report comprises Financial Highlights, the Chairman’s
Statement, the Chief Executive’s Review, the Operating
and Financial Review, the remainder of the Report of the
Directors on Remuneration and the Report of the Directors
on Corporate Governance.
Basis of audit opinionWe conducted our audit in accordance with auditing standards
issued by the Auditing Practices Board. An audit includes
examination, on a test basis, of evidence relevant to the amounts
and disclosures in the Annual Accounts, the Annual Business
Statement and the auditable part of the Report of the Directors
on Remuneration. It also includes an assessment of the significant
estimates and judgements made by the Directors in the
preparation of the Annual Accounts, and of whether the
accounting policies are appropriate to the Society’s and Group’s
circumstances, consistently applied and adequately disclosed.
We planned and performed our audit so as to obtain all the
information and explanations which we considered necessary
in order to provide us with sufficient evidence to give reasonable
assurance that the Annual Accounts and the auditable part of
the Report of the Directors on Remuneration are free from
material misstatement, whether caused by fraud or other
irregularity or error. In forming our opinion we also evaluated
the overall adequacy of the presentation of information in the
Annual Accounts.
OpinionIn our opinion:
• the Annual Accounts give a true and fair view of the state of
affairs of the Society and of the Group as at 4 April 2004 and
of the income and expenditure of the Society and the income
and expenditure and cash flows of the Group for the year
then ended;
• the information given in the Annual Business Statement
(other than the information upon which we are not required
to report) gives a true representation of the matters in
respect of which it is given;
• the information given in the Directors’ Report is consistent
with the accounting records and the Annual Accounts; and
• the Annual Accounts, the Annual Business Statement, the
Directors’ Report and the auditable part of the Report of the
Directors on Remuneration have each been prepared in
accordance with the applicable requirements of Part VIII of the
Building Societies Act 1986 and regulations made under it.
PricewaterhouseCoopers LLP
Chartered Accountants and Registered Auditors
London
19 May 2004
Nationwide Annual Report and Accounts 2004 35
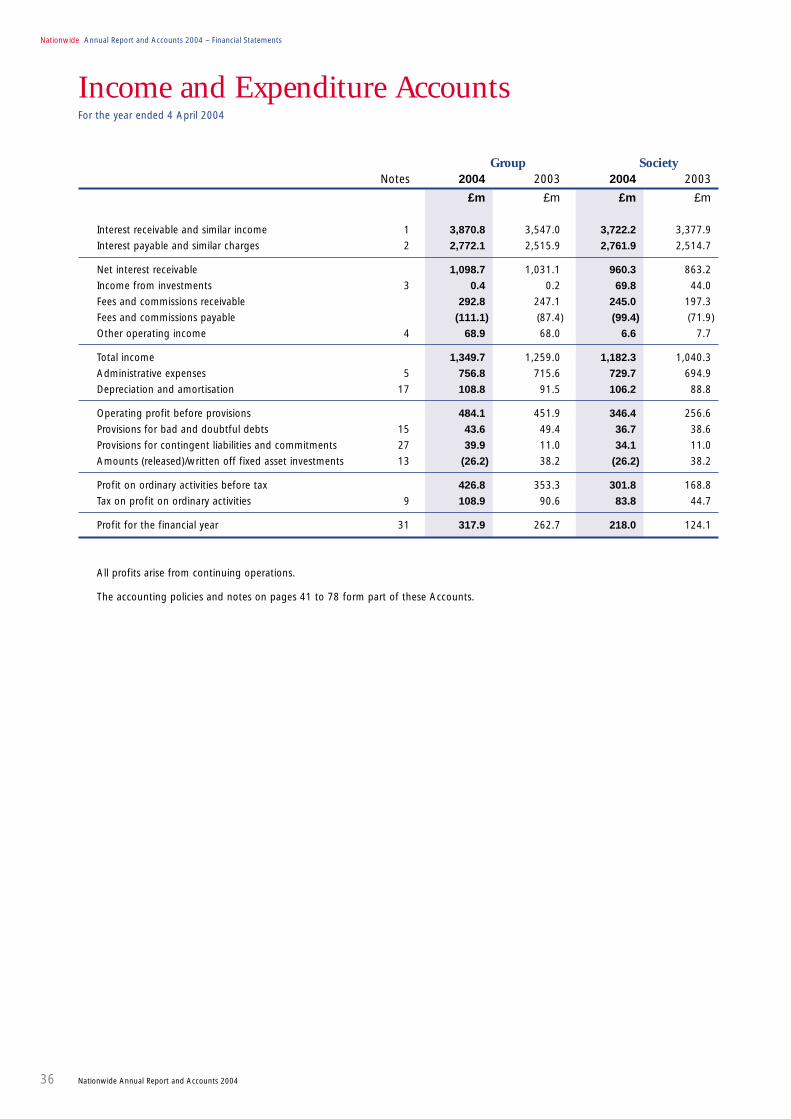
Group SocietyNotes 2004 2003 2004 2003
£m £m £m £m
Nationwide Annual Report and Accounts 2004 – Financial Statements
36 Nationwide Annual Report and Accounts 2004
Interest receivable and similar income 1 3,870.8 3,547.0 3,722.2 3,377.9
Interest payable and similar charges 2 2,772.1 2,515.9 2,761.9 2,514.7
Net interest receivable 1,098.7 1,031.1 960.3 863.2
Income from investments 3 0.4 0.2 69.8 44.0
Fees and commissions receivable 292.8 247.1 245.0 197.3
Fees and commissions payable (111.1) (87.4) (99.4) (71.9)
Other operating income 4 68.9 68.0 6.6 7.7
Total income 1,349.7 1,259.0 1,182.3 1,040.3
Administrative expenses 5 756.8 715.6 729.7 694.9
Depreciation and amortisation 17 108.8 91.5 106.2 88.8
Operating profit before provisions 484.1 451.9 346.4 256.6
Provisions for bad and doubtful debts 15 43.6 49.4 36.7 38.6
Provisions for contingent liabilities and commitments 27 39.9 11.0 34.1 11.0
Amounts (released)/written off fixed asset investments 13 (26.2) 38.2 (26.2) 38.2
Profit on ordinary activities before tax 426.8 353.3 301.8 168.8
Tax on profit on ordinary activities 9 108.9 90.6 83.8 44.7
Profit for the financial year 31 317.9 262.7 218.0 124.1
All profits arise from continuing operations.
The accounting policies and notes on pages 41 to 78 form part of these Accounts.
Income and Expenditure AccountsFor the year ended 4 April 2004

Group SocietyNotes 2004 2003 2004 2003
£m £m £m £m
Nationwide Annual Report and Accounts 2004 37
Statements of Total Recognised Gains and LossesFor the year ended 4 April 2004
Profit for the financial year 317.9 262.7 218.0 124.1
Unrealised surplus on revaluation of properties 30 49.0 34.8 24.4 16.1
366.9 297.5 242.4 140.2
Translation difference on foreign currency investment (7.9) 2.7 – 0.6
Translation difference on foreign currency hedge 11.3 (3.8) – (0.8)
Taxation on translation difference on foreign currency hedge (3.4) 1.1 – 0.2
Total gains and losses recognised relating to the year 366.9 297.5 242.4 140.2
Reported profit on ordinary activities before tax 426.8 353.3 301.8 168.8
Unrealised (increase) in valuation of long term life (34.7) (3.8) – –
assurance business
Realisation of net property revaluation gains of previous year 2.2 3.6 – –
Historical cost profit on ordinary activities before tax 394.3 353.1 301.8 168.8
Historical cost profit for the financial year 285.4 262.9 218.0 124.1
The accounting policies and notes on pages 41 to 78 form part of these Accounts.
Group SocietyNotes 2004 2003 2004 2003
£m £m £m £m
Group Society2004 2003 2004 2003
£m £m £m £m
Note of Historical Cost Profits and LossesFor the year ended 4 April 2004

Nationwide Annual Report and Accounts 2004 – Financial Statements
38 Nationwide Annual Report and Accounts 2004
Group Balance SheetAt 4 April 2004
Notes 2004 2003
£m £m
ASSETS
Liquid assets
Cash in hand and balances with the Bank of England 310.5 348.4
Loans and advances to credit institutions 11 1,464.1 975.8
Debt securities 12 15,650.8 15,661.0
Loans and advances to customers
Loans fully secured on residential property 14 70,762.2 57,212.4
Other loans 14 9,944.0 8,521.0
Investments
Equity shares 16 9.0 6.6
Tangible fixed assets 17 857.6 798.4
Other assets 18 409.9 301.4
Prepayments and accrued income 19 237.4 121.0
99,645.5 83,946.0
Long term life assurance business assets 20 1,782.9 1,471.7
Total assets 101,428.4 85,417.7
LIABILITIES
Shares 21 65,943.9 60,952.2
Amounts owed to credit institutions 22 2,229.3 1,758.8
Amounts owed to other customers 23 4,836.5 4,539.5
Debt securities in issue 24 19,706.5 11,088.1
Other liabilities 25 419.0 250.0
Accruals and deferred income 26 284.6 259.0
Provisions for liabilities and charges 27 55.4 21.9
Subordinated liabilities 28 925.6 594.0
Subscribed capital 29 691.7 296.4
95,092.5 79,759.9
Revaluation reserve 30 211.9 165.1
General reserve 31 4,341.1 4,021.0
99,645.5 83,946.0
Long term life assurance business liabilities 20 1,782.9 1,471.7
Total liabilities 101,428.4 85,417.7
MEMORANDUM ITEMS
Commitments 32 2,930.6 3,561.5
Other loans include £849.8 million (2003 – £932.6 million) of loans which are fully secured on residential property but are classified as
‘other loans’ in accordance with the requirements of the Building Societies Act 1997 (Note 14).
The accounting policies and notes on pages 41 to 78 form part of these Accounts.
Approved by the Board of Directors on 19 May 2004.
J G W Agnew, Chairman
B A Walsh, Deputy Chairman
P F Williamson, Director and Chief Executive
G J Beale, Group Finance Director

Notes 2004 2003
£m £m
ASSETS
Liquid assets
Cash in hand and balances with the Bank of England 306.8 347.8
Loans and advances to credit institutions 11 1,332.9 741.5
Debt securities 12 14,969.1 15,115.1
Loans and advances to customers
Loans fully secured on residential property 14 64,996.2 51,994.3
Other loans 14 8,169.7 6,946.5
Investments
Equity shares 16 1.7 1.6
Investments in subsidiary undertakings 16 7,884.4 7,263.3
Tangible fixed assets 17 602.5 572.3
Other assets 18 110.5 47.9
Prepayments and accrued income 19 354.5 253.2
Total assets 98,728.3 83,283.5
LIABILITIES
Shares 21 65,943.9 60,952.2
Amounts owed to credit institutions 22 2,181.6 1,758.2
Amounts owed to other customers 23 5,271.0 4,830.6
Debt securities in issue 24 19,399.8 11,006.7
Other liabilities 25 307.1 133.1
Accruals and deferred income 26 276.4 252.2
Provisions for liabilities and charges 27 49.5 20.8
Subordinated liabilities 28 925.6 594.0
Subscribed capital 29 691.7 296.4
95,046.6 79,844.2
Revaluation reserve 30 110.7 86.3
General reserve 31 3,571.0 3,353.0
Total liabilities 98,728.3 83,283.5
MEMORANDUM ITEMS
Commitments 32 2,288.0 3,103.2
Other loans include £260.0 million (2003 – £361.0 million) of loans which are fully secured on residential property but are classified
as ‘other loans’ in accordance with the requirements of the Building Societies Act 1997 (Note 14).
The accounting policies and notes on pages 41 to 78 form part of these Accounts.
Approved by the Board of Directors on 19 May 2004.
J G W Agnew, Chairman
B A Walsh, Deputy Chairman
P F Williamson, Director and Chief Executive
G J Beale, Group Finance Director
Nationwide Annual Report and Accounts 2004 39
Society Balance SheetAt 4 April 2004
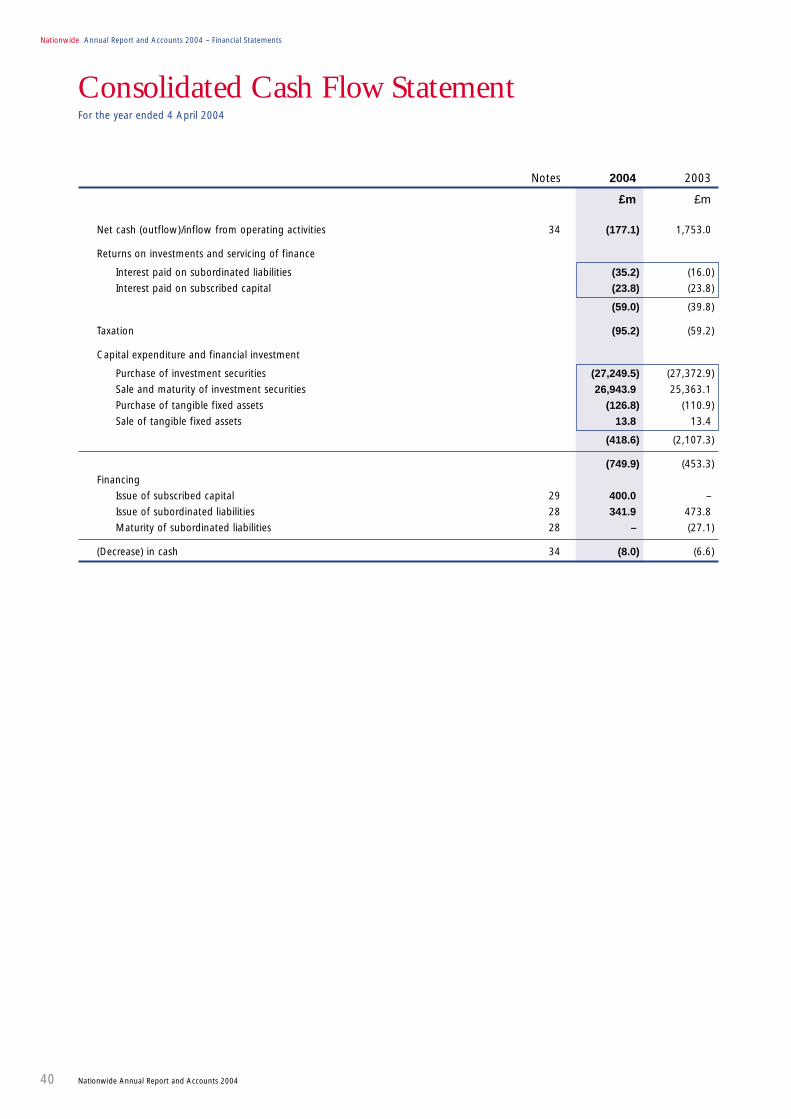
Nationwide Annual Report and Accounts 2004 – Financial Statements
40 Nationwide Annual Report and Accounts 2004
Consolidated Cash Flow StatementFor the year ended 4 April 2004
Notes 2004 2003
£m £m
Net cash (outflow)/inflow from operating activities 34 (177.1) 1,753.0
Returns on investments and servicing of finance
Interest paid on subordinated liabilities (35.2) (16.0)
Interest paid on subscribed capital (23.8) (23.8)
(59.0) (39.8)
Taxation (95.2) (59.2)
Capital expenditure and financial investment
Purchase of investment securities (27,249.5) (27,372.9)
Sale and maturity of investment securities 26,943.9 25,363.1
Purchase of tangible fixed assets (126.8) (110.9)
Sale of tangible fixed assets 13.8 13.4
(418.6) (2,107.3)
(749.9) (453.3)
Financing
Issue of subscribed capital 29 400.0 –
Issue of subordinated liabilities 28 341.9 473.8
Maturity of subordinated liabilities 28 – (27.1)
(Decrease) in cash 34 (8.0) (6.6)

Statement of Accounting Policies
Accounting conventionThe Accounts have been prepared under the historical cost
convention as modified by the revaluation of certain freehold
and long leasehold premises and investment properties and
the valuation of the long term life assurance business, in
accordance with the Building Societies (Accounts and Related
Provisions) Regulations 1998 (the ‘Regulations’) with applicable
accounting standards issued by the Accounting Standards Board
and pronouncements of its Urgent Issues Task Force and with
the Statements of Recommended Practice (SORPs) issued by
the British Bankers’ Association.
The Association of British Insurers (ABI) has issued a SORP
addressing the accounting and disclosure of insurance business
for insurance undertakings. Nationwide is not an insurance
undertaking and the ABI SORP does not specifically address
the accounting for long term life assurance business for
predominantly retail banking institutions. In line with other retail
banking groups, Nationwide uses the embedded value method
to measure its interest in the long term life assurance business.
Although the Group has continued to account for pensions
under SSAP 24, the additional transitional disclosures required
under Financial Reporting Standard (‘FRS’) 17 ‘Retirement
Benefits’ are set out in Note 8 to the Accounts.
An analysis of results by business segment is provided in
Note 10. A business segment is defined as one providing
products with different risks and returns from other business
segments. No segmental analysis is presented on geographical
lines because substantially all of the Group’s activities are in
the United Kingdom and the Isle of Man.
Basis of consolidationThe Group Accounts consolidate the assets, liabilities and
results of the Society, its subsidiary and associate undertakings.
Companies that do not meet the legal definition of a subsidiary
but which give rise to benefits that are in substance no different
to those that would arise from subsidiaries are considered to be
quasi-subsidiaries and are also consolidated. Investments in
subsidiary undertakings are stated in the Society Accounts at
cost less provisions for any impairment in value. The Directors
consider it appropriate for administrative and commercial
reasons that subsidiary undertakings have financial years ending
on 31 March. Adjustment is made for any individually
significant transactions arising between 31 March and the
Society’s year end. Certain quasi-subsidiaries have year ends
other than 31 March and are consolidated using internal
management accounts prepared to that date.
As the consolidated accounts include partnerships where
a Group member is a partner, advantage has been taken of
the exemption given by Regulation 7 of the Partnerships and
Unlimited Companies (Accounts) Regulations 1993 with regard
to the preparation and filing of individual partnership accounts.
In order to aid comparability certain comparatives have
been re-classified.
Income recognitionInterest is recognised in the Income and Expenditure Account
on an accruals basis with the exception of accounts where
interest has been suspended in accordance with the
provisioning policy for bad and doubtful debts as set out below.
Fees received by the Group relating to the risk borne for a
customer are offset against Loans to Customers on the balance
sheet and are then taken to interest receivable and similar
income so as to achieve a constant yield over the expected
life of the underlying loan. Other fees and commissions are
recognised on an accruals basis in the period during which
they are earned or incurred.
Mortgage incentivesThe costs of mortgage cashbacks and discounts are charged
as incurred to the Income and Expenditure Account.
Goodwill Goodwill arising on the acquisition of subsidiary undertakings
represents the excess of cost over the fair value of net tangible
assets acquired. Goodwill arising on each acquisition is
capitalised and amortised on a straight line basis over its useful
economic life which does not exceed 20 years. Useful economic
life is determined at the time of acquisition by considering
the nature of the acquired business, the economic environment
in which it operates and the period over which the value of
the business is expected to exceed the values of the net
tangible assets.
Deferred taxationFull provision is made for deferred tax on all timing differences
between the recognition of gains and losses in the accounts
and their recognition in a tax computation. Deferred taxation
is provided at tax rates expected to be applicable when a
liability or asset crystallises, on a non-discounted basis. Deferred
tax assets are recognised to the extent that it is regarded that
there will be sufficient taxable profits available against which
they can be offset in the future.
Nationwide Annual Report and Accounts 2004 41
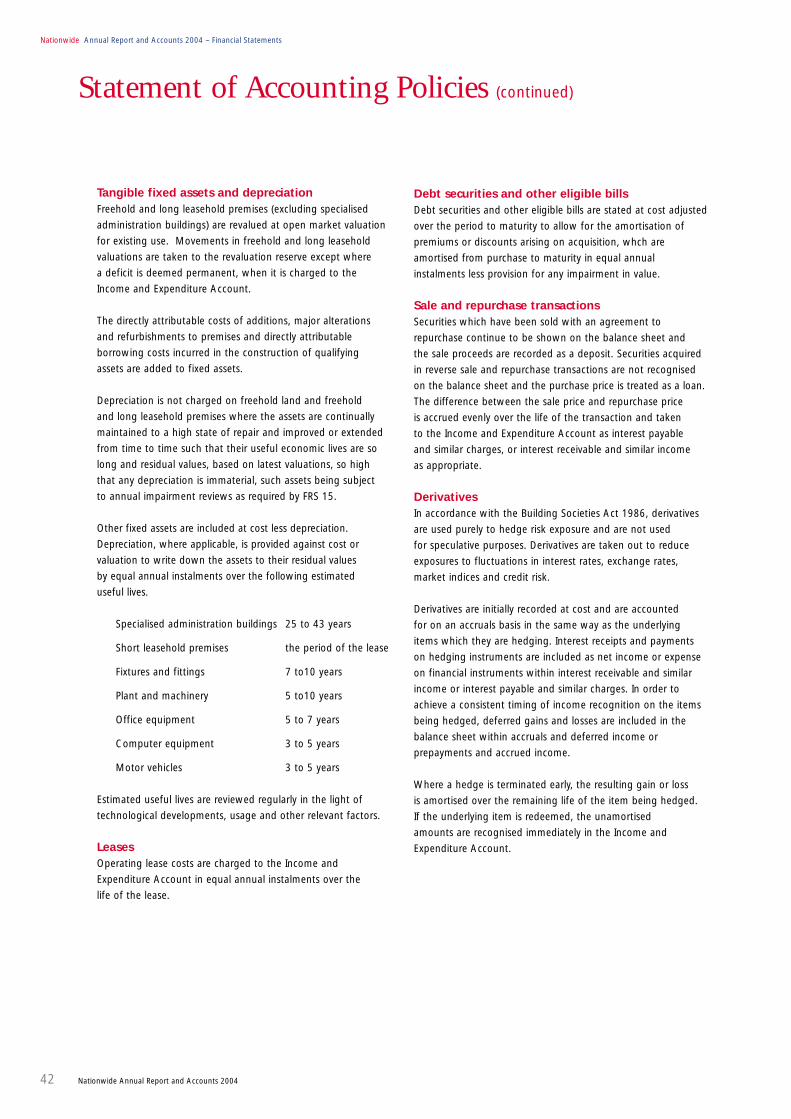
Nationwide Annual Report and Accounts 2004 – Financial Statements
42 Nationwide Annual Report and Accounts 2004
Tangible fixed assets and depreciationFreehold and long leasehold premises (excluding specialised
administration buildings) are revalued at open market valuation
for existing use. Movements in freehold and long leasehold
valuations are taken to the revaluation reserve except where
a deficit is deemed permanent, when it is charged to the
Income and Expenditure Account.
The directly attributable costs of additions, major alterations
and refurbishments to premises and directly attributable
borrowing costs incurred in the construction of qualifying
assets are added to fixed assets.
Depreciation is not charged on freehold land and freehold
and long leasehold premises where the assets are continually
maintained to a high state of repair and improved or extended
from time to time such that their useful economic lives are so
long and residual values, based on latest valuations, so high
that any depreciation is immaterial, such assets being subject
to annual impairment reviews as required by FRS 15.
Other fixed assets are included at cost less depreciation.
Depreciation, where applicable, is provided against cost or
valuation to write down the assets to their residual values
by equal annual instalments over the following estimated
useful lives.
Specialised administration buildings 25 to 43 years
Short leasehold premises the period of the lease
Fixtures and fittings 7 to10 years
Plant and machinery 5 to10 years
Office equipment 5 to 7 years
Computer equipment 3 to 5 years
Motor vehicles 3 to 5 years
Estimated useful lives are reviewed regularly in the light of
technological developments, usage and other relevant factors.
LeasesOperating lease costs are charged to the Income and
Expenditure Account in equal annual instalments over the
life of the lease.
Debt securities and other eligible billsDebt securities and other eligible bills are stated at cost adjusted
over the period to maturity to allow for the amortisation of
premiums or discounts arising on acquisition, whch are
amortised from purchase to maturity in equal annual
instalments less provision for any impairment in value.
Sale and repurchase transactionsSecurities which have been sold with an agreement to
repurchase continue to be shown on the balance sheet and
the sale proceeds are recorded as a deposit. Securities acquired
in reverse sale and repurchase transactions are not recognised
on the balance sheet and the purchase price is treated as a loan.
The difference between the sale price and repurchase price
is accrued evenly over the life of the transaction and taken
to the Income and Expenditure Account as interest payable
and similar charges, or interest receivable and similar income
as appropriate.
DerivativesIn accordance with the Building Societies Act 1986, derivatives
are used purely to hedge risk exposure and are not used
for speculative purposes. Derivatives are taken out to reduce
exposures to fluctuations in interest rates, exchange rates,
market indices and credit risk.
Derivatives are initially recorded at cost and are accounted
for on an accruals basis in the same way as the underlying
items which they are hedging. Interest receipts and payments
on hedging instruments are included as net income or expense
on financial instruments within interest receivable and similar
income or interest payable and similar charges. In order to
achieve a consistent timing of income recognition on the items
being hedged, deferred gains and losses are included in the
balance sheet within accruals and deferred income or
prepayments and accrued income.
Where a hedge is terminated early, the resulting gain or loss
is amortised over the remaining life of the item being hedged.
If the underlying item is redeemed, the unamortised
amounts are recognised immediately in the Income and
Expenditure Account.
Statement of Accounting Policies (continued)
Foreign currency translationForeign currency income and expenditure are included in
the Income and Expenditure Account at the rate of exchange
current at the date the transaction took place, unless the
transaction is hedged, when it is translated at the underlying
rate of exchange inherent in the associated hedge contract.
Amounts due or receivable under foreign currency swap
contracts are translated at the exchange rate inherent in those
contracts and are included within accruals and deferred income
or prepayments and accrued income. All other non-Sterling
assets and liabilities are translated at the rates of exchange
ruling at the balance sheet date.
Exchange differences on the translation of the opening net
assets of overseas Group undertakings are taken to reserves.
Exchange differences arising from the translation of funding
and hedge transactions relating to investments in such
undertakings are also taken to reserves to offset the exchange
differences arising from the translation of these investments.
Debt securities in issue and subordinated liabilitiesPremiums and discounts, together with costs associated with
the issue of debt securities and subordinated liabilities, are
accounted for as an adjustment to the amount of the liability
and amortised in equal annual instalments to interest payable
and similar charges over the term of the instrument.
Provisions for bad and doubtful debtsProvisions are made to reduce the value of loans and
advances to the amount that the Directors consider likely
to be recovered.
Specific provisions
Specific provisions are raised against defaulted loans where,
in the opinion of the Directors, it is likely that some of the
capital will not be repaid or, where the loan is secured,
recovered through enforcement of security. No specific provision
is made where the estimated value of the security is in excess
of the secured debt.
The specific provisions established against the Group’s high
volume homogeneous loans such as the residential mortgage,
personal lending and credit card portfolios are calculated using
statistical techniques. These techniques apply a propensity
factor against each portfolio based on recent experience and
other relevant risk considerations to determine the appropriate
provision. Specific provisions are calculated as the difference
between the outstanding loan balance and, where applicable,
the estimated market value (net of costs) of the security.
For residential mortgages, the estimated value of security is
derived by applying Nationwide’s regional house price index less
a forced sale discount to the purchase value for each property.
For the Group’s non-retail lending portfolios, the specific
provision is determined on a case by case basis from a review
of the financial condition of the counterparty and any guarantor
and takes into account the nature and value of any security held.
General provisions
General provisions are made to cover latent losses which,
although not yet specifically identified, are known from
experience to exist in the Group’s loan portfolios. General
provisions are determined using management judgement based
on a combination of past loss experience, lending quality and
other relevant risk considerations.
Specific and general provisions are deducted from loans and
advances. The charge to the Income and Expenditure Account
represents new or additional provisions made less any reduction
in provisions or recoveries of amounts previously written off.
Loans on which interest is being placed in suspense
When the collection of interest is in doubt it is credited to a
suspense account, excluded from interest income and netted off
loans and advances. However, interest continues to be charged
to the customer’s account. This interest is subsequently written
off if there is deemed to be no realistic prospect of recovery.
Investment propertiesInvestment properties, which comprise properties held for
rental, are revalued annually to open market value. The changes
in market value are reflected in the revaluation reserve except
where any impairment is deemed permanent, when it is taken
to the Income and Expenditure Account. No provision is made
for depreciation of investment properties. This is a departure
from the requirements of accounting legislation which requires
all properties to be depreciated. The Directors consider that
these properties are held for investment and that to depreciate
them would not give a true and fair view. The depreciation
charge is only one of the factors reflected in the annual
valuation and therefore the amount of depreciation
which might otherwise have been charged cannot be
readily quantified.
Nationwide Annual Report and Accounts 2004 43
Statement of Accounting Policies (continued)

Nationwide Annual Report and Accounts 2004 – Financial Statements
44 Nationwide Annual Report and Accounts 2004
Pension costsThe expected cost, including variations from the regular cost,
of pensions in respect of the Group's pension schemes is charged
to the Income and Expenditure Account so as to spread the cost
of pensions over the expected service lives of employees in the
schemes. The pension cost is assessed in accordance with the
advice of independent actuaries. A formal actuarial valuation of
the Society's pension scheme is undertaken on a triennial basis.
Long term life assurance businessNationwide uses the embedded value method of accounting
to measure its interest in the long term life assurance business.
In order to reflect the different nature of the shareholder’s and
policyholders’ interests in the long term life assurance business,
the value of the long term life assurance business attributable
to the shareholder and the assets and liabilities attributable to
policyholders are disclosed separately in the Group balance sheet.
The value of the shareholder’s interest in the long term life
assurance business (‘the embedded value’) is included in other
assets in the balance sheet. This represents the present value
of future earnings of in-force business, together with the net
tangible assets and the surplus retained within the long term
life assurance fund. The value of in-force business is determined
annually using assumed economic parameters (future investment
returns, expense inflation and risk discount rate) and taxation,
mortality, persistency and expense assumptions. Changes in
the value of the long term life assurance business, which are
determined on a post-tax basis, are included in other operating
income and are grossed up at the effective rate of tax for
the purpose of presentation.
Long term life assurance funds comprising the assets and
liabilities relating to the policyholders of the long term life
assurance business are of a different nature to the assets and
liabilities of the rest of the Group. Accordingly the Directors have
separately classified the long term life assurance business assets
and liabilities on the face of the Group balance sheet. An analysis
of these assets and liabilities is shown separately in Note 20
to the Accounts.
Statement of Accounting Policies (continued)
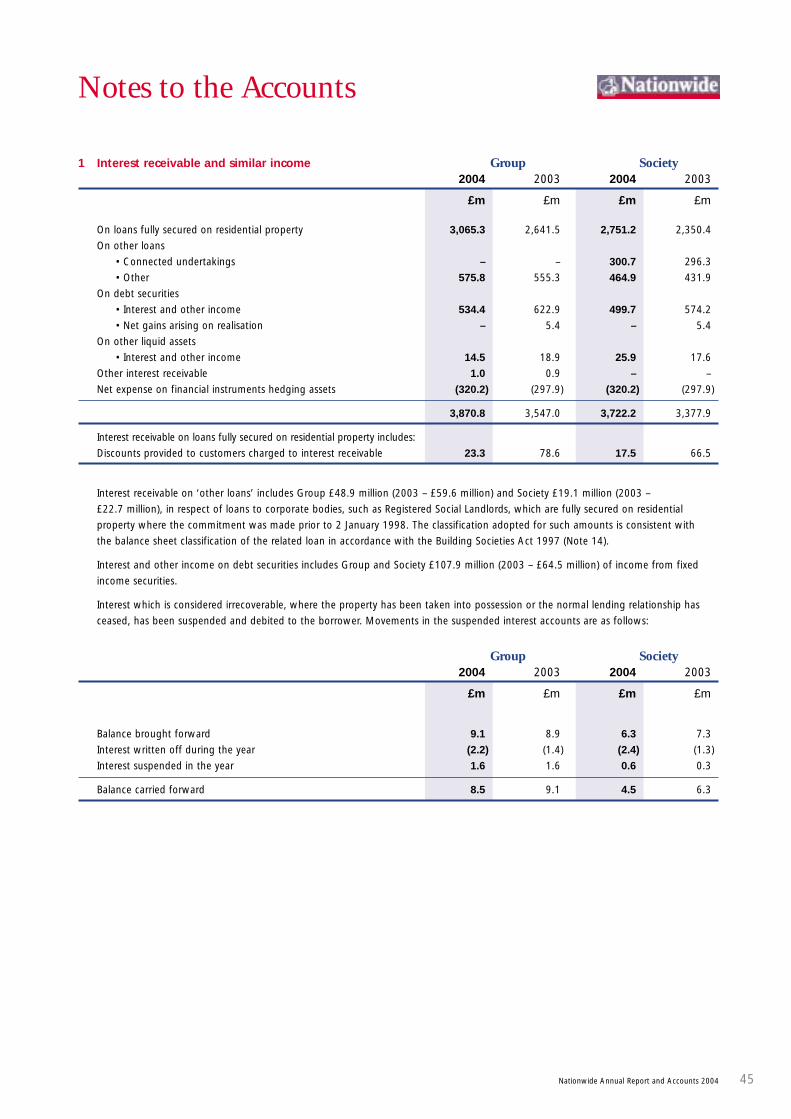
Notes to the Accounts
1 Interest receivable and similar income Group Society2004 2003 2004 2003
£m £m £m £m
On loans fully secured on residential property 3,065.3 2,641.5 2,751.2 2,350.4
On other loans
• Connected undertakings – – 300.7 296.3
• Other 575.8 555.3 464.9 431.9
On debt securities
• Interest and other income 534.4 622.9 499.7 574.2
• Net gains arising on realisation – 5.4 – 5.4
On other liquid assets
• Interest and other income 14.5 18.9 25.9 17.6
Other interest receivable 1.0 0.9 – –
Net expense on financial instruments hedging assets (320.2) (297.9) (320.2) (297.9)
3,870.8 3,547.0 3,722.2 3,377.9
Interest receivable on loans fully secured on residential property includes:
Discounts provided to customers charged to interest receivable 23.3 78.6 17.5 66.5
Interest receivable on ‘other loans’ includes Group £48.9 million (2003 – £59.6 million) and Society £19.1 million (2003 –
£22.7 million), in respect of loans to corporate bodies, such as Registered Social Landlords, which are fully secured on residential
property where the commitment was made prior to 2 January 1998. The classification adopted for such amounts is consistent with
the balance sheet classification of the related loan in accordance with the Building Societies Act 1997 (Note 14).
Interest and other income on debt securities includes Group and Society £107.9 million (2003 – £64.5 million) of income from fixed
income securities.
Interest which is considered irrecoverable, where the property has been taken into possession or the normal lending relationship has
ceased, has been suspended and debited to the borrower. Movements in the suspended interest accounts are as follows:
Group Society2004 2003 2004 2003
£m £m £m £m
Balance brought forward 9.1 8.9 6.3 7.3
Interest written off during the year (2.2) (1.4) (2.4) (1.3)
Interest suspended in the year 1.6 1.6 0.6 0.3
Balance carried forward 8.5 9.1 4.5 6.3
Nationwide Annual Report and Accounts 2004 45
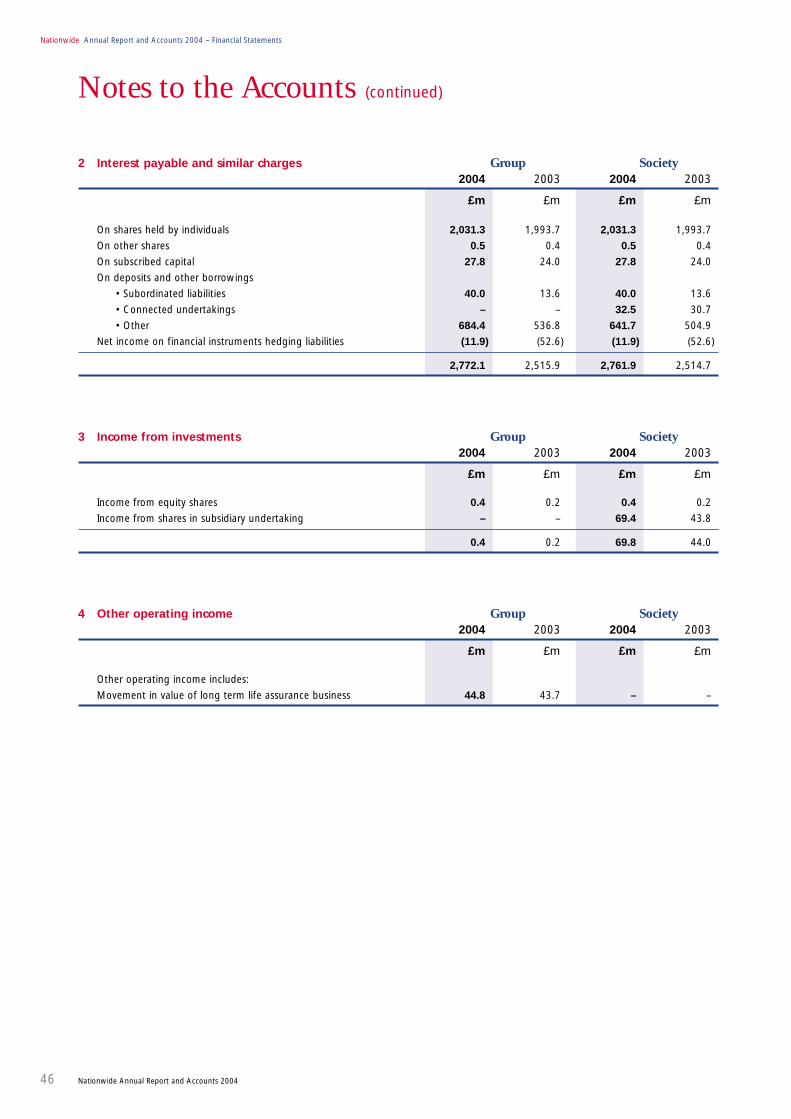
2 Interest payable and similar charges Group Society2004 2003 2004 2003
£m £m £m £m
Nationwide Annual Report and Accounts 2004 – Financial Statements
46 Nationwide Annual Report and Accounts 2004
On shares held by individuals 2,031.3 1,993.7 2,031.3 1,993.7
On other shares 0.5 0.4 0.5 0.4
On subscribed capital 27.8 24.0 27.8 24.0
On deposits and other borrowings
• Subordinated liabilities 40.0 13.6 40.0 13.6
• Connected undertakings – – 32.5 30.7
• Other 684.4 536.8 641.7 504.9
Net income on financial instruments hedging liabilities (11.9) (52.6) (11.9) (52.6)
2,772.1 2,515.9 2,761.9 2,514.7
3 Income from investments Group Society2004 2003 2004 2003
£m £m £m £m
Income from equity shares 0.4 0.2 0.4 0.2
Income from shares in subsidiary undertaking – – 69.4 43.8
0.4 0.2 69.8 44.0
4 Other operating income Group Society2004 2003 2004 2003
£m £m £m £m
Other operating income includes:
Movement in value of long term life assurance business 44.8 43.7 – –
Notes to the Accounts (continued)

Notes to the Accounts (continued)
5 Administrative expenses Group Society2004 2003 2004 2003
£m £m £m £m
Nationwide Annual Report and Accounts 2004 47
Employee costs
• Wages and salaries 312.4 288.9 294.4 271.1
• Social security costs 29.5 23.5 27.9 21.7
• Other pension costs 46.1 47.0 43.6 44.1
388.0 359.4 365.9 336.9
Other administrative expenses 368.8 356.2 363.8 358.0
756.8 715.6 729.7 694.9
Other administrative expenses include:
Property rentals under operating leases 26.8 26.7 26.1 26.0
Auditors’ remuneration and expenses
• Statutory audit fees 0.9 0.8 0.6 0.5
• Audit related and regulatory fees 0.1 0.1 0.1 0.1
1.0 0.9 0.7 0.6
• Further assurance services 0.3 0.2 0.3 0.2
• Tax advisory 0.1 0.1 0.1 0.1
1.4 1.2 1.1 0.9
The Group adopted its current policy in relation to the use of its auditors on non audit engagements during 2003. This policy sets
out the types of service they are precluded from performing which includes all management consultancy services. Certain de minimis
limits for non audit fees have also been established. All non audit fees where the fee is expected to exceed the relevant limit, are
subject to pre-approval by the Audit Committee. In addition each Audit Committee meeting receives a report of amounts paid and
payable to the auditors.
6 Employees Group Society2004 2003 2004 2003
The average number of persons employed during the year was:
• Full-time 10,676 10,542 9,809 9,678
• Part-time 4,885 4,647 4,712 4,479
15,561 15,189 14,521 14,157
Building society
• Central administration 6,268 5,941 6,268 5,941
• Branches 8,253 8,216 8,253 8,216
Subsidiaries 1,040 1,032 – –
15,561 15,189 14,521 14,157
Employee numbers include 464 (2003 – 458) people relating to the Group’s life assurance operation whose costs are included in
other operating income (Note 4). Central administration employee numbers include employees engaged in direct customer-facing
operations in administrative centres.

Nationwide Annual Report and Accounts 2004 – Financial Statements
48 Nationwide Annual Report and Accounts 2004
7 Directors' emoluments Directors’ emoluments are shown as part of the Report of the Directors on Remuneration in accordance with Schedule 5, paragraphs
4 and 5 to the Building Societies (Accounts and Related Provisions) Regulations 1998.
8 Pension arrangements The majority of the Group’s employees are members of the defined benefit scheme the Nationwide Pension Fund (the ‘Fund’).
The Group also participates in other pension arrangements for a number of employees of subsidiary companies and has two
unapproved pension schemes, one unfunded scheme for certain Directors who were members of the Board prior to 10 January 1990
and a funded scheme for executive Directors and Officers whose benefits are unable to be provided in full using an approved
pension arrangement.
The pension cost included in administrative expenses under SSAP 24 (Note 5) and the cash contributions paid to the Fund are based
on the latest full actuarial valuation as at 31 March 2001. The valuation was performed using the projected unit method in respect
of pension benefits and the current unit method in respect of lump sum death in service benefits.
The next full actuarial valuation will be as at 31 March 2004. The results will not be available until after the publication of these accounts.
The assumptions used in assessing the pension cost are a matter of judgement for the independent actuary in consultation with the
Society. The assumptions used in determining the cash contribution are recommended by the independent actuary and are agreed
with the Fund Trustees. The assumptions, which are based on the latest full actuarial valuation under SSAP 24 as at 31 March 2001,
and the resulting pension charge are summarised below:
Cash contribution and pension cost assumptions(Years ended 4 April 2004 and 4 April 2003)
Rate of return on investments 6.8% (before retirement)
5.8% (after retirement)
Rate of increase in salaries 4.3% – 5.3% per annum
Rate of increase in pensions 2.4% per annum
Market value of the Fund’s assets, excluding money purchase £752.0 million
additional voluntary contributions
Market value as a percentage of the value of the benefits based on 98%
service to date, allowing for assumed future salary and
pension increases
Long term regular cost 17.3%
Employer’s cash contribution rate 19.1%
Employees’ contribution rate 5%
Notes to the Accounts (continued)

Notes to the Accounts (continued)
Nationwide Annual Report and Accounts 2004 49
8 Pension arrangements (continued) Group Society2004 2003 2004 2003
£m £m £m £m
Pension charge for the year (Note 5) 46.1 47.0 43.6 44.1
The pension charge is calculated after taking account of:
• Amortisation of pension fund deficit 1.0 1.0 1.0 1.0
Cumulative excess of cash contributions paid to the Fund over
the SSAP 24 pension charge included in:
• Prepayments and accrued income (Note 19) (108.3) (5.3) (108.3) (5.3)
• Provisions for liabilities and charges including charge for 5.6 5.4 5.6 5.3
contribution to unfunded Directors’ pension obligations (Note 27)
Provision for part-time employee pension rights included in 0.5 0.6 0.5 0.6
Provisions for liabilities and charges (Note 27)
Because of lower investment returns and declining stock markets, the Directors consider that the deficit in the Fund has increased
significantly since the last full actuarial valuation at 31 March 2001. Consequently, in May 2003, an additional £100 million was paid
into the Fund to reduce the deficit. The employees’ contribution rate was increased from 5% to 6% on 1 July 2003 for members
in the final salary section of the Fund.
The Group’s pension arrangements for employees who joined the Fund after 31 December 2001 are based on a career average
of revalued earnings (‘CARE’) rather than their final salary. The employer’s cash contribution rate for these employees is 12.6%.
The employees’ contribution rate is 5%.
The Group provides concessionary rate mortgages and limited post-retirement healthcare benefits to certain of its former employees.
The cost of providing these benefits is not significant and is recognised in the Income and Expenditure Account as it is incurred.
FRS 17 DISCLOSURES
The Group has continued to account for pensions under SSAP 24. Financial Reporting Standard 17, Retirement Benefits, will
fundamentally change the calculation and reporting of the cost of retirement benefits. The transitional arrangements of FRS 17
requires additional disclosures as set out below. Only the Nationwide Pension Fund is of a material size for the purposes of this note.
As explained above, a full actuarial valuation of the Fund was carried out at 31 March 2001 and has been updated to take account
of the requirements of FRS 17, to 4 April 2004 by qualified independent actuaries.
MAIN FINANCIAL ASSUMPTIONS
The major assumptions used for the FRS 17 disclosures are:
4 April 2004 4 April 2003 4 April 2002(%pa) (%pa) (%pa)
Inflation 3.0 2.6 2.7
Rate of general long term increase in salaries 5.0 4.6* 4.7*
Rate of increase to pensions in payment 2.8 2.6 2.7
Discount rate for scheme liabilities 5.5 5.5 6.0
*plus an additional 1% p.a. until 4 April 2004

Nationwide Annual Report and Accounts 2004 – Financial Statements
50 Nationwide Annual Report and Accounts 2004
Notes to the Accounts (continued)
8 Pension arrangements (continued) Long term Long term Long term
rate of return Value at rate of return Value at rate of return Value at
expected at 4 April 2004 expected at 4 April 2003 expected at 4 April 2002
4 April 2004 £m 4 April 2003 £m 4 April 2002 £m
SCHEME ASSETS AND LIABILITIES
AND EXPECTED RETURN
Equities 7.9% 729 7.7% 490 8.1% 578
Bonds (gilts) 5.1% 224 4.9% 146 5.5% 167
Other 4.9% 10 4.3% 28 4.1% 24
Total market value of assets 7.2% 963 6.9% 664 7.4% 769
Present value of scheme liabilities (1,394) (1,152) (965)
Deficit in the scheme (431) (488) (196)
Related deferred tax asset 129 146 59
Net pension liability (302) (342) (137)
The assets of the scheme are mainly invested with Fidelity Pensions Management, Barclays Global Investors Limited and UBS Global
Asset Management UK Ltd.
Money purchase pension assets and liabilities (AVCs) are excluded from the table above.
The decrease in the net pension liability arises from an increase in the market value of investments and includes the net effect of the
special contribution of £100 million, as discussed above, and changes in actuarial assumptions mainly relating to mortality rates and
the long-term outlook for inflation that have lead to an increase in scheme liabilities.
The position shown represents the funded status of the Fund based on the market conditions at 4 April 2004. Market related
calculations are subject to daily variations. The net pension liability shown does not represent a debt of the Society. Contributions
to the Fund will continue to be determined in accordance with the full triennial actuarial valuations.

Notes to the Accounts (continued)
Nationwide Annual Report and Accounts 2004 51
8 Pension arrangements (continued)If the requirements of FRS 17 were fully adopted in the Annual Accounts in the year to 4 April 2004 the impact would be:
2004 2003
£m £m
Amount charged to operating profit:
Current service cost (55) (47)
Past service cost (2) –
Total operating charge (57) (47)
Amount charged to other finance income:
Expected return on pension scheme assets 47 58
Interest on pension scheme liabilities (65) (59)
Net amount charged to other finance income (18) (1)
Analysis of amount in the statement of total recognised gains and losses:
Actual return less expected return on pension scheme assets 108 (197)
Experience gains and losses arising on scheme liabilities (2) (3)
Changes in assumptions underlying the present value of scheme liabilities (120) (86)
Actuarial loss recognised in the statement of total recognised gains and losses (14) (286)
Analysis of movement in deficit during the year:
Deficit in scheme at beginning of the year (488) (196)
Current service cost (55) (47)
Other finance charge (18) (1)
Contributions 146 42
Past service charge (2) –
Actuarial loss (14) (286)
Deficit in scheme at the end of the year (431) (488)
Details of experience gains and losses for the year to 4 April 2004:
Difference between expected and actual return on scheme assets:
• Amount (£ million) 108 (197)
• Percentage of scheme assets 11.2%
Experience (losses) on scheme liabilities:
• Amount (£ million) (2) (3)
• Percentage of the present value of the scheme liabilities 0.1%
Total amount recognised in the statement of total recognised gains and losses:
• Amount (£ million) (14) (286)
• Percentage of the present value of the scheme liabilities 1.0%
If the net pension liability had been recognised in the Annual Accounts, the Group’s liabilities would increase by £302 million
and the Group’s general reserve at 4 April 2004 would be as follows:
4 April 2004 4 April 2003
£m £m
General reserve excluding net pension liability 4,341.1 4,021.0
SSAP 24 prepayment (net of deferred tax) (75.8) (3.7)
Pension liability (net of deferred tax) (302.0) (342.0)
3,963.3 3,675.3
29.7%
0.3%
24.8%
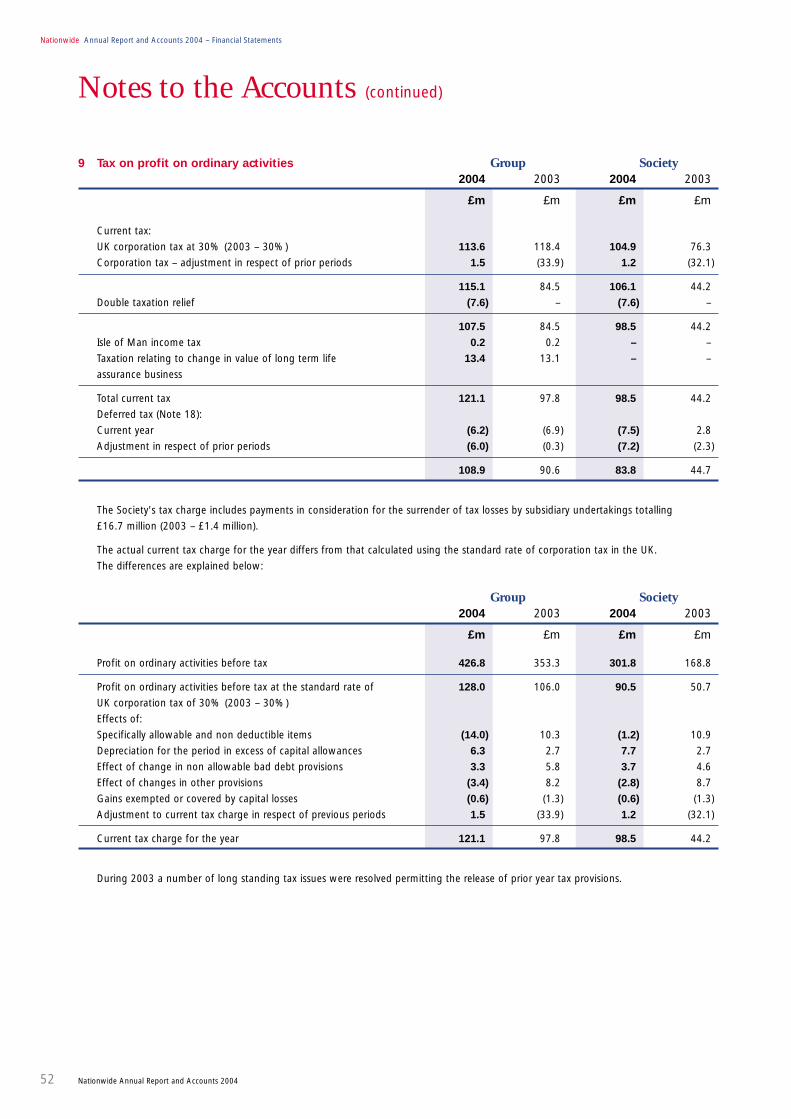
9 Tax on profit on ordinary activities Group Society2004 2003 2004 2003
£m £m £m £m
Nationwide Annual Report and Accounts 2004 – Financial Statements
52 Nationwide Annual Report and Accounts 2004
Notes to the Accounts (continued)
Current tax:
UK corporation tax at 30% (2003 – 30%) 113.6 118.4 104.9 76.3
Corporation tax – adjustment in respect of prior periods 1.5 (33.9) 1.2 (32.1)
115.1 84.5 106.1 44.2
Double taxation relief (7.6) – (7.6) –
107.5 84.5 98.5 44.2
Isle of Man income tax 0.2 0.2 – –
Taxation relating to change in value of long term life 13.4 13.1 – –
assurance business
Total current tax 121.1 97.8 98.5 44.2
Deferred tax (Note 18):
Current year (6.2) (6.9) (7.5) 2.8
Adjustment in respect of prior periods (6.0) (0.3) (7.2) (2.3)
108.9 90.6 83.8 44.7
The Society's tax charge includes payments in consideration for the surrender of tax losses by subsidiary undertakings totalling
£16.7 million (2003 – £1.4 million).
The actual current tax charge for the year differs from that calculated using the standard rate of corporation tax in the UK.
The differences are explained below:
Group Society2004 2003 2004 2003
£m £m £m £m
Profit on ordinary activities before tax 426.8 353.3 301.8 168.8
Profit on ordinary activities before tax at the standard rate of 128.0 106.0 90.5 50.7
UK corporation tax of 30% (2003 – 30%)
Effects of:
Specifically allowable and non deductible items (14.0) 10.3 (1.2) 10.9
Depreciation for the period in excess of capital allowances 6.3 2.7 7.7 2.7
Effect of change in non allowable bad debt provisions 3.3 5.8 3.7 4.6
Effect of changes in other provisions (3.4) 8.2 (2.8) 8.7
Gains exempted or covered by capital losses (0.6) (1.3) (0.6) (1.3)
Adjustment to current tax charge in respect of previous periods 1.5 (33.9) 1.2 (32.1)
Current tax charge for the year 121.1 97.8 98.5 44.2
During 2003 a number of long standing tax issues were resolved permitting the release of prior year tax provisions.

Notes to the Accounts (continued)
Nationwide Annual Report and Accounts 2004 53
10 Segmental reporting Group Group2004 2003
Profit/(Loss) Total Net Profit/(Loss) Total Netbefore tax assets assets before tax assets assets
£m £m £m £m £m £m
Analysis of class of business:
Retail 299.0 71,039.4 3,148.2 287.6 57,431.1 2,627.2
Commercial 174.1 12,383.0 1,003.6 165.6 10,762.6 889.6
Group (46.3) 18,006.0 401.2 (99.9) 17,224.0 669.3
426.8 101,428.4 4,553.0 353.3 85,417.7 4,186.1
Retail represents the provision of personal financial services including all the attributable income and expenditure relating to retail
mortgages, unsecured and secured personal lending, credit card, insurance products and FlexAccount. Nationwide’s strategy of better
pricing means that retail profit contribution is intentionally reduced.
Commercial includes all of the costs and income associated with the Group’s lending to Registered Social Landlords and other loans
to support investment in commercial properties and residential housing.
Group includes the costs and income associated with managing the Group’s capital position, fixed asset investment portfolio, wholesale
funding and the liquid asset management of the Group.
Administrative expenses and depreciation have been allocated to segments based on resources consumed, except where they cannot
be meaningfully allocated in which case they are included within Group items. Group items include rental income and associated
property costs plus the core Group administrative expenses that have not been allocated to business segments.
Capital is allocated to each business segment for investment purposes and is based upon the regulatory capital framework. No charge
has been made for capital.
11 Loans and advances to credit institutions Group Society2004 2003 2004 2003
£m £m £m £m
Loans and advances to credit institutions have remaining
maturities as follows:
Accrued interest 3.6 0.3 3.2 0.3
Repayable on demand 139.4 109.5 117.6 86.8
Other loans and advances by residual maturity repayable:
• In not more than three months 1,212.2 654.5 1,212.1 654.4
• In more than three months but not more than one year 108.9 211.5 – –
1,464.1 975.8 1,332.9 741.5

12 Debt securities Group Society2004 2003 2004 2003
£m £m £m £m
Nationwide Annual Report and Accounts 2004 – Financial Statements
54 Nationwide Annual Report and Accounts 2004
Government debt securities 430.1 482.6 243.8 284.1
Other public sector debt securities – 8.8 – 8.3
Issued by public bodies 430.1 491.4 243.8 292.4
Private sector debt securities 15,220.7 15,169.6 14,725.3 14,822.7
15,650.8 15,661.0 14,969.1 15,115.1
The amount of bank and building society certificates of deposits included in the above was £5,282.6 million (2003 – £5,183.2 million).
Debt securities have remaining maturities as follows:
Group Society2004 2003 2004 2003
£m £m £m £m
• Accrued interest 109.9 111.0 106.1 106.2
• In not more than one year 8,928.3 8,053.3 8,806.0 8,004.6
• In more than one year 6,612.6 7,496.7 6,057.0 7,004.3
15,650.8 15,661.0 14,969.1 15,115.1
Transferable debt securities comprise:
• Listed 9,115.5 9,577.3 8,433.8 9,059.8
• Unlisted 6,535.3 6,083.7 6,535.3 6,055.3
15,650.8 15,661.0 14,969.1 15,115.1
Market value of transferable debt securities:
• Government debt securities 446.8 500.8 257.2 299.0
• Other public sector securities – 8.9 – 8.4
• Private sector debt securities 15,244.9 15,422.3 14,757.2 15,017.8
15,691.7 15,932.0 15,014.4 15,325.2
The market value of bank and building society certificates of deposit included in the above was £5,279.4 million
(2003 – £5,187.1 million).
Group Society2004 2003 2004 2003
£m £m £m £m
Market value of listed transferable debt securities 9,223.7 9,841.3 8,546.4 9,262.6
Included in debt securities are:
• Unamortised premiums 18.8 38.5 5.6 9.3
• Unamortised discounts (130.6) (115.3) (130.6) (115.3)
The Directors consider that the primary purpose of holding securities is prudential. The securities are held as liquid assets with
the intention of use on a continuing basis in the Group's activities and are therefore classified as financial fixed assets rather than
current assets.
Notes to the Accounts (continued)

Notes to the Accounts (continued)
Nationwide Annual Report and Accounts 2004 55
12 Debt securities (continued)The carrying value of debt securities is net of a specific provision of £1.9 million (2003 – £21.5 million) and a general provision of
£25.8 million (2003 – £35.7 million) recognising impairment within a portfolio of assets held for their long term investment potential
(Note 13). The credit risk on £716.6 million (Sterling equivalent at 4 April 2004; 2003 – £838.8 million) of assets within this investment
portfolio has been hedged by the Society entering into a credit derivative. Under the terms of this overall risk mitigating transaction the
Society retains the risk of credit losses on the assets which are covered by the credit derivative and certain other reference assets, up
to a maximum of £76.1 million (Sterling equivalent at 4 April 2004; 2003 – £78.5 million), which is divided into two distinct tranches.
Under the first tranche, the Society bears the first tier of credit losses up to an amount of £27.9 million (2003 – £28.8 million), of which
£8.7 million (2003 – £25.4 million) is already reflected in the provisions against debt securities. Beyond this level, the Society’s second
tranche of exposure to credit losses of £48.2 million (2003 – £49.7 million) is impacted once £23.5 million (2003 – £24.2 million) of
loss protection has been utilised. All of the Society’s credit loss protection under the transaction will be settled by the credit derivative
counterpart, an A+ rated US Banking institution.
£177.9 million (2003 – £304.9 million) of debt securities are subject to sale and repurchase agreements.
Debt securities include asset backed securities of £273.5 million owned by a bankruptcy remote special purpose vehicle.
The acquisitions of the asset backed securities have been funded primarily through the issue of commercial paper reported in Debt
Securities in Issue (Note 24). The vehicle is owned by a charitable trust and therefore is not a legal subsidiary of the Nationwide Group.
However it has been included in the accounts as a quasi-subsidiary (see Note 16) and the assets and liabilities have been fully
consolidated because the vehicle gives rise to risks and rewards that are in substance no different than if it were a subsidiary.
Movements during the year of debt securities all of which are held as financial fixed assets are analysed as follows:
Group Society
£m £m
Adjusted cost and net book value (excluding accrued interest)
At 5 April 2003 15,550.0 15,008.9
Additions 27,249.5 26,323.2
Disposals/maturities (26,943.9) (26,223.6)
Other movements (314.7) (245.5)
At 4 April 2004 15,540.9 14,863.0
13 Amounts released and provisions against fixed asset investments Specific General Total
£m £m £m
Group and SocietyProvisions at 5 April 2003 21.5 35.7 57.2
(Release) for the year (16.3) (9.9) (26.2)
Amounts written off (3.3) – (3.3)
Provisions at 4 April 2004 1.9 25.8 27.7
Provisions for impairment have been deducted in arriving at the carrying value of debt securities (as shown in Note 12) in the
balance sheet.
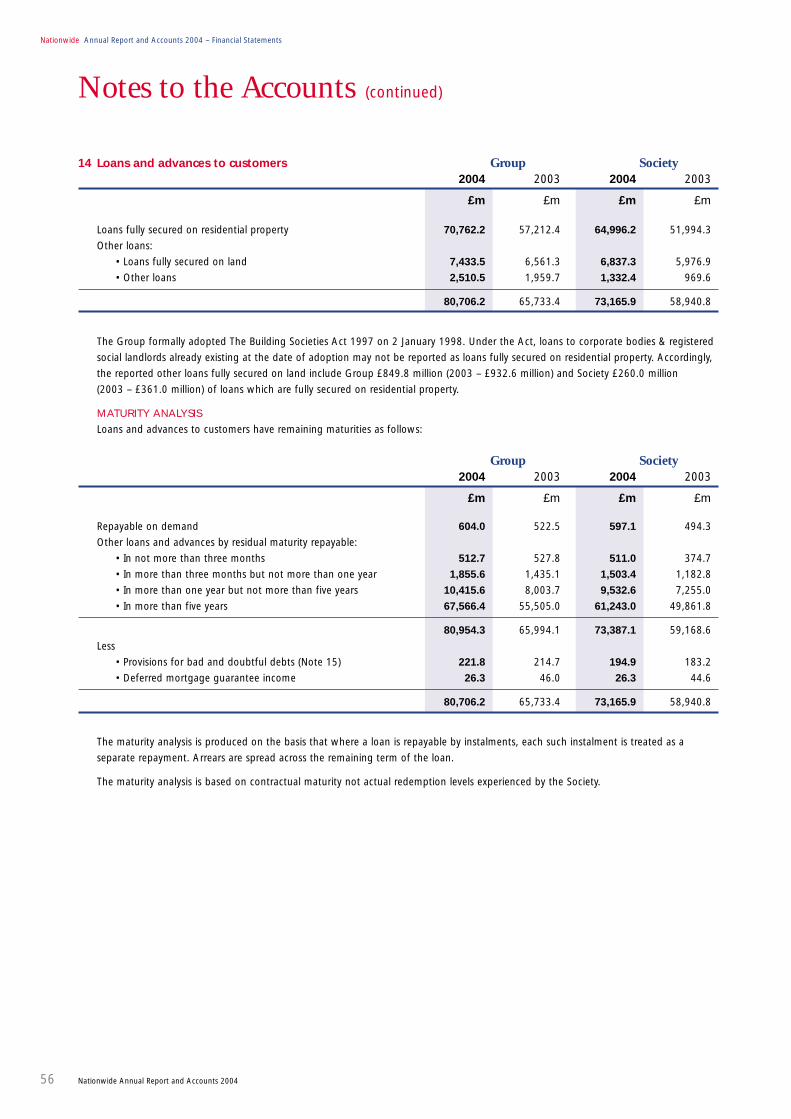
14 Loans and advances to customers Group Society2004 2003 2004 2003
£m £m £m £m
Nationwide Annual Report and Accounts 2004 – Financial Statements
56 Nationwide Annual Report and Accounts 2004
Loans fully secured on residential property 70,762.2 57,212.4 64,996.2 51,994.3
Other loans:
• Loans fully secured on land 7,433.5 6,561.3 6,837.3 5,976.9
• Other loans 2,510.5 1,959.7 1,332.4 969.6
80,706.2 65,733.4 73,165.9 58,940.8
The Group formally adopted The Building Societies Act 1997 on 2 January 1998. Under the Act, loans to corporate bodies & registered
social landlords already existing at the date of adoption may not be reported as loans fully secured on residential property. Accordingly,
the reported other loans fully secured on land include Group £849.8 million (2003 – £932.6 million) and Society £260.0 million
(2003 – £361.0 million) of loans which are fully secured on residential property.
MATURITY ANALYSIS
Loans and advances to customers have remaining maturities as follows:
Group Society2004 2003 2004 2003
£m £m £m £m
Repayable on demand 604.0 522.5 597.1 494.3
Other loans and advances by residual maturity repayable:
• In not more than three months 512.7 527.8 511.0 374.7
• In more than three months but not more than one year 1,855.6 1,435.1 1,503.4 1,182.8
• In more than one year but not more than five years 10,415.6 8,003.7 9,532.6 7,255.0
• In more than five years 67,566.4 55,505.0 61,243.0 49,861.8
80,954.3 65,994.1 73,387.1 59,168.6
Less
• Provisions for bad and doubtful debts (Note 15) 221.8 214.7 194.9 183.2
• Deferred mortgage guarantee income 26.3 46.0 26.3 44.6
80,706.2 65,733.4 73,165.9 58,940.8
The maturity analysis is produced on the basis that where a loan is repayable by instalments, each such instalment is treated as a
separate repayment. Arrears are spread across the remaining term of the loan.
The maturity analysis is based on contractual maturity not actual redemption levels experienced by the Society.
Notes to the Accounts (continued)

Notes to the Accounts (continued)
15 Provisions for bad and Loans fully secured Other loans Other loans Total doubtful debts on residential property fully secured on land
Specific General Specific General Specific General Specific General
£m £m £m £m £m £m £m £m
GroupAt 5 April 2003 8.7 91.8 12.7 54.6 38.2 8.7 59.6 155.1
Amounts written off (1.5) – (3.4) – (41.1) – (46.0) –
Recoveries of amounts previously written off 3.6 – 0.1 – 5.8 – 9.5 –
Charge/(credit) for the year (4.9) 8.1 0.5 5.4 39.0 (4.5) 34.6 9.0
At 4 April 2004 5.9 99.9 9.9 60.0 41.9 4.2 57.7 164.1
SocietyAt 5 April 2003 8.0 84.0 12.7 54.6 19.4 4.5 40.1 143.1
Amounts written off (2.4) – (3.4) – (23.8) – (29.6) –
Recoveries of amounts previously written off 2.9 – 0.1 – 1.6 – 4.6 –
Charge/(credit) for the year (3.2) 9.0 0.5 5.3 27.5 (2.4) 24.8 11.9
At 4 April 2004 5.3 93.0 9.9 59.9 24.7 2.1 39.9 155.0
These provisions have been deducted from the appropriate asset values shown in the balance sheets.
The total of non performing loans, being those on which interest is no longer being credited to the Income and Expenditure
Account is as follows:
Group Society2004 2003 2004 2003
£m £m £m £m
Non performing loans before provisions 65.9 87.4 38.3 59.6
Non performing loans after provisions 42.8 61.3 28.1 50.0
Nationwide Annual Report and Accounts 2004 57

16 InvestmentsInvestments in equity shares and subsidiary undertakings are financial fixed assets.
Group Society
£m £m
Nationwide Annual Report and Accounts 2004 – Financial Statements
58 Nationwide Annual Report and Accounts 2004
Investments in equity shares
Cost and net book value
At 5 April 2003 6.6 1.6
Additions 2.4 0.1
Disposals – –
At 4 April 2004 9.0 1.7
SocietyInvestments in associated undertakings
The Society has a 25.5% interest in the ordinary share capital of Grove Village Holdings Limited. Grove Village Holdings is a limited
liability company, registered in England and operating in the UK.
Shares Loans Total
£m £m £mInvestments in subsidiary undertakings
At 5 April 2003 749.2 6,514.1 7,263.3
Additions 7.0 795.7 802.7
Redemptions/repayments (62.5) (119.1) (181.6)
At 4 April 2004 693.7 7,190.7 7,884.4
The interests of the Society in its principal subsidiary undertakings, all of which are consolidated, as at 4 April 2004 are set out below:
Directly held subsidiary undertakings Nature of business
First Nationwide Investment company
Monument (Sutton) Limited Property rental
Nationwide International Limited Offshore investment
Nationwide Investments No 1 Limited Investment company
Nationwide Life Limited Life assurance
Nationwide Mortgage Corporation Limited Mortgage book acquisition and management
Nationwide Syndications Limited Syndicated lending
Nationwide Trust Limited Consumer finance
Nationwide Unit Trust Managers Limited Unit trust management
at.home nationwide limited Property rental
Foundation Insurance Limited Mortgage indemnity insurance
UCB Home Loans Corporation Limited Centralised mortgage lender
All the above subsidiary undertakings are limited liability companies except First Nationwide which is an unlimited liability company
with share capital.
Notes to the Accounts (continued)
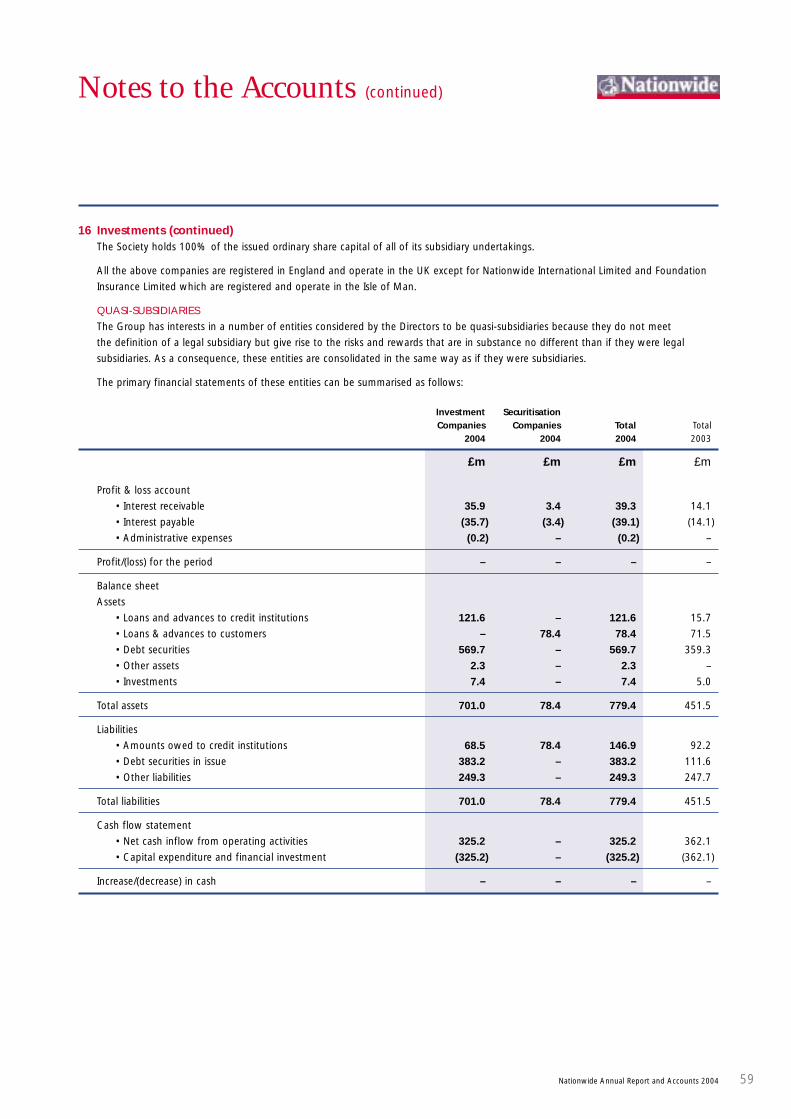
Notes to the Accounts (continued)
Nationwide Annual Report and Accounts 2004 59
16 Investments (continued)The Society holds 100% of the issued ordinary share capital of all of its subsidiary undertakings.
All the above companies are registered in England and operate in the UK except for Nationwide International Limited and Foundation
Insurance Limited which are registered and operate in the Isle of Man.
QUASI-SUBSIDIARIES
The Group has interests in a number of entities considered by the Directors to be quasi-subsidiaries because they do not meet
the definition of a legal subsidiary but give rise to the risks and rewards that are in substance no different than if they were legal
subsidiaries. As a consequence, these entities are consolidated in the same way as if they were subsidiaries.
The primary financial statements of these entities can be summarised as follows:
Investment SecuritisationCompanies Companies Total Total
2004 2004 2004 2003
£m £m £m £m
Profit & loss account
• Interest receivable 35.9 3.4 39.3 14.1
• Interest payable (35.7) (3.4) (39.1) (14.1)
• Administrative expenses (0.2) – (0.2) –
Profit/(loss) for the period – – – –
Balance sheet
Assets
• Loans and advances to credit institutions 121.6 – 121.6 15.7
• Loans & advances to customers – 78.4 78.4 71.5
• Debt securities 569.7 – 569.7 359.3
• Other assets 2.3 – 2.3 –
• Investments 7.4 – 7.4 5.0
Total assets 701.0 78.4 779.4 451.5
Liabilities
• Amounts owed to credit institutions 68.5 78.4 146.9 92.2
• Debt securities in issue 383.2 – 383.2 111.6
• Other liabilities 249.3 – 249.3 247.7
Total liabilities 701.0 78.4 779.4 451.5
Cash flow statement
• Net cash inflow from operating activities 325.2 – 325.2 362.1
• Capital expenditure and financial investment (325.2) – (325.2) (362.1)
Increase/(decrease) in cash – – – –

17 Tangible fixed assets Branches Total Equipment
and non Specialised Short land Plant fixtures,
specialised administration leasehold Investment and and fittings and
buildings buildings buildings properties buildings machinery vehicles Total
£m £m £m £m £m £m £m £m
Nationwide Annual Report and Accounts 2004 – Financial Statements
60 Nationwide Annual Report and Accounts 2004
GroupCost or valuation
At 5 April 2003 221.5 102.6 35.2 207.9 567.2 92.4 699.3 1,358.9
Additions 15.5 0.3 0.8 13.4 30.0 2.8 97.9 130.7
Adjustment on revaluation 24.9 – – 24.1 49.0 – – 49.0
Disposals (1.7) – – (8.8) (10.5) – (12.0) (22.5)
At 4 April 2004 260.2 102.9 36.0 236.6 635.7 95.2 785.2 1,516.1
Depreciation
At 5 April 2003 – 34.4 26.2 – 60.6 64.7 435.2 560.5
Charge for the year – 3.5 1.6 – 5.1 7.0 96.7 108.8
Disposals – – – – – – (10.8) (10.8)
At 4 April 2004 – 37.9 27.8 – 65.7 71.7 521.1 658.5
Net book value
At 4 April 2004 260.2 65.0 8.2 236.6 570.0 23.5 264.1 857.6
At 4 April 2003 221.5 68.2 9.0 207.9 506.6 27.7 264.1 798.4
Cost or valuation at 4 April 2004
is represented by:
• Valuation 260.1 – – 236.6 496.7 – – 496.7
• Cost 0.1 102.9 36.0 – 139.0 95.2 785.2 1,019.4
260.2 102.9 36.0 236.6 635.7 95.2 785.2 1,516.1
Cost or valuation of land and buildings includes £512.4 million (2003 – £444.9 million) in respect of freehold and long leasehold land
and buildings which are not depreciated.
All freehold and long leasehold land and buildings except specialised administration buildings and investment properties were valued
at 4 April 2004 on the basis of an open market valuation for existing use. A representative sample of around 25% of the branches
and non specialised buildings has been valued by members of the Royal Institution of Chartered Surveyors who are either independent
or employed by the Society and the remaining properties have been included at valuation based on the percentage movement in values
shown by the sample. Investment properties are included at Directors’ valuation.
Notes to the Accounts (continued)

Notes to the Accounts (continued)
Nationwide Annual Report and Accounts 2004 61
17 Tangible fixed assets (continued) Branches Total Equipment
and non Specialised Short land Plant fixtures,
specialised administration leasehold and and fittings and
buildings buildings buildings buildings machinery vehicles Total
£m £m £m £m £m £m £m
SocietyCost or valuation
At 5 April 2003 210.4 102.6 34.7 347.7 90.8 672.2 1,110.7
Additions 15.5 0.3 0.7 16.5 2.7 95.4 114.6
Adjustment on revaluation 24.4 – – 24.4 – – 24.4
Disposals (1.6) – – (1.6) – (11.5) (13.1)
At 4 April 2004 248.7 102.9 35.4 387.0 93.5 756.1 1,236.6
Depreciation
At 5 April 2003 – 34.4 25.8 60.2 63.6 414.6 538.4
Charge for the year – 3.5 1.6 5.1 6.8 94.3 106.2
Disposals – – – – – (10.5) (10.5)
At 4 April 2004 – 37.9 27.4 65.3 70.4 498.4 634.1
Net book value
At 4 April 2004 248.7 65.0 8.0 321.7 23.1 257.7 602.5
At 4 April 2003 210.4 68.2 8.9 287.5 27.2 257.6 572.3
Cost or valuation at 4 April 2004
is represented by:
• Valuation 248.7 – – 248.7 – – 248.7
• Cost – 102.9 35.4 138.3 93.5 756.1 987.9
248.7 102.9 35.4 387.0 93.5 756.1 1,236.6
Cost or valuation of land and buildings includes £264.2 million (2003 – £225.9 million) in respect of freehold and long leasehold land
and buildings which are not depreciated.
Group Society2004 2003 2004 2003
£m £m £m £m
Net book value of land and buildings is represented by:
• Freehold 507.9 454.9 295.4 261.8
• Long leasehold 53.9 42.7 18.2 16.8
• Short leasehold 8.2 9.0 8.1 8.9
570.0 506.6 321.7 287.5
Net book value of land and buildings occupied by the
Group/Society for its own activities 277.3 265.5 265.0 224.3
Net book value of land and buildings based on historical cost is:
• Cost 448.7 427.3 285.3 270.5
• Aggregate depreciation 74.7 69.7 74.3 69.3
Net book value 374.0 357.6 211.0 201.2

18 Other assets Group Society2004 2003 2004 2003
£m £m £m £m
Nationwide Annual Report and Accounts 2004 – Financial Statements
62 Nationwide Annual Report and Accounts 2004
Value of long term life assurance business 245.3 213.9 – –
Deferred taxation 40.5 28.3 32.7 18.0
Other 124.1 59.2 77.8 29.9
409.9 301.4 110.5 47.9
The long term life assurance business has been valued using the following key assumptions:
• Expected future profits after tax from business currently in force have been discounted at a rate of 9.0% (2003 – 9.0%)
per annum.
• Future investment returns of 5.0% (2003 – 4.5%) gross per annum for fixed interest investments and 7.0% (2003 – 6.5%)
for equity investments. The investment return for guaranteed return products is linked to the matching assets.
• Expense inflation rate of 3.5% (2003 – 3.5%) gross.
• Mortality for the future based on general industry experience of the type of business concerned.
• Expenses and withdrawals for the future based on own recent experience of the type of business concerned.
Group Society2004 2003 2004 2003
£m £m £m £m
Deferred Taxation
Brought forward at 5 April 2003 28.3 21.1 18.0 18.5
Deferred tax credit/(charge) in Income and Expenditure Account (Note 9) 12.2 7.2 14.7 (0.5)
Carried forward at 4 April 2004 40.5 28.3 32.7 18.0
The amounts provided for deferred taxation, which represent the
full potential deferred assets/(liabilities), are set out below:
Excess of capital allowances over depreciation (0.3) (5.3) 0.2 (6.0)
Interest adjustments (9.1) (9.1) (9.1) (9.1)
Other timing differences 49.9 42.7 41.6 33.1
40.5 28.3 32.7 18.0
Provision is not made for any taxation liability which might arise on the disposal of premises at their balance sheet value as it is
anticipated that either substantially all the properties will be retained by the Group or that any gains which arise on disposal will
be eligible for roll-over relief or set off against available capital losses. The Directors are, therefore, of the opinion that the likelihood
of any material liability arising in this respect is remote.
19 Prepayments and accrued income Group Society2004 2003 2004 2003
£m £m £m £m
Accruals relating to off balance sheet instruments 14.3 35.8 14.3 35.8
Due from subsidiary undertakings – – 151.3 143.1
Prepayments related to pension fund (Note 8) 108.3 5.3 108.3 5.3
Other 114.8 79.9 80.6 69.0
237.4 121.0 354.5 253.2
Notes to the Accounts (continued)

Notes to the Accounts (continued)
Nationwide Annual Report and Accounts 2004 63
20 Assets and liabilities relating to long term life assurance business Group2004 2003
£m £m
The assets and liabilities of the long term life assurance business of the Group are:
Investments 1,769.4 1,453.4
Current assets 13.5 18.3
Long term life assurance business assets 1,782.9 1,471.7
Creditors 774.6 697.1
Long term life assurance fund 1,008.3 774.6
Long term life assurance business liabilities 1,782.9 1,471.7
The above investments are stated at market value.
21 Shares Group and Society2004 2003
£m £m
Held by individuals 65,927.7 60,938.9
Other shares 16.2 13.3
65,943.9 60,952.2
Shares are repayable from the balance sheet date in the ordinary course of business as follows:
Accrued interest 470.6 555.1
Repayable on demand 62,412.7 59,427.8
Other shares by residual maturity repayable:
• In not more than three months 435.1 197.2
• In more than three months but not more than one year 1,889.3 453.4
• In more than one year but not more than five years 736.2 318.7
65,943.9 60,952.2

22 Amounts owed to credit institutions Group Society2004 2003 2004 2003
£m £m £m £m
Nationwide Annual Report and Accounts 2004 – Financial Statements
Amounts owed to credit institutions are repayable from the balance
sheet date in the ordinary course of business as follows:
Accrued interest 13.0 8.2 13.0 8.2
Repayable on demand 337.8 0.5 337.8 0.5
Other amounts owed to credit institutions by residual maturity repayable:
• In not more than three months 1,569.2 1,433.5 1,567.4 1,432.9
• In more than three months but not more than one year 193.4 32.8 147.5 32.8
• In more than one year but not more than five years 115.9 119.4 115.9 119.4
• In more than five years – 164.4 – 164.4
2,229.3 1,758.8 2,181.6 1,758.2
Amounts owed to credit institutions include £177.9 million (2003 – £304.4 million) in respect of sale and repurchase agreements.
23 Amounts owed to other customers Group Society2004 2003 2004 2003
£m £m £m £m
Amounts owed to subsidiary undertakings – – 1,213.4 1,002.8
Other 4,836.5 4,539.5 4,057.6 3,827.8
4,836.5 4,539.5 5,271.0 4,830.6
Amounts owed to other customers are repayable from the
balance sheet date in the ordinary course of business as follows:
Accrued interest 21.6 14.4 21.1 15.4
Repayable on demand 1,253.6 1,284.0 2,120.9 2,040.5
Other amounts owed to other customers with residual maturity repayable:
• In not more than three months 2,883.4 2,666.6 2,471.8 2,422.4
• In more than three months but not more than one year 515.5 458.5 512.6 236.8
• In more than one year but not more than five years 162.4 86.8 144.6 86.3
• In more than five years – 29.2 – 29.2
4,836.5 4,539.5 5,271.0 4,830.6
Notes to the Accounts (continued)
64 Nationwide Annual Report and Accounts 2004
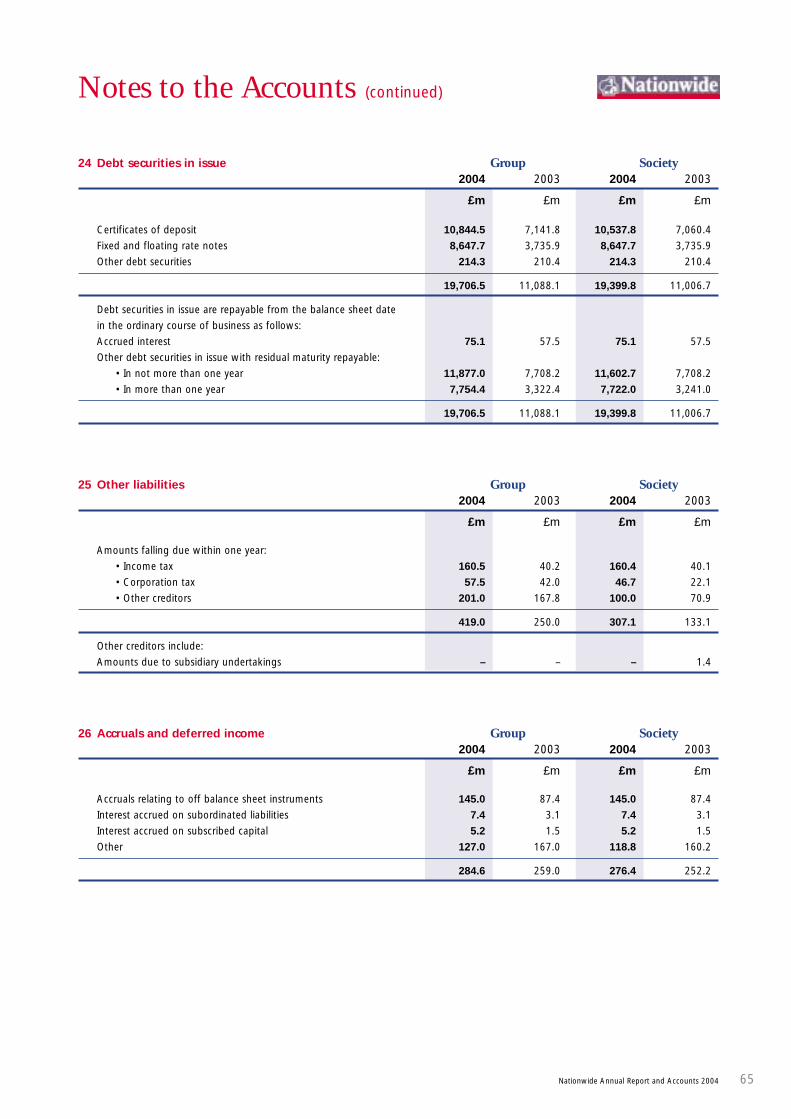
Notes to the Accounts (continued)
24 Debt securities in issue Group Society2004 2003 2004 2003
£m £m £m £m
Certificates of deposit 10,844.5 7,141.8 10,537.8 7,060.4
Fixed and floating rate notes 8,647.7 3,735.9 8,647.7 3,735.9
Other debt securities 214.3 210.4 214.3 210.4
19,706.5 11,088.1 19,399.8 11,006.7
Debt securities in issue are repayable from the balance sheet date
in the ordinary course of business as follows:
Accrued interest 75.1 57.5 75.1 57.5
Other debt securities in issue with residual maturity repayable:
• In not more than one year 11,877.0 7,708.2 11,602.7 7,708.2
• In more than one year 7,754.4 3,322.4 7,722.0 3,241.0
19,706.5 11,088.1 19,399.8 11,006.7
25 Other liabilities Group Society2004 2003 2004 2003
£m £m £m £m
Amounts falling due within one year:
• Income tax 160.5 40.2 160.4 40.1
• Corporation tax 57.5 42.0 46.7 22.1
• Other creditors 201.0 167.8 100.0 70.9
419.0 250.0 307.1 133.1
Other creditors include:
Amounts due to subsidiary undertakings – – – 1.4
26 Accruals and deferred income Group Society2004 2003 2004 2003
£m £m £m £m
Accruals relating to off balance sheet instruments 145.0 87.4 145.0 87.4
Interest accrued on subordinated liabilities 7.4 3.1 7.4 3.1
Interest accrued on subscribed capital 5.2 1.5 5.2 1.5
Other 127.0 167.0 118.8 160.2
284.6 259.0 276.4 252.2
Nationwide Annual Report and Accounts 2004 65
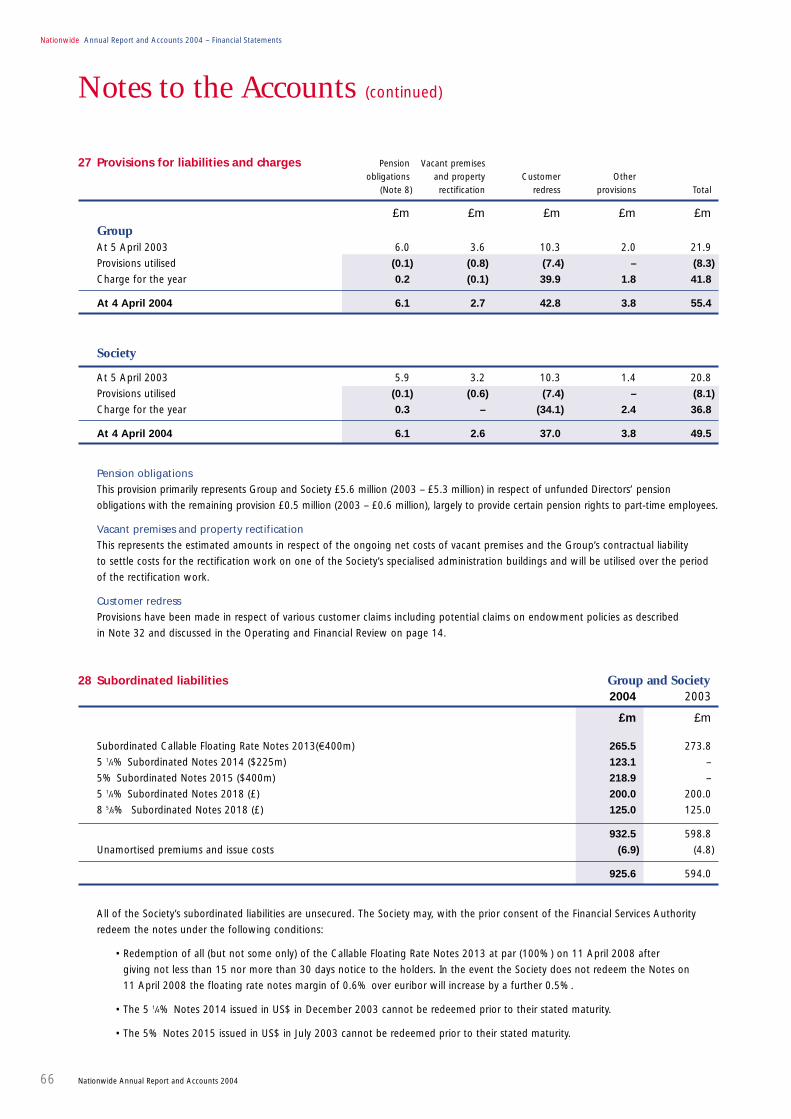
27 Provisions for liabilities and charges Pension Vacant premisesobligations and property Customer Other
(Note 8) rectification redress provisions Total
£m £m £m £m £m
Nationwide Annual Report and Accounts 2004 – Financial Statements
66 Nationwide Annual Report and Accounts 2004
GroupAt 5 April 2003 6.0 3.6 10.3 2.0 21.9
Provisions utilised (0.1) (0.8) (7.4) – (8.3)
Charge for the year 0.2 (0.1) 39.9 1.8 41.8
At 4 April 2004 6.1 2.7 42.8 3.8 55.4
Society
At 5 April 2003 5.9 3.2 10.3 1.4 20.8
Provisions utilised (0.1) (0.6) (7.4) – (8.1)
Charge for the year 0.3 – (34.1) 2.4 36.8
At 4 April 2004 6.1 2.6 37.0 3.8 49.5
Pension obligations
This provision primarily represents Group and Society £5.6 million (2003 – £5.3 million) in respect of unfunded Directors’ pension
obligations with the remaining provision £0.5 million (2003 – £0.6 million), largely to provide certain pension rights to part-time employees.
Vacant premises and property rectification
This represents the estimated amounts in respect of the ongoing net costs of vacant premises and the Group’s contractual liability
to settle costs for the rectification work on one of the Society’s specialised administration buildings and will be utilised over the period
of the rectification work.
Customer redress
Provisions have been made in respect of various customer claims including potential claims on endowment policies as described
in Note 32 and discussed in the Operating and Financial Review on page 14.
28 Subordinated liabilities Group and Society2004 2003
£m £m
Subordinated Callable Floating Rate Notes 2013(€400m) 265.5 273.8
5 1/4% Subordinated Notes 2014 ($225m) 123.1 –
5% Subordinated Notes 2015 ($400m) 218.9 –
5 1/4% Subordinated Notes 2018 (£) 200.0 200.0
8 5/8% Subordinated Notes 2018 (£) 125.0 125.0
932.5 598.8
Unamortised premiums and issue costs (6.9) (4.8)
925.6 594.0
All of the Society’s subordinated liabilities are unsecured. The Society may, with the prior consent of the Financial Services Authority
redeem the notes under the following conditions:
• Redemption of all (but not some only) of the Callable Floating Rate Notes 2013 at par (100%) on 11 April 2008 after
giving not less than 15 nor more than 30 days notice to the holders. In the event the Society does not redeem the Notes on
11 April 2008 the floating rate notes margin of 0.6% over euribor will increase by a further 0.5%.
• The 5 1/4% Notes 2014 issued in US$ in December 2003 cannot be redeemed prior to their stated maturity.
• The 5% Notes 2015 issued in US$ in July 2003 cannot be redeemed prior to their stated maturity.
Notes to the Accounts (continued)
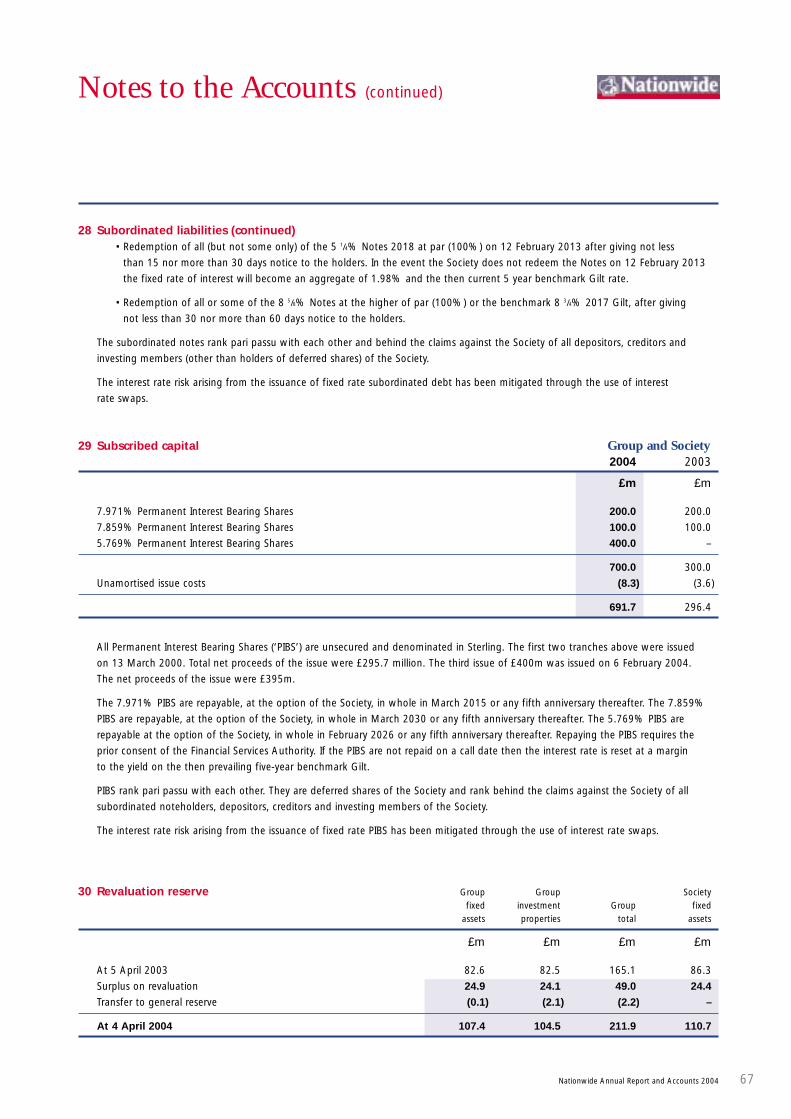
Notes to the Accounts (continued)
28 Subordinated liabilities (continued)• Redemption of all (but not some only) of the 5 1/4% Notes 2018 at par (100%) on 12 February 2013 after giving not less
than 15 nor more than 30 days notice to the holders. In the event the Society does not redeem the Notes on 12 February 2013
the fixed rate of interest will become an aggregate of 1.98% and the then current 5 year benchmark Gilt rate.
• Redemption of all or some of the 8 5/8% Notes at the higher of par (100%) or the benchmark 8 3/4% 2017 Gilt, after giving
not less than 30 nor more than 60 days notice to the holders.
The subordinated notes rank pari passu with each other and behind the claims against the Society of all depositors, creditors and
investing members (other than holders of deferred shares) of the Society.
The interest rate risk arising from the issuance of fixed rate subordinated debt has been mitigated through the use of interest
rate swaps.
29 Subscribed capital Group and Society2004 2003
£m £m
7.971% Permanent Interest Bearing Shares 200.0 200.0
7.859% Permanent Interest Bearing Shares 100.0 100.0
5.769% Permanent Interest Bearing Shares 400.0 –
700.0 300.0
Unamortised issue costs (8.3) (3.6)
691.7 296.4
All Permanent Interest Bearing Shares (‘PIBS’) are unsecured and denominated in Sterling. The first two tranches above were issued
on 13 March 2000. Total net proceeds of the issue were £295.7 million. The third issue of £400m was issued on 6 February 2004.
The net proceeds of the issue were £395m.
The 7.971% PIBS are repayable, at the option of the Society, in whole in March 2015 or any fifth anniversary thereafter. The 7.859%
PIBS are repayable, at the option of the Society, in whole in March 2030 or any fifth anniversary thereafter. The 5.769% PIBS are
repayable at the option of the Society, in whole in February 2026 or any fifth anniversary thereafter. Repaying the PIBS requires the
prior consent of the Financial Services Authority. If the PIBS are not repaid on a call date then the interest rate is reset at a margin
to the yield on the then prevailing five-year benchmark Gilt.
PIBS rank pari passu with each other. They are deferred shares of the Society and rank behind the claims against the Society of all
subordinated noteholders, depositors, creditors and investing members of the Society.
The interest rate risk arising from the issuance of fixed rate PIBS has been mitigated through the use of interest rate swaps.
30 Revaluation reserve Group Group Societyfixed investment Group fixed
assets properties total assets
£m £m £m £m
At 5 April 2003 82.6 82.5 165.1 86.3
Surplus on revaluation 24.9 24.1 49.0 24.4
Transfer to general reserve (0.1) (2.1) (2.2) –
At 4 April 2004 107.4 104.5 211.9 110.7
Nationwide Annual Report and Accounts 2004 67
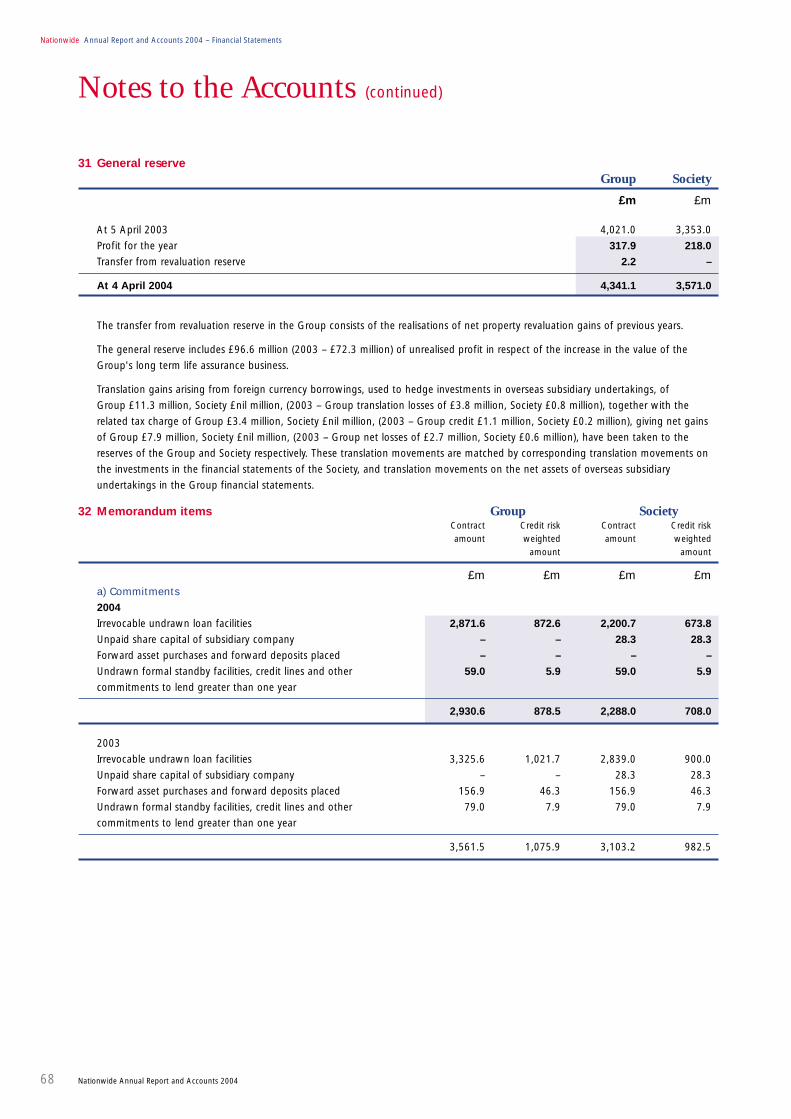
31 General reserveGroup Society
£m £m
Nationwide Annual Report and Accounts 2004 – Financial Statements
68 Nationwide Annual Report and Accounts 2004
At 5 April 2003 4,021.0 3,353.0
Profit for the year 317.9 218.0
Transfer from revaluation reserve 2.2 –
At 4 April 2004 4,341.1 3,571.0
The transfer from revaluation reserve in the Group consists of the realisations of net property revaluation gains of previous years.
The general reserve includes £96.6 million (2003 – £72.3 million) of unrealised profit in respect of the increase in the value of the
Group's long term life assurance business.
Translation gains arising from foreign currency borrowings, used to hedge investments in overseas subsidiary undertakings, of
Group £11.3 million, Society £nil million, (2003 – Group translation losses of £3.8 million, Society £0.8 million), together with the
related tax charge of Group £3.4 million, Society £nil million, (2003 – Group credit £1.1 million, Society £0.2 million), giving net gains
of Group £7.9 million, Society £nil million, (2003 – Group net losses of £2.7 million, Society £0.6 million), have been taken to the
reserves of the Group and Society respectively. These translation movements are matched by corresponding translation movements on
the investments in the financial statements of the Society, and translation movements on the net assets of overseas subsidiary
undertakings in the Group financial statements.
32 Memorandum items Group SocietyContract Credit risk Contract Credit riskamount weighted amount weighted
amount amount
£m £m £m £ma) Commitments
2004
Irrevocable undrawn loan facilities 2,871.6 872.6 2,200.7 673.8
Unpaid share capital of subsidiary company – – 28.3 28.3
Forward asset purchases and forward deposits placed – – – –
Undrawn formal standby facilities, credit lines and other 59.0 5.9 59.0 5.9
commitments to lend greater than one year
2,930.6 878.5 2,288.0 708.0
2003
Irrevocable undrawn loan facilities 3,325.6 1,021.7 2,839.0 900.0
Unpaid share capital of subsidiary company – – 28.3 28.3
Forward asset purchases and forward deposits placed 156.9 46.3 156.9 46.3
Undrawn formal standby facilities, credit lines and other 79.0 7.9 79.0 7.9
commitments to lend greater than one year
3,561.5 1,075.9 3,103.2 982.5
Notes to the Accounts (continued)

Notes to the Accounts (continued)
32 Memorandum items (continued)b) Contingent liabilities
The Society on its own account and, during the period from 1 January 1990 to 31 December 1995 as appointed representative of
Guardian Assurance plc (‘Guardian’), sold a substantial number of endowment policies to the Society’s mortgage borrowers for the
purpose of repaying their mortgage loans on maturity. The value of these policies is typically related to the performance of underlying
investments in managed funds. As a result of the relatively poor performance of many of these funds and of the securities market
generally over the past few years some policyholders have experienced, or expect to experience, a shortfall between the value of their
policies and the value of their outstanding mortgage loans at maturity.
Some of these policyholders have brought claims alleging that they were unaware of the risk attached to this type of policy.
The Society is currently seeking to ascertain and will continue to evaluate the magnitude of any potential exposure in respect
of endowment related claims. As far as policies sold by Guardian are concerned Guardian contends that it is entitled to be indemnified
by the Society in respect of any liability on its part to compensate policyholders. On the basis of external legal advice the Society
contends that it is not liable to indemnify Guardian.
The Society has decided to make a provision in relation to its estimate of liability for such claims or potential claims against policies sold
on its own account as detailed in Note 27.
33 Financial commitments Group Society2004 2003 2004 2003
£m £m £m £m
Capital commitments
Capital expenditure contracted for but not provided for in the Accounts 11.4 9.5 10.9 7.1
Land and buildings
2004 2003
£m £m
Leasing commitments
GroupAt the balance sheet date, annual commitments under operating leases relating to land, buildings
and equipment were as follows:
Leases which expire:
• Within one year 7.6 5.4
• Between one and five years 8.4 10.2
• After five years 10.8 10.9
26.8 26.5
SocietyAt the balance sheet date, annual commitments under operating leases relating to land, buildings
and equipment were as follows:
Leases which expire:
• Within one year 7.6 5.3
• Between one and five years 8.1 10.1
• After five years 10.4 10.5
26.1 25.9
Nationwide Annual Report and Accounts 2004 69

34 Consolidated cash flow statement2004 2003
£m £m
Nationwide Annual Report and Accounts 2004 – Financial Statements
70 Nationwide Annual Report and Accounts 2004
Reconciliation of operating profit to net cash inflow from operating activities
Operating profit 426.8 353.3
(Increase)/decrease in prepayments and accrued income (115.3) 313.5
Increase in accruals and deferred income 13.7 61.6
Provisions for bad and doubtful debts 43.6 49.4
Loans and advances written off, net of recoveries (36.5) (41.4)
Amounts (released)/written off fixed asset investments (26.2) 38.2
Depreciation and amortisation 108.8 91.5
Interest on subordinated liabilities 40.0 13.6
Interest on subscribed capital 27.8 24.0
Profit on sale of tangible fixed assets (2.1) (1.3)
Increase in provisions for liabilities and charges 33.5 17.3
(Increase) in value of long term life assurance business (44.8) (43.7)
Amortisation of debt securities 344.2 (163.4)
Other non-cash movements (19.1) (7.6)
Net cash inflow from trading activities 794.4 705.0
Net (increase) in loans and advances to customers (14,979.9) (9,076.7)
Net increase in shares 4,991.7 5,482.7
Net increase in amounts owed to credit institutions and other customers 767.5 501.6
Net increase in debt securities in issue 8,618.4 4,113.2
Net (increase) in equity securities (2.4) (3.0)
Net (increase)/decrease in loans and advances to credit institutions (458.4) 14.1
Net (increase)/decrease in other assets (64.7) 56.4
Net increase/(decrease) in other liabilities 156.3 (40.3)
Net cash (outflow)/inflow from operating activities (177.1) 1,753.0
Analysis of changes in financing during the yearSubscribed Subordinated
capital liabilities
£m £m
At 5 April 2003 296.4 594.0
Cash inflow from financing 400.0 341.9
Amortisation of premiums and issue costs (4.7) (10.3)
At 4 April 2004 691.7 925.6
Analysis of the balances of cash as shown in the balance sheet
2004 Flows 2003
£m £m £m
Cash in hand and balances with the Bank of England 310.5 (37.9) 348.4
Loans and advances to credit institutions repayable on demand 139.4 29.9 109.5
449.9 (8.0) 457.9
The Group is required to maintain balances with the Bank of England which, at 4 April 2004, amounted to £105.8 million
(2003 – £93.6 million).
Notes to the Accounts (continued)
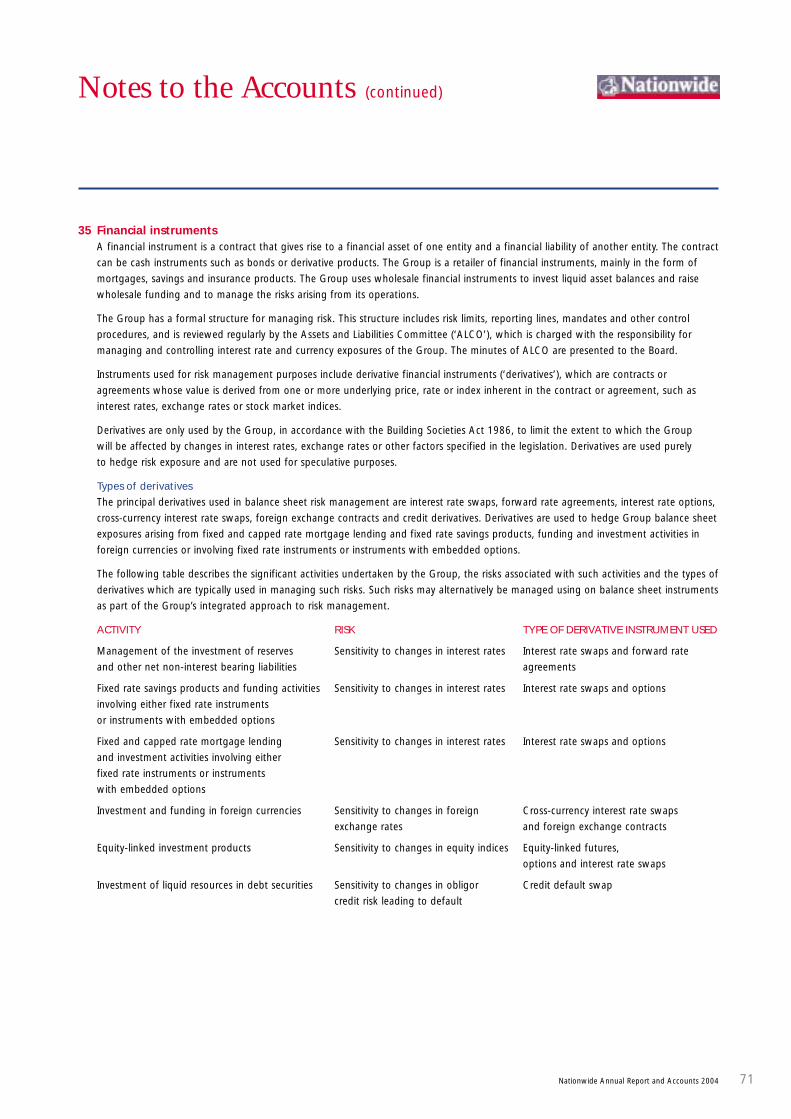
Notes to the Accounts (continued)
Nationwide Annual Report and Accounts 2004 71
35 Financial instrumentsA financial instrument is a contract that gives rise to a financial asset of one entity and a financial liability of another entity. The contract
can be cash instruments such as bonds or derivative products. The Group is a retailer of financial instruments, mainly in the form of
mortgages, savings and insurance products. The Group uses wholesale financial instruments to invest liquid asset balances and raise
wholesale funding and to manage the risks arising from its operations.
The Group has a formal structure for managing risk. This structure includes risk limits, reporting lines, mandates and other control
procedures, and is reviewed regularly by the Assets and Liabilities Committee (‘ALCO’), which is charged with the responsibility for
managing and controlling interest rate and currency exposures of the Group. The minutes of ALCO are presented to the Board.
Instruments used for risk management purposes include derivative financial instruments (‘derivatives’), which are contracts or
agreements whose value is derived from one or more underlying price, rate or index inherent in the contract or agreement, such as
interest rates, exchange rates or stock market indices.
Derivatives are only used by the Group, in accordance with the Building Societies Act 1986, to limit the extent to which the Group
will be affected by changes in interest rates, exchange rates or other factors specified in the legislation. Derivatives are used purely
to hedge risk exposure and are not used for speculative purposes.
Types of derivatives
The principal derivatives used in balance sheet risk management are interest rate swaps, forward rate agreements, interest rate options,
cross-currency interest rate swaps, foreign exchange contracts and credit derivatives. Derivatives are used to hedge Group balance sheet
exposures arising from fixed and capped rate mortgage lending and fixed rate savings products, funding and investment activities in
foreign currencies or involving fixed rate instruments or instruments with embedded options.
The following table describes the significant activities undertaken by the Group, the risks associated with such activities and the types of
derivatives which are typically used in managing such risks. Such risks may alternatively be managed using on balance sheet instruments
as part of the Group’s integrated approach to risk management.
ACTIVITY RISK TYPE OF DERIVATIVE INSTRUMENT USED
Management of the investment of reserves Sensitivity to changes in interest rates Interest rate swaps and forward rate
and other net non-interest bearing liabilities agreements
Fixed rate savings products and funding activities Sensitivity to changes in interest rates Interest rate swaps and options
involving either fixed rate instruments
or instruments with embedded options
Fixed and capped rate mortgage lending Sensitivity to changes in interest rates Interest rate swaps and options
and investment activities involving either
fixed rate instruments or instruments
with embedded options
Investment and funding in foreign currencies Sensitivity to changes in foreign Cross-currency interest rate swaps
exchange rates and foreign exchange contracts
Equity-linked investment products Sensitivity to changes in equity indices Equity-linked futures,
options and interest rate swaps
Investment of liquid resources in debt securities Sensitivity to changes in obligor Credit default swap
credit risk leading to default

Nationwide Annual Report and Accounts 2004 – Financial Statements
72 Nationwide Annual Report and Accounts 2004
35 Financial instruments (continued)Derivative products which are combinations of more basic derivatives are used only in circumstances where the underlying position
being hedged contains the same risk features. For example, guaranteed equity bonds issued by the Group may be hedged with a single
contract incorporating both the interest rate and equity index risk incurred. In such cases the derivatives used will be designed to match
exactly the risks of the underlying asset or liability. Exposure to market risk on such contracts is therefore fully hedged.
Control of derivatives
The Board has authorised the use of derivatives in accordance with the Building Societies Act 1986. Limits over the use of derivative
products are the responsibility of ALCO with the exception of the Group Credit Committee which sets Group credit policy and regularly
monitors and reviews credit exposures arising in all aspects of the Group’s operations, including derivatives.
All exchange-traded instruments are subject to cash requirements under the standard margin arrangements applied by the individual
exchanges. Such instruments are not subject to significant credit risk. Other derivative contracts are not subject to the cash
requirements. The accounting policies for ‘hedging instruments’ are described in the Statement of Accounting Policies.
The table on the next page analyses derivatives by type of contract and maturity and shows the contract or underlying principal amounts,
credit risk weighted amounts and replacement costs of contracts. Contract or underlying principal amounts indicate the volume of
business outstanding at the balance sheet date and do not represent amounts at risk. The credit risk weighted amount, which is
calculated according to rules specified by the Financial Services Authority, is based on the replacement cost, but also takes into account
measures of the extent of potential future exposure and the nature of the counterparty. The replacement cost represents the cost of
replacing contracts with positive values, calculated at market rates current at the balance sheet date reflecting the Group's exposure
should the counterparties default.
Notes to the Accounts (continued)

Notes to the Accounts (continued)
Nationwide Annual Report and Accounts 2004 73
GroupExchange rate contracts:
• Cross-currency interest rate swaps 579.6 22.3 3.1 1,133.1 14.3 19.8
• Forward foreign exchange 6,429.6 64.5 54.7 3,289.0 8.6 9.1
7,009.2 86.8 57.8 4,422.1 22.9 28.9
• Under one year 6,647.8 66.5 55.4 3,710.3 11.8 21.5
• Between one and five years 256.1 12.4 2.4 508.3 7.4 6.5
• Over five years 105.3 7.9 – 203.5 3.7 0.9
7,009.2 86.8 57.8 4,422.1 22.9 28.9
Interest rate contracts:
• Interest rate swaps 43,372.8 210.6 364.8 25,316.0 67.1 164.2
• Swaptions 121.4 1.6 3.5 68.9 2.6 12.2
• Forward rate agreements 8,069.5 – – 1,544.9 – 0.1
• Caps, collars and floors 7,819.3 9.3 0.9 7,848.8 7.7 0.6
59,383.0 221.5 369.2 34,778.6 77.4 177.1
• Under one year 26,964.0 – 39.9 8,775.7 6.3 31.3
• Between one and five years 26,481.6 132.5 230.1 22,121.9 32.2 50.7
• Over five years 5,937.4 89.0 99.2 3,881.0 38.9 95.1
59,383.0 221.5 369.2 34,778.6 77.4 177.1
Equity and credit contracts:
• Equity contracts 1,396.7 112.6 893.2 1,204.7 154.7 674.7
• Credit contracts 829.5 – – 850.9 – 2.4
2,226.2 112.6 893.2 2,055.6 154.7 677.1
• Under one year 133.5 8.0 130.6 17.5 3.6 16.9
• Between one and five years 1,917.2 87.0 596.9 1,904.6 123.6 535.9
• Over five years 175.5 17.6 165.7 133.5 27.5 124.3
2,226.2 112.6 893.2 2,055.6 154.7 677.1
All of the Group's derivatives activity is contracted with OECD financial institutions.
The financial risks faced by the Group include liquidity risk, market risk and credit risk.
Liquidity risk
The Group’s liquidity policy is to maintain sufficient liquid resources to cover cash flow imbalances and fluctuations in funding, to retain
full public confidence in the solvency of the Group and to enable the Group to meet its financial obligations. This is achieved through
maintaining a prudent level of liquid assets, through management control of the growth of the business and through wholesale
funding facilities. As at 4 April 2004, the Group maintained £1.6 billion of committed standby facilities (2003 – £1.4 billion), of which
£1.0 billion (2003 – £0.6 billion) are due to mature within one year.
35 Financial instruments (continued)Contract or Contract orunderlying Credit risk underlying Credit risk
principal weighted Replacement principal weighted Replacementamount amount cost amount amount cost
2004 2004 2004 2003 2003 2003
£m £m £m £m £m £m

Nationwide Annual Report and Accounts 2004 – Financial Statements
74 Nationwide Annual Report and Accounts 2004
Notes to the Accounts (continued)
35 Financial instruments (continued)Market risk
The primary market risk faced by the Group is interest rate risk. The net interest income and market value of the Group is exposed
to movements in interest rates. This exposure is managed on a continuous basis, within limits set by the Board, using a combination
of on and off balance sheet instruments. In the table below items are allocated to time bands. After taking into account the various
derivatives entered into by the Group, the interest rate sensitivity exposure of the Group by reference to the earlier of the next
contractual interest rate repricing date and the maturity date was:
At 4 April 2004 – Repricing dateMore than More than More than3 months 6 months 1 year
Not more but not but not but not More Non-than more than more than more than than interest
3 months 6 months 1 year 5 years 5 years bearing Total
£m £m £m £m £m £m £mASSETS
Liquid assets 12,736.5 1,828.0 576.4 1,362.6 419.7 502.2 17,425.4
Loans and advances to customers 45,944.8 1,061.1 5,058.6 24,903.3 3,986.5 (248.1) 80,706.2
Fixed assets – – – – – 857.6 857.6
Other assets – – – – – 2,439.2 2,439.2
Total assets 58,681.3 2,889.1 5,635.0 26,265.9 4,406.2 3,550.9 101,428.4
LIABILITIES
Shares 61,414.7 249.0 310.6 3,920.4 49.2 – 65,943.9
Amounts owed to credit institutions and 21,887.2 2,929.7 562.5 1,072.5 210.7 109.7 26,772.3
other customers and debt securities in issue
Other liabilities – – – – – 2,541.9 2,541.9
Subordinated liabilities 252.1 – – – 673.5 – 925.6
Subscribed capital – – – – 691.7 – 691.7
Reserves – – – – – 4,553.0 4,553.0
Total liabilities 83,554.0 3,178.7 873.1 4,992.9 1,625.1 7,204.6 101,428.4
Off balance sheet items 24,528.5 1,368.1 (4,101.7) (19,003.5) (2,791.4) – –
Interest rate sensitivity gap (344.2) 1,078.5 660.2 2,269.5 (10.3) (3,653.7) –
Cumulative interest rate sensitivity gap (344.2) 734.3 1,394.5 3,664.0 3,653.7 –
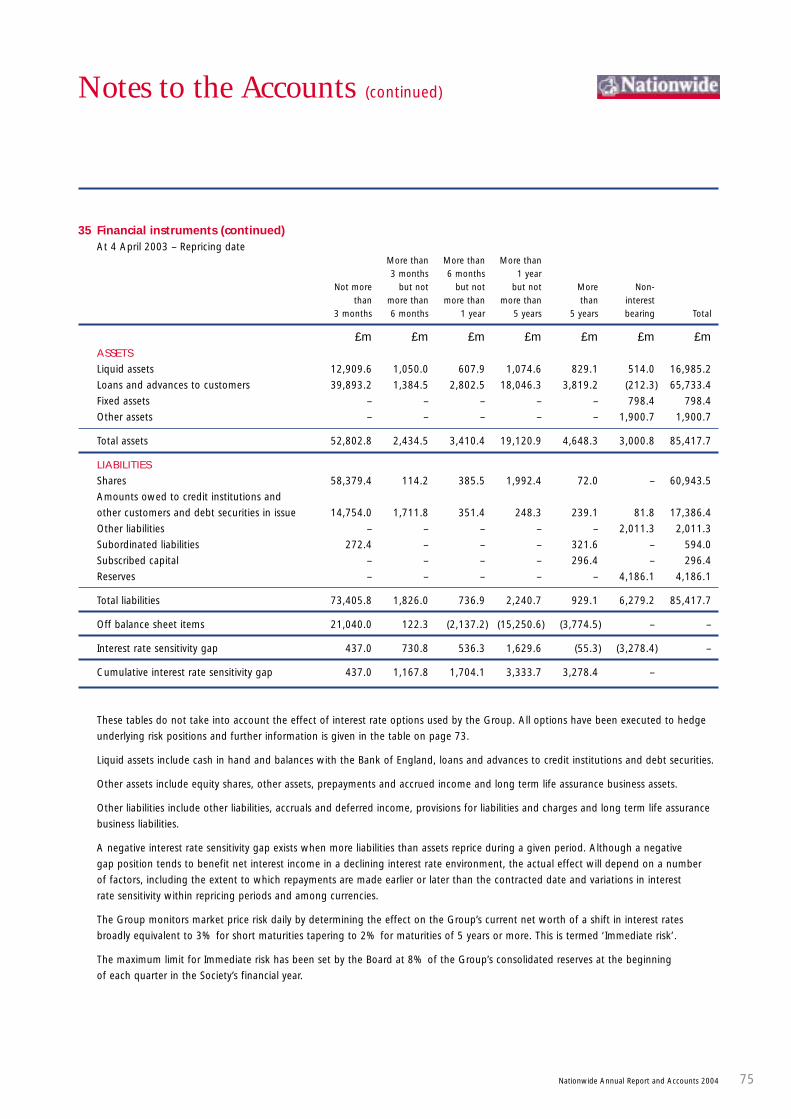
Notes to the Accounts (continued)
Nationwide Annual Report and Accounts 2004 75
35 Financial instruments (continued)At 4 April 2003 – Repricing date
More than More than More than3 months 6 months 1 year
Not more but not but not but not More Non-than more than more than more than than interest
3 months 6 months 1 year 5 years 5 years bearing Total
£m £m £m £m £m £m £mASSETS
Liquid assets 12,909.6 1,050.0 607.9 1,074.6 829.1 514.0 16,985.2
Loans and advances to customers 39,893.2 1,384.5 2,802.5 18,046.3 3,819.2 (212.3) 65,733.4
Fixed assets – – – – – 798.4 798.4
Other assets – – – – – 1,900.7 1,900.7
Total assets 52,802.8 2,434.5 3,410.4 19,120.9 4,648.3 3,000.8 85,417.7
LIABILITIES
Shares 58,379.4 114.2 385.5 1,992.4 72.0 – 60,943.5
Amounts owed to credit institutions and
other customers and debt securities in issue 14,754.0 1,711.8 351.4 248.3 239.1 81.8 17,386.4
Other liabilities – – – – – 2,011.3 2,011.3
Subordinated liabilities 272.4 – – – 321.6 – 594.0
Subscribed capital – – – – 296.4 – 296.4
Reserves – – – – – 4,186.1 4,186.1
Total liabilities 73,405.8 1,826.0 736.9 2,240.7 929.1 6,279.2 85,417.7
Off balance sheet items 21,040.0 122.3 (2,137.2) (15,250.6) (3,774.5) – –
Interest rate sensitivity gap 437.0 730.8 536.3 1,629.6 (55.3) (3,278.4) –
Cumulative interest rate sensitivity gap 437.0 1,167.8 1,704.1 3,333.7 3,278.4 –
These tables do not take into account the effect of interest rate options used by the Group. All options have been executed to hedge
underlying risk positions and further information is given in the table on page 73.
Liquid assets include cash in hand and balances with the Bank of England, loans and advances to credit institutions and debt securities.
Other assets include equity shares, other assets, prepayments and accrued income and long term life assurance business assets.
Other liabilities include other liabilities, accruals and deferred income, provisions for liabilities and charges and long term life assurance
business liabilities.
A negative interest rate sensitivity gap exists when more liabilities than assets reprice during a given period. Although a negative
gap position tends to benefit net interest income in a declining interest rate environment, the actual effect will depend on a number
of factors, including the extent to which repayments are made earlier or later than the contracted date and variations in interest
rate sensitivity within repricing periods and among currencies.
The Group monitors market price risk daily by determining the effect on the Group’s current net worth of a shift in interest rates
broadly equivalent to 3% for short maturities tapering to 2% for maturities of 5 years or more. This is termed ‘Immediate risk’.
The maximum limit for Immediate risk has been set by the Board at 8% of the Group’s consolidated reserves at the beginning
of each quarter in the Society’s financial year.
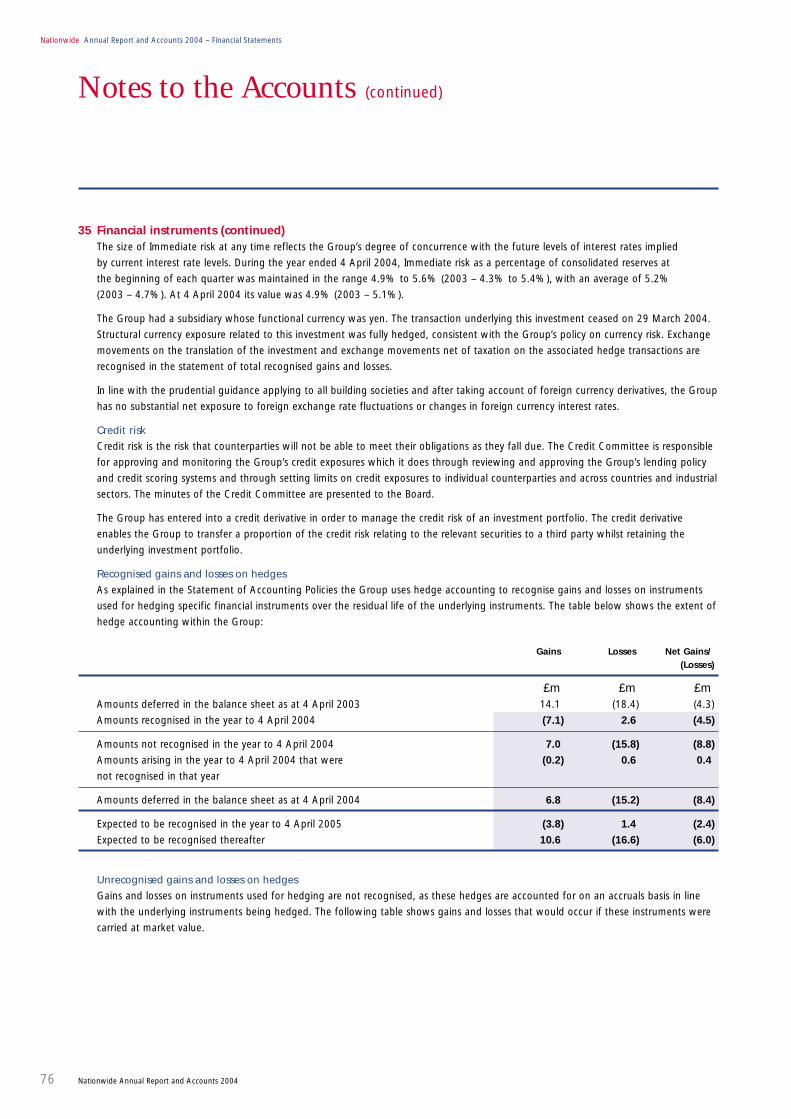
Nationwide Annual Report and Accounts 2004 – Financial Statements
76 Nationwide Annual Report and Accounts 2004
35 Financial instruments (continued)The size of Immediate risk at any time reflects the Group’s degree of concurrence with the future levels of interest rates implied
by current interest rate levels. During the year ended 4 April 2004, Immediate risk as a percentage of consolidated reserves at
the beginning of each quarter was maintained in the range 4.9% to 5.6% (2003 – 4.3% to 5.4%), with an average of 5.2%
(2003 – 4.7%). At 4 April 2004 its value was 4.9% (2003 – 5.1%).
The Group had a subsidiary whose functional currency was yen. The transaction underlying this investment ceased on 29 March 2004.
Structural currency exposure related to this investment was fully hedged, consistent with the Group’s policy on currency risk. Exchange
movements on the translation of the investment and exchange movements net of taxation on the associated hedge transactions are
recognised in the statement of total recognised gains and losses.
In line with the prudential guidance applying to all building societies and after taking account of foreign currency derivatives, the Group
has no substantial net exposure to foreign exchange rate fluctuations or changes in foreign currency interest rates.
Credit risk
Credit risk is the risk that counterparties will not be able to meet their obligations as they fall due. The Credit Committee is responsible
for approving and monitoring the Group’s credit exposures which it does through reviewing and approving the Group’s lending policy
and credit scoring systems and through setting limits on credit exposures to individual counterparties and across countries and industrial
sectors. The minutes of the Credit Committee are presented to the Board.
The Group has entered into a credit derivative in order to manage the credit risk of an investment portfolio. The credit derivative
enables the Group to transfer a proportion of the credit risk relating to the relevant securities to a third party whilst retaining the
underlying investment portfolio.
Recognised gains and losses on hedges
As explained in the Statement of Accounting Policies the Group uses hedge accounting to recognise gains and losses on instruments
used for hedging specific financial instruments over the residual life of the underlying instruments. The table below shows the extent of
hedge accounting within the Group:
Gains Losses Net Gains/(Losses)
£m £m £mAmounts deferred in the balance sheet as at 4 April 2003 14.1 (18.4) (4.3)
Amounts recognised in the year to 4 April 2004 (7.1) 2.6 (4.5)
Amounts not recognised in the year to 4 April 2004 7.0 (15.8) (8.8)
Amounts arising in the year to 4 April 2004 that were (0.2) 0.6 0.4
not recognised in that year
Amounts deferred in the balance sheet as at 4 April 2004 6.8 (15.2) (8.4)
Expected to be recognised in the year to 4 April 2005 (3.8) 1.4 (2.4)
Expected to be recognised thereafter 10.6 (16.6) (6.0)
Unrecognised gains and losses on hedges
Gains and losses on instruments used for hedging are not recognised, as these hedges are accounted for on an accruals basis in line
with the underlying instruments being hedged. The following table shows gains and losses that would occur if these instruments were
carried at market value.
Notes to the Accounts (continued)
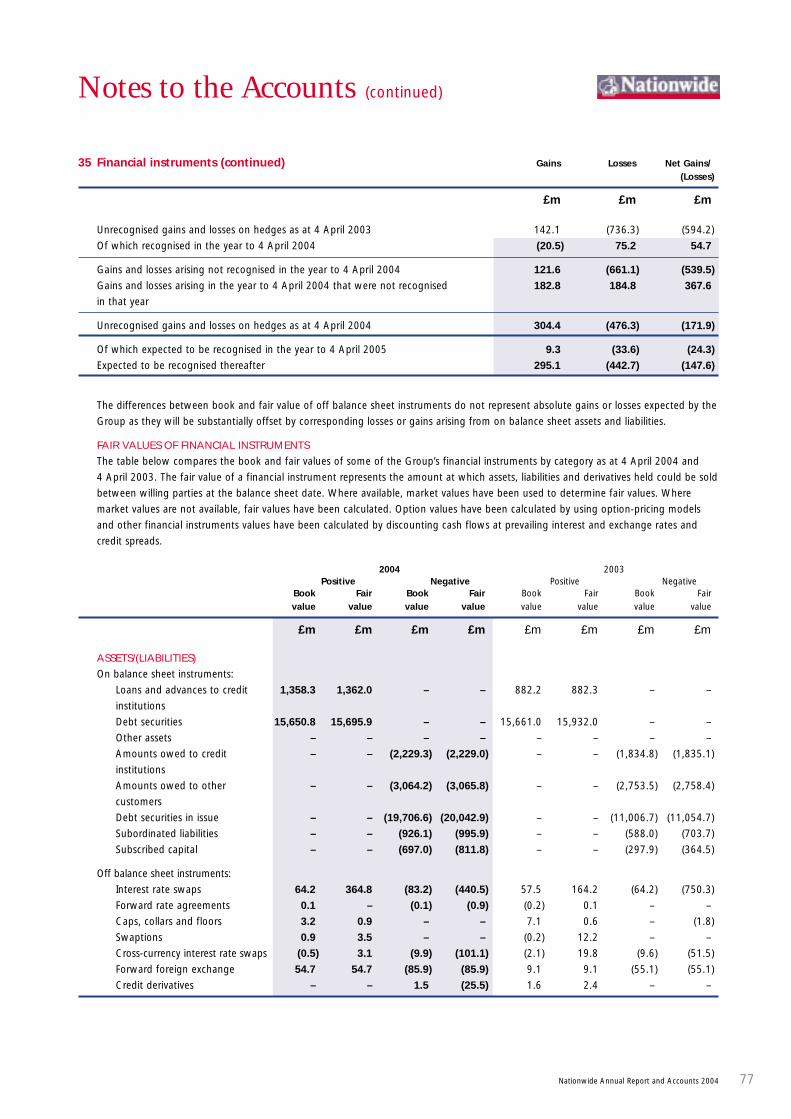
Notes to the Accounts (continued)
Nationwide Annual Report and Accounts 2004 77
35 Financial instruments (continued) Gains Losses Net Gains/(Losses)
£m £m £m
Unrecognised gains and losses on hedges as at 4 April 2003 142.1 (736.3) (594.2)
Of which recognised in the year to 4 April 2004 (20.5) 75.2 54.7
Gains and losses arising not recognised in the year to 4 April 2004 121.6 (661.1) (539.5)
Gains and losses arising in the year to 4 April 2004 that were not recognised 182.8 184.8 367.6
in that year
Unrecognised gains and losses on hedges as at 4 April 2004 304.4 (476.3) (171.9)
Of which expected to be recognised in the year to 4 April 2005 9.3 (33.6) (24.3)
Expected to be recognised thereafter 295.1 (442.7) (147.6)
The differences between book and fair value of off balance sheet instruments do not represent absolute gains or losses expected by the
Group as they will be substantially offset by corresponding losses or gains arising from on balance sheet assets and liabilities.
FAIR VALUES OF FINANCIAL INSTRUMENTS
The table below compares the book and fair values of some of the Group’s financial instruments by category as at 4 April 2004 and
4 April 2003. The fair value of a financial instrument represents the amount at which assets, liabilities and derivatives held could be sold
between willing parties at the balance sheet date. Where available, market values have been used to determine fair values. Where
market values are not available, fair values have been calculated. Option values have been calculated by using option-pricing models
and other financial instruments values have been calculated by discounting cash flows at prevailing interest and exchange rates and
credit spreads.
2004 2003Positive Negative Positive Negative
Book Fair Book Fair Book Fair Book Fairvalue value value value value value value value
£m £m £m £m £m £m £m £m
ASSETS/(LIABILITIES)
On balance sheet instruments:
Loans and advances to credit 1,358.3 1,362.0 – – 882.2 882.3 – –
institutions
Debt securities 15,650.8 15,695.9 – – 15,661.0 15,932.0 – –
Other assets – – – – – – – –
Amounts owed to credit – – (2,229.3) (2,229.0) – – (1,834.8) (1,835.1)
institutions
Amounts owed to other – – (3,064.2) (3,065.8) – – (2,753.5) (2,758.4)
customers
Debt securities in issue – – (19,706.6) (20,042.9) – – (11,006.7) (11,054.7)
Subordinated liabilities – – (926.1) (995.9) – – (588.0) (703.7)
Subscribed capital – – (697.0) (811.8) – – (297.9) (364.5)
Off balance sheet instruments:
Interest rate swaps 64.2 364.8 (83.2) (440.5) 57.5 164.2 (64.2) (750.3)
Forward rate agreements 0.1 – (0.1) (0.9) (0.2) 0.1 – –
Caps, collars and floors 3.2 0.9 – – 7.1 0.6 – (1.8)
Swaptions 0.9 3.5 – – (0.2) 12.2 – –
Cross-currency interest rate swaps (0.5) 3.1 (9.9) (101.1) (2.1) 19.8 (9.6) (51.5)
Forward foreign exchange 54.7 54.7 (85.9) (85.9) 9.1 9.1 (55.1) (55.1)
Credit derivatives – – 1.5 (25.5) 1.6 2.4 – –

Nationwide Annual Report and Accounts 2004 – Financial Statements
78 Nationwide Annual Report and Accounts 2004
35 Financial instruments (continued)The book value of off balance sheet instruments represents the equivalent value at which such instruments would be carried in the
balance sheet. This primarily consists of interest accruals and unaccreted forward points.
The table excludes certain financial assets and liabilities which are not listed or publicly traded, or for which a liquid and active market
does not exist. It excludes mortgages, retail savings accounts and other balance sheet items whose book and fair values differ.
The book value for subordinated liabilities includes £1.8 million (2003 – £6.0 million) included within prepayments and accrued income
and accruals and deferred income.
The book value for subscribed capital includes £5.2 million (2003 – £1.5 million) included within accruals and deferred income.
36 Non-Sterling assets and liabilities Group and Society2004 2003
£m £m
The aggregate amount of assets and liabilities included in the balance sheet
denominated in a currency other than Sterling was as follows:
Assets 8,347.8 7,839.7
Liabilities 12,519.2 5,073.2
The Group’s non-Sterling assets and liabilities are hedged on balance sheet or by using derivatives to eliminate material currency
exposures.
37 Directors' loans and related party transactionsThe aggregate amount outstanding at the end of the financial year in respect of loans from the Society or a subsidiary company
to Directors of the Society or persons connected with a Director of the Society was £1,859,573 (2003 – £1,196,285) representing loans
to 9 persons (2003 – 10 persons).
A register is maintained by the Society containing details of loans, transactions and arrangements made between the Society or its
subsidiary undertakings and Directors of the Society or persons connected with Directors of the Society. The register will be available
for inspection by members at the Annual General Meeting on 22 July 2004 and during normal office hours at the Society's principal
office (Nationwide House, Pipers Way, Swindon) during the period of 15 days prior to the meeting.
Included in fees and commissions receivable is an amount of £15.0 million (2003 – £11.4 million) receivable from the life assurance
subsidiary in respect of life assurance products sold through the retail network, less associated sales force costs of £13.4 million
(2003 – £11.4 million).
There are no other related party transactions which require disclosure under FRS 8 (Related Party Disclosures).
Notes to the Accounts (continued)
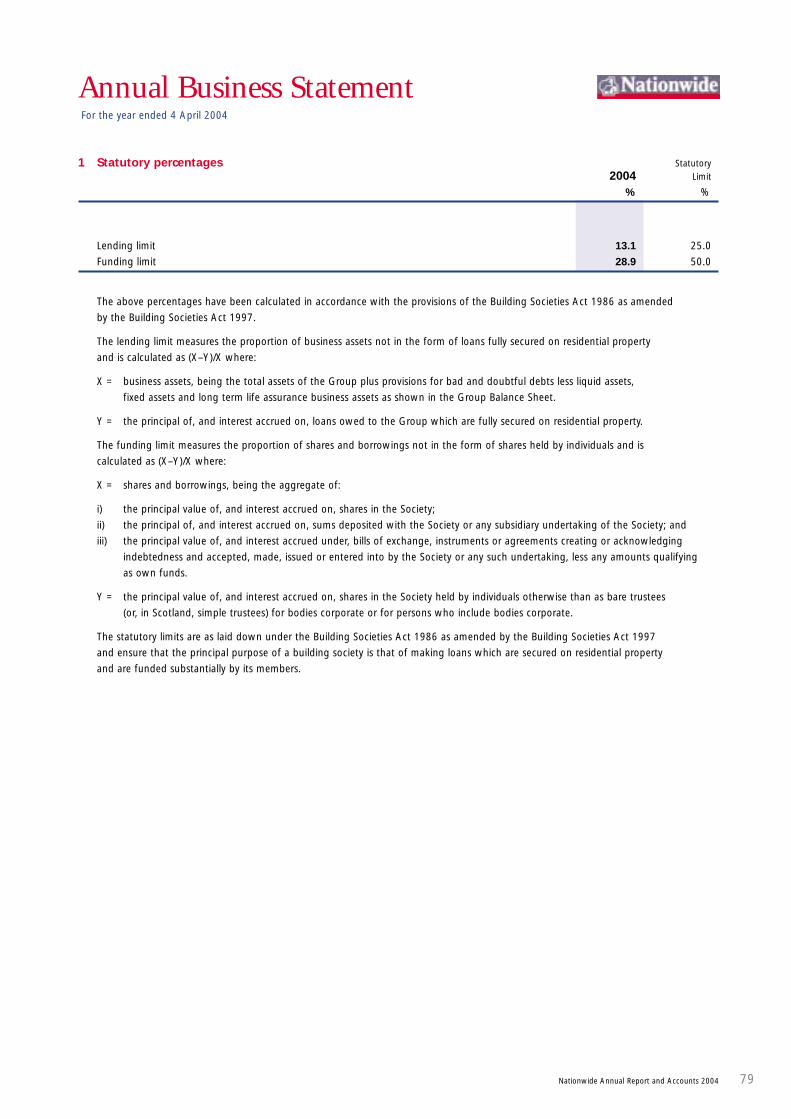
Nationwide Annual Report and Accounts 2004 79
1 Statutory percentages Statutory 2004 Limit
% %
Lending limit 13.1 25.0
Funding limit 28.9 50.0
The above percentages have been calculated in accordance with the provisions of the Building Societies Act 1986 as amended
by the Building Societies Act 1997.
The lending limit measures the proportion of business assets not in the form of loans fully secured on residential property
and is calculated as (X–Y)/X where:
X = business assets, being the total assets of the Group plus provisions for bad and doubtful debts less liquid assets,
fixed assets and long term life assurance business assets as shown in the Group Balance Sheet.
Y = the principal of, and interest accrued on, loans owed to the Group which are fully secured on residential property.
The funding limit measures the proportion of shares and borrowings not in the form of shares held by individuals and is
calculated as (X–Y)/X where:
X = shares and borrowings, being the aggregate of:
i) the principal value of, and interest accrued on, shares in the Society;
ii) the principal of, and interest accrued on, sums deposited with the Society or any subsidiary undertaking of the Society; and
iii) the principal value of, and interest accrued under, bills of exchange, instruments or agreements creating or acknowledging
indebtedness and accepted, made, issued or entered into by the Society or any such undertaking, less any amounts qualifying
as own funds.
Y = the principal value of, and interest accrued on, shares in the Society held by individuals otherwise than as bare trustees
(or, in Scotland, simple trustees) for bodies corporate or for persons who include bodies corporate.
The statutory limits are as laid down under the Building Societies Act 1986 as amended by the Building Societies Act 1997
and ensure that the principal purpose of a building society is that of making loans which are secured on residential property
and are funded substantially by its members.
Annual Business StatementFor the year ended 4 April 2004
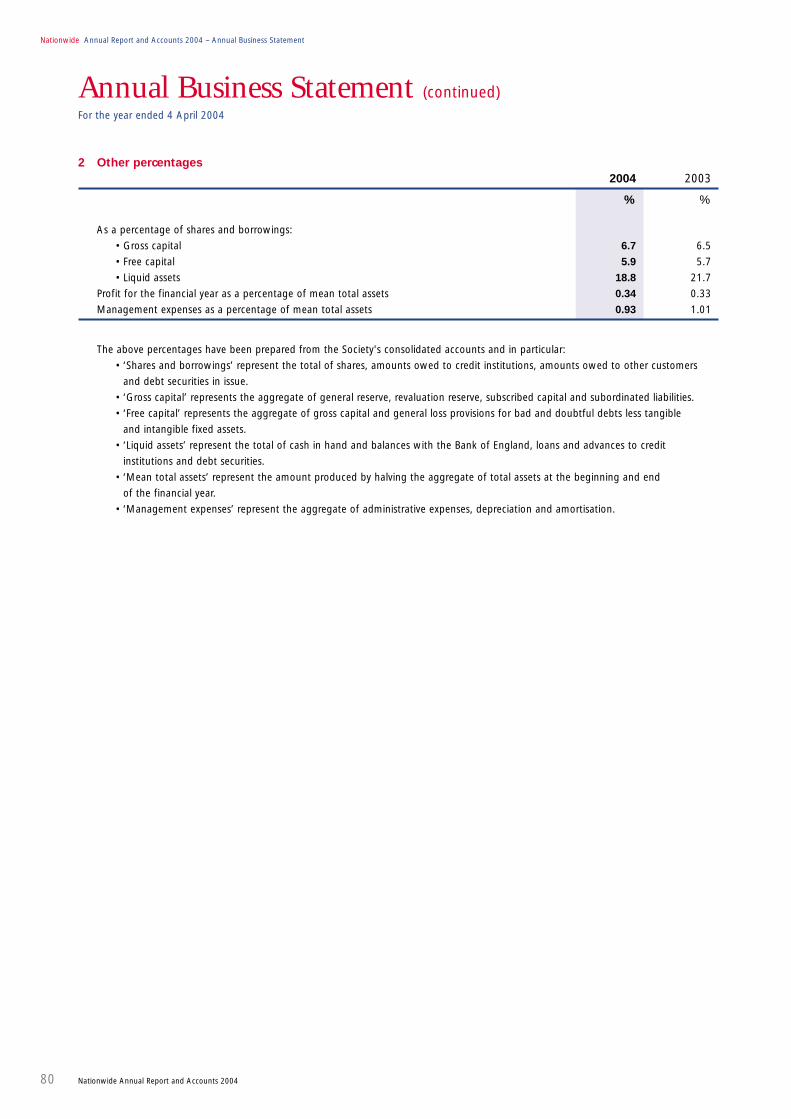
2 Other percentages2004 2003
% %
Nationwide Annual Report and Accounts 2004 – Annual Business Statement
80 Nationwide Annual Report and Accounts 2004
As a percentage of shares and borrowings:
• Gross capital 6.7 6.5
• Free capital 5.9 5.7
• Liquid assets 18.8 21.7
Profit for the financial year as a percentage of mean total assets 0.34 0.33
Management expenses as a percentage of mean total assets 0.93 1.01
The above percentages have been prepared from the Society's consolidated accounts and in particular:
• ‘Shares and borrowings’ represent the total of shares, amounts owed to credit institutions, amounts owed to other customers
and debt securities in issue.
• ‘Gross capital’ represents the aggregate of general reserve, revaluation reserve, subscribed capital and subordinated liabilities.
• ‘Free capital’ represents the aggregate of gross capital and general loss provisions for bad and doubtful debts less tangible
and intangible fixed assets.
• ‘Liquid assets’ represent the total of cash in hand and balances with the Bank of England, loans and advances to credit
institutions and debt securities.
• ‘Mean total assets’ represent the amount produced by halving the aggregate of total assets at the beginning and end
of the financial year.
• ‘Management expenses’ represent the aggregate of administrative expenses, depreciation and amortisation.
Annual Business Statement (continued)For the year ended 4 April 2004

Annual Business Statement (continued)For the year ended 4 April 2004
Nationwide Annual Report and Accounts 2004 81
3 Information relating to Directors and other OfficersAt 4 April 2004DirectorsName and date of birth Occupation Date of appointment Other directorships
J G W Agnew MA Banker 1 March 1997 Beazley Group plcChairman Beazley Furlonge Ltd 30 July 1941 Jarvis plc
Soditic LtdSoditic SAThos Agnew & Sons Ltd
B A Walsh MSc (Econ), FCMA, CIMgt Company Director 2 August 1999Deputy Chairman27 May 1944
P F Williamson BA (Econ), FCIB Chief Executive 5 April 1996 Building Societies Association, Council Member11 December 1947
B K Simpson MIMIS, FRSA Deputy Chief Executive 4 May 1994 Nationwide Anglia Property Services Ltd29 January 1948 and Chief Operating Officer Nationwide Trust Ltd
NBS Fleet Services LtdThe Nationwide Foundation
G J Beale BSc, ACA Group Finance Director 5 April 2003 First Nationwide Investments Ltd19 October 1958 First Nationwide
Nationwide Anglia Property Services LtdNBS Fleet Services Ltd
S D M Bernau BSc (Econ), FCIB, MCT Commercial and 1 November 1996 at.home nationwide ltd15 August 1951 Treasury Director Council of Mortgage Lenders, Executive
Committee MemberCouncil of Mortgage Lenders, Chairman’s Committee,
Deputy ChairmanCouncil of the Chartered Institute of Bankers,
MemberEthos Independent Financial Services LtdFinancial Services National Training Organisation,
MemberFirst NationwideFirst Nationwide Investments LtdNationwide BES Fund Managers LtdNationwide Housing Trust LtdNationwide Investments (No 1) LtdNationwide Lease Finance LtdNationwide Mortgage Corporation LtdNationwide Life LtdNationwide Syndications LtdNationwide Unit Trust Managers LtdThe Minchinhampton Golf Club Ltd
Nationwide Annual Report and Accounts 2004 – Annual Business Statement
82 Nationwide Annual Report and Accounts 2004
3 Information relating to Directors and other Officers (continued)At 4 April 2004DirectorsName and date of birth Occupation Date of appointment Other directorships
J H Willens MBA, DMS, ACIB Retail Operations Director 1 January 2002 Institution of Financial Services Retail Faculty Board,7 June 1956 Member
Monument (Sutton) LtdNationwide Anglia Property Services LtdNationwide Home Loans LtdNationwide Life LtdNationwide Unit Trust Managers LtdUCB Home Loans Corporation Ltd
Mrs S J David Company Director 16 April 2003 Bacardi UK LtdMA Cantab Bacardi-Martini b.v.20 November 1962 Bacardi-Martini Ltd
First Drinks Brands LtdSupervisory Board of Bacardi-Martini
Netherlands NVThe Pure Brewing Company LtdWestbay Distributors Ltd
J Engestrom MBA Company Director 1 March 1997 Nationwide Life Ltd7 February 1942 Nationwide Unit Trust Managers Ltd
Wellington Underwriting Agencies LtdWellington Underwriting plc
Ms R E Evans MA Company Director 1 April 2002 General Medical Council, Lay Member and Chairman12 October 1957 of Standards Committee
Independent Inquiry into Drug Testing At Work,Chairman
Law Society Governance Review Group, Member Ofcom Consumer Panel, Deputy ChairPanel of Independent Assessors, Office of the
Commissioner for Public Appointments, Member Tribunals for Users Programme Interdepartmental
Steering Group, non-executive Member
R G Handover Company Director 1 May 2000 Adult Learning Inspectorate, Chairman13 April 1946 Business in the Community, Vice Chairman
Royal Mail Holdings plcWHSmith plc, Chairman
R P Walther MA, FIA Company Director 1 July 2002 Fidelity European Values plc, Chairman31 July 1943 JP Morgan Fleming Claverhouse
Investment Trust plc, ChairmanNationwide Life LtdNationwide Unit Trust Managers Ltd
Documents may be served on any of the Directors at Burges Salmon LLP, Narrow Quay House, Narrow Quay, Bristol, BS1 4AH Directors' Service ContractsDetails of the Directors’ service contracts are shown in the Report of the Directors on Remuneration.Directors’ Share OptionsNo Director or other Officer, including connected persons, has any rights to subscribe for shares in, or debentures of, any connected undertaking of the Society.
Annual Business Statement (continued)For the year ended 4 April 2004

Annual Business Statement (continued)For the year ended 4 April 2004
Nationwide Annual Report and Accounts 2004 83
3 Information relating to Directors and other Officers (continued)At 4 April 2004OfficersName Occupation Directorships
R T Bailey DMS Divisional Director (Branch Network)
S C Clode BSc (Econ), MA, PhD Divisional Director (Marketing) Lingmoor View Management LtdNationwide Trust Ltd
A J del Strother BA, FCIB, FCIPD Divisional Director (Personnel and Development) The Nationwide Foundation
P Feldman BSc (Hons), PhD Divisional Director (Banking and Savings) BACS LtdCheque and Credit Clearing Company LtdCouncil of Association of Payment and
Clearing Services (APACS), MemberLINK Interchange Network LtdNationwide International Ltd
M R Jenkins BA (Hons), FCA, DIPL Divisional Director (Commercial) at.home nationwide ltdLongwide LtdNationwide BES Fund Managers LtdNationwide Housing Trust LtdNationwide Lease Finance LtdNationwide Mortgage Corporation LtdNationwide Syndications Ltd
T L Morshead FCIM Divisional Director (Mortgages and Insurance) Ethos Independent Financial Services LtdFoundation Insurance LtdMBL Financial Services LtdMBL Holdings LtdMortgage Brain LtdNationwide Life LtdNationwide Unit Trust Managers LtdPremier Processing Services LtdThe Mortgage Trading Exchange Ltd
D G Parry ACIB, DMS Divisional Director (Finance and Planning)
D J Rigney ACMA, MBA Divisional Director (Central Retail Operations)
J A Sutherland MA, MBA, FCIB, Dip FS Divisional Director (Member Account Administration) Prospect Foundation Ltd
W P Tonks MA, CPFA Divisional Director (Risk Management) Council of Management of the Regulatory Policy Institute
F I Walsh BSc Divisional Director (Technology) Nationwide International Ltd
C R L Wilson Divisional Director (Legal Compliance)
J R Wood Divisional Director (Treasury) Aldbury Housing AssociationFirst NationwideNationwide Lease Finance Ltd
Nationwide Annual Report and Accounts 2004 – Index
84 Nationwide Annual Report and Accounts 2004
Index
Accounting policies, statement of 41 – 44Accruals and deferred income (Note 26) 65Administrative expenses (Note 5) 47Amounts owed to credit institutions (Note 22) 64Amounts owed to other customers (Note 23) 64Amounts released and provisions against fixed asset investments (Note 13) 55Annual Business Statement 79 – 83Assets and Liabilities Committee 20, 71Assets and Liabilities relating to long-term life assurance business (Note 20) 63Audit Committee 26, 28 – 29Auditors’ Report 35Balance Sheet – Group 38Balance Sheet – Society 39Board – biographies and information 22 – 23, 81 – 82Chairman’s Statement 2Chief Executive’s Review 3 – 5Consolidated Cash Flow Statement 40Consolidated Cash Flow Statement (Note 34) 70Corporate Governance Report 26 – 30Debt securities (Note 12) 54 – 55Debt securities in issue (Note 24) 65Derivatives 21, 42, 71 – 78Directors’ emoluments (Note 7) 31 – 34, 48Directors’ loans and related party transactions (Note 37) 78Directors’ Report 24 – 25Divisional Directors 83Employees (Note 6) 47Financial commitments (Note 33) 69Financial instruments (Note 35) 71 – 78Financial Review 11 – 21Fixed assets – tangible (Note 17) 60 – 61Income – from investments (Note 3) 46Income – other operating income (Note 4) 46Income and Expenditure Accounts 36Interest payable and similar charges (Note 2) 46Interest receivable and similar income (Note 1) 45Investments (Note 16) 58 – 59Loans and advances to credit institutions (Note 11) 53Loans and advances to customers (Note 14) 56Non-Sterling assets and liabilities (Note 36) 78Note of Historical Cost Profits and Losses 37Operating and Financial Review 6 – 21Operating Review 6 – 10Other assets (Note 18) 62Other liabilities (Note 25) 65Pension arrangements (Note 8) 48 – 51Prepayments and accrued income (Note 19) 62Provisions for bad and doubtful debts (Note 15) 57Provisions for liabilities and charges (Note 27) 66Remuneration Report 31 – 34Remuneration Committee 26 – 27, 32Reserve – general (Note 31) 68Reserve – revaluation (Note 30) 67Segmental reporting (Note 10) 53Shares (Note 21) 63Statements of Total Recognised Gains and Losses 37Subordinated liabilities (Note 28) 66 – 67Subscribed capital (Note 29) 67Subsidiaries 58 – 59Tax on profit on ordinary activities (Note 9) 52

Contents
01 Financial Highlights
02 Chairman’s Statement
03 Chief Executive’s Review
06 Operating and Financial Review
22 Board of Directors
24 Directors’ Report
26 Report of the Directors on Corporate Governance
31 Report of the Directors on Remuneration
35 Independent Auditors’ Report
36 Income and Expenditure Accounts
37 Statements of Total Recognised Gains and Losses
37 Note of Historical Cost Profits and Losses
38 Group Balance Sheet
39 Society Balance Sheet
40 Consolidated Cash Flow Statement
41 Statement of Accounting Policies
45 Notes to the Accounts
79 Annual Business Statement
84 Index
We’re different because we’re abuilding society. We’re run for thebenefit of our members, and take pridein championing the rights of consumers.
Our principles of fairness, honestyand openness enable us to offer betterrates, fewer charges and an excellentlevel of service.
We’re committed to remaininga building society so that we cancontinue to offer these benefits tomembers now and in the future.
AN
NU
AL
RE
PO
RT
AN
D A
CC
OU
NT
S 2
00
4N
AT
ION
WID
E B
UIL
DIN
G S
OC
IET
Y
ANNUAL REPORT AND ACCOUNTS 2004
‘Our members are at the heart of our business’Philip Williamson, Chief Executive
Nationwide Building Society, Head Office, Nationwide House, Pipers Way, Swindon SN38 1NW
©Nationwide Building Society
www.nationwide.co.uk