Embed Size (px)
Citation preview


“Without data, you are just another person with an opinion.” — W. Edwards Deming
Nothing informs a discussion better than solid data, and the 2016/17 Magazine Media Factbook has plentyof conversation starters. The research continues to show that magazine media is the most trusted, inspiring and influential of all media, and several new studies provide even more proof of magazine media’s powerful ability to drive sales.
Reliable third-party sources, including Millward Brown Digital and Nielsen Catalina Solutions, have recently released reports that show the incredible power of print advertising. Adding print to the advertising mix improves the overall campaign performance, both persuasion metrics and purchase intent; ads inmagazines deliver a higher Return on Advertising Spend than any other measured media.
In addition to the clear statistics that magazine media drives sales, we have solid research that touts the many unique benefits of paper-based reading, such as higher comprehension and recall, more focused attention and the fact that print is preferred by the majority of readers—even millennials.
Within these nearly 100 pages of current, compelling and comprehensive facts and figures, you will see that the power of magazine media is undeniably clear.
I hope you find the Factbook useful and that you share in our excitement for the future.
— Linda Thomas Brooks — President and Chief Executive Officer, MPA–The Association of Magazine Media

28 Magazine media net audience continues to grow 29 Print and digital magazine audience continues to increase
30 Digital edition magazine readers are young, educated and professional
31 Readers of all ages enjoy print magazines
32 The median age of magazine readers reflects the median age of the U.S. population
33 Print magazines are more balanced across generations than internet, TV, radio and newspapers
34 Magazine media readership is diverse
35 Print magazines reach more households with $150K+ than any other medium
36 Magazines show the highest return on advertising spend by far 37 Advertising in magazine media lifts sales
39 Brands that advertise in print magazines achieve greater increases in brand awareness, favorability and purchase intent than online or TV advertising
46 Print magazine advertising inspires readers to take action— regardless of ad position or size 48 Print magazines are #1 in reaching affluent influential consumers
50 Across product categories, trusted recommenders are devoted print magazine readers
51 Automotive: Print magazines drive automotive growth—especially at the top end of the market
52 Automotive: Print magazines deliver consumers with the highest auto purchase intent
53 Automotive: Print magazine readers are most likely to purchase or lease vehicles of all types
TABLE OF CONTENTS04
MAGAZINE MEDIA 360° 6 Magazine Media 360° is . . .
7 2015 Full Year Average Performance 8 2015 Category Performance
17 Social Media Report
23 Magazine Media USP
24 What neuroscience says about why print magazine ads work
INFLUENCE/IMPACT 25 Americans of all ages read print magazines—especially younger adults 26 The top 25 print magazines reach more adults and teens than the top 25 primetime TV programs
27 Print magazine audience builds long after publication date
TABLE OF CONTENTSTOP 10 HIGHLIGHTS

TABLE OF CONTENTS05
54 Super influentials in every segment are devoted print magazine readers 55 Healthcare/pharma: Print magazines excel in reaching super influential healthcare and healthy living consumers
56 Healthcare/pharma: Print readers are the most informed and engaged healthcare customers
57 Healthcare/pharma: Magazine media advertising is #1 in driving consumer healthcare actions
58 Healthcare/pharma: Those who view healthcare ads in magazine media are most likely to purchase prescription products
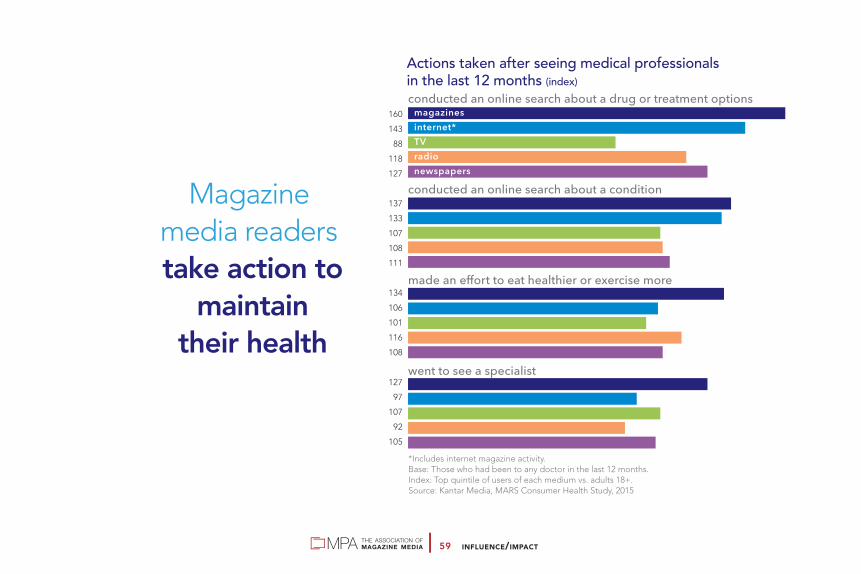
59 Healthcare/pharma: Magazine media readers take action to maintain their health
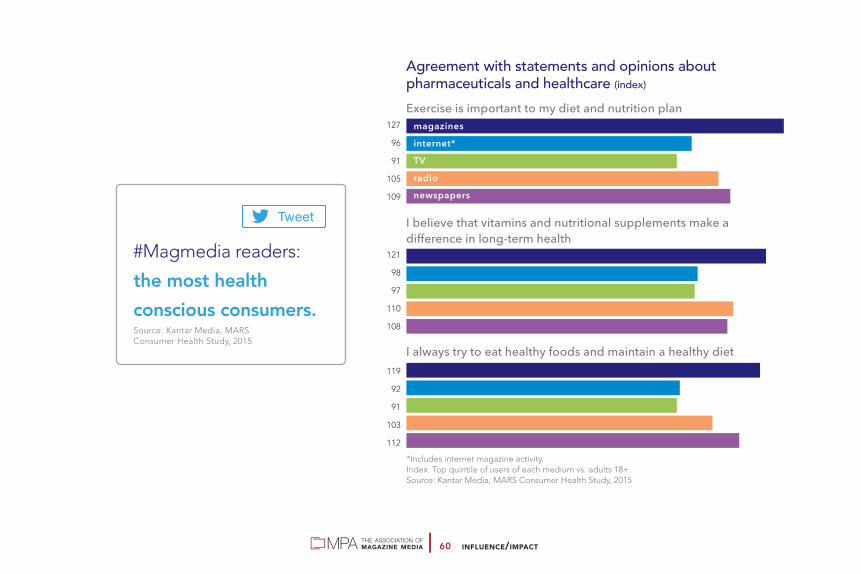
60 Healthcare/pharma: Magazine media readers are the most health conscious consumers
61 Food: Super influentials consume print magazines
62 Financial: Households with the largest assets prefer magazine media
63 Financial: Magazine media readers plan to invest in stocks and mutual funds more than consumers of other media
64 Luxury goods: Category influencers are devoted print magazine readers
65 Luxury goods: Category buyers are devoted print magazine readers
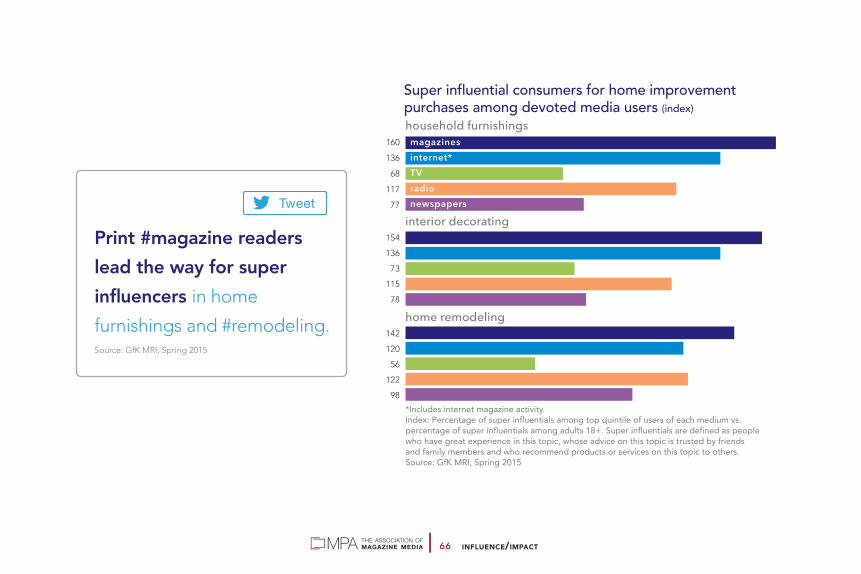
66 Home furnishing/remodeling: Print magazine readers lead the way for super influencers in home improvement
69 Travel: Affluent magazine readers are the most frequent travelers
70 Travel: Magazine media users are most likely to vacation abroad
71 Travel: Affluent magazine readers are most likely to spend $10k+ on a vacation within the U.S. 72 Travel: Print magazine readers travel more than internet, TV, radio and newspaper media users
73 Technology: Print magazine readers strongly influence technology buys
74 Entertainment: Print magazine readers are avid buyers of entertainment technology goods and services
AD ENVIRONMENT 75 Ads in magazine media are valued more than ads in other media 76 Print magazine readers believe in brands and are heavily swayed by advertising
77 Influential household members are especially receptive to advertising in magazine media
78 Print magazines are the most trusted, inspiring and motivating form of media 79 Readers of print or digital magazines are more likely to feel positive
80 Print magazine readers enjoy spending their free time engaging in a variety of activities
83 Print magazine readers are actively engaged, knowledgeable and inquisitive
MAGAZINE BRAND VITALITY 84 Seasonality: Magazine advertising doesn’t take a vacation
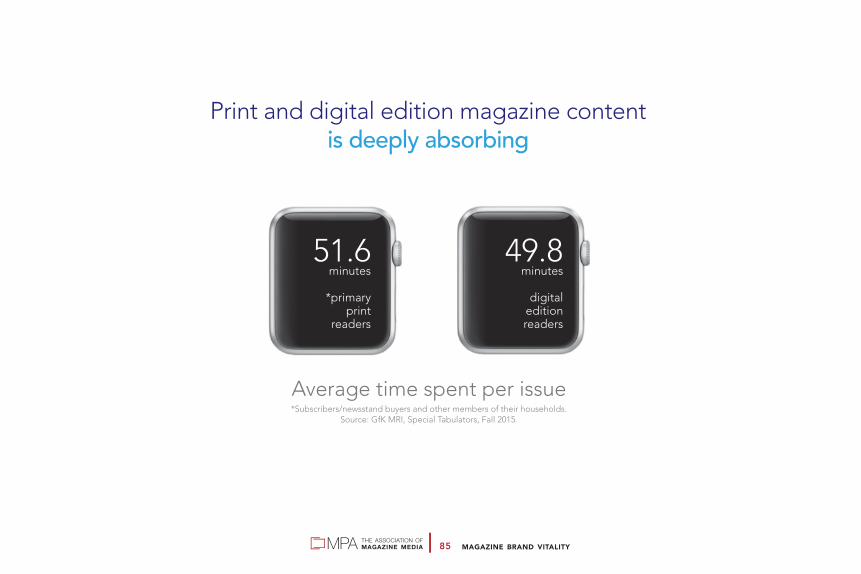
85 Print and digital edition magazine content is deeply absorbing
86 The number of U.S. print consumer magazines from 2005-2015
87 237 new print magazine brands launched in 2015 88 More than 185 print magazines have thrived for over 50 years
89 Leading marketers invest in print magazines

MAGAZINE MEDIA 360°06
Magazine Media 360ºMagazine Media 360° measures audiences across multiple platforms and formats to provide a comprehensive and accurate picture of consumer demand for magazine media brands.
Platforms and formats covered include:• print+digital magazine editions• web (desktop and laptop)• mobile web• video• social media (reported separately)
Magazine Media 360° uses data from leading third-party providers and currently covers more than 138 magazine media brands from more than 33 publishing companies, representing 95% of the reader universe.
The MPA Magazine Media 360° Brand Audience Report, whichcontains the 360° audience metric by title, is published monthlyat www.magazine.org. The separate MPA Magazine Media 360° Social Media Report is released quarterly.
The #MM360 BrandAudience Reportmeasures monthly volumein print+digital, web,mobile web and video.MPA, 2016
MagazineMedia 360˚
Brand AudienceReport
WINNERFIPP 2016INSIGHTAWARDThe new
global mediameasurement
standard
MAGAZINE MEDIA 360°07
20141.648 B*
Gross Brand ImpressionsYear Average
Web(Desktop/Laptop)17%
Mobile Web23%
Video3%
Web(Desktop/Laptop)15%
Mobile Web31%
Video3%
Print+DigitalEditions51%
Print+DigitalEditions57%
20151.751 B
Gross Brand ImpressionsYear Average
Audience Growth* +6.2%*Due to a former joint venture with CNN, 2014 web/mobile data for Fortune and Money is not available and is not reported for these titles. Additionally, in order toappropriately calculate audience percentage change, Fortune and Money were excluded in their entirety from the current year to date and year ago data.
Sources: Print+Digital Editions GfK MRI’s Survey of the American Consumer® Print+Digital Fall 2015 and Fall 2014, GfK MRI’s Survey of the American Consumer® Print+Digital DoubleBase 2015 and 2014, GfK MRI Accessed Prototype, GfK MRI’s Teenmark® or 2015 and 2014 Ipsos Affluent Survey USA (Print only). Web (Desktop/Laptop) comScore Media Metrix® or Nielsen NetView; unique visitors; Jan.–Dec. 2015 and Jan.–Dec. 2014; U.S. Mobile Web comScore Mobile Metrix or Nielsen Mobile NetView 3.0; unique visitors; Jan.–Dec. 2015 and Jan.–Dec. 2014; U.S. Video comScore Video Metrix or Nielsen VideoCensus; unique viewers; Jan.–Dec. 2015 and Jan.–Dec. 2014; U.S.
Magazine Media 360º2015 Full Year Average Performance

MAGAZINE MEDIA 360°08
2014175.8 M
Year Average
Web(Desktop/Laptop)22%
Mobile Web33%
Video1%
Web(Desktop/Laptop)18%
Mobile Web41%
Video2%
Print+DigitalEditions39%
Print+DigitalEditions44%
2015192.6 M
Year Average
Audience Growth +9.5%Sources: Print+Digital Editions GfK MRI’s Survey of the American Consumer® Print+Digital Fall 2015 and 2014, GfK MRI’s Survey of the American Consumer® Print+Digital DoubleBase 2015 and 2014, GfK MRI Accessed Prototype, GfK MRI’s Teenmark® or 2015 and 2014 Ipsos Affluent Survey USA (Print only). Web (Desktop/Laptop) comScore Media Metrix® or Nielsen NetView; unique visitors; Jan.–Dec. 2015 and Jan.–Dec. 2014; U.S. Mobile Web comScore Mobile Metrix or Nielsen Mobile NetView 3.0; unique visitors; Jan.–Dec. 2015 and Jan.–Dec. 2014; U.S. Video comScore Video Metrix or Nielsen VideoCensus; unique viewers; Jan.–Dec. 2015 and Jan.–Dec. 2014; U.S.
Magazine Media 360º2015 Epicurean Category

MAGAZINE MEDIA 360°09
2014130.6 M
Year Average
Web(Desktop/Laptop)15%
Mobile Web24%
Video<1%
Web(Desktop/Laptop)11%
Mobile Web32%
Video<1%
Print+DigitalEditions58%
Print+DigitalEditions60%
2015129.5 M
Year Average
Audience Growth -0.8%Sources: Print+Digital Editions GfK MRI’s Survey of the American Consumer® Print+Digital Fall 2015 and 2014, GfK MRI’s Survey of the American Consumer® Print+Digital DoubleBase 2015 and 2014, GfK MRI Accessed Prototype, GfK MRI’s Teenmark® or 2015 and 2014 Ipsos Affluent Survey USA (Print only). Web (Desktop/Laptop) comScore Media Metrix® or Nielsen NetView; unique visitors; Jan.–Dec. 2015 and Jan.–Dec. 2014; U.S. Mobile Web comScore Mobile Metrix or Nielsen Mobile NetView 3.0; unique visitors; Jan.–Dec. 2015 and Jan.–Dec. 2014; U.S. Video comScore Video Metrix or Nielsen VideoCensus; unique viewers; Jan.–Dec. 2015 and Jan.–Dec. 2014; U.S.
Magazine Media 360º2015 Health and Fitness Category

MAGAZINE MEDIA 360°010
201420.3 MYear Average
Web(Desktop/Laptop)16%
Mobile Web25%
Video7%
Print+DigitalEditions32%
Print+DigitalEditions52%
201529.8 MYear Average
Audience Growth +46.5%Sources: Print+Digital Editions GfK MRI’s Survey of the American Consumer® Print+Digital Fall 2015 and 2014, GfK MRI’s Survey of the American Consumer® Print+Digital DoubleBase 2015 and 2014, GfK MRI Accessed Prototype, GfK MRI’s Teenmark® or 2015 and 2014 Ipsos Affluent Survey USA (Print only). Web (Desktop/Laptop) comScore Media Metrix® or Nielsen NetView; unique visitors; Jan.–Dec. 2015 and Jan.–Dec. 2014; U.S. Mobile Web comScore Mobile Metrix or Nielsen Mobile NetView 3.0; unique visitors; Jan.–Dec. 2015 and Jan.–Dec. 2014; U.S. Video comScore Video Metrix or Nielsen VideoCensus; unique viewers; Jan.–Dec. 2015 and Jan.–Dec. 2014; U.S.
Magazine Media 360º2015 Men’s Fashion and Grooming Category
Web(Desktop/Laptop)19%
Mobile Web36%
Video14%

MAGAZINE MEDIA 360°011
2014239.9 M
Year Average
Web(Desktop/Laptop)23%
Mobile Web31%
Video5%
Web(Desktop/Laptop)18%
Mobile Web40%
Video9%
Print+DigitalEditions33%
Print+DigitalEditions41%
2015266.9 M
Year Average
Audience Growth +11.3%Sources: Print+Digital Editions GfK MRI’s Survey of the American Consumer® Print+Digital Fall 2015 and 2014, GfK MRI’s Survey of the American Consumer® Print+Digital DoubleBase 2015 and 2014, GfK MRI Accessed Prototype, GfK MRI’s Teenmark® or 2015 and 2014 Ipsos Affluent Survey USA (Print only). Web (Desktop/Laptop) comScore Media Metrix® or Nielsen NetView; unique visitors; Jan.–Dec. 2015 and Jan.–Dec. 2014; U.S. Mobile Web comScore Mobile Metrix or Nielsen Mobile NetView 3.0; unique visitors; Jan.–Dec. 2015 and Jan.–Dec. 2014; U.S. Video comScore Video Metrix or Nielsen VideoCensus; unique viewers; Jan.–Dec. 2015 and Jan.–Dec. 2014; U.S.
Magazine Media 360º2015 Newsweeklies Category

MAGAZINE MEDIA 360°012
2014184.7 M
Year Average
Web(Desktop/Laptop)10%
Mobile Web13%
Video1%
Web(Desktop/Laptop)10%
Mobile Web22%
Video1%
Print+DigitalEditions68%
Print+DigitalEditions75%
2015189.7 M
Year Average
Audience Growth +2.7%Sources: Print+Digital Editions GfK MRI’s Survey of the American Consumer® Print+Digital Fall 2015 and 2014, GfK MRI’s Survey of the American Consumer® Print+Digital DoubleBase 2015 and 2014, GfK MRI Accessed Prototype, GfK MRI’s Teenmark® or 2015 and 2014 Ipsos Affluent Survey USA (Print only). Web (Desktop/Laptop) comScore Media Metrix® or Nielsen NetView; unique visitors; Jan.–Dec. 2015 and Jan.–Dec. 2014; U.S. Mobile Web comScore Mobile Metrix or Nielsen Mobile NetView 3.0; unique visitors; Jan.–Dec. 2015 and Jan.–Dec. 2014; U.S. Video comScore Video Metrix or Nielsen VideoCensus; unique viewers; Jan.–Dec. 2015 and Jan.–Dec. 2014; U.S.
Magazine Media 360º2015 Shelter Category

MAGAZINE MEDIA 360°013
201430.9 MYear Average
Web(Desktop/Laptop)8%
Mobile Web9%
Video<1%
Web(Desktop/Laptop)8%
Mobile Web19%
Video<1%
Print+DigitalEditions72%
Print+DigitalEditions85%
201534.4 MYear Average
Audience Growth +11.1%Sources: Print+Digital Editions GfK MRI’s Survey of the American Consumer® Print+Digital Fall 2015 and 2014, GfK MRI’s Survey of the American Consumer® Print+Digital DoubleBase 2015 and 2014, GfK MRI Accessed Prototype, GfK MRI’s Teenmark® or 2015 and 2014 Ipsos Affluent Survey USA (Print only). Web (Desktop/Laptop) comScore Media Metrix® or Nielsen NetView; unique visitors; Jan.–Dec. 2015 and Jan.–Dec. 2014; U.S. Mobile Web comScore Mobile Metrix or Nielsen Mobile NetView 3.0; unique visitors; Jan.–Dec. 2015 and Jan.–Dec. 2014; U.S. Video comScore Video Metrix or Nielsen VideoCensus; unique viewers; Jan.–Dec. 2015 and Jan.–Dec. 2014; U.S.
Magazine Media 360º2015 Travel Category

MAGAZINE MEDIA 360°014
201492.8 MYear Average
Web(Desktop/Laptop)12%
Mobile Web18%
Video3%
Web(Desktop/Laptop)12%
Mobile Web34%
Video2%
Print+DigitalEditions51%
Print+DigitalEditions67%
2015108.9 M
Year Average
Audience Growth +17.4%Sources: Print+Digital Editions GfK MRI’s Survey of the American Consumer® Print+Digital Fall 2015 and 2014, GfK MRI’s Survey of the American Consumer® Print+Digital DoubleBase 2015 and 2014, GfK MRI Accessed Prototype, GfK MRI’s Teenmark® or 2015 and 2014 Ipsos Affluent Survey USA (Print only). Web (Desktop/Laptop) comScore Media Metrix® or Nielsen NetView; unique visitors; Jan.–Dec. 2015 and Jan.–Dec. 2014; U.S. Mobile Web comScore Mobile Metrix or Nielsen Mobile NetView 3.0; unique visitors; Jan.–Dec. 2015 and Jan.–Dec. 2014; U.S. Video comScore Video Metrix or Nielsen VideoCensus; unique viewers; Jan.–Dec. 2015 and Jan.–Dec. 2014; U.S.
Magazine Media 360º2015 Women’s Fashion Category

MAGAZINE MEDIA 360°015
201451.5 MYear Average
Web(Desktop/Laptop)24%
Mobile Web20%
Video3%
Web(Desktop/Laptop)20%
Mobile Web29%
Video2%
Print+DigitalEditions49%
Print+DigitalEditions53%
201557.6 MYear Average
Audience Growth +11.9%Sources: Print+Digital Editions GfK MRI’s Survey of the American Consumer® Print+Digital Fall 2015 and 2014, GfK MRI’s Survey of the American Consumer® Print+Digital DoubleBase 2015 and 2014, GfK MRI Accessed Prototype, GfK MRI’s Teenmark® or 2015 and 2014 Ipsos Affluent Survey USA (Print only). Web (Desktop/Laptop) comScore Media Metrix® or Nielsen NetView; unique visitors; Jan.–Dec. 2015 and Jan.–Dec. 2014; U.S. Mobile Web comScore Mobile Metrix or Nielsen Mobile NetView 3.0; unique visitors; Jan.–Dec. 2015 and Jan.–Dec. 2014; U.S. Video comScore Video Metrix or Nielsen VideoCensus; unique viewers; Jan.–Dec. 2015 and Jan.–Dec. 2014; U.S.
Magazine Media 360º2015 Science and Technology Category

MAGAZINE MEDIA 360°016
2014129.5 M
Year Average
Web(Desktop/Laptop)43%
Mobile Web34%
Video7%
Web(Desktop/Laptop)32%
Mobile Web42%
Video9%
Print+DigitalEditions17%
Print+DigitalEditions16%
2015153.8 M
Year Average
Audience Growth +18.8%Sources: Print+Digital Editions GfK MRI’s Survey of the American Consumer® Print+Digital Fall 2015 and 2014, GfK MRI’s Survey of the American Consumer® Print+Digital DoubleBase 2015 and 2014, GfK MRI Accessed Prototype, GfK MRI’s Teenmark® or 2015 and 2014 Ipsos Affluent Survey USA (Print only). Web (Desktop/Laptop) comScore Media Metrix® or Nielsen NetView; unique visitors; Jan.–Dec. 2015 and Jan.–Dec. 2014; U.S. Mobile Web comScore Mobile Metrix or Nielsen Mobile NetView 3.0; unique visitors; Jan.–Dec. 2015 and Jan.–Dec. 2014; U.S. Video comScore Video Metrix or Nielsen VideoCensus; unique viewers; Jan.–Dec. 2015 and Jan.–Dec. 2014; U.S.
Magazine Media 360º2015 Business and Finance Category

MAGAZINE MEDIA 360° SOCIAL MEDIA017
In November 2014, MPA began releasing The Magazine Media 360º Social Media Report.
This report reveals new insights into the performance of magazine media brands on the five
leading social media platforms—Facebook, Twitter, Google+, Instagram and Pinterest. The data
on the following pages are based on the likes and followers of more than 220 magazine brands
from 36 companies. The report, from the first quarter of 2016, is based on data provided by
SocialFlow, exclusively for MPA.
“Social Networks, and especially Facebook, continue to be an important way for magazine media
publishers to distribute their content. The 360º report is a great resource to help publishers
understand the value of these social distribution platforms, and we’re pleased to partner with the
MPA to help produce it.” — Jim Anderson Chief Executive Officer, SocialFlow
Social Media Report

MAGAZINE MEDIA 360° SOCIAL MEDIA018
Social Media Report
Social network share of total magazine media industry likes/followers
Total magazine media industry likes/followers by social media(as of March 31, 2016)
D A T A P R O V I D E D B Y
Growth in number or % of page likes/followers: The absolute or % difference between total number of page likes/followers on Mar. 31, 2016, and total number of page likes/followers on Dec. 31, 2015, for brands that were measured in both periods. Magazine Media Industry: Data shown are collected from almost 220 magazine media brands from 36 companies.
Facebook Page Likes, Twitter Followers, Google+ Followers, Instagram Followers, Pinterest Followers: Number of people who have opted in to receive messages (posts, tweets or pins) from that particular social entity (page or handle). For Pinterest, includes all those following any or all “boards” on the publisher’s page. All statistics gathered on last day of month.
SOURCES: Facebook, Twitter, Google+, Instagram, Pinterest: Automatic collection through the social networks’ APIs (Application Program Interface).
191
134
24
420(m
illion
s)
Facebook Twitter Google+ Instagram Pinterest
139
47.2% 20.7%
13.4% 14.8%
2.7%
Dec 31,2015 16.0%
Mar 31,2016
46.3% 21.0%
15.3%
2.6%

MAGAZINE MEDIA 360° SOCIAL MEDIA019
Social Media Report
D A T A P R O V I D E D B Y
Growth in number or % of page likes/followers: The absolute or % difference between total number of page likes/followers on Mar 31, 2016 and total number of page likes/followers on Dec 31, 2015 for brands that were measured in both periods. Magazine Media Industry: Data shown are collected from almost 220 magazine media brands from 36 companies.
Facebook Page Likes, Twitter Followers, Google+ Followers, Instagram Followers, Pinterest Followers: Number of people who have opted in to receive messages (posts, tweets, or pins) from that particular social entity (page or handle). For Pinterest, includes all those following any or all “boards” on the publisher’s page. All statistics gathered on last day of month.
SOURCES: Facebook, Twitter, Google+, Instagram, Pinterest: Automatic collection through the social networks’ APIs (Application Program Interface).
% growth in number of magazine mediaindustry likes/followers by social network(first quarter 2016)
Growth in number of magazine medialikes/followers by social network(first quarter 2016)
Google+
2.2%
6.0%
9.5%
3.0%
19.2%
16.6
4.0
21.6
0.5
23.7(m
illion
s)
Facebook Twitter Google+ Instagram Pinterest
MAGAZINE MEDIA 360° SOCIAL MEDIA020
Social Media Report
D A T A P R O V I D E D B Y
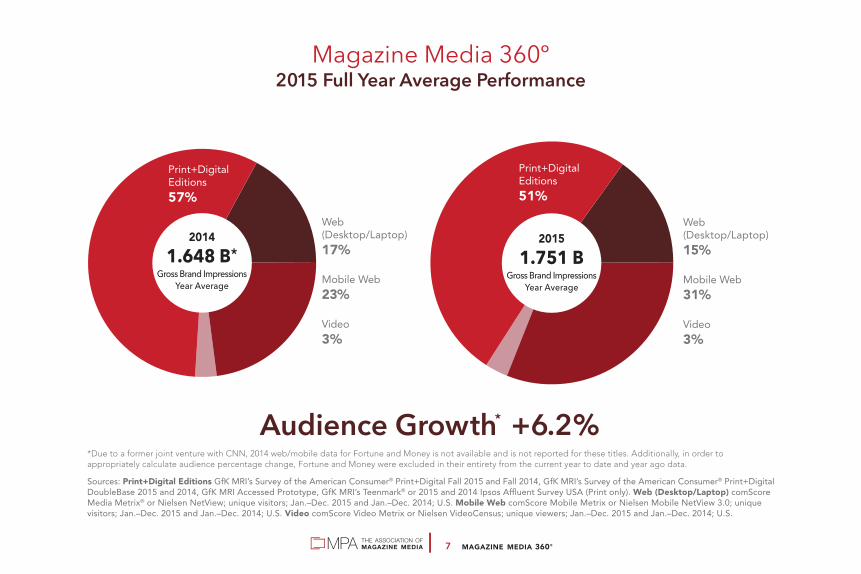
Magazine Media Industry: Data shown are collected from almost 220 magazine media brands from 36 companies. Facebook Page Likes, Twitter Followers, Google+ Followers, Instagram Followers, Pinterest Followers: Number of people who have opted in to receive messages (posts, tweets, or pins) from that particular social entity (page or handle). For Pinterest, includes all those following any or all “boards” on the publisher’s page. All statistics gathered on last day of month.
SOURCES: Facebook, Twitter, Google+, Instagram, Pinterest: Automatic collection through the social networks’APIs (Application Program Interface).
TOTAL MAGAZINEMEDIA INDUSTRY
% share by network by editorial category, March 2016
Motorcycle
Automotive
Fishing and Hunting
Hispanic
Health/Fitness
Shelter
Green
Teens
Epicurean
Women's Service
Photography
Newsweeklies
Regional
Adventure
Personal Sports
Men's Fashion & Grooming
Luxury
Science/Technology
Women's Fashion & Beauty
Popular Culture
Spectator Sports
Business/Finance
Travel
Parenting

SOCIAL MEDIA021
Magazine readersare word-of-mouth
leaders, passingalong their opinionsand experiences in
multiple productcategories
Average number of weekly conversations about product categoryamong devoted users of each medium (index) magazine media internet* TV radio newspapers
children 200 94 89 145 183
personal care/beauty 195 106 97 141 175
household products 190 105 103 143 175
home 160 95 92 128 152
financial 156 96 92 128 153
retail/apparel 154 106 100 128 145
automotive 152 94 92 131 147
beverages 131 108 99 123 125
*Includes internet magazine activity. Sample size: 30,971Index: Top quartile of users of each medium vs. adults 18–69.Source: TalkTrack® (January–December 2015) from Keller Fay Group, an Engagements Labs Company

SOCIAL MEDIA022
197
152
140
204
157
177
182
155
164
more than 20
15 or more
10 or more
Index: Percentage of top users of each medium vs. percentage of adults 18+.Note: Devoted print magazine readers are defined as those who read printed magazines at least several times per week. Devoted TV viewers are defined as those who watch live or “catch-up” TV at least 31 hours per week. Devoted radio listeners are those who listen to FM radio at least two hours a day or AM radio at least one hour a day. Each group represents approximately the same proportion of U.S. adults 18+.Source: YouGov Profiles, April 2016
Number of friends among devoted media users (index)
have a wide social circle and enjoy it
get energy by being in a group of people
consider self to be empathetic
Self-perception (index)
150
113
139
133
117
119
116
87
69
print magazinesTVradio
Devoted #magmediausers have more BFFsthan TV or radio users,
spreading their ideas
over a wide social circle.Source: YouGov Profiles, April 2016

MAGAZINE MEDIA USP023
Magazine Media USP
Magazine media delivers powerful relationships that
influence, inspire and endure. The magazine media brand
experience is based on trusted editorial, complemented
by relevant advertising. This dual immersion in edit and
ads satisfies the interests and passions of millions of
readers—when, where and how they choose. The readers’
commitment to this unique brand experience results in
extraordinary consumer engagement with magazine media
on all platforms and formats.
How much has #magmedia
grown? The #MM360 BrandAudience Report shows6.2% average performancegrowth in 2015.Source: MPA, 2016 (see page 7)

INFLUENCE/IMPACT024
What neuroscience says about why print magazine ads work.Reading on paper is slower and deeper; paper readers remember more.
Source: “What Can Neuroscience Tell Us About Why Print Magazine Advertising Works?” A White Paper from MPA–The Association of Magazine Media, Scott McDonald, Ph.D.
Nomos Research, October 2015
higher comprehensionand recall
stimulates emotionsand desires
slower readingspeeds
paper-basedreading
preferred by majority(even millennials)
more focused attention, less distraction
drives sensory involvementwhich contributes to its impact on readers

INFLUENCE/IMPACT025
Americans of all ages read magazines— especially younger adults
90% of adults 93% of those under 35
95% of those under 25
Read magazine media in the last six months (print and digital editions)(includes approx. 3% digital editions)
Base: U.S. adults 18+. Source: GfK MRI, Fall 2015
INFLUENCE/IMPACT026
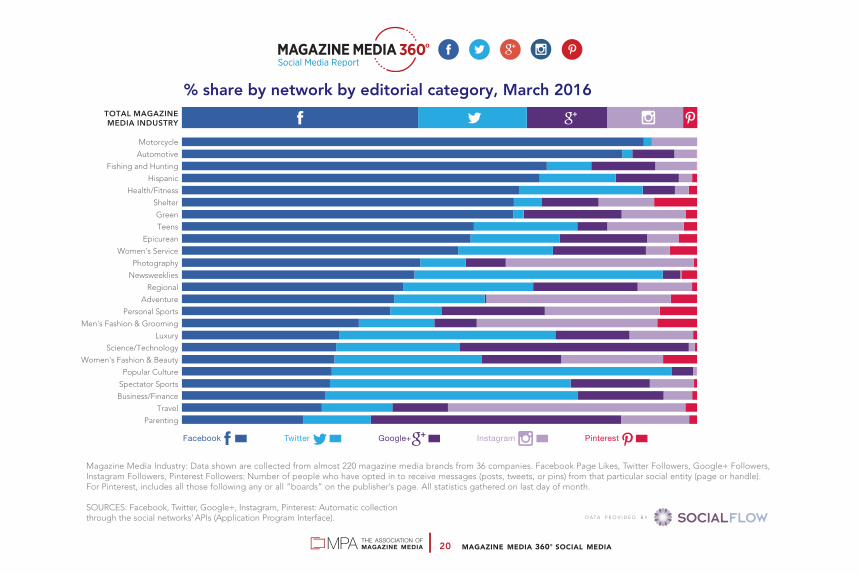
Adults 18+
Adults 18-34
Adults 18-49
Men 18-49
Men 18-49 HHI $75K+
Men 18-49 HHI $100K+
Women 18-49
Women 18-49 HHI $75K+
Women 18-49 HHI $100K+
Teens 12-17
Note: Total GRPs equal the ratings of the top 25 vehicles in each medium added together.Source: Carat Insights; Nielsen, September 2014-May 2015 (regularly scheduled primetime programs). Nielsen defines primetime as Monday to Saturday 8pm – 11pm and Sunday 7pm – 11pm; TV ratings based on live +SD data; GfK MRI, Fall 2015 Doublebase, GfK MRI Twelveplus, 2015
176
127
173
67
164
84
171
89
172
101
175
104
221
86
238
97
242
98
124
41
print magazinesprimetime TV
The top 25 #print magazines reach moreadults and teens than the top 25 primetime TV shows.Source: Carat Insights, 2015
Gross rating points (GRPs) of the top 25 print magazinesand primetime TV programs (index)
INFLUENCE/IMPACT027
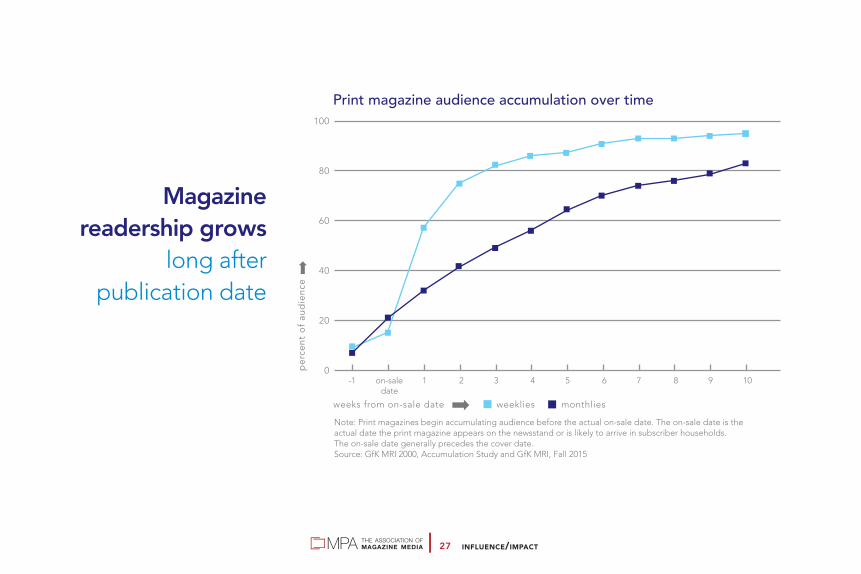
Magazinereadership grows
long afterpublication date
weeks from on-sale date weeklies monthlies
Print magazine audience accumulation over time
0
20
40
60
80
100
-1 on-sale 1 2 3 4 5 6 7 8 9 10 date
Note: Print magazines begin accumulating audience before the actual on-sale date. The on-sale date is the actual date the print magazine appears on the newsstand or is likely to arrive in subscriber households. The on-sale date generally precedes the cover date.Source: GfK MRI 2000, Accumulation Study and GfK MRI, Fall 2015
per
cent
of
aud
ienc
e

INFLUENCE/IMPACT028
Total number of adults 18+ who read magazines 2012–2015Note: Measured magazine titles excluding Sunday magazines.Source: GfK MRI, Fall 2012–2015
210.7
214.1
215.7216.5
2012 2013 2014 2015
Net audience for #print and #digital magazines continues to grow.Source: GfK MRI, Fall 2012–2015
in m
illio
ns/ 200 million
INFLUENCE/IMPACT029
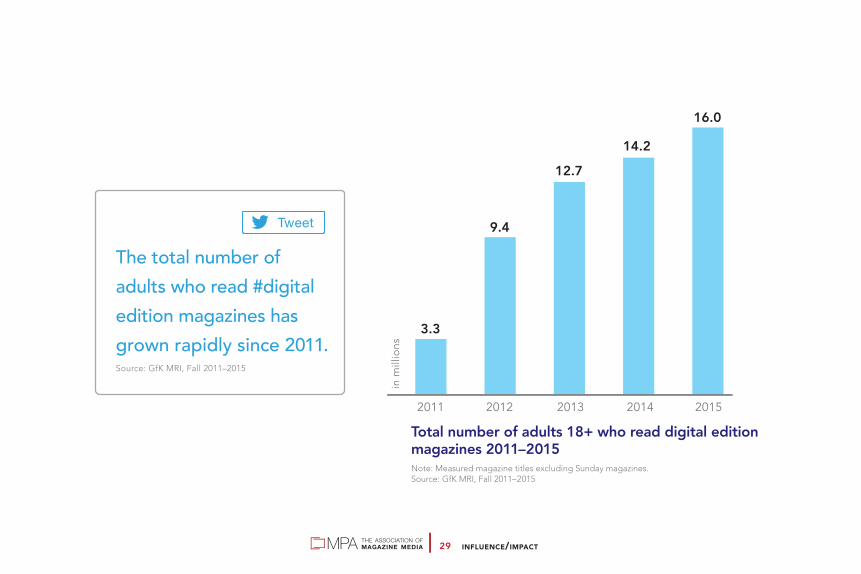
Total number of adults 18+ who read digital editionmagazines 2011–2015Note: Measured magazine titles excluding Sunday magazines.Source: GfK MRI, Fall 2011–2015
3.3
9.4
12.714.2
2011 2012 2013 2014 2015in
mill
ions
16.0
The total number ofadults who read #digital edition magazines hasgrown rapidly since 2011.Source: GfK MRI, Fall 2011–2015

INFLUENCE/IMPACT030
Digital editionmagazine readers
are young,upscale,
educated andprofessional
Digital edition magazine reader profile percent index
men 47 % 98women 53 102age18 – 24 19 % 152
25 – 34 28 158
35 – 44 21 124
45 – 54 17 97
55+ 15 42
annual household incomeless than $75,000 43 % 73
$75,000 – $149,000 38 131
$150,000+ 19 156
education levelhigh school graduate or less 22 % 54
some college 33 114
college graduate+ 45 153
occupationprofessional 22 % 160
managerial 15 155
Percent of total digital magazine readers indexed against U.S. adults 18+.Source: GfK MRI, Fall 2015
INFLUENCE/IMPACT031
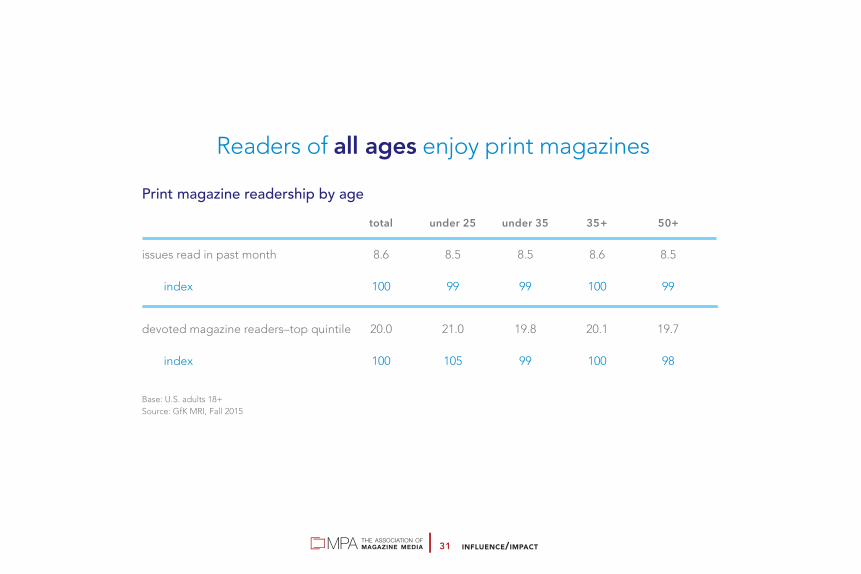
Print magazine readership by age total under 25 under 35 35+ 50+
issues read in past month 8.6 8.5 8.5 8.6 8.5
index 100 99 99 100 99
devoted magazine readers–top quintile 20.0 21.0 19.8 20.1 19.7
index 100 105 99 100 98
Base: U.S. adults 18+Source: GfK MRI, Fall 2015
Readers of all ages enjoy print magazines

INFLUENCE/IMPACT032
Median age by media usage*Includes internet magazine activity.Note: Magazines and newspaper numbers represent print only.Source: GfK MRI, Fall 2015
Median ageof U.S. adult
population: 46.8
42.4
inter
net*
45.147.1 48.5
52.1
radi
o
mag
azine
s TV
news
pape
rs
The median age of #magazine readers (47.1) reflects the median ageof the U.S. population.Source: GfK MRI, Fall 2015
INFLUENCE/IMPACT033
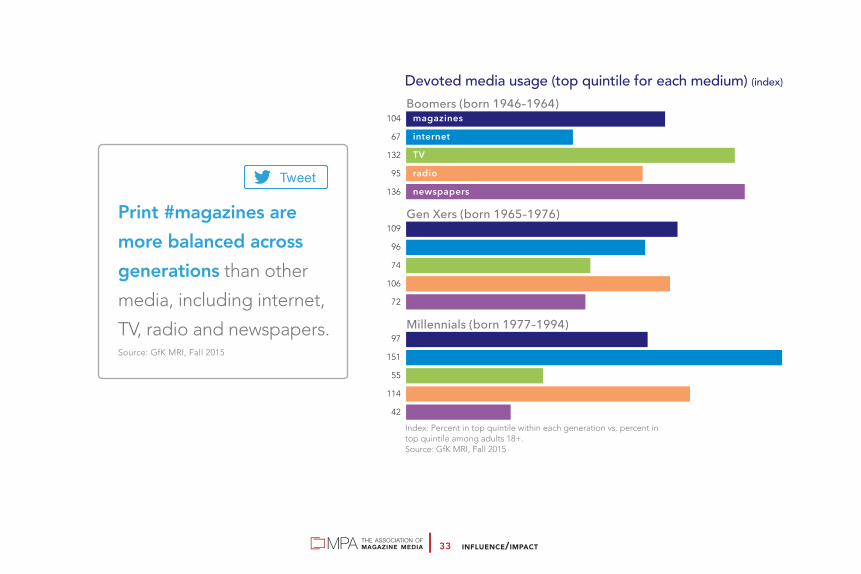
104
67
132
95
136
109
96
74
106
72
97
151
55
114
42
Devoted media usage (top quintile for each medium) (index)
Index: Percent in top quintile within each generation vs. percent in top quintile among adults 18+.Source: GfK MRI, Fall 2015
Boomers (born 1946–1964)
Gen Xers (born 1965–1976)
Millennials (born 1977–1994)
magazinesinternetTVradionewspapers
Print #magazines are more balanced across generations than other
media, including internet,
TV, radio and newspapers.Source: GfK MRI, Fall 2015

INFLUENCE/IMPACT034
Magazine media readership is diverse
African-Americanadults
Asian-Americanadults
Hispanic-Americanadults
Read magazine media in the last six months (print and digital editions)
LGBTadults
African-American adults readan average of 11.9 print
magazine issues per month,compared to 8.6 issues per
month for all U.S. adults.
Source: GfK MRI, Fall 2015
Asian-American adults readan average of 8.7 print
magazine issues per month,close to the U.S. average.
Hispanic-American adults readan average of 9.2 print magazine issues per month, slightly higher
than the average number of issues for all U.S. adults.
Lesbian, Gay, Bisexual and Transgender (LGBT) adults
read an average of 10.5 print magazine issues per month —
higher than the average for U.S. adults.
91% 88% 84% 94%

INFLUENCE/IMPACT035
Household income $150K+ (index)*Includes internet magazine activity. Index: Top quintile of users of each medium vs. adults 18+. Source: GfK MRI, Fall 2015
129122 121
80
42
print newspapers internet* radio TVmagazines
Households with incomeof $150K+ are drawnto #magazines.Source: GfK MRI, Fall 2015

INFLUENCE/IMPACT036
Average return on advertising spend — all studies Note: Nielsen Catalina Solutions comparison of average increase in dollar sales per dollar ofadvertising spend by media in study across 1,400 CPG campaigns.Source: Nielsen Catalina Solutions, Multi-Media Sales Effect Studies from 2004 – Q4 2015
$2.63
magazines display cross media linear TV mobile digital video
Magazines show the highest return onadvertising spend—the ultimate KPI.Source: Nielsen Catalina Solutions, 2015
$2.55 $2.45
$1.53
$3.94
$2.62

INFLUENCE/IMPACT037
$100
$150
10/13 11/13 12/13 1/14 2/14 3/14 4/14 5/14 6/14 7/14 8/14 9/14 10/14
DEC+40%
MAY/JUNE+27%
OCT+37%exposed
unexposed
Source: Meredith, Nielsen Buyer Insights; analysis period 10/1/13 – 10/31/14; pre-period 7/1/13 – 9/30/13
3X 3X 4X 1X 1X 1X 4X 2X 3X 2X 2X 1Xnumber of insertions
Average spend per buyer
$165 $166
$183
$161
$172$169
$192$194
$191
$163
$188
$171
$196
$147$153
$131 $133$136
$143
$156$153 $150
$156 $159
$146$143
CASE STUDY: Magazines boost sales throughout a campaignA home retailer placing 27 insertions in four Meredith Corporation magazines experienced
a lift in spending per buyer for every month of the campaign. Overall lift in sales vs. unexposed: +7%. Total incremental sales: $36.9 million.
INFLUENCE/IMPACT038
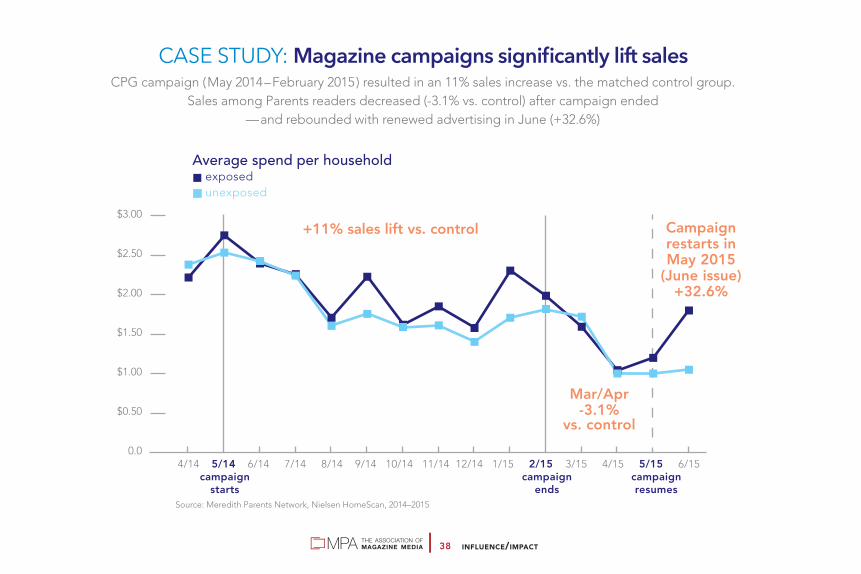
+11% sales lift vs. control
exposedunexposed
Source: Meredith Parents Network, Nielsen HomeScan, 2014–2015
Average spend per household
CASE STUDY: Magazine campaigns significantly lift salesCPG campaign (May 2014–February 2015) resulted in an 11% sales increase vs. the matched control group.
Sales among Parents readers decreased (-3.1% vs. control) after campaign ended—and rebounded with renewed advertising in June (+32.6%)
Campaignrestarts inMay 2015
(June issue)+32.6%
Mar/Apr-3.1%
vs. control
4/14 5/14 6/14 7/14 8/14 9/14 10/14 11/14 12/14 1/15 2/15 3/15 4/15 5/15 6/15 campaign campaign campaign starts ends resumes
0.0
$0.50
$1.00
$1.50
$2.00
$2.50
$3.00

INFLUENCE/IMPACT039
Average brand lift due to exposureData is Delta. Delta=Exposed-Control.Numbers of respondents: Print n=88,0146; online n=253,421; TV n=198,479*Print media includes newspapers, which were represented in less than 10% of the analyzed campaigns and generally represented a small portion of the print media buy.Print media also includes digital editions of magazines. Source: Millward Brown Digital, 2007–2015
11%
brand awareness brand favorability brand purchase intent
4%
8%
11%
4%
8%
5%
4%
8%
pri
nt m
edia
*
onl
ine
TV
Advertising in printyields greater
increases in brandawareness, brandfavorability andpurchase intent
than online orTV advertising
INFLUENCE/IMPACT040
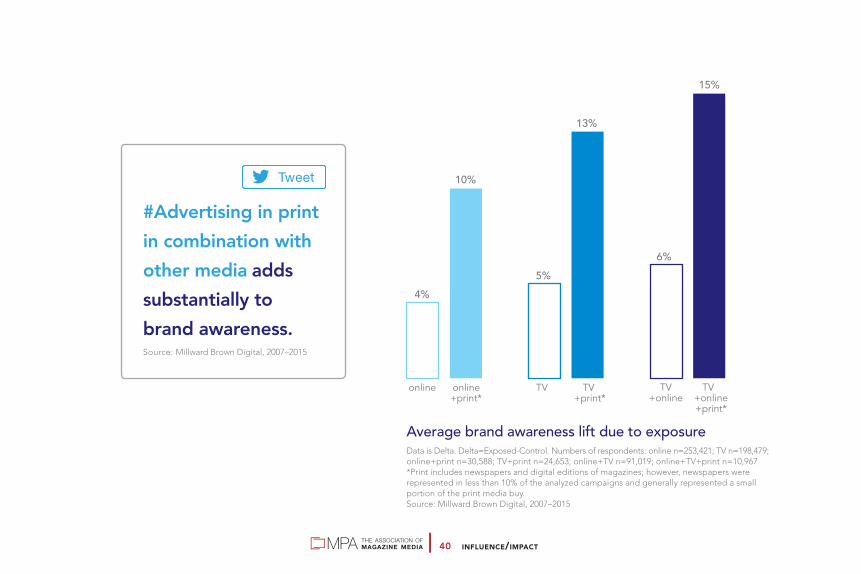
Average brand awareness lift due to exposureData is Delta. Delta=Exposed-Control. Numbers of respondents: online n=253,421; TV n=198,479; online+print n=30,588; TV+print n=24,653; online+TV n=91,019; online+TV+print n=10,967*Print includes newspapers and digital editions of magazines; however, newspapers were represented in less than 10% of the analyzed campaigns and generally represented a small portion of the print media buy. Source: Millward Brown Digital, 2007–2015
4%
online online +print*
TV TV +print*
TV TV+online +online +print*
5%6%
10%
13%
15%
#Advertising in printin combination withother media addssubstantially tobrand awareness.Source: Millward Brown Digital, 2007–2015

INFLUENCE/IMPACT041
Average brand favorability and purchase intent lifts due to exposureData is Delta. Delta=Exposed-Control. Number of respondents: online n=253,421; TV n=198,479;
online+print n=30,588; TV+print n=24,653; online+TV n=91,019; online+TV+print n=10,967*Print includes newspapers and digital editions of magazines; however, newspapers were represented in
less than 10% of the analyzed campaigns and generally represented a small portion of the print media buy.Source: Millward Brown Digital, 2007–2015
4%
online online +print*
Advertisingin print addssubstantially
to thepersuasion
power ofother media
TV TV +print*
TV TV+online +online +print*
8%
10%
15%14%
4%
11%
7%8%
17%
8%
17%
online online +print*
TV TV +print*
TV TV+online +online +print*
Brand Favorability Purchase Intent

INFLUENCE/IMPACT042
Percent lift with increased exposureData is Delta. Delta=Exposed-Control. Number of respondents: 1-2 exposures n=60,259; 3-4 exposures n=12,638; 5+ exposures n=14,789*Print includes newspapers and digital editions of magazines; however, newspapers were represented inless than 10% of the analyzed campaigns and generally represented a small portion of the print media buy.Source: Millward Brown Digital, 2007–2015
Increasedexposure to
print media adsboosts
key advertisingmetrics
brand awarenessprint ad awareness
brand favo
rability
brand purchase
intent
7.3
10.8
12.2
8.3
9.510
11.7
13.8
14.2
18.4
17.6
16.9
1–2exposures
3–4exposures
5+exposures
INFLUENCE/IMPACT043
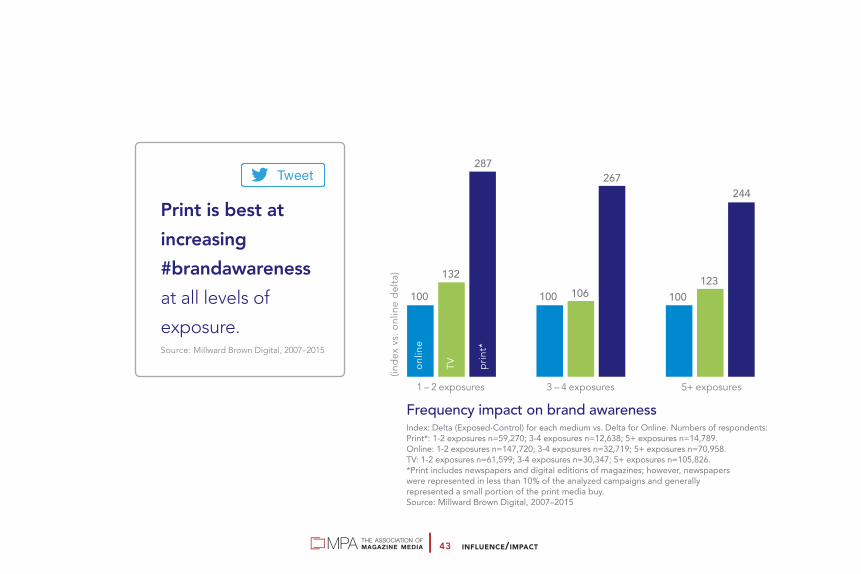
Frequency impact on brand awarenessIndex: Delta (Exposed-Control) for each medium vs. Delta for Online. Numbers of respondents: Print*: 1-2 exposures n=59,270; 3-4 exposures n=12,638; 5+ exposures n=14,789. Online: 1-2 exposures n=147,720; 3-4 exposures n=32,719; 5+ exposures n=70,958. TV: 1-2 exposures n=61,599; 3-4 exposures n=30,347; 5+ exposures n=105,826.*Print includes newspapers and digital editions of magazines; however, newspaperswere represented in less than 10% of the analyzed campaigns and generally represented a small portion of the print media buy. Source: Millward Brown Digital, 2007–2015
100
1 – 2 exposures 3 – 4 exposures 5+ exposures
132
287
100 100106
267
123
244
onl
ine
TV pri
nt*
(ind
ex v
s. o
nlin
e d
elta
)
Print is best at increasing #brandawarenessat all levels of
exposure.Source: Millward Brown Digital, 2007–2015
INFLUENCE/IMPACT044
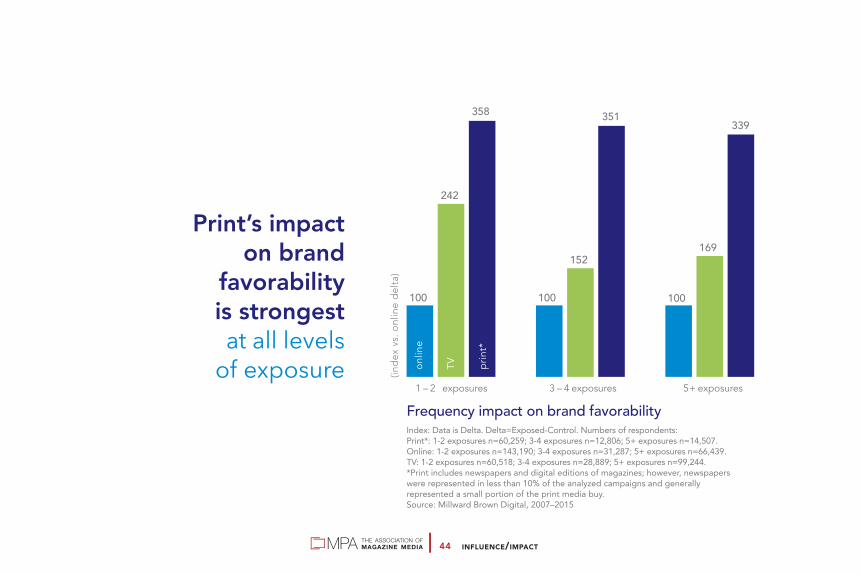
Frequency impact on brand favorabilityIndex: Data is Delta. Delta=Exposed-Control. Numbers of respondents: Print*: 1-2 exposures n=60,259; 3-4 exposures n=12,806; 5+ exposures n=14,507. Online: 1-2 exposures n=143,190; 3-4 exposures n=31,287; 5+ exposures n=66,439. TV: 1-2 exposures n=60,518; 3-4 exposures n=28,889; 5+ exposures n=99,244.*Print includes newspapers and digital editions of magazines; however, newspaperswere represented in less than 10% of the analyzed campaigns and generally represented a small portion of the print media buy. Source: Millward Brown Digital, 2007–2015
100
1 – 2 exposures 3 – 4 exposures 5+ exposures
Print’s impacton brand
favorabilityis strongestat all levels
of exposure
242
358
100 100
152
351
169
339
onl
ine
TV pri
nt*
(ind
ex v
s. o
nlin
e d
elta
)

INFLUENCE/IMPACT045
Frequency impact on purchase intentIndex: Data is Delta. Delta=Exposed-Control. Numbers of respondents: Print*: 1-2 exposures n=54,996; 3-4 exposures n=12,101; 5+ exposures n=13,692. Online: 1-2 exposures n=135,385; 3-4 exposures n=29,591; 5+ exposures n=61,923. TV: 1-2 exposures n=53,381; 3-4 exposures n=27,466; 5+ exposures n=94,129.*Print includes newspapers and digital editions of magazines; however, newspaperswere represented in less than 10% of the analyzed campaigns and generally represented a small portion of the print media buy. Source: Millward Brown Digital, 2007–2015
100
1 – 2 exposures 3 – 4 exposures 5+ exposures
225
322
100 100
166
359
196
390
onl
ine
TV pri
nt*
(ind
ex v
s. o
nlin
e d
elta
)#Print’s impact on purchase intent is especially strong athigher levels of exposure.Source: Millward Brown Digital, 2007–2015

INFLUENCE/IMPACT046
Advertising effectiveness by position noted action taken
first quarter of book 56% 60%
second quarter of book 51 61
third quarter of book 50 62
fourth quarter of book 51 62
Note: Includes all ads, size/color and cover positions.Source: GfK MRI, July 2014 – June 2015
Action taken includes:• have a more favorable opinion about the advertiser
• consider purchasing the advertised product or service
• gather more information about the advertised product or service
• recommend the product or service
• visit the advertiser’s website• purchase the product or service
• clip or save the ad• visit or plan to visit a dealership Source: GfK MRI Starch
Print #magazines inspire readers to take action, such as
clipping the ad, recommending the product or buying it. Source: GfK MRI, Spring 2015

INFLUENCE/IMPACT047
Impact of print magazine advertising noted action taken
all ads 53% 61%
ad sizemultiple pages (excluding spreads) 70 61
gatefold ads 64 61
spread 55 59
full page 52 60
half page 44 65
third page 43 65
less than half page 43 65
colorfour color 53 61
black and white 41 58
premium positioninside front cover 76 59
inside back cover 61 60
back cover 64 60
adjacent to table of contents 59 60
Source: GfK MRI Starch Advertising Research, July 2014 – June 2015
61% of readers areinspired to take actionafter seeing a print #magazine ad.Source: GfK MRI, Spring 2015
Print magazineadvertising works
regardless of sizeor placement
INFLUENCE/IMPACT048
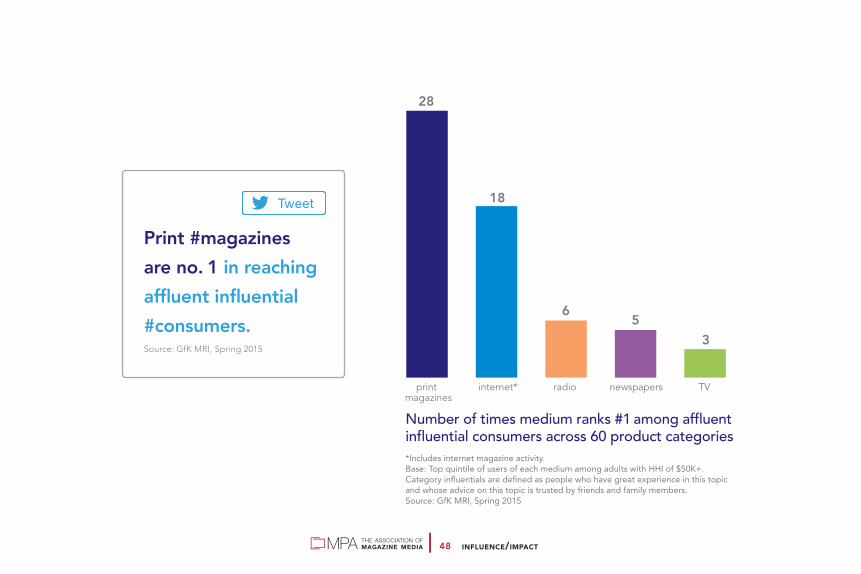
Number of times medium ranks #1 among affluentinfluential consumers across 60 product categories*Includes internet magazine activity. Base: Top quintile of users of each medium among adults with HHI of $50K+. Category influentials are defined as people who have great experience in this topic and whose advice on this topic is trusted by friends and family members. Source: GfK MRI, Spring 2015
28
18
6 53
print internet* radio newspapers TVmagazines
Print #magazines are no. 1 in reaching affluent influential#consumers.Source: GfK MRI, Spring 2015

INFLUENCE/IMPACT049
Affluentcategory influentials
are devoted printmagazine readers
140
117
81
117
108
130
123
78
123
69
126
121
81
113
74
121
93
98
106
87
sporting equipment
beauty
fashion (clothes, shoes or other fashion)
household furnishings
Category influentials among devoted media users (index)
*Includes internet magazine activity. Index: Percentage of category influentials within top quintile of users of each medium withHHI of $50K+ vs. percentage of all category influentials among adults 18+ with HHI of $50K+. Category influentials are defined as people who have great experience in this topic and whose advice on this topic is trusted by friends and family members. Source: GfK MRI, Spring 2015
magazinesinternet*TVradionewspapers

INFLUENCE/IMPACT050
116115
93112109
116104
96117104
114114
81106107
114102102106109
107106
93105
97
finance
automotive
vacation travel
healthcare
food
*Includes internet magazine activity. Index: Percentage of recommenders within top quintile of users of each medium vs.percentage of recommenders among adults 18+. Recommenders are defined as people who say they have recommend products or services to others in the past 12 months within a category. Source: GfK MRI, Spring 2015
Trusted recommenders among devoted media users (index)
print magazinesinternet*TVradionewspapers
Across product categories,
trusted recommendersare devoted printmagazine readers.Source: GfK MRI, Spring 2015

INFLUENCE/IMPACT051
*Includes internet magazine activity. Note: Print magazine quintiles based on readership of 120 titles.Index: Top quintile of users of each medium among new vehicle buyersvs. all of new vehicle buyers. Source: JD Power Automotive Media and Marketing Report, Summer 2015
Print magazinesdrive automotive
growth—especiallyat the top end of
the market
134
102
83
78
128
93
56
77
117
99
63
87
103
97
74
94
103
99
78
97
bought premium brand vehicle
HHI $200,000+
HHI $150,000+
HHI $100,000+
HI $80,000+
Among new vehicle buyers, devoted print magazine readersare more affluent and more likely to buy premium makes (index)
magazinesinternet*TVradio
Devoted print #magazine
readers accounted
for $94 billion in annual
#automotive sales.Source: JD Power, Summer 2015

INFLUENCE/IMPACT052
*Includes internet magazine activity. Index: Top quintile of users of each medium vs. adults 18+. Source: GfK MRI, Spring 2015
Print magazinesdeliver consumers
with thehighest auto
purchase intent
122
110
96
110
94
Very/somewhat likely to buy a new vehicle in the next 12 months
Very/somewhat likely to lease a vehicle in the next 12 months
magazines
internet*
TV
radio
newspapers
129
114
92
110
87
INFLUENCE/IMPACT053
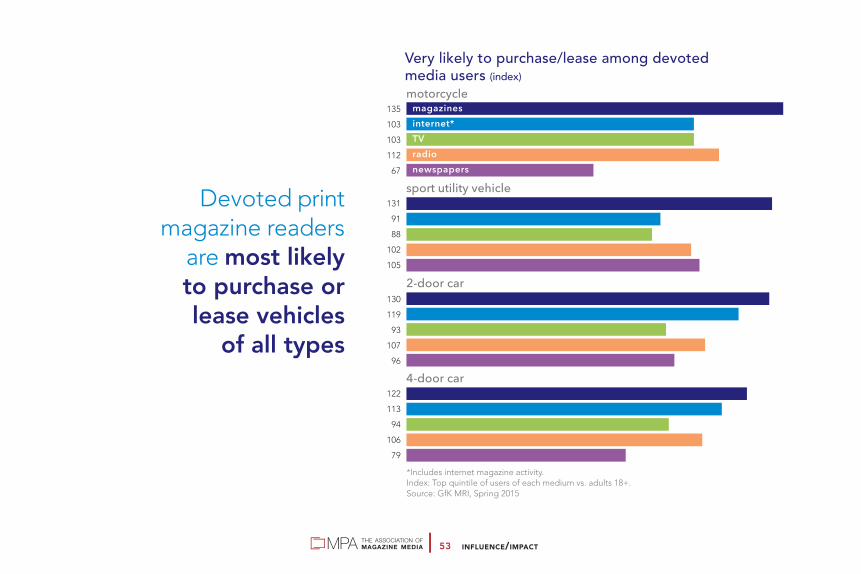
*Includes internet magazine activity. Index: Top quintile of users of each medium vs. adults 18+. Source: GfK MRI, Spring 2015
Devoted printmagazine readers
are most likelyto purchase orlease vehicles
of all types
135
103
103
112
67
131
91
88
102
105
130
119
93
107
96
122
113
94
106
79
motorcycle
sport utility vehicle
2-door car
4-door car
Very likely to purchase/lease among devotedmedia users (index)
magazinesinternet*TVradionewspapers
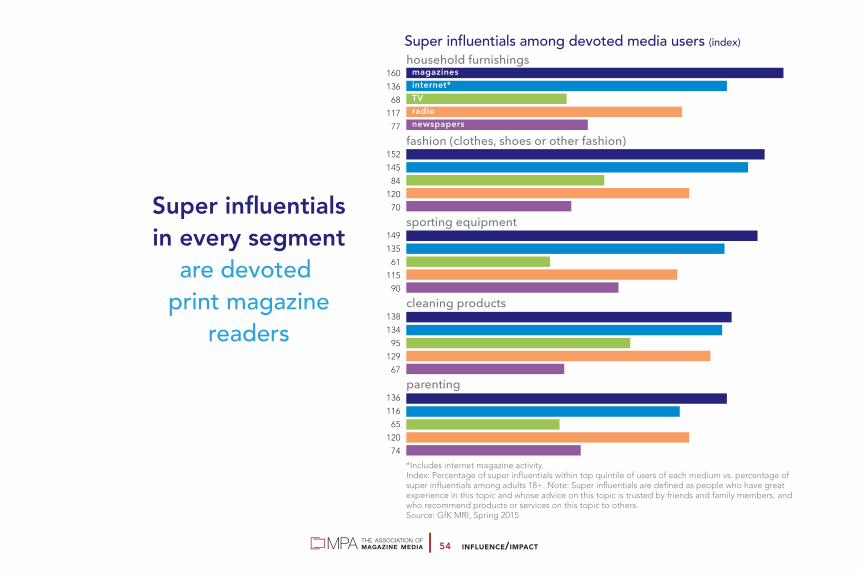
INFLUENCE/IMPACT054
Super influentialsin every segment
are devoted print magazine
readers
160
136
68
117
77
152
145
84
120
70
149
135
61
115
90
138
134
95
129
67
136
116
65
120
74
Super influentials among devoted media users (index)
*Includes internet magazine activity. Index: Percentage of super influentials within top quintile of users of each medium vs. percentage of super influentials among adults 18+. Note: Super influentials are defined as people who have great experience in this topic and whose advice on this topic is trusted by friends and family members, and who recommend products or services on this topic to others. Source: GfK MRI, Spring 2015
household furnishings
fashion (clothes, shoes or other fashion)
sporting equipment
cleaning products
parenting
magazinesinternet*TVradionewspapers

INFLUENCE/IMPACT055
154
131
63
111
68
148
131
87
105
81
137
127
67
99
74
133
121
55
93
68
dieting
prescription drugs
healthcare
healthy lifestyle
magazinesinternet*TVradionewspapers
*Includes internet magazine activity. Index: Percentage of super influentials among top quintile of users of each medium vs.percentage of super influentials among adults 18+. Super influentials are defined as peoplewho have great experience in this topic, whose advice on this topic is trusted by friendsand family members and who recommend products or services on this topic to others. Source: GfK MRI, Spring 2015
Super influential consumers for healthcarecategories among devoted media users (index)
Print magazines excel in
reaching super influentialconsumers in #healthcareand #healthy living.Source: GfK MRI, Spring 2015
INFLUENCE/IMPACT056
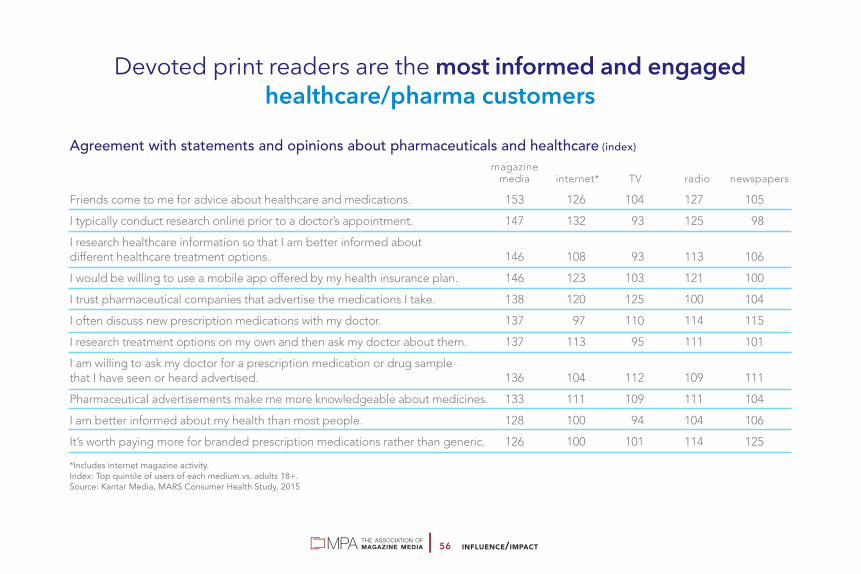
Devoted print readers are the most informed and engagedhealthcare/pharma customers
Agreement with statements and opinions about pharmaceuticals and healthcare (index) magazine media internet* TV radio newspapers
Friends come to me for advice about healthcare and medications. 153 126 104 127 105
I typically conduct research online prior to a doctor’s appointment. 147 132 93 125 98
I research healthcare information so that I am better informed aboutdifferent healthcare treatment options. 146 108 93 113 106
I would be willing to use a mobile app offered by my health insurance plan. 146 123 103 121 100
I trust pharmaceutical companies that advertise the medications I take. 138 120 125 100 104
I often discuss new prescription medications with my doctor. 137 97 110 114 115
I research treatment options on my own and then ask my doctor about them. 137 113 95 111 101
I am willing to ask my doctor for a prescription medication or drug samplethat I have seen or heard advertised. 136 104 112 109 111
Pharmaceutical advertisements make me more knowledgeable about medicines. 133 111 109 111 104
I am better informed about my health than most people. 128 100 94 104 106
It’s worth paying more for branded prescription medications rather than generic. 126 100 101 114 125
*Includes internet magazine activity.Index: Top quintile of users of each medium vs. adults 18+.Source: Kantar Media, MARS Consumer Health Study, 2015

INFLUENCE/IMPACT057
Magazine media advertising is number 1in driving consumer healthcare actions
Actions taken in the last 12 months as a result of healthcare advertising (index) magazine media internet* TV radio newspapers
visited a pharmaceutical company website 276 169 112 168 146
discussed an ad with your doctor 260 99 143 95 149
asked your doctor for a product sample of a prescription drug 260 109 131 90 125
discussed an ad with a friend or relative 253 163 148 128 151
asked your doctor to prescribe a specific drug 234 128 155 119 113
consulted a pharmacist 231 117 148 107 160
purchased a nonprescription product 214 109 111 118 135
used a coupon 210 119 124 144 156
took medication 190 127 109 137 143
made an appointment to see a doctor 170 108 138 118 144
*Includes internet magazine activity.Index: Top quintile of users of each medium vs. adults 18+.Source: Kantar Media, MARS Consumer Health Study, 2015

INFLUENCE/IMPACT058
IN THE LAST 12 MONTHS
Number of times purchased prescription products (index) magazine media internet* TV radio newspapers
6+ times 139 110 116 117 137
3+ times 129 110 113 107 129
1+ times 120 109 109 107 119
none 68 89 92 127 87
Where purchased medication (index)
drugstore chain’s website 171 112 100 104 113
club store (e.g. Costco, Sam’s Club, BJ’s) 130 121 118 103 110
drug store chain (e.g. Rite Aid, CVS) 130 125 117 129 128
*Includes internet magazine activity.*Index: Those who saw/heard healthcare advertising in each medium in the last 12 months vs. adults 18+.Source: Kantar Media, MARS Consumer Health Study, 2015
Those who view
#healthcare ads in
#magmedia are mostlikely to purchase prescription products.Source: Kantar Media, MARSConsumer Health Study, 2015
INFLUENCE/IMPACT059
*Includes internet magazine activity. Base: Those who had been to any doctor in the last 12 months.Index: Top quintile of users of each medium vs. adults 18+. Source: Kantar Media, MARS Consumer Health Study, 2015
Magazine media readers take action to
maintaintheir health
160
143
88
118
127
137
133
107
108
111
134
106
101
116
108
127
97
107
92
105
conducted an online search about a drug or treatment options
conducted an online search about a condition
made an effort to eat healthier or exercise more
went to see a specialist
Actions taken after seeing medical professionalsin the last 12 months (index)
magazinesinternet*TVradionewspapers
INFLUENCE/IMPACT060
*Includes internet magazine activity. Index: Top quintile of users of each medium vs. adults 18+. Source: Kantar Media, MARS Consumer Health Study, 2015
127
96
91
105
109
121
98
97
110
108
119
92
91
103
112
Exercise is important to my diet and nutrition plan
I believe that vitamins and nutritional supplements make adifference in long-term health
I always try to eat healthy foods and maintain a healthy diet
Agreement with statements and opinions aboutpharmaceuticals and healthcare (index)
magazinesinternet*TVradionewspapers
#Magmedia readers:
the most health conscious consumers.Source: Kantar Media, MARSConsumer Health Study, 2015

INFLUENCE/IMPACT061
174141
95119
81
162161110113
44
138131
58110
90
134124
78108
79
131124
48115
91
new food
soft drinks
coffee
cooking
wine
*Includes internet magazine activity. Index: Percentage of super influentials among top quintile of users of each medium vs.percentage of super influentials among adults 18+. Super influentials are defined as people who have great experience in this topic and whose advice on this topic is trusted by friends and family members and who recommend products or services on this topic often. Source: GfK MRI, Spring 2015
Food influencersconsume print
magazines
Super influential consumers for food purchasesamong devoted media users (index)
magazinesinternet*TVradionewspapers

INFLUENCE/IMPACT062
125
96
117
99
120
98
114
101
115
100
110
101
+Includes digital magazine reading. *Includes internet magazine activity. Index: Top quintile of users of each medium among adults 18+ with HHI $100K+vs. all adults 18+ with HHI $100K+. Source: Ipsos Affluent Survey USA, Spring 2016
Total value of household’s financial accounts/liquid assets (index)
magazines+
internet*
TV
radio
$750K+
$500K+
$250K+
Households with the biggest financial assetsprefer #magmedia over
internet, TV and radio.Source: Ipsos Affluent Survey USA, Spring 2016

INFLUENCE/IMPACT063
157
116
131
117
140
120
122
124
136
99
120
112
128
108
114
112
123
102
113
102
118
102
114
107
plan to open or move a non-retirement account
plan to open or move a retirement account
used a wealth advisor
plan to invest in stocks, mutual funds, etc.
used a full-service broker
used a financial planner
+Includes digital magazine reading. *Includes internet magazine activity. Index: Top quintile of users of each medium among adults 18+ with HHI $100K+vs. all adults 18+ with HHI $100K+. Source: Ipsos Affluent Survey USA, Spring 2016
Any household member — in the past 12 months/next 12 months (index)
magazines+internet*TVradio
#Magmedia readers plan to invest in stocksand mutual funds more
than affluent consumers
of other #media.Source: Ipsos Affluent Survey USA, Spring 2016
Magazine media:where to find
active investors

INFLUENCE/IMPACT064
Luxury goods category influencers among devotedmedia users (index) print news- magazines internet* TV radio papers
beauty 130 123 78 123 69
fashion+ 126 121 81 113 74
interior decorating 117 97 108 111 78
*Includes internet magazine activity.+Clothes, shoes or other fashionIndex: Percentage of category influentials within top quintile of users of each mediumamong adults 18+ with HHI $50K+ vs. percentage of category influentials among all adults18+ with HHI $50K+. Category influentials are defined as people who have great experiencein this topic, whose advice on this topic is trusted by friends and family members. Source: GfK MRI, Spring 2015
Luxury goods categoryinfluencers are devoted
print #magazine readers.Source: GfK MRI, Spring 2015

INFLUENCE/IMPACT065
IN THE LAST 12 MONTHS
Luxury goods spending among affluent devoted media users (index) magazines+ internet* TV radio
$1,000+ watches 176 163 143 112
$1,000+ skin care/cosmetics/fragrance 142 132 127 113
$1,000+ fine jewelry 153 139 132 114
$3,000+ fine jewelry 173 157 144 123
$1,000+ fine watches, fine jewelry 154 138 131 113
$3,000+ fine watches, fine jewelry 167 151 141 117
$5,000+ women’s apparel and accessories 166 146 128 116
$5,000+ men’s apparel and accessories 180 156 139 123
$10,000+ apparel and accessories 179 153 134 118
+Includes digital magazine reading. *Includes internet magazine activity.Index: Top quintile of users of each medium among adults 18+ with HHI $100K+ vs. all adults 18+ with HHI 100K+.Source: Ipsos Affluent Survey USA, Spring 2016
Luxury goods buyersare devoted
magazinemedia readers
INFLUENCE/IMPACT066
magazinesinternet*TVradionewspapers
160
136
68
117
77
154
136
73
115
78
142
120
56
122
98
household furnishings
interior decorating
home remodeling
Super influential consumers for home improvementpurchases among devoted media users (index)
*Includes internet magazine activity. Index: Percentage of super influentials among top quintile of users of each medium vs.percentage of super influentials among adults 18+. Super influentials are defined as peoplewho have great experience in this topic, whose advice on this topic is trusted by friendsand family members and who recommend products or services on this topic to others. Source: GfK MRI, Spring 2015
Print #magazine readerslead the way for superinfluencers in home
furnishings and #remodeling.Source: GfK MRI, Spring 2015

INFLUENCE/IMPACT067
Home improvement spending among affluent devoted media users (index) magazines+ internet* TV radio
$1,000+ home decorating services 170 164 137 108
$3,000+ furniture 144 134 121 107
$5,000+ furniture 153 140 127 109
$1,000+ household appliances 139 136 124 111
$1,000+ kitchen appliances 136 131 120 105
$3,000+ kitchen appliances 163 144 130 115
$5,000+ home remodeling services 126 114 117 105
$10,000+ home remodeling services 121 104 113 102
+Includes digital magazine reading. *Includes internet magazine activity. Index: Top quintile of users of each medium among adults 18+ with HHI $100K+ vs. all adults 18+ with HHI $100K+.Source: Ipsos Affluent Survey, USA, Spring 2016.
Affluent magazinereaders are
top spenderson home
remodeling anddecorating

INFLUENCE/IMPACT068
Home improvement activity among affluent devoted media users (index)
IN THE PAST 12 MONTHS magazines+ internet* TV radio
used landscape architect 151 131 125 107
used interior designer/decorator 147 139 122 114
used landscape designer 139 114 116 107
used any home-related professional 128 115 113 109
IN THE NEXT 12 MONTHS
plan to remodel or renovate kitchen 128 117 122 113
plan to remodel or renovate bathroom 120 109 114 107
plan to remodel or renovate home 119 111 113 112
plan to remodel or renovate garden 119 98 114 115
+Includes digital magazine reading. *Includes internet magazine activity.Index: Top quintile of users of each medium among adults 18+ with HHI $100K+ vs. all adults 18+ with HHI $100K+ Source: Ipsos Affluent Survey, USA, Spring 2016
Affluent #magazine readers are more likelyto remodel or renovate
their #kitchen than users
of any other medium.Source: Ipsos Affluent Survey, USA, Spring 2016
Affluent magazine readers use home improvementprofessionals and undertake renovations

INFLUENCE/IMPACT069
Travel habits of affluent devoted media users (index) magazines+ internet* TV radio
own a boat 137 111 111 114
took five or more airline trips for domestic vacations in past year 133 123 109 115
took a cruise of 7+ days in past three years 127 114 114 100
traveled to Europe in the past three years 125 111 102 107
belong to car rental frequent traveler program 121 114 111 109
traveled to any island in Atlantic orCaribbean in the past three years 115 108 99 109
belong to a hotel frequent traveler program 111 103 106 104
belong to an airline frequent traveler program 107 102 102 103
*Includes digital magazine reading. *Includes internet magazine activityIndex: Top quintile of users of each medium among adults 18+ with HHI $100K+ vs. all adults 18+ with HHI 100K+.Source: Ipsos Affluent Survey USA, Spring 2016
Affluent magazinereaders are most
likely to travel
More than any other
devoted media users,
affluent #magmedia
readers are most likely
to own a boat.Source: Ipsos Affluent Survey USA, Spring 2016

INFLUENCE/IMPACT070
*Includes internet magazine activity. Index: Top quintile of users of each medium vs. adults 18+. +Defined as Hawaii, Florida, theme parks and other U.S. destinations. Source: GfK MRI, Spring 2015
magazinesinternet*TVradionewspapers
114
105
82
103
107
113
103
78
98
98
110
107
96
109
101
108
101
85
102
104
very likely next 12 months: take a cruise (2+ days)
very likely next 12 months: vacation abroad
agree completely/somewhat: people ask my advice about vacation travel
very likely next 12 months: vacation in the U.S.+
Travel charactistics of devoted media users (index)
Devoted #magmediausers are most likely totake a #vacation abroadwithin the next 12 months.Source: GfK MRI, Spring 2015

INFLUENCE/IMPACT071
*Includes digital magazine reading. +Includes internet magazine activity. Index: Top quintile of users of each medium among adults 18+ with HHI $100K+vs. all adults 18+ with HHI $100K+. Source: Ipsos Affluent Survey USA, Spring 2016
150
111
127
120
144
107
116
111
132
103
115
115
132
110
112
108
Amount spent on vacations in past 12 months (index)$10,000+ on vacation within the U.S.
$10,000+ on vacation outside the U.S.
$5,000+ on vacation within the U.S.
$5,000+ on vacation outside the U.S.
magazines*internet+
TVradio
More so than users of other
media, affluent #magmedia readers are most likely to spend $5K+ or $10K+ on vacations.Source: Ipsos Affluent Survey USA, Spring 2016

INFLUENCE/IMPACT072
Travel intentions among devoted users of media (index)Intended destinations very likely next 12 months
print news- magazines internet* TV radio papers
Hawaii 132 102 82 109 102
Europe 131 100 73 96 113
South America 130 104 83 95 85
Caribbean 126 112 87 97 94
Florida 115 101 89 94 107
Mexico 108 96 79 105 74
*Includes internet magazine activity.Index: Top quintile of users of each medium vs. adults 18+.Source: GfK MRI, Spring 2015
Print magazine readerstravel more than other #media users.Source: GfK MRI, Spring 2015
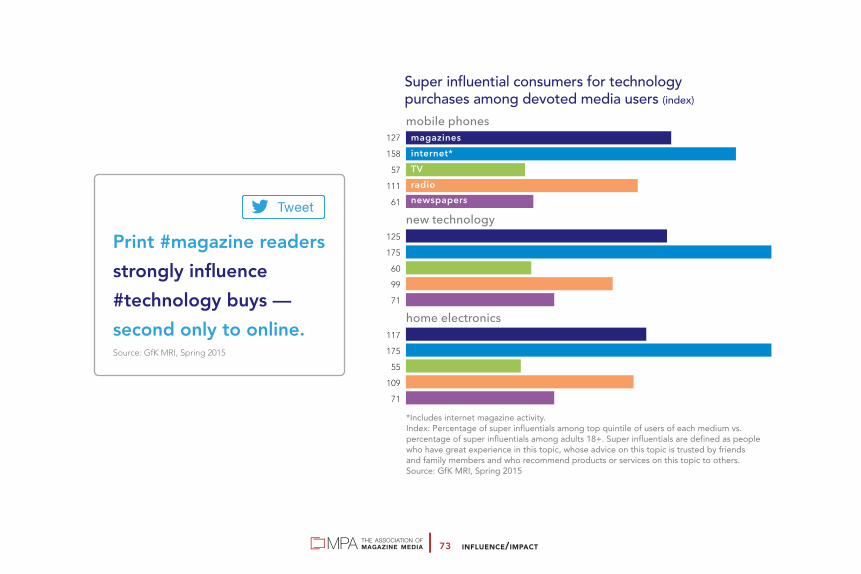
INFLUENCE/IMPACT073
127
158
57
111
61
125
175
60
99
71
117
175
55
109
71
mobile phones
new technology
home electronics
magazinesinternet*TVradionewspapers
*Includes internet magazine activity. Index: Percentage of super influentials among top quintile of users of each medium vs.percentage of super influentials among adults 18+. Super influentials are defined as peoplewho have great experience in this topic, whose advice on this topic is trusted by friendsand family members and who recommend products or services on this topic to others. Source: GfK MRI, Spring 2015
Super influential consumers for technologypurchases among devoted media users (index)
Print #magazine readersstrongly influence#technology buys — second only to online.Source: GfK MRI, Spring 2015

INFLUENCE/IMPACT074
Entertainment activities among devoted media users (index) print magazines internet* TV radio newspapers
very likely to buy a portable DVD player in the next 12 months 151 115 115 125 81
very/somewhat likely to buy satellite radio in next 12 months 144 112 111 131 93
bought wireless speakers in past 12 months 144 122 66 94 69
very likely to buy a home theater system in the next 12 months 136 118 124 112 75
attended movies twice a month or more 136 129 91 103 96
very likely to buy a giant flat screen TV in the next 12 months 135 113 109 117 88
bought a DVD or Blu-ray player in the last 12 months 122 114 89 115 84
bought a DVD in the past 30 days 121 117 79 109 88
*Includes internet magazine activity.Index: Top quintile of users of each medium vs. adults 18+.Source: GfK MRI, Spring, 2015
Print magazine readers are avid buyers of entertainment goods and services
AD ENVIRONMENT075
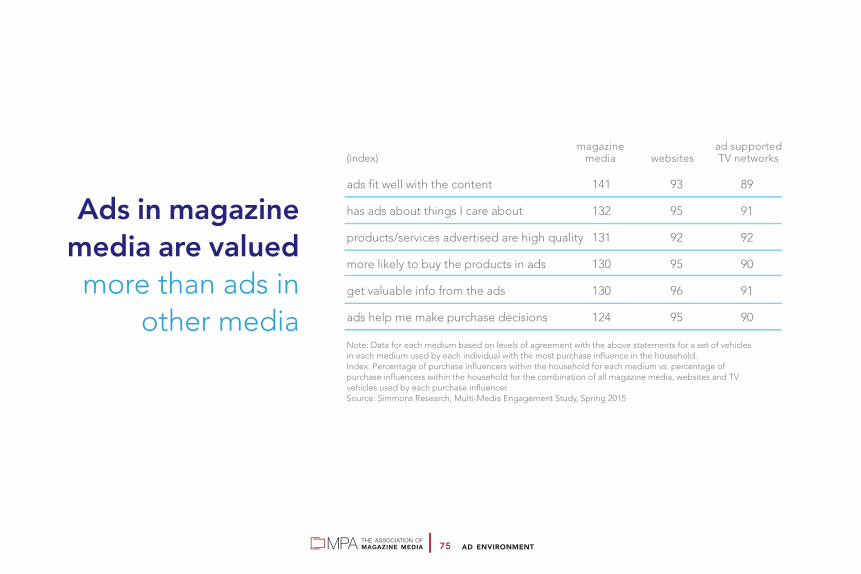
magazine ad supported(index) media websites TV networks
ads fit well with the content 141 93 89
has ads about things I care about 132 95 91
products/services advertised are high quality 131 92 92
more likely to buy the products in ads 130 95 90
get valuable info from the ads 130 96 91
ads help me make purchase decisions 124 95 90
Note: Data for each medium based on levels of agreement with the above statements for a set of vehicles in each medium used by each individual with the most purchase influence in the household.Index: Percentage of purchase influencers within the household for each medium vs. percentage of purchase influencers within the household for the combination of all magazine media, websites and TV vehicles used by each purchase influencer. Source: Simmons Research, Multi-Media Engagement Study, Spring 2015
Ads in magazinemedia are valued
more than ads inother media

AD ENVIRONMENT076
Print magazine readers believe in brands—and are heavily swayed by advertising
Definitely agree or agree that . . . (index) print magazines TV radio
I choose branded drugs because they are higher quality 144 133 123
I am willing to pay more for luxury brands 139 119 121
I will buy some brands without even looking at the price 137 121 120
I have expensive tastes 132 112 113
Advertising helps me choose what I buy 130 126 119
People tend to ask me for advice before buying things 128 110 117
I tend to choose premium products and services 123 114 116
Well-known brands tend to be better than generic brands 123 115 113
I don’t mind paying extra for quality 108 102 103
Index: Percentage of top users of each medium vs. percentage of adults 18+.Note: Devoted print magazine readers are defined as those who read printed magazines at least several times per week. Devoted radio listeners are those who listen to FM radio at least two hours a day or AM radio at least one hour a day. Devoted TV viewers are defined as those who watch live or “catch-up” TV at least 31 hours per week. Each group represents approximately the same proportion of U.S. adults 18+.Source: YouGov Profiles, April 2016
AD ENVIRONMENT077
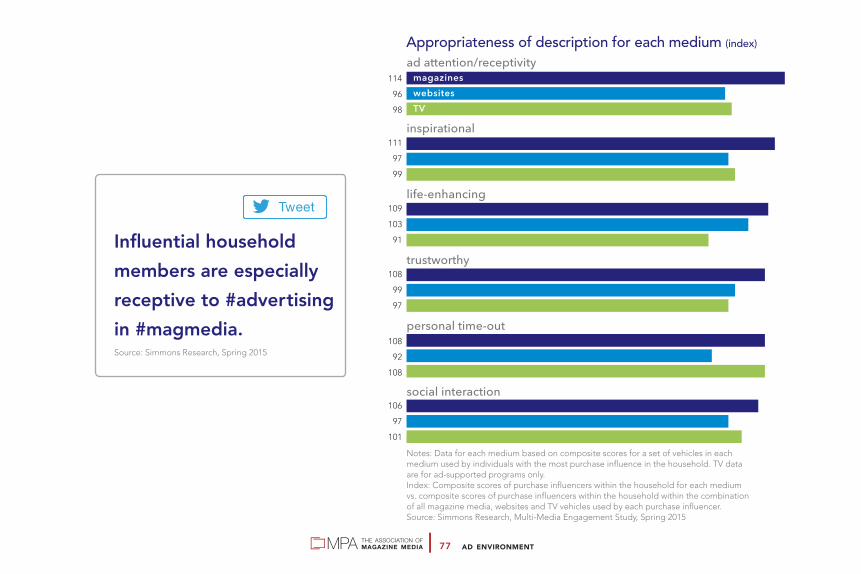
114
96
98
111
97
99
109
103
91
108
99
97
108
92
108
106
97
101
ad attention/receptivity
inspirational
life-enhancing
trustworthy
personal time-out
social interaction
Appropriateness of description for each medium (index)
Notes: Data for each medium based on composite scores for a set of vehicles in each medium used by individuals with the most purchase influence in the household. TV data are for ad-supported programs only.Index: Composite scores of purchase influencers within the household for each medium vs. composite scores of purchase influencers within the household within the combination of all magazine media, websites and TV vehicles used by each purchase influencer.Source: Simmons Research, Multi-Media Engagement Study, Spring 2015
magazineswebsitesTV
Influential householdmembers are especiallyreceptive to #advertisingin #magmedia. Source: Simmons Research, Spring 2015
AD ENVIRONMENT078
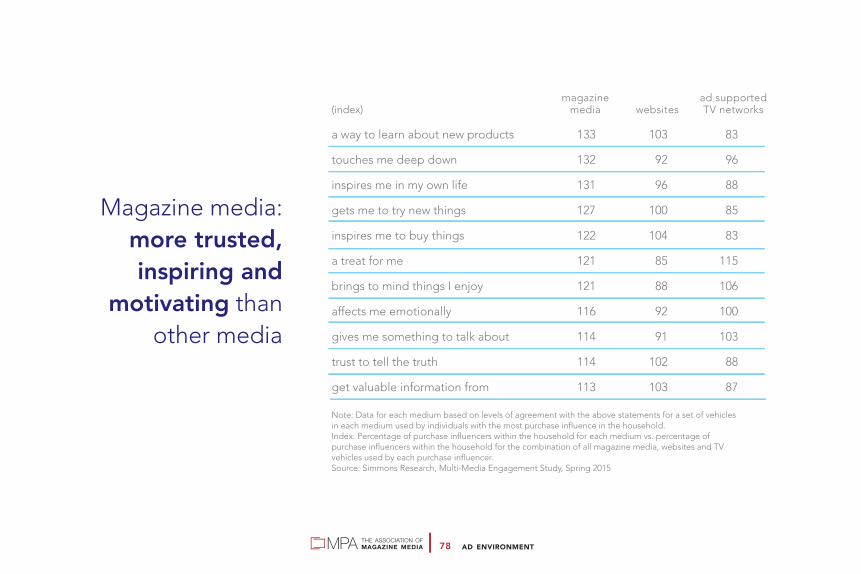
magazine ad supported(index) media websites TV networks
a way to learn about new products 133 103 83
touches me deep down 132 92 96
inspires me in my own life 131 96 88
gets me to try new things 127 100 85
inspires me to buy things 122 104 83
a treat for me 121 85 115
brings to mind things I enjoy 121 88 106
affects me emotionally 116 92 100
gives me something to talk about 114 91 103
trust to tell the truth 114 102 88
get valuable information from 113 103 87
Note: Data for each medium based on levels of agreement with the above statements for a set of vehicles in each medium used by individuals with the most purchase influence in the household.Index: Percentage of purchase influencers within the household for each medium vs. percentage of purchase influencers within the household for the combination of all magazine media, websites and TV vehicles used by each purchase influencer. Source: Simmons Research, Multi-Media Engagement Study, Spring 2015
Magazine media:more trusted,inspiring and
motivating thanother media

AD ENVIRONMENT079
Share of gross half-hours when emotion was experienced (index) print/digital radio/ magazines TV audio computer+ mobile+ tablet+
hopeful 400 92 132 111 169 176
confident 306 81 158 156 128 134
excited 164 112 130 94 127 103
happy 129 101 101 81 104 91
any positive emotion (net) 132 101 115 94 108 106
+Excluding digital magazines.Index against percentage of all half hours in which emotion was experienced.Source: RealityMine USA TouchPoints, 2015
Individuals are more likely to be happy, confident, excited and hopeful when they read magazines compared
to time spent with other media

AD ENVIRONMENT080
Super influential consumers among devoted media users (index) print magazines internet* TV radio newspapers
Fishing 161 143 93 128 82
Restaurants 146 126 66 108 90
Sports 144 130 87 110 92
Books 141 138 73 108 98
Vacation Travel 135 119 41 99 97
Pets 133 129 89 118 78
*Includes internet magazine activity.Index: Percentage of super influentials among the top quintile of users of each medium vs. percentage of super influentials among adults 18+.Note: Super influentials are defined as people who have great experience in this topic, whose advice on this topicis trusted by friends and family members and who recommend products or services on this topic to others.Source: GfK MRI, Spring 2015
Print magazinereaders enjoy
their free time

AD ENVIRONMENT081
Activities participated in regularly (index)(index) magazine media internet* TV radio newspapers
visit museums 190 91 93 131 146
attend pro/college sports 185 123 86 110 120
entertain family/friends 164 99 90 124 109
fine dining/eating out 156 100 101 121 132
cooking for fun 155 101 101 111 114
shopping for fun 154 112 107 105 100
photography 151 108 100 126 102
go to bars/nightclubs 146 110 95 112 121
fantasy sports league 133 122 103 124 72
*Includes internet magazine activity.Index: Top quintile of users of each medium vs. adults 18+.Source: Kantar Media, MARS Consumer Health Study, 2015
#Magmedia readersattend pro/college#sports games more
than users of any other
media.Source: Kantar Media, MARS Consumer Health Study, 2015
Magazine media readers lead the most active lives
AD ENVIRONMENT082
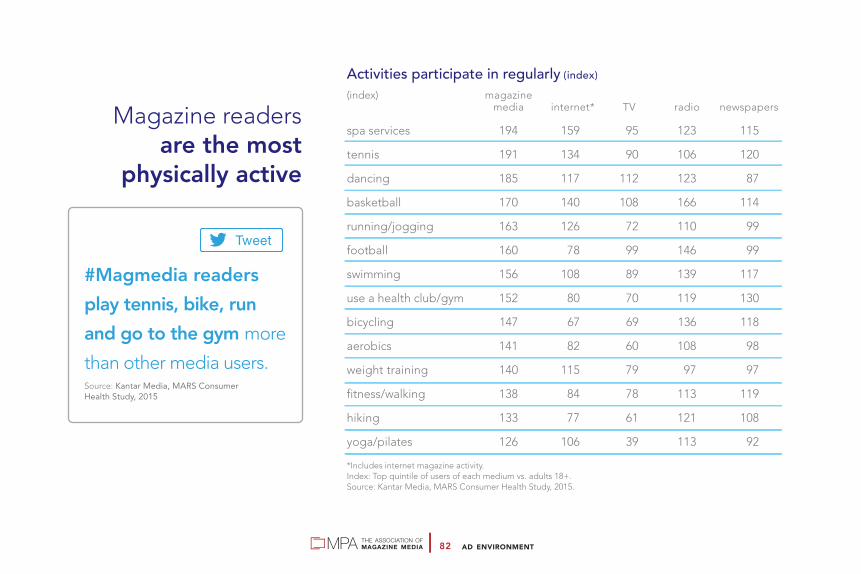
Activities participate in regularly (index)(index) magazine media internet* TV radio newspapers
spa services 194 159 95 123 115
tennis 191 134 90 106 120
dancing 185 117 112 123 87
basketball 170 140 108 166 114
running/jogging 163 126 72 110 99
football 160 78 99 146 99
swimming 156 108 89 139 117
use a health club/gym 152 80 70 119 130
bicycling 147 67 69 136 118
aerobics 141 82 60 108 98
weight training 140 115 79 97 97
fitness/walking 138 84 78 113 119
hiking 133 77 61 121 108
yoga/pilates 126 106 39 113 92
*Includes internet magazine activity.Index: Top quintile of users of each medium vs. adults 18+.Source: Kantar Media, MARS Consumer Health Study, 2015.
#Magmedia readersplay tennis, bike, runand go to the gym more
than other media users.Source: Kantar Media, MARS Consumer Health Study, 2015
Magazine readersare the most
physically active

AD ENVIRONMENT083
Print magazinereaders are
actively engaged,knowledgeableand inquisitive
162
97
110
143
114
131
139
101
124
129
74
77
127
99
126
124
68
76
knowledgeable
living life to the fullest
active
cerebral
adventurous
curious
Self-perception (index)
Index: Percentage of top users of each medium vs. percentage of adults 18+.Note: Devoted print magazine readers are defined as those who read printed magazines at least several times per week. Devoted radio listeners are those who listen to FM radio at least two hours a day or AM radio at least one hour a day. Devoted TV viewers are defined as those who watch live or “catch-up” TV at least 31 hours per week. Each group represents approximately the same proportion of U.S. adults 18+.Source: YouGov Profiles, April 2016
magazinesTVradio

MAGAZINE BRAND VITALITY084
January–March23.3%
April–June25.1%
Note: All measured publicationsSource: GfK MRI, July 2014–June 2015
DEC JAN
MAR
JUL
APR
MAY
FEB
AUG
SEP
OCT
NOV
JUN
7.0
7.4
8.9
8.1
8.3
8.78.0
7.3
9.2
8.8
9.2
9.1
October–December27.1%
July-September24.5%
Issue-specific audiences 2014–2015by month and quarter (percent)
Magazine advertising doesn’t take a vacation
MAGAZINE BRAND VITALITY085
Print and digital edition magazine contentis deeply absorbing
51.6minutes
*primaryprint
readers
Average time spent per issue*Subscribers/newsstand buyers and other members of their households.
Source: GfK MRI, Special Tabulators, Fall 2015.
49.8minutes
digitaleditionreaders

MAGAZINE BRAND VITALITY086
Staying powerFor the past eight years,
the total number ofconsumer magazines has
remained above 7,000
Number of U.S. printconsumer magazines 2005–2015
Source: National Directory of MagazinesMediaFinder.com, 2016
consumer year magazines 2015 7,293
2014 7,289
2013 7,240
2012 7,390
2011 7,179
2010 7,163
2009 7,110
2008 7,383
2007 6,809
2006 6,734
2005 6,325
MAGAZINE BRAND VITALITY087
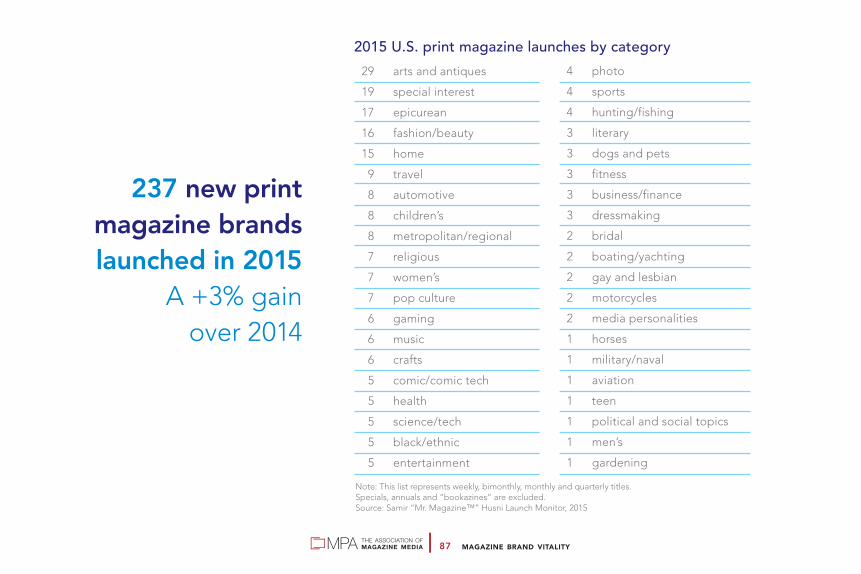
29 arts and antiques
19 special interest
17 epicurean
16 fashion/beauty
15 home
9 travel
8 automotive
8 children’s
8 metropolitan/regional
7 religious
7 women’s
7 pop culture
6 gaming
6 music
6 crafts
5 comic/comic tech
5 health
5 science/tech
5 black/ethnic
5 entertainment
237 new printmagazine brandslaunched in 2015
A +3% gainover 2014
2015 U.S. print magazine launches by category
Note: This list represents weekly, bimonthly, monthly and quarterly titles. Specials, annuals and “bookazines” are excluded.Source: Samir “Mr. Magazine™” Husni Launch Monitor, 2015
4 photo
4 sports
4 hunting/fishing
3 literary
3 dogs and pets
3 fitness
3 business/finance
3 dressmaking
2 bridal
2 boating/yachting
2 gay and lesbian
2 motorcycles
2 media personalities
1 horses
1 military/naval
1 aviation
1 teen
1 political and social topics
1 men’s
1 gardening

MAGAZINE BRAND VITALITY088
Magazine brands endureMore than 185 print magazineshave thrived for more than50 years (only 15 TV programscan say the same)Source: MPA Info Center, MediaFinder.com, Museum of Broadcast Communications, 2016 data.
65 print magazineshave flourishedfor more than100 years

MAGAZINEMAGAZINE BRANDBRAND VITALITYVITALITY008888
Note: Sunday magazines excluded. Source: PIB and Kantar Media, data as of January 2016
Leadingmarketers
investin print
magazines
1 L’Oréal SA (in thousands) 716,709
2 Procter & Gamble Co. 537,125
3 Pfizer Inc. 452,466
4 LVMH Möet Hennessy Louis Vuitton SA 266,747
5 Johnson & Johnson 254,447
6 Unilever 237,830
7 Mars Inc. 200,075
8 Berkshire Hathaway Inc. 197,997
9 Allergan Plc 175,105
10 Estée Lauder Cosmetics Inc. 174,637
11 Kraft Heinz Co. 173,929
12 Merck & Co Inc. 169,173
13 Kellogg Co. 157,831
14 General Motors Corp. 140,089
15 Joh A Benckiser Gmbh 131,705
16 Nestlé SA 125,868
17 Glaxosmithkline Plc 116,159
18 Ford Motor Co. 112,836
19 PepsiCo Inc. 107,009
20 Amazon.com Inc. 103,393
21 Bradford Exchange LTD 98,971
22 Toyota Motor Corp. 96,244
23 Bristol-Myers Squibb Co. 95,067
24 Kering SA 90,057
25 AT&T Inc. 88,793
26 Chanel SA 87,076
27 Church & Dwight Co Inc. 79,148
28 Edgewell Personal Care Co. 77,560
29 Eli Lilly & Co. 72,653
30 Comcast Corp. 71,743
31 Sanofi 68,723
32 MacNeil Automotive Products Ltd 65,734
33 Macys Inc. 62,823
34 Compagnie Financiére Richémont AG 61,881
35 VF Corp. 61,603
36 Revlon Inc. 61,568
37 Reynolds American Inc. 60,820
38 AstraZeneca Plc 58,802
39 Fiat Chrysler Automobiles NV 58,157
40 Luxottica Group Spa 57,512
41 Altria Group Inc. 57,491
42 Clorox Co. 57,190
43 Valeant Pharmaceuticals Intl 57,169
44 Skechers USA Inc. 56,438
45 Campbell Soup Co. 56,274
46 Walt Disney Co. 55,691
47 Coca-Cola Co. 50,951
48 America Movil SA 50,155
49 AbbVie Inc. 49,795
50 Phillips-Van Heusen Corp. 49,410
2015 Top 50 marketers’ print magazine rate card reported spend: $6,566,627,128

MAGAZINE.ORG090
MPA—The Association of Magazine Media is the primary advocate and voice for themagazine media industry, driving thought leadership and game-changing strategies to promote the industry’s vitality, increase revenues and grow market share. Established in 1919, MPA represents 175 domestic, associate and international members. MPA is headquartered in New York City, with a government affairs office in Washington, D.C.
The MPA Information Center offers personalized research services for MPA members, advertisers and their agencies. The staff can provide data on historical trends, industrystatistics, news and much more.
Members wishing to subscribe to the MPA Daily News Roundup, the industry’s comprehensive email newsletter of the latest magazine media news and developments, can email [email protected].
Members can send requests to [email protected] in New York. Staff is available 9am to 5pm Eastern time, Monday through Friday.
Find more information and updates at magazine.org.
The Magazine Media Factbook 2016. Produced by MPA–The Association of Magazine Media. MPA, 757 Third Avenue, 11th Floor, New York, NY 10017. © Copyright 2016. All rights reserved.

CaratcomScore, Inc.GfK MRI, GfK MRI StarchIpsos J.D. Power & AssociatesKantar MediaKeller Fay GroupMediaFinderMeredith CorporationMillward Brown DigitalMuseum of Broadcast CommunicationsNielsen Catalina Solutions/Nielsen HomescanProfessor Samir Husni, Mrmagazine.comPublishers Information Bureau® (PIB)RealityMine USASimmons ResearchSocialFlowYouGov
Our thanksto the following
for theirresearch
contribution

PublishersInformationBureau
THANK YOU TO OUR PRINT SPONSOR
magazine.org