Embed Size (px)
Citation preview


“Sprint is turning the corner. Even with all the aggressive promotional offers
from our competitors, we were still able to add more postpaid phone
customers than both Verizon and AT&T while continuing to grow revenues, take
costs out of the business, and improve the network.”

491 447 377
740 577
58.4 58.8
59.4 60.2
59.5
3QFY15 4QFY15 1QFY16 2QFY16 3QFY16
Net Additions (in Thousands) End of Period (In Millions)
The company had 577,000 net additions^ in the current quarter compared with 491,000 in the
year-ago period and 740,000 in the prior quarter.
Sprint ended the quarter with 59.5 million connections, including 31.7 million postpaid, 11.8
million prepaid, and 16.0 million wholesale and affiliate connections. The prepaid base was
reduced by approximately 1.2 million as a result of tightening the customer engagement criteria
and aligning all prepaid brands under one churn and retention program.
The company has added over 2.1 million net additions^ over the last four quarters.

501
56
180
344405
3QFY15 4QFY15 1QFY16 2QFY16 3QFY16
Postpaid Net Adds^
In Thousands
Postpaid net additions^ were
405,000 during the quarter
compared to 501,000 in the year-
ago period and 344,000 in the
prior quarter. The year-over-year
decline was driven by higher
tablet net losses, while the
sequential increase was primarily
driven by higher phone net
additions combined with a
reduction in tablet net losses.
1.53% 1.56%
1.39% 1.37%
1.57%
1.62%
1.72%
1.56% 1.52%
1.67%
3QFY15 4QFY15 1QFY16 2QFY16 3QFY16
Postpaid Phone Churn Postpaid Total Churn
Postpaid Total Churn and Postpaid Phone Churn^
Postpaid phone churn^ of 1.57 percent
compared to 1.53 percent in the year-ago
period and 1.37 percent in the prior quarter.
The year-over-year change was impacted by
aggressive promotional offers from
competitors. Sequentially, the higher phone
churn was primarily driven by typical
seasonality combined with more aggressive
promotional offers from competitors.
Postpaid churn^ of 1.67 percent for the
current quarter increased from 1.62 percent in
the year-ago period and 1.52 percent in the
prior quarter. Year-over-year, churn was
primarily impacted by higher tablet churn
related to fewer promotional offers. The
increase in churn from the prior quarter was
mostly due to higher phone churn.

366
22
173
347 368
3QFY15 4QFY15 1QFY16 2QFY16 3QFY16
Postpaid Phone Net Adds ^
In Thousands
Postpaid phone net additions^ of
368,000 compared to net
additions of 366,000 in the year-
ago period and 347,000 in the
prior quarter. Sequentially,
seasonally higher gross additions
were partially offset by seasonally
higher churn. This quarter was the
sixth consecutive quarter of
positive phone net additions and
the company ended the quarter
with over 26 million phone
connections.
Tablet net losses^ were 30,000 in the quarter compared to net additions of 82,000 in the year-ago
period and net losses of 50,000 in the prior quarter. The year-over-year decline was due to lower
gross additions and higher churn rates as the company continues to focus on growing phone
connections. The sequential improvement was mostly related to higher gross additions. The
company ended the quarter with 3.0 million tablet connections.
25.3 25.3 25.3 25.7 26.0
3.2 3.1 3.1 3.0 3.0
2.4 2.5 2.5 2.6 2.7
30.9 30.9 30.9 31.3 31.7
3QFY15 4QFY15 1QFY16 2QFY16 3QFY16
Phones Tablets Other DevicesPostpaid Connections^
In Millions

2.72 2.72 2.73 2.74 2.75
3QFY15 4QFY15 1QFY16 2QFY16 3QFY16
Average Postpaid Subscribers per Account^Average postpaid subscribers
per account^ of 2.75 at quarter
end compared to 2.72 in the
year-ago period and 2.74 in the
prior quarter. The growth has
been driven by higher phones
per account, partially offset by
recent tablet pressure.
Wholesale & affiliate^ net additions were 673,000 in the quarter compared to 481,000 in the year-
ago period and 823,000 in the prior quarter. Connected devices represented the majority of the net
additions.
Prepaid net losses^ of 501,000 during the quarter compared to 491,000 in the year-ago period and
427,000 in the prior quarter. Year-over-year, an increase in Boost net losses was offset by fewer net
losses within the Virgin brand. The sequential decline was mostly driven by increased competitive
pressure and less promotional activity.
Prepaid churn^ was 5.80 percent compared to 5.82 percent for the year-ago period and 5.63
percent for the prior quarter. Since the tightening of customer engagement criteria occurred late
in the quarter, there was not a material impact to prepaid churn this quarter.

4.8 3.4 3.3 3.7
4.8
3.4
3.5 3.2 3.1 2.9
8.2
6.9 6.5 6.8 7.7
3QFY15 4QFY15 1QFY16 2QFY16 3QFY16
Postpaid PrepaidRetail Sales^
In Millions
Retail sales^ were 7.7 million
during the quarter compared to
8.2 million in the year-ago period
and 6.8 million in the prior
quarter. Lower prepaid gross
additions was the biggest driver
of the year-over-year decline,
while the sequential increase
was driven by seasonally higher
postpaid sales.
21%
28%
35%42%
50%
3QFY15 4QFY15 1QFY16 2QFY16 3QFY16
Postpaid Carrier Agreggation Capable Phones as a Percentage of Phone Connections ^
Postpaid carrier aggregation capable phones^, which
allow for higher download data speeds, were 78 percent of
postpaid phones sold during the quarter, increasing the
number of these phones within the phone base to 50
percent.
Postpaid smartphones^
represented 94 percent of the
ending postpaid phone
connection base compared to
91 percent at the end of the
year-ago period and 93
percent at the end of the prior
quarter. During the quarter, 99
percent of postpaid phones
sold were smartphones.
Postpaid tri-band LTE
phones^ represented 82
percent of the 26.0 million
ending postpaid phone
connection base compared to
64 percent at the end of the
year-ago period and 78
percent at the end of the prior
quarter. During the quarter, 96
percent of postpaid phones
sold were tri-band.
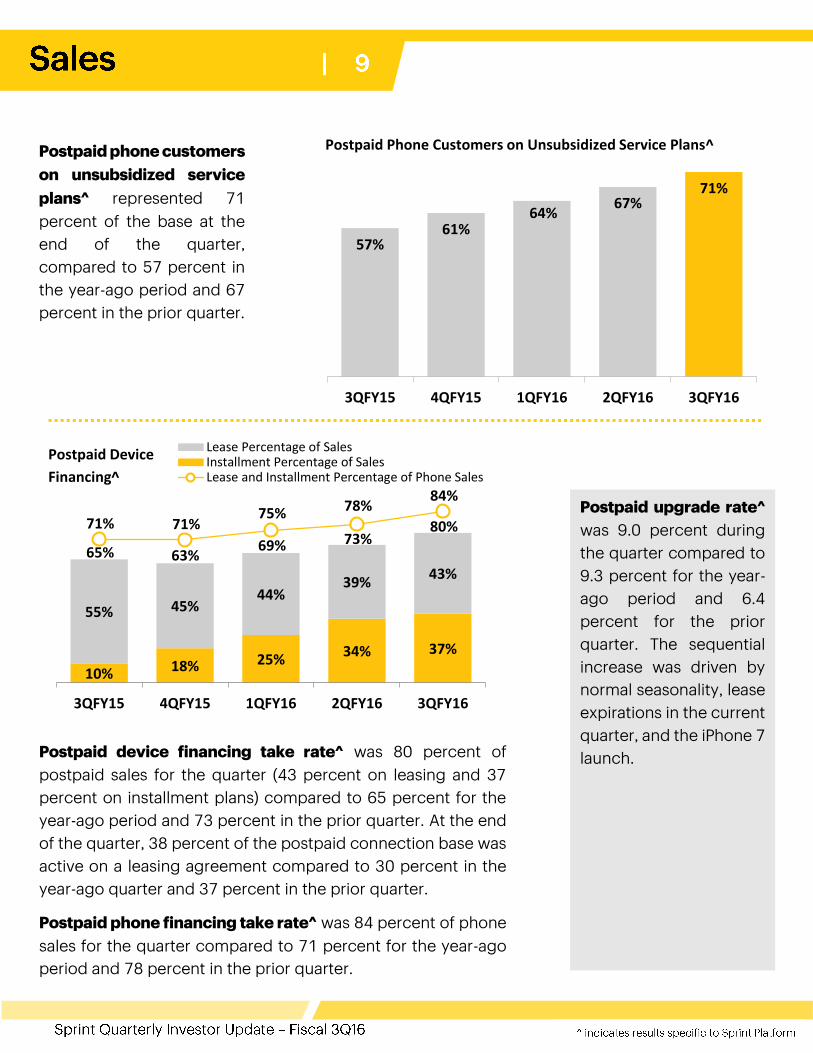
57%61%
64%67%
71%
3QFY15 4QFY15 1QFY16 2QFY16 3QFY16
Postpaid Phone Customers on Unsubsidized Service Plans^Postpaid phone customers
on unsubsidized service
plans^ represented 71
percent of the base at the
end of the quarter,
compared to 57 percent in
the year-ago period and 67
percent in the prior quarter.
10% 18% 25%34% 37%
55% 45%44%
39%43%
65% 63%69% 73%
80%71% 71%75% 78%
84%
3QFY15 4QFY15 1QFY16 2QFY16 3QFY16
Lease Percentage of SalesInstallment Percentage of SalesLease and Installment Percentage of Phone Sales
Postpaid Device
Financing^
Postpaid device financing take rate^ was 80 percent of
postpaid sales for the quarter (43 percent on leasing and 37
percent on installment plans) compared to 65 percent for the
year-ago period and 73 percent in the prior quarter. At the end
of the quarter, 38 percent of the postpaid connection base was
active on a leasing agreement compared to 30 percent in the
year-ago quarter and 37 percent in the prior quarter.
Postpaid phone financing take rate^ was 84 percent of phone
sales for the quarter compared to 71 percent for the year-ago
period and 78 percent in the prior quarter.
Postpaid upgrade rate^
was 9.0 percent during
the quarter compared to
9.3 percent for the year-
ago period and 6.4
percent for the prior
quarter. The sequential
increase was driven by
normal seasonality, lease
expirations in the current
quarter, and the iPhone 7
launch.

Sprint continues to unlock the value of the largest spectrum holdings in the U.S. by densifying and
optimizing its network to provide customers the best experience. Third party sources continue to
validate the company’s network performance improvements.
Independent mobile analytics firm RootMetrics®
awarded Sprint a company record 246 first-place
(outright or shared) Metropolitan area RootScore®
awards for reliability, speed, data, call, text, or
overall network performance in the second half of
2016, including more call RootScore awards than
Verizon, AT&T, or T-Mobile for the first time ever.
Additionally, Sprint has received nearly 50 percent
more total awards compared to its award tally in
the prior testing period.1
Sprint’s overall network reliability continues to beat
T-Mobile and performs within 1 percent of Verizon
and AT&T, based on an analysis of Nielsen data.2
The Sprint LTE Plus network, which includes advanced
technologies such as antenna beamforming and two-
channel carrier aggregation, is now available in more than
250 markets, with three-channel carrier aggregation
deployed in more than 100 of those markets.
Sprint also recently announced a breakthrough
innovation called High Performance User Equipment
(HPUE), a new technology that can extend the coverage
of its 2.5GHz spectrum by up to 30 percent to nearly
match its mid-band 1.9GHz spectrum performance on
capable devices, including indoors where the majority of
wireless traffic is generated. HPUE-capable devices are
expected to be available in the coming months.
.
1 Rankings based on RootMetrics 125 Metro RootScore Reports (1H and 2H 2016) for mobile performance as tested on best available plans and devices
on 4 mobile networks across all available network types. Your experience may vary. The RootMetrics awards are not an endorsement of Sprint. Visit
www.rootmetrics.com. 2 Average network reliability (voice & data) based on Sprint’s analysis of latest Nielsen drive test data in the top 106 metro markets.
2

$8.1 $8.1 $8.0
$8.2
$8.5
3QFY15 4QFY15 1QFY16 2QFY16 3QFY16
Net Operating Revenues
Dollars In Billions
Net operating revenues of $8.5 billion for the quarter were up $442 million year-over-year and $302
million sequentially, as higher equipment revenue was partially offset by lower wireless and wireline
service revenue. The growth in equipment revenue both year-over-year and sequentially was
primarily driven by higher leasing revenue and more installment billing sales.
Wireless service revenue of $5.9 billion declined $300 million year-over-year and $71 million
sequentially. The year-over-year and sequential decreases were driven by lower prepaid revenues
related to customer losses, in addition to lower postpaid phone Average Revenue Per User (ARPU)^,
as customers continued to migrate to rate plans offered in conjunction with device financing,
partially offset by growth in the postpaid phone customer base.
Wireline revenues of $497 million for the quarter declined $84 million year-over-year and $24
million sequentially. The year-over-year and sequential declines were primarily driven by lower voice
volumes as the company continues to de-emphasize certain voice services.

$70.99 $71.53 $72.17 $71.69 $71.77
3QFY15 4QFY15 1QFY16 2QFY16 3QFY16
Service EquipmentPostpaid Phone Average Billings Per User
(ABPU)^*
Postpaid Phone Average Billings
Per User (ABPU)^* of $71.77 for the
quarter increased 1 percent year-
over-year and was relatively flat
sequentially. The year-over-year
increase was primarily related to
higher billings associated with
equipment, partially offset by a
shift to service plans offered in
conjunction with device financing
options.
$167.11 $168.49 $170.56 $170.29 $171.28
3QFY15 4QFY15 1QFY16 2QFY16 3QFY16
Service EquipmentPostpaid Average Billings Per Account
(ABPA)^*
Postpaid Average Billings Per Account (ABPA)^* of
$171.28 for the quarter increased over 2 percent year-
over-year and 1 percent sequentially. The year-over-year
increase was due to higher equipment billings, in
addition to growth in lines per account, partially offset by
service plans offered in conjunction with device
financing options.
Prepaid Average Revenue Per
User (ARPU)^ of $27.61 for the
quarter increased 1 percent both
year-over-year and sequentially.
Since the tightening of customer
engagement criteria occurred
late in the quarter, there was not
a material impact to prepaid
ARPU this quarter.
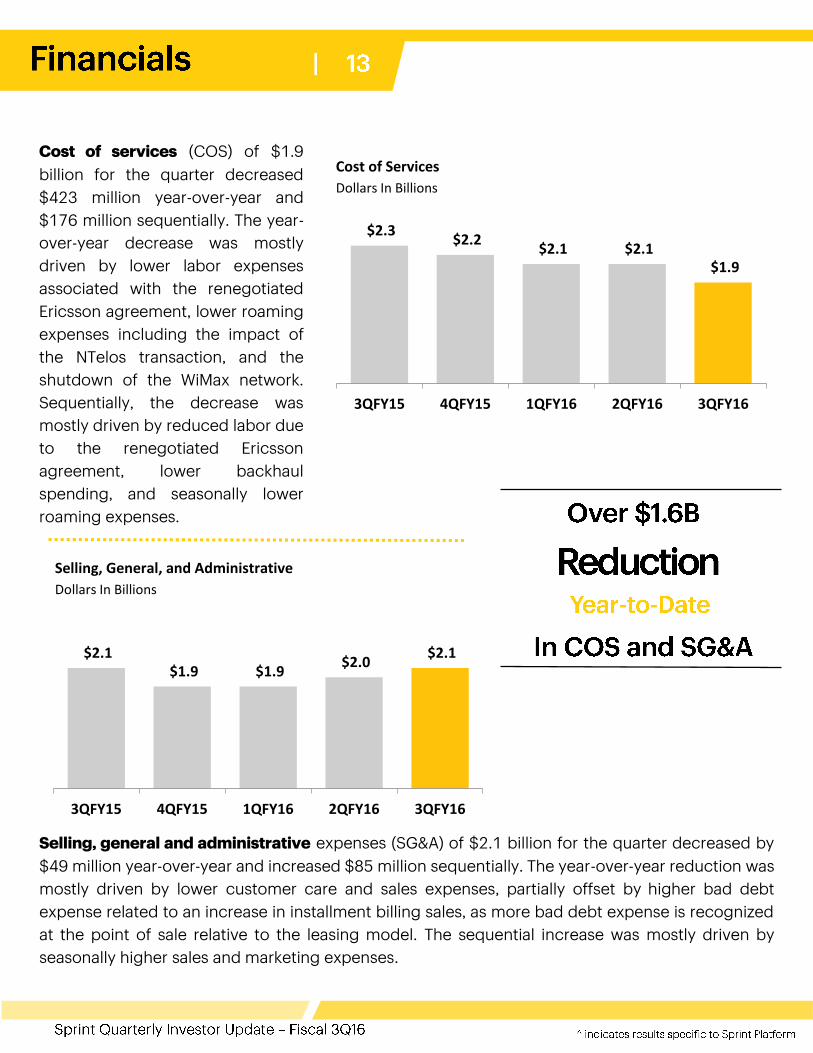
$2.3 $2.2
$2.1 $2.1 $1.9
3QFY15 4QFY15 1QFY16 2QFY16 3QFY16
Cost of Services
Dollars In Billions
Cost of services (COS) of $1.9
billion for the quarter decreased
$423 million year-over-year and
$176 million sequentially. The year-
over-year decrease was mostly
driven by lower labor expenses
associated with the renegotiated
Ericsson agreement, lower roaming
expenses including the impact of
the NTelos transaction, and the
shutdown of the WiMax network.
Sequentially, the decrease was
mostly driven by reduced labor due
to the renegotiated Ericsson
agreement, lower backhaul
spending, and seasonally lower
roaming expenses.
$2.1 $1.9 $1.9
$2.0 $2.1
3QFY15 4QFY15 1QFY16 2QFY16 3QFY16
Selling, General, and Administrative
Dollars In Billions
Selling, general and administrative expenses (SG&A) of $2.1 billion for the quarter decreased by
$49 million year-over-year and increased $85 million sequentially. The year-over-year reduction was
mostly driven by lower customer care and sales expenses, partially offset by higher bad debt
expense related to an increase in installment billing sales, as more bad debt expense is recognized
at the point of sale relative to the leasing model. The sequential increase was mostly driven by
seasonally higher sales and marketing expenses.

$1.6 $1.6
$1.4
$1.7
$2.0
3QFY15 4QFY15 1QFY16 2QFY16 3QFY16
Cost of Products
Dollars In BillionsCost of products of $2.0 billion for
the quarter increased $396 million
year-over-year and $292 million
sequentially. The year-over-year
increase was mostly driven by the
significant increase in the
installment billing mix of sales in
conjunction with the decrease in
the mix of leasing sales. The
sequential increase was primarily
due to seasonally higher postpaid
sales.
$1.1 $1.0 $1.0 $1.0 $1.0
$0.5 $0.6 $0.7 $0.7 $0.8
$0.3 $0.3 $0.3 $0.3 $0.3 $1.9 $1.9 $2.0 $2.0 $2.1
3QFY15 4QFY15 1QFY16 2QFY16 3QFY16
Amortization
Leased Devices
Network and Other Depreciation
Depreciation and Amortization
Dollars In Billions
Depreciation and amortization expense of $2.1 billion for the
quarter increased $227 million year-over-year and $111 million
sequentially. The year-over-year and sequential increases were
primarily related to depreciation of devices associated with our
leasing options. Leased device depreciation was $837 million
in the quarter, $535 million in the year-ago period, and $724
million in the prior quarter.
Other, net expense
of $156 million for
the quarter included
$47 million primarily
related to asset
dispositions and
severance costs, as
well as $109 million
of loss on leased
devices, with only
the latter impacting
Adjusted EBITDA*.

$1.9
$2.2
$2.5
$2.3
$2.5
3QFY15 4QFY15 1QFY16 2QFY16 3QFY16
Adjusted EBITDA*
Dollars In Billions
Adjusted EBITDA* was $2.5 billion for the quarter, compared to $1.9 billion in the year-ago period
and $2.3 billion in the prior quarter. The year-over-year and sequential improvement was primarily
due to higher net operating revenues and lower cost of services expenses, partially offset by higher
cost of products expenses. The sequential increase was also impacted by seasonally higher sales
and marketing expenses.
Operating income of $311 million compared to an operating loss of $197 million in the year-ago
period and operating income of $622 million in the prior quarter. The current quarter included $47
million primarily related to asset dispositions and severance costs, while the year-ago period was
impacted by $209 million of severance and exit costs and $21 million of litigation and other
contingency expenses. In addition, the prior quarter included a pre-tax non-cash gain of $354
million related to spectrum swaps with other carriers that was partially offset by $103 million in
litigation and other contingency expenses. Adjusting for items in each period, operating income
would have improved by approximately $325 million year-over-year and would have been relatively
flat sequentially.
Net loss of $479 million for the quarter compared to a loss of $836 million in the year-ago period
and $142 million in the prior quarter. The year-over-year and sequential changes in net losses were
directionally in line with the operating income changes.

$339
$603
$466
$707
($646)
3QFY15 4QFY15 1QFY16 2QFY16 3QFY16
Adjusted Free Cash Flow *
Dollars In Millions
Cash provided by operating activities of $650 million for the quarter compared to $806 million in
the year-ago period and $1.7 billion in the prior quarter. Year-over-year, the $156 million decrease
was driven by unfavorable changes in working capital that were partially offset by improvements in
Adjusted EBITDA*. The $1.1 billion sequential decrease was primarily due to unfavorable working
capital changes.
Adjusted free cash flow* of negative $646 million for the quarter compared to positive $339 million
in the year-ago period and positive $707 million in the prior quarter. The year-ago period included
$1.1 billion of proceeds from the first sale-leaseback transaction with Mobile Leasing Solutions, LLC
(MLS), while this quarter included a net cash outflow of approximately $370 million related to the
repurchase of devices sold in the first MLS transaction. The sequential decrease was driven by
unfavorable changes to working capital. During the quarter, the company made net repayments of
$231 million related to device financing and sales of future lease receivables.
Cash capital expenditures were $1.2 billion in the quarter compared to $1.6 billion in the year-ago
period and $828 million in the prior quarter. Capital expenditures for leased devices were $767
million in the current quarter, including $477 million associated with the repurchase of devices sold
in the first MLS transaction, compared to $607 million in the year-ago period and $358 million in the
prior quarter. The year-over-year decline in spending was primarily driven by lower network capital
expenditures.

Maturities
Cash, Equivalents & ST Investments
Total Revolver Availability
AR Securitization Availability
Vendor Financing
Network LeaseCo
Other
[Empty]
[Empty]
Total
3.1
6.1
3.0
1.0
1.2
0.5
1.7
Liquidity as of12/31/16
CurrentMaturities**
Cash, Cash Equiv, Short-Term Investments Revolver
Network Equipment Financing
Receivables/Device FinancingVendor Financing Note Maturities
Other ** Includes maturities due through Dec. 2017
Liquidity and Debt
Dollars In Billions $ 10.3
$9.1 of
General Purpose
Liquidity
$ 6.6
Total general purpose liquidity was $9.1 billion at the end of the quarter, including $6.1 billion of
cash, cash equivalents and short-term investments. Additionally, the company also has $1.2 billion
of availability under vendor financing agreements that can be used toward the purchase of 2.5GHz
network equipment.
During the quarter the company issued $3.5 billion of spectrum-backed senior secured notes at
3.36 percent, which is about half of Sprint’s current effective interest rate, as part of a $7 billion
program aimed at diversifying the company’s funding sources, lowering its cost of capital, and
reducing future cash interest expenses. The company also retired $2.3 billion of debt maturities
with significantly higher coupon payments and repurchased the devices sold in the first MLS
transaction, thus eliminating the associated future lease obligation.
Based on the company’s sustained operational performance and improved liquidity, Moody’s
Investor Service recently upgraded Sprint’s corporate family rating from B3 to B2.


Wireless Operating Statistics (Unaudited)
Quarter To Date
12/31/16 9/30/16 12/31/15 12/31/16 12/31/15
Sprint platform (1):
Net additions (losses) (in thousands)
Postpaid 405 344 501 929 1,189
Prepaid (501) (427) (491) (1,259) (1,045)
Wholesale and affiliate 673 823 481 2,024 2,078
Total Sprint platform wireless net additions 577 740 491 1,694 2,222
End of period connections (in thousands)
Postpaid (d) 31,694 31,289 30,895 31,694 30,895
Prepaid (d) (e) 11,812 13,547 14,661 11,812 14,661
Wholesale and affiliate (d) (e) 16,009 15,357 12,803 16,009 12,803
Total Sprint platform end of period connections 59,515 60,193 58,359 59,515 58,359
Churn
Postpaid 1.67% 1.52% 1.62% 1.58% 1.57%
Prepaid (e) 5.80% 5.63% 5.82% 5.66% 5.31%
Supplemental data - connected devices
End of period connections (in thousands)
Retail postpaid 1,960 1,874 1,676 1,960 1,676
Wholesale and affiliate 10,594 9,951 7,930 10,594 7,930
Total 12,554 11,825 9,606 12,554 9,606
Sprint platform ARPU (1) (a)
Postpaid 49.70$ 50.54$ 52.48$ 50.59$ 53.97$
Prepaid (e) 27.61$ 27.31$ 27.44$ 27.41$ 27.64$
Sprint platform postpaid phone (1)
Postpaid phone net additions 368 347 366 888 416
Postpaid phone end of period connections (d) 26,037 25,669 25,294 26,037 25,294
Postpaid phone churn 1.57% 1.37% 1.53% 1.44% 1.50%
NON-GAAP RECONCILIATION - ABPA*, POSTPAID PHONE ARPU AND ABPU* (Unaudited)
(Millions, except accounts, connections, ABPA*, ARPU, and ABPU*)
12/31/16 9/30/16 12/31/15 12/31/16 12/31/15
Sprint platform ABPA* (1)
Postpaid service revenue 4,686$ 4,720$ 4,813$ 14,184$ 14,670$
Add: Installment plan billings 291 274 300 829 903
Add: Lease revenue 887 811 531 2,453 1,176
Total for Sprint platform postpaid connections $ 5,864 $ 5,805 $ 5,644 $ 17,466 $ 16,749
Sprint platform postpaid accounts (in thousands) 11,413 11,363 11,261 11,368 11,211
Sprint platform postpaid ABPA* (b) 171.28$ 170.29$ 167.11$ 170.71$ 166.00$
12/31/16 9/30/16 12/31/15 12/31/16 12/31/15
Sprint platform postpaid phone ARPU and ABPU* (1)
Postpaid phone service revenue 4,420$ 4,441$ 4,529$ 13,350$ 13,819$
Add: Installment plan billings 261 248 280 752 848
Add: Lease revenue 873 797 522 2,411 1,150
Total for Sprint platform postpaid phone connections $ 5,554 $ 5,486 $ 5,331 $ 16,513 $ 15,817
Sprint platform postpaid average phone connections (in thousands) 25,795 25,514 25,040 25,528 24,927
Sprint platform postpaid phone ARPU (a) 57.12$ 58.03$ 60.30$ 58.11$ 61.60$
Sprint platform postpaid phone ABPU* (c) 71.77$ 71.69$ 70.99$ 71.87$ 70.51$
(e) As a result of aligning all prepaid brands, including prepaid affiliate subscribers, under one churn and retention program as of December 31, 2016, end of period
prepaid and affiliate subscribers were reduced by 1,234,000 and 21,000, respectively.
(b) Sprint platform postpaid ABPA* is calculated by dividing service revenue earned from connections plus installment plan billings and lease revenue by the sum of
the monthly average number of accounts during the period.(c) Sprint platform postpaid phone ABPU* is calculated by dividing postpaid phone service revenue earned from postpaid phone connections plus installment plan
billings and lease revenue by the sum of the monthly average number of postpaid phone connections during the period.(d) As part of the transaction involving Shenandoah Telecommunications Company (Shentel), 186,000 and 92,000 subscribers were transferred in May 2016 from
postpaid and prepaid, respectively, to affiliates. An additional 270,000 nTelos' subscribers are now part of our affiliate relationship with Shentel and are being reported
in wholesale and affiliate subscribers during the quarter ended June 30, 2016.
Year To Date
Quarter To Date Year To Date
Quarter To Date Year To Date
(a) ARPU is calculated by dividing service revenue by the sum of the monthly average number of connections in the applicable service category. Changes in average
monthly service revenue reflect connections for either the postpaid or prepaid service category who change rate plans, the level of voice and data usage, the amount
of service credits which are offered to connections, plus the net effect of average monthly revenue generated by new connections and deactivating connections.
Sprint platform postpaid phone ARPU represents revenues related to our postpaid phone connections.

Wireless Device Financing Summary (Unaudited)
(Millions, except sales, connections, and sales and connections mix)
Quarter To Date
12/31/16 9/30/16 12/31/15 12/31/16 12/31/15
Postpaid sales (in thousands) 4,812 3,747 4,799 11,827 12,956
Postpaid sales mix
Subsidy/other 20% 27% 35% 25% 35%
Installment plans 37% 34% 10% 33% 12%
Leasing 43% 39% 55% 42% 53%
Installment plans
Installment sales financed 1,036$ 745$ 251$ 2,188$ 748$
Installment billings 291 274 300 829 903
Leasing
Lease revenue 887$ 811$ 531$ 2,453$ 1,176$
Lease depreciation 837 724 535 2,205 1,231
Leased device additions:
Cash paid for capital expenditures - leased devices 767$ 358$ 607$ 1,530$ 1,724$
Transfers from inventory - leased devices 1,095 645 1,073 2,281 2,623
Leased devices in property, plant and equipment, net 4,454$ 3,759$ 3,321$ 4,454$ 3,321$
Leased device net proceeds
Proceeds from MLS sale -$ -$ 1,136$ 1,055$ 1,136$
Repayments to MLS (176) (161) - (502) -
Proceeds from lease securitization - - - - -
Repayments of lease securitization (55) (23) - (153) -
Net (repayments) proceeds of device financings and sales of future
lease receivables (231)$ (184)$ 1,136$ 400$ 1,136$
54
55
56
57
58
59
60
61
62
63
64
65
66
67
68
69
70
71
72
73
74
75
Year To Date

CONDENSED CONSOLIDATED STATEMENTS OF OPERATIONS (Unaudited)
(Millions, except per share data)
12/31/16 9/30/16 12/31/15 12/31/16 12/31/15
Net operating revenues
Service revenue 6,323$ 6,413$ 6,683$ 19,252$ 20,600$
Equipment revenue 2,226 1,834 1,424 5,556 3,509
Total net operating revenues 8,549 8,247 8,107 24,808 24,109
Net operating expenses
Cost of services (exclusive of depreciation and amortization below) 1,925 2,101 2,348 6,125 7,194
Cost of products (exclusive of depreciation and amortization below) 1,985 1,693 1,589 5,097 4,244
Selling, general and administrative 2,080 1,995 2,129 5,992 6,540
Depreciation - network and other 1,000 986 1,014 3,022 2,971
Depreciation - leased devices 837 724 535 2,205 1,231
Amortization 255 271 316 813 994
Other, net 156 (145) 373 260 633
Total net operating expenses 8,238 7,625 8,304 23,514 23,807
Operating income (loss) 311 622 (197) 1,294 302
Interest expense (619) (630) (546) (1,864) (1,630)
Other (expense) income, net (60) (15) 4 (67) 13
Loss before income taxes (368) (23) (739) (637) (1,315)
Income tax expense (111) (119) (97) (286) (126)
Net loss (479)$ (142)$ (836)$ (923)$ (1,441)$
Basic and diluted net loss per common share (0.12)$ (0.04)$ (0.21)$ (0.23)$ (0.36)$
Weighted average common shares outstanding 3,983 3,979 3,970 3,979 3,969
Effective tax rate -30.2% -517.4% -13.1% -44.9% -9.6%
NON-GAAP RECONCILIATION - NET LOSS TO ADJUSTED EBITDA* (Unaudited)
(Millions)
12/31/16 9/30/16 12/31/15 12/31/16 12/31/15
Net loss (479)$ (142)$ (836)$ (923)$ (1,441)$
Income tax expense 111 119 97 286 126
Loss before income taxes (368) (23) (739) (637) (1,315)
Other expense (income), net 60 15 (4) 67 (13)
Interest expense 619 630 546 1,864 1,630
Operating income (loss) 311 622 (197) 1,294 302
Depreciation - network and other 1,000 986 1,014 3,022 2,971
Depreciation - leased devices 837 724 535 2,205 1,231
Amortization 255 271 316 813 994
EBITDA* (3)2,403 2,603 1,668 7,334 5,498
Loss (gain) from asset dispositions and exchanges, net (4) 28 (354) - (326) 85
Severance and exit costs (5) 19 (5) 209 30 247
Contract terminations (6) - - - 113 -
Litigation and other contingencies (7) - 103 21 103 178
Reduction in liability - U.S. Cellular asset acquisition (8) - - - - (20)
Adjusted EBITDA* (3)2,450$ 2,347$ 1,898$ 7,254$ 5,988$
Adjusted EBITDA margin* 38.7% 36.6% 28.4% 37.7% 29.1%
Selected items:
Cash paid for capital expenditures - network and other 478$ 470$ 994$ 1,421$ 3,958$
Cash paid for capital expenditures - leased devices 767$ 358$ 607$ 1,530$ 1,724$
Quarter To Date Year To Date
Quarter To Date Year To Date

WIRELESS STATEMENTS OF OPERATIONS (Unaudited)
(Millions)
12/31/16 9/30/16 12/31/15 12/31/16 12/31/15
Net operating revenues
Service revenue
Sprint platform (1):
Postpaid 4,686$ 4,720$ 4,813$ 14,184$ 14,670$
Prepaid 1,077 1,129 1,224 3,371 3,783
Wholesale, affiliate and other 183 168 182 509 548
Total Sprint platform 5,946 6,017 6,219 18,064 19,001
Total transactions (2) - - 27 - 216
Total service revenue 5,946 6,017 6,246 18,064 19,217
Equipment revenue 2,226 1,834 1,424 5,556 3,509
Total net operating revenues 8,172 7,851 7,670 23,620 22,726
Net operating expenses
Cost of services (exclusive of depreciation and amortization below) 1,649 1,793 2,031 5,226 6,147
Cost of products (exclusive of depreciation and amortization below) 1,985 1,693 1,589 5,097 4,244
Selling, general and administrative 2,032 1,931 2,041 5,797 6,273
Depreciation - network and other 947 936 961 2,868 2,821
Depreciation - leased devices 837 724 535 2,205 1,231
Amortization 255 271 316 813 994
Other, net 150 (151) 353 248 611
Total net operating expenses 7,855 7,197 7,826 22,254 22,321
Operating income (loss) 317$ 654$ (156)$ 1,366$ 405$
WIRELESS NON-GAAP RECONCILIATION (Unaudited)
(Millions)
12/31/16 9/30/16 12/31/15 12/31/16 12/31/15
Operating income (loss) 317$ 654$ (156)$ 1,366$ 405$
Loss (gain) from asset dispositions and exchanges, net (4) 28 (354) - (326) 85
Severance and exit costs (5) 13 (11) 189 18 225
Contract terminations (6) - - - 113 -
Litigation and other contingencies (7) - 103 21 103 178
Reduction in liability - U.S. Cellular asset acquisition (8) - - - - (20)
Depreciation - network and other 947 936 961 2,868 2,821
Depreciation - leased devices 837 724 535 2,205 1,231
Amortization 255 271 316 813 994
Adjusted EBITDA* (3)2,397$ 2,323$ 1,866$ 7,160$ 5,919$
Adjusted EBITDA margin* 40.3% 38.6% 29.9% 39.6% 30.8%
Selected items:
Cash paid for capital expenditures - network and other 389$ 358$ 869$ 1,123$ 3,512$
Cash paid for capital expenditures - leased devices 767$ 358$ 607$ 1,530$ 1,724$
60
61
62
63
64
65
66
67
68
69
70
71
72
73
74
75
Quarter To Date Year To Date
Quarter To Date Year To Date

WIRELINE STATEMENTS OF OPERATIONS (Unaudited)
(Millions)
12/31/16 9/30/16 12/31/15 12/31/16 12/31/15
Net operating revenues
Voice 153$ 172$ 201$ 506$ 646$
Data 41 43 42 127 134
Internet 281 288 317 871 968
Other 22 18 21 59 72
Total net operating revenues 497 521 581 1,563 1,820
Net operating expenses
Costs of services (exclusive of depreciation and amortization below) 400 436 466 1,284 1,495
Selling, general and administrative 49 62 82 189 254
Depreciation and amortization 51 48 50 148 144
Other, net 6 7 20 13 22
Total net operating expenses 506 553 618 1,634 1,915
Operating loss (9)$ (32)$ (37)$ (71)$ (95)$
WIRELINE NON-GAAP RECONCILIATION (Unaudited)
(Millions)
12/31/16 9/30/16 12/31/15 12/31/16 12/31/15
Operating loss (9)$ (32)$ (37)$ (71)$ (95)$
Severance and exit costs (5) 6 7 20 13 22
Depreciation and amortization 51 48 50 148 144
Adjusted EBITDA* 48$ 23$ 33$ 90$ 71$
Adjusted EBITDA margin* 9.7% 4.4% 5.7% 5.8% 3.9%
Selected items:
Cash paid for capital expenditures - network and other 24$ 31$ 74$ 75$ 205$
58
59
60
61
62
63
64
65
66
67
68
69
70
71
72
73
74
75
Quarter To Date Year To Date
Quarter To Date Year To Date

CONDENSED CONSOLIDATED CASH FLOW INFORMATION (Unaudited)**
(Millions)
12/31/16 12/31/15
Operating activities
Net loss (923)$ (1,441)$
Depreciation and amortization 6,040 5,196
Provision for losses on accounts receivable 406 385
Share-based and long-term incentive compensation expense 57 58
Deferred income tax expense 276 120
Gains from asset dispositions and exchanges (354) -
Amortization of long-term debt premiums, net (234) (236)
Loss on disposal of property, plant and equipment 368 228
Contract terminations 96 -
Other changes in assets and liabilities:
Accounts and notes receivable (542) (1,482)
Inventories and other current assets (2,254) (2,165)
Deferred purchase price from sale of receivables (220) 2,048
Accounts payable and other current liabilities (97) (816)
Non-current assets and liabilities, net (313) 112
Other, net 594 596
Net cash provided by operating activities 2,900 2,603
Investing activities
Capital expenditures - network and other (1,421) (3,958)
Capital expenditures - leased devices (1,530) (1,724)
Expenditures relating to FCC licenses (46) (75)
Change in short-term investments, net (2,349) 125
Proceeds from sales of assets and FCC licenses 126 36
Proceeds from sale-leaseback transaction - 1,136
Other, net 26 (25)
Net cash used in investing activities (5,194) (4,485)
Financing activities
Proceeds from debt and financings 6,830 755
Repayments of debt, financing and capital lease obligations (3,266) (727)
Debt financing costs (272) (1)
Other, net 68 20
Net cash provided by financing activities 3,360 47
Net increase (decrease) in cash and cash equivalents 1,066 (1,835)
Cash and cash equivalents, beginning of period 2,641 4,010
Cash and cash equivalents, end of period 3,707$ 2,175$
RECONCILIATION TO CONSOLIDATED FREE CASH FLOW* (NON-GAAP) (Unaudited)
(Millions)
12/31/16 9/30/16 12/31/15 12/31/16 12/31/15
Net cash provided by operating activities 650$ 1,708$ 806$ 2,900$ 2,603$
Capital expenditures - network and other (478) (470) (994) (1,421) (3,958)
Capital expenditures - leased devices (767) (358) (607) (1,530) (1,724)
Expenditures relating to FCC licenses, net (14) (17) (30) (46) (75)
Proceeds from sales of assets and FCC licenses 60 39 32 126 36
Other investing activities, net 134 (11) (4) 98 (25)
Free cash flow* (9)(415)$ 891$ (797)$ 127$ (3,143)$
Net (repayments) proceeds of device financings and sales of future lease
receivables (231) (184) 1,136 400 1,136
Adjusted free cash flow* (646)$ 707$ 339$ 527$ (2,007)$
**Certain prior period amounts have been reclassified to conform to the current period presentation.
Year to Date
Quarter To Date Year to Date

CONDENSED CONSOLIDATED BALANCE SHEETS (Unaudited)
(Millions)
12/31/16 3/31/16
ASSETS
Current assets
Cash and cash equivalents 3,707$ 2,641$
Short-term investments 2,349 -
Accounts and notes receivable, net 1,236 1,099
Device and accessory inventory 1,296 1,173
Prepaid expenses and other current assets 1,984 1,920
Total current assets 10,572 6,833
Property, plant and equipment, net 19,333 20,297
Goodwill 6,579 6,575
FCC licenses and other 40,556 40,073
Definite-lived intangible assets, net 3,582 4,469
Other assets 673 728
Total assets 81,295$ 78,975$
LIABILITIES AND STOCKHOLDERS' EQUITY
Current liabilities
Accounts payable 2,894$ 2,899$
Accrued expenses and other current liabilities 4,189 4,374
Current portion of long-term debt, financing and capital lease obligations 6,554 4,690
Total current liabilities 13,637 11,963
Long-term debt, financing and capital lease obligations 30,759 29,268
Deferred tax liabilities 14,238 13,959
Other liabilities 3,665 4,002
Total liabilities 62,299 59,192
Stockholders' equity
Common stock 40 40
Treasury shares, at cost - (3)
Paid-in capital 27,694 27,563
Accumulated deficit (8,301) (7,378)
Accumulated other comprehensive loss (437) (439)
Total stockholders' equity 18,996 19,783
Total liabilities and stockholders' equity 81,295$ 78,975$
NET DEBT* (NON-GAAP) (Unaudited)
(Millions)
12/31/16 3/31/16
Total debt 37,313$ 33,958$
Less: Cash and cash equivalents (3,707) (2,641)
Less: Short-term investments (2,349) -
Net debt* 31,257$ 31,317$
54
55
56
57
58
59
60
61
62
63
64
65
66
67
68
69

SCHEDULE OF DEBT (Unaudited)
(Millions)
12/31/16
ISSUER MATURITY PRINCIPAL
Sprint Corporation
7.25% Senior notes due 2021 09/15/2021 2,250$
7.875% Senior notes due 2023 09/15/2023 4,250
7.125% Senior notes due 2024 06/15/2024 2,500
7.625% Senior notes due 2025 02/15/2025 1,500
Sprint Corporation 10,500
Sprint Spectrum Co LLC, Sprint Spectrum Co II LLC and Sprint Spectrum Co III LLC
3.36% Senior secured notes due 2021 09/20/2021 3,500
Sprint Spectrum Co LLC, Sprint Spectrum Co II LLC and Sprint Spectrum Co III LLC 3,500
Sprint Communications, Inc.
Export Development Canada Facility (Tranche 4) 12/15/2017 250
Export Development Canada Facility (Tranche 3) 12/17/2019 300
9.125% Senior notes due 2017 03/01/2017 1,000
8.375% Senior notes due 2017 08/15/2017 1,300
9% Guaranteed notes due 2018 11/15/2018 3,000
7% Guaranteed notes due 2020 03/01/2020 1,000
7% Senior notes due 2020 08/15/2020 1,500
11.5% Senior notes due 2021 11/15/2021 1,000
9.25% Debentures due 2022 04/15/2022 200
6% Senior notes due 2022 11/15/2022 2,280
Sprint Communications, Inc. 11,830
Sprint Capital Corporation
6.9% Senior notes due 2019 05/01/2019 1,729
6.875% Senior notes due 2028 11/15/2028 2,475
8.75% Senior notes due 2032 03/15/2032 2,000
Sprint Capital Corporation 6,204
Clearwire Communications LLC
8.25% Exchangeable notes due 2017 (a) 12/01/2017 629
Clearwire Communications LLC 629
Secured equipment credit facilities 2017 - 2021 586
Financing obligations 2017 - 2021 3,401
Capital leases and other obligations 2017 - 2024 480
Total principal 37,130
Net premiums and debt financing costs 183
Total debt 37,313$
(a) $629 million Clearwire 8.25% Exchangeable Notes due 2040 have both a par call and put in December 2017.
*This table excludes (i) our unsecured revolving bank credit facility, which will expire in 2018 and has no outstanding balance, (ii) $274 million in letters of credit
outstanding under the unsecured revolving bank credit facility, (iii) $480 million of capital leases and other obligations, and (iv) net premiums and debt financing costs.

NOTES TO THE FINANCIAL INFORMATION (Unaudited)
(1) Sprint platform refers to the Sprint network that supports the wireless service we provide through our multiple brands.
(2) Postpaid and prepaid connections from transactions are defined as retail postpaid and prepaid connections acquired from Clearwire in July 2013
who had not deactivated or been recaptured on the Sprint platform.
(3) As more of our customers elect to lease a device rather than purchasing one under our subsidized program, there is a significant positive impact
to EBITDA* and Adjusted EBITDA* from direct channel sales primarily due to the fact the cost of the device is not recorded as cost of products
but rather is depreciated over the customer lease term. Under our device leasing program for the direct channel, devices are transferred from
inventory to property and equipment and the cost of the leased device is recognized as depreciation expense over the customer lease term to an
estimated residual value. The customer payments are recognized as revenue over the term of the lease. Under our subsidized program, the cash
received from the customer for the device is recognized as equipment revenue at the point of sale and the cost of the device is recognized as cost
of products. During the three and nine-month periods ended December 31, 2016, we leased devices through our Sprint direct channels totaling
approximately $1,095 million and $2,281 million, respectively, which would have increased cost of products and reduced EBITDA* if they had
been purchased under our subsidized program. Also, during the three and nine-month periods ended December 31, 2016, the equipment revenue
derived from customers electing to finance their devices through device leasing or installment billing programs in our direct channel was 66% and
67%, respectively.
The impact to EBITDA* and Adjusted EBITDA* resulting from the sale of devices under our installment billing program is generally neutral except
for the impact from the time value of money element related to the imputed interest on the installment receivable.
(4) During the third quarter of fiscal year 2016 and the second quarter of fiscal year 2015, the company recorded losses on dispositions of assets
primarily related to cell site construction and network development costs that are no longer relevant as a result of changes in the company's
network plans. During the second quarter of fiscal year 2016 the company recorded a pre-tax non-cash gain of $354 million related to spectrum
swaps with other carriers.
(5) Severance and exit costs consist of lease exit costs primarily associated with tower and cell sites, access exit costs related to payments that
will continue to be made under the company's backhaul access contracts for which the company will no longer be receiving any economic benefit,
and severance costs associated with reduction in its work force.
(6) Contract terminations primarily relate to the termination of our pre-existing wholesale arrangement with Ntelos Holding Corp.
(7) Litigation and other contingencies consist of unfavorable developments associated with legal as well as federal and state matters such as sales,
use or property taxes.
(8) As a result of the U.S. Cellular asset acquisition, we recorded a liability related to network shut-down costs, which primarily consisted of lease
exit costs, for which we agreed to reimburse U.S. Cellular. During the third quarter of fiscal year 2014, we identified favorable trends in actual
costs and, as a result, reduced the liability resulting in a gain of $41 million. During the first quarter of fiscal year 2015, we revised our estimate
and, as a result, reduced the liability resulting in approximately $20 million of income.
(9) Free cash flow* for the three and nine-month periods ended December 31, 2016, included net cash outflows of approximately $370 million related
to the termination of our MLS Tranche 1 arrangement, which included the repurchase of the devices.

*FINANCIAL MEASURES
*FINANCIAL MEASURES
Sprint provides financial measures determined in accordance with GAAP and adjusted GAAP (non-GAAP). The non-GAAP
financial measures reflect industry conventions, or standard measures of liquidity, profitability or performance commonly
used by the investment community for comparability purposes. These measurements should be considered in addition to,
but not as a substitute for, financial information prepared in accordance with GAAP. We have defined below each of the
non-GAAP measures we use, but these measures may not be synonymous to similar measurement terms used by other
companies.
Sprint provides reconciliations of these non-GAAP measures in its financial reporting. Because Sprint does not predict
special items that might occur in the future, and our forecasts are developed at a level of detail different than that used to
prepare GAAP-based financial measures, Sprint does not provide reconciliations to GAAP of its forward-looking financial
measures.
The measures used in this release include the following:
EBITDA is operating income/(loss) before depreciation and amortization. Adjusted EBITDA is EBITDA excluding severance,
exit costs, and other special items. Adjusted EBITDA Margin represents Adjusted EBITDA divided by non-equipment net
operating revenues for Wireless and Adjusted EBITDA divided by net operating revenues for Wireline. We believe that
Adjusted EBITDA and Adjusted EBITDA Margin provide useful information to investors because they are an indicator of the
strength and performance of our ongoing business operations. While depreciation and amortization are considered
operating costs under GAAP, these expenses primarily represent non-cash current period costs associated with the use of
long-lived tangible and definite-lived intangible assets. Adjusted EBITDA and Adjusted EBITDA Margin are calculations
commonly used as a basis for investors, analysts and credit rating agencies to evaluate and compare the periodic and future
operating performance and value of companies within the telecommunications industry.
Sprint Platform Postpaid ABPA is average billings per account and calculated by dividing postpaid service revenue earned
from postpaid customers plus installment plan billings and lease revenue by the sum of the monthly average number of
postpaid accounts during the period. We believe that ABPA provides useful information to investors, analysts and our
management to evaluate average Sprint platform postpaid customer billings per account as it approximates the expected
cash collections, including installment plan billings and lease revenue, per postpaid account each month.
Sprint Platform Postpaid Phone ABPU is average billings per postpaid phone user and calculated by dividing service
revenue earned from postpaid phone customers plus installment plan billings and lease revenue by the sum of the monthly
average number of postpaid phone connections during the period. We believe that ABPU provides useful information to
investors, analysts and our management to evaluate average Sprint platform postpaid phone customer billings as it
approximates the expected cash collections, including installment plan billings and lease revenue, per postpaid phone user
each month.
Free Cash Flow is the cash provided by operating activities less the cash used in investing activities other than short-term
investments, including changes in restricted cash, if any, and excluding the sale-leaseback of devices. Adjusted Free Cash
Flow is Free Cash Flow plus the proceeds from device financings and sales of future lease receivables, net of repayments.
We believe that Free Cash Flow and Adjusted Free Cash Flow provide useful information to investors, analysts and our
management about the cash generated by our core operations and net proceeds obtained to fund certain leased devices,
respectively, after interest and dividends, if any, and our ability to fund scheduled debt maturities and other financing
activities, including discretionary refinancing and retirement of debt and purchase or sale of investments.
Net Debt is consolidated debt, including current maturities, less cash and cash equivalents, short-term investments and, if
any, restricted cash. We believe that Net Debt provides useful information to investors, analysts and credit rating agencies
about the capacity of the company to reduce the debt load and improve its capital structure.
SAFE
SAFE HARBOR
This release includes “forward-looking statements” within the meaning of the securities laws. The words “may,” “could,”
“should,” “estimate,” “project,” “forecast,” “intend,” “expect,” “anticipate,” “believe,” “target,” “plan”, “outlook,” “providing
guidance,” and similar expressions are intended to identify information that is not historical in nature. All statements that
address operating performance, events or developments that we expect or anticipate will occur in the future — including
statements relating to our network, cost reductions, connections growth, and liquidity; and statements expressing general
views about future operating results — are forward-looking statements. Forward-looking statements are estimates and
projections reflecting management’s judgment based on currently available information and involve a number of risks and
uncertainties that could cause actual results to differ materially from those suggested by the forward-looking statements.
With respect to these forward-looking statements, management has made assumptions regarding, among other things,
the development and deployment of new technologies and services; efficiencies and cost savings of new technologies
and services; customer and network usage; connection growth and retention; service, speed, coverage and quality;
availability of devices; availability of various financings, including any leasing transactions; the timing of various events and
the economic environment. Sprint believes these forward-looking statements are reasonable; however, you should not
place undue reliance on forward-looking statements, which are based on current expectations and speak only as of the
date when made. Sprint undertakes no obligation to publicly update or revise any forward-looking statements, whether as
a result of new information, future events or otherwise, except as required by law. In addition, forward-looking statements
are subject to certain risks and uncertainties that could cause actual results to differ materially from our company's
historical experience and our present expectations or projections. Factors that might cause such differences include, but
are not limited to, those discussed in Sprint Corporation’s Annual Report on Form 10-K for the fiscal year ended March 31,
2016. You should understand that it is not possible to predict or identify all such factors. Consequently, you should not
consider any such list to be a complete set of all potential risks or uncertainties.
About Sprint:
Sprint (NYSE: S) is a communications services company that creates more and better ways to connect its customers to the
things they care about most. Sprint served 59.5 million connections as of December 31, 2016 and is widely recognized for
developing, engineering and deploying innovative technologies, including the first wireless 4G service from a national
carrier in the United States; leading no-contract brands including Virgin Mobile USA, Boost Mobile, and Assurance Wireless;
instant national and international push-to-talk capabilities; and a global Tier 1 Internet backbone. Sprint has been named
to the Dow Jones Sustainability Index (DJSI) North America for the past five years. You can learn more and visit Sprint at
www.sprint.com or www.facebook.com/sprint and www.twitter.com/sprint.