Embed Size (px)
Citation preview

“Big Fish in a Small Pond”: ChineseMigrant Shopkeepers in South Africa
Edwin LinUniversity of California, Berkeley
The steady growth of Chinese migrants to South Africa in the pastdecade provides an opportunity to use Sen’s (2001, Development asFreedom. Oxford: Oxford University Press) capabilities approach inthe field of immigration. This theoretical framing reveals that theChinese employ, what I call, a small pond migration strategy – utiliz-ing mobility to maximize their social, economic, and human capital. Iargue that the Chinese move to South Africa because of a desire toventure out of China and pursue freedoms associated with being one’sown boss. Once in South Africa, they choose to stay because of com-fortable weather and a slower pace of life, despite losing freedomsassociated with high crime in Johannesburg. The findings suggestalternative ways of understanding factors of migration as well as amodel that explains migration from more developed countries to lessdeveloped ones.
INTRODUCTION
If you have not experienced crime or being robbed in South Africa yet, then you haven’t
really (zhen zhen de) lived here! We all accept that this will happen to us eventually.No, money is not good to make here (bu hao zhuan). Look around. It is so quiet, and
it is like this most of the day. How can we make money? Some months, when it is really
bad, we even lose money!
These quotes from recent Chinese migrant shop-keepers in Johan-nesburg, South Africa represent common responses I received when askingabout their daily lives, interactions with South African society, and eco-nomic situations. In 2009, estimates of the Chinese population in Africasat between 580,000 and 820,000. Three years later, that estimate hasincreased to over one million, South Africa being the largest recipient of
© 2014 by the Center for Migration Studies of New York. All rights reserved.DOI: 10.1111/imre.12074
IMR Volume 48 Number 1 (Spring 2014):181–215 181

Chinese migrants with approximately 350,000 Chinese in 2009, and atleast 500,000 in mid-year 2011 (Statistics South Africa, 2011). The mostrecent Chinese migrants are mostly low-educated peasants and unskilledlaborers who come from mainland China to engage in small-scale shop-keeping. Given China’s growing economy, the physical distance betweenChina and South Africa, the striking ethnic differences between Chinesemigrants and the majority of South African citizens, as well as self-expressed difficulties Chinese people face while living in South Africa,why have Chinese people increasingly moved away from a rising worldpower to this poorer and less developed country, and why have theydecided to remain in South Africa upon arrival? In other words, what fac-tors go into the decision-making process of Chinese migrants in SouthAfrica, and what meanings do they ascribe to their mobility decisions?
Standard explanations for migration give us some purchase on thesetwo questions. Economic incentives (Hatten and Williamson, 1998; Masseyet al., 1998) in a globalized world economy (Sassen, 1988, 1998a,b) areimportant, as are established social networks that perpetuate migration(Massey, 1990; Menjivar, 2000). Politically and legally, relative low barriersto entry also help to explain why Chinese migrants choose South Africainstead of a country in the global north (Massey, 1999a,b; Zolberg, 1999).More recent research goes beyond the initial move from home country todestination country often using a quantitative approach to represent themigration decision-making process. These studies consider the economicinvestment involved in migration (Khwaja, 2002), the social networks andcapital in both the place of residence and the place of destination (Albertsand Hazen, 2005; Haug, 2008), and the value of immobility (Fischer, Mar-tin, and Straubhaar, 1997) as important factors in explaining a migrant’sdecision-making process. While these factors are helpful in examining thecase of Chinese migrants in South Africa, they fail to capture the rhetoricalstrategies and meanings that Chinese migrants construct concerning theirmigration to and settlement in South Africa.
The present study applies Sen’s (2001) capabilities approach to thefield of international migration as a framework to uncover the rhetoricalstrategies and meanings Chinese migrants ascribe to their migration expe-rience. This framework gives focus to the perspective of migrants concern-ing their use of mobility as a tool to improve their lives. It contributes toexisting research in two ways: first, the framework acts as a way to bridgethe gap between south–south and south–north immigration research,where currently each subfield sees its phenomena as distinct and separate
182 INTERNATIONAL MIGRATION REVIEW

from one another with little overlap or cross-conversation; and second, itprovides an alternative to using aggregate national statistical data as theprimary way to analyze and explain motivational factors of migration.
Based on in-depth interviews and participant observation in Johan-nesburg, I find that in addition to those factors isolated by traditional the-ories of migration, recent Chinese immigrants decide to come to SouthAfrica to gain life experience (adventuring outside of China) and to seekout the possibility of attaining self-employment (becoming their ownboss). Results reveal that the Chinese migrants who choose to stay inSouth Africa do so because they want to continue to pursue their dreamof self-employment and because they experience a more comfortable lifedue to a slower paced living, better weather, and a cleaner environment.These less tangible factors are important freedoms and capabilities thatnot only help explain the migration pattern between China and SouthAfrica, but also serve to make more complete existing migration theory.Although the conditions in South Africa, especially well-documentedproblems with crime (SAPS Strategic Management, 2013), lead to Chi-nese migrants forfeiting certain freedoms (such as going out at night),results show that migrants adapt and adjust, and those who remain choosethe possibility of saving up money and becoming one’s own boss over thefreedoms they forfeit. In the end, while existing literature provides statisti-cally generalizable data on social and economic factors that affect migrantdecision-making, the case of Chinese migrants in South Africa reveals anadditional factor: the migrant’s own understanding of his or her mobilityas a strategy for improving his or her life. Migrants are people with indi-vidual agency and to thoroughly explain their behavior in choosing oneliving space over another, one must account for the stories they tell abouthow and why they made their decision. In the specific case of Chinesemigrants in South Africa, migrants knowingly and deliberately search outpoorer towns and regions so that they can take advantage of more favor-able economic situations and maximize their social, economic, and humancapital. I refer to this migration strategy as ‘small pond migration,’ basedupon the American idiom, “big fish in a small pond.”
BACKGROUND
In the past decade, Chinese migration has grown quickly to become increas-ingly commonplace all throughout China. According to the most recentdata, internal migration primarily to coastal provinces has exploded to the
CHINESE MIGRANT SHOPKEEPERS IN SOUTH AFRICA 183

point where China has a third of all internal migrants in the world, and thenumber of rural Chinese migrants working away from home has reached160 million or 12 percent of the country’s population (Chan, 2012). Thisgrowing floating Chinese population has translated to overseas migration aswell. While Chinese emigration to Southeast Asia has slowed, destinationssuch as Europe and Africa are experiencing significant increases in Chineseimmigration (Skeldon, 2011). In the case of Europe, Chinese emigrants areless skilled than those going to older and more traditional destinationregions such as North America or Australasia. These immigrants work inthe European trade or manufacturing sector (Skeldon, 2011). With Chinabecoming Africa’s leading trade partner, Chinese immigration to the conti-nent has also increased (Politzer, 2008). Estimates of Chinese in Africarange from 580,000 to over 800,000 with the overwhelming majority ofChinese found in South Africa (Park, 2009a,b). Chinese immigrants toAfrica can be divided into four categories: temporary labor migration linkedto Chinese development and investment in Africa, small-time entrepreneurs,in-transit migrants, and agricultural workers (Politzer, 2008). The largestgroup of Chinese immigrants in Africa is made up of temporary labormigrants who utilize private employment agencies who provide migrantswith proper visa and travel documents to work in construction or othermanual labor (Park, 2009a,b).
While Chinese labor migration is a major trend in recent Chineseemigration around the world, Africa is seeing an increase in its secondlargest group of Chinese immigrants: small-time entrepreneurs. Thesemigrants were not entrepreneurs in China, but upon migrating, beganengaging in entrepreneurial activity. ‘China shops’ import cheap but qual-ity Chinese goods and sell them to the local population – everything fromclothing to travel accessories, from everyday household appliances to toysand games for children (Park, 2009a,b). The establishment of these Chi-nese shops in Africa has snowballed creating more demand for Chineseimmigrant labor because shop owners prefer to trust their business withfamily and friend networks rather than local labor (Østbø and Carling,2005; Ma Mung, 2008).
South Africa has had several waves of Chinese immigrants through-out its history, waves which can be broken down into three groups: Chi-nese South Africans whose families came as early as 1900 (approximately10,000), Taiwanese South Africans who set up businesses in the 1970sand 80s (approximately 6,000), and new Chinese migrants who camefrom the People’s Republic of China since the 1990s (over 500,000; Park,
184 INTERNATIONAL MIGRATION REVIEW
2009a,b). This paper focuses on the largest group of Chinese South Afri-can immigrants – the mainland immigrants who have arrived in the pasttwo decades. This group is predominantly formed by small-scale entrepre-neurs from mainland China who set up Chinese shops importing Chi-nese-made goods (Huynh, Park, and Chen, 2010).
Of the most recent group of migrants, the majority live in Johannes-burg, an economic hub for all of southern Africa. Due to the rapidly increas-ing saturation of Chinese shopkeepers in Johannesburg, however, this thirdwave has begun to move out to more rural areas and neighboring provinces(Park, 2009a,b). Chinese small-scale entrepreneurs can be further subdi-vided into three categories: the first-movers who emigrated in the early1990s, immigrants who came during the mid- to late-1990s from businessconnections with Taiwanese factories, and traders and peasants who startedmoving in the late-1990s and are now increasingly coming from all overChina (Park, 2009a,b). The first-movers have had large success in establish-ing wholesale businesses and importing goods from China. Large wholesalebusinesses are mostly found in Johannesburg, which has over ten Chinesewholesale centers with hundreds of Chinese wholesale stalls (Park, 2009a,b),but new wholesale distribution centers have recently opened in both CapeTown and Durban, two major coastal cities in South Africa, as well asBloemfontein, located in the rural center of South Africa. Many of thesefirst-mover entrepreneurs have either returned to China or migrated to moredeveloped countries, employing a step-wise migration strategy (Paul, 2011).Immigrants in the second group from the 1990s have built extensive busi-ness networks and have become involved in industries such as mining, man-ufacturing, and property development, as well as expanding wholesale andimporting to neighboring countries in southern Africa (Park, 2009a,b). Thefinal group of ongoing migrants is the largest and has spread throughoutSouth Africa, searching for holes in the retail and wholesale market wheretheir small shops can survive (Park, 2009a,b). Many of these migrants cometo South Africa through family and friends who sponsor them and providework visas for their stay in South Africa. This paper focuses on this last andlargest group of ongoing Chinese migrants to South Africa.
THEORETICAL FRAMING
Current theories of migration act as a starting point for framing the caseof Chinese migration to South Africa. Existing models focus on three setsof factors: economic, social, and political. Economic models focus on
CHINESE MIGRANT SHOPKEEPERS IN SOUTH AFRICA 185
individuals and wages (Hatten and Williamson, 1998), household riskminimization (Massey et al., 1998), entrepreneurship (Waldinger et al.,1990), economic investment in the act of migration (Khwaja, 2002), anda bifurcated labor market (Sassen, 1998a,b). Sassen, in particular, providesa political–economic model that emphasizes capital venture flows and his-torical connections (Sassen, 1988, 1998a,b). Social models pay specialattention to social capital and social ties (Menjivar, 2000), social networksin the country of origin and country of destination (Alberts and Hazen,2005; Haug, 2008), and how networks snowball and accelerate migrationflows (Massey, 1999a,b). Finally, political and legal constraints can chan-nel migration by making some destinations more difficult or easier toenter than others, influencing the countries’ migrants target (Massey,1999a,b; Zolberg, 1999; Torpey, 2000). These migration models providea strong foundation for knowing what factors to test when attempting toexplain existing migration patterns. A limitation of existing theories ofmigration, however, is the relative absence of the measures of migrants’understanding of their migration decisions, plans, and experience. In thispaper, I argue that additional information concerning how migrants inter-pret and understand their experience will increase the analytic power ofperspectives on international migration.
Of all existing frameworks, social network theory provides the mostpurchase on explaining Chinese South African migration because of itsattention to the importance of social ties. Social network analysis focuseson seeing people as nodal points connected to one another and analyzingthe effects of these relationships (Scott, 2013). In the field of immigration,this has taken the form of research on social ties, social capital, and socialembeddedness (Portes and Sensenbrenner, 1993; Menjivar, 2000). Socialnetworks decrease the barriers to entry and the costs of migration for newimmigrants arriving in the destination country. When it comes to entre-preneurship, social networks help migrants start businesses by loweringthe entry barriers for small-scale entrepreneurs (Waldinger et al., 1990).While this paper does not use a network analysis of Chinese immigrantsin South Africa, it does draw on the importance of social ties in helpingChinese migrants have an easier time migrating to South Africa and estab-lishing their small businesses. As suggested above, however, social networktheory is limited in its emphasis on the perspective of migrants and howmigrants understand and ascribe meaning to their decision to migrate.This perspective sheds light on why Chinese migrants chose specifically
186 INTERNATIONAL MIGRATION REVIEW

social networks in South Africa rather than choosing to utilize other net-works they have around the world.
Much South to south migration research focuses on instances offorced migration, wage labor migration, and seasonal labor migration (seefor example Yang, 2003; Ratha and Shaw, 2007a,b; Bakewell, 2009; Rim-mer, 2009), but Chinese migration to South Africa is none of these. Ingeneral, three of the largest factors found to determine south–south migra-tion are proximity, social networks, and income (Ratha and Shaw, 2007a,b). With proximity, while 80 percent of all south–south migration hap-pens between countries that share a border (Ratha and Shaw, 2007a,b),China is nearly halfway around the world from South Africa, resulting inpresumably higher migration costs than migration between borderingcountries. Available data indicates that excluding cases related to thebreakup of the Soviet Union, only 19 percent of south to south migrantsmove from a country with higher overall income to a country with lowerincome, an indeterminate portion of these migrants being refugees andasylum seekers (Ratha and Shaw, 2007a,b). The movement from Chinato South Africa falls within this 19 percent.
Sen’s, 1993 capabilities approach for development, when applied tomigration theory, provides a useful framework for understanding the caseof Chinese migrants in South Africa, as well as migrants’ decision-makingprocess in general. In his book Development as Freedom, Sen (2001) showsthat the end goal of development has always been increasing the individ-ual’s capability to live a better life. Development should not be confinedto national projects enhancing infrastructure or employing fiscal and mon-etary policies to generate higher gross national product. Instead, develop-ment should be defined to include any action where the end goal is toincrease the capabilities, freedoms, and choices that individuals have tolive the way they want to live. In other words, Sen provides an alternativeview that sees increasing political freedoms, economic facilities, and socialopportunities all as important parts of development, a process which is sit-uated in individuals’ ability to pursue better lives (Sen, 2001:36–40).
Sen defines these capabilities as “a kind of freedom: the substantivefreedom to achieve…various lifestyles” (Sen, 2001:75). A capability set,then, is all the choices and potential life trajectories from which an indi-vidual can choose, and Sen’s capabilities approach seeks to evaluate notonly what life path the individual takes but also what potential optionsthe individual has open to him or her. Sen also recognizes that in manycases development projects may empirically result in increasing one set of
CHINESE MIGRANT SHOPKEEPERS IN SOUTH AFRICA 187

capabilities at the expense of another (i.e., suspending rights to promote atransition to capitalism); however, he contends that, in theory and ideally,all capabilities can increase together, making democratic and education-based development the most ideal development path. Applying this devel-opment approach to immigration means holding two key tenets as foun-dational to understanding international migration: (1) migrants moveprimarily to improve their capabilities sets (migration as a strategy toincrease freedoms); and (2) mobility is one of the best and most effectiveways to quickly and fundamentally change one’s capability sets (mobilityas a development strategy).
This analytic approach provides a more fruitful theoretical frame forunderstanding migration patterns by pushing migration theory beyondeconomistic explanatory factors and toward a narrative approach thatunderstands the migrant’s experience as a journey of increasing one’s free-doms. Explanatory factors for migration are complex and multiple, almostalways including some level of trade off, where the migrant loses somecapabilities to gain others. Narrative data complement more objective-based approaches to explain motivations for migration by identifyingmore clearly which freedoms migrants seek to increase through migration.
One of the problems with a narrative approach, especially when theperson is speaking about oneself, is that the data are inherently subjective.While this might be considered a weakness in measurement within thenarrative framework, it is, at the same time, its strength; narratives are ouraccess point to the rhetorical strategies and meanings that the migrantsthemselves attach to their mobility. Because migrant narratives are inevita-bly told after the fact, it is always possible that the reports are alteredbecause of memory and the passage of time. But this does not undercutthe importance of narrative data revealing factors of migration, sincemigrants’ evolving understanding of their own migration experiencesinfluences their future decisions regarding mobility (Roth, 1989; Richard-son, 1990; Vandsemb, 1995; Czarniawska, 2004).
The approach I outline here builds on complementary argumentsabout capabilities in subfields that focus on small-scale migrant entrepre-neurship, ethnic enclaves, and remittances, as well as scholarship docu-menting more deliberate mobility strategies. For example, whenexplaining Filipino migration to the Gulf States and Singapore, Paul(2011) elaborates on the idea of stepwise migration, where migrants moveto stepping stone countries as a way to accrue capital with the ultimategoal of moving to countries in the developed world. This serves as one
188 INTERNATIONAL MIGRATION REVIEW

example of how migrants utilize mobility strategically to improve theircapabilities. Unlike the Filipinos that Paul studied, however, Chinesemigrants to South Africa do not use a stepwise migration strategy, butinstead employ almost the opposite, what I call a “small pond” migrationstrategy.
The American idiom, “A big fish in a small pond,” is used todescribe a person who is important only because he or she is situated in asmall sphere of influence. If one were to take this “big fish” and place itin the ocean, it would cease to have much importance, because it is notreally that big a fish, and the ocean is vast. To take the idiom in theopposite direction, if a medium-sized fish in a large pond moves to asmaller pond, it will no longer have to compete with the bigger fish fromits original pond and now has the chance of becoming the biggest fisharound. If someone wants to become a “big fish,” he or she doesn’t actu-ally have to grow bigger; he or she can just move to a smaller pond.
The small pond migration strategy is where migrants move from amore developed place to a lesser developed country or region to take advantageof characteristics of the receiving place, which effectively increase their existingsocial, economic, and human capital. Through the use of small pond migra-tion, Chinese migrants who move to South Africa experience an almostimmediate increase in the utility of their capital, which translates intomore freedoms. Unlike stepwise migration (Paul, 2011), where themigrant focuses on moving to a more developed place, in small pondmigration, migrants focus on advancing their socioeconomic status, movingto areas where they can maximize the effectiveness of their existing capital.When Chinese migrants explain their choice to move, the fact that SouthAfrica is less developed is the very reason for wanting to go there. Thisway of thinking is exhibited in a Chinese proverb that parallels the “bigfish in a small pond” idiom: shan zhong wu lao hu, hou zi cheng da wang.This proverb means, “In a mountain with no tigers, the monkey becomesking.” While the English idiom holds a derogatory connotation that a bigfish in a small pond is still unimportant, the Chinese proverb has theopposite connotation and praises the monkey for taking advantage of themountain’s lack of tigers.
Using a capabilities approach to understand a migrant’s decision-making process reveals that Chinese migrants in South Africa employ asmall pond migration strategy which helps explain both why they come toSouth Africa and why, for those who stay, they choose to remain in SouthAfrica. Traditional and quantitative approaches are simply unable to
CHINESE MIGRANT SHOPKEEPERS IN SOUTH AFRICA 189

account for the importance and effect of such a mentality. Therefore,while social network theories, economic frameworks, and decision-makingmodels provide the groundwork for understanding why Chinese migrateto and choose to remain in South Africa, I argue that, on examining theindividual’s own narrative about the freedoms they gain from moving, anadditional and important factor that helps explain the peculiarities of thiscase is revealed.
METHOD
To understand the narrative of Chinese migrants in South Africa, I spenta total of 6 months in South Africa conducting in-depth interviews andparticipant observation in three major cities: Johannesburg, Durban, andBloemfontein. These locations were selected for their diversity and repre-sentativeness of the various Chinese communities in South Africa. Johan-nesburg has the largest Chinese population in South Africa with a well-developed Chinese retail and wholesale sector (Park, 2008). Durban hasrecently expanded in its Chinese retail and wholesale centers serving thesoutheast regions of South Africa. Finally, Bloemfontein is a major ruralhub for the South Africa heartland where Taiwanese and Chinesemigrants who do business in Lesotho reside. Prior to this 6-monthresearch endeavor, five summer trips were made spread out across 7 years(since 2006) to work with the Chinese community in South Africa. Thesetrips included academic projects, such as working with the University ofWitwatersrand as a research intern, and more informal interactions, suchas working with Chinese missionaries and churches, while learning aboutthe Chinese community through immersion and regular interaction.While this paper does not explicitly draw on these experiences, theresearch does utilize previously established relationships with the Chinesein South Africa to gain access to the community. Rather than startingfrom scratch, I was able to quickly immerse myself in the Chinese shop-keeping community and so take advantage of a full 6 months of research.
This article primarily focuses on data from 3 months spent inJohannesburg. Most of the respondents from the other two field sites,Durban and Bloemfontein, were from a province in southeast China(Fujian Province) and have a distinct community and culture often sepa-rate from other Chinese migrants in South Africa. As a result, theyascribed different meanings to their mobility than the other mainlandChinese migrants in Johannesburg. Because of limited space, I focus on
190 INTERNATIONAL MIGRATION REVIEW
this latter group who has increasingly moved to Johannesburg over thelast decade to participate in the vibrant retail and wholesale market.Twenty four formal in-depth interviews were conducted while spendingseveral hours a day at six different Chinese retail/wholesale malls acrossthe city, casually talking and interacting with Chinese shopkeepers. In twoother cities, Durban and Bloemfontein, an additional 18 in-depth inter-views were gathered and several hours a week were spent conducting par-ticipant observation in Chinese malls and Chinese churches. Although theinterviews and observations drawn on for this paper come from Johannes-burg, data from Durban and Bloemfontein generally supported the find-ings discussed here. I choose not to rely heavily on data from Durban andBloemfontein because I am unable to discuss the nuances and differencesbetween these cities in the limited space provided.
Through the use of in-depth interviewing and participant observa-tion, a deep narrative of the lives of Chinese migrants was obtained andinsight into their perspective on their life decisions became clear, especiallythose regarding migration. Interviews were conducted with people fromthe most recent group of Chinese immigrants, as defined by Park (2009a,b), those who have arrived in South Africa over the last decade with thegoal of becoming self-employed small-scale shopkeepers. I chose to focuson recent Chinese shopkeepers because they represent the largest growinggroup of Chinese people in South Africa.
The city and suburbs of Johannesburg are the largest receiving areaof incoming Chinese migrants to South Africa. With two Chinatowns,Johannesburg’s Chinese communities are the most established in terms ofhistory, growth, and social connections. The city itself is a major businesshub for the entire region of southern Africa, making it an ideal place toconduct wholesale businesses. Many of the earlier arriving Chinesemigrants set up successful wholesale businesses in Johannesburg. The morerecent migrants go to Johannesburg in part because they have social con-nections with these earlier arrivers. Because the more recent arriving Chi-nese are unable to set up equally successful wholesale businesses, mosthave gone into retail shops that also provide for some smaller and morelocal wholesale customers.
Before locating sites for in-depth interviewing and participant obser-vation, a geographical profile of the city was created, identifying key Chi-nese shopping areas, living spaces, and social communities. This was donenot only as a way to understand the Chinese community in Johannesburg,but also as a way to ensure that the research covered the diversity of
CHINESE MIGRANT SHOPKEEPERS IN SOUTH AFRICA 191

different Chinese migrants in Johannesburg. Because Chinese migrantshave different experiences depending on when they arrived in South Africaand from what parts of China they came from, shopping centers chosenfor research needed to be diverse (from upscale to rundown and fromnewly opened to well-established), increasing the odds of interacting withdifferent Chinese migrants arriving in South Africa at different times fromdifferent places. Ultimately, twelve shopping areas were identified. Theseshopping areas came in many forms including massive warehouses, whereeach storeroom was converted into a wholesale shop; local indoor shop-ping malls redeveloped to showcase at least 70 percent Chinese-ownedshops, indoor flea market-like malls with anywhere from two- to fourhundred stalls, and a new Chinatown which consisted of one street span-ning five large blocks with street vendors, outdoor markets, indoor restau-rants and entertainment, an assortment of small convenience stores, andother service shops, like hair salons and doctor’s offices.
Once these Chinese communities were identified, I started spendingtime in each of these locations and speaking informally to some Chineseshopkeepers to develop a profile of each area, including the extent ofwholesale versus retail shops, the year the place first opened, and an esti-mate of the amount of business that came through. Five Chinese mallswere selected covering the full range of different Chinese shopping spaces,especially in terms of length of time opened, size of the mall, and amountof customer traffic. This was done to ensure that the research would notresult in bias where all the respondents were only representative of a sub-group of Chinese shopkeepers (such as only those who arrived early andwere successful or only those who arrived recently and have struggled).Variation in Chinese shopping scene was sought to obtain a broad repre-sentation over the entire Chinese shop-keeping population in Johannes-burg.
To maximize representativeness and minimize selection bias, shopsin each shopping center were randomly sampled using stall numbers anda random number generator. I conducted interviews in the morning,when the stalls first opened and customer traffic was still low, to maximizemy response rate. All interviews were conducted in Mandarin, and mostwere recorded.1 I, being of Chinese heritage, many shopkeepers were open
1Of the 24 interviewees, six respondents requested not to be recorded. Interviews were onaverage 35 min and conducted while the respondents were watching their shops. Because
these interviews were done in the morning, there were few interruptions.
192 INTERNATIONAL MIGRATION REVIEW

toward me, and because I also conducted participant observation in theChinese malls, other shopkeepers noticed me talking with their neighborsand so felt comfortable engaging with me in an in-depth interview. Overtwo-thirds of all migrants asked for an interview agreed to participate insome capacity. Because some conversations were interrupted and did notlast long (<15 min), they were excluded from the final total of 24 in-depth interviews. In accordance with a narrative approach that seeks tounderstand the thought process behind migrants’ decision-making, inter-view questions focused on encouraging respondents to tell stories abouttheir experience of life in China, their decision to move to South Africa,and their experience of South Africa so far. This would help get at thesalient issues for Chinese migrants and as to why they chose to migrate,without explicitly asking the question.
In addition to asking migrants to compare their lives before andafter migration, interviews explicitly asked them to evaluate different capa-bilities and freedoms to see whether any of them added value to theirmigration experience. Based on Sen’s capabilities approach (2001) and theway it has been operationalized in past research (Nussbaum, 2000; Sen,2005; Klasen, 2006; Anand, Santos, and Smith, 2009), I asked abouttheir daily work environment, their social life, their interactions withmigrants and local South Africans, their knowledge and experience ofpolitical freedoms, their health and access to health services, their accessto any government services, and their experience of gender or racial dis-crimination. Interviews also asked open-ended questions about the bestand worst parts of living in South Africa and living in China. Thisallowed respondents to talk more about whatever they felt was mostimportant in their decision-making process and provided a space for therespondents to verbalize any other capabilities that my questions may nothave brought up. Finally, interviews covered migrants’ future plans –whether they planned to move back to China, stay in South Africa, ormove somewhere else. This was to further interrogate their way of under-standing mobility and how they employed it as a tool to improve theirlives. I would sometimes revisit interviewees and have follow-up conversa-tions with them, although these conversations were not recorded.
Of the 24 interviewees, ten arrived in South Africa within the last3 years, seven arrived between 3 and 8 years ago, and seven respondentshave been in South Africa for more than 8 years. Twelve males and 12females were interviewed ranging in age from 19 to 55, with four respon-dents between 19 and 29, eight respondents in their 30s, nine respondents
CHINESE MIGRANT SHOPKEEPERS IN SOUTH AFRICA 193

in their 40s, and three respondents over 50. Twelve interviewees had somehigh school or only middle school education, nine interviewees had com-pleted high school, and three interviewees had some form of higher educa-tion, either a university degree or attended technical school. All but twoof my respondents came from coastal provinces in China. These provinceswere fairly evenly distributed all along the eastern coast of China, fromLiaoning in the north, to Guangdong in the south. Table 1 summarizesthe social demographic information of Johannesburg respondents.
Interview data was analyzed not only in terms of the respondentsand their characteristics, but more importantly, in terms of their responsesto the key questions discussed above. After translating all the interviews,each interview was reviewed and coded so that each respondent’s answerto key questions could be categorized and sorted. Once all the interviewswere coded, I looked for patterns among the responses to key questions tosee how often respondents brought up certain themes. I then went backto read through the interview transcripts to get a sense at the nuances ofthese patterned responses. Although the stories of each respondent weredifferent, the experiences and salient issues for Chinese migrants were sim-ilar. Quotes selected in this article were based on commonly held patternsthat emerged from the interview data based on the approach to analysisdescribed above.
The participant observation portion of my research design focusedon understanding not only the way migrants conducted business in SouthAfrica, but also Chinese social life in Johannesburg. Beyond the shopping
TABLE 1DEMOGRAPHIC INFORMATION OF JOHANNESBURG INTERVIEWEES
# Of Respondents % Of All Respondents
GenderMale 12 50.00Female 12 50.00
Number of Years in South Africa<3 10 41.673–8 7 29.17More Than 8 7 29.17
Ages19–29 4 16.6730–39 8 33.3340–49 9 37.50Over 50 3 12.50
EducationSome High School or Lower 12 50.00Completed High School 9 37.50Post-High School 3 12.50
194 INTERNATIONAL MIGRATION REVIEW

areas, days were spent observing and interacting with Chinese people inChinatown, eating with local Chinese at hot pot restaurants and shoppingin their markets. In part because of my Chinese heritage and ability tospeak Mandarin, a rapport was quickly established with Chinese shop-keepers. In some cases, my previous involvement with the Chinese SouthAfrican community and Chinese churches enabled me to hear storiesabout shopkeepers through personal connections with members of thechurch.2 To avoid bias, however, I never interviewed anyone known per-sonally or who knew me personally from my previous communityinvolvement – as stated above, the interviews were gathered through asampling process that was kept as random as possible. But these connec-tions provided unique insight into the Chinese shop-keeping community.In the shopping malls, social interactions were observed between shop-keepers, and participation took the form of helping out with some of myinterviewees’ shops by translating from English to Chinese, watching theshop while they ran errands, or moving boxes and stock. Through partici-pant observation, I engaged in many smaller conversations with shopkeep-ers and asked similar questions as in my interviews. These conversationswere often in a small group context, and it was helpful to gain group per-spectives on various interview topics.
FINDINGS: CHOOSING SOUTH AFRICA AS THEIRDESTINATION
Common Explanatory Factors for Migration
Factors long associated with migration, especially income differentials,social networks, and lower barriers to entry, play an important role inencouraging Chinese migrants to move to South Africa. In terms of socialnetworks, relationships with family, relatives and friends helped lower thebarriers to entering South Africa. When asked how they decided on SouthAfrica and what other places they had considered, all but one respondentsaid they based their choice on having family and friends in South Africa.When generally discussing where they might go next, migrants frequentlysaid they needed a relative or friend to already be in the potential destina-
2Because shopkeepers worked every day of the week, church activities held at night in Chi-nese shopkeepers’ homes were one of the only social organizations and communities that
Chinese migrants could engaged in outside of work.
CHINESE MIGRANT SHOPKEEPERS IN SOUTH AFRICA 195

tion. A 24-year-old young man who came to Johannesburg from Fujianprovince reported, “I would go to Cape Town to do business there. Itseems nice and it’s supposed to be safe, but I have no opportunity there.Yes, thinking about going is just thinking about going (xiang shi xiang),but if you don’t know anyone there, how can you go?” This response,delivered as if it were an obvious fact, was typical of the way migrantstalked about their decisions of where to move. A few migrants had theoption to go places other than South Africa when they decided to leaveChina – places including Argentina, the United States, Canada, and Swit-zerland. They had relatives in all these places (in some cases, more rela-tives than in South Africa), but in the end, they chose South Africabecause it was cheaper not only to fly there but to live there as well. Acombination of their global social network and the costs of migration lim-ited the array of potential places the Chinese migrants could move. How-ever, while social networks lowered the barriers of entry and narrowed theoptions of Chinese migrants, just having friends or family in a foreigncountry was never stated as a sufficient reason for moving. Once migrantsdecided they wanted to move already, their social networks helped makeit possible.
Income differences between China and South Africa, although expe-rientially small for most Chinese migrants, seemed to be an enticement tomove to South Africa. When asked about how much respondents earnedin China, the reported average income per month was around 1,250RMB (about $200), ranging from 800 RMB a month to 2,500 RMB amonth. On the other hand, migrants’ experience of making money inSouth Africa varied considerably depending on date of arrival. All thosewho had arrived over 10 years ago stated that making money was easyand were now living comfortable, if not rich, lives. Chinese migrants whoarrived more recently talked about it being a little easier to make moneyin South Africa, but did not rave about income increases. All those whoarrived over the past 2 years said they were not making any much moremoney than they already had been making in China – some were makingless, and some were even losing money. However, the majority ofmigrants did say that, before deciding to come, they had heard it was easyto make money in South Africa. The evidence suggests that perceivedincome differences matter, even though the migrants’ actual experiences ofincome improvements are marginal, especially for recent migrants.
In terms of push factors for migration, the migrants’ narratives didnot point to many problems happening in China that forced respondents
196 INTERNATIONAL MIGRATION REVIEW

out. Indeed, many migrants denied such motivations. Asked what prob-lems in China made them feel like they should leave, many migrantsimmediately responded that there were no problems in China. “No, no,it’s nothing like that. There’s no problem with living in China,” said onemiddle-aged woman who had lived in South Africa for 2 years. In severalinterviews, respondents elaborated that they merely saw an opportunity totravel outside of China and decided to try it out, emphasizing that it wastheir free choice to leave China. Of the minority of respondents who didmention problems in China, the main problem articulated was the com-petition and pace of life in China. One 32-year-old man who lived inSouth Africa for 8 years said, “I feel like China’s lifestyle was too compli-cated and chaotic (fu za). When I came to South Africa, I felt like thelifestyle here is very peaceful (ping an).” Importantly, China’s complicatedlifestyle was not a push factor for this respondent, because he did not real-ize how chaotic things were in China until after arriving in South Africa.
Besides a chaotic lifestyle, some respondents discussed high livingcosts and the inability to save money as being issues in China. Theserespondents mentioned a lack of economic opportunities opened to themsaying, “In China, there are economic opportunities, but not for those ofus who are uneducated, like me.” However, when casually talking to Chi-nese shopkeepers, most said it was not a major problem. “Yes, if we needto survive and continue living in China, it’s fine,” said a woman with4 years of residence in South Africa. A woman next to her elaborated,“This is not really a big problem, because you can definitely find a joband live in China, but if we’re only making 2,000 a month, after foodcosts, living costs, car, phone, we end up with so little left that we can’treally develop (fa zhan).” The desire to leave China, then, focused not somuch on the inability to find a job – they did not feel that somethingwas necessarily pushing them out of China – but a desire to save upmoney so that they could find opportunities to improve and “develop(fa zhan)” their life.
Adventuring Out
Social networks, barriers to entry, and income differences play a role inexplaining Chinese migration to South Africa, but although these are themost common factors usually used to explain migration, they were notthe most common self-identified reasons Chinese migrants gave for com-ing to South Africa. Instead, respondents emphasized factors that are
CHINESE MIGRANT SHOPKEEPERS IN SOUTH AFRICA 197

impossible to quantitate: the desire for adventure and exploration outsideof China, the goal of being one’s own boss, and, for some, the enjoyableSouth African lifestyle that motivates Chinese migrants to stay in spite ofhardships. One interesting aspect about the narrative data I collected wasthe surprising commonality of the responses. Once research moves awayfrom quantifiable data and starts investigating individual desires and moti-vations, one would expect the great variety in migrants’ backgrounds, per-sonalities, and circumstances to produce an equally wide variety ofexplanations for why they chose to move. However, in my interviews andparticipant observations, I found that these three highly subjective desires– for adventure, for self-employment, and for a comfortable lifestyle –were nonetheless mentioned over and over again without any promptingas migrants described their decision-making processes.
The desire to explore abroad (guo wai) serves as a starting point thatmotivated many Chinese migrants to take the opportunity to go to SouthAfrica when it presented itself. One of the most surprising discoveries in myinterviews and participant observation was how Chinese migrants had sucha positive feeling about traveling abroad. When asked why they wanted tocome to South Africa, 22 out of the 24 interview respondents mentioned,to some degree, the idea that they had never been outside China, and sothey could not refuse the opportunity when it came. One young man fromFujian Province told me that “in China, at least where I am from, I feel likeeveryone has a picture of guo wai as very ideal and wonderfully beautiful(wan mei). So if you are not really poor and have the opportunity to goabroad, of course you will take it!” At first, I thought this view was specificto the Fujian Province, where because of a long history of established portsand outside influence, they would have a particularly positive view of guowai (Pieke and Mallee, 1999; Chu, 2010). I quickly discovered, however,that even those in the Liaoning Province in northeast China had a similarview. The language Chinese migrants used to describe this desire for adven-ture and exploration not only centered around a feeling that things outsideof China were simply better, but also that while they were still young, theyshould “have a look and try things out” (shi shi kan and chuang chuang),implying that going on the journey itself, even if things did not work out intheir favor, was in itself beneficial.
This resonates with Fong’s (2011) finding that Chinese studentswant to study abroad so that they can gain access to capabilities generallyopen only to those in developed countries. Unlike Fong’s college students,however, Chinese migrants in South Africa were not fixated on going to a
198 INTERNATIONAL MIGRATION REVIEW

developed country and admitted that, in many ways (especially crime,governance, and infrastructure) South Africa was far less developed thanChina. Instead, the very act of exercising and experiencing the freedom totravel abroad anywhere seemed to be reason enough for them to adven-ture out. Being able to prove that they could indeed leave China was seenas a privilege not openly accessible to all, and in some ways this in itselfwas an increase in their capability sets.
Being One’s Own Boss
Hearing about the success of migrants in South Africa helps draw somemore economically minded migrants to South Africa, but the main eco-nomic motivation is not just making more money but specifically aboutentering a new social class, one in which the migrant is not working forothers but working for him- or herself. Being one’s own boss was a highlyvalued goal of Chinese immigrants in South Africa. Migrants discussedtheir economic motivations not simply as a journey to earn more moneyand go where the money was good. Instead, they described their journeywith a distinct goal of saving up money so that they could open theirown shop/stall. After a few days with one migrant, he explained why heplanned to open his own shop saying, “You can choose how hard youwant to work. Some people are really ambitious and they want to openup five shops, one in every mall! If you want to work that hard, you can.But if you are satisfied with just one or two shops, then you probablydon’t have to work as hard… If you are successful, you can just hire peo-ple to work in your shop, and so you can really have freedom to dothings you enjoy.” Of the 16 respondents in Johannesburg who did notown their own shop, only one interviewee did not plan to open his ownshop.3 The dream to become self-employed helps explain why eventhough income differences between China and South Africa were low, thesmall differential was enough to entice migrants to come because the costof opening up a shop in South Africa was also low, making the risk alsolower. So even though Chinese migrants would not be earning very muchmore, they knew it would still be possible for them to save up over a fewyears and open their own shop.
3He said it was because he did not mind working for other people and because, withincreasing market saturation in Johannesburg, he was unsure that opening his own store
would be profitable.
CHINESE MIGRANT SHOPKEEPERS IN SOUTH AFRICA 199

The dream of becoming one’s own boss was one of the central fac-tors encouraging Chinese migrants to come to South Africa. Chineseshopkeepers indicated that they knew nothing about the South AfricanChinese community, geography, weather, culture, and history beforedeciding to go to South Africa. One of the two things that Chinesemigrants knew about South Africa prior to migrating was the country’sChinese shop-keeping scene (the other common response being about thecountry’s crime, which I discuss later in the next section). They had heardstories about how easy it would be to set up their own shop from earlierarriving Chinese migrants who had experienced massive success in theJohannesburg wholesale industry. Their decision to choose to go to SouthAfrica reflects some basic self-awareness of a small pond migration strat-egy. When migrants had the option to go to other countries more devel-oped than South Africa, they ended up in Johannesburg because theybelieved they could take advantage of the “smaller pond” and achieve eco-nomic freedom in the form of self-employment. One young man at theage of 25 had the option of going to meet his uncle in Greece but said,“If I went there, it would cost me most of my savings just to fly there!Plus, my uncle told me roughly what the monthly living expenses werelike… if I go there, I will be stuck working for him forever. South Africais much cheaper and I can save money and open my own store here.”
One Chinese migrant who had become a successful business ownerexplained, “Here in South Africa, it is so much easier to be the boss (laoban). If you have money, you can be a boss. There are so many Chinesehere who work for a year and then become a big boss right away!” Nearlyall the low educated Chinese migrants I spoke to, both in interviews andin participant observation, described their journey as beginning withworking at someone else’s shop (usually a relative) for the first couple ofyears after arriving in South Africa and then being able to open their ownshop. This was the plan for all the Chinese migrants I spoke to whoarrived in the past 2 years. Respondents emphasized that the differencebetween being an employee and owning one’s own shop was huge. “Youcan’t compare the difference between working (for someone else)(da gong) and being the boss (lao ban)!” Often times, for respondents overthe age of 40, the discussion about owning one’s own shop revolvedaround retirement. Chinese migrants saw being a boss as a secure way toenter into retirement, and they looked forward to making enough moneyto move back to China, open a shop there, and retire. The 47-year-oldmigrant from Hebei who gave up his chemistry job to move to South
200 INTERNATIONAL MIGRATION REVIEW

Africa explained his actions saying, “(Owning a shop) makes enoughmoney to take care of you and your family, and it gives you something todo when you get older, so that you’re not just bored doing nothing.” Thedream of self-employment was so important and powerful that many werewilling to sacrifice economic earnings in the short-run for the hope ofbecoming one’s own boss in the long-run.
FINDINGS: FACING BARRIERS UPON ARRIVAL
Danger and Crime
Chinese migrants come to South Africa hoping for an adventure in theoutside world and dreaming of becoming their own boss. However, whenthey actually arrive in South Africa, migrants report that they experiencemany setbacks, some of which are so serious that they cause migrants togive up and go back to China. The main challenge Chinese migrants haveto deal with is the high crime rate in South Africa in general and Johan-nesburg in particular.
Chinese people consistently refer to Johannesburg as a dangerous(wei xian) place, where it is not safe to walk around at night. Shopkeepersretold horror stories of fellow Chinese from neighboring stores who wereseverely beaten and robbed, sometimes losing hundreds of thousands ofSouth African Rand after just withdrawing money from the bank. Policecorruption was also considered normal to South African life. The policewere often described as worse than black criminals4 because Chinese peo-ple never felt safe from those who were supposed to protect them andbecause there was nothing they could do to fight the police. In the end,many respondents said, “It is better to just pay them than get into bigtrouble.” While at a Chinese mall conducting an interview, I met twomiddle-aged women in a shop who, after hearing about my project, couldnot resist telling me all about the terrible crime and corruption in SouthAfrica. They said, “The black people who sell things on the street aroundthis shopping mall hire people to come and steal from our shops. And wecan’t do anything about it because when they bribe the security guards
4Respondents said that those who committed acts of robbery and violence were alwaysblack. Although many of those I spoke to could not distinguish whether these were blackSouth Africans, black foreigners, or both, some Chinese migrants seem to believe they
were mostly extremely poor foreigners driven to crime because of their desperate situation.
CHINESE MIGRANT SHOPKEEPERS IN SOUTH AFRICA 201

here.” When I asked about them going to the police, they told me, “Thepolice? What can they do? We have a saying in China, that the policethere are like the mafia, but here in South Africa, the police are themafia!” After talking with them for over a half hour, I was on my wayout of the shop when they ran up urgently to stop and tell me, “Whenyou write your thesis, make sure you do not tell anyone anything aboutus or our shop or anything!” They were afraid of the local police andhired guards would find out and cause trouble for them. This was justone example of the many difficulties that Chinese migrants faced in deal-ing with crime and corruption.
For most Chinese migrants, race relations only surfaced in relationto problems with crime. When I asked migrants directly about racism andtheir relationship with different racial groups in South Africa, they hadvery little to say about the issue, claiming that they got along fine withblack workers and because of language barriers could not interact muchwith local South Africans. But when the issue of crime came up, Chinesemigrants often described the situation in racialized terms. The majority ofthe stories they told would include some remark about how “black crimi-nals” would target Chinese people because they believed Chinese peoplehad lots of money. Besides crime, race was not a salient issue for Chinesemigrants. This does not mean that racial identity and race relations is notan important part of the lives of Chinese shopkeepers in South Africa(Park, 2008), but rather that the Chinese people I interacted with rarelybrought up the issue of race relations in our conversations.
According to persons interviewed, many Chinese returned to Chinabecause of the high crime rate in South Africa and its impact on profits inenterprises owned by Chinese migrants. One respondent expressed a com-mon feeling held among most Chinese people that “if the crime was not sobad, South Africa would actually be a wonderfully beautiful (wan mei) placeto live!” Crime and corruption were universally cited as the biggest prob-lems in South Africa. Even if Chinese migrants did not experience crimefirst-hand, and many of those I spoke with had experienced only small inci-dents or none at all, everyone lived in fear of crime. Shopkeepers kept warn-ing me that I should never go out at night, and if I do, to be sure not towalk anywhere, not even a block. Many respondents said, “We are tooscared to go out at night, so we just go to work and then go home and hidein our homes at night.” Although most individuals seem to experience rela-tively little difference in their social activities when comparing China toSouth Africa, some respondents described their lives in China as going out
202 INTERNATIONAL MIGRATION REVIEW

regularly or weekly with friends and family, while in South Africa, theywould be lucky to go out even once a month because of fear of crime. Whilejoining in a conversation between neighboring shopkeepers, they told meseveral stories of their family members who had returned to China eventhough they were making more money in South Africa because they couldnot adjust to the lifestyle of living in fear of crime.
Market Saturation
In recent years, there have been so many Chinese migrants coming toSouth Africa to open their own shops that the wholesale and retail mar-kets are starting to reach a saturation point. While conducting participantobservation in different Chinese malls, migrants told me that 7 years ago,there were only three or four Chinese shopping malls. At the time of theresearch in 2012, there were over twelve different Chinese shopping areas,most of which opened since 2009, with a couple newly opened in 2011and 2012 with further plans for expansion. Every migrant I interviewedin Johannesburg complained about the oversaturation of Chinese shop-keepers. They told me stories about how their profits have dwindled witheach passing year. One woman who had lived in South Africa for 7 yearssaid, “The money used to be great – easy to make. Now, there are somemonths that we lose money! At the beginning and end of the month,around Christmas and New Year’s, you can still make good money, butmonths like this month? It is very difficult.” While the first movers experi-enced easy success opening their own stores and making lots of money,migrants who arrived within the past 2 years struggle to make a profitand in some cases lose money from their entrepreneurial efforts. All themigrants I spoke with knew of at least one friend who decided to go backto China because of the oversaturation of Chinese shops, either decidingthat they had made enough money and would try their luck in China orgiving up on achieving the success they had hoped for.
FINDINGS: CHOOSING TO REMAIN IN SOUTH AFRICA
Weather and Environment
In spite of the difficulties they encounter in terms of crime and bad busi-ness, at the time of my research, the number of Chinese shopkeepers inSouth Africa is still increasing. Migrants come, experience hardships
CHINESE MIGRANT SHOPKEEPERS IN SOUTH AFRICA 203

firsthand, and still decide to stay in the country. The experience ofweather, environment, and a slower lifestyle, for many migrants, becomegood reasons to continue living in South Africa, even for those whose eco-nomic expectations were not met. When asked what was the best thingabout South Africa, nearly every single Chinese migrant mentioned theenvironment. “South Africa is actually a beautiful country! If not for thecrime, I think many Chinese people would come here.” One woman whohad lived in South Africa for 7 years said, “The weather here is excellent.In China, the winter is so cold and the summer is so hot – you’re justfreezing or sweating, and suffering the whole time. Here, it is nice all yearround!” At first, I did not take these remarks too seriously, as I thought itwas somewhat of a joke – as if they were saying they enjoyed so littleabout South Africa, the only good thing worth mentioning was theweather. But as I spent more time with Chinese migrants, I realized thatnot only was this one of the biggest reasons to recommend South Africato others but it was also an important value that improved their lives.Formerly, urban-dwelling Chinese migrants often remarked about the pol-lution in China, saying things like, “In China, the pollution is terrible.Here, you have beautiful mountains and a really nice environment. It’snice here.” When asked what the biggest benefit to staying in SouthAfrica would be, a surprisingly common response was the weather and theenvironment.
A Slower Pace of Life
In addition to these factors, Chinese migrants after arriving in South Africaenjoy and prefer the slower pace of life. They often described the life inChina as chaotic and too complicated. When asked specifically why, theymentioned issues of factory work, increased competition (both in schooland in finding a job) resulting in increased pressure, and long, busy, andharsh work environments. After arriving in South Africa, many Chinesemigrants immediately feel like life is less burdensome and lighter (qing song).One young man who used to be a mechanic in China described thesituation well:
Life here is much lighter (qing song) than in China. In China, you have to get up and
work at six or seven in the morning and then work until sometimes nine or ten at night.
Here, you only work at nine or ten in the morning until around five in the afternoon.
Sometimes, we have to stay late to do inventory, but that is only maybe once a month.
Plus, the atmosphere in South Africa in general is more relaxed. In China, maybe because
204 INTERNATIONAL MIGRATION REVIEW

there are so many people, you feel like the pressure (ya li) of life is just really heavy – like
you have to compete all the time. Here, the culture and the society in general is just more
relaxed and lighter (qing song).
Some of these migrants who just arrived in the past 2 years saw theslow pace as a bad thing, saying that life is too simple and boring. Butthose who have stayed at least 5 years seemed to have adjusted and talkedabout how they really preferred their lives in South Africa. These migrantscommonly hear about how difficult and full of pressure their families’ andfriends’ lives are back in China. Although only two respondents men-tioned this explicitly as a deterrent to returning back to China, mosttalked about it as a valuable benefit to staying in South Africa.
The migrants’ experience of a slower pace of life is one of the effectsof small pond migration. Whereas some migrants want to move up tobigger ponds (more developed countries) and compete in environmentswhere there is often a faster-paced culture, a small pond migrationstrategy instead looks to leave these kinds of environments to avoid harshcompetition. The entire mobility strategy of moving up to living in ahigher HDI country implies that the migrant wants to tackle competitionhead on. Migrants that choose to stay in South Africa do so because theyfind that a smaller pond is the right place for them. They enjoy a slowerpace of life and even complain about the intense competition that theyfaced at home in China.
Admittedly, because the scope of this research project is limited toChinese migrants who were in South Africa at the time I conducted myresearch in 2012, these responses about the benefits of staying in SouthAfrica come from a self-selected group of those who chose to stay. I heardstories of Chinese migrants whose relatives and friends decided to returnto China because the pace of life was too slow or because of the problemwith crime. As with any migration strategy, there will always be somemigrants who, after trying to employ a small pond migration strategy,realize this was not the life they wanted – the costs associated with mov-ing to a less developed place were not worth the potential benefits.
Each explanatory factor has a specific role in the narrative of Chinesemigrants to South Africa. A cultural factor in China creates a desire toexplore the guo wai, giving potential migrants a feeling that it is a privi-lege to adventure out of China. This, along with dissatisfaction with theirsocioeconomic situation, acts as a starting point. Then, social networksand barriers to entry limit the possible options of where migrants considergoing. Many end up choosing South Africa and employing a small pond
CHINESE MIGRANT SHOPKEEPERS IN SOUTH AFRICA 205

migration strategy because there is an opportunity to pursue a dream ofbeing one’s own boss. Although the most recent migrants experience theharsh reality of the difficulty of achieving this dream, and some migrantsdo return to China after a time, those who stay point to the hope ofbecoming self-employed, the weather, the environment, and a slowerpaced lifestyle as strong reasons to continue living in South Africa despitelow economic gains. Overall, Chinese migrants experience an increase incapabilities through exercising their freedom in mobility and exploringguo wai, gaining economic facilities through slight income increases andlower costs in South Africa, and experiencing a better daily lifestyle inmore comfortable and peaceful living. Some migrants, especially early-comers, have achieved their dream of stable self-employment and, in thisway, have increased their freedoms – not simply by earning more moneybut also by having the freedom to choose how to spend their time andlive their daily lives.
SMALL POND MIGRATION: MAXIMIZING THE UTILITY OFEXISTING CAPITAL
The case of Chinese migrants in South Africa is exemplary of employinga small pond migration development strategy. As stated earlier, smallpond migration is one form of migration as development (utilizing mobil-ity to increase one’s capabilities set). In small pond migration, migrantsmove to a lesser developed place because certain characteristics of thisplace effectively increase the migrant’s social, economic, and human capi-tal. While the concept of small pond migration was not explicitlyexpressed by all respondents, several Chinese migrants did articulate thespecific idea of wanting to be a big fish in a smaller pond. When askedwhere they would consider moving to if they left South Africa, onerespondent said, “We aren’t considering going to any developed place, likethe U.S. or Europe. Instead, the only places besides China we’re thinkingabout are even more backward (luo hou) places, like Mozambique or Zim-babwe.” The most common places that Chinese migrants considered mov-ing to besides China were areas outside Johannesburg, which they called“shan xia” which literally translated means the foot of a mountain. Thisrefers to rural villages between 50 and 300 km away from major cities,like Johannesburg, Durban, and Bloemfontein. The Chinese people fre-quently talked about how, if the business continued to deteriorate inJohannesburg, they would consider moving to shan xia locations to do
206 INTERNATIONAL MIGRATION REVIEW

business, where they hear from relatives that business is good, despite poorinfrastructure, housing, and safety. This way of thinking reveals the Chi-nese migrants and their desire to employ a small pond migration strategy,where they consider moving to a lesser developed area to face less compe-tition, thereby helping them to achieve their goals.
Small pond migration provides Chinese migrants with rather imme-diate increases in effective capital. In terms of social capital, Chinesemigrants moved to South Africa with the help of family and friends whohave already started their own businesses. This provides them a social con-nection with those who have already succeeded in achieving the goal ofstable self-employment. While migrants lived in China, these connectionswere only useful insofar as they received remittances from South Africanfamily and friends. Arriving in South Africa, however, Chinese migrantsare now able to utilize these connections for job opportunities and to starttheir own businesses. Relatives helped to plan visas and even pay for Chi-nese migrants to come to South Africa. Not only would these earlier arriv-ing relatives provide newly arriving Chinese migrants with jobs in theirshops, they would also provide housing and the support needed to transi-tion into a new country. From these early stages, Chinese migrants furtherutilized familial ties to make more business connections with suppliersand mall owners, and after typically a year or two, they used these con-nections to venture out and open their own stores. While potential Chi-nese migrants have always had these social ties to relatives in SouthAfrica, coming to South Africa expands the effective use of their socialcapital. Here, the characteristic that allows for this expansion in socialcapital has nothing to do with the geographic place of South Africa, butinstead, the specific history of Chinese people successfully doing businessin South Africa and a growing Chinese population there (Hart, 2002;Park, 2012).
Chinese migrants also experience an increase in their economic capi-tal. One way this occurs immediately is because of exchange rates andlower living costs. Migrants, even those with less than high school educa-tion, were acutely aware of the exchange rate between China and SouthAfrica, saying things like “business is not as good now, because theexchange rate is not as good. When we first came, it was something like1.5 or 1.6, but now it’s more like 1.3.” Also, most migrants, when askedabout how their economic situation compared since arriving in SouthAfrica, talked about lower living costs using them to evaluate their realincomes. Migrants would discuss, in detail, the costs of rent, food, and
CHINESE MIGRANT SHOPKEEPERS IN SOUTH AFRICA 207
transport and explain how things are cheaper across the board in SouthAfrica. Mostly importantly, South Africa was understood as a good placefor migrants’ quest for self-employment, as South Africa had such lowinvestment costs. Overall, Chinese migrants approximated the cost ofopening a shop in South Africa as about four times cheaper than in Chinabecause of cheaper rent and lack of government regulations. The smallerand less developed economy of South Africa works in Chinese people’sfavor, providing lower costs and effectively increasing the migrants’ eco-nomic capital.
Finally, in terms of human capital, although moving to South Africadoes not actually improve one’s human capital, it does allow for one’sexisting education and skills to be more competitive and thereby moreeffective. Migrants talked about the huge population in China and that togain access to new opportunities available in China’s growing economyone had to be a successful student. On young migrant who came to SouthAfrica shortly after high school said, “Because I did not do well in school,I cannot compete in China’s economy.” Although this was not a centraldecision-making factor in the migrants’ narratives, migrants still felt thatdespite their low education they had far more opportunities in SouthAfrica. Chinese self-made entrepreneurs had no education or backgroundin business, yet they had no problems opening shops. A man in his thir-ties who had successfully opened his own shop 8 years ago said, “Whateducation? What do you need to know? Opening a shop is easy! You canlearn everything just by doing it.” Respondents felt they could not com-pete in China, especially with little to no experience in business (prior tocoming to South Africa), and several migrants explicitly said that theycame to South Africa to gain that experience so they would have a betterchance doing business in China when they went back.
Another added benefit revolves around South Africa being an Eng-lish-speaking country. Although it might seem like a barrier for Chinesemigrants to move to a place where they do not know the language,respondents actually saw it as an expansion of their capabilities. The issueof language is unlike the aforementioned examples of capital, where smallpond migration results in an immediate and effective increase in capital.But migrants believed it was important for them to learn English as a skillthat made them more economically competitive, especially if they were togo back to China, and living in an English-speaking country providedthem with the opportunity to more easily learn English. With the excep-tion of the few respondents that had university education, all migrants
208 INTERNATIONAL MIGRATION REVIEW

said they had poor English upon arriving in South Africa. Those who hadstayed longer explicitly said they wanted their kids to eventually come toSouth Africa so that they could learn English. At the same time, however,they did not feel that the lack of complex English skills decreased theireffective human capital, because they did not believe their lack of Englishwould prevent them from doing business. When I asked a respondenthow they do business without speaking any English, he remarked, “WhatEnglish do I have to know? Just some numbers and prices… other thanthat you just point and make it work. We really do not need much Eng-lish to do business here.” From the perspective of most respondents, mov-ing to an English-speaking country was beneficial because it enabled themto easily learn the language and was not a barrier or hindrance to theireconomic goals.
Small pond migration as a development strategy is not without itsdrawbacks – Chinese migrants had to give up certain freedoms to expandother capabilities. In general, a primary reason why most migration pat-terns are from lower-HDI countries to higher ones is that moving to amore developed country immediately provides socioeconomic structuraland living standard benefits (United Nations Development Report Team,2009). A lesser developed country may come with poorer infrastructure,bad housing, and weak government. In the case of South Africa, Chinesemigrants lose capabilities and freedoms associated with the high amountsof crime and corruption in Johannesburg. Chinese migrants’ freedom togo out at night and enjoy social activities is the one major trade-offs theymust endure in living in South Africa.
CONCLUSION
Chinese migrants have journeyed to South Africa to utilize a small pondmigration strategy, effectively increasing their social, economic, andhuman capital. They come to South Africa not only to use this capital toobtain their goal of stable self-employment, but also to experience lifeabroad, something that exercises their freedom of mobility and has intrin-sic value. Although some have returned to China due to low economicreturns and high crime, many have stayed because of comfortable weather,beautiful environment, and a slower, less chaotic lifestyle. These migrantshave accepted the loss of freedoms associated with crime, such as goingout at night, in return for a more comfortable life and the pursuit of theirdream of being their own boss.
CHINESE MIGRANT SHOPKEEPERS IN SOUTH AFRICA 209

Applying Sen’s capabilities approach to the field of internationalmigration provides a more narrative-focused framework that deepens ourunderstanding of why people migrate and why certain migration patternsexist. Small pond migration, a mobility strategy in which the migrantmoves to a smaller pond to effectively gain capital and become a big fish,helps explain the seemingly peculiar case when migrants move from moredeveloped countries to lesser developed ones. Analyzing migration patternsbased on a mobility-as-development-strategy framing would prioritizethinking about the way mobility is utilized to improve one’s life, ratherthan focusing on the country of origin and destination. This provides auseful way to compare migration patterns across many geographic loca-tions, such as the divide between south–north and south–south migrationpatterns, and even cases of north–south migration.
Although the use of small pond migration is not necessarily a new phe-nomenon (Østbø and Carling, 2005), this case suggests a change in thedynamic of how potential migrants utilize such migration. Prior researchhas documented Chinese migration to Southeast Asia (Purcell, 1965; Sury-adinata, 1997; Chua, 2004). More recent studies have described Chinesemigration to Latin America (Siu, 2005; Devlin, Estevadeordal, and Rodri-guez-Clare, 2006; Lai and Chee-Beng, 2010). Recent Chinese migration toregions within Africa may constitute new spatial patterns. These patternsmay further suggest that forces of globalization (specifically decreasing costsof social contacts over wider spaces, decreasing transportation costs of goods,and increasing linkages across geographic and cultural spaces) open up morepossibilities for small pond migration to become a viable development strat-egy for aspiring migrants and households in the global south. The case ofChinese migrants to South Africa provides evidence for how migrants mayemploy this strategy.
From a policy perspective, this case reveals the importance of under-standing non-traditional factors that influence migrants and their decisionsto migrate. Government policies that seek to control migration tend tofocus on factors such as labor market structures and migrant family andfriend networks (Boyd, 1989). Small pond migration suggests that mone-tary, fiscal, and trade policies not commonly associated with immigrationhave major implications for migration patterns. Because of the importantrole of exchange rates and transaction costs of importing goods formigrant entrepreneurs, governments seeking to control migrants employ-ing a small pond migration strategy could utilize monetary, fiscal, andtrade policies to either encourage or curb migration flows. The findings in
210 INTERNATIONAL MIGRATION REVIEW

this case study suggest that currency exchange rates may have a larger-than-expected influence on migrants and their decision making, as theseexchange rates affect the migrant’s standard of living in the destinationcountry as well as their ability to get the most out of their existing eco-nomic capital. Further research is required to understand the relationshipbetween currency and migration patterns.
This case may also anticipate the future for countries and contextsthroughout the continent of Africa. Although some historical connectionsexisted between China and South Africa, the first large wave of Chinesemigrants came to South Africa 40 years ago when the apartheid governmentengaged in business partnerships with the Taiwanese government. Cur-rently, the Chinese government invests aggressively in 49 countries through-out Africa with trade flows amounting to $120 billion, making ChinaAfrica’s biggest trading partner. Just as unplanned Chinese migration flowsto South Africa show little signs of slowing, it is likely that Chinese govern-ment contracts will increase informal migration networks, providing moreplaces and opportunities for potential Chinese migrants to utilize a smallpond migration strategy all over the African continent. Chinese entrepre-neurs in Cape Verde off the coast of West Africa are an example of theincreasing Chinese influence and expansion on the African continent (Østbøand Carling, 2005). Awareness of this growing phenomenon encouragesgovernments to act preemptively to understand the effects of Chinese migra-tion and seek out ways to benefit from it. This also suggests further researchon the complex relationship between immigration and trade (White, 2007;Head and Ries, 1998) – specifically suggesting that while internationalmigration results in more bilateral trade, trade may also result in increasingimmigration. Because the case of Chinese migrants to South Africa begins40 years ago, it serves as an important first predictor and potential modelfor emerging Chinese–African migration patterns.
REFERENCES
Alberts, H. C., and H. D. Hazen2005 ““There are Always Two Voices..”: International Students’ Intentions to Stay in the
United States or Return to their Home Countries.” International Migration43(3):131–154.
Anand, P., C. Santos, and R. Smith2009 “The Measurement of Capabilities.” Vol. 1, In Arguments for a Better World: Essays
in Honor of Amartya Sen–Volume I: Ethics, Welfare, and Measurement. Ed. K. Basuand R. Kanbur. New York, NY: Oxford University Press. Pp. 283–310.
CHINESE MIGRANT SHOPKEEPERS IN SOUTH AFRICA 211
Bakewell, O.2009 South-South Migration and Human Development: Reflections on African Experiences.
Human Development Research Paper, United Nations Development Programme.Boyd, M.1989 “Family and Personal Networks in International Migration: Recent Developments
and New Agendas.” International Migration Review 23(3):638–670.Chan, K. W.2012 “Migration and Development in China: Trends, Geography and Current Issues.”
Migration and Development 1(2):187–205.Chu, J. Y.2010 Cosmologies of Credit: Transnational Mobility and the Politics of Destination in China.
London: Duke University Press.Chua, A.2004 World on Fire: How Exporting Free Market Democracy Breeds Ethnic Hatred and Glo-
bal Instability. New York, NY: First Anchor Books.Czarniawska, B.2004 Narratives in Social Science Research. London: SAGE Publications.Devlin, R., A. Estevadeordal, and A. Rodriguez-Clare2006 The Emergence of China: Opportunities and Challenges for Latin America and the
Caribbean. Washington, DC: Inter-American Development Bank.Fischer, P. A., R. Martin, and T. Straubhaar1997 “Should I Stay or Should I Go?” In International Migration, Immobility and Devel-
opment. Ed. T. Hammar, G. Brochmann, K. Tamas and T. Faist. Oxford: Berg.Pp. 49–90.
Fong, V. L.2011 Paradise Redefined: Transnational Chinese Students and the Quest for Flexible Citizen-
ship in the Developed World. Stanford: Stanford University Press.Hart, G.2002 Disabling Globalization: Places of Power in Post-Apartheid South Africa. Berkeley:
University of California Press.Hatten, T. J., and J. G. Williamson1998 The Age of Mass Migration: Causes and Economic Impact. Oxford: Oxford University
Press.Haug, S.2008 “Migration Networks and Migration Decision-Making.” Journal of Ethnic and
Migration Studies 34(4):585–605.Head, K., and J. Ries1998 “Immigration and Trade Creation: Economietric Evidence from Canada.” The
Canadian Journal of Economics 31(1):47–62.Huynh, T. T., Y. J. Park, and A. Y. Chen2010 “Faces of China: New Chinese Migrants in South Africa, 1980s to Present.” African
and Asian Studies 9(3):286–306.Khwaja, Y.2002 Should I Stay or Should I Go? Migration under Uncertainty: A Real Options Approach.
Economics and Finance Working papers, London: Brunel University.Klasen, S.2006 “UNDP Gender-Related Measures: Some Conceptual Problems and Possible Solu-
tions.” Journal of Human Development 7(2):243–274.Lai, W. L., and T. Chee-Beng2010 The Chinese in Latin America and the Carribbean. Boston, MA: Brill.
212 INTERNATIONAL MIGRATION REVIEW
Massey, D. S.1990 “Social Structure, Houshold Strategies, and the Cumulative Causation of Migra-
tion.” Population Index 56(1):3–26.———1999a “International Migration at the Dawn of the Twenty-First Century: The Role of
the State.” Population and Development Review 000:303–322.———1999b“Why Does Immigration Occur? A Theoretical Synthesis.” In The Handbook of
International Migration: The American Experience. Ed. C. Hirschman, P. Kasinitzand J. DeWind. New York, NY: Russell Sage Foundation. Pp. 34–52.
——— et al.1998 Worlds in Motion: Understanding International Migration at the End of the Millen-
nium. New York, NY: Oxford University Press.Menjivar, C.2000 Fragmented Ties: Salvadoran Immigrant Networks in America. Berkeley and Los
Angeles: University of California Press.Ma Mung, E.2008 “Chinese Migration and China’s Foreign Policy in Africa.” Journal of Chinese Over-
seas 4(1):91–109.Nussbaum, M.2000 Women and Human Development. Cambridge: Cambridge University Press.Østbø, H., and J. Carling2005 “On the Edge of the Chinese Diaspora: The Surge of Baihuo Busniness in an Afri-
can City.” Ethnic and Racial Studies 28(4):639–662.Park, Y. J.2008 A Matter of Honour: Being Chinese in South Africa. Lanham: Lexington Books.———2009a Chinese Migration in Africa. Occasional Paper No. 24, Johannesburg: South African
Institute of International Affairs.———2009b“Recent Chinese Migration to South Africa: New Intersections of Race, Class &
Ethnicity.” In Representation, Expression and Identity. Interdisciplinary Perspectives.Ed. T. Rahimy. Inter-Disciplinary Press, E-book. Pp. 153–168. <http://www.inter-disciplinary.net/publishing/id-press/ebooks/representation-expression-and-identity/>Accessed on January 28, 2014.
———2012 Living In Between: The Chinese in South Africa. http://www.migrationinformation.
org/feature/display.cdm?IDM=875. Accessed on November 2, 2012.Paul, A. M.2011 “Stepwise International Migration: A Multistage Migration Pattern for the Aspiring
Migrant.” American Journal of Sociology 116(6):1842–1886.Pieke, F. N., and H. Mallee1999 Internal and International Migration: Chinese Perspectives. Richmond: Curzon Press.Politzer, M.2008 China and Africa: Stronger Economic Ties Mean More Migration. [http://www.migra-
tioninformation.org/feature/display.cfm?ID=690. Accessed on November 14, 2013.Portes, A., and J. Sensenbrenner1993 “Embeddedness and Immigration: Notes on the Social Determinants of Economic
Action.” American Journal of Sociology 98(6):1320–1350.
CHINESE MIGRANT SHOPKEEPERS IN SOUTH AFRICA 213

Purcell, V.1965 The Chinese in Southeast Asia, 2nd ed. Oxford: Oxford University Press.Ratha, D., and W. Shaw2007a “Causes of South-South Migration and Its Socioeconomic Effects.” Migration Infor-
mation Source. http://www.migrationinformation.org/feature/display.cfm?ID=647.Accessed on November 3, 2012.
———, and ———2007bSouth-South Migration and Remittances. Working Paper No. 102, Washington, DC:
World Bank.Richardson, L.1990 “Narrative and Sociology.” Journal of Contemporary Ethnography 19(1):116–135.Rimmer, S. H.2009 Refugees, Internally Displaced Persons and the ‘Responsibility to Protect’. Research Paper
No. 185, United Nations High Commissioner of Refugees.Roth, P.1989 “How Narratives Explain.” Social Research 56(2):449–478.SAPS Strategic Management2013 An Analysis of the National Crime Statistics. Addendum to the Annual Report, Preto-
ria: South African Police Service.Sassen, S.1988 The Mobility of Capital and Labor. Cambridge: Cambridge University Press.———1998a “America’s Immigration ‘Problem’.” In Globalization and Its Discontents: Essays on
the New Mobility of People and Money. Ed. S. Sassen. New York, NY: New Press,Pp. 31–53.
———1998bGlobalizations and Its Discontents: Essays on the New Mobility of People and Money.
New York, NY: New Press.Scott, J.2013 Social Network Analysis, 3rd ed. London: SAGE Publications.Sen, A.1993 “Capability and Well-Being.” In The Quality of Life. Ed. M. Nussbaum and A. Sen.
Oxford: Clarendon Press. Pp. 30–54.———2001 Development as Freedom. Oxford: Oxford University Press.———2005 “Human Rights and Capabilities.” Journal of Human Development 6(2):151–166.Siu, L. C. D.2005 Memories of a Future Home: Diasporic Citizenship of Chinese in Panama. Stanford:
Stanford University Press.Skeldon, R.2011 China: An Emerging Destination for Economic Migration. http://www.migrationinfor-
mation.org/feature/display.cfm?ID=838. Accessed on November 14, 2013.Statistics South Africa2011 Mid-Year Population Estimates. Statistical Release, Pretoria: Statistics South Africa.Suryadinata, L.1997 Ethnic Chinese as Southeast Asians. Singapore: Institute of Southeast Asian Studies.Torpey, J.2000 The Invention of the Passport: Surveillance, Citizenship, and the State. New York, NY:
Cambridge University Press.
214 INTERNATIONAL MIGRATION REVIEW

United Nations Development Report Team2009 United Nations Human Development Report, 2009. New York, NY: Human Devel-
opment Report, United Nations Development Programme.Vandsemb, B. H.1995 “The Place of Narrative in the Study of Third World Migration: The Case of
Spontaneous Rural Migration in Sri Lanka.” The Professional Geographer 47(4):411–425.
Waldinger, R. et al.1990 Ethnic Entreprenuers: Immigrant Business in Industrial Societies. Newbury Park:
SAGE Publications.White, R.2007 “Immigrant-Trade Links, Transplanted Home Bias and Network Effects.” Applied
Economics 39:839–852.Yang, D.2003 Remittances and Human Capital Investment: Child Schooling and Child Labor in the
Origin Households of Overseas Filipino Workers. Working Paper. University ofMichigan.
Zolberg, A. R.1999 “Matters of State: Theorizing Immigration Policy.” In The Handbook of
International Migration: The American Experience. Ed. C. Hirshman, P. Kasinitz andJ. DeWind. New York, NY: Russell Sage Foundation. Pp. 71–93.
CHINESE MIGRANT SHOPKEEPERS IN SOUTH AFRICA 215

Journal of Health Economics 27 (2008) 1260–1274
Contents lists available at ScienceDirect
Journal of Health Economics
journa l homepage: www.e lsev ier .com/ locate /econbase
Predicting health behaviors with an experimentalmeasure of risk preference
Lisa R. Andersona, Jennifer M. Mellorb,∗
a Department of Economics, Morton 110, College of William and Mary, P.O. Box 8795, Williamsburg,VA 23187-8795, United Statesb Department of Economics and Thomas Jefferson Program in Public Policy, Morton 110,College of William and Mary, Williamsburg, VA 23187-8795, United States
a r t i c l e i n f o
Article history:Received 25 September 2007Received in revised form 19 May 2008Accepted 28 May 2008Available online 7 June 2008
JEL classification:I12C91
Keywords:Risk preferenceLottery choice experimentHealth risk behaviorsSmoking
a b s t r a c t
We conduct a large-scale economics experiment paired with a survey to examine the asso-ciation between individual risk preference and health-related behaviors among adults aged18–87 years. Risk preference is measured by the lottery choice experiment designed by Holtand Laury [Holt, C.A., Laury, S.K., 2002. Risk aversion and incentive effects. The AmericanEconomic Review 92(5), 1644–1655]. Controlling for subject demographic and economiccharacteristics, we find that risk aversion is negatively and significantly associated withcigarette smoking, heavy drinking, being overweight or obese, and seat belt non-use. Inadditional specifications, we find that risk aversion is negatively and significantly associ-ated with the likelihood a subject engaged in any of five risky behaviors and the number ofrisky behaviors reported.
© 2008 Elsevier B.V. All rights reserved.
1. Introduction
Risk preference influences a variety of economic behaviors under uncertainty, such as investment, portfolio choice, jobchange, and migration. In the field of health economics, attitudes toward risk are likely to affect the purchase of healthinsurance, the use of preventive medical care, and the propensity to engage in behaviors that either increase or decreasemortality risk, such as cigarette smoking or seat belt use. Despite the importance of individual-specific risk preference,there is no consensus on how best to measure it or control for its contribution to economic behaviors. Recent studies haveemployed various survey questions dealing with hypothetical gambles (e.g., Barsky et al., 1997), hypothetical willingness topay for risky assets (e.g., Guiso and Paiella, 2005), and self-reported attitudes toward risk (e.g., Dohmen et al., 2005). Thesesurvey-based measures of risk preference have shown the expected relationship with risky health-related behaviors in some,but not all, such studies. One concern about survey questions is that choices made in hypothetical situations may not reflectactual behaviors when real money is at stake. Further, evidence from experimental economics suggests that respondents’reports of their own attitudes do not always reflect their actual behaviors (e.g., Glaeser et al., 2000). These issues motivatethe use of economics experiments to generate additional measures of subject-specific risk preference.
∗ Corresponding author. Tel.: +1 757 221 2852; fax: +1 757 221 1175.E-mail addresses: [email protected] (L.R. Anderson), [email protected] (J.M. Mellor).
0167-6296/$ – see front matter © 2008 Elsevier B.V. All rights reserved.doi:10.1016/j.jhealeco.2008.05.011

L.R. Anderson, J.M. Mellor / Journal of Health Economics 27 (2008) 1260–1274 1261
The primary contribution of this paper is a methodological one. We pair a widely used economics experiment designedto measure risk preference (the lottery choice experiment designed by Holt and Laury (2002)) with a survey that measuresseveral risky health-related behaviors, and we use the resulting data to test whether risk preference measured by the exper-iment is associated with surveyed behaviors. This general approach has been reported in only a few prior studies, and ours isthe first study to focus exclusively on health behaviors. Our methodological contribution is enhanced by the use of a subjectpool that is both large and diverse when compared to those derived from most economics experiments, many of which con-sist of undergraduate students. Using data from one of the largest replications of the lottery choice experiment, we examinea sample of more than a thousand adult subjects ranging from 18 to 87 years of age. All subjects in our experiment receivedimmediate financial payments based on their decisions, so that the stakes in the lotteries were not simply hypothetical.
Our empirical results show that an experimental measure of risk preference is significantly associated with several riskyhealth behaviors measured in our survey. Controlling for a number of subject demographic and economic traits, we findthat laboratory-measured risk aversion is negatively and significantly associated with cigarette smoking, heavy episodicdrinking, being overweight or obese, and seat belt non-use. In other specifications, we find that the experimental measureof risk aversion is negatively and significantly associated with the likelihood of reporting any of five risky behaviors, thenumber of risky behaviors reported, and a factor-analysis-based measure of subjects’ underlying propensity to engage inrisky behavior. Thus, our findings provide additional evidence that certain health behaviors are influenced in a consistentmanner by preferences toward risk. Because two of the behaviors significantly associated with our experimental measureof risk aversion are smoking and seat belt non-use, our results also offer additional support for the use of these behaviors asproxies for risk preference. Finally, our findings demonstrate the potential benefits of linking experimental tasks to householdsurveys.
2. Measuring individual-specific risk attitudes
Before introducing our methodological approach, we first describe existing techniques for measuring individual-specificattitudes toward risk. The literature review makes several points relevant to our work. First, there is no single or standardchoice of proxy for risk preference. Second, only a small number of studies have used experimental measures to gener-ate a measure of risk preference and examine its relation to risky behaviors. Third, compared to these prior studies, ourwork has a unique focus on health behaviors and draws on a subject pool that is both exceptionally large and diverse inage.
Past research studies have measured individual-specific attitudes toward risk with measures of hypothetical behaviors,actual behaviors, and self-reported attitudes. Among the measures involving hypothetical scenarios, the most commondeals with hypothetical gambles. For example, questions on the 1992 Health and Retirement Study (HRS) ask respondents tochoose between two jobs, one with a certain income and another with a 50% chance of doubling income and a 50% chanceof reducing income by one-third, one-fifth, or one-half. Based on their job choices, respondents can be classified into oneof four categories ranging from least risk tolerant to most risk tolerant1; alternatively, it is possible to construct a cardinalmeasure of risk tolerance from the responses as is done in Barsky et al. (1997). Variations of these questions have alsoappeared in the Panel Study of Income Dynamics (PSID) (e.g., Luoh and Stafford, 2007), a 1997 survey of French households(e.g., Arrondel, 2002) and a 1998 survey of Dutch households (e.g., Kapteyn and Teppa, 2002). In all cases, the questionsoffered subjects the choice of a safe job with certain earnings of Y and a risky job with expected earnings greater than Y.As a result, the questions can be used to classify subjects at different levels of risk aversion, but not as risk-loving or riskneutral.
Measures derived from hypothetical gamble questions have been used to predict health-related risky behaviors in anumber of studies.2 For example, controlling for age, sex, race, and religion, Barsky et al. (1997) reported that respondentsin the HRS with larger parameter values of risk tolerance were more likely to smoke, drink, and not own health insurance. Incontrast, Picone et al. (2004) found that the coefficient on a risk tolerance parameter was either statistically insignificant orsignificant and of the wrong sign in models of the demand for preventive medical tests. Sloan and Norton (1997) reportedinsignificant coefficients on categorical dummies for risk aversion in a model of long-term care insurance demand. Lahiriand Song (2000) reported that a categorical dummy for risk aversion had a negative and significant effect in a model ofsmoking initiation but an insignificant effect in a model of smoking continuation. Finally, Dave and Saffer (2007) found thata categorical dummy for risk aversion had a negative and significant coefficient in models of alcohol consumption.
Individual risk preference has also been measured with questions on other hypothetical behaviors. For example, Guisoand Paiella (2005) used hypothetical willingness to pay for a risky asset to examine decision making in the 1995 Bank of
1 In later waves of the HRS, additional questions increase the number of categories to six.2 Additional studies have employed the hypothetical gamble questions to control for risk preferences in models of behaviors unrelated to health. Using the
HRS, these include Lusardi (1998) on precautionary saving behavior, and Kimball et al. (2007) on asset allocation. Using the PSID, Charles and Hurst (2003)examined investment decisions, Kan (2003) examined mobility, Brown and Taylor (2007) modeled educational attainment and wages, and Schmidt (2007)studied marriage and childbearing. Kapteyn and Teppa (2002) and Arrondel (2002) examined wealth and investment using Dutch and French householddata, respectively.

1262 L.R. Anderson, J.M. Mellor / Journal of Health Economics 27 (2008) 1260–1274
Italy Survey of Household Income and Wealth.3 Risk aversion indicators had significant negative effects on the likelihood ofhaving a chronic disease, but unexpected negative effects in models of health insurance ownership.4
Another approach is to use measures of actual behaviors to proxy for risk preference. For example, Viscusi and Hersch(2001) and Hakes and Viscusi (2007) used smoking status to control for risk preference in models of job risk-taking andseat belt use, respectively. In related work, Hersch and Viscusi (1998) showed that smoking status predicted risk-reducingpreventive health behaviors, such as tooth flossing and blood pressure monitoring. One concern about using smoking tocapture risk preference is that it may also reflect time preference (e.g., Fuchs, 1982; Evans and Montgomery, 1994). However,the same concern is unlikely to apply to seat belt non-use, another behavioral measure of risk preference. Hersch and Viscusi(1990) validated both smoking and seat belt use as proxies of risk tolerance in a study of compensating differentials for riskyjobs.
Finally, questions on self-reported attitudes are another means of measuring individual risk preferences. Dohmen et al.(2005) is a notable example of this approach.5 More than 20,000 subjects from German households were surveyed abouttheir general willingness to take risks on a scale of 0–10. A binary measure of risk tolerance constructed from this scalewas used in models of various behaviors, and found to have positive and significant effects on smoking participation, stockinvestment, self-employment, and sports participation.6
The Dohmen et al. study is especially relevant to our work because it also provides an experimental validation of theattitudinal risk tolerance measure using a representative sample of 450 adult individuals living in Germany. Subjects inthis sample completed a questionnaire containing the same set of attitudinal questions used in the larger survey, and thenparticipated in a lottery choice experiment. For each of 20 decision rows, subjects had to choose either a lottery withexpected winnings of D150, or a safe monetary amount that increased in size across the rows from D0 to 190. The point atwhich subjects switched from the lottery to the safe option indicated risk preferences: the higher the value of the safe optionat the switch point, the more risk tolerant the subject. The survey-based attitudinal measure of risk tolerance was foundto be a significant predictor of the experimental measure even upon controlling for a number of subject traits. Thus, thisstudy provided important validation of the attitudinal measure of risk-taking, although the authors did not report whetherthe experimental measure of risk-taking was itself associated with smoking status. It is also worth noting that while largemonetary payoffs were used to motivate incentive-compatible decision-making, subjects were informed that only one inseven would be paid for their decisions, and payments were made in checks sent by mail.
We know of only a few other studies that use economics experiments to both measure risk preference and compare theresulting measure to survey-based questions on risky behavior. Kruse and Thompson (2003) took this approach in studyingthe hypothetical willingness to pay for a risk mitigation device. They compared subject responses about willingness to pay fora lock that reduced the chance of burglary to subject play in an experiment with identical losses and probabilities, but withreal money at stake. The experimental and survey-based measures were consistent on average, but on an individual levelthey were consistent for less than one-quarter of the subjects. Lusk and Coble (2005) compared subject responses to surveyquestions on the willingness to consume genetically modified foods to subject decisions in a lottery choice experiment. Theirresults are described in detail in the next section (since they use the same lottery choice experiment we employ), but theirmain finding is that the experimental measure was significantly associated with risk-taking behavior.
While our study is related to these three prior studies, it makes several new contributions. First, our study is the firstto pair an experimental measure of risk preference with several common health risk behaviors. Findings from Dohmen etal. (2005) suggest that an experimental measure might be associated with smoking, but this was not explicitly examined;moreover the majority of subjects in the experiment were not paid based on their lottery choices. Second, our study usesan exceptionally large sample of more than a thousand subjects, roughly twice the number used in Dohmen et al. and 20times the sample size used in Lusk and Coble (2005). Finally, while our data do not allow us to make direct comparisons ofall measures of risk preference described above, we are able to compare our experimental measure of risk preference to twocommonly used measures defined from actual behaviors, seat belt non-use and smoking. In this way, our results are able toinform the choice of proxy measures used in future studies.
3. An experimental measure of risk preference
To examine whether an experimental measure of risk preference is associated with health-related behaviors, we useddata from a large-scale experiment involving more than one thousand subjects. We employed one of the most widely usedexperiments designed to capture risk preference—the lottery choice task from Holt and Laury (2002). A major advantage ofthis design relative to other experiment-based studies of risk aversion is that the task is simple and context free. Anotheradvantage is that subjects are not placed in the role of buyer and seller to elicit certainty equivalents, which is important
3 Hartog et al. (2000) also used this type of survey question, and Kruse and Thompson (2003) used a survey question on willingness to pay for a riskmitigation device. Neither study focused on the relationship between risk attitudes and reported health behaviors.
4 These measures had significant coefficients of the expected sign in models of self-employment, ownership of risky assets, moving, and changing jobs.5 In another such study, Kapteyn and Teppa (2002) used attitudinal measures of risk tolerance to predict portfolio choice.6 Dohmen et al. (2005) also employed five measures of willingness to take risks in specific domains; three of these had positive and significant coefficients
in the smoking model. Another risk preference measure was based on subject responses to a question about the fraction of hypothetical lottery winningsthey would invest in a risky asset. This measure was not significantly related to smoking.
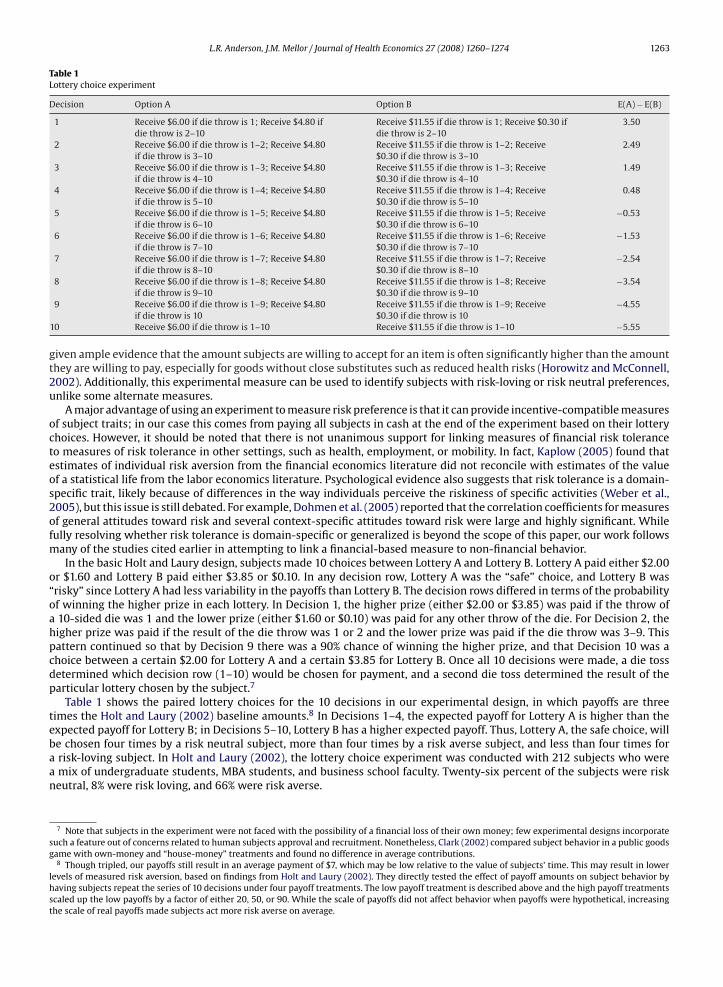
L.R. Anderson, J.M. Mellor / Journal of Health Economics 27 (2008) 1260–1274 1263
Table 1Lottery choice experiment
Decision Option A Option B E(A) − E(B)
1 Receive $6.00 if die throw is 1; Receive $4.80 ifdie throw is 2–10
Receive $11.55 if die throw is 1; Receive $0.30 ifdie throw is 2–10
3.50
2 Receive $6.00 if die throw is 1–2; Receive $4.80if die throw is 3–10
Receive $11.55 if die throw is 1–2; Receive$0.30 if die throw is 3–10
2.49
3 Receive $6.00 if die throw is 1–3; Receive $4.80if die throw is 4–10
Receive $11.55 if die throw is 1–3; Receive$0.30 if die throw is 4–10
1.49
4 Receive $6.00 if die throw is 1–4; Receive $4.80if die throw is 5–10
Receive $11.55 if die throw is 1–4; Receive$0.30 if die throw is 5–10
0.48
5 Receive $6.00 if die throw is 1–5; Receive $4.80if die throw is 6–10
Receive $11.55 if die throw is 1–5; Receive$0.30 if die throw is 6–10
−0.53
6 Receive $6.00 if die throw is 1–6; Receive $4.80if die throw is 7–10
Receive $11.55 if die throw is 1–6; Receive$0.30 if die throw is 7–10
−1.53
7 Receive $6.00 if die throw is 1–7; Receive $4.80if die throw is 8–10
Receive $11.55 if die throw is 1–7; Receive$0.30 if die throw is 8–10
−2.54
8 Receive $6.00 if die throw is 1–8; Receive $4.80if die throw is 9–10
Receive $11.55 if die throw is 1–8; Receive$0.30 if die throw is 9–10
−3.54
9 Receive $6.00 if die throw is 1–9; Receive $4.80if die throw is 10
Receive $11.55 if die throw is 1–9; Receive$0.30 if die throw is 10
−4.55
10 Receive $6.00 if die throw is 1–10 Receive $11.55 if die throw is 1–10 −5.55
given ample evidence that the amount subjects are willing to accept for an item is often significantly higher than the amountthey are willing to pay, especially for goods without close substitutes such as reduced health risks (Horowitz and McConnell,2002). Additionally, this experimental measure can be used to identify subjects with risk-loving or risk neutral preferences,unlike some alternate measures.
A major advantage of using an experiment to measure risk preference is that it can provide incentive-compatible measuresof subject traits; in our case this comes from paying all subjects in cash at the end of the experiment based on their lotterychoices. However, it should be noted that there is not unanimous support for linking measures of financial risk toleranceto measures of risk tolerance in other settings, such as health, employment, or mobility. In fact, Kaplow (2005) found thatestimates of individual risk aversion from the financial economics literature did not reconcile with estimates of the valueof a statistical life from the labor economics literature. Psychological evidence also suggests that risk tolerance is a domain-specific trait, likely because of differences in the way individuals perceive the riskiness of specific activities (Weber et al.,2005), but this issue is still debated. For example, Dohmen et al. (2005) reported that the correlation coefficients for measuresof general attitudes toward risk and several context-specific attitudes toward risk were large and highly significant. Whilefully resolving whether risk tolerance is domain-specific or generalized is beyond the scope of this paper, our work followsmany of the studies cited earlier in attempting to link a financial-based measure to non-financial behavior.
In the basic Holt and Laury design, subjects made 10 choices between Lottery A and Lottery B. Lottery A paid either $2.00or $1.60 and Lottery B paid either $3.85 or $0.10. In any decision row, Lottery A was the “safe” choice, and Lottery B was“risky” since Lottery A had less variability in the payoffs than Lottery B. The decision rows differed in terms of the probabilityof winning the higher prize in each lottery. In Decision 1, the higher prize (either $2.00 or $3.85) was paid if the throw ofa 10-sided die was 1 and the lower prize (either $1.60 or $0.10) was paid for any other throw of the die. For Decision 2, thehigher prize was paid if the result of the die throw was 1 or 2 and the lower prize was paid if the die throw was 3–9. Thispattern continued so that by Decision 9 there was a 90% chance of winning the higher prize, and that Decision 10 was achoice between a certain $2.00 for Lottery A and a certain $3.85 for Lottery B. Once all 10 decisions were made, a die tossdetermined which decision row (1–10) would be chosen for payment, and a second die toss determined the result of theparticular lottery chosen by the subject.7
Table 1 shows the paired lottery choices for the 10 decisions in our experimental design, in which payoffs are threetimes the Holt and Laury (2002) baseline amounts.8 In Decisions 1–4, the expected payoff for Lottery A is higher than theexpected payoff for Lottery B; in Decisions 5–10, Lottery B has a higher expected payoff. Thus, Lottery A, the safe choice, willbe chosen four times by a risk neutral subject, more than four times by a risk averse subject, and less than four times fora risk-loving subject. In Holt and Laury (2002), the lottery choice experiment was conducted with 212 subjects who werea mix of undergraduate students, MBA students, and business school faculty. Twenty-six percent of the subjects were riskneutral, 8% were risk loving, and 66% were risk averse.
7 Note that subjects in the experiment were not faced with the possibility of a financial loss of their own money; few experimental designs incorporatesuch a feature out of concerns related to human subjects approval and recruitment. Nonetheless, Clark (2002) compared subject behavior in a public goodsgame with own-money and “house-money” treatments and found no difference in average contributions.
8 Though tripled, our payoffs still result in an average payment of $7, which may be low relative to the value of subjects’ time. This may result in lowerlevels of measured risk aversion, based on findings from Holt and Laury (2002). They directly tested the effect of payoff amounts on subject behavior byhaving subjects repeat the series of 10 decisions under four payoff treatments. The low payoff treatment is described above and the high payoff treatmentsscaled up the low payoffs by a factor of either 20, 50, or 90. While the scale of payoffs did not affect behavior when payoffs were hypothetical, increasingthe scale of real payoffs made subjects act more risk averse on average.

1264 L.R. Anderson, J.M. Mellor / Journal of Health Economics 27 (2008) 1260–1274
The Holt and Laury (2002) design has been used in many subsequent studies to examine risk attitudes. For example,Harrison et al. (2007a) studied the relationship between demographic characteristics and lottery choice decisions using aDutch subject pool, and Harrison et al. (2007b) ran the lottery choice experiment in the context of a rare coin market toexamine the effects of framing and background risk. Two studies used the Holt and Laury (2002) lottery choice experimentto study risk preferences of workers who chose occupations with risky income streams.9
As noted earlier, our study is closely related to Lusk and Coble (2005) which used the Holt and Laury (2002) lotterychoice experiment to predict preferences for and consumption of genetically modified food. Subjects made a series of tenchoices with real payoffs roughly five times the amounts used in the Holt and Laury (2002) low payoff treatment.10 Fiftyundergraduate students participated, and average earnings were $12 (plus a $10 show up payment). Lusk and Coble (2005)found that individuals who were more risk averse in the lottery choice experiment were significantly less likely to reportpurchasing and eating genetically modified food on a post-experiment survey. Like Lusk and Coble (2005) we focus onthe relationship between a measure of risk preference defined from the lottery choice experiment and measures of riskybehaviors. Our focus is on behaviors that have well-known and significant risks to health status, such as smoking, alcoholuse, and seat belt non-use. We know of no previous study that pairs a lottery choice experiment with survey-based measuresof these health-related decisions. Finally we use a considerably larger subject pool, which we describe in the next section.
4. Experimental methods
Non-student adult subjects were recruited from the greater Williamsburg, Virginia area by contacting a variety of localorganizations and posting flyers in public places. Student subjects were recruited from various undergraduate and graduatecourses at the College of William and Mary. A total of 1094 subjects participated in the experiment, making this study one ofthe largest replications of the lottery choice experiment. Prior to the experiment, instructions were distributed to subjectsand read aloud. Subjects then made 10 decisions with real payoffs that were three times the low payoffs used in Holt andLaury (2002). Appendix A includes copies of the instructions and decision sheet. Once all decisions were recorded, 1 of the10 was randomly chosen for payment, and earnings averaged $6.90.11
In our lottery choice experiment and in others, subjects generally begin by choosing Option A (the safe option) in Decision1, when the chance of winning the higher Option B payoff is relatively small. The point at which subjects switch from the safeoption to the risky option can be used to define a range of values for the subject’s risk aversion parameter. We follow Holtand Laury’s procedures for defining upper and lower bounds on this parameter by assuming a utility function of constantrelative risk aversion:
U(Y) = Y1−r
1 − r(1)
where r is the coefficient of relative risk aversion (CRRA), and Y is the payoff in the lottery. To illustrate, consider an individualwho chooses the safe option in the first three decisions, then chooses the risky option for each subsequent decision. Thelower bound of the CRRA can be determined by solving for r such that the individual is indifferent between Option A andOption B at Decision 3:
0.361−r
1 − r+ 0.7
4.801−r
1 − r= 0.3
11.551−r
1 − r+ 0.7
0.301−r
1 − r⇔ r ≡ −0.49 (2)
For the same individual, the upper bound is r such that the individual is indifferent between Option A and Option B atDecision 4:
0.461−r
1 − r+ 0.6
4.801−r
1 − r= 0.4
11.551−r
1 − r+ 0.6
0.301−r
1 − r⇔ r ≡ −0.15 (3)
Values of r < 0 indicate risk-loving preferences, r = 0 indicates risk neutrality, and values of r > 0 indicate risk aversion. Forsubjects who switch from Option A to Option B a single time, these ranges are reported in Table 2. We discuss other cases inmore detail below.
At the end of the experiment, subjects completed a survey that began with questions about demographic traits includingage, sex, race, educational attainment, household income and household size.12 The survey included seven health-relatedquestions: one each on cigarette smoking, height and weight (used to define body mass index), seat belt use, driving over thespeed limit, and two questions on alcohol consumption. These questions are reprinted in Appendix B. With one exception(driving over the speed limit), they were adapted from the CDC’s Behavioral Risk Factor Surveillance System.
9 Bellemare and Shearer (2006) conducted the experiment using Canadian tree planters as subjects and reported that their subjects were generally morerisk tolerant than the Holt and Laury subjects. Similarly, Elston et al. (2005) conducted the experiment at two small business conventions and reported thatfull-time entrepreneurs were significantly more risk tolerant than part-time entrepreneurs and non-entrepreneurs.
10 Lottery A, the safe choice, earned subjects either $10 or $8 and Lottery B, the risky choice, earned subjects either $19 or $1.00.11 Once all subjects completed and were paid for the lottery choice experiment they took part in a financial investment experiment that is the subject of
a separate manuscript (Agnew et al., 2008).12 The majority of survey questions dealt with subject experiences and attitudes about the financial investment experiment described in Agnew et al.
(2008).

L.R. Anderson, J.M. Mellor / Journal of Health Economics 27 (2008) 1260–1274 1265
Table 2Lottery choices and risk aversion
Number of safe choices Proportion of subjects Range of relative risk aversion
0–1 0.02 r < −0.952 0.03 −0.95 < r < −0.493 0.09 −0.49 < r < −0.154 0.23 −0.15 < r < 0.155 0.26 0.15 < r < 0.416 0.20 0.41 < r < 0.687 0.10 0.68 < r < 0.978 0.03 0.97 < r < 1.379–10 0.03 1.37 < r
The behaviors measured in our survey represent some of the most significant and well-known behavioral influ-ences on health status. Tobacco use, alcohol consumption, and behaviors tied to overweight and obesity are thoughtto explain almost 40% of U.S. deaths annually (e.g., Mokdad et al., 2004). Seat belt use has long been studied in thecontext of behavioral risks (e.g., Peltzman, 1975, and more recently Hakes and Viscusi, 2007) and is significantly asso-ciated with reductions in traffic fatalities (Department of Transportation, 1984). The evidence linking injuries withdriving over posted speed limits is less clear cut, but some studies suggest that speeding is a contributing factor innearly 30% of all fatal crashes (NHTSA, 1997). In the next section, we report results from the lottery choice experimentand from models of these behaviors that include the experimental measure of risk preference as an explanatory vari-able.
5. Estimation and results
Of the 1094 subjects who participated in the experiment, we excluded three subjects who left at least 1 of the 10 lotterychoice decisions blank. Table 2 shows the distribution of the number of safe choices made by the remaining 1091 subjects,which appears very similar to that reported in other lottery choice experiments. Like those of other studies, our results alsosuggest a considerable amount of heterogeneity in risk preferences. The majority of subjects made either four (23%), five(26%) or six (20%) safe decisions. The comparable percentages reported in Holt and Laury (2002) are 26%, 26%, and 23%, and24%, 12% and 24% in Lusk and Coble (2005). Fourteen percent of our subjects made three or fewer safe decisions; Holt andLaury (2002) and Lusk and Coble (2005) reported 8% and 12%, respectively, in this range.
The majority of our subjects (79%) started with Option A then switched from Option A to Option B once and played OptionB thereafter. However, 21% “switched back” to the safe option after having chosen the risky option. This type of behavior isalso reported in other lottery choice experiments. In Holt and Laury (2002), 13% of 212 subjects switched back to the safeoption in an initial low-payoff treatment, and 7% switched back in a second low-payoff treatment. In Lusk and Coble (2005),6% of 50 subjects did so. The difference in the percentage of such respondents may be attributable to the large fraction ofnon-students and older individuals in our subject pool.13 Like Holt and Laury (2002), we found that a large proportion (48%)of the subjects who switched back did so only once. The comparable percentage in their sample is higher, at around 75%.
For subjects who made multiple switches, we follow Harrison et al. (2007b) and Lusk and Coble (2005) in determiningthe range of values for relative risk aversion. The lower bound of the range is determined by the first switch a subject madefrom the safe lottery to the risky lottery. For example, if a subject chose Lottery A for the first four decisions then switchedto Lottery B for the fifth decision, we use the lower bound associated with four safe choices, which is −0.15 (from Table 2).The upper bound is determined by the last safe choice a subject makes. Continuing with the example above, if this subjectswitched back to Lottery A for the sixth decision and then chose Lottery B for all remaining decisions, we use the upperbound of the range of relative risk aversion associated with six safe choices, which is 0.68 (from Table 2). As Harrison et al.(2007b) explain, this treats subjects as if they were indifferent between the options in the intermediate decisions and have“fat preferences.”
Forty-six subjects in our sample chose the safe option for Decision 10.14 Because a safe choice for the 10th decision meansfavoring a certain $6 over a certain $11.55, we interpret this as a sign the subject did not understand the instructions. Thesesubjects are excluded from our subsequent analysis. This is similar to procedures described in Harrison et al. (2007b), whichdropped 14 of 85 subjects who showed signs of confusion or lack of motivation.
Table 3 reports descriptive statistics for the explanatory variables defined from our survey questions. We exclude thethree subjects who did not make all 10 pairwise lottery choice questions and the 46 subjects who chose the safe lottery indecision 10. This leaves us with 1045 observations; missing data on the other explanatory variables in our models reduces
13 We found evidence consistent with this when we estimated a probit model in which the dependent variable equaled 1 if the subject switched backfrom risky to safe, and 0 otherwise. Age had a positive and significant coefficient and an indicator for current student had a significant negative coefficient.Also of interest is that indicators for the highest income and educational categories had negative and significant coefficients.
14 This number includes the 1.5% shown in Table 2 who made exactly 10 safe decisions, and other subjects who made risky decisions in prior rows butchoose safe in Decision 10.

1266 L.R. Anderson, J.M. Mellor / Journal of Health Economics 27 (2008) 1260–1274
Table 3Explanatory variable definitions, and sample means (n = 978)
Variable Definition Mean
CRRA Coefficient of relative risk aversion (see text for details) 0.257Female Equals 1 if subject is female; 0 otherwise 0.517Age Age at session, in years, calculated as session year minus birth year 45.35Nonwhite Equals 1 if subject is Black, Hispanic, Asian or another race; 0 if White 0.133Current full time student Equals 1 if subject reports employment status as full-time student; 0 otherwise 0.242Some college Equals 1 if highest level of education completed is some college, and subject is not a
full time student; 0 otherwise0.147
College degree Equals 1 if highest level of education completed is college degree, and subject is not afull time student; 0 otherwise
0.261
Graduate degree Equals 1 if highest level of education completed is college degree, and subject is not afull time student; 0 otherwise
0.299
Household income $20–40k Equals 1 if annual pre-tax household income is $20,000–40,000; 0 otherwise,including “no answer”
0.106
Household income $40–60k Equals 1 if annual pre-tax household income is $40,001–60,000; 0 otherwise,including “no answer”
0.135
Household income $60–100k Equals 1 if annual pre-tax household income is $60,001–100,000; 0 otherwise,including “no answer”
0.277
Household income >$100k Equals 1 if annual pre-tax household income is $100,000 or more; 0 otherwise,including “no answer”
0.307
Household income missing Equals 1 if no income range was reported on household income question; 0 otherwise 0.094Household size Number of persons in household, including the subject 2.65Catholic Equals 1 if religious affiliation is Catholic; 0 otherwise 0.203Protestant Equals 1 if religious affiliation is Protestant; 0 otherwise 0.420Other religion Equals 1 if religious affiliation is Jewish, Muslim or other; 0 otherwise 0.172Short-term time horizon Equals 1 if most important time period in planning saving and spending is “next few
months” or “next year”; 0 otherwise0.160
Long-term time horizon Equals 1 if most important time period in planning saving and spending is “longer than10 years”; 0 otherwise
0.269
Table 4Health behavior variable definitions, sample means, and correlations
Variable Definition Mean Pairwise tetrachoric coefficient of correlation with
Cigarettesmoking
Heavy episodicdrinking
Overweight/obese
Seat beltnon-use
Driving overthe speed limit
Cigarette smoking Equals 1 if subjectsmokes cigarettes“every day” or “somedays”; 0 if subject“never” smokes
0.081(n = 977)
1.00
Heavy episodicdrinking
Equals 1 if averagedrinks per day ≥4 forfemale subjects, ≥5 formale subjects; 0otherwise
0.070(n = 946)
0.511***(n = 945)
1.00
Overweight/obese Equals 1 if body massindex ≥25; 0 otherwise
0.468(n = 885)
−0.128(n = 884)
−0.166*(n = 860)
1.00
Seat belt non-use Equals 1 if subjectwears seat belt “never,”“some of the time” or“most of the time”; 0 if“always or almostalways”
0.101(n = 978)
0.348***(n = 977)
0.151(n = 946)
−0.041(n = 885)
1.00
Driving over thespeed limit
Equals 1 if subjectdrives over the speedlimit “always or almostalways”; 0 if “most” or“some of the time,” or“never”
0.092(n = 971)
0.068(n = 970)
0.427***(n = 939)
−0.078(n = 879)
0.132(n = 971)
1.00
Notes: Statistical significance indicated by *0.10 and ***0.01 or better.
our sample to a maximum of 978 observations, and missing data on the dependent variables (reported in Table 4) results inslightly smaller samples in our model estimations.
Our sample includes an almost even mix of males (48%) and females (52%). Subject age ranges from 18 to 87 years, and theaverage subject is 45 years old. About 13% of subjects are nonwhite; of these, the majority are African American. Our subjectpool is highly educated. About one-fourth of the sample are current full-time students, another 30% hold graduate degreesand 26% have a college degree. Those whose highest level of education is high school or less comprise just over 5% of the

L.R. Anderson, J.M. Mellor / Journal of Health Economics 27 (2008) 1260–1274 1267
sample. The household income question was structured with categorical responses. About 10% of the sample did not providean income range for this question so we construct a “missing” dummy variable so as not to lose these observations. All otherincome dummies are coded to 0 for these individuals. Household income is skewed toward the upper-end of the distribution,with 31% reporting annual household income greater than $100,000, and another 28% reporting income between $60,000and $100,000. Those with the lowest income range, less than $20,000, represent just under 8% of the sample.
Table 4 reports the definitions and means of five variables capturing health-related behavioral risks for the sample ofobservations with non-missing data on the explanatory variables. About 8% of respondents reported that they smokedcigarettes every day or some days, and 7% had an episode of heavy drinking in the past week.15 Just under half of thesample was classified as overweight or obese, based on having a body mass index (BMI) greater than 25.16 About 10% ofour sample reported they did not wear seat belts “always or almost always,” and 9% frequently drove over speed limits.Table 4 also reports pairwise correlation coefficients for these five variables: 6 of the 10 raw correlations are positive and 3are statistically significant.17 Later in this section, we describe the results of a factor analysis of these outcome measures.
Compared to national averages, these risky behaviors are less common in our sample. Estimates from 2006 show thatabout 20% of U.S. adults were current smokers, 15% reported an episode of heavy drinking in the past month, and 62% wereclassified as overweight or obese (CDC, 2006). NHTSA (2006) reported nationwide seat belt non-use at 19%. There are severalpossible explanations for these differences. In the case of drinking, differences may be attributable to slight variations in thequestion wording (e.g., our question referenced the past week instead of the past month). Another is that our sample consistsof a high proportion of highly educated individuals. However, educational differences do not account for this entirely, sinceeven in our college-educated subsample we observe lower rates of smoking, drinking, and overweight/obesity comparedto national estimates for this group (CDC, 2007). Another possibility is that the individuals who chose to participate in theexperiment were different in some unobservable trait that is negatively correlated with these behaviors.
It is also possible that individuals underreported their behaviors on the survey. While we tried to minimize underreportingby using self-administered paper questionnaires that were not identified with personal data such as names or addresses, it ispossible that subject responses were affected by social desirability bias. The fact that many responses were broadly definedmay have limited the extent of this type of bias, although the downside to that is that we are unable to distinguish degrees ofriskiness (such as those who drive 20 miles/h above the speed limit versus those who drive 5 miles/h over the limit). Althoughit is not possible to quantify the relative contributions of these factors or the degree of underreporting, measurement error inbinary dependent variables is known to produce attenuated coefficient estimates (Hausman, 2001). In this case, our resultswould underestimate the true relationship between CRRA and behavioral health risks.
We next examine the association between these behavioral health risks and a measure of risk preference defined fromour lottery choice experiment. We estimate separate probit models in which a binary indicator of each risky behavior is thedependent variable, and the main explanatory variable is the midpoint of the subject’s range of CRRA values (indicated inTable 2 for subjects with a single switchpoint from Lotteries A to B, and described earlier in this section for subjects withmultiple switch points). This follows Lusk and Coble (2005). All models also include controls for sex, race, age, education,income, religious affiliation, and time preference, as defined in Table 3.18 As noted earlier, lower rates of time preference mayincrease risky behaviors (e.g., Picone et al., 2004; Khwaja et al., 2007). Religious commitment has been inversely associatedwith binge drinking (e.g., van Ours, 2004), and studies such as Barsky et al. (1997) include religious affiliation as a control inmodels of risky behavior. The results from these probit models are reported as marginal effects and shown in Table 5.
The estimated marginal effect of the CRRA is negative and significant at the 5% level in the model of overweight/obesity,negative and significant at the 10% level in models of cigarette smoking, heavy drinking, and seat belt non-use, and negativebut insignificant in the model of driving over the speed limit. These results suggest that individuals who are more riskaverse, as defined by having a larger CRRA from the lottery choice experiment, are significantly less likely to engage in fourof five of these health risk behaviors, even upon controlling for a large number of individual traits. To evaluate the size ofthe marginal effect for CRRA, we consider the effect of a one standard deviation increase, or an increase of 0.41 units. Thisis roughly equivalent to a change from risk neutral to moderately risk averse. Using the marginal effects and dependentvariable means reported in Table 5, we find that such an increase in risk aversion is associated with a 0.012 percentage pointdecline in the mean probability of smoking, or a 15.2% decline. The same increase in risk aversion is associated with an 8.9%decline in overweight/obesity, a 14.6% decline in seat belt non-use, and a statistically insignificant decline in speeding of11.6%. The decline in heavy drinking associated with this change, though statistically significant, is infinitesimal (at 0.06%).Thus, in several cases the magnitude of the risk aversion effect is meaningfully large, albeit usually smaller than the marginaleffect associated with being female or having a higher household income. We return to the relative contribution of the CRRAvariable in Section 6.
The marginal effects of demographic controls are usually significant, and many have the expected sign. The marginal effectof the female indicator is negative in all models and significant in four of the five models (the exception is in the smoking
15 For men we defined heavy episodic drinking as having an average of five drinks or more on the days they drank; for women we used four drinks ormore. These cutoffs are reported by the Journal of Studies in Alcohol.
16 The body mass index is calculated as weight in pounds multiplied by 703, then divided by height in inches squared.17 Because the five variables were binary we estimated pairwise tetrachoric correlation coefficients.18 The question on time preference in our survey is similar to one included on the HRS.
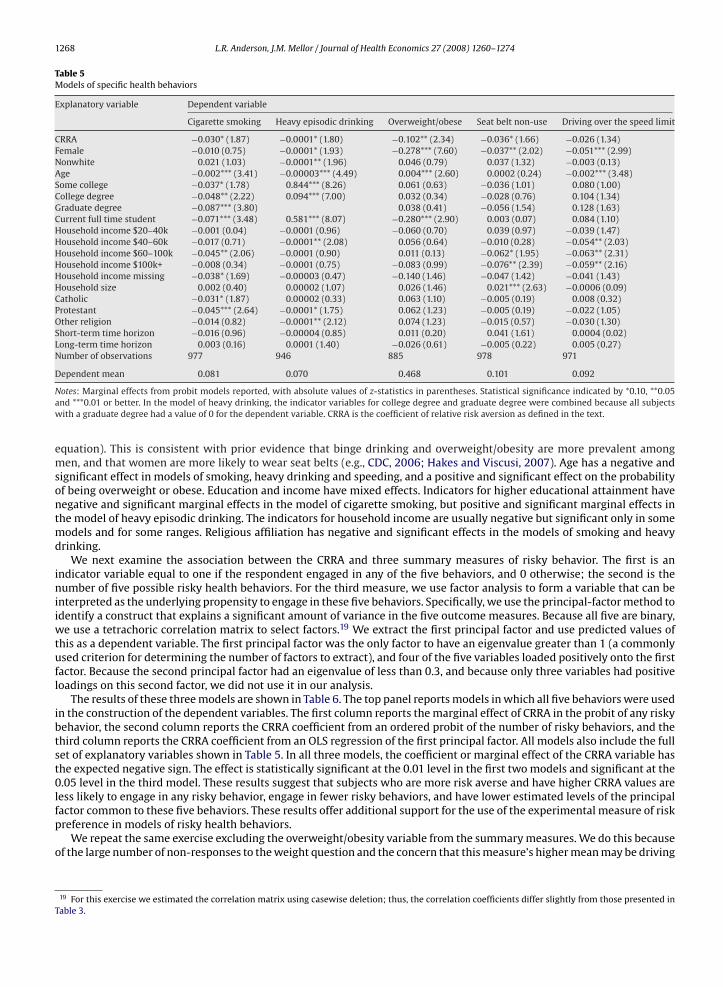
1268 L.R. Anderson, J.M. Mellor / Journal of Health Economics 27 (2008) 1260–1274
Table 5Models of specific health behaviors
Explanatory variable Dependent variable
Cigarette smoking Heavy episodic drinking Overweight/obese Seat belt non-use Driving over the speed limit
CRRA −0.030* (1.87) −0.0001* (1.80) −0.102** (2.34) −0.036* (1.66) −0.026 (1.34)Female −0.010 (0.75) −0.0001* (1.93) −0.278*** (7.60) −0.037** (2.02) −0.051*** (2.99)Nonwhite 0.021 (1.03) −0.0001** (1.96) 0.046 (0.79) 0.037 (1.32) −0.003 (0.13)Age −0.002*** (3.41) −0.00003*** (4.49) 0.004*** (2.60) 0.0002 (0.24) −0.002*** (3.48)Some college −0.037* (1.78) 0.844*** (8.26) 0.061 (0.63) −0.036 (1.01) 0.080 (1.00)College degree −0.048** (2.22) 0.094*** (7.00) 0.032 (0.34) −0.028 (0.76) 0.104 (1.34)Graduate degree −0.087*** (3.80) 0.038 (0.41) −0.056 (1.54) 0.128 (1.63)Current full time student −0.071*** (3.48) 0.581*** (8.07) −0.280*** (2.90) 0.003 (0.07) 0.084 (1.10)Household income $20–40k −0.001 (0.04) −0.0001 (0.96) −0.060 (0.70) 0.039 (0.97) −0.039 (1.47)Household income $40–60k −0.017 (0.71) −0.0001** (2.08) 0.056 (0.64) −0.010 (0.28) −0.054** (2.03)Household income $60–100k −0.045** (2.06) −0.0001 (0.90) 0.011 (0.13) −0.062* (1.95) −0.063** (2.31)Household income $100k+ −0.008 (0.34) −0.0001 (0.75) −0.083 (0.99) −0.076** (2.39) −0.059** (2.16)Household income missing −0.038* (1.69) −0.00003 (0.47) −0.140 (1.46) −0.047 (1.42) −0.041 (1.43)Household size 0.002 (0.40) 0.00002 (1.07) 0.026 (1.46) 0.021*** (2.63) −0.0006 (0.09)Catholic −0.031* (1.87) 0.00002 (0.33) 0.063 (1.10) −0.005 (0.19) 0.008 (0.32)Protestant −0.045*** (2.64) −0.0001* (1.75) 0.062 (1.23) −0.005 (0.19) −0.022 (1.05)Other religion −0.014 (0.82) −0.0001** (2.12) 0.074 (1.23) −0.015 (0.57) −0.030 (1.30)Short-term time horizon −0.016 (0.96) −0.00004 (0.85) 0.011 (0.20) 0.041 (1.61) 0.0004 (0.02)Long-term time horizon 0.003 (0.16) 0.0001 (1.40) −0.026 (0.61) −0.005 (0.22) 0.005 (0.27)Number of observations 977 946 885 978 971
Dependent mean 0.081 0.070 0.468 0.101 0.092
Notes: Marginal effects from probit models reported, with absolute values of z-statistics in parentheses. Statistical significance indicated by *0.10, **0.05and ***0.01 or better. In the model of heavy drinking, the indicator variables for college degree and graduate degree were combined because all subjectswith a graduate degree had a value of 0 for the dependent variable. CRRA is the coefficient of relative risk aversion as defined in the text.
equation). This is consistent with prior evidence that binge drinking and overweight/obesity are more prevalent amongmen, and that women are more likely to wear seat belts (e.g., CDC, 2006; Hakes and Viscusi, 2007). Age has a negative andsignificant effect in models of smoking, heavy drinking and speeding, and a positive and significant effect on the probabilityof being overweight or obese. Education and income have mixed effects. Indicators for higher educational attainment havenegative and significant marginal effects in the model of cigarette smoking, but positive and significant marginal effects inthe model of heavy episodic drinking. The indicators for household income are usually negative but significant only in somemodels and for some ranges. Religious affiliation has negative and significant effects in the models of smoking and heavydrinking.
We next examine the association between the CRRA and three summary measures of risky behavior. The first is anindicator variable equal to one if the respondent engaged in any of the five behaviors, and 0 otherwise; the second is thenumber of five possible risky health behaviors. For the third measure, we use factor analysis to form a variable that can beinterpreted as the underlying propensity to engage in these five behaviors. Specifically, we use the principal-factor method toidentify a construct that explains a significant amount of variance in the five outcome measures. Because all five are binary,we use a tetrachoric correlation matrix to select factors.19 We extract the first principal factor and use predicted values ofthis as a dependent variable. The first principal factor was the only factor to have an eigenvalue greater than 1 (a commonlyused criterion for determining the number of factors to extract), and four of the five variables loaded positively onto the firstfactor. Because the second principal factor had an eigenvalue of less than 0.3, and because only three variables had positiveloadings on this second factor, we did not use it in our analysis.
The results of these three models are shown in Table 6. The top panel reports models in which all five behaviors were usedin the construction of the dependent variables. The first column reports the marginal effect of CRRA in the probit of any riskybehavior, the second column reports the CRRA coefficient from an ordered probit of the number of risky behaviors, and thethird column reports the CRRA coefficient from an OLS regression of the first principal factor. All models also include the fullset of explanatory variables shown in Table 5. In all three models, the coefficient or marginal effect of the CRRA variable hasthe expected negative sign. The effect is statistically significant at the 0.01 level in the first two models and significant at the0.05 level in the third model. These results suggest that subjects who are more risk averse and have higher CRRA values areless likely to engage in any risky behavior, engage in fewer risky behaviors, and have lower estimated levels of the principalfactor common to these five behaviors. These results offer additional support for the use of the experimental measure of riskpreference in models of risky health behaviors.
We repeat the same exercise excluding the overweight/obesity variable from the summary measures. We do this becauseof the large number of non-responses to the weight question and the concern that this measure’s higher mean may be driving
19 For this exercise we estimated the correlation matrix using casewise deletion; thus, the correlation coefficients differ slightly from those presented inTable 3.

L.R. Anderson, J.M. Mellor / Journal of Health Economics 27 (2008) 1260–1274 1269
Table 6Alternate model specifications using summary measures of risk behavior
Dependentvariable
Any riskybehavior(probitmarginal effectsreported)
Number of risky behaviors(ordered probit coefficientsreported)
Principal factor obtained from factor analysis(OLS coefficients reported)
Panel A: All five behaviors usedto construct dependentvariables
CRRA −0.124*** (3.09) −0.349*** (3.70) −0.029** (2.01)Dependent Mean 0.640 0.819 0.054Sample size 889 853 853
Panel B: Overweight/obeseindicator omitted inconstruction of dependentvariables
CRRA −0.078** (2.21) −0.296*** (2.67) −0.034*** (2.47)Dependent Mean 0.266 0.338 0.090Sample size 952 938 938
Notes: All models also include all of the explanatory variables shown in Table 5. Absolute values of z-statistics are shown in parentheses. Statistical significanceindicated by *0.10, **0.05 and ***0.01 or better. CRRA is the coefficient of relative risk aversion as defined in the text.
the results, and because the obese/overweight indicator loaded negatively onto the first principal factor. These results arepresented in the bottom panel of Table 6, and are similar in terms of the sign and statistical significance of the CRRA’s marginaleffect or coefficient.
We next examine the sensitivity of our results to changes in the explanatory variables included in the model, changesin the dependent variable construction, and changes in the sample. In some cases our results were robust to thesechanges. For example, when we re-estimated models by dropping the controls for religious affiliation and financial plan-ning time horizons, we obtained statistically significant results for the CRRA variable in all of the models shown inTables 5 and 6 except two—the speeding model, where the effect of the CRRA was not significant in the first place,and the heavy drinking model, where the marginal effect lost its significance. Because religious affiliation had a signifi-cant effect on heavy drinking, we view the Table 5 version as the preferred specification. When we re-estimated modelsadding controls for marital status, we obtained results for the CRRA similar to those shown in Tables 5 and 6 in termsof sign and significance, with one exception—the statistical significance of CRRA in the smoking model rose to the 0.05level.
Our results are also largely robust to changes in the sample that exclude some subjects who switched back and forth fromthe risky option to the safe option multiple times. As noted above, about one-fifth of our subjects switched back to the safechoice of Lottery A after having made the initial switch to Lottery B in an earlier row. This type of subject behavior is commonin variations of the lottery choice experiment, and we followed the previous literature in dealing with these subjects. Thatsaid, the percentage of subjects who switched-back is somewhat higher in our study, and of this group, a higher percentageswitched-back more than once. This raises questions about how well these subjects comprehended the task and how seriouslythey took it. To examine the influence of these subjects on our results, we re-estimated our models by excluding first, theroughly 4% of the sample who switched-back more than twice, and then the roughly 10% who switched back more thanonce. For all models using summary measures as dependent variables, the results using these two alternate samples werequalitatively similar to those shown in Table 6 in terms of the sign and significance of the CRRA effect. For the individualbehavior models, excluding subjects who switched back more than once led to a loss of statistical significance for the CRRAonly in the model of seat belt non-use; the statistical significance of CRRA was intact in the models of smoking, drinking andoverweight/obese. The CRRA coefficient was negative and significant in the models of smoking, drinking, overweight/obese,and seat belt non-use when subjects who switched back more than twice were excluded.
However, the results in Table 5 are sensitive to changes in the way risk behaviors are defined from the survey questionsshown in Appendix B. For example, we examined what happened to the main results if smoking was re-defined as equalto 1 only when the subject reported smoking “every day” (as opposed to “every day” or “most days” in Table 5 model).For seat belt non-use, we constructed an alternate measure equal to 1 if the subject reported wearing a belt only “someof the time” or “never” (as opposed to any frequency other than “always” in Table 5 model). Table 7 reports alternatedefinitions of all five risk behavior variables, their means, and the effects of the CRRA variable in models of the behaviors.In most cases, such as the alternate models of seat belt non-use and smoking, the CRRA variable still had a negative effect,but the effect was not significant. In two cases the marginal effect of the CRRA variable was positive but insignificant.This was the case when the dependent variable was defined as 1 if the individual was obese and 0 otherwise, and when

1270 L.R. Anderson, J.M. Mellor / Journal of Health Economics 27 (2008) 1260–1274
Table 7Models using alternate definitions of specific risk behaviors
Dependent variable Alternate definition Mean Marginal effect of CRRA
Cigarette smoking Equals 1 if subject smokes cigarettes “every day”; 0 ifsubject smokes “some days” or “never”
0.032 −0.005 (0.78)
Heavy drinking Equals 1 if subject has at least one drink a day every day ofthe week for female subjects, or at least two drinks a dayfor every day of the week for male subjects; 0 otherwise
0.025 0.006 (1.13)
Obese Equals 1 if body mass index ≥30; 0 otherwise 0.115 0.011 (0.47)Body mass index Weight in pounds divided by height in inches squared,
multiplied by 70325.15 −0.597* (1.84)
Seat belt non-use Equals 1 if subject wears seat belt “never” or “some of thetime”; 0 if “most of the time” or “always or almost always”
0.035 −0.016 (1.39)
Driving over the speed limit Equals 1 if subject drives over the speed limit “always oralmost always” or “most of the time”; 0 if “some of thetime” or “never”
0.347 −0.004 (0.11)
Notes: All models also include all of the explanatory variables shown in Table 5. Absolute values of z-statistics are shown in parentheses. Statistical significanceindicated by *0.10, **0.05 and ***0.01 or better. CRRA is the coefficient of relative risk aversions as defined in the text.
heavy drinking was defined as having more than one drink per day for females (two for males) every day during the pastweek.20
In spite of these findings, we prefer the specifications shown in Table 5 for two reasons. The first is that the originaldependent variable definitions are closer to the definitions used in other studies (e.g., Hakes and Viscusi, 2007; CDC, 2006).The second is that, in most cases, the alternate definitions resulted in dependent variables with very low means. Specifically,rates of heavy drinking, seat belt non-use, smoking, and obesity were 2.5%, 3.5%, 3.2%, and 11.5%, respectively.21 These meanvalues are less than those based on the original definitions, which were themselves low compared to national estimates.Thus, it is possible that the alternate definitions are more prone to measurement error; as noted earlier, attenuation biasmay result when a binary dependent variable is subject to measurement error. Nonetheless, some caution is in order. WhileTable 5 results show that the experimental measure can be used to predict risky behaviors, it is clear that our results aresensitive to how the behavior is defined. In light of these findings, and the earlier-noted concern that our survey questionresponse categories may obscure other meaningful differences in risk behavior, additional exploration of how risk behaviorsare defined may be worthwhile in future studies.
6. Discussion and conclusions
Survey questions on respondents’ actual behaviors, hypothetical behaviors, and attitudes have been used in manyempirical studies of health-related behaviors to control for individual risk preference. As Dave and Saffer (2007) explain,incorporating risk preference measures into models of risky behaviors may improve the estimation process and help toidentify differential effects of economic measures or policy instruments within populations. In some studies, risk preferencedefined by hypothetical gamble questions had significant coefficients of the expected sign in models of health-related risks(e.g., Barsky et al., 1997), but other studies have found such risk preference measures to yield unexpected results (e.g., Piconeet al., 2004). In response to concerns that survey questions on attitudes and hypothetical actions may lead to biased ornoisy measures of preferences, a few researchers have used economics experiments to capture preferences for risk-taking,trust, and other-regarding behavior (e.g., Glaeser et al., 2000; Anderson et al., 2004). Because subjects are paid based on thedecisions they make, experiments provide incentive-compatible measures.
In this paper, we examine how well an experiment-based measure of risk preference predicts several health-relatedbehaviors. We find that risk aversion as measured by subject choices in the Holt and Laury (2002) lottery choice experimentis negatively and significantly associated with cigarette smoking, heavy drinking, being overweight or obese, and seat beltnon-use, and with several summary measures of risky behavior. These results suggest that risk-taking is consistent acrossthese multiple behaviors, both when small monetary amounts are at stake, and when the stakes include consequencesfor one’s health. These findings can be interpreted as additional evidence that risky health behaviors are influenced in aconsistent manner by this preference trait. In this regard, our findings build on earlier research by Viscusi and Hersch (2001),Hersch and Viscusi (1998) and Hakes and Viscusi (2007).
Our results offer some guidance in the choice of proxy measures employed in prior studies. While a complete assessmentof the relative merits of all risk preference proxies is not possible with our data, our work does show that two actual behaviorscommonly used as risk preference proxies are significantly related to our experimental measure of risk preference. That is,
20 The USDA defines moderate drinking as the consumption of up to one drink per day for women and up to two drinks per day for men (USDA, 2005).21 In one case the re-defined variable had a higher mean: 35% of subjects reported driving over the speed limit all or most of the time, while only 9%
reported speeding all the time (the construction used in Table 5). Regardless of how speeding was defined, the CRRA marginal effect was not statisticallysignificant. In another case the redefined dependent variable was the body mass index, a continuous measure. In this case the CRRA had a negative andsignificant effect.
L.R. Anderson, J.M. Mellor / Journal of Health Economics 27 (2008) 1260–1274 1271
we find that individuals with higher levels of risk aversion in the experiment were less likely to smoke cigarettes and lesslikely to forego the use of a seat belt. As such our findings validate the use of these measures in future research.
In addition, our results have implications for both experimental economics and research based on household surveys. Ourwork adds to a growing number of studies on the external validity of laboratory experiments. One approach to validationis to examine whether field experiments can replicate results within a naturally occurring environment (e.g., List, 2006).For example, Harrison et al. (2007b) conducted a lottery choice experiment using coin dealers as subjects and rare coinsas prizes, and found that field results validated lab results when there was minimal uncertainty about the value of theprize. Broadly speaking, field experiments often but not always validate findings from laboratory experiments. Our studytakes another approach to the external validation of laboratory experiments by pairing an experimental measure of riskpreference with “real-world” behaviors. Building on evidence provided by Lusk and Coble (2005), which showed that lotterychoice-based risk preference predicted demand for genetically modified food, we find that the same experimental measurepredicts several risky health behaviors. Our survey does not allow us to examine the association between experimentalmeasures and preventive health behaviors (such as flu shots and cancer screening activities), and it would be interesting toexamine these behaviors in future research.
Our results also contribute to an emerging discussion on the merits of pairing large household surveys with experimentaleconomics pilots that elicit incentive-compatible measures of attitudes. The Dohmen et al. (2005) study described earlieris one such example; another is Hammoudi and Thomas (2006), which recruited several hundred rural respondents to the2002 Mexican Family Life Survey to participate in a series of economics experiments measuring preferences. They reportedthat experimental measures of risk preferences and intertemporal choice were sometimes correlated with behaviors in wayspredicted by theory. Their work is part of a larger project on the merits of integrating experiments into existing householdsurveys funded by the National Institutes of Health. Related projects have been funded by the National Science Foundationand private foundations.
The results presented here suggest that there are benefits to incorporating experiments into surveys. The results fromsignificance tests of the CRRA variable suggest that the addition of this measure increases the explanatory power of most ofthe models reported in Tables 5 and 6 (the exception is speeding). Of course this gain in predictive power is not costless. Acrossall of our sessions, subjects received average earnings of $7 in the lottery choice experiment, making the total earnings paidjust over $7500. For surveys in which an interviewer assists in the completion of the survey in the presence of the respondent,adding the lottery choice experiment would involve a small increase in survey time, which we estimate to be approximately15 minutes per subject.
Clearly many issues remain regarding the costs of adding experiments to national surveys that are conducted by mail orphone, the challenges more representative samples may face in completing such a task, and the merits of the experimentalmeasure relative to its alternatives. For example, adding an indicator variable for smoking also increased the explanatorypower of models of seat belt non-use and heavy drinking according to results of t-tests. Interestingly, the effects of seat beltnon-use or smoking were sometimes statistically insignificant in models of other risk behaviors. Smoking had an insignificanteffect in models of speeding and overweight, and seat belt non-use had an insignificant effect in models of drinking, speeding,and overweight. Thus, our findings suggest that there may be additional benefits from using an experimental measure ofrisk preference to predict certain health-related behaviors.
Acknowledgments
Financial support for this research was provided by the Schroeder Center for Healthcare Policy at the Thomas JeffersonProgram in Public Policy at the College of William & Mary and the FINRA Investor Education Foundation. We are grate-ful to Anderson’s co-PIs Julie Agnew, Jeff Gerlach, and Lisa Szykman for agreeing to add the health behaviors componentto the FINRA project. We also thank Editor Richard Frank and two anonymous referees for their helpful comments andsuggestions.
Appendix A. Experiment Instructions (from http://veconlab.econ.virginia.edu/admin.htm)
InstructionsID number:You will be making choices between two lotteries, such as those represented as “Option A” and “Option B” below. The
money prizes are determined by throwing a 10-sided die. Each outcome, 1, 2, 3, 4, 5, 6, 7, 8, 9, 10, is equally likely. Thus, ifyou choose Option A, you will have a 1 in 10 chance of earning $6.00 and a 9 in 10 chance of earning $4.80. Similarly, OptionB offers a 1 in 10 chance of earning $11.55 and a 9 in 10 chance of earning $0.30.
Decision Option A Option B Your choice (circle one)
1st $6.00 if the die is 1; $4.80 if the die is 2–10 $11.55 if the die is 1; $0.30 if the die is 2–10 A or B
Each row of the decision table contains a pair of choices between Option A and Option B.

1272 L.R. Anderson, J.M. Mellor / Journal of Health Economics 27 (2008) 1260–1274
You make your choice by circling either “A” or “B” in the far right hand column of the table. Only one option in each row(i.e. for each Decision) can be circled.
Decision Option A Option B Your choice (circle one)
1st $6.00 if the die is 1; $4.80 if the die is 2–10 $11.55 if the die is 1; $0.30 if the die is 2–10 A or B2nd $6.00 if the die is 1–2; $4.80 if the die is 3–10 $11.55 if the die is 1–2; $0.30 if the die is 3–10 A or B...
Even though you will make 10 decisions, only one of these will end up being used. The selection of the one to be useddepends on the throw of a 10-sided die. No decision is any more likely to be used than any other, and you will not know inadvance which one will be selected, so please think about each one carefully. The first throw of the 10-sided die fixes therow (i.e. the Decision) that will be used to determine your earnings. For example, suppose that you make all 10 decisionsand the throw of the die is 9, then your choice, A or B, for decision 9 below would be used and the other decisions would notbe used.
Decision Option A Option B Your choice (circle one)
9th $6.00 if the die is 1–9; $4.80 if the die is 10 $11.55 if the die is 1–9; $0.30 if the die is 10 A or B...
After the random die throw fixes the Decision row that will be used, we need to make a second die throw to determinethe earnings for the Option you chose for that row. In Decision 9 below, for example, a throw of 1, 2, 3, 4, 5, 6, 7, 8, or 9 willresult in the higher payoff for the option you chose, and a throw of 10 will result in the lower payoff.
Decision Option A Option B Your choice
9th $6.00 if the die is 1–9; $4.80 if the die is 10 $11.55 if the die is 1–9; $0.30 if the die is 10 A or B10th $6.00 if the die is 1–10 $11.55 if the die is 1–10 A or B
For decision 10, the random die throw will not be needed, since the choice is between amounts of money that are fixed:$6.00 for Option A and $11.55 for Option B.
Making 10 decisions: At the end of these instructions you will see a table with 10 decisions in 10 separate rows, and youchoose by circling one choice (A or B) in the far right hand column for each of the 10 rows. You may make these choices inany order.
The relevant decision: One of the rows (i.e. Decisions) is then selected at random, and the Option (A or B) that you chose inthat row will be used to determine your earnings. Note: Please think about each decision carefully, since each row is equallylikely to end up being the one that is used to determine payoffs.
Determining the payoff: After one of the decisions has been randomly selected, we will throw the 10-sided die a secondtime. The number is equally likely to be 1, 2, 3, . . ., 10. This number determines your earnings for the Option (A or B) thatyou previously selected for the decision being used.
Instructions summary:
To summarize, you will indicate an option, A or B, for each of the rows by circling one choice in the far right hand column.Then the throw of a 10-sided die fixes which row of the table (i.e. which Decision) is relevant for your earnings.In that row, your decision fixed the choice for that row, Option A or Option B, and a final throw of the 10-sided die willdetermine the money payoff for the decision you made.
Decision sheetDecision Option A Option B Your decision (circle one)
1 $6.00 if the die is 1; $4.80 if the die is 2–10 $11.55 if the die is 1; $0.30 if the die is 2–10 A or B2 $6.00 if the die is 1–2; $4.80 if the die is 3–10 $11.55 if the die is 1–2; $0.30 if the die is 3–10 A or B3 $6.00 if the die is 1–3; $4.80 if the die is 4–10 $11.55 if the die is 1–3; $0.30 if the die is 4–10 A or B4 $6.00 if the die is 1–4; $4.80 if the die is 5–10 $11.55 if the die is 1–4; $0.30 if the die is 5–10 A or B5 $6.00 if the die is 1–5; $4.80 if the die is 6–10 $11.55 if the die is 1–5; $0.30 if the die is 6–10 A or B6 $6.00 if the die is 1–6; $4.80 if the die is 7–10 $11.55 if the die is 1–6; $0.30 if the die is 7–10 A or B7 $6.00 if the die is 1–7; $4.80 if the die is 8–10 $11.55 if the die is 1–7; $0.30 if the die is 8–10 A or B8 $6.00 if the die is 1–8; $4.80 if the die is 9–10 $11.55 if the die is 1–8; $0.30 if the die is 9–10 A or B9 $6.00 if the die is 1–9; $4.80 if the die is 10 $11.55 if the die is 1–9; $0.30 if the die is 10 A or B
10 $6.00 if the die is 1–10 $11.55 if the die is 1–10 A or B
Result of first die throw (to determine Decision): . Result of second die throw (to determine payoff): . Payoff: .

L.R. Anderson, J.M. Mellor / Journal of Health Economics 27 (2008) 1260–1274 1273
Appendix B. Survey questions on health-related behaviors
References
Agnew, J., Anderson, L.R., Gerlach, J., Szykman, L., 2008. Who chooses annuities? An experimental investigation of the role of gender, framing, and defaults.American Economic Review Papers and Proceedings 98 (2), 418–422.
Anderson, L.R., Jennifer, M.M., Milyo, J., 2004. Social capital and contributions in a public goods experiment. American Economic Review Papers andProceedings 94 (2), 373–376.
Arrondel, L., 2002. Risk management and wealth accumulation behavior in France. Economics Letters 74, 187–194.Barsky, R.B., Miles, K., Thomas Juster, F., Shapiro, M., 1997. Preference parameters and behavioral heterogeneity: an experimental approach in the health and
retirement study. Quarterly Journal of Economics 112 (2), 537–579.Bellemare, C., Shearer, B.S., 2006. Sorting, Incentives and Risk Preferences: Evidence from a Field Experiment. IZA Discussion Paper No. 2227.Brown, S., Taylor, K., 2007. Education, Risk Preference and Wages. Department of Economics, University of Sheffield.Centers for Disease Control and Prevention (CDC), 2007. Cigarette Smoking Among Adults, United States 2006. Mortality and Morbidity Weekly Report 56
(44), 1157–1161.Centers for Disease Control and Prevention (CDC), 2006. Behavioral Risk Factor Surveillance System Survey Data. U.S. Department of Health and Human
Services, Centers for Disease Control and Prevention, Atlanta, GA.Charles, K.K., Hurst, C., 2003. The correlation of wealth across generations. Journal of Political Economy 111, 1155–1182.Clark, J., 2002. House money effects in public goods experiments. Experimental Economics 5, 223–231.Dave, D., Saffer, H., 2007. Risk Tolerance and Alcohol Demand Among Adults and Older Adults. National Bureau of Economic Research Working Paper No.
13482.Department of Transportation, 1984. Regulatory Impact Analysis of FMVSS 208: Occupant Crash Protection. Department of Transportation, Washington,
DC.Dohmen, T., Falk, A., Huffman, D., Sunde, U., Schupp, J., Wagner, G.G., 2005. Individual Risk Attitudes: New Evidence from a Large, Representative,
Experimentally-Validated Survey. IZA Discussion Paper No. 1730.

1274 L.R. Anderson, J.M. Mellor / Journal of Health Economics 27 (2008) 1260–1274
Elston, J.A., Harrison, G.W., Rutström, E.E., 2005. Characterizing the Entrepreneur Using Field Experiments. Working Paper, Max Planck Institute of Economics.Evans, W.N., Montgomery, E., 1994. Education and Health: Where’s There’s Smoke There’s An Instrument. National Bureau of Economic Research, Working
Paper 4949.Fuchs, V.R., 1982. Time preferences and health: an exploratory study. In: Fuchs, V.R. (Ed.), Economic Aspects of Health. University of Chicago Press, Chicago.Glaeser, E.L., David, I.L., José, A.S., Soutter, C.L., 2000. Measuring trust. Quarterly Journal of Economics 115 (3), 811–846.Guiso, L., Paiella, M., 2005. The Role of Risk Aversion in Predicting Individual Behavior. Bank of Italy, Working Paper No. 546.Hakes, J.K., Viscusi, W.K., 2007. Automobile seatbelt usage and the value of a statistical life. Southern Economic Journal 73, 659–676.Hammoudi, A., Thomas, D., 2006. Do you care? Altruism and Inter-Generational Exchanges in Mexico. California Center for Population Research, University
of California Los Angeles, Working Paper No. 008-06.Hartog, J., Ferrer-i-Carbonell, A., Jonker, N., 2000. On a Simple Measure of Individual Risk Aversion. Tinbergen Institute Discussion Paper TI2000-074/3.Harrison, G.W., Morten, L., Rutström, E., 2007a. Estimating risk attitudes in Denmark: a field experiment. Scandinavian Journal of Economics 109 (2),
341–368.Harrison, G.W., John, A.L., Towe, C., 2007b. Naturally occurring preferences and exogenous laboratory experiments: a case study of risk aversion. Econometrica
75 (2), 433–458.Hausman, J., 2001. Mismeasured variables in econometric analysis: problems from the right and problems from the left. Journal of Economic Perspectives
15 (4), 57–67.Hersch, J., Viscusi, W.K., 1990. Cigarette smoking, seatbelt use, and differences in wage-risk tradeoffs. Journal of Human Resources 25 (2), 202–227.Hersch, J., Viscusi, W.K., 1998. Smoking and other risky behaviors. Journal of Drug Issues 28 (3), 645–661.Holt, C.A., Laury, S.K., 2002. Risk aversion and incentive effects. The American Economic Review 92 (5), 1644–1655.Horowitz, J.K., McConnell, K.E., 2002. A review of WTA/WTP studies. The Journal of Environmental Economics and Management 44, 426–447.Kan, K., 2003. Residential mobility and job changes under uncertainty. Journal of Urban Economics 54, 566–586.Kaplow, L., 2005. The value of a statistical life and the coefficient of relative risk aversion. The Journal of Risk and Uncertainty 31 (1), 23–34.Kapteyn, A., Teppa, F., 2002. Subjective Measures of Risk Aversion and Portfolio Choice. RAND Corporation, Labor and Population Program Working Paper
Series, DRU-2802, 02-03.Khwaja, A., Dan, S., Sloan, F., 2007. Time preference, time discounting and smoking decisions. Journal of Health Economics 26, 927–949.Kimball, M.S., Sahm, C.R., Shapiro, M.D., 2007. Imputing Risk Tolerance from Survey Responses. Department of Economics, The University of Michigan.Kruse, J.B., Thompson, M.A., 2003. Valuing low probability risk: survey and experimental evidence. Journal of Economic Behavior and Organization 50,
495–505.Lahiri, K., Song, J.G., 2000. The effect of smoking on health using a sequential self-selection model. Health Economics 9, 491–511.List, J.A., 2006. Field experiments: a bridge between lab and naturally occurring data. Advances in Economic Analysis & Policy 6 (2), 1–45.Luoh, M.-C., Stafford, F., 2007. Estimating Risk Tolerance from the 1996 PSID. Available on-line at: http://psidonline.isr.umich.edu/Data/Documentation/Cbks/
Support.html.Lusardi, A., 1998. On the importance of the precautionary saving motive. American Economic Review 88 (2), 449–453.Lusk, J.L., Coble, K.H., 2005. Risk perceptions, risk preference, and acceptance of risky food. American Journal of Agricultural Economics 87 (2), 393–405.Mokdad, A.H., James, S.M., Donna, F.S., Gerberding, J.L., 2004. Actual causes of death in the United States, 2000. Journal of the American Medical Association
291, 1238–1245.National Highway Traffic Safety Administration (NHTSA), November 2006. Seat belt use in 2006—overall results. DOT HS 810-677. U.S. Department of
Transportation.National Highway Traffic Safety Administration (NHTSA), January 1997. Summary of State Speed Laws. DOT HS 808-510. U.S. Department of Transportation.Peltzman, S., 1975. The effects of automobile safety regulation. Journal of Political Economy 83, 667–725.Picone, G., Frank, S., Taylor Jr., D., 2004. Effects of risk and time preference and expected longevity on demand for medical tests. The Journal of Risk and
Uncertainty 28 (1), 39–53.Schmidt, L., 2007. Risk Preferences and the Timing of Marriage and Childbearing. Department of Economics, Williams College.Sloan, F.A., Norton, E.C., 1997. Adverse selection, bequests, crowding out, and private demand for insurance: evidence from the market for long term care
insurance. Journal of Risk and Uncertainty 15 (3), 210–219.United States Department of Agriculture (USDA)., 2005. Dietary Guidelines for Americans. US Government Printing Office, Washington, DC.van Ours, J.C., 2004. A pint a day raises a man’s pay; but smoking blows that gain away. Journal of Health Economics 23 (5), 863–886.Viscusi, W.K., Hersch, J., 2001. Cigarette smokers as job risk takers. The Review of Economics and Statistics 83 (2), 269–280.Weber, E.U., Ann-Renee, B., Betz, N.E., 2005. A domain-specific risk-attitude scale: measuring risk perceptions and risk behaviors. Journal of Behavioral
Decision Making 15, 263–290.