Embed Size (px)
Citation preview
AoC College Workforce Survey 2016 Summary of findings March 2017
2
Table of contents LIST OF TABLES .............................................................................................................. 4 1. INTRODUCTION ...................................................................................................... 6 2. KEY FINDINGS ......................................................................................................... 7 3. BACKGROUND INFORMATION ...........................................................................10 4. COLLEGE STAFF AND COMPOSITION.................................................................12 4.1 COLLEGE EMPLOYEES (EXCLUDING AGENCY WORKERS) ....................................................12 4.2 HR STAFF BY FUNCTION ...............................................................................................13 4.3 FLEXIBLE CONTRACTS ...................................................................................................14 4.4 APPRENTICESHIPS........................................................................................................14 4.5 EU AND NON EU STAFF NUMBERS.................................................................................15 5. STAFF TURNOVER .................................................................................................16 5.1 STAFF TURNOVER BY CATEGORY OF STAFF ......................................................................16 5.2 REASONS FOR TURNOVER .............................................................................................17 6. REDUNDANCIES ....................................................................................................19 7. VACANT AND HARD TO FILL POSTS...................................................................20 7.1 VACANT POSTS ............................................................................................................20 7.2 HARD TO FILL VACANCIES .............................................................................................20 7.3 REASONS FOR RECRUITMENT DIFFICULTIES .....................................................................21 8. TERMS AND CONDITIONS ...................................................................................23 8.1 CONTRACTUAL WORKING WEEK.....................................................................................23 8.2 PAID HOLIDAY ENTITLEMENT.........................................................................................23 8.3 CLOSURE/EFFICIENCY DAYS...........................................................................................24 8.4 OCCUPATIONAL SICK PAY .............................................................................................25 8.5 STATUTORY AND ENHANCED PAY...................................................................................26 9. WORKFORCE DEVELOPMENT BUDGET ..............................................................27 10. PAY ..........................................................................................................................28 10.1 AOC HARMONISED PAY SPINE .....................................................................................28 10.2 2016/17 PAY AWARDS ..............................................................................................28 10.3 2017/18 PAY AWARDS ..............................................................................................29 10.4 AVERAGE SALARY FOR LECTURERS................................................................................31 10.5 AVERAGE PAY FOR APPRENTICES..................................................................................31 10.6 AUTOMATIC INCREMENTAL PAY PROGRESSION..............................................................31 10.7 GENERAL COMMENTS ON PAY .....................................................................................32

3
11. SICKNESS ABSENCE ...............................................................................................33 11.1 OVERALL ABSENCE RATES AND LOST TIME ....................................................................33 11.2 REASONS FOR SICKNESS ABSENCE ...............................................................................36 12. OTHER COMMENTS AND CLARIFICATION OF COLLEGE RESPONSES ............37 APPENDIX A – NOTES FOR COMPLETION ................................................................38
4
List of tables TABLE 1. RESPONSE RATE BY COLLEGE TYPE 10 TABLE 2. RESPONSE RATE BY COLLEGE REGION 11 TABLE 3. COLLEGE EMPLOYEE HEADCOUNT AND ESTIMATE OF COLLEGE WORKFORCE (EXCLUDING
AGENCY WORKERS) BY CATEGORY OF STAFF, ENGLAND 2015/16 12 TABLE 4. COLLEGE EMPLOYEE HEADCOUNT AND ESTIMATE OF COLLEGE WORKFORCE (EXCLUDING
AGENCY WORKERS) BY CATEGORY OF STAFF, WALES 2015/16 12 TABLE 5. COLLEGE EMPLOYEE HEADCOUNT (EXCLUDING AGENCY WORKERS) BY GENDER, ENGLAND 2015/16 13 TABLE 6. COLLEGE EMPLOYEE HEADCOUNT (EXCLUDING AGENCY WORKERS) BY GENDER, WALES
2015/16 13 TABLE 7. HR STAFF BY FUNCTION 13 TABLE 8. PROPORTION OF COLLEGE STAFF ON FLEXIBLE CONTRACTS BETWEEN 1 SEPTEMBER
2015 TO 31 AUGUST 2016 14 TABLE 9. AVERAGE NUMBER OF APPRENTICES (HEADCOUNT) EMPLOYED IN ENGLAND, 2015/16 14 TABLE 10. ESTIMATE OF COLLEGE STAFF THAT WERE (A) FROM THE EU (EXCL. UK) AND (B) ON
WORK PERMITS IN 2015/16 15 TABLE 11. STAFF TURNOVER BY CATEGORY OF STAFF, 2011/12 - 2015/16 16 TABLE 12. STAFF TURNOVER BY CATEGORY OF STAFF AND REGION, 2015/16 17 TABLE 13. THREE MAIN REASONS FOR STAFF TURNOVER, 2015/16 18 TABLE 14. VOLUNTARY AND COMPULSORY REDUNDANCIES IN COLLEGES IN 2015/16 19 TABLE 15. VOLUNTARY AND COMPULSORY REDUNDANCIES IN COLLEGES BY CATEGORY OF STAFF
IN 2015/16 19 TABLE 16. VACANT POSTS ON 1 SEPTEMBER 2016 20 TABLE 17. HARD TO FILL POSTS, 2015/16 21 TABLE 18. THREE MAIN REASONS FOR STAFF RECRUITMENT DIFFICULTIES, 2015/16 22 TABLE 19. STANDARD FULL-TIME CONTRACTUAL WORKING WEEK, 1 SEPTEMBER 2016 23 TABLE 20. AVERAGE STANDARD HOURS FOR TEACHING CONTACT TIME, 1 SEPTEMBER 2016 23 TABLE 21. CONTRACTUAL PAID HOLIDAY ENTITLEMENT, 1 SEPTEMBER 2016 23 TABLE 22. NUMBER OF CLOSURE/EFFICIENCY DAYS, 2016/17 24 TABLE 23. AVERAGE NUMBER OF CLOSURE/EFFICIENCY DAYS FOR ALL STAFF, 2016/17 24 TABLE 24. MAXIMUM OCCUPATIONAL SICK PAY PAYABLE TO STAFF 25 TABLE 25. ROLLING PERIOD USED AS THE REFERENCE PERIOD TO CALCULATE ELIGIBILITY TO
OCCUPATIONAL SICK PAY 25 TABLE 26. STATUTORY OR ENHANCED PAY FOR EACH OF THE FOLLOWING 26 TABLE 27. COLLEGE INCOME ALLOCATED TO WORKFORCE DEVELOPMENT IN 2015/16 27 TABLE 28. WORKFORCE DEVELOPMENT SPENDING AS A PERCENTAGE OF TOTAL INCOME IN
2015/16 27 TABLE 29. DID COLLEGES MAKE OR PLAN TO MAKE A PAY AWARD IN 2016/17? 28 TABLE 30. DID COLLEGES FOLLOW THE AOC RECOMMENDED PAY AWARD IN 2016/17? 28 TABLE 31. PAY AWARDS BY COLLEGES THAT DIDN’T FOLLOW THE AOC RECOMMENDED PAY
AWARD IN 2016/17 29
5
TABLE 32. PERCENTAGE UPLIFT AWARDED BY COLLEGES THAT DIDN’T FOLLOW THE AOC
RECOMMENDED PAY AWARD IN 2016/17 29 TABLE 33. CONSOLIDATED OR UNCONSOLIDATED PAY AWARDS IN 2016/17 29 TABLE 34. DO COLLEGES ANTICIPATE MAKING ANY SORT OF PAY AWARD FOR 2017/18? 30 TABLE 35. WHAT ARE COLLEGES BUDGETING FOR 2017/18 PAY AWARDS? 30 TABLE 36. WHEN WILL 2017/18 PAY AWARDS BE DECIDED? 30 TABLE 37. AVERAGE ANNUAL SALARY FOR LECTURERS IN COLLEGES 31 TABLE 38. CURRENT MINIMUM HOURLY RATE OF PAY FOR APPRENTICES EMPLOYED BY COLLEGES
31 TABLE 39. AUTOMATIC INCREMENTAL PAY PROGRESSION IN COLLEGES 31 TABLE 40. PERCENTAGE OF COLLEGE STAFF ELIGIBLE FOR AUTOMATIC INCREMENTAL PAY
PROGRESSION, BY CATEGORY OF STAFF 32 TABLE 41. ABSENCE RATE AND LOST TIME PERCENTAGE, 2011/12 – 2015/16 34 TABLE 42. ABSENCE RATE BY CATEGORY OF STAFF, 2015/16 34 TABLE 43. LOST TIME PERCENTAGE BY CATEGORY OF STAFF, 2015/16 34 TABLE 44. ABSENCE RATE BY CATEGORY OF STAFF AND REGION, 2015/16 35 TABLE 45. LOST TIME PERCENTAGE BY CATEGORY OF STAFF AND REGION, 2015/16 35 TABLE 46. THREE MAIN REASONS FOR SICKNESS ABSENCE, 2015/16 36
6
1. Introduction This annual AoC survey focuses primarily on the key headline performance indicators and benchmarks that HR departments in colleges frequently report on: • headcount of college staff and composition • staff turnover and reasons, voluntary and compulsory redundancies • vacant posts, hard-to-fill vacancies and reasons for recruitment difficulties • terms and conditions (contractual working week, annual leave, teaching
contact time, closure days, sick pay, statutory and enhanced pay) • workforce development budget • pay (2016/17 and 2017/18 pay awards and automatic incremental pay
progression) • sickness absence and reasons. Colleges were asked to provide information for all staff in colleges as well as to give a breakdown by the following three categories: • Management staff (incl. leadership teams): this category is defined as full-time
and part-time staff (including those on flexible contracts) that are on the management pay spine. This includes teaching staff with management responsibility and senior post holders (e.g. principals, vice/assistant principals and clerks).
• Teaching staff: this category is defined as full-time and part-time/fractional staff (including those on flexible contracts). This includes associate lecturers and also teaching staff employed on an hourly-paid basis. Instructors and demonstrators that fall into this category should be excluded from the teaching staff category and instead included in support staff.
• Support staff: this category is defined as full-time and part-time staff (including those on flexible contracts) who are employed on support terms and conditions, including instructors and demonstrators.
The intelligence gathered will be used as part of AoC’s representation work on behalf of members and will also be useful benchmarking data for member colleges. The AoC College Workforce Survey 2016 was conducted during December 2016 and January 2017. The census period for the majority of the workforce data collection is the period 1 September 2015 - 31 August 2016 (i.e. the last academic year 2015/16). Section 9 focuses on 'pay' and asks questions about 2016/17 and 2017/18 pay awards. For other sections (and some questions within the above) the census date is 1 September 2016 or current practice. A copy of the notes for completing the survey can be found in Appendix A of this report.
7
2. Key findings • Based on survey responses from 140 colleges in England, we estimate that the
total college workforce in England in 2015/16 was 189,000 employees. This is a headcount and excludes agency workers.
• Our estimate is that the college workforce in England includes 76,000 teachers,
15,000 management staff (this includes teaching staff with management responsibility and senior post holders) and 97,000 support staff (including instructors and demonstrators).
• We estimate that there were approximately 14,000 staff in colleges in Wales in
2015/16 – this is based on survey responses from 9 colleges in Wales. • 63% of college employees in England are female and 36% are male1. 56% of
managers, 58% of teachers and 69% of support staff are female. • HR staff make up approximately 1.6% of staff in colleges in England and Wales. • The survey shows that 97% of colleges use flexible contracts. • The average college in England employs 8 apprentices. This is approximately
2,500 in the sector as a whole, accounting for 1.3% of college employees. • 85% of colleges that responded expect that their college will be able to spend
its full apprenticeship levy in 2017/18. • 58% of colleges reported having less than 5% (but greater than zero) of staff
from the EU (excluding UK). Just over one-third (36%) said less than 5% (but greater than zero) of their staff were employed on work permits.
• The average college in England has 23 staff from the EU (excluding UK),
roughly 7,500 in the sector as a whole, accounting for approximately 4% of total college employees2.
• In 2015/16, the average staff turnover was 18.2% across all three categories of
staff (15.1% for management staff, 18.2% for teaching staff and 18.0% for support staff). Staff turnover in 2014/15 was 21.0%, though is this not directly comparable to the latest figures due to a change in methodology for 2015/16. Overall, turnover is highest in the south east (23.6% on average) and lowest in the East Midlands (15.1% on average) and Wales (11.8% on average).
1 Percentages do not sum to 100% due to rounding 2 Approximate calculations based on college estimates of the proportion (percentage bands) of total staff from the EU (excluding UK)
8
• The main reason for turnover in each category of staff was (1) promotion outside the college. For management staff this was followed by (2) retirement and (3) voluntary redundancy, for teaching staff – (2) retirement and (3) personal / family circumstances and for support staff – (2) change of career and (3) personal / family circumstances.
• 70% of colleges reported having voluntary redundancies and 61% reported
having compulsory redundancies in 2015/16. • The average college had 15 vacant posts at the start of the academic year (1
September 2016). • The top three most difficult to fill posts in 2015/16 were teaching jobs in
engineering, mathematics and construction (this was also the case in the previous two surveys).
• The top three reasons for recruitment difficulties across all college staff were
lack of necessary specialist skills, looking for more pay than college could offer and no applicants (this was closely followed by insufficient experience).
• The standard full-time contractual working week for all college staff is reported
as 37 hours a week. Average standard hours for teaching contact time are 24 hours per week which translates into an average figure of 869 hours per year.
• Average paid holiday time is 33 days a year with 27 days on average for
support staff (down to a minimum of 20 days in some colleges) and 41 days for teaching staff (with a range from zero to 67 days).
• The majority (77%) of colleges expect to have 3-5 closure/efficiency days for all
staff in 2016/17. In 71% of colleges, closure days are contractual. • 84% of colleges reported that the maximum occupational sick pay payable to
staff was 6 months full pay and 6 months half pay. 90% of colleges use a 12 months rolling period as the reference period to calculate eligibility to occupational sick pay.
• Two-thirds of colleges offer statutory pay for redundancy (65%) and shared
parental leave (68%). 85% of colleges offer enhanced pay for maternity, whilst 58% offer it for paternity and 67% offer it for adoption leave.
• Colleges spent an average of £105,000 on workforce development in 2015/16.
This ranged from 0% to 3.2% of total income, but in the majority (75%) of colleges it was less than 0.5% of total income.
• 24% of colleges use the AoC harmonised pay spine.
9
• 57% of colleges reported making a pay award in 2016/17 of which just under half (46%) followed the AoC recommended pay award. Out of the 54% colleges that didn’t follow the AoC recommended pay award, the majority (71%) said they awarded 1%.
• 79% of colleges that made a pay award in 2016/17 said that this was
consolidated. • 85% of colleges said that it was too early to say whether or not they would be
making any sort of pay award for 2017/18. • The survey shows that the average annual salary for college lecturers is
£30,182. • The average current minimum hourly rate of pay for apprentices employed by
colleges is £4.63. • 72% of colleges reported operating automatic incremental pay progression. • The figures from this year’s survey show an overall absence rate of 5.8 days
per employee and a lost time percentage of 3.1% in 2015/16. The 2014/15 figures (though not directly comparable due to a change in methodology for 2015/16) found an overall absence rate of 7.4 days per employee and a lost time percentage of 3.1%.
• Average support staff absence rates were higher at 6.2% than teaching staff
(5.6%) and management staff (4.3%).

10
3. Background information 153 providers responded to this survey – 143 colleges in England; 9 colleges in Wales and 1 independent specialist college. This represents 44% of colleges in England and 64% of colleges in Wales. Four of the responses from England were for part of a recently merged college (i.e. one member of the group) Data and summary tables shown are for colleges in England and Wales unless specified otherwise. Not all colleges responded to every question. The number of responses for each question is shown within or under each table/chart. Responses by college type and region are shown in the tables below. More than half of all general further education colleges responded to the survey compared with only 19% of sixth form colleges. Table 1. Response rate by college type
Type Number of responses
Number of Colleges in
England / Wales
Percent within
type
Percentage of total
responses in England
Percentage of total
responses General further education college
116 208 56% 81% 76%
Sixth form college 17 90 19% 12% 11% Specialist college 10 26 38% 7% 7% Total colleges in England
143 324 44% 100%
Total colleges in Wales
9 14 64% 6%
Other 1 1% Total responses 153 100%

11
Table 2. Response rate by college region
Region Number of responses
Number of Colleges in
region
Percent within region
Percentage of total
responses in England
Percentage of total
responses Eastern region 12 33 36% 8% 8% East Midlands 12 20 60% 8% 8% Greater London 28 47 60% 20% 18% North East 9 19 47% 6% 6% North West 19 55 35% 13% 12% South East 21 58 36% 15% 14% South West 11 24 46% 8% 7% West Midlands 13 35 37% 9% 8% Yorkshire and the Humber
18 33 55% 13% 12%
Total colleges in England
143 324 44% 100%
Wales 9 14 64% 6% Other 1 1% Total responses 153 100%
12
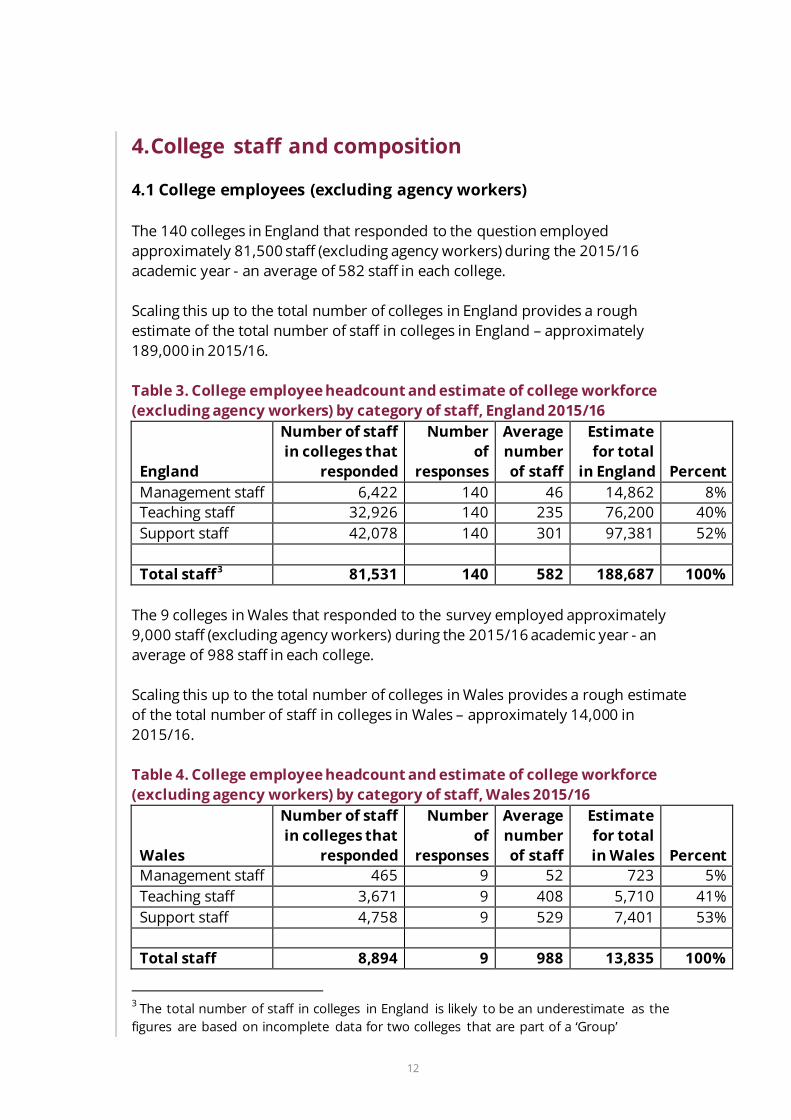
4. College staff and composition 4.1 College employees (excluding agency workers) The 140 colleges in England that responded to the question employed approximately 81,500 staff (excluding agency workers) during the 2015/16 academic year - an average of 582 staff in each college. Scaling this up to the total number of colleges in England provides a rough estimate of the total number of staff in colleges in England – approximately 189,000 in 2015/16. Table 3. College employee headcount and estimate of college workforce (excluding agency workers) by category of staff, England 2015/16
England
Number of staff in colleges that
responded
Number of
responses
Average number of staff
Estimate for total
in England Percent Management staff 6,422 140 46 14,862 8% Teaching staff 32,926 140 235 76,200 40% Support staff 42,078 140 301 97,381 52% Total staff3 81,531 140 582 188,687 100%
The 9 colleges in Wales that responded to the survey employed approximately 9,000 staff (excluding agency workers) during the 2015/16 academic year - an average of 988 staff in each college. Scaling this up to the total number of colleges in Wales provides a rough estimate of the total number of staff in colleges in Wales – approximately 14,000 in 2015/16. Table 4. College employee headcount and estimate of college workforce (excluding agency workers) by category of staff, Wales 2015/16
Wales
Number of staff in colleges that
responded
Number of
responses
Average number of staff
Estimate for total in Wales Percent
Management staff 465 9 52 723 5% Teaching staff 3,671 9 408 5,710 41% Support staff 4,758 9 529 7,401 53% Total staff 8,894 9 988 13,835 100%
3 The total number of staff in colleges in England is likely to be an underestimate as the figures are based on incomplete data for two colleges that are part of a ‘Group’
13
The gender breakdown for staff in colleges is shown below. Almost two-thirds of the college workforce in England and Wales is female. Table 5. College employee headcount (excluding agency workers) by gender, England 2015/16
Staff category Male Female Management staff 44% 56% Teaching staff 42% 58% Support staff 31% 69% Total staff 36% 63%
Base: 141 colleges Table 6. College employee headcount (excluding agency workers) by gender, Wales 2015/16
Staff category Male Female Management staff 46% 54% Teaching staff 44% 56% Support staff 34% 66% Total staff 38% 62%
Base: 9 colleges 4.2 HR staff by function 150 colleges provided information on the number of HR staff by function. More than half of the HR staff in these colleges were in a ‘HR only’ role. HR staff make up approximately 1.6% of staff in colleges in England and Wales. Table 7. HR staff by function
HR function
Number of HR staff in colleges that responded
Percent within HR
Percent of total staff
HR 815 55% 0.9% Payroll 263 18% 0.3% Health and safety 148 10% 0.2% Staff development 229 16% 0.3% Other 19 1% 0.0% Total 1,471 100% 1.6%
Base: 150 colleges

14
4.3 Flexible contracts 97% of colleges that responded use flexible contracts. The average college has 22% of its staff on flexible contracts; the range is shown in the table below. Table 8. Proportion of college staff on flexible contracts between 1 September 2015 to 31 August 2016
Percent of staff on flexible contracts Number of responses Percent 0% 5 3% Less than 5% 19 13% 5%-9.9% 22 15% 10%-14.9% 16 11% 15%-19.9% 16 11% 20%-24.9% 23 16% 25%-29.9% 11 8% 30%-34.9% 10 7% 35%-39.9% 10 7% 40%-44.9% 4 3% 45%-49.9% 2 1% 50% or more 7 5% Total 145 100%
4.4 Apprenticeships 130 of the 153 colleges that responded to the survey employed apprentices during 2015/16 – this is 85% of colleges. The average college in England and Wales employs 7 apprentices. The average college in England employs 8 apprentices. This is approximately 2,500 in the sector as a whole, accounting for 1.3% of college employees in England. Table 9. Average number of apprentices (headcount) employed in England, 2015/16
Number of apprentices (headcount) employed in England in 2015/16 Total number of apprentices employed in England 956 Average number of apprentices employed 7.7 Number of responses 124 Estimate of total number in colleges in England 2,500 Estimate of percent of college workforce in England 1.3%
85% of colleges (118 out of 139) that responded to the question expect that their college will be able to spend its full apprenticeship levy in 2017/18.
15
Colleges provided a range of additional comments on whether or not they would be able to spend the full apprenticeship levy in 2017/18, the key points were: • “Unknown or may prove difficult due to proposed merger situation” • “Recruitment plan needed” • “The way in which the levy operates in Wales is different to that in England
making full spend of the levy problematic” • “It is anticipated that we will be able to spend the full levy in the first year but
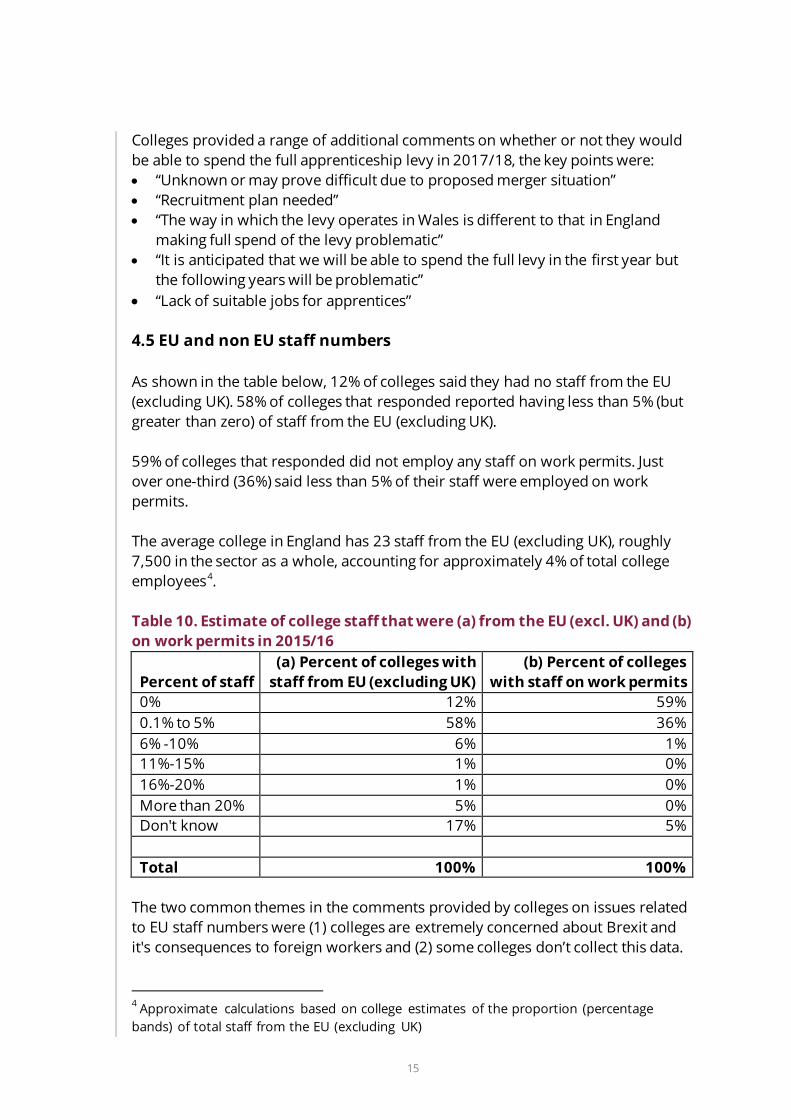
the following years will be problematic” • “Lack of suitable jobs for apprentices” 4.5 EU and non EU staff numbers As shown in the table below, 12% of colleges said they had no staff from the EU (excluding UK). 58% of colleges that responded reported having less than 5% (but greater than zero) of staff from the EU (excluding UK). 59% of colleges that responded did not employ any staff on work permits. Just over one-third (36%) said less than 5% of their staff were employed on work permits. The average college in England has 23 staff from the EU (excluding UK), roughly 7,500 in the sector as a whole, accounting for approximately 4% of total college employees4. Table 10. Estimate of college staff that were (a) from the EU (excl. UK) and (b) on work permits in 2015/16
Percent of staff (a) Percent of colleges with
staff from EU (excluding UK) (b) Percent of colleges
with staff on work permits 0% 12% 59% 0.1% to 5% 58% 36% 6% -10% 6% 1% 11%-15% 1% 0% 16%-20% 1% 0% More than 20% 5% 0% Don't know 17% 5% Total 100% 100%
The two common themes in the comments provided by colleges on issues related to EU staff numbers were (1) colleges are extremely concerned about Brexit and it's consequences to foreign workers and (2) some colleges don’t collect this data.
4 Approximate calculations based on college estimates of the proportion (percentage bands) of total staff from the EU (excluding UK)
16
5. Staff turnover For the purposes of this survey AoC use the following calculations for staff turnover for each category of staff:
Headcount of leavers (excluding any compulsory redundancies in that category) during 2015/16 x100
Total headcount of staff employed (in each category) during 2015/16
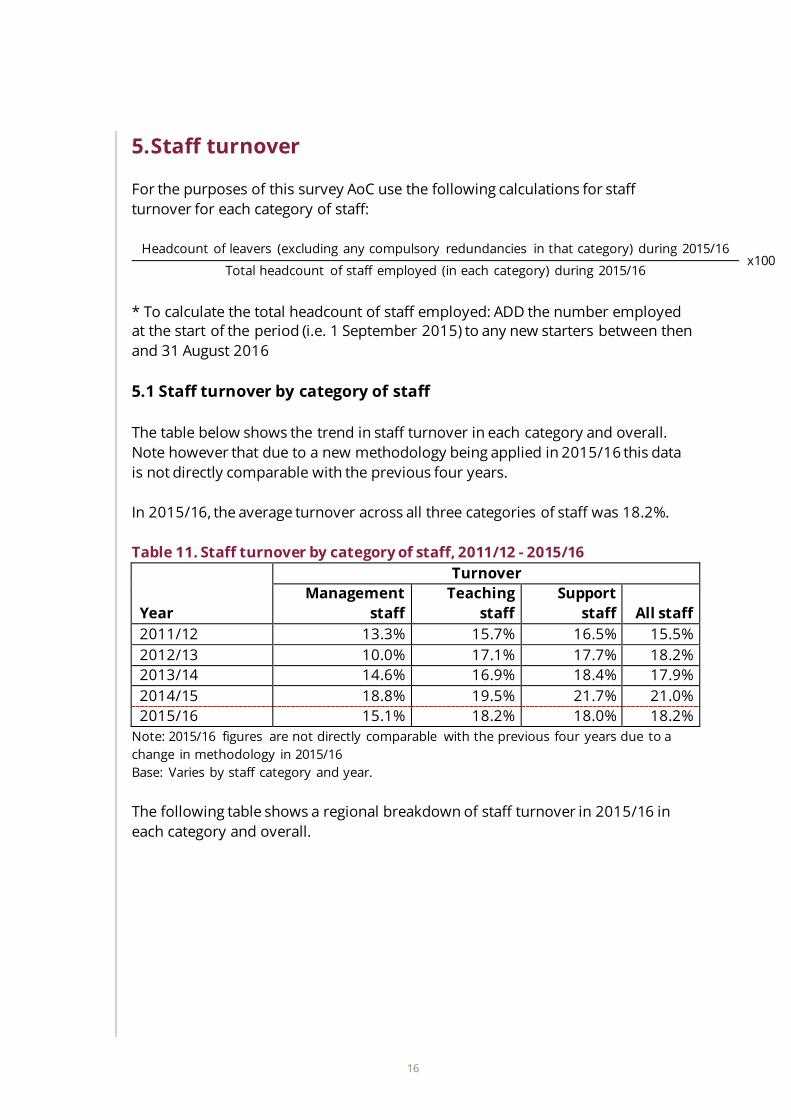
* To calculate the total headcount of staff employed: ADD the number employed at the start of the period (i.e. 1 September 2015) to any new starters between then and 31 August 2016 5.1 Staff turnover by category of staff The table below shows the trend in staff turnover in each category and overall. Note however that due to a new methodology being applied in 2015/16 this data is not directly comparable with the previous four years. In 2015/16, the average turnover across all three categories of staff was 18.2%. Table 11. Staff turnover by category of staff, 2011/12 - 2015/16
Year
Turnover Management
staff Teaching
staff Support
staff All staff 2011/12 13.3% 15.7% 16.5% 15.5% 2012/13 10.0% 17.1% 17.7% 18.2% 2013/14 14.6% 16.9% 18.4% 17.9% 2014/15 18.8% 19.5% 21.7% 21.0% 2015/16 15.1% 18.2% 18.0% 18.2%
Note: 2015/16 figures are not directly comparable with the previous four years due to a change in methodology in 2015/16 Base: Varies by staff category and year. The following table shows a regional breakdown of staff turnover in 2015/16 in each category and overall.

17
Table 12. Staff turnover by category of staff and region, 2015/16 Turnover
Region Management
staff Teaching
staff Support
staff All staff Eastern region 12.9% 18.4% 20.0% 17.7% East Midlands 12.6% 16.7% 14.8% 15.1% Greater London 17.8% 18.4% 19.1% 19.4% North East 13.8% 19.9% 14.2% 20.5% North West 17.4% 18.6% 17.6% 18.2% South East 17.1% 23.8% 23.1% 23.6% South West 14.1% 18.3% 21.6% 19.2% West Midlands 17.0% 20.6% 17.4% 18.2% Yorkshire and the Humber 14.3% 16.9% 16.7% 17.4% Wales 8.0% 11.0% 12.8% 11.8% Total 15.1% 18.2% 18.0% 18.2% Number of responses 140 139 139 149
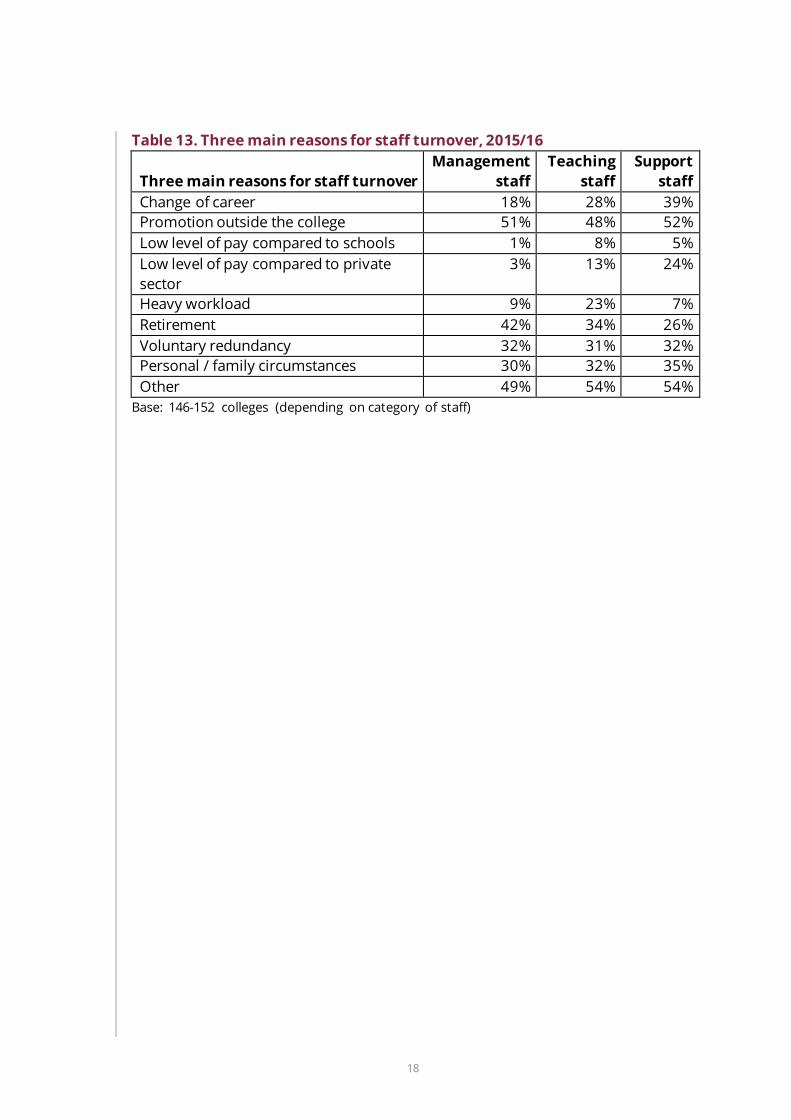
Base: Varies by region and category. 5.2 Reasons for turnover Colleges were asked to indicate the three main reasons for staff turnover across each category, the responses are shown in Table 13. The top reason for turnover in each category of staff was promotion outside the college. For management staff this was followed by retirement and voluntary redundancy, for teaching staff - retirement and personal / family circumstances and for support staff - change of career and personal / family circumstances. Other reasons cited by colleges for staff turnover include: end of fixed term contracts; dismissals; compulsory redundancies; reason for leaving not specified/collected; TUPE transfer; performance management processes; relocation; further study; new job; restructure; lack of career opportunities.
18
Table 13. Three main reasons for staff turnover, 2015/16
Three main reasons for staff turnover Management
staff Teaching
staff Support
staff Change of career 18% 28% 39% Promotion outside the college 51% 48% 52% Low level of pay compared to schools 1% 8% 5% Low level of pay compared to private sector
3% 13% 24%
Heavy workload 9% 23% 7% Retirement 42% 34% 26% Voluntary redundancy 32% 31% 32% Personal / family circumstances 30% 32% 35% Other 49% 54% 54%
Base: 146-152 colleges (depending on category of staff)
19
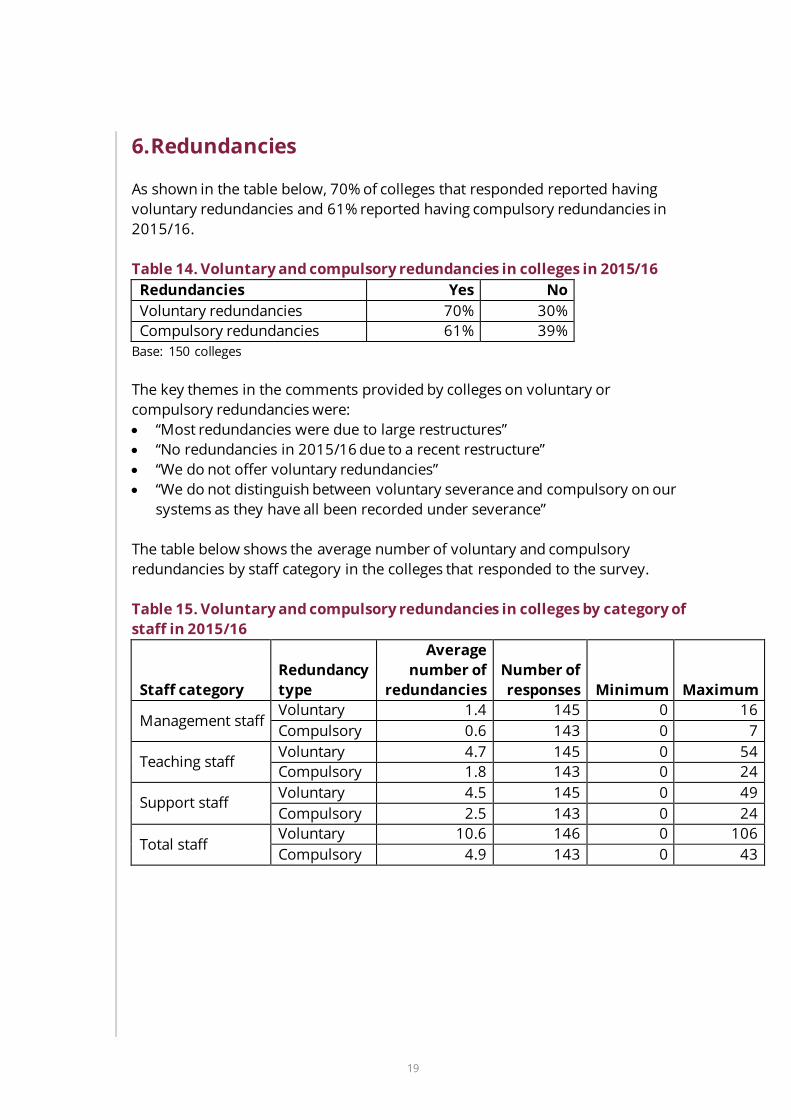
6. Redundancies As shown in the table below, 70% of colleges that responded reported having voluntary redundancies and 61% reported having compulsory redundancies in 2015/16. Table 14. Voluntary and compulsory redundancies in colleges in 2015/16
Redundancies Yes No Voluntary redundancies 70% 30% Compulsory redundancies 61% 39%
Base: 150 colleges The key themes in the comments provided by colleges on voluntary or compulsory redundancies were: • “Most redundancies were due to large restructures” • “No redundancies in 2015/16 due to a recent restructure” • “We do not offer voluntary redundancies” • “We do not distinguish between voluntary severance and compulsory on our
systems as they have all been recorded under severance” The table below shows the average number of voluntary and compulsory redundancies by staff category in the colleges that responded to the survey. Table 15. Voluntary and compulsory redundancies in colleges by category of staff in 2015/16
Staff category Redundancy type
Average number of
redundancies Number of responses Minimum Maximum
Management staff Voluntary 1.4 145 0 16 Compulsory 0.6 143 0 7
Teaching staff Voluntary 4.7 145 0 54 Compulsory 1.8 143 0 24
Support staff Voluntary 4.5 145 0 49 Compulsory 2.5 143 0 24
Total staff Voluntary 10.6 146 0 106 Compulsory 4.9 143 0 43
20
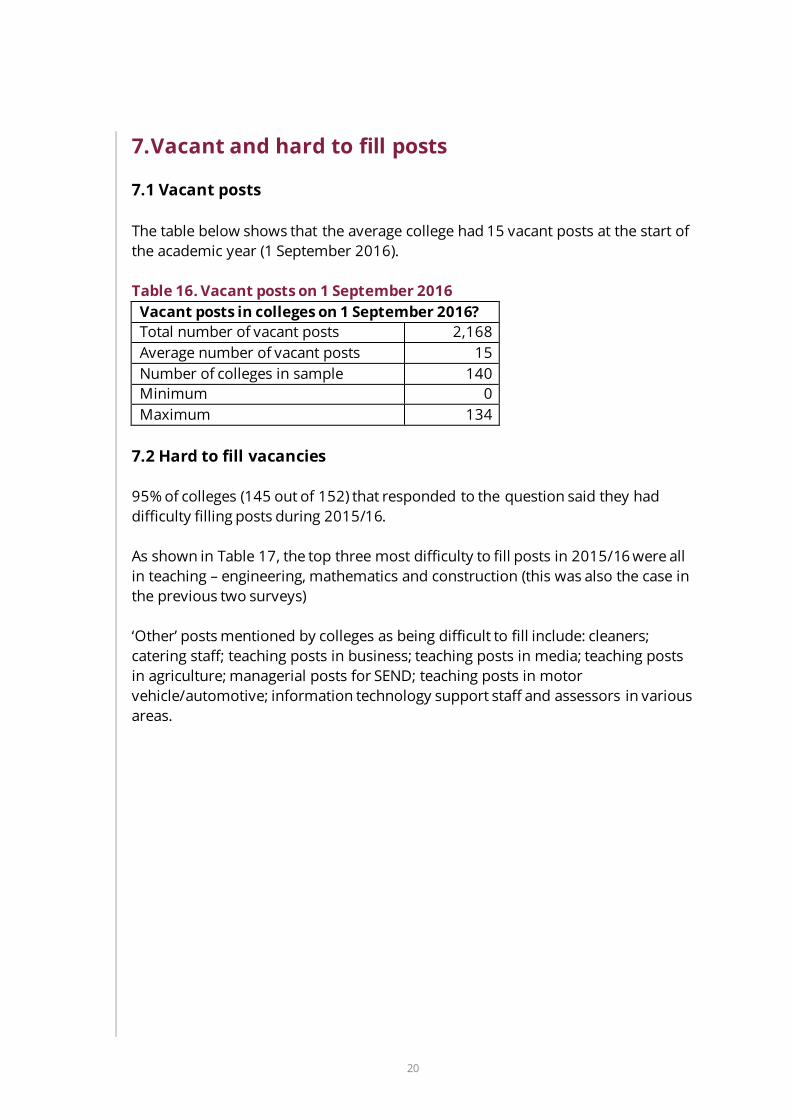
7. Vacant and hard to fill posts 7.1 Vacant posts The table below shows that the average college had 15 vacant posts at the start of the academic year (1 September 2016). Table 16. Vacant posts on 1 September 2016
Vacant posts in colleges on 1 September 2016? Total number of vacant posts 2,168 Average number of vacant posts 15 Number of colleges in sample 140 Minimum 0 Maximum 134
7.2 Hard to fill vacancies 95% of colleges (145 out of 152) that responded to the question said they had difficulty filling posts during 2015/16. As shown in Table 17, the top three most difficulty to fill posts in 2015/16 were all in teaching – engineering, mathematics and construction (this was also the case in the previous two surveys) ‘Other’ posts mentioned by colleges as being difficult to fill include: cleaners; catering staff; teaching posts in business; teaching posts in media; teaching posts in agriculture; managerial posts for SEND; teaching posts in motor vehicle/automotive; information technology support staff and assessors in various areas.

21
Table 17. Hard to fill posts, 2015/16 Rank 3 main reasons (with
1 being the most difficult) Posts that have proven most difficult to fill
Number of responses Percent Rank 1 Rank 2 Rank 3
Management - leadership posts
11 8% 1 6 4
Management - management posts
18 13% 4 5 9
Teaching - construction 55 38% 28 15 12 Teaching - engineering 78 54% 48 23 7 Teaching - English 28 19% 3 11 14 Teaching - health, social care and public services
40 28% 7 19 14
Teaching - information and communication technology
18 13% 4 7 7
Teaching - maths 67 47% 23 24 20 Teaching - science 27 19% 11 10 6 Learning support - technical
6 4% 1 3 2
Learning support - teaching
6 4% 3 1 2
Other support - professional staff, e.g. librarians, accountants, welfare and guidance staff
12 8% 0 3 9
Other support - administrative/ clerical staff
8 6% 1 0 7
Other 27 19% 9 6 12 Total 144
7.3 Reasons for recruitment difficulties Colleges were asked to indicate the three main reasons for any recruitment difficulties in all categories of staff during the 2015/16 academic year, the responses are shown in Table 18 below. The top three reasons were lack of necessary specialist skills, looking for more pay than college could offer and no applicants (this was closely followed by insufficient experience).

22
Table 18. Three main reasons for staff recruitment difficulties, 2015/16 Top 3 reasons for recruitment difficulties (for all categories of staff)
Number of responses Percent
Did not have difficulty recruiting to posts in 2015/16
7 5%
No applicants 74 49% Insufficient experience 73 48% Lack of necessary specialist skills 103 68% Insufficient relevant qualifications 52 34% Looking for more pay than college could offer 97 64% Other (please specify) 6 4% Total 152
‘Other’ reasons given by colleges for any recruitment difficulties experienced in 2015/16 include: • “Too few applications” (one college mentioned this was because of low local
unemployment) • “Pay is particularly an issue in the 'trades'” • “GCSE pay rates in schools can be significantly higher than those we are able to
offer” • Due to large building projects in the area we cannot compete with industry
rates of pay in construction and engineering” • “Candidates are earning more money in industry than we can offer on
teaching scales” • “Recruitment is generally competitive in the area, with a number of other
education establishments also looking to recruit” • “National shortage of computer science teachers” • “Holiday offering could not compete with schools” • “Each of these difficult to fill posts was problematic because they were mid
year and contractual notice clauses/lack of offer of permanent position made them unattractive”
23
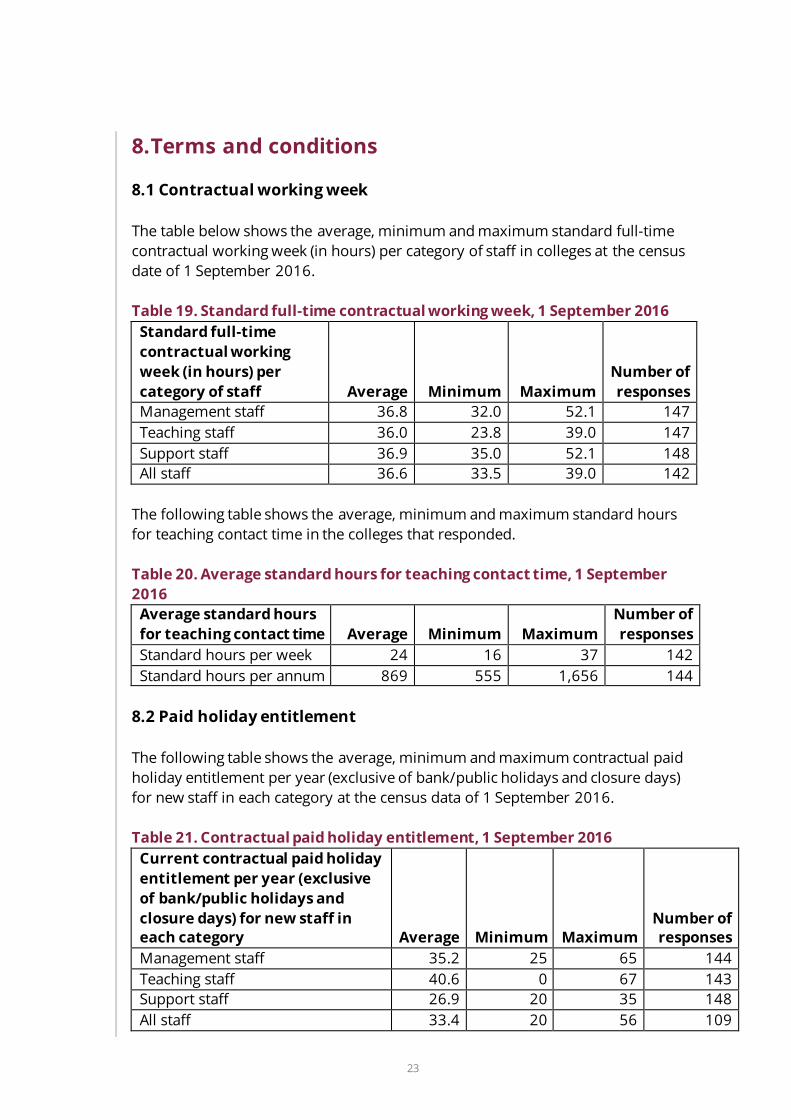
8. Terms and conditions 8.1 Contractual working week The table below shows the average, minimum and maximum standard full-time contractual working week (in hours) per category of staff in colleges at the census date of 1 September 2016. Table 19. Standard full-time contractual working week, 1 September 2016
Standard full-time contractual working week (in hours) per category of staff Average Minimum Maximum
Number of responses
Management staff 36.8 32.0 52.1 147 Teaching staff 36.0 23.8 39.0 147 Support staff 36.9 35.0 52.1 148 All staff 36.6 33.5 39.0 142
The following table shows the average, minimum and maximum standard hours for teaching contact time in the colleges that responded. Table 20. Average standard hours for teaching contact time, 1 September 2016
Average standard hours for teaching contact time Average Minimum Maximum
Number of responses
Standard hours per week 24 16 37 142 Standard hours per annum 869 555 1,656 144
8.2 Paid holiday entitlement The following table shows the average, minimum and maximum contractual paid holiday entitlement per year (exclusive of bank/public holidays and closure days) for new staff in each category at the census data of 1 September 2016. Table 21. Contractual paid holiday entitlement, 1 September 2016
Current contractual paid holiday entitlement per year (exclusive of bank/public holidays and closure days) for new staff in each category Average Minimum Maximum
Number of responses
Management staff 35.2 25 65 144 Teaching staff 40.6 0 67 143 Support staff 26.9 20 35 148 All staff 33.4 20 56 109
24
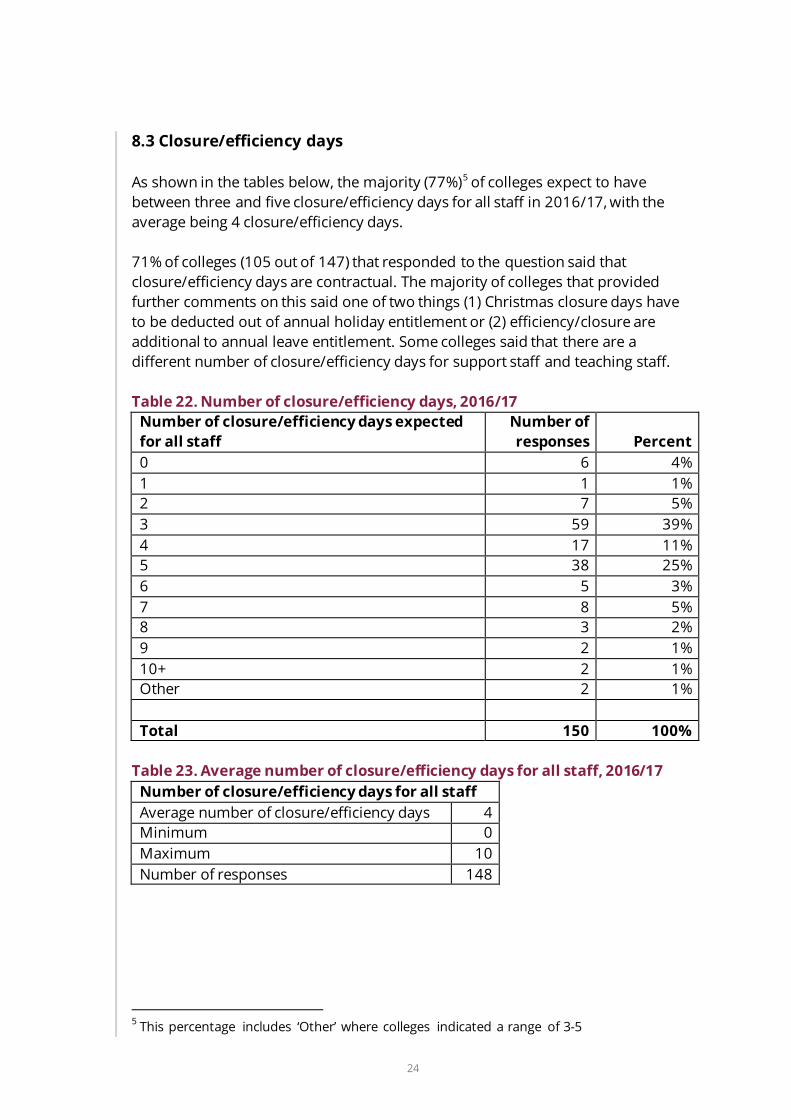
8.3 Closure/efficiency days As shown in the tables below, the majority (77%)5 of colleges expect to have between three and five closure/efficiency days for all staff in 2016/17, with the average being 4 closure/efficiency days. 71% of colleges (105 out of 147) that responded to the question said that closure/efficiency days are contractual. The majority of colleges that provided further comments on this said one of two things (1) Christmas closure days have to be deducted out of annual holiday entitlement or (2) efficiency/closure are additional to annual leave entitlement. Some colleges said that there are a different number of closure/efficiency days for support staff and teaching staff. Table 22. Number of closure/efficiency days, 2016/17
Number of closure/efficiency days expected for all staff
Number of responses Percent
0 6 4% 1 1 1% 2 7 5% 3 59 39% 4 17 11% 5 38 25% 6 5 3% 7 8 5% 8 3 2% 9 2 1% 10+ 2 1% Other 2 1% Total 150 100%
Table 23. Average number of closure/efficiency days for all staff, 2016/17
Number of closure/efficiency days for all staff Average number of closure/efficiency days 4 Minimum 0 Maximum 10 Number of responses 148
5 This percentage includes ‘Other’ where colleges indicated a range of 3-5
25
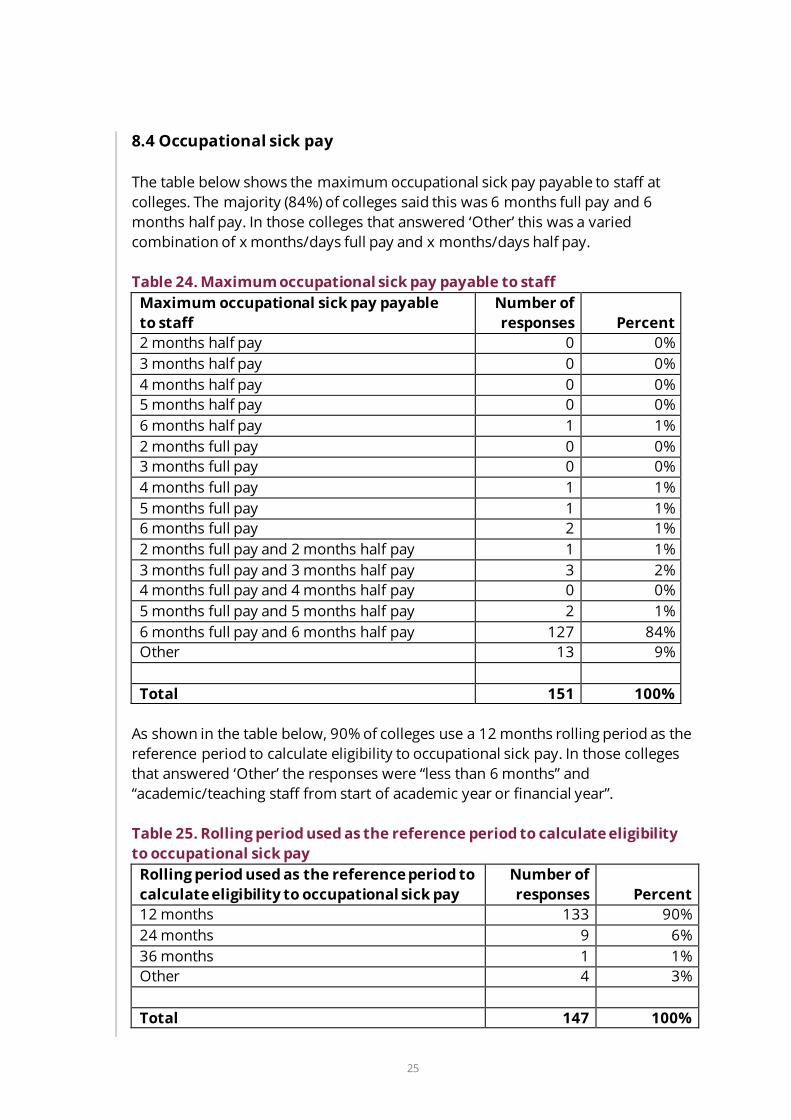
8.4 Occupational sick pay The table below shows the maximum occupational sick pay payable to staff at colleges. The majority (84%) of colleges said this was 6 months full pay and 6 months half pay. In those colleges that answered ‘Other’ this was a varied combination of x months/days full pay and x months/days half pay. Table 24. Maximum occupational sick pay payable to staff
Maximum occupational sick pay payable to staff
Number of responses Percent
2 months half pay 0 0% 3 months half pay 0 0% 4 months half pay 0 0% 5 months half pay 0 0% 6 months half pay 1 1% 2 months full pay 0 0% 3 months full pay 0 0% 4 months full pay 1 1% 5 months full pay 1 1% 6 months full pay 2 1% 2 months full pay and 2 months half pay 1 1% 3 months full pay and 3 months half pay 3 2% 4 months full pay and 4 months half pay 0 0% 5 months full pay and 5 months half pay 2 1% 6 months full pay and 6 months half pay 127 84% Other 13 9% Total 151 100%
As shown in the table below, 90% of colleges use a 12 months rolling period as the reference period to calculate eligibility to occupational sick pay. In those colleges that answered ‘Other’ the responses were “less than 6 months” and “academic/teaching staff from start of academic year or financial year”. Table 25. Rolling period used as the reference period to calculate eligibility to occupational sick pay
Rolling period used as the reference period to calculate eligibility to occupational sick pay
Number of responses Percent
12 months 133 90% 24 months 9 6% 36 months 1 1% Other 4 3% Total 147 100%

26
8.5 Statutory and enhanced pay The following table shows the number and proportion of colleges that offer statutory or enhanced pay for redundancy, maternity, shared parental leave, paternity and adoption. Two-thirds of colleges offer statutory pay for redundancy (65%) and shared parental leave (68%). 85% of colleges offer enhanced pay for maternity, whilst 58% offer it for paternity and 67% offer it for adoption leave. Table 26. Statutory or enhanced pay for each of the following
Whether college offers statutory or enhanced pay for each of the following
Statutory pay
Enhanced pay
Number of responses
Redundancy 95 52 147 Maternity 22 128 150 Shared parental leave 100 46 146 Paternity 63 86 149 Adoption 49 99 148 Statutory
pay Enhanced
pay Number of responses
Redundancy 65% 35% 100% Maternity 15% 85% 100% Shared parental leave 68% 32% 100% Paternity 42% 58% 100% Adoption 33% 67% 100%
88 colleges provided details (where offered) of the ‘enhanced pay' for redundancy, maternity, shared parental leave, paternity and adoption. However the responses received were too varied to pull together any meaningful summary.
27
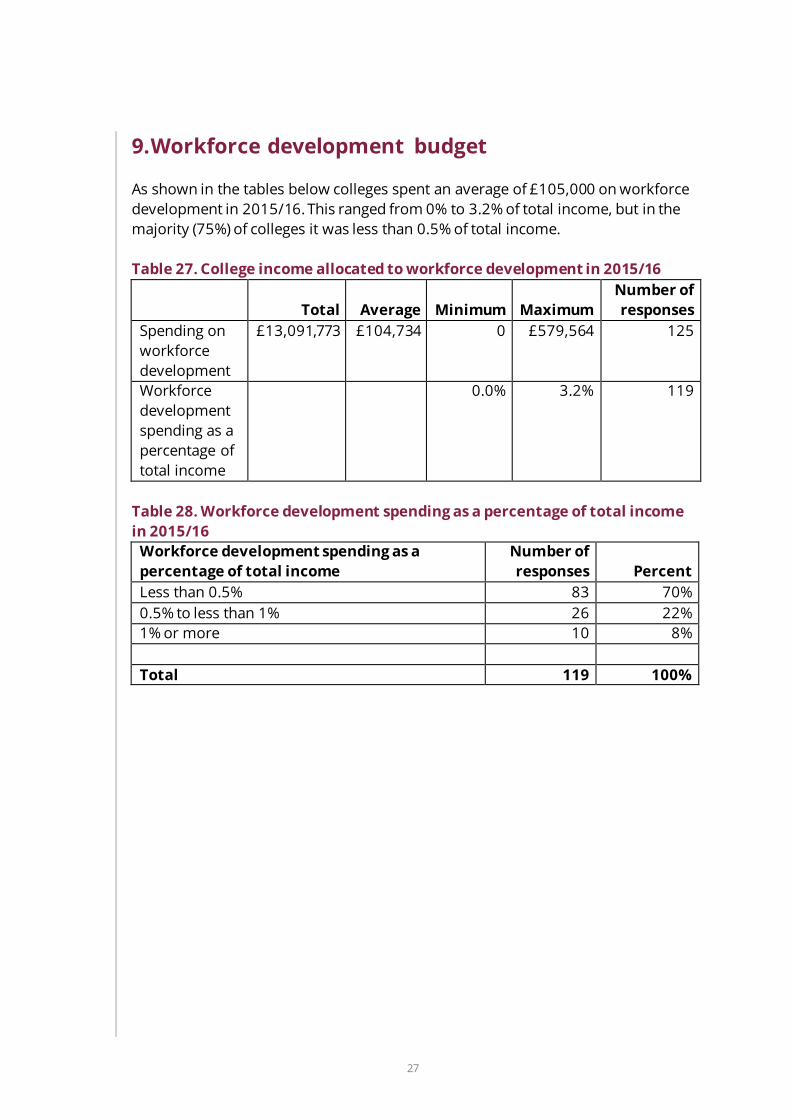
9. Workforce development budget As shown in the tables below colleges spent an average of £105,000 on workforce development in 2015/16. This ranged from 0% to 3.2% of total income, but in the majority (75%) of colleges it was less than 0.5% of total income. Table 27. College income allocated to workforce development in 2015/16
Total Average Minimum Maximum
Number of responses
Spending on workforce development
£13,091,773 £104,734 0 £579,564 125
Workforce development spending as a percentage of total income
0.0% 3.2% 119
Table 28. Workforce development spending as a percentage of total income in 2015/16
Workforce development spending as a percentage of total income
Number of responses Percent
Less than 0.5% 83 70% 0.5% to less than 1% 26 22% 1% or more 10 8% Total 119 100%
28
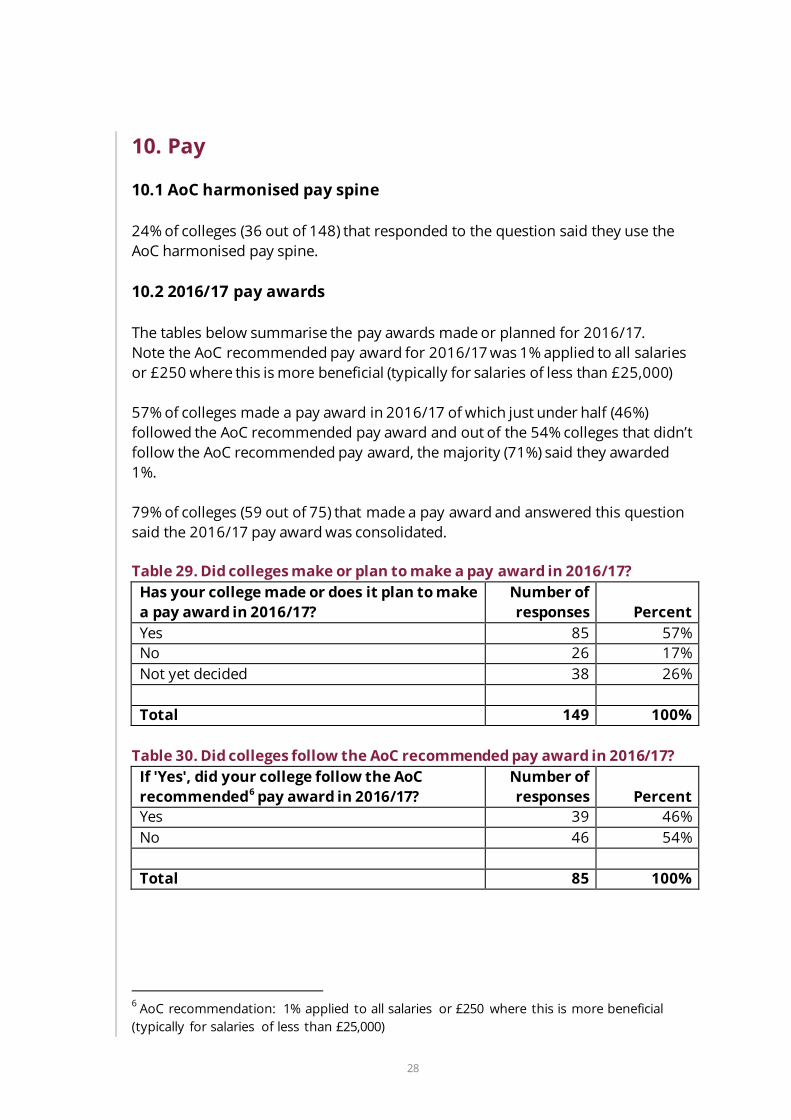
10. Pay 10.1 AoC harmonised pay spine 24% of colleges (36 out of 148) that responded to the question said they use the AoC harmonised pay spine. 10.2 2016/17 pay awards The tables below summarise the pay awards made or planned for 2016/17. Note the AoC recommended pay award for 2016/17 was 1% applied to all salaries or £250 where this is more beneficial (typically for salaries of less than £25,000) 57% of colleges made a pay award in 2016/17 of which just under half (46%) followed the AoC recommended pay award and out of the 54% colleges that didn’t follow the AoC recommended pay award, the majority (71%) said they awarded 1%. 79% of colleges (59 out of 75) that made a pay award and answered this question said the 2016/17 pay award was consolidated. Table 29. Did colleges make or plan to make a pay award in 2016/17?
Has your college made or does it plan to make a pay award in 2016/17?
Number of responses Percent
Yes 85 57% No 26 17% Not yet decided 38 26% Total 149 100%
Table 30. Did colleges follow the AoC recommended pay award in 2016/17?
If 'Yes', did your college follow the AoC recommended6 pay award in 2016/17?
Number of responses Percent
Yes 39 46% No 46 54% Total 85 100%
6 AoC recommendation: 1% applied to all salaries or £250 where this is more beneficial (typically for salaries of less than £25,000)

29
Table 31. Pay awards by colleges that didn’t follow the AoC recommended pay award in 2016/17
If 'No', please provide details of the percentage and/or cash uplift that your college awarded in 2016/17 Minimum Maximum
Number of responses
% uplift: 0.2% 3.3% 42 cash uplift: 150 500 6
Table 32. Percentage uplift awarded by colleges that didn’t follow the AoC recommended pay award in 2016/17
If 'No', please provide details of the percentage uplift that your college awarded in 2016/17
Number of responses Percent
Less than 1% 6 14% 1% 30 71% More than 1% 6 14% Total* 42 100%
Table 33. Consolidated or unconsolidated pay awards in 2016/17
Was the 2016/17 pay award consolidated or not?
Number of responses Percent
Consolidated 59 79% Unconsolidated 16 21% Total 75 100%
10.3 2017/18 pay awards The tables below summarise information provided on pay awards planned for 2017/18. 85% of colleges (127 out of 149) that responded to the question said it was too early to say whether or not they would be making any sort of pay award for 2017/18. Out of the small number that said they anticipate making an award the majority (67%) said they were budgeting 1%. Just over one-third of colleges said the award for 2017/18 would most likely be decided between February and August 2017, another 18% said it would be October to December 2017 and 10% said it would be in line with sector recommendations. A further 21% of colleges said it was not known when pay awards for 2017/18 would be decided with some of these saying it would be dependent on mergers and financial stability of colleges.

30
Table 34. Do colleges anticipate making any sort of pay award for 2017/18? Does the college anticipate making any sort of pay award for 2017/18?
Number of responses Percent
Yes 14 9% No 8 5% Too early to say 127 85% Total 149 100%
Table 35. What are colleges budgeting for 2017/18 pay awards?
If 'Yes', what is the college budgeting for 2017/18?
Number of responses Percent
1% 8 67% 1.5% 1 8% AoC Recommendation 1 8% Subject to Welsh Colleges guidance 1 8% Too early to say 1 8% Total 12 100%
Table 36. When will 2017/18 pay awards be decided?
If 'Too early to say', when will 2017/18 pay awards be decided?
Number of responses Percent
February 2017 1 1% March, April 2017 7 6% May, June, July 2017 27 24% Aug 2017 6 5% Oct, Nov, Dec 2017 20 18% 2017 1 1% 2017/18 2 2% Mid Year Financial Review 1 1% Following AoC recommendation for 2017/18 5 4% In line with SFCA guidance 5 4% Subject to Welsh Colleges guidance 1 1% Jan, Feb, March, April 2018 9 8% 2018 1 1% 2018/19 1 1% September 2018 1 1% Not known 24 21% Total 112 100%
31
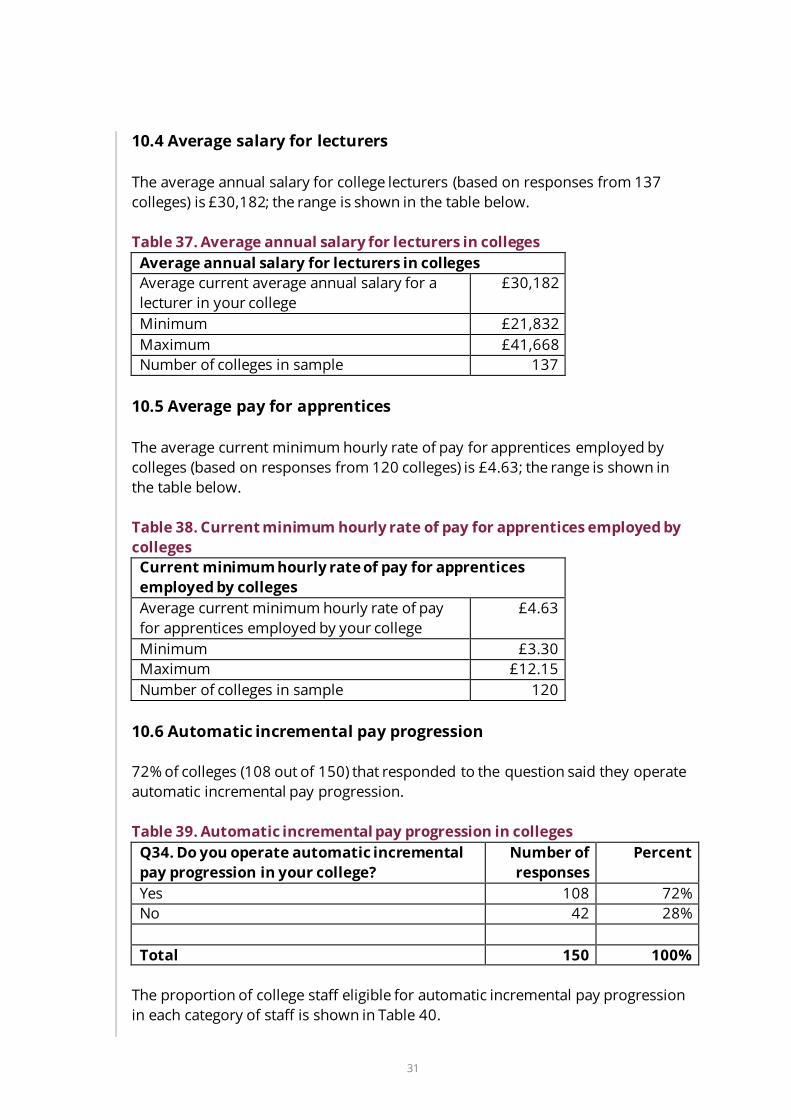
10.4 Average salary for lecturers The average annual salary for college lecturers (based on responses from 137 colleges) is £30,182; the range is shown in the table below. Table 37. Average annual salary for lecturers in colleges
Average annual salary for lecturers in colleges Average current average annual salary for a lecturer in your college
£30,182
Minimum £21,832 Maximum £41,668 Number of colleges in sample 137
10.5 Average pay for apprentices The average current minimum hourly rate of pay for apprentices employed by colleges (based on responses from 120 colleges) is £4.63; the range is shown in the table below. Table 38. Current minimum hourly rate of pay for apprentices employed by colleges
Current minimum hourly rate of pay for apprentices employed by colleges Average current minimum hourly rate of pay for apprentices employed by your college
£4.63
Minimum £3.30 Maximum £12.15 Number of colleges in sample 120
10.6 Automatic incremental pay progression 72% of colleges (108 out of 150) that responded to the question said they operate automatic incremental pay progression. Table 39. Automatic incremental pay progression in colleges
Q34. Do you operate automatic incremental pay progression in your college?
Number of responses
Percent
Yes 108 72% No 42 28% Total 150 100%
The proportion of college staff eligible for automatic incremental pay progression in each category of staff is shown in Table 40.

32
Table 40. Percentage of college staff eligible for automatic incremental pay progression, by category of staff
Staff category 0% 1-25% 26-50% 51-75% 76-99% 100% Number of responses
Management staff 66 20 5 7 13 15 126 Teaching staff 37 18 16 9 12 38 130 Support staff 37 13 20 12 11 34 127 Total staff 31 13 21 10 20 14 109
0% 1-25% 26-50% 51-75% 76-99% 100% Number of responses
Management staff 52% 16% 4% 6% 10% 12% 100% Teaching staff 28% 14% 12% 7% 9% 29% 100% Support staff 29% 10% 16% 9% 9% 27% 100% Total staff 28% 12% 19% 9% 18% 13% 100%
10.7 General comments on pay The colleges that provided further comments on pay generally focused on incremental pay progression, but there were some additional points: • A large number of colleges said that whilst they had incremental pay
progression, this is subject to satisfactory performance throughout the year (i.e. successful appraisal outcome) and therefore not ‘automatic’
• “Automatic incremental increases until top of pay band is reached” • “A large number of staff have reached the top increment of their grade” • “Rates used for apprentices is the minimum wage dependent on age” • Some colleges reported appointing management and support staff posts on a
spot point salary to minimise the annual increase pay costs, though some said whilst management are usually on a 'spot salary' they have an automated pay spine for teachers and support staff.
33
11. Sickness absence Sickness absence includes all absences attributed to sickness, including all long-term sickness absence of employees irrespective of length, absences due to industrial injury and absences of less than one day. Sickness absence excludes authorised absences for medical appointments, dental appointments, and maternity leave. It also excludes emergency leave, parental/dependents leave and compassionate leave. AoC uses the following calculations when reporting on the absence data: Lost time percentage (LTP): This shows the percentage of the total time available which has been lost because of sickness absence from all causes in a given period: Total number of days of sickness absence in 2015/16 X 100 Total possible working days in the period Absence rate (AR): This shows the average number of working days lost due to sickness absence per employee: Total number of days of sickness absence in 2015/16 Total headcount of employees during the period Employee numbers are calculated using headcounts. (Following feedback from colleges, this has been changed from previous years’ full-time equivalent (FTE) measure). 11.1 Overall absence rates and lost time The absence rate is a measure of the average number of days of absence per employee during the year, while the lost time percentage is a measure of the proportion of available working time lost due to absence during the year. The figures from this year’s survey show an overall absence rate of 5.8 days per employee and a lost time percentage of 3.1% in 2015/16. The table below shows the trend in absence rates and lost time percentages. Note however that due to a new methodology being applied in 2015/16 this data is not directly comparable with the previous four years.

34
Table 41. Absence rate and lost time percentage, 2011/12 – 2015/16 Year Absence rate Lost time % 2011/12 8.0 days 3.7% 2012/13 8.4 days 3.8% 2013/14 8.1 days 3.7% 2014/15 7.4 days 3.1% 2015/16 5.8 days 3.1%
Note: 2015/16 figures are not directly comparable with the previous four years due to a change in methodology in 2015/16 Base: Varies by staff category and year. The following tables show the average, minimum and maximum absence rates (days per employee) and lost time percentages by category of staff in the colleges that responded in 2015/16. Table 42. Absence rate by category of staff, 2015/16
Staff category Average Minimum Maximum Number of responses
Management staff 4.3 days 0.0 days 55.5 days 123 Teaching staff 5.6 days 0.1 days 18.2 days 124 Support staff 6.2 days 0.3 days 24.3 days 124 Total staff 5.8 days 0.1 days 20.1 days 139
Table 43. Lost time percentage by category of staff, 2015/16
Staff category Average Minimum Maximum Number of responses
Management staff 1.5% 0.1% 6.1% 100 Teaching staff 3.0% 0.2% 11.0% 103 Support staff 3.1% 0.1% 10.7% 102 Total staff 3.1% 0.0% 19.3% 114
The two tables below show the regional breakdown in absence rates and lost time percentages by category of staff in the colleges that responded in 2015/16. Note that there will be small samples sizes for the regional breakdowns.
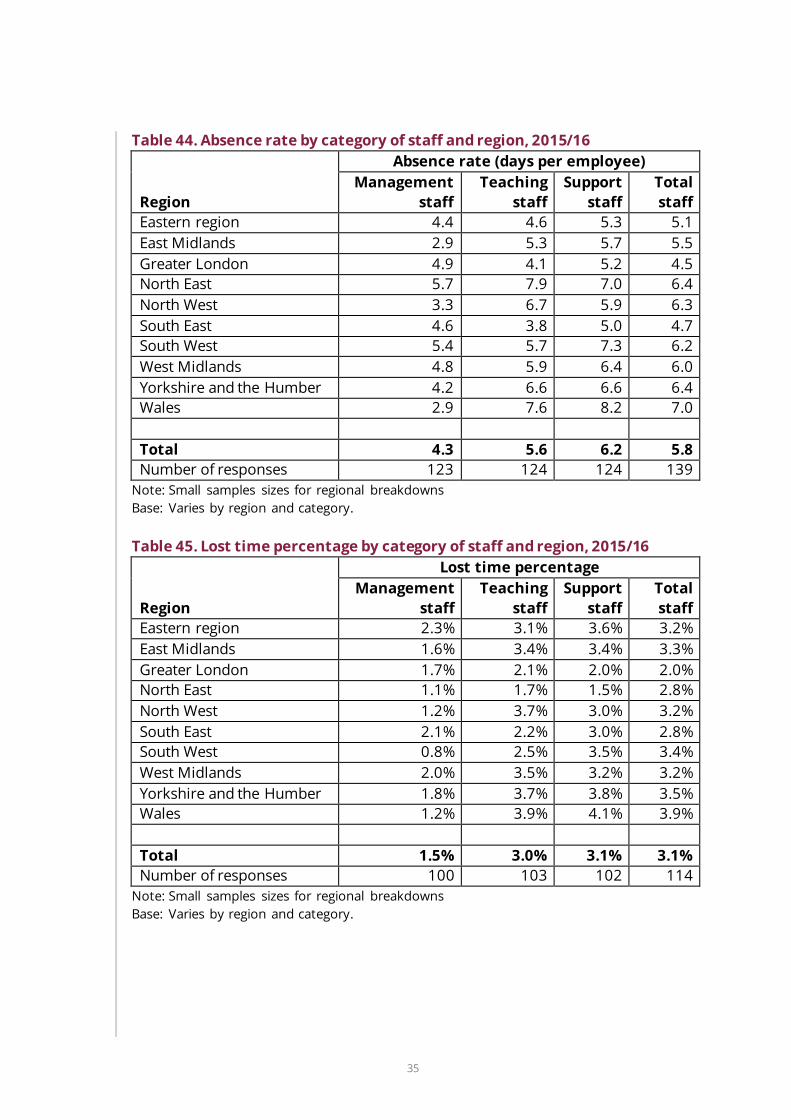
35
Table 44. Absence rate by category of staff and region, 2015/16
Region
Absence rate (days per employee) Management
staff Teaching
staff Support
staff Total staff
Eastern region 4.4 4.6 5.3 5.1 East Midlands 2.9 5.3 5.7 5.5 Greater London 4.9 4.1 5.2 4.5 North East 5.7 7.9 7.0 6.4 North West 3.3 6.7 5.9 6.3 South East 4.6 3.8 5.0 4.7 South West 5.4 5.7 7.3 6.2 West Midlands 4.8 5.9 6.4 6.0 Yorkshire and the Humber 4.2 6.6 6.6 6.4 Wales 2.9 7.6 8.2 7.0 Total 4.3 5.6 6.2 5.8 Number of responses 123 124 124 139
Note: Small samples sizes for regional breakdowns Base: Varies by region and category. Table 45. Lost time percentage by category of staff and region, 2015/16
Region
Lost time percentage Management
staff Teaching
staff Support
staff Total staff
Eastern region 2.3% 3.1% 3.6% 3.2% East Midlands 1.6% 3.4% 3.4% 3.3% Greater London 1.7% 2.1% 2.0% 2.0% North East 1.1% 1.7% 1.5% 2.8% North West 1.2% 3.7% 3.0% 3.2% South East 2.1% 2.2% 3.0% 2.8% South West 0.8% 2.5% 3.5% 3.4% West Midlands 2.0% 3.5% 3.2% 3.2% Yorkshire and the Humber 1.8% 3.7% 3.8% 3.5% Wales 1.2% 3.9% 4.1% 3.9% Total 1.5% 3.0% 3.1% 3.1% Number of responses 100 103 102 114
Note: Small samples sizes for regional breakdowns Base: Varies by region and category.
36
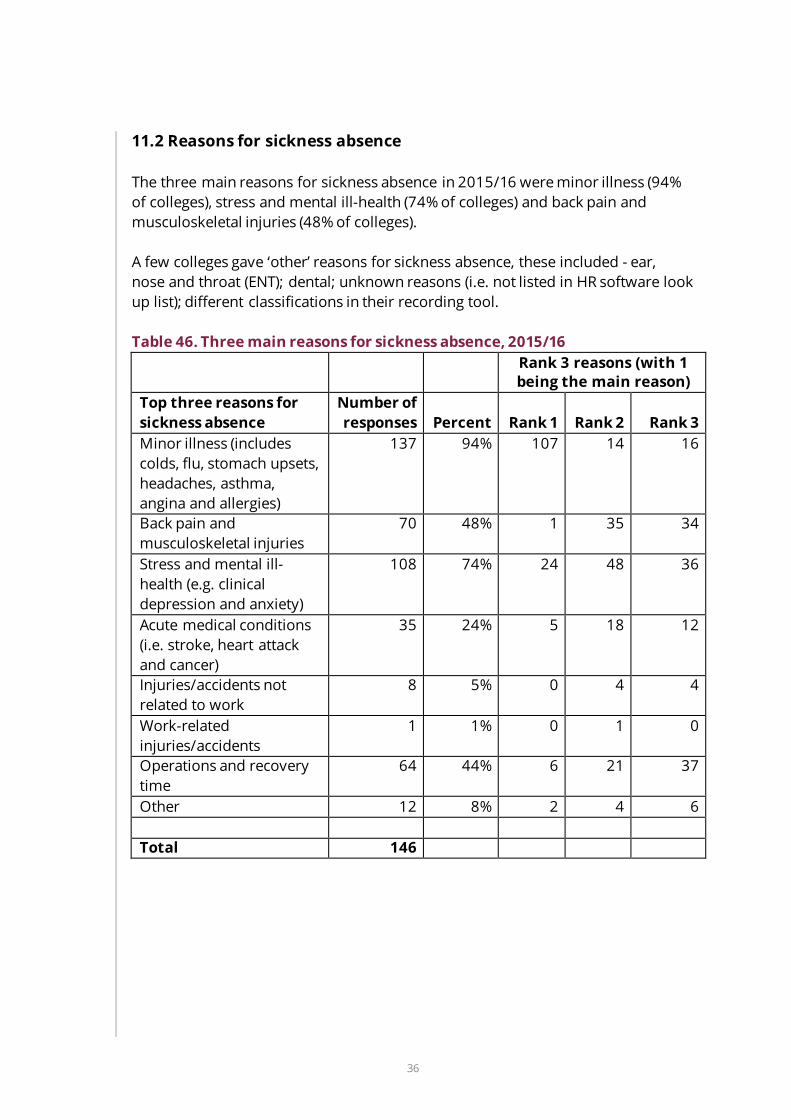
11.2 Reasons for sickness absence The three main reasons for sickness absence in 2015/16 were minor illness (94% of colleges), stress and mental ill-health (74% of colleges) and back pain and musculoskeletal injuries (48% of colleges). A few colleges gave ‘other’ reasons for sickness absence, these included - ear, nose and throat (ENT); dental; unknown reasons (i.e. not listed in HR software look up list); different classifications in their recording tool. Table 46. Three main reasons for sickness absence, 2015/16
Rank 3 reasons (with 1 being the main reason)
Top three reasons for sickness absence
Number of responses Percent Rank 1 Rank 2 Rank 3
Minor illness (includes colds, flu, stomach upsets, headaches, asthma, angina and allergies)
137 94% 107 14 16
Back pain and musculoskeletal injuries
70 48% 1 35 34
Stress and mental ill-health (e.g. clinical depression and anxiety)
108 74% 24 48 36
Acute medical conditions (i.e. stroke, heart attack and cancer)
35 24% 5 18 12
Injuries/accidents not related to work
8 5% 0 4 4
Work-related injuries/accidents
1 1% 0 1 0
Operations and recovery time
64 44% 6 21 37
Other 12 8% 2 4 6 Total 146
37
12. Other comments and clarification of college responses A few colleges provided additional comments and/or further clarification on their response to the survey: Staff categories: • “Management questions difficult to answer as there are not separate contracts
(except Principal and Deputy Principal) - we generally report by academic and support staff”
Casual and flexible contracts: • “A number of casual staff that assist with events at set times of the year” • “Variable hours staff we have listed includes a large amount that are only
employed for summer events and are employed for a period of 4 - 8 weeks only”
• “Q8 flexible contracts - some of these employees only worked a few hours over the whole year so this figure looks much higher than it actually was”
Staff turnover: • “When reporting on staff turnover we would not normally include fixed term
contracts and maternity cover contracts in the calculation for our turnover figure. We would usually include staff that have left through resignation, voluntary redundancy, dismissal and failure of probation. We would report on fixed term and maternity cover contracts separately”
Sickness absence: • “Sickness absence calculations are difficult” • “The absence questions were difficult to answer with the system we have, so
are indicative based on our own sickness absence data” • “We are not able to provide the sickness data in the format requested” • “College absence reporting and monitoring is based on using full-time
equivalent (FTE) figures.

38
Appendix A – notes for completion AoC Workforce Survey December 2016 – Guidance notes for completion December 2016 1. Census period The census period for the majority of the workforce data collection is the period 1 September 2015 - 31 August 2016 (i.e. 2015/16 academic year). Section 9 focuses on ‘pay’ and asks questions about 2016/17 and 2017/18 pay awards. For other sections (and some questions within the above) the census date is 1 September 2016 or current practice. 2. Categories of staff & contract types (excluding agency workers), 2015/16 All staff numbers within the survey should be specified as headcounts Management staff (incl. leadership teams): this category is defined as full-time and part-time staff (including those on flexible contracts) that are on the management pay spine. This includes teaching staff with management responsibility and senior post holders (e.g. principals, vice/assistant principals and clerks). Teaching staff: this category is defined as full-time and part-time/fractional staff (including those on flexible contracts). This includes associate lecturers and also teaching staff employed on an hourly-paid basis. If instructors and demonstrators fall into this category for your college, please exclude them from the teaching staff category and include them in support staff. Support staff: this category is defined as full-time and part-time staff (including those on flexible contracts) who are employed on support terms and conditions, including instructors and demonstrators. Flexible contracts: this category comprises contracts typically referred to as fixed-term, zero-hours and variable hours contracts. It does not include agency workers.
39
Apprenticeship contracts: this terminology refers to apprentices employed by the college under an apprenticeship contract. The college may also be the training provider in this context but the number of apprentices that should be reported, for survey purposes, is the number of apprentices actually employed by the college. Further clarification on staff headcount: Employees with multiple contracts should be counted as ‘one’ and included in the category where they are performing the most number of hours. Where an employee is engaged on two contracts both at the same number of hours, we recommend that you add them to the relevant headcount category based on the seniority of the role. 3. Staff turnover (2015/16) For the purposes of this survey, AoC use the following calculations for staff turnover for each category of staff:
Headcount of leavers (excluding any compulsory redundancies in that category) during 2015/16 x100
Total headcount of staff employed (in each category) during 2015/16
Headcount of leavers (excluding any compulsory redundancies in that category) during 2015/16 DIVIDED BY total headcount of staff employed (in each category) during the 1 September 2015 to 31 August 2016 period* MULTIPLIED BY 100 * To calculate the total headcount of staff employed: ADD the number employed at the start of the period (i.e. 1 September 2015) to any new starters between then and 31 August 2016 EXAMPLE: 25 staff left the college during 2015/16, of which 5 were compulsory redundancies total leavers = 25-5 = 20 100 staff employed on 1 September 2015 and 10 new starters between then and 31 August 2016 total staff in 2015/16 = 100+10 = 110 Turnover = (20/110)*100 = 18% 4. Sickness absence (2015/16) Sickness absence: this includes all absences attributed to sickness, including all long-term sickness absence of employees irrespective of length, absences due to industrial injury and absences of less than one day. Sickness absence excludes authorised absences for medical appointments, dental appointments, and
40
maternity leave. It also excludes emergency leave, parental/dependents leave and compassionate leave. Any half-day absence should be recorded on a pro-rata basis, i.e. 0.5 days. Number of employees: employee numbers should be calculated using HEADCOUNTS. (Following feedback from colleges, this has been changed from previous years’ full-time equivalent (FTE) measure). Note - for clarification: if an employee started or left part way through the year, they should still be counted as ‘one’. Sum of total possible working days: you will need to add up the total possible working days in 2015/16 for each employee and add this up to give an overall total for all staff in each category. Note you will need to pro-rata the days for any staff that started or left part way through the year: • e.g. for each full-time employee who worked 5 days per week, this would be:
365 calendar days – 104 weekend days = 261 • e.g. for someone employed 4 days a week ,this would be 365 calendar days -
104 weekend days - 52 weekdays not worked = 209 • e.g. for a full-time employee that started half way through the year, this would
be 183 calendar days – 52 weekend days = 131 5. Further information on sickness absence calculations (not required for survey completion): AoC uses the following calculations when reporting on the absence data: • Lost time percentage (LTP) This shows the percentage of the total time available which has been lost because of sickness absence from all causes in a given period: Total number of days of sickness absence in 2015/16 X 100 Total possible working days in the period • Absence rate (AR) The absence rate shows the average number of working days lost due to sickness absence per employee: Total number of days of sickness absence in 2015/16 Total headcount of employees during the period
41