Embed Size (px)
Citation preview
ANZ BANK NEW ZEALAND LIMITED REGISTERED BANK DISCLOSURE STATEMENT
FOR THE NINE MONTHS ENDED 30 JUNE 2017 NUMBER 86 | ISSUED AUGUST 2017

ANZ Bank New Zealand Limited REGISTERED BANK DISCLOSURE STATEMENT FOR THE NINE MONTHS ENDED 30 JUNE 2017
CONTENTS General Disclosures 2
Income Statement 3
Statement of Comprehensive Income 3
Balance Sheet 4
Condensed Cash Flow Statement 5
Statement of Changes in Equity 6
Notes to the Financial Statements 7
Directors' Statement 16
GLOSSARY OF TERMS In this Registered Bank Disclosure Statement (Disclosure Statement) unless the context otherwise requires:
Bank means ANZ Bank New Zealand Limited.
Banking Group means the Bank and all its controlled entities.
Immediate Parent Company means ANZ Holdings (New Zealand) Limited.
Ultimate Parent Bank means Australia and New Zealand Banking Group Limited.
Overseas Banking Group means the worldwide operations of Australia and New Zealand Banking Group Limited including its controlled entities.
New Zealand business means all business, operations, or undertakings conducted in or from New Zealand identified and treated as if it were conducted by a company formed and registered in New Zealand.
NZ Branch means the New Zealand business of the Ultimate Parent Bank.
ANZ New Zealand means the New Zealand business of the Overseas Banking Group.
UDC means UDC Finance Limited.
Registered Office is Ground Floor, ANZ Centre, 23-29 Albert Street, Auckland, New Zealand, which is also the Banking Group’s address for service.
RBNZ means the Reserve Bank of New Zealand.
APRA means the Australian Prudential Regulation Authority.
the Order means the Registered Bank Disclosure Statements (New Zealand Incorporated Registered Banks) Order 2014.
Any term or expression which is defined in, or in the manner prescribed by, the Order shall have the meaning given in or prescribed by the Order.

ANZ Bank New Zealand Limited 2 GENERAL DISCLOSURES
This Disclosure Statement has been issued in accordance with the Order.
Credit Rating Information The Bank has three credit ratings, which are applicable to its long-term senior unsecured obligations. On 19 June 2017, Moody’s Investors Service downgraded the Bank’s credit rating from Aa3 to A1 and changed the outlook from Negative to Stable.
The Bank’s credit ratings are:
Rating Agency Current Credit
Rating Qualification Standard & Poor’s AA- Outlook Negative
Moody’s Investors Service A1 Outlook Stable
Fitch Ratings AA- Outlook Stable
Guarantors No material obligations of the Bank are guaranteed as at 11 August 2017.
ANZNZ Covered Bond Trust Certain debt securities (Covered Bonds) issued by the Bank’s wholly owned subsidiary, ANZ New Zealand (Int’l) Limited, are guaranteed by ANZNZ Covered Bond Trust Limited (the Covered Bond Guarantor), solely in its capacity as trustee of ANZNZ Covered Bond Trust. The Covered Bond Guarantor has guaranteed the payment of interest and principal of Covered Bonds with a carrying value as at 30 June 2017 of NZ$5,111 million, pursuant to a guarantee which is secured over a pool of assets. The Covered Bond Guarantor’s address for service is Level 9, 34 Shortland Street, Auckland, New Zealand. The Covered Bond Guarantor is not a member of the Banking Group and has no credit ratings applicable to its long term senior unsecured obligations. The Covered Bonds have been assigned a long term rating of Aaa and AAA by Moody’s Investors Service and Fitch Ratings respectively. Details of the pool of assets that secure this guarantee are provided in note 7.
Other Matters
APRA has reviewed the level of exposures that can be provided to the respective New Zealand banking subsidiaries and branches (New Zealand operations) of the four Australian parent banks, including the Ultimate Parent Bank.
APRA has confirmed that by 1 January 2021 no more than 5% of the Ultimate Parent Bank’s Level 1 Tier 1 capital can comprise non-equity exposures to its New Zealand operations during ordinary times. Exposures in excess of this limit must be reduced in equal percentages over the five year transition period and may not increase above the exposures as at 30 June 2015. This limit does not include holdings of capital instruments or eligible secured contingent funding support provided to the Bank during times of financial stress.
The Ultimate Parent Bank established a New Zealand branch which was registered on 5 January 2009. The Bank sells, from time-to-time, residential loans and mortgages into the NZ Branch to provide funding for the Bank’s business. As at 30 June 2017, the NZ Branch held NZ$4.8 billion of residential loans. To satisfy APRA’s requirements described above, the Bank intends to repay this funding at approximately NZ$1.6 billion per annum over the five year transition period ending 31 December 2020.
APRA has also clarified that contingent funding support by the Ultimate Parent Bank to the Bank during times of financial stress must be provided on terms that are acceptable to APRA and, in aggregate with all other exposures to its New Zealand operations, must not exceed 50% of the Ultimate Parent Bank’s Level 1 Tier 1 capital. At present, only covered bonds meet APRA’s criteria for contingent funding. On this basis, we believe that the Ultimate Parent Bank will continue to be able to provide financial support to the Bank.
Auditor The Banking Group’s auditor is KPMG, Chartered Accountants, Level 9, 10 Customhouse Quay, Wellington, New Zealand.

ANZ Bank New Zealand Limited 3
The notes to the financial statements form part of and should be read in conjunction with these financial statements
INCOME STATEMENT
Unaudited Unaudited Audited
9 months to 9 months to Year to 30/06/2017 30/06/2016 30/09/2016
Note NZ$m NZ$m NZ$m
Interest income 4,620 4,837 6,423
Interest expense 2,352 2,590 3,421
Net interest income 2,268 2,247 3,002
Net trading gains 174 44 12
Net funds management and insurance income 238 325 414
Other operating income 2 239 318 421
Share of associates' profit 5 2 5
Operating income 2,924 2,936 3,854
Operating expenses 1,101 1,197 1,599
Profit before credit impairment and income tax 1,823 1,739 2,255
Credit impairment charge 5 53 105 150
Profit before income tax 1,770 1,634 2,105
Income tax expense 496 449 570
Profit after income tax 1,274 1,185 1,535
STATEMENT OF COMPREHENSIVE INCOME
Unaudited Unaudited Audited
9 months to 9 months to Year to
30/06/2017 30/06/2016 30/09/2016
NZ$m NZ$m NZ$m
Profit after income tax 1,274 1,185 1,535
Items that will not be reclassified to profit or loss
Actuarial gain / (loss) on defined benefit schemes 19 (6) 18
Income tax credit / (expense) relating to items that will not be reclassified (5) 2 (5)
Total items that will not be reclassified to profit or loss 14 (4) 13
Items that may be reclassified subsequently to profit or loss
Unrealised gains / (losses) recognised directly in equity (18) 78 91
Realised losses transferred to income statement 10 4 9
Income tax credit / (expense) relating to items that may be reclassified 2 (23) (28)
Total items that may be reclassified subsequently to profit or loss (6) 59 72
Total comprehensive income for the period 1,282 1,240 1,620

ANZ Bank New Zealand Limited 4
The notes to the financial statements form part of and should be read in conjunction with these financial statements
BALANCE SHEET
Unaudited Unaudited Audited
30/06/2017 30/06/2016 30/09/2016
Note NZ$m NZ$m NZ$m
Assets
Cash 2,216 1,836 2,274
Settlement balances receivable 374 550 396
Collateral paid 2,227 2,326 2,310
Trading securities 9,781 12,746 11,979
Investments backing insurance contract liabilities 120 120 119
Derivative financial instruments 15,429 21,505 21,110
Current tax assets 141 135 -
Available-for-sale assets 4,818 2,831 2,859
Net loans and advances 4 116,454 113,107 114,623
Other assets 619 723 701
Life insurance contract assets 605 633 630
Investments in associates 7 4 7
Premises and equipment 377 398 387
Goodwill and other intangible assets 3,283 3,418 3,424
UDC assets held for sale 17 2,956 - -
Total assets 159,407 160,332 160,819
Interest earning and discount bearing assets 138,835 133,307 134,489
Liabilities
Settlement balances payable 1,709 1,764 1,771
Collateral received 549 761 529
Deposits and other borrowings 8 102,091 99,941 99,066
Derivative financial instruments 16,619 22,674 21,956
Current tax liabilities - - 21
Deferred tax liabilities 167 155 145
Payables and other liabilities 1,121 1,571 1,119
Provisions 196 190 206
Debt issuances 9 19,320 17,108 20,014
Subordinated debt 10 3,283 3,282 3,282
UDC liabilities held for sale 17 1,150 - -
Total liabilities 146,205 147,446 148,109
Net assets 13,202 12,886 12,710
Equity
Share capital 8,888 8,888 8,888
Reserves 56 49 62
Retained earnings 4,258 3,949 3,760
Total equity 13,202 12,886 12,710
Interest and discount bearing liabilities 118,509 114,532 115,961

ANZ Bank New Zealand Limited 5
The notes to the financial statements form part of and should be read in conjunction with these financial statements
CONDENSED CASH FLOW STATEMENT Unaudited Unaudited Audited
9 months to 9 months to Year to
30/06/2017 30/06/2016 30/09/2016
NZ$m NZ$m NZ$m
Cash flows from operating activities Interest received 4,649 4,839 6,443
Interest paid (2,301) (2,573) (3,416)
Other cash inflows provided by operating activities 689 733 976
Other cash outflows used in operating activities (1,617) (1,712) (2,143)
Cash flows from operating profits before changes in operating assets and liabilities 1,420 1,287 1,860
Net changes in operating assets and liabilities (140) (1,606) (4,434)
Net cash flows provided by / (used in) operating activities 1,280 (319) (2,574)
Cash flows from investing activities
Cash inflows provided by investing activities - 38 40
Cash outflows used in investing activities (41) (69) (100)
Net cash flows used in investing activities (41) (31) (60)
Cash flows from financing activities
Cash inflows provided by financing activities 2,943 4,845 8,318
Cash outflows used in financing activities (4,289) (5,087) (5,840)
Net cash flows provided by / (used in) financing activities (1,346) (242) 2,478
Net decrease in cash and cash equivalents (107) (592) (156)
Cash and cash equivalents at beginning of the period 2,315 2,471 2,471
Cash and cash equivalents at end of the period 2,208 1,879 2,315

ANZ Bank New Zealand Limited 6
The notes to the financial statements form part of and should be read in conjunction with these financial statements
STATEMENT OF CHANGES IN EQUITY
Share capital
Available- for-sale
revaluation reserve
Cash flow hedging
reserve Retained earnings
Total equity
NZ$m NZ$m NZ$m NZ$m NZ$m
As at 1 October 2015 (Audited) 8,888 - (10) 3,575 12,453
Profit after income tax - - - 1,185 1,185
Unrealised gains recognised directly in equity - - 78 - 78
Realised losses transferred to the income statement - - 4 - 4
Actuarial loss on defined benefit schemes - - - (6) (6)
Income tax credit / (expense) on items recognised directly in equity - - (23) 2 (21)
Total comprehensive income for the period - - 59 1,181 1,240
Ordinary dividend paid - - - (800) (800)
Preference dividend paid - - - (7) (7)
As at 30 June 2016 (Unaudited) 8,888 - 49 3,949 12,886
As at 1 October 2015 (Audited) 8,888 - (10) 3,575 12,453
Profit after income tax - - - 1,535 1,535
Unrealised gains / (losses) recognised directly in equity - (2) 93 - 91
Realised losses transferred to the income statement - 2 7 - 9
Actuarial gain on defined benefit schemes - - - 18 18
Income tax expense on items recognised directly in equity - - (28) (5) (33)
Total comprehensive income for the period - - 72 1,548 1,620
Ordinary dividend paid - - - (1,350) (1,350)
Preference dividend paid - - - (13) (13)
As at 30 September 2016 (Audited) 8,888 - 62 3,760 12,710
Profit after income tax - - - 1,274 1,274
Unrealised gains / (losses) recognised directly in equity - 10 (28) - (18)
Realised losses transferred to the income statement - - 10 - 10
Actuarial gain on defined benefit schemes - - - 19 19
Income tax credit / (expense) on items recognised directly in equity - (3) 5 (5) (3)
Total comprehensive income for the period - 7 (13) 1,288 1,282
Ordinary dividend paid - - - (785) (785)
Preference dividend paid - - - (5) (5)
As at 30 June 2017 (Unaudited) 8,888 7 49 4,258 13,202

ANZ Bank New Zealand Limited 7 NOTES TO THE FINANCIAL STATEMENTS
1. SIGNIFICANT ACCOUNTING POLICIES (i) Reporting entity and statement of compliance
These interim financial statements are for the Banking Group for the nine months ended 30 June 2017. They have been prepared in accordance with the requirements of the Order and New Zealand Generally Accepted Accounting Practice (NZ GAAP) as applicable to interim financial statements. The Banking Group is a publicly accountable for-profit entity for the purposes of complying with NZ GAAP.
These financial statements comply with NZ IAS 34 Interim Financial Reporting, IAS 34 Interim Financial Reporting and the Order, and should be read in conjunction with the Banking Group’s financial statements for the year ended 30 September 2016.
(ii) Basis of measurement
These financial statements have been prepared on a going concern basis in accordance with historical cost concepts except that the following assets and liabilities are stated at their fair value:
• derivative financial instruments • available-for-sale financial assets • financial instruments held for trading • financial instruments designated at fair value through
profit and loss.
(iii) Changes in accounting policies
The accounting policies adopted by the Banking Group are consistent with those adopted and disclosed in the previous full year Disclosure Statement.
(iv) Presentation currency and rounding
The amounts contained in the financial statements are presented in millions of New Zealand dollars, unless otherwise stated.
(v) Comparatives
Certain amounts in the comparative information have been reclassified to ensure consistency with the current period’s presentation.
(vi) Principles of consolidation
The financial statements consolidate the financial statements of the Bank and its subsidiaries.
2. OTHER OPERATING INCOME Unaudited Unaudited Audited
9 months to 9 months to Year to
30/06/2017 30/06/2016 30/09/2016
NZ$m NZ$m NZ$m
Net fee income 305 316 422
Net fair value loss on hedging activities and other fair value adjustments (90) (28) (42)
Gain / (loss) on sale of mortgages to NZ Branch (1) 1 1
Other income 25 29 40
Total other operating income 239 318 421

ANZ Bank New Zealand Limited 8 NOTES TO THE FINANCIAL STATEMENTS
3. SEGMENT ANALYSIS The Banking Group is organised into three major business segments for segment reporting purposes - Retail, Commercial and Institutional. Centralised back office and corporate functions support these segments. These segments are consistent with internal reporting provided to the chief operating decision maker, being the Bank’s Chief Executive Officer.
During the year ended 30 September 2016, Wealth was integrated with Retail, having been disclosed separately previously. Segment reporting has been updated to reflect this change and other minor changes to the Banking Group’s structure. Comparative data has been adjusted to be consistent with the current period’s segment definitions.
Retail
Retail provides products and services to Retail, Private Banking, and Business Banking customers via the branch network, mortgage specialists, relationship managers, the contact centre and a variety of self service channels (internet banking, phone banking, ATMs, website and mobile phone banking). Retail and Private Banking customers have personal banking requirements and Business Banking customers consist primarily of small enterprises with annual revenues of less than NZ$5 million. Core products and services include current and savings accounts, unsecured lending (credit
cards, personal loans and overdrafts), home loans secured by mortgages over property, investment products, superannuation and insurance services.
Commercial
Commercial provides services to Commercial & Agri (CommAgri) and UDC customers. CommAgri customers consist of primarily privately owned medium to large enterprises. Commercial's relationship with these businesses ranges from simple banking requirements with revenue from deposit and transactional facilities, and cash flow lending, to more complex funding arrangements with revenue sourced from a wider range of products. UDC is principally involved in the financing and leasing of plant, vehicles and equipment, mainly for small and medium sized businesses, as well as investment products.
Institutional
Institutional provides financial services through a number of specialised units to large multi-banked corporations, often global, which require sophisticated product and risk management solutions. Those financial services include loan structuring, foreign exchange and interest rate products, wholesale money market services and transaction banking.
Other
Other includes treasury and back office support functions, none of which constitutes a separately reportable segment.
Business segment analysis1 Retail Commercial Institutional Other Total
NZ$m NZ$m NZ$m NZ$m NZ$m
Unaudited 9 months to 30/06/2017
External revenues 1,978 1,336 469 (859) 2,924
Intersegment revenues (202) (651) 43 810 -
Total revenues 1,776 685 512 (49) 2,924
Profit / (loss) after income tax 718 328 280 (52) 1,274
Unaudited 9 months to 30/06/2016
External revenues 1,874 1,427 369 (734) 2,936
Intersegment revenues (126) (742) 13 855 -
Total revenues 1,748 685 382 121 2,936
Profit after income tax 682 327 158 18 1,185
Audited year to 30/09/2016
External revenues 2,543 1,890 453 (1,032) 3,854
Intersegment revenues (198) (980) 19 1,159 -
Total revenues 2,345 910 472 127 3,854
Profit after income tax 904 417 196 18 1,535
1 Intersegment transfers are accounted for and determined on an arm's length or cost recovery basis.
Other segment
The table below sets out the profit/(loss) after tax impact of items included in Other.
Unaudited Unaudited Audited
9 months to 9 months to Year to 30/06/2017 30/06/2016 30/09/2016 NZ$m NZ$m NZ$m
Operations and support 3 11 3
Economic hedges (65) (20) (29)
Revaluation of insurance policies from changes in interest rates (25) 45 42
Other 35 (18) 2
Total (52) 18 18
ANZ Bank New Zealand Limited 9 NOTES TO THE FINANCIAL STATEMENTS
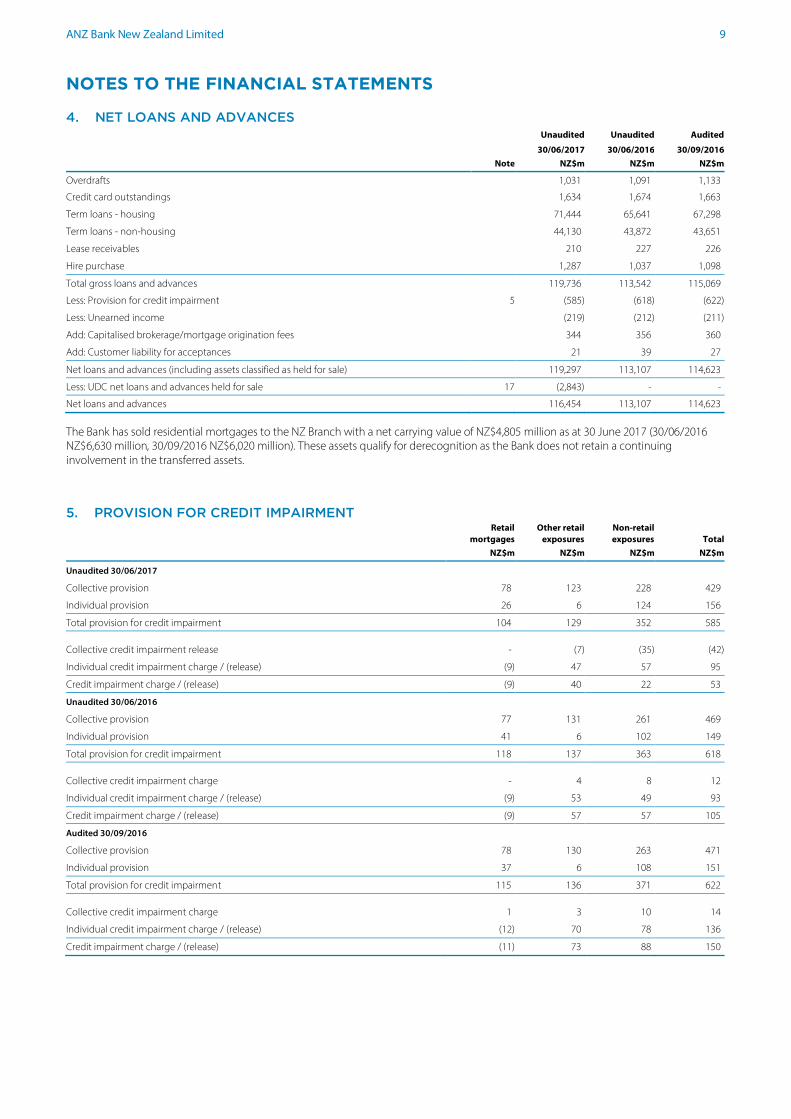
4. NET LOANS AND ADVANCES Unaudited Unaudited Audited 30/06/2017 30/06/2016 30/09/2016 Note NZ$m NZ$m NZ$m
Overdrafts 1,031 1,091 1,133
Credit card outstandings 1,634 1,674 1,663
Term loans - housing 71,444 65,641 67,298
Term loans - non-housing 44,130 43,872 43,651
Lease receivables 210 227 226
Hire purchase 1,287 1,037 1,098
Total gross loans and advances 119,736 113,542 115,069
Less: Provision for credit impairment 5 (585) (618) (622)
Less: Unearned income (219) (212) (211)
Add: Capitalised brokerage/mortgage origination fees 344 356 360
Add: Customer liability for acceptances 21 39 27
Net loans and advances (including assets classified as held for sale) 119,297 113,107 114,623
Less: UDC net loans and advances held for sale 17 (2,843) - -
Net loans and advances 116,454 113,107 114,623
The Bank has sold residential mortgages to the NZ Branch with a net carrying value of NZ$4,805 million as at 30 June 2017 (30/06/2016 NZ$6,630 million, 30/09/2016 NZ$6,020 million). These assets qualify for derecognition as the Bank does not retain a continuing involvement in the transferred assets. 5. PROVISION FOR CREDIT IMPAIRMENT
Retail
mortgages Other retail
exposures Non-retail exposures Total
NZ$m NZ$m NZ$m NZ$m
Unaudited 30/06/2017
Collective provision 78 123 228 429
Individual provision 26 6 124 156
Total provision for credit impairment 104 129 352 585 Collective credit impairment release - (7) (35) (42)
Individual credit impairment charge / (release) (9) 47 57 95
Credit impairment charge / (release) (9) 40 22 53
Unaudited 30/06/2016
Collective provision 77 131 261 469
Individual provision 41 6 102 149
Total provision for credit impairment 118 137 363 618 Collective credit impairment charge - 4 8 12
Individual credit impairment charge / (release) (9) 53 49 93
Credit impairment charge / (release) (9) 57 57 105
Audited 30/09/2016
Collective provision 78 130 263 471
Individual provision 37 6 108 151
Total provision for credit impairment 115 136 371 622 Collective credit impairment charge 1 3 10 14
Individual credit impairment charge / (release) (12) 70 78 136
Credit impairment charge / (release) (11) 73 88 150

ANZ Bank New Zealand Limited 10 NOTES TO THE FINANCIAL STATEMENTS
6. IMPAIRED ASSETS AND PAST DUE ASSETS
Retail
mortgages Other retail
exposures Non-retail exposures Total
NZ$m NZ$m NZ$m NZ$m
Unaudited 30/06/2017
Total impaired assets 37 20 368 425
Loans that are at least 90 days past due but not impaired 129 32 14 175
Unaudited 30/06/2016
Total impaired assets 66 30 264 360
Loans that are at least 90 days past due but not impaired 98 31 49 178
Audited 30/09/2016
Total impaired assets 57 27 342 426
Loans that are at least 90 days past due but not impaired 81 26 23 130
7. ASSETS CHARGED AS SECURITY FOR LIABILITIES
The carrying amounts of assets pledged as security are as follows. These amounts exclude the amounts disclosed as collateral paid in the balance sheet that relate to derivative liabilities. The terms and conditions of the collateral agreements are included in the standard Credit Support Annex that forms part of the International Swaps and Derivatives Association Master Agreements.
Carrying Amount Related Liability
Unaudited Unaudited Audited Unaudited Unaudited Audited
30/06/2017 30/06/2016 30/09/2016 30/06/2017 30/06/2016 30/09/2016 NZ$m NZ$m NZ$m NZ$m NZ$m NZ$m
Securities sold under agreements to repurchase 530 861 77 531 861 76
Residential mortgages pledged as security for covered bonds 10,842 11,317 10,265 5,111 4,739 6,218
Assets pledged as collateral for UDC secured investments 2,922 2,619 2,665 1,121 1,677 1,592
UDC Secured Investments are secured by a security interest granted under the Trust Deed over all of UDC Finance Limited's (UDC) present and future assets and undertakings, to Trustees Executors Limited, as supervisor. The assets subject to the security interest comprise mainly loans to UDC's customers and certain plant and equipment. The security interest secures all amounts payable by UDC on the UDC Secured Investments and all other moneys payable by UDC under the Trust Deed.
ANZNZ Covered Bond Trust (the Covered Bond Trust)
Substantially all of the assets of the Covered Bond Trust are made up of certain housing loans and related securities originated by the Bank which are security for the guarantee by ANZNZ Covered Bond Trust Limited as trustee of the Covered Bond Trust of issuances of covered bonds by the Bank, or its wholly owned subsidiary ANZ New Zealand (Int’l) Limited, from time to time. The assets of the Covered Bond Trust are not available to creditors of the Bank, although the Bank (or its liquidator or statutory manager) may have a claim against the residual assets of the Covered Bond Trust (if any) after all prior ranking creditors of the Covered Bond Trust have been satisfied.
The Banking Group continues to recognise the assets of the Covered Bond Trust on its balance sheet as, although they are pledged as security for covered bonds, the Bank retains substantially all the risks and rewards of ownership. 8. DEPOSITS AND OTHER BORROWINGS Unaudited Unaudited Audited
30/06/2017 30/06/2016 30/09/2016 Note NZ$m NZ$m NZ$m
Term deposits 45,721 38,121 39,665
On demand and short term deposits 42,157 43,674 42,323
Deposits not bearing interest 8,590 7,548 7,780
UDC secured investments 7 1,121 1,677 1,592
Total customer deposits 97,589 91,020 91,360
Certificates of deposit 2,270 1,502 2,237
Commercial paper 2,736 6,541 5,364
Securities sold under agreements to repurchase 531 861 76
Deposits from Ultimate Parent Bank and other members of ANZ New Zealand 86 17 29
Deposits and other borrowings (including liabilities classified as held for sale) 103,212 99,941 99,066
Less: UDC secured investments held for sale 17 (1,121) - -
Deposits and other borrowings 102,091 99,941 99,066
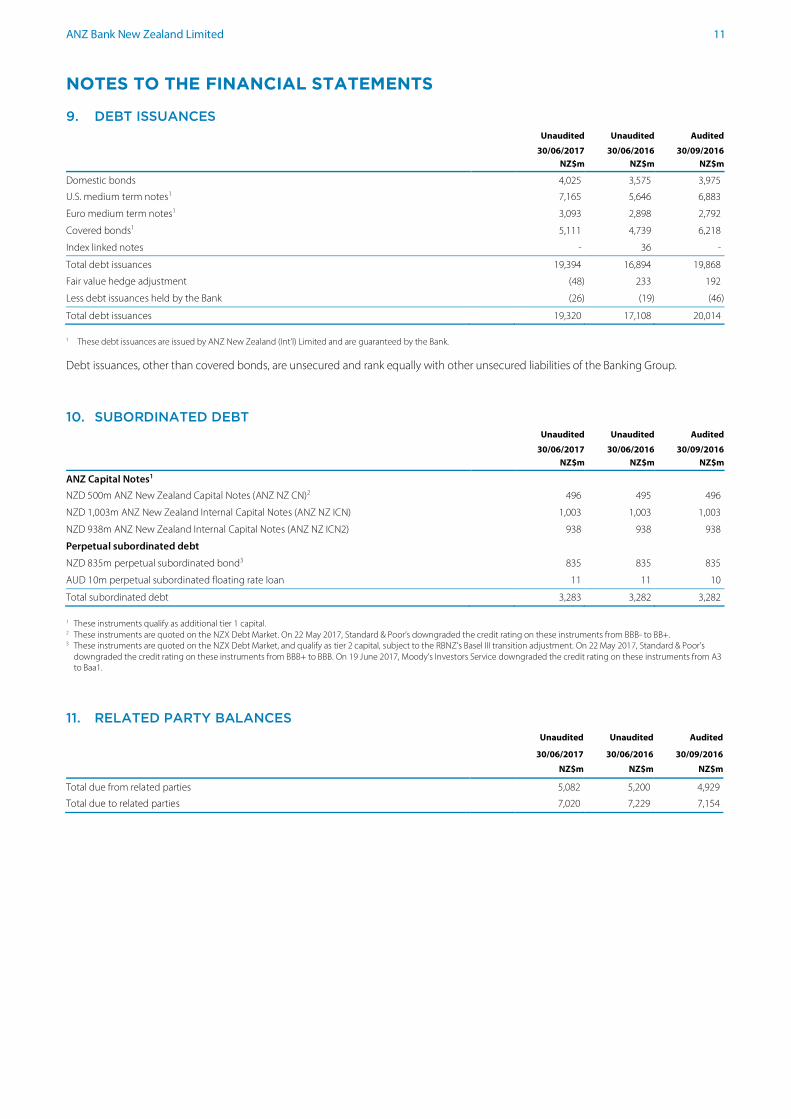
ANZ Bank New Zealand Limited 11 NOTES TO THE FINANCIAL STATEMENTS
9. DEBT ISSUANCES Unaudited Unaudited Audited
30/06/2017 30/06/2016 30/09/2016 NZ$m NZ$m NZ$m
Domestic bonds 4,025 3,575 3,975
U.S. medium term notes1 7,165 5,646 6,883
Euro medium term notes1 3,093 2,898 2,792
Covered bonds1 5,111 4,739 6,218
Index linked notes - 36 -
Total debt issuances 19,394 16,894 19,868
Fair value hedge adjustment (48) 233 192
Less debt issuances held by the Bank (26) (19) (46)
Total debt issuances 19,320 17,108 20,014 1 These debt issuances are issued by ANZ New Zealand (Int’l) Limited and are guaranteed by the Bank.
Debt issuances, other than covered bonds, are unsecured and rank equally with other unsecured liabilities of the Banking Group. 10. SUBORDINATED DEBT Unaudited Unaudited Audited 30/06/2017 30/06/2016 30/09/2016
NZ$m NZ$m NZ$m
ANZ Capital Notes1
NZD 500m ANZ New Zealand Capital Notes (ANZ NZ CN)2 496 495 496
NZD 1,003m ANZ New Zealand Internal Capital Notes (ANZ NZ ICN) 1,003 1,003 1,003
NZD 938m ANZ New Zealand Internal Capital Notes (ANZ NZ ICN2) 938 938 938
Perpetual subordinated debt
NZD 835m perpetual subordinated bond3 835 835 835
AUD 10m perpetual subordinated floating rate loan 11 11 10
Total subordinated debt 3,283 3,282 3,282
1 These instruments qualify as additional tier 1 capital. 2 These instruments are quoted on the NZX Debt Market. On 22 May 2017, Standard & Poor’s downgraded the credit rating on these instruments from BBB- to BB+. 3 These instruments are quoted on the NZX Debt Market, and qualify as tier 2 capital, subject to the RBNZ’s Basel III transition adjustment. On 22 May 2017, Standard & Poor’s
downgraded the credit rating on these instruments from BBB+ to BBB. On 19 June 2017, Moody’s Investors Service downgraded the credit rating on these instruments from A3 to Baa1.
11. RELATED PARTY BALANCES Unaudited Unaudited Audited
30/06/2017 30/06/2016 30/09/2016
NZ$m NZ$m NZ$m
Total due from related parties 5,082 5,200 4,929
Total due to related parties 7,020 7,229 7,154

ANZ Bank New Zealand Limited 12 NOTES TO THE FINANCIAL STATEMENTS
12. CAPITAL ADEQUACY RBNZ Basel III capital ratios
RBNZ
minimum ratios
Banking Group
Unaudited 30/06/2017 30/06/2016 30/09/2016
Common equity tier 1 capital 4.5% 10.7% 10.4% 10.0%
Tier 1 capital 6.0% 13.9% 13.7% 13.2%
Total capital 8.0% 14.2% 14.2% 13.7%
Buffer ratio 2.5% 6.2% 5.9% 5.5%
Capital of the Banking Group Unaudited
30/06/2017 NZ$m
Common equity tier 1 capital before deductions 12,902
Less deductions from common equity tier 1 capital (3,756)
Common equity tier 1 capital 9,146
Additional tier 1 capital 2,777
Total tier 1 capital 11,923
Tier 2 capital 234
Total capital 12,157
Capital requirements of the Banking Group
Exposure at default
Risk weighted exposure or implied risk
weighted exposure1
Total capital requirement
Unaudited 30/06/2017 NZ$m NZ$m NZ$m
Corporate exposures 49,643 29,838 2,387
Sovereign exposures 11,377 128 10
Bank exposures 11,642 3,413 273
Retail mortgage exposures 77,765 16,913 1,353
Other retail exposures 10,851 8,634 691
Exposures subject to internal ratings based approach 161,278 58,926 4,714
Specialised lending exposures subject to slotting approach 11,777 10,697 856
Exposures subject to standardised approach 2,249 476 37
Equity exposures 8 32 3
Other exposures 3,535 1,686 135
Agri business supervisory adjustment n/a 1,372 110
Total credit risk 178,847 73,189 5,855
Operational risk n/a 5,874 470
Market risk n/a 6,797 544
Total 178,847 85,860 6,869
1 Total credit risk weighted exposures include a scalar of 1.06 in accordance with the Bank's Conditions of Registration.

ANZ Bank New Zealand Limited 13 NOTES TO THE FINANCIAL STATEMENTS
Capital for other material risks
The Banking Group has an Internal Capital Adequacy Assessment Process (ICAAP) which complies with the requirements of the Bank's Conditions of Registration.
Under the Banking Group's ICAAP it identifies and measures all "other material risks", which are those material risks that are not explicitly captured in the calculation of the Banking Group's tier 1 and total capital ratios. The other material risks identified by the Banking Group include pension risk, insurance risk, strategic equity risk, fixed asset risk, deferred acquisition cost risk, value in-force risk, business retention risk and software risk.
The Banking Group's internal capital allocation for these other material risks is NZ$437 million (30/06/2016 NZ$438 million; 30/09/2016 NZ$441 million).
The Banking Group regularly reviews the methodologies used to calculate the economic capital allocated to other material risks.
Residential mortgages by loan-to-valuation ratio (LVR)
As required by the RBNZ, LVRs are calculated as the current exposure secured by a residential mortgage divided by the Banking Group's valuation of the security property at origination of the exposure. Off balance sheet exposures include undrawn and partially drawn residential mortgage loans as well as commitments to lend. Commitments to lend are formal offers for housing lending which have been accepted by the customer. On-balance
sheet Off-balance
sheet Total Unaudited 30/06/2017 NZ$m NZ$m NZ$m
LVR range
Does not exceed 60% 32,130 5,217 37,347
Exceeds 60% and not 70% 15,720 1,386 17,106
Exceeds 70% and not 80% 16,812 1,273 18,085
Does not exceed 80% 64,662 7,876 72,538
Exceeds 80% and not 90% 2,809 141 2,950
Exceeds 90% 1,469 185 1,654
Total 68,940 8,202 77,142
Liquidity portfolio management
The Banking Group holds a diversified portfolio of cash and high quality liquid securities to support liquidity risk management. The size of the Banking Group’s liquidity portfolio is based on the amount required to meet the requirements of its liquidity policy and includes both items classified as cash and those classified as operating assets in the Condensed Cash Flow Statement.
Unaudited 30/06/2017
NZ$m
Cash and balances with central banks 2,018
Certificates of deposit 549
Government, local body stock and bonds 5,520
Government treasury bills 701
Other bonds 6,960
Total liquidity portfolio 15,748
The Bank also held unencumbered internal residential mortgage backed securities which would entitle the Banking Group to enter into repurchase transactions with a value of NZ$7,427 million at 30 June 2017.

ANZ Bank New Zealand Limited 14 NOTES TO THE FINANCIAL STATEMENTS
13. FAIR VALUE MEASUREMENTS Financial assets and financial liabilities not measured at fair value
Below is a comparison of the carrying amounts as reported on the balance sheet and fair values of financial asset and liability categories other than those categories where the carrying amount is at fair value or considered a reasonable approximation of fair value.
The fair values below have been calculated using discounted cash flow techniques where contractual future cash flows of the instrument are discounted using discount rates incorporating wholesale market rates or market borrowing rates of debt with similar maturities or a yield curve appropriate for the remaining term to maturity.
Unaudited Unaudited Audited
30/06/2017 30/06/2016 30/09/2016
Carrying amount Fair value
Carrying amount Fair value
Carrying amount Fair value
NZ$m NZ$m NZ$m NZ$m NZ$m NZ$m
Assets
Net loans and advances1, 2 119,297 119,272 113,107 113,437 114,623 114,891
Liabilities
Deposits and other borrowings2, 3 103,212 103,253 99,941 100,059 99,066 99,169
Debt issuances1 19,320 19,483 17,108 17,233 20,014 20,148
Subordinated debt 3,283 3,465 3,282 3,220 3,282 3,351
1 Fair value hedging is applied to certain financial instruments within these categories. The resulting fair value adjustments mean that the carrying value differs from the amortised cost.
2 Includes UDC items classified as held for sale. 3 Includes commercial paper (note 8) designated at fair value through profit or loss.
Financial assets and financial liabilities measured at fair value in the balance sheet
The Banking Group uses a valuation method within the following hierarchy to determine the carrying amount of assets and liabilities held at fair value, all of which are recurring fair value measurements. There are no assets or liabilities measured at fair value on a non-recurring basis.
• Level 1 – Financial instruments that have been valued by reference to unadjusted quoted prices in active markets for identical financial instruments. This category includes financial instruments valued using quoted yields where available for specific debt securities.
• Level 2 – Financial instruments that have been valued through valuation techniques incorporating inputs other than quoted prices within Level 1 that are observable for a similar financial asset or liability, either directly or indirectly.
• Level 3 – Financial instruments that have been valued using valuation techniques which incorporate significant inputs that are not based on observable market data (unobservable inputs).
There have been no substantial changes in the valuation techniques applied to different classes of financial instruments during the period. Valuation hierarchy Unaudited Unaudited Audited
30/06/2017 30/06/2016 30/09/2016
Level 1 Level 2 Level 3 Total Level 1 Level 2 Level 3 Total Level 1 Level 2 Level 3 Total NZ$m NZ$m NZ$m NZ$m NZ$m NZ$m NZ$m NZ$m NZ$m NZ$m NZ$m NZ$m
Financial assets
Trading securities 8,601 1,180 - 9,781 12,592 154 - 12,746 11,937 42 - 11,979
Derivative financial instruments 10 15,415 4 15,429 3 21,495 7 21,505 3 21,100 7 21,110
Available-for-sale assets 4,319 498 1 4,818 1,636 1,193 2 2,831 1,671 1,187 1 2,859
Investments backing insurance contract liabilities
4 116 - 120 5 115 - 120 5 114 - 119
Total financial assets held at fair value 12,934 17,209 5 30,148 14,236 22,957 9 37,202 13,616 22,443 8 36,067
Financial liabilities
Deposits and other borrowings - 2,736 - 2,736 - 6,541 - 6,541 - 5,364 - 5,364
Derivative financial instruments 11 16,607 1 16,619 41 22,630 3 22,674 46 21,908 2 21,956
Payables and other liabilities 180 - - 180 386 - - 386 157 - - 157
Total financial liabilities held at fair value 191 19,343 1 19,535 427 29,171 3 29,601 203 27,272 2 27,477

ANZ Bank New Zealand Limited 15 NOTES TO THE FINANCIAL STATEMENTS
14. CONCENTRATIONS OF CREDIT RISK TO INDIVIDUAL COUNTERPARTIES The Banking Group measures its concentration of credit risk using actual exposures for bank counterparties and limits for non-bank counterparties. No account is taken of collateral, security and/or netting agreements which the Banking Group may hold in respect of the various counterparty exposures.
For the three months ended 30 June 2017 there were no individual counterparties (excluding connected parties, governments and banks with long term credit ratings of A- or above) where the Banking Group’s period end or peak end-of-day credit exposure equalled or exceeded 10% of equity (as at the end of the period).
15. INSURANCE BUSINESS The Banking Group conducts insurance business through its subsidiary OnePath Life (NZ) Limited (OnePath Life).
The Banking Group’s aggregate amount of insurance business comprises the total assets of OnePath Life of NZ$893 million (30/06/2016: NZ$921 million; 30/09/2016 NZ$926 million), which is 0.6% (30/06/2016: 0.6%; 30/09/2016 0.6%) of the total consolidated assets of the Banking Group. 16. CREDIT RELATED COMMITMENTS, GUARANTEES AND CONTINGENT LIABILITIES Unaudited Unaudited Audited
30/06/2017 30/06/2016 30/09/2016
NZ$m NZ$m NZ$m
Contract amount of:
Credit related commitments - facilities provided
Undrawn facilities1 27,121 27,583 27,296
Guarantees and contingent liabilities
Guarantees and letters of credit 902 929 850
Performance related contingencies 1,487 1,534 1,611
Total guarantees and contingent liabilities 2,389 2,463 2,461
Total credit related commitments, guarantees and contingent liabilities 29,510 30,046 29,757
¹ The comparative amount for undrawn facilities as at 30 June 2016 has been reduced by NZ$5,851 million following a review of the composition of commitments.
The Banking Group guarantees the performance of customers by issuing standby letters of credit and guarantees to third parties, including its Ultimate Parent Bank. The risk involved is essentially the same as the credit risk involved in extending loan facilities to customers, therefore these transactions are subjected to the same credit origination, portfolio management and collateral requirements for customers applying for loans. As the facilities may expire without being drawn upon, the notional amounts do not necessarily reflect future cash requirements.
Other contingent liabilities
The Banking Group has other contingent liabilities in respect of actual and possible claims and court proceedings.
An assessment of the Banking Group’s likely loss in respect of these matters has been made on a case-by-case basis and provision made where deemed necessary. 17. DISPOSAL GROUP HELD FOR SALE On 11 January 2017, the Bank announced that it had entered into a conditional agreement to sell UDC to HNA Group for approximately NZ$660 million. Completion is expected late in the second half of the 2017 calendar year. The assets and liabilities of UDC are classified as held for sale as at 30 June 2017. The sale is subject to closing steps and conditions including regulatory approvals.
18. SUBSEQUENT EVENTS On 11 August 2017, the Bank’s Board resolved to pay a preference dividend of NZ$5.8 million on 1 September 2017 and to pay an ordinary dividend of NZ$900 million no later than 30 September 2017.

ANZ Bank New Zealand Limited 16
DIRECTORS' STATEMENT As at the date on which this Disclosure Statement is signed, after due enquiry, each Director believes that:
(i) The Disclosure Statement contains all the information that is required by the Registered Bank Disclosure Statements (New Zealand Incorporated Registered Banks) Order 2014
(ii) The Disclosure Statement is not false or misleading.
Over the nine months ended 30 June 2017, after due enquiry, each Director believes that:
(i) ANZ Bank New Zealand Limited has complied with all Conditions of Registration that applied during that period
(ii) Credit exposures to connected persons were not contrary to the interests of the Banking Group
(iii) ANZ Bank New Zealand Limited had systems in place to monitor and control adequately the Banking Group’s material risks, including credit risk, concentration of credit risk, interest rate risk, currency risk, equity risk, liquidity risk, operational risk and other business risks, and that those systems were being properly applied.
This Disclosure Statement is dated, and has been signed by or on behalf of all Directors of the Bank on, 11 August 2017. Antony Carter Shayne Elliott David Hisco John Judge Mark Verbiest Nigel Williams Joan Withers