Embed Size (px)
Citation preview

ANZ insight
ISSUE 6, AUGUST 2015
A REPORT FROM PORT JACKSON PARTNERS COMMISSIONED BY ANZ
Powering PNG into the Asian Century

ANZ INSIGHT / ISSUE 6, AUGUST 2015

POWERING PNG INTO THE ASIAN CENTURY I
Asian urbanisation and industrialisation presents Papua New Guinea (PNG) with a unique opportunity to fast-track economic and social development. In ANZ’s 2013 insight report Bold Thinking: Imagining PNG in the Asian Century, we identified a number of opportunities to create balanced economic growth throughout PNG. The report also outlined the vital role infrastructure will play in creating this balance. In discussions following Bold Thinking, electricity was identified again and again as an area in which additional work would be of value.
Improving electricity access and service is widely acknowledged as one of PNG’s key infrastructure challenges. Electricity is a foundation for development, underpinning activities which raise quality of life through to those which drive important resource sector projects that create wealth and opportunity. A cheaper, more reliable electricity system would deliver significant economic and social improvements in PNG.
At the same time, rapid improvements in energy technology have created new electricity generation and storage options for developing economies. Countries that seek substantial electricity system improvements can now leap-frog traditional approaches, achieving improved electricity access more cheaply than previously possible.
PNG’s leaders have recognised this combination of great need and newly recognised potential. As a consequence, much valuable work to improve electricity performance has already begun. This work includes the flagship National Electricity Roll-Out Plan (NEROP) and its associated initiatives; PNG’s draft energy policy; ongoing efforts to develop private investment in generation; and reforms to many of the regulations and organisations that govern the country’s electricity sector.
This report aims to discuss key questions relevant to all of these efforts: what is the size of the challenge laid out by existing targets; which development models are emerging on the back of new technologies and how do they compare; and what further changes may be needed to the institutions that must do most to drive improved power outcomes?
The creation of an electricity strategy that can provide for PNG’s future development will be the work of many over the next decade and beyond. This report is an early contribution to that effort. We also hope to lend urgency to the case for redeveloping PNG’s power sector and offer directions that can help guide ongoing work. The size of the prize necessitates an immediate and focused evaluation of PNG’s electricity approach to set a course for decades to come.
Michael Smith Chief Executive Officer, ANZ August 2015
FOREWORD

ANZ INSIGHT / ISSUE 6, AUGUST 2015II

POWERING PNG INTO THE ASIAN CENTURY III
CONTENTS
1 1.0 EXECUTIVE SUMMARY
4 2.0 MATCHING DEMAND: THE CHALLENGE FOR PNG’S ELECTRICITY SYSTEM 4 2.1 A conversation is needed about how best to respond 7 2.2 Electricity performance is poor, especially in rural areas 9 2.3 Tripling demand will be an enormous strain on the existing power model
13 3.0 PRINCIPLES FOR IMPROVEMENT: TOOLS TO SOLVE PNG’S POWER CHALLENGE 14 3.1 Move beyond the assumption the grid is the answer 15 3.2 In on-grid settings utilisation can trump scale, upsetting traditional solutions 18 3.3 New technologies are a superb match for off-grid needs 21 3.4 Better integration of landmark resource developments can support
nationwide development 23 3.5 New approaches will save money and reduce emissions
25 4.0 MEETING THE CHALLENGE: BUILDING A FIT-FOR-PURPOSE ELECTRICITY SECTOR 25 4.1 Reform is needed to allow investment and innovation to flow 26 4.1.1 Structure tariffs and subsidies to offer fair returns on new investments29 4.1.2 Structurally separate PPL to improve performance and eliminate
conflicts of interest 31 4.1.3 Invite competition and consider selectively privatising PPL 32 4.1.4 Introduce a new framework for off-grid provision to introduce competition
of ideas and approaches 33 4.2 A possible future state for PNG’s electricity sector
35 5.0 IMPLICATIONS FOR STAKEHOLDERS SEEKING TO SUPPORT PNG’S ELECTRICITY DEVELOPMENT 35 5.1 Government conversations on the road to success 35 5.1.1 What is the best way forward for PPL and off-grid electricity provision? 36 5.1.2 How can an appropriate and predictable environment for stakeholders involved in electricity provision be established? 36 5.1.3 How should electricity reform align with other government initiatives and PNG’s cultural landscape? 37 5.2 Private entities and NGOs – engage in dialogue with government to develop the future electricity market 37 5.3 Electricity entrepreneurs – communicate new models to gain support 37 5.4 Aid agencies and investors – direct investment towards clean, off-grid solutions 38 5.5 Industrial and resource sector – help resolve the integration challenge 38 5.6 Concluding thoughts
39 APPENDIX 1: METHODOLOGY
43 APPENDIX 2: ELECTRICITY GOVERNANCE

ANZ INSIGHT / ISSUE 6, AUGUST 2015Iv

POWERING PNG INTO THE ASIAN CENTURY v
ACRONYMS
C-Centre Care Centre
CCGT Combined Cycle Gas Turbine
CO2 Carbon Dioxide
DPE Department of Petroleum and Energy
DSIP District Services Improvement Program
EMC Electricity Management Committee
ERC Electricity Regulatory Contract
GDP Gross Domestic Product
ICCC Independent Consumer and Competition Commission
IPBC Independent Public Business Corporation
IPPs Independent Power Producers
LCOE Levelised Cost of Electricity
NEC National Executive Council
NEROP National Electricity Roll-Out Plan
NGO Non-Governmental Organisation
OCGT Open Cycle Gas Turbine
PNG Papua New Guinea
PPL PNG Power Limited
PSIP Provincial Services Improvement Program
REA Rural Electrification Agency
REDD Reducing Emission from Deforestation and Forest Degradation
SOE State Owned Enterprise
Solar Pv Solar Photo-voltaic
Wh Watt hours (k-kilo, M-mega, G-giga, T-tera)

ANZ INSIGHT / ISSUE 6, AUGUST 2015vI
POWERING PNG INTO THE ASIAN CENTURY 1
KEY THEMES:
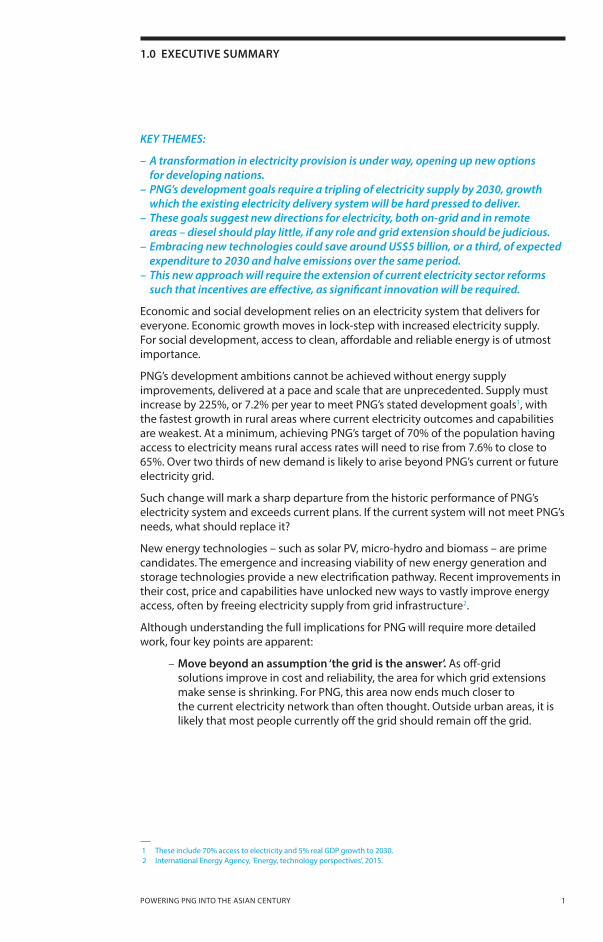
– A transformation in electricity provision is under way, opening up new options for developing nations. – PNG’s development goals require a tripling of electricity supply by 2030, growth which the existing electricity delivery system will be hard pressed to deliver. – These goals suggest new directions for electricity, both on-grid and in remote areas – diesel should play little, if any role and grid extension should be judicious. – Embracing new technologies could save around US$5 billion, or a third, of expected expenditure to 2030 and halve emissions over the same period. – This new approach will require the extension of current electricity sector reforms such that incentives are effective, as significant innovation will be required.
Economic and social development relies on an electricity system that delivers for everyone. Economic growth moves in lock-step with increased electricity supply. For social development, access to clean, affordable and reliable energy is of utmost importance.
PNG’s development ambitions cannot be achieved without energy supply improvements, delivered at a pace and scale that are unprecedented. Supply must increase by 225%, or 7.2% per year to meet PNG’s stated development goals1, with the fastest growth in rural areas where current electricity outcomes and capabilities are weakest. At a minimum, achieving PNG’s target of 70% of the population having access to electricity means rural access rates will need to rise from 7.6% to close to 65%. Over two thirds of new demand is likely to arise beyond PNG’s current or future electricity grid.
Such change will mark a sharp departure from the historic performance of PNG’s electricity system and exceeds current plans. If the current system will not meet PNG’s needs, what should replace it?
New energy technologies – such as solar Pv, micro-hydro and biomass – are prime candidates. The emergence and increasing viability of new energy generation and storage technologies provide a new electrification pathway. Recent improvements in their cost, price and capabilities have unlocked new ways to vastly improve energy access, often by freeing electricity supply from grid infrastructure2.
Although understanding the full implications for PNG will require more detailed work, four key points are apparent:
– Move beyond an assumption ‘the grid is the answer’. As off-grid solutions improve in cost and reliability, the area for which grid extensions make sense is shrinking. For PNG, this area now ends much closer to the current electricity network than often thought. Outside urban areas, it is likely that most people currently off the grid should remain off the grid.
1.0 EXECUTIVE SUMMARY
1 These include 70% access to electricity and 5% real GDP growth to 2030. 2 International Energy Agency, 'Energy, technology perspectives', 2015.

ANZ INSIGHT / ISSUE 6, AUGUST 20152
– For on-grid generation, utilisation effects can challenge traditional approaches. For many plausible demand scenarios, large-scale hydro generation may not be the best option. Low early utilisation rates may mean the whole-of-life cost for large hydro plants could be only 4c/kWh lower than for the latest gas generation plants. The practical and commercial advantages of gas-fired generation may suggest gas is superior. Improved energy forecasts and greater understanding of the impact of generation type and scale on end-user costs are needed to make the right choices.
– New technologies are a superb match for off-grid needs. In areas beyond the reach of the current electricity grid, the use of emerging energy technologies such as micro-hydro, biomass and solar Pv – perhaps twinned with improved energy storage – could immediately make real improvements in cost and reliability, even when compared with currently installed capacity.
This report does not assess all available technologies but those included demonstrate that emerging technologies offer superior economics today across a range of settings. For agricultural processing our estimates suggest energy from diesel generation is 150% more expensive than from biomass generators. Similarly, diesel is 50% more expensive than a twinned solar/storage setup in village settings. In regional centres – for example, Wewak – diesel generation is 20% more expensive than micro-hydro and 150% more expensive than biomass. These cost advantages will grow as the technologies mature.
The benefits extend beyond cost. As they are self-contained, generation plants based on these technologies allow diverse, decentralised supply approaches that can be well matched to local needs. They can be simpler to install and maintain and as many do not require fuel to be shipped to them, their ongoing operation is simpler to support. The economics of these plants are also not contingent on the variable and at times high price of diesel in remote areas. Over time, they can form the basis of local grids and be appropriately integrated into the provision of other basic needs including water. In addition, they support the achievement of emissions targets.
– Better integration of landmark resource and agricultural developments can support nationwide network development. Bold Thinking identified the need to integrate infrastructure development with key agricultural and minerals projects. Electricity planning presents many opportunities to do so. Large concentrated loads – arising particularly from minerals projects – enable the creation of at-scale electricity generation and can also be the centre of regional mini-grids.
However, this integration needs to be performed with care. Planning is needed such that integration is only undertaken where it makes sense. Reliability concerns must also be addressed if integration is to be viable. Appropriate commercial arrangements will be critical and policy and practical work in this area should be a priority.
Together, these points invite a move away from diesel. Achieving PNG’s electricity goals by embracing new generation and storage approaches could reduce required expenditure from around US$15 billion to US$10 billion, saving PNG around US$5 billion over the next 15 years. Furthermore, these choices would more than halve carbon dioxide emissions over the same period.

POWERING PNG INTO THE ASIAN CENTURY 3
Institutional and organisational changes will be needed to deliver these savings. Energy tariffs should be cost-reflective and subsidies made explicit, rather than being governed by internal PNG Power Limited (PPL) decision-making or government intervention. The component parts of the electricity system – generating electricity, transmitting it to end users and helping customers track and pay for the electricity they use – would be best organised and operated separately.
Targeted private sector involvement will be key, in this case to create the competition and innovation needed, particularly off-grid, to expand electricity access. Regional and remote customers in particular will benefit from a thoughtful approach to introducing appropriately regulated competition for the right to serve remote customers.
Over time, PPL may also benefit from privatisation, although there is a case that the transmission (that is, construction and maintenance of the power grid) could usefully remain in public ownership. The details of privatisation bear significant and careful consideration if it is to be executed successfully.
This report describes a possible end-state for PNG’s electricity sector. However, the reforms proposed would represent rapid change for all involved and much remains to be defined. The many programs currently under way – including the drafting of PNG’s new energy policy and NEROP – will ensure real resources are dedicated to establishing a secure energy future for PNG.
A conversation about how best to respond to these challenges is needed and should include:
– What is the best way forward for PPL and off-grid electricity provision?
– How can an appropriate and predictable environment for stakeholders involved in electricity provision be established?
– How should electricity reform align with other government initiatives and with PNG’s social reality?
The possible impact of successful electricity planning and implementation in PNG includes not only the US$5 billion savings outlined above but more importantly a foundation for PNG’s national future. Achieving the kind of growth across agriculture and natural resources outlined in Bold Thinking will not be possible if electricity access remains a handbrake on development. The size of this prize clearly justifies the above efforts. Stakeholders must continue to push for an immediate and focused evaluation of PNG’s electricity approach to set a course for decades to come.
ANZ INSIGHT / ISSUE 6, AUGUST 20154
2.0 MATCHING DEMAND: THE CHALLENGE FOR PNG’S ELECTRICITY SYSTEM
KEY THEMES:
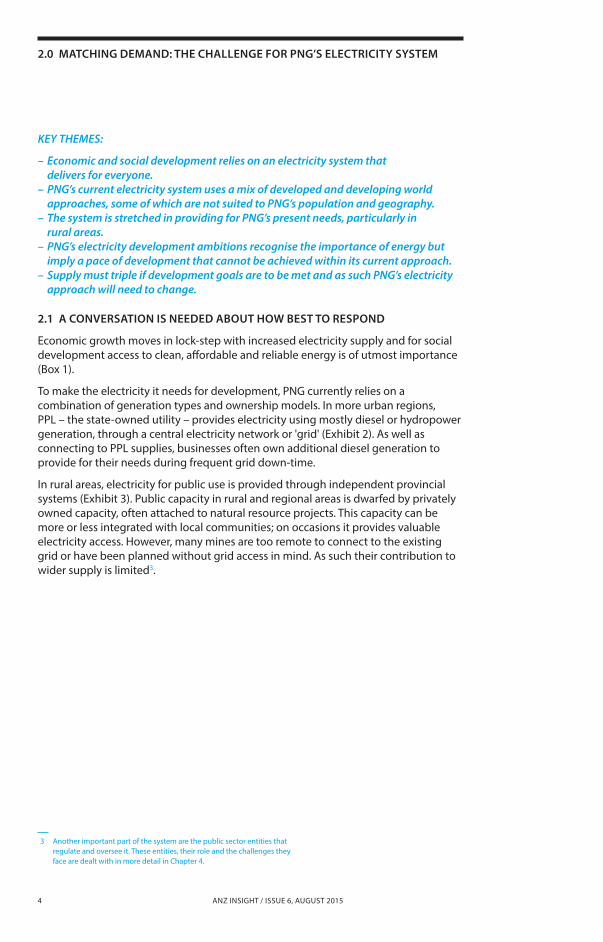
– Economic and social development relies on an electricity system that delivers for everyone. – PNG’s current electricity system uses a mix of developed and developing world approaches, some of which are not suited to PNG’s population and geography. – The system is stretched in providing for PNG’s present needs, particularly in rural areas. – PNG’s electricity development ambitions recognise the importance of energy but imply a pace of development that cannot be achieved within its current approach. – Supply must triple if development goals are to be met and as such PNG’s electricity approach will need to change.
2.1 A CONVERSATION IS NEEDED ABOUT HOW BEST TO RESPOND
Economic growth moves in lock-step with increased electricity supply and for social development access to clean, affordable and reliable energy is of utmost importance (Box 1).
To make the electricity it needs for development, PNG currently relies on a combination of generation types and ownership models. In more urban regions, PPL – the state-owned utility – provides electricity using mostly diesel or hydropower generation, through a central electricity network or 'grid' (Exhibit 2). As well as connecting to PPL supplies, businesses often own additional diesel generation to provide for their needs during frequent grid down-time.
In rural areas, electricity for public use is provided through independent provincial systems (Exhibit 3). Public capacity in rural and regional areas is dwarfed by privately owned capacity, often attached to natural resource projects. This capacity can be more or less integrated with local communities; on occasions it provides valuable electricity access. However, many mines are too remote to connect to the existing grid or have been planned without grid access in mind. As such their contribution to wider supply is limited3.
3 Another important part of the system are the public sector entities that regulate and oversee it. These entities, their role and the challenges they face are dealt with in more detail in Chapter 4.

POWERING PNG INTO THE ASIAN CENTURY 5
4 US Energy Information Agency, Energy Statistics, 2015.5 Correlation assessed using World Bank, Development Indicators, 2015.6 Soishansi, 'Energy efficiency – towards the end of demand growth', 2014;
Cleveland and Ruth, 'Indicators of dematerialisation and the materials intensity of use' 2008; World Resources Institute, The weight of nations, 2014. 7 UNDP, 'Sustainable energy for all', 2014; UN, 'Post 2015 development agenda', 2015. 8 WHO, 'Clean household energy can save people’s lives', 2014; Reiche et al., 'Expanding electricity access to remote areas', 2000; Modi et al., 'Energy services for the MDGs', 2005; ESMAP, 'Energy access', 2015. 9 World Bank, 'The role of mobile phones in sustainable rural poverty reduction', 2010; UNESO, C4D, 2011; UNESCO, 'Reading in the mobile era', 2014; Spence and Smith, 'ICT, Human development and poverty reduction', 2009.
Box 1 Electricity is critical for national development
For those in the developed world the ubiquity of electricity at times obscures its importance. Electricity production makes up 39% of total fuel consumption globally 4, although much of this is lost in transformation.
Economic growth moves in lock-step with increased electricity supply. Across developing Asia and Africa, GDP per capita is closely correlated with per capita electricity consumption (Exhibit 1)5. Energy demand is maintained as countries climb the development ladder and as development progresses they begin to prefer electricity over other forms of energy6.
Exhibit 1 ELECTRICITY CONSUMPTION AND GDP PER CAPITA AMONG SELECTED NATIONS
Electricity is also fundamental to broader social development. The UN’s Post-2015 Development Goals and the 'Sustainable Energy for All' program recognise development outcomes can only be achieved with broad access to energy and sustainable energy production7. Beyond basic access, robust growth that delivers broad social gains in health, education, safety and equity relies on ongoing improvements in the cost, reliability and cleanliness of energy8. Furthermore, the emergence of information technology has arguably made electricity even more important to initial development than in the past 9.
(MWh per annum per capita) Electricity consumption
GDP per capita (PPP 2011 int’l $’000)
GDP per capita and energy consumption per capita
0
1
2
3
4
5
6
7
8
9
10
0 10 20 30 40 50 60 70 80
Bangladesh
Botswana
Algeria
DevelopingEast Asia & Paci�c
Ethiopia Ghana
Hong KongIndia Indonesia
Kenya
Cambodia
Morocco
Malaysia Nepal Philippines Singapore Thailand
Tanzania
Vietnam
Zimbabwe
PNG
Asia & Paci�c
Africa
Source: EIA Energy Statistics Data, 2015; World Bank, Development Indicators, 2015

ANZ INSIGHT / ISSUE 6, AUGUST 20156
Exhibit 2PNG’S CURRENT ELECTRICITY INFRASTRUCTURE
Exhibit 3ELECTRICITY GENERATION CAPACITY AND SOURCE MW, 2014 – 2015 period100% = 738 MW 1
Electricity Generation Capacity and Source
18%
18%
17%17% 7%
2%
9%
6%
6%
11%
Provincial systems Port Moresby
Private industrial
Ramu
Grid systems O�-grid systems
Energy source
Source: PPL, 2014-2028 Strategic plan, 2014; ADB, Sector Assessment Power, 2015; PJPL analysis
1 PPL’s derated nameplate site capacities stem from PPL’s Fifteen Year Power Development Plan, as of March 2014 (including Ramu 1 TOD Yonki installation). Private industrial as well as IPPs have been gathered through research on current 2015 capacity of each mine or IPP to give the best overview of current installed capacity
Energy origin
10%
0%0% 10% 20% 30% 40% 50% 60% 70% 80% 90% 100%
20%
30%
40%
50%
60%
70%
80%
90%
Diesel = 40% Hydro = 37%Gas = 16%
Geothermal = 7%
100%
PNG’s Current Electricity Infrastructure
Source: PPL, 2014-2028 Strategic plan, 2014; PJPL analysis
Substation
1 The Gazelle system is considered a grid, but is small and geographically constrained enough to be considered a distribution network in this report
Diesel
Hydro
Gas
Geothermal
PPL provincial power station or C-Centres
Owner-operated power stations
Unknown
Power station type
Colour coding
Substation
Papua NewGuinea
Source: PPL, 2014-2028 Strategic plan, 2014; PJPL analysis
1 The Gazelle system is considered a grid, but is small and geographically constrained enough to be considered a distribution network in this report
Diesel
Hydro
Gas
Geothermal
Unknown
Colour coding
Substation
New Britain
Bismarck Sea
Port Moresby
KokodaLosuia
LatangaiIsland
BougainvilleIsland
Ramu Grid
Port Moresby Grid
Lae
Mt. Hagen
Kundiawa
GorokaMendi
Wewak
Momote
Kokopo
Kaewieng
1 The Gazelle system is considered a grid but is small and geographically constrained enough to be considered a distribution network in this reportSource: PPL, 2014–2028 Strategic Plan, 2014; Port Jackson Partners Limited (PJPL) analysis
1 PPL’s derated nameplate site capacities stem from PPL’s Fifteen Year Power Development Plan, as of March 2014 (including Ramu 1 TOD Yonki installation). Private industrial capacity as well as IPPs have been gathered through research on current 2015 capacity of each mine or IPP to give the best overview of current installed capacitySource: PPL, 2014–2028 Strategic Plan, 2014; ADB, Sector Assessment Power, 2015; PJPL analysis
POWERING PNG INTO THE ASIAN CENTURY 7
2.2 ELECTRICITY PERFORMANCE IS POOR, ESPECIALLY IN RURAL AREAS
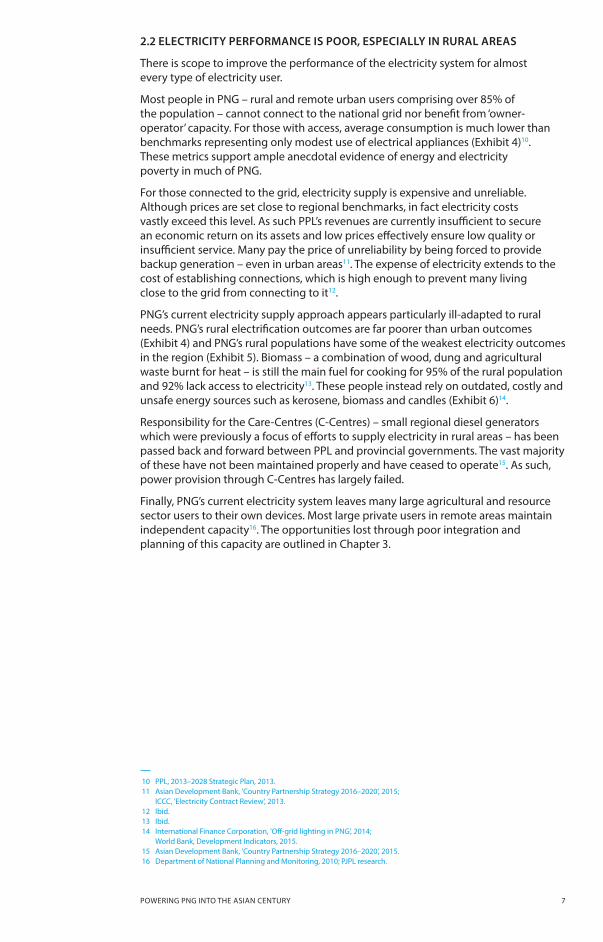
There is scope to improve the performance of the electricity system for almost every type of electricity user.
Most people in PNG – rural and remote urban users comprising over 85% of the population – cannot connect to the national grid nor benefit from ‘owner-operator’ capacity. For those with access, average consumption is much lower than benchmarks representing only modest use of electrical appliances (Exhibit 4)10. These metrics support ample anecdotal evidence of energy and electricity poverty in much of PNG.
For those connected to the grid, electricity supply is expensive and unreliable. Although prices are set close to regional benchmarks, in fact electricity costs vastly exceed this level. As such PPL’s revenues are currently insufficient to secure an economic return on its assets and low prices effectively ensure low quality or insufficient service. Many pay the price of unreliability by being forced to provide backup generation – even in urban areas11. The expense of electricity extends to the cost of establishing connections, which is high enough to prevent many living close to the grid from connecting to it12.
PNG’s current electricity supply approach appears particularly ill-adapted to rural needs. PNG’s rural electrification outcomes are far poorer than urban outcomes (Exhibit 4) and PNG’s rural populations have some of the weakest electricity outcomes in the region (Exhibit 5). Biomass – a combination of wood, dung and agricultural waste burnt for heat – is still the main fuel for cooking for 95% of the rural population and 92% lack access to electricity13. These people instead rely on outdated, costly and unsafe energy sources such as kerosene, biomass and candles (Exhibit 6)14.
Responsibility for the Care-Centres (C-Centres) – small regional diesel generators which were previously a focus of efforts to supply electricity in rural areas – has been passed back and forward between PPL and provincial governments. The vast majority of these have not been maintained properly and have ceased to operate15. As such, power provision through C-Centres has largely failed.
Finally, PNG’s current electricity system leaves many large agricultural and resource sector users to their own devices. Most large private users in remote areas maintain independent capacity16. The opportunities lost through poor integration and planning of this capacity are outlined in Chapter 3.
10 PPL, 2013–2028 Strategic Plan, 2013.11 Asian Development Bank, 'Country Partnership Strategy 2016–2020', 2015; ICCC, 'Electricity Contract Review', 2013.12 Ibid. 13 Ibid. 14 International Finance Corporation, 'Off-grid lighting in PNG', 2014; World Bank, Development Indicators, 2015. 15 Asian Development Bank, 'Country Partnership Strategy 2016–2020', 2015.16 Department of National Planning and Monitoring, 2010; PJPL research.

ANZ INSIGHT / ISSUE 6, AUGUST 20158
Exhibit 4COMPARISON OF URBAN AND RURAL ELECTRICITY USE IN PNG – 2013
Exhibit 5 ELECTRICITY OUTCOMES BY COUNTRY
Overall electricity performance in PNG is among the poorest in the region17. Although PNG’s GDP per capita is at present similar to Cambodia, for example, electricity access is around half Cambodian levels, with only 15% of the population of PNG currently having electricity access compared with 31% in Cambodia (Exhibit 5). In addition, electricity investment is slow18 with electricity access in PNG growing by only 6.4 percentage points between 1990 and 201019.
Comparison of Urban and Rural Power Indicators in PNG - 2013
47
2 8
Urban Rural Total population
74
23
51
Urban Rural Total population
63%
8% 15%
Urban Rural Total population
44
12
57
Urban Rural Total population
1.0
6.4 7.3
Urban Rural Total population
KWh/annum
Access to electricity (2010)
Total supply
Electricity use per person with access
Use per capita
Population
Percentage of population
KWh/annum
Millions
MWh/annum
Eletricity Outcomes by Country
Country
GDP per capita (2012, thousands, constant 2011 international $) Electricity access
Urban access
Rural access
Consumption per capita (kWh)
Population served (m)
Hong Kong SAR, China 100.0% 100.0% 5,675 7.2
Thailand 100.0% 97.0% 2,326 66.8
China 100.0% 98.0% 3,292 1,353.3
Malaysia 99.8% 98.0% 3,989 29.5
Vietnam 98.5% 94.9% 1,207 86.1
Indonesia 98.9% 89.4% 670 235.2
Korea, Rep. 93.9% 90.5% 9,605 46.9
Philippines 94.4% 72.8% 623 82.0
Singapore 72.6% 64.3% 8,150 3.9
Lao PDR 94.3% 52.0% 425 4.5
Myanmar 92.0% 28.4% 146 26.0
Cambodia 91.3% 18.8% 198 4.7
Korea, Dem. Rep. 36.6% 10.0% 631 6.5
Papua New Guinea 63.3% 7.6% 426 1.1
50
14
11
22
5
9
32
6
75
4
4
3
2
2
100%
100%
100%
99%
96%
94%
93%
83%
73%
66%
49%
31%
26%
15%
1
1
17 International Development Agency, Energy Development Indicators, 2015.18 PPL, 2013–2028 Strategic Plan, 2013.19 World Bank, Development Indicators, 2015.
Source: World Bank, Development Indicators, 2015; US Energy Information Agency, Energy Statistics, 2015; PPL, 2014–2028 Power Plan, 2014
1 GDP per capita in 2013 US$ from CIA, The World FactbookSource: US Energy Information Agency, Energy Statistics, 2015; World Bank, Development Indicators, 2015; CIA, The World Factbook, 2015

POWERING PNG INTO THE ASIAN CENTURY 9
2.3 TRIPLING DEMAND WILL BE AN ENORMOUS STRAIN ON THE EXISTING POWER MODEL
PNG’s own economic and social ambitions imply significant electricity supply targets.
In rural areas, for reasons described above, PNG plans to vastly improve electricity access. PNG’s new energy policy is still being drafted but national development plans aim to have national access to electricity at 70% in 203020. This goal can only partly be achieved by improving urban access, with 87% of the population in rural areas21. Adjusting for urbanisation, rural electricity access will need to rise from 7.6% to around 65%; even if 100% access is achieved in non-rural areas, rural electricity access will need to rise from 7.6% to around 65% . In other words, 65%22 rural electrification is the minimum needed to achieve PNG’s overall goal.
In addition, PNG’s electricity ambitions must anticipate achieving substantial economic growth targets in all sectors. Government plans target GDP growth of 8.4% per annum to 203023. Inflation in PNG has been highly variable but has moderated in recent years24. Assuming an inflation rate slightly lower than the 2010 to 2015 average – which has been buoyed by heavy LNG investment – real GDP growth is likely to be around 5% per annum, with much of that growth set to come from resources and agriculture.
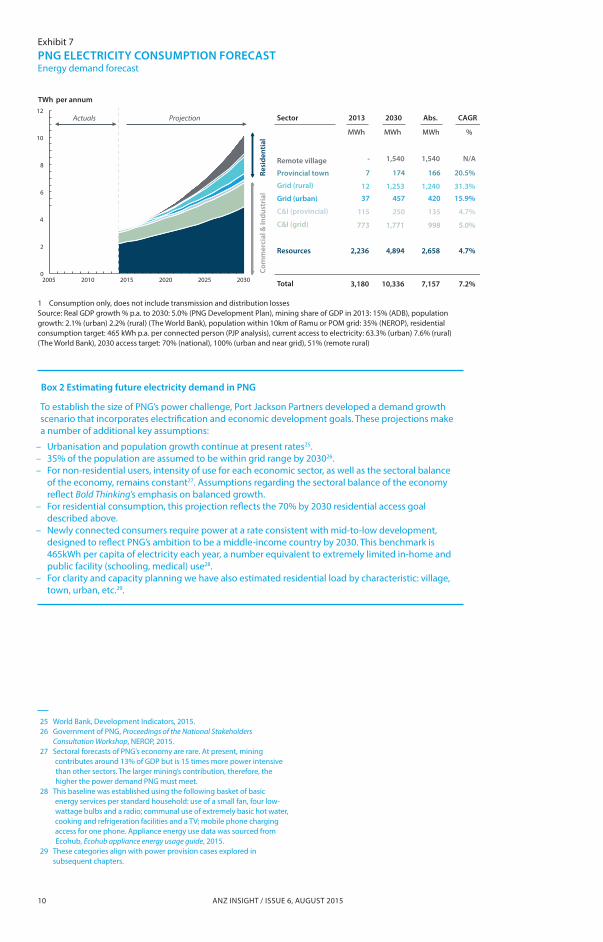
Meeting these targets will require a 225% absolute increase in electricity supply to 2030 for a combined annual growth rate (CAGR) of 7.2% (Exhibit 7). Demand would increase from 3.2GWh per annum in 2013 to 10.3GWh per annum in 2030. This estimate assumes that both electricity access and economic goals are met. Alternative scenarios across a range of economic and social achievement outcomes (Box 3) also pose challenging targets.
20 Government of PNG, Papua New Guinea Development Strategic Plan, 2010–2030, 2010.21 World Bank, World Development Indicators, 2015.22 PJPL analysis. 23 Average annual GDP growth rate 2010–2030: 8.4% nominal, assumed 5.0% real:
Papua New Guinea Development Strategic Plan, 2010–2030, p.13.24 Asian Development Bank, 'PNG overview', 2015.
Use of Lighting Power Sources in PNG by Region
Source: International Finance Corporation, O�-grid Lighting in PNG, 2014
Per cent of total power use in 2012
3%
28%
42%
57%
1%
5%
2%
11%
5%
4%
23%
21%
85%
58%
6% 5%
33%
10%
100% 100% 100% 100%
Urban - Grid Connected Semi-urban - Underserved O�-Grid - Non Remote O�-Grid - Remote
Kerosene
Candles
Flash Light
Electrical/Grid Appliances
Generator
Exhibit 6 USE OF LIGHTING POWER SOURCES IN PNG BY REGION Per cent of total power use for lighting in 2012
Source: International Finance Corporation, 'Off-grid lighting in PNG', 2014
ANZ INSIGHT / ISSUE 6, AUGUST 201510
Exhibit 7 PNG ELECTRICITY CONSUMPTION FORECASTEnergy demand forecast
0
2
4
6
8
10
12
2005 2010 2015 2020 2025 2030
PNG Electricity Consumption Forecast
TWh per annum
Resources
C&I (grid)
C&I (provincial)
Grid (urban)
Grid (rural)
Provincial town
Remote village
Sector
Total
2013 2030 CAGR Actuals Projection
Resi
dent
ial
Com
mer
cial
& In
dust
rial
Abs.
MWh MWh MWh %
1
- 1,540 1,540 N/A
7 174 166 20.5%
12 1,253 1,240 31.3%
37 457 420 15.9%
115 250 135 4.7%
773 1,771 998 5.0%
2,236 4,894 2,658 4.7%
3,180 10,336 7,157 7.2%
Box 2 Estimating future electricity demand in PNG
To establish the size of PNG’s power challenge, Port Jackson Partners developed a demand growth scenario that incorporates electrification and economic development goals. These projections make a number of additional key assumptions:
– Urbanisation and population growth continue at present rates25.– 35% of the population are assumed to be within grid range by 203026.– For non-residential users, intensity of use for each economic sector, as well as the sectoral balance of the economy, remains constant27. Assumptions regarding the sectoral balance of the economy reflect Bold Thinking’s emphasis on balanced growth. – For residential consumption, this projection reflects the 70% by 2030 residential access goal described above.– Newly connected consumers require power at a rate consistent with mid-to-low development, designed to reflect PNG’s ambition to be a middle-income country by 2030. This benchmark is 465kWh per capita of electricity each year, a number equivalent to extremely limited in-home and public facility (schooling, medical) use28.– For clarity and capacity planning we have also estimated residential load by characteristic: village, town, urban, etc.29.
25 World Bank, Development Indicators, 2015.26 Government of PNG, Proceedings of the National Stakeholders
Consultation Workshop, NEROP, 2015. 27 Sectoral forecasts of PNG’s economy are rare. At present, mining
contributes around 13% of GDP but is 15 times more power intensive than other sectors. The larger mining’s contribution, therefore, the higher the power demand PNG must meet.
28 This baseline was established using the following basket of basic energy services per standard household: use of a small fan, four low-wattage bulbs and a radio; communal use of extremely basic hot water, cooking and refrigeration facilities and a Tv; mobile phone charging access for one phone. Appliance energy use data was sourced from Ecohub, Ecohub appliance energy usage guide, 2015.
29 These categories align with power provision cases explored in subsequent chapters.
1 Consumption only, does not include transmission and distribution lossesSource: Real GDP growth % p.a. to 2030: 5.0% (PNG Development Plan), mining share of GDP in 2013: 15% (ADB), population growth: 2.1% (urban) 2.2% (rural) (The World Bank), population within 10km of Ramu or POM grid: 35% (NEROP), residential consumption target: 465 kWh p.a. per connected person (PJP analysis), current access to electricity: 63.3% (urban) 7.6% (rural) (The World Bank), 2030 access target: 70% (national), 100% (urban and near grid), 51% (remote rural)
POWERING PNG INTO THE ASIAN CENTURY 11
30 The extent to which grid extensions will be able to serve rural and regional customers is discussed in Chapter 3.31 US Energy Information Agency, Energy Statistics, 2015; PPL, 2013–2028
Strategic Plan, 2013.32 Ibid.33 PPL, 2013–2028 Strategic Plan, 2013.34 Greenpeace, 'PNG not ready for REDD', 2010.35 PJPL analysis based on PNG’s commitments under the Copenhagen
Accord and World Bank data.
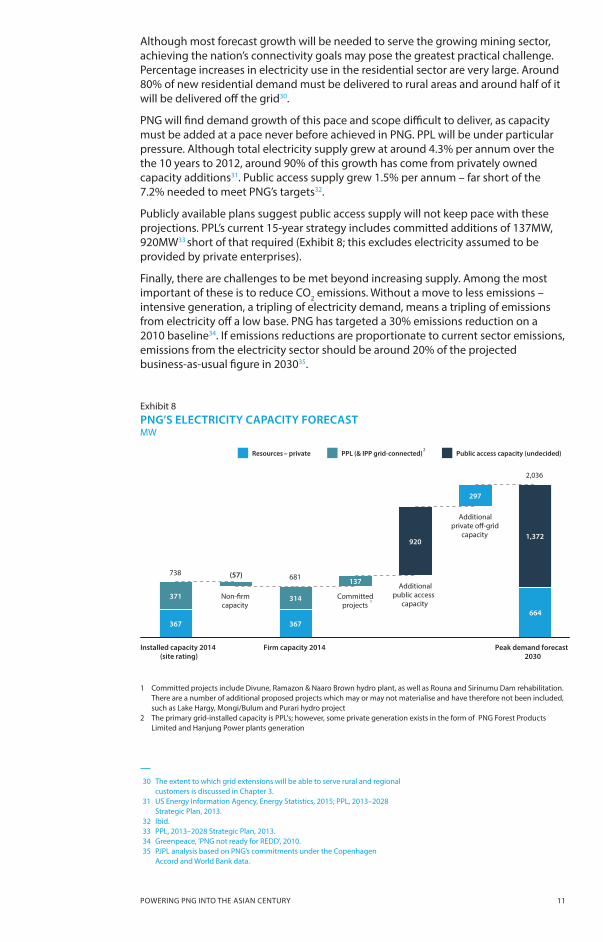
Although most forecast growth will be needed to serve the growing mining sector, achieving the nation’s connectivity goals may pose the greatest practical challenge. Percentage increases in electricity use in the residential sector are very large. Around 80% of new residential demand must be delivered to rural areas and around half of it will be delivered off the grid30.
PNG will find demand growth of this pace and scope difficult to deliver, as capacity must be added at a pace never before achieved in PNG. PPL will be under particular pressure. Although total electricity supply grew at around 4.3% per annum over the the 10 years to 2012, around 90% of this growth has come from privately owned capacity additions31. Public access supply grew 1.5% per annum – far short of the 7.2% needed to meet PNG’s targets32.
Publicly available plans suggest public access supply will not keep pace with these projections. PPL’s current 15-year strategy includes committed additions of 137MW, 920MW33 short of that required (Exhibit 8; this excludes electricity assumed to be provided by private enterprises).
Finally, there are challenges to be met beyond increasing supply. Among the most important of these is to reduce CO2 emissions. Without a move to less emissions – intensive generation, a tripling of electricity demand, means a tripling of emissions from electricity off a low base. PNG has targeted a 30% emissions reduction on a 2010 baseline34. If emissions reductions are proportionate to current sector emissions, emissions from the electricity sector should be around 20% of the projected business-as-usual figure in 203035.
Exhibit 8PNG’S ELECTRICITY CAPACITY FORECAST MW
PNG’S Electricity Capacity Forecast
Installed capacity 2014 (site rating)
Non-�rm capacity
Firm capacity 2014
Committed projects
Additional public access
capacity
Additional private o�-grid
capacity
Peak demand forecast 2030
367 367
297
664
371 314
137
920 1,372
(57) 738 681
2,036
1
PPL (& IPP grid-connected) Resources – private Public access capacity (undecided) 2
1 Committed projects include Divune, Ramazon & Naaro Brown hydro plant, as well as Rouna and Sirinumu Dam rehabilitation. There are a number of additional proposed projects which may or may not materialise and have therefore not been included, such as Lake Hargy, Mongi/Bulum and Purari hydro project2 The primary grid-installed capacity is PPL's; however, some private generation exists in the form of PNG Forest Products Limited and Hanjung Power plants generation

ANZ INSIGHT / ISSUE 6, AUGUST 201512
Box 3 Demand sensitivity of different growth scenarios
What would be the impact on demand if GDP growth and public access targets are not met or if economic growth comes from different sectors? Alternative scenarios, linked to different levels of GDP growth and resource sector development, are used here to broadly explore these impacts (Exhibit 9). Of three scenarios, the first scenario is the expected scenario used in this report – one in which public access and GDP growth goals are met and the resource sector maintains its current economic significance (~14% of GDP). The second scenario mimics an agricultural or commercial boom in PNG: social access and GDP targets are met and growth comes mainly from non-resource sectors36. A third scenario simulates a state in which central institutional development struggles, leading to poorer growth and access rate outcomes and a reliance on resource-based activity for economic growth37.
Demand is most sensitive to changes in resource sector activity as a consequence of the energy intensity of mining, which is currently an order of magnitude more energy intensive per unit GDP than other activity. In contrast, an agricultural or commercial boom will not significantly alter public demand, as these activities are relatively efficient. However, although activity in the resource sector is highly significant for electricity use, it will likely be met by private capacity and as such is of lesser concern for public access providers. An overview of cost differences across scenarios can be found in Chapter 3.
Exhibit 9ELECTRICITY UNDER DIFFERENT SCENARIOS
TWh, % share of demand
Demand in Di�erent Scenarios
0
2
4
6
8
10
12
2013 2030
TWh, % share of demand
Demand by scenario* Scenario Public
Resources – private
Expected
Agricultural boom
Institutional failure
5.4 4.9
53% 47%
* Scenarios are intended to be purely illustrative
Source: PJPL Analysis
Base
Agricultural boom
Institutional failure
5.6 2.2
72% 28%
3.1 5.5
36% 64%
1
2
3
36 Scenario 2 assumes 5% GDP growth per annum, 70% electrification and 6% resource share of GDP.
37 Scenario 3 assumes 2% GDP growth per annum, 40% electrification and 27% resource share of GDP.
* Scenarios are intended to be purely illustrativeSource: PJPL analysis
POWERING PNG INTO THE ASIAN CENTURY 13
KEY THEMES:
– Extending grid boundaries makes sense in fewer cases than commonly assumed. – Plant size is a critical consideration for on-grid capacity additions. – Emerging technologies provide cost-efficient and versatile solutions for remote loads. – Better integration of resource developments can support nationwide development. – Switching from diesel – currently the default – to the cheapest alternatives will save money and reduce emissions.
If the current system is unlikely to meet PNG’s electricity needs, what is needed to enhance it?
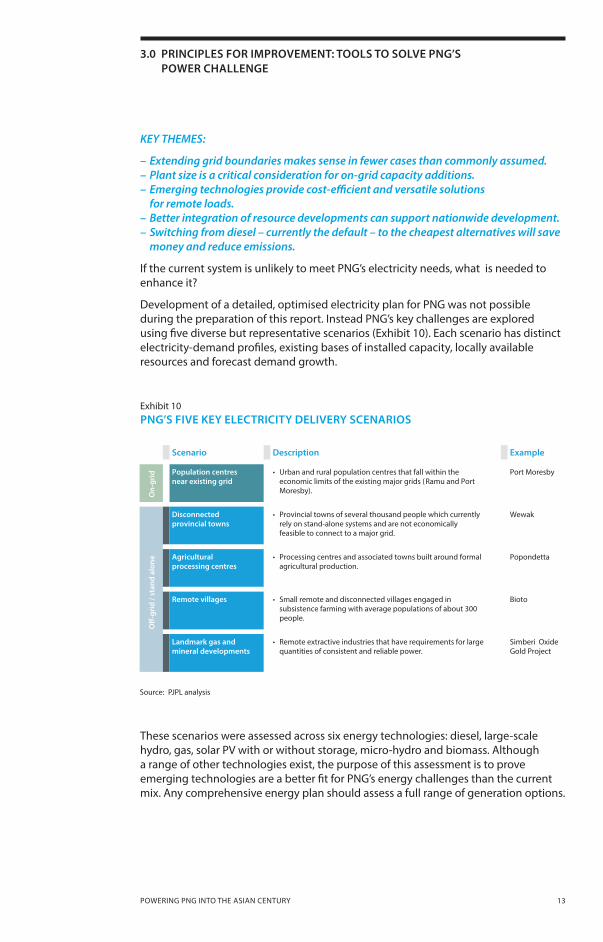
Development of a detailed, optimised electricity plan for PNG was not possible during the preparation of this report. Instead PNG’s key challenges are explored using five diverse but representative scenarios (Exhibit 10). Each scenario has distinct electricity-demand profiles, existing bases of installed capacity, locally available resources and forecast demand growth.
Exhibit 10 PNG’S FIVE KEY ELECTRICITY DELIVERY SCENARIOS
These scenarios were assessed across six energy technologies: diesel, large-scale hydro, gas, solar Pv with or without storage, micro-hydro and biomass. Although a range of other technologies exist, the purpose of this assessment is to prove emerging technologies are a better fit for PNG’s energy challenges than the current mix. Any comprehensive energy plan should assess a full range of generation options.
3.0 PRINCIPLES FOR IMPROVEMENT: TOOLS TO SOLVE PNG’S POWER CHALLENGE
PNG's Five Key Electricity Delivery Scenarios
Scenario Description Example
On-
grid
Population centres near existing grid
• Urban and rural population centres that fall within the economic limits of the existing major grids (Ramu and Port Moresby).
Port Moresby
O�
-gri
d / s
tand
alo
ne
Disconnected provincial towns
• Provincial towns of several thousand people which currently rely on stand-alone systems and are not economically feasible to connect to a major grid.
Wewak
Agricultural processing centres
• Processing centres and associated towns built around formal agricultural production.
Popondetta
Remote villages • Small remote and disconnected villages engaged in subsistence farming with average populations of about 300 people.
Bioto
Landmark gas and mineral developments
• Remote extractive industries that have requirements for large quantities of consistent and reliable power.
Simberi Oxide Gold Project
Source: PJPL analysis Source: PJPL analysis
ANZ INSIGHT / ISSUE 6, AUGUST 201514
Analysing electricity supply options for each scenario reveals a set of broader principles which can help guide PNG’s power sector through the challenges ahead. These are:
1. PNG should move beyond an assumption ‘the grid is the answer’.
2. For on-grid generation, utilisation effects can upset traditional solutions.
3. New technologies are an ideal match for off-grid needs.
4. Better integration of landmark resource and agricultural developments can support nationwide network development.
3.1 MOVE BEYOND THE ASSUMPTION THE GRID IS THE ANSWER
As new stand-alone generation alternatives become available and more efficient, the case for extending PNG’s power grid weakens.
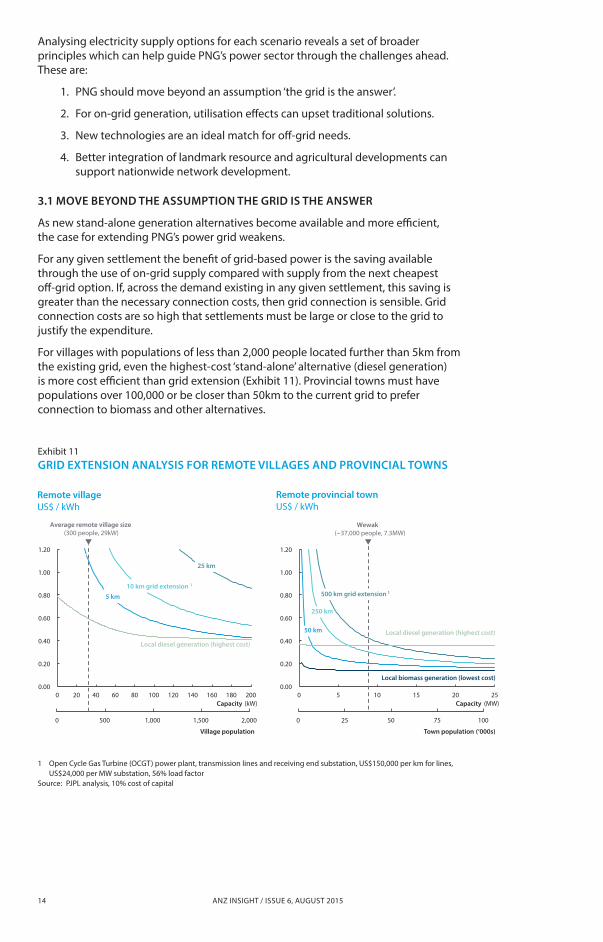
For any given settlement the benefit of grid-based power is the saving available through the use of on-grid supply compared with supply from the next cheapest off-grid option. If, across the demand existing in any given settlement, this saving is greater than the necessary connection costs, then grid connection is sensible. Grid connection costs are so high that settlements must be large or close to the grid to justify the expenditure.
For villages with populations of less than 2,000 people located further than 5km from the existing grid, even the highest-cost ‘stand-alone’ alternative (diesel generation) is more cost efficient than grid extension (Exhibit 11). Provincial towns must have populations over 100,000 or be closer than 50km to the current grid to prefer connection to biomass and other alternatives.
Exhibit 11 GRID EXTENSION ANALYSIS FOR REMOTE VILLAGES AND PROVINCIAL TOWNS
Grid Extension Analysis For Remote Villages And Provincial Towns
Source: PJPL analysis, 10% cost of capital
1 OCGT power plant, transmission lines and receiving end substation, US$150,000 per km for lines, US$24,000 per MW substation, 56% load factor
US$ / kWh Remote village
0.00
0.20
0.40
0.60
0.80
1.00
1.20
0 20 40 60 80 100 120 140 160 180 200
2,000 0 500 1,000 1,500
Village population
Capacity (kW)
5 km 10 km grid extension 1
25 km
Local diesel generation (highest cost)
0.00
0.20
0.40
0.60
0.80
1.00
1.20
0 5 10 15 20 25
100 0 25 50 75
Town population (‘000s)
Capacity (MW)
50 km
250 km
Local diesel generation (highest cost)
US$ / kWh Remote provincial town
Average remote village size (300 people, 29kW)
Local biomass generation (lowest cost)
Wewak (~37,000 people, 7.3MW)
500 km grid extension 1
1 Open Cycle Gas Turbine (OCGT) power plant, transmission lines and receiving end substation, US$150,000 per km for lines, US$24,000 per MW substation, 56% load factor
Source: PJPL analysis, 10% cost of capital
Remote village US$ / kWh
Remote provincial town US$ / kWh
POWERING PNG INTO THE ASIAN CENTURY 15
38 US$150,000 per km, Government of PNG, Proceedings of the National Stakeholders Consultation Workshop, NEROP, p. 29, 2015.39 Solar has not been used as part of this analysis. Since it depends on
sunlight to generate power, it is difficult to meaningfully compare the capacity of often variable solar power plants with those that can generate power continuously.
Linking multiple population centres can make grid extensions more economic. Equally, however, future grid extensions may be in areas less suitable for grid construction, increasing connection costs. Many larger loads are already connected to the grid and the provincial towns that remain disconnected can be hundreds of kilometres from the nearest access point, through dense vegetation, mountains or across bodies of water. Extending grid costs above current estimates, based on prior experience, quickly reduces economic connection distances38.
In coming years, a large portion of PNG’s population may be best served by remaining off-grid.
3.2 IN ON-GRID SETTINGS UTILISATION CAN TRUMP SCALE, UPSETTING TRADITIONAL SOLUTIONS
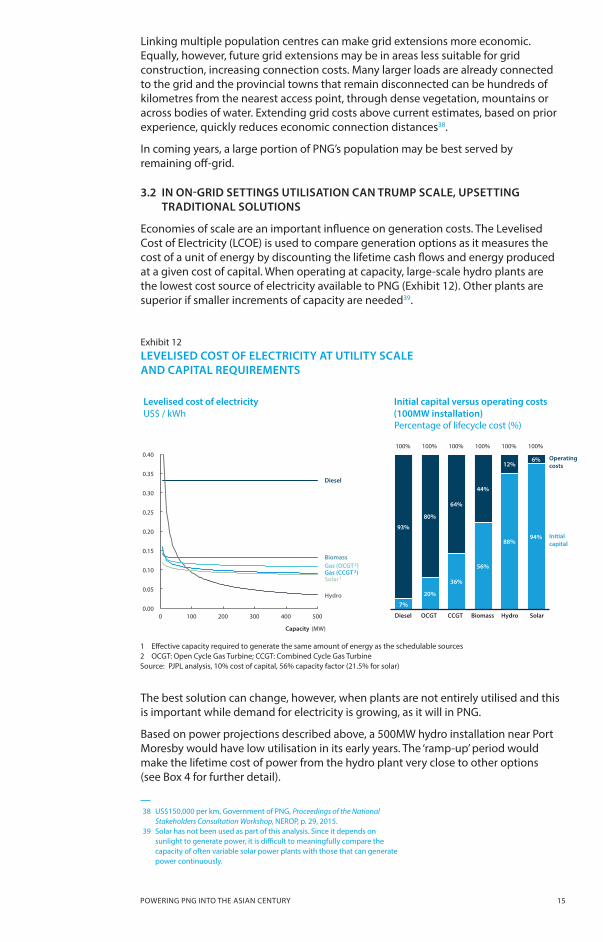
Economies of scale are an important influence on generation costs. The Levelised Cost of Electricity (LCOE) is used to compare generation options as it measures the cost of a unit of energy by discounting the lifetime cash flows and energy produced at a given cost of capital. When operating at capacity, large-scale hydro plants are the lowest cost source of electricity available to PNG (Exhibit 12). Other plants are superior if smaller increments of capacity are needed39.
Exhibit 12 LEVELISED COST OF ELECTRICITY AT UTILITY SCALE AND CAPITAL REQUIREMENTS
Levelised Cost of Utility Scale Versus Capacity in PNG
Levelised cost of electricity Initial capital versus operating costs (100 MW installation)
7%
20%
36%
56%
88% 94%
93%
80%
64%
44%
12% 6%
100% 100% 100% 100% 100% 100%
Diesel OCGT CCGT Biomass Hydro Solar 0.00
0.05
0.10
0.15
0.20
0.25
0.30
0.35
0.40
0 100 200 300 400 500
Capacity (MW)
Percentage of lifecycle cost (%)
Initial capital
Operating costs
Diesel
Hydro
Gas (OCGT 2) Gas (CCGT 2) Solar 1
Biomass
The best solution can change, however, when plants are not entirely utilised and this is important while demand for electricity is growing, as it will in PNG.
Based on power projections described above, a 500MW hydro installation near Port Moresby would have low utilisation in its early years. The ‘ramp-up’ period would make the lifetime cost of power from the hydro plant very close to other options (see Box 4 for further detail).
1 Effective capacity required to generate the same amount of energy as the schedulable sources 2 OCGT: Open Cycle Gas Turbine; CCGT: Combined Cycle Gas TurbineSource: PJPL analysis, 10% cost of capital, 56% capacity factor (21.5% for solar)
Levelised cost of electricity US$ / kWh
Percentage of lifecycle cost (%)
Initial capital versus operating costs (100MW installation)

ANZ INSIGHT / ISSUE 6, AUGUST 201516
When cost advantages are small, a number of other important factors guiding generation choice must be considered and may, when combined, favour smaller incremental additions over larger hydro plants. These include:
– Energy security: building one large plant puts energy supply security in one basket. Unscheduled maintenance and other failures will force significant electricity outages in the supply area.
– Project risk: large infrastructure projects can come with significant delivery risk.
– Financing constraints: the initial capital requirements of a large hydro plant present a significant financing challenge, one which may potentially tie PNG to demands of foreign investors.
– Environmental impact: the emissions intensity of hydro projects flooded without prior logging are unknown but may be similar to diesel generation40.
– Demand risk: large-scale capacity additions carry the risk that demand will not eventuate to the levels forecast or will take significantly longer than anticipated and therefore further damage the economics of the project.
In addition, there are likely to be different options if new capacity is to add to overall system capacity or replace existing generators. Replacement capacity may be able to operate at full capacity straight away; new capacity is unlikely to do so.
Careful consideration of all available alternatives and their intended utilisation profiles should be undertaken before seeking and committing to new generation projects. Simplistic cost analysis that doesn’t sufficiently accommodate other practical challenges invites decisions that are both incorrect and irreversible.
40 World Commission on Dams, Report, 2000.
POWERING PNG INTO THE ASIAN CENTURY 17
Box 4 Scale and utilisation in on-grid planning
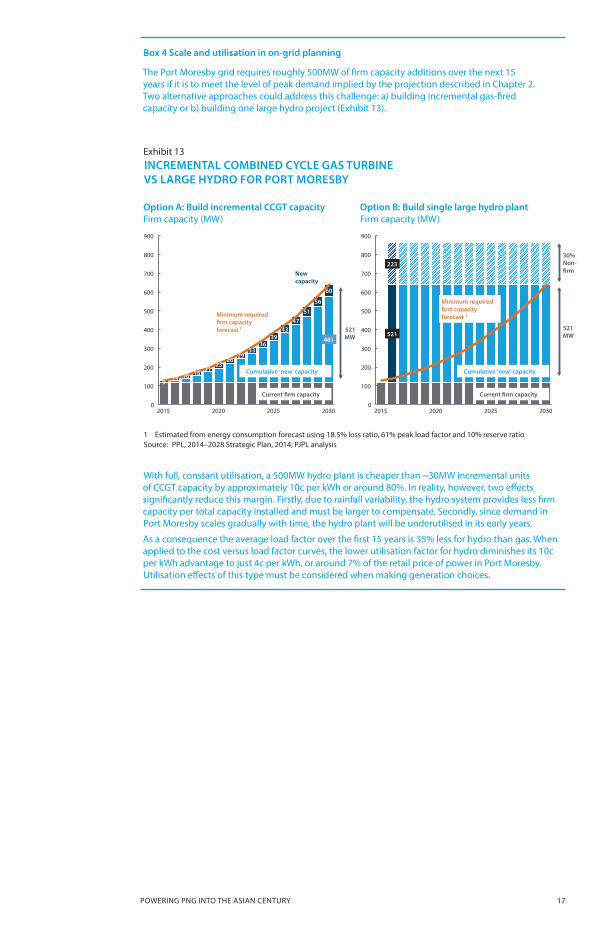
The Port Moresby grid requires roughly 500MW of firm capacity additions over the next 15 years if it is to meet the level of peak demand implied by the projection described in Chapter 2. Two alternative approaches could address this challenge: a) building incremental gas-fired capacity or b) building one large hydro project (Exhibit 13).
Exhibit 13 INCREMENTAL COMBINED CYCLE GAS TURBINE VS LARGE HYDRO FOR PORT MORESBY
With full, constant utilisation, a 500MW hydro plant is cheaper than ~30MW incremental units of CCGT capacity by approximately 10c per kWh or around 80%. In reality, however, two effects significantly reduce this margin. Firstly, due to rainfall variability, the hydro system provides less firm capacity per total capacity installed and must be larger to compensate. Secondly, since demand in Port Moresby scales gradually with time, the hydro plant will be underutilised in its early years.
As a consequence the average load factor over the first 15 years is 35% less for hydro than gas. When applied to the cost versus load factor curves, the lower utilisation factor for hydro diminishes its 10c per kWh advantage to just 4c per kWh, or around 7% of the retail price of power in Port Moresby. Utilisation effects of this type must be considered when making generation choices.
US$ / kWh Incremental CCGT Versus Large Hydro for Port Moresby
Firm capacity (MW) Option A: Build incremental CCGT capacity
Firm capacity (MW) Option B: Build single large hydro plant
461
9 13 16 18 21
23 26
29 33
36 39
43 47
51
56
60
0
100
200
300
400
500
600
700
800
900
2015 2020 2025 2030
Current �rm capacity
Cumulative ‘new’ capacity
New capacity
521 MW 521
223
0
100
200
300
400
500
600
700
800
900
2015 2020 2025 2030
Minimum required �rm capacity forecast 1
Current �rm capacity
Cumulative ‘new’ capacity
521 MW
Minimum required �rm capacity forecast 1
30% Non- �rm
Source: PPL, 2014-2028 Strategic plan, 2014; PJPL analysis
1 Estimated from energy consumption forecast using 18.5% loss ratio, 61% peak load factor and 10% reserve ratio 1 Estimated from energy consumption forecast using 18.5% loss ratio, 61% peak load factor and 10% reserve ratioSource: PPL, 2014–2028 Strategic Plan, 2014; PJPL analysis
Option A: Build incremental CCGT capacity Firm capacity (MW)
Option B: Build single large hydro plant Firm capacity (MW)
ANZ INSIGHT / ISSUE 6, AUGUST 201518
3.3 NEW TECHNOLOGIES ARE A SUPERB MATCH FOR OFF-GRID NEEDS
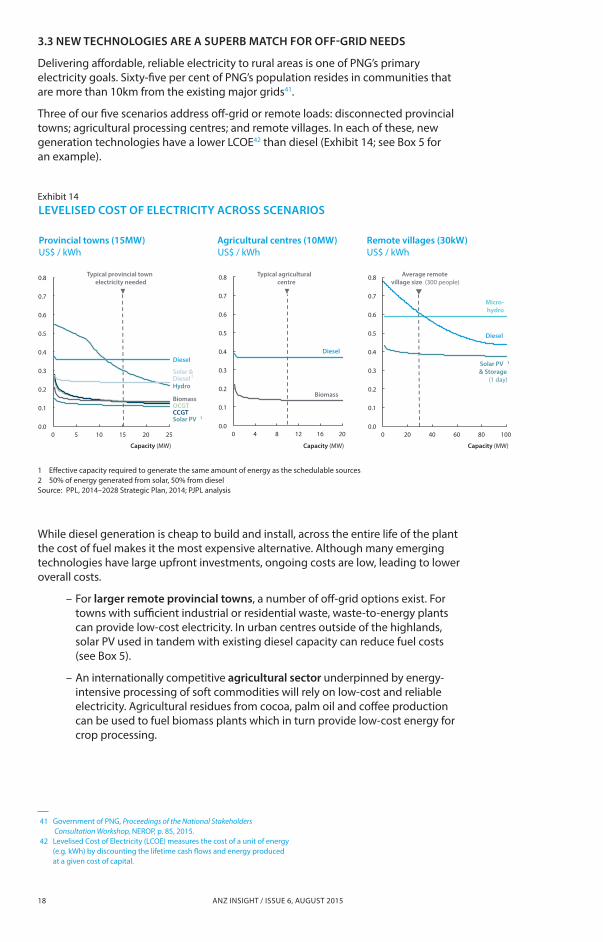
Delivering affordable, reliable electricity to rural areas is one of PNG’s primary electricity goals. Sixty-five per cent of PNG’s population resides in communities that are more than 10km from the existing major grids41.
Three of our five scenarios address off-grid or remote loads: disconnected provincial towns; agricultural processing centres; and remote villages. In each of these, new generation technologies have a lower LCOE42 than diesel (Exhibit 14; see Box 5 for an example).
41 Government of PNG, Proceedings of the National Stakeholders Consultation Workshop, NEROP, p. 85, 2015.
42 Levelised Cost of Electricity (LCOE) measures the cost of a unit of energy (e.g. kWh) by discounting the lifetime cash flows and energy produced at a given cost of capital.
Exhibit 14 LEVELISED COST OF ELECTRICITY ACROSS SCENARIOS
Levelised Cost Of Electricity (LCOE) Across Scenarios
US$ / kWh
0.0
0.1
0.2
0.3
0.4
0.5
0.6
0.7
0.8
0 20 40 60 80 100
Provincial towns (15MW) Agricultural centres (10MW) Remote villages (30kW)
Diesel
Micro- hydro
Solar PV 1 & Storage
(1 day)
Average remote village size (300 people)
US$ / kWh
0.0
0.1
0.2
0.3
0.4
0.5
0.6
0.7
0.8
0 4 8 12 16 20
Diesel
Biomass
0.0
0.1
0.2
0.3
0.4
0.5
0.6
0.7
0.8
0 5 10 15 20 25
Capacity (MW) Capacity (MW) Capacity (MW)
Diesel
Hydro
OCGT CCGT Solar PV 1
Biomass
Solar & Diesel
Typical provincial town electricity needed
US$ / kWh
Typical agricultural centre
2
While diesel generation is cheap to build and install, across the entire life of the plant the cost of fuel makes it the most expensive alternative. Although many emerging technologies have large upfront investments, ongoing costs are low, leading to lower overall costs.
– For larger remote provincial towns, a number of off-grid options exist. For towns with sufficient industrial or residential waste, waste-to-energy plants can provide low-cost electricity. In urban centres outside of the highlands, solar Pv used in tandem with existing diesel capacity can reduce fuel costs (see Box 5).
– An internationally competitive agricultural sector underpinned by energy-intensive processing of soft commodities will rely on low-cost and reliable electricity. Agricultural residues from cocoa, palm oil and coffee production can be used to fuel biomass plants which in turn provide low-cost energy for crop processing.
1 Effective capacity required to generate the same amount of energy as the schedulable sources2 50% of energy generated from solar, 50% from dieselSource: PPL, 2014–2028 Strategic Plan, 2014; PJPL analysis
Provincial towns (15MW) US$ / kWh
Agricultural centres (10MW) US$ / kWh
Remote villages (30kW) US$ / kWh

POWERING PNG INTO THE ASIAN CENTURY 19
ANZ INSIGHT / ISSUE 6, AUGUST 201520
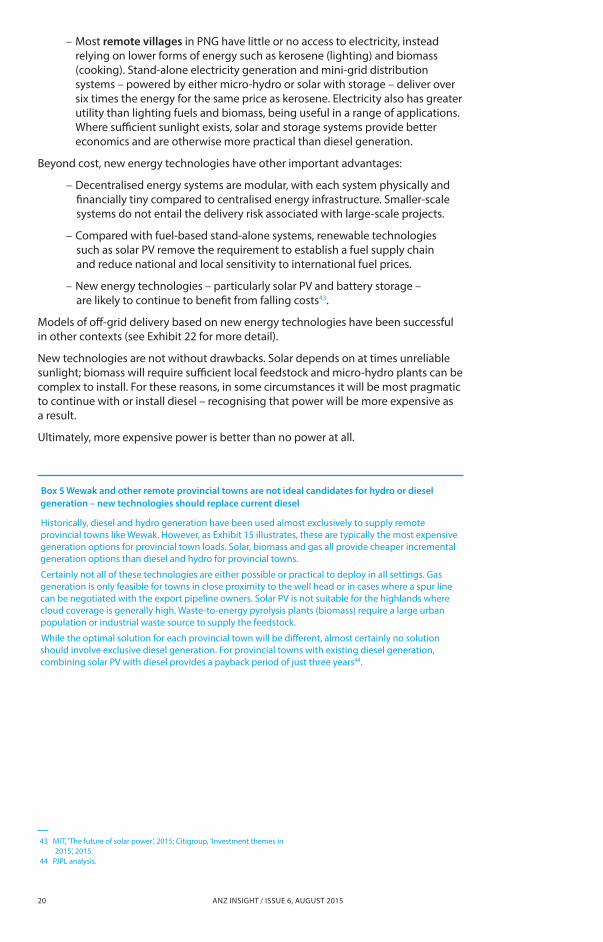
Box 5 Wewak and other remote provincial towns are not ideal candidates for hydro or diesel generation – new technologies should replace current diesel
Historically, diesel and hydro generation have been used almost exclusively to supply remote provincial towns like Wewak. However, as Exhibit 15 illustrates, these are typically the most expensive generation options for provincial town loads. Solar, biomass and gas all provide cheaper incremental generation options than diesel and hydro for provincial towns.
Certainly not all of these technologies are either possible or practical to deploy in all settings. Gas generation is only feasible for towns in close proximity to the well head or in cases where a spur line can be negotiated with the export pipeline owners. Solar Pv is not suitable for the highlands where cloud coverage is generally high. Waste-to-energy pyrolysis plants (biomass) require a large urban population or industrial waste source to supply the feedstock.
While the optimal solution for each provincial town will be different, almost certainly no solution should involve exclusive diesel generation. For provincial towns with existing diesel generation, combining solar Pv with diesel provides a payback period of just three years44.
43 MIT, 'The future of solar power’, 2015; Citigroup, 'Investment themes in 2015’, 2015.
44 PJPL analysis.
– Most remote villages in PNG have little or no access to electricity, instead relying on lower forms of energy such as kerosene (lighting) and biomass (cooking). Stand-alone electricity generation and mini-grid distribution systems – powered by either micro-hydro or solar with storage – deliver over six times the energy for the same price as kerosene. Electricity also has greater utility than lighting fuels and biomass, being useful in a range of applications. Where sufficient sunlight exists, solar and storage systems provide better economics and are otherwise more practical than diesel generation.
Beyond cost, new energy technologies have other important advantages:
– Decentralised energy systems are modular, with each system physically and financially tiny compared to centralised energy infrastructure. Smaller-scale systems do not entail the delivery risk associated with large-scale projects.
– Compared with fuel-based stand-alone systems, renewable technologies such as solar Pv remove the requirement to establish a fuel supply chain and reduce national and local sensitivity to international fuel prices.
– New energy technologies – particularly solar Pv and battery storage – are likely to continue to benefit from falling costs43.
Models of off-grid delivery based on new energy technologies have been successful in other contexts (see Exhibit 22 for more detail).
New technologies are not without drawbacks. Solar depends on at times unreliable sunlight; biomass will require sufficient local feedstock and micro-hydro plants can be complex to install. For these reasons, in some circumstances it will be most pragmatic to continue with or install diesel – recognising that power will be more expensive as a result.
Ultimately, more expensive power is better than no power at all.

POWERING PNG INTO THE ASIAN CENTURY 21
Exhibit 15 LEVELISED COST OF ELECTRICITY VERSUS CAPACITY BY GENERATION TYPE IN PROVINCIAL TOWNS
Exhibit 15 illustrates the LCOE of different technologies across the capacity curve and at 15MW. The left-hand chart demonstrates that the levelised cost of any technology varies with capacity over a range typical of provincial towns. Wewak – a town in PNG’s East Sepik province – will require a further 15MW by 2030 to meet the demand forecast presented in Chapter 2. The LCOE merit order for a 15MW installation is displayed in the chart above.
LCOE Versus Capacity By Generation Type In Provincial Towns
US$ / kWh Levelised cost of electricity (LCOE)
0.0
0.1
0.2
0.3
0.4
0.5
0.6
0 5 10 15 20 25
Source: PJPL analysis, 10% cost of capital, 56% capacity factor (21.5% for solar)
Capacity (MW)
1 E�ective capacity required to generate the same amount of energy as the schedulable sources 2 50% of energy generated from solar, 50% from diesel 3 PJPL forecast assuming 7.1% CAGR for provincial towns
US$ per kWh LCOE of technologies at 15 MW
0.11 0.13 0.13 0.14
0.24
0.30
0.36
Solar CCGT OCGT Biomass Solar & Diesel
Hydro Diesel
Not including gas transport cost
Diesel
Hydro
OCGT CCGT Solar PV 1
Biomass
Solar & Diesel
Wewak 2013 Wewak 2030 3 Assumes hydro plant is close to load
2
3.4 BETTER INTEGRATION OF LANDMARK RESOURCE DEVELOPMENTS CAN SUPPORT NATIONWIDE DEVELOPMENTANZ’s 2013 Bold Thinking report explained how a deliberate approach to coordinating PNG’s agriculture, resource and infrastructure sectors will be key to creating balanced economic development.
For electricity, it is the coordinated development of the resource sector with associated electricity infrastructure that should be a priority. Resource sector projects bring the demand, skills and in many cases investment appetite to accelerate remote and rural power provision.
Within PNG and elsewhere, resource companies at times provide electricity, along with a range of other services, to nearby ‘mining town’ communities. In many of these cases the communities concerned are well served but these arrangements are not without their drawbacks.
1 Effective capacity required to generate the same amount of energy as the schedulable sources2 50% of energy generated from solar, 50% from diesel3 PJPL forecast assuming 7.1% CAGR for provincial townsSource: PJPL analysis, 10% cost of capital, 56% capacity factor (21.5% for solar)
Levelised cost of electricity (LCOE) US$ / kWh
LCOE of technologies at 15 MW US$ / kWh

ANZ INSIGHT / ISSUE 6, AUGUST 201522
For project owners, there can be a tension between delivering competitive energy to the resource project with expectations to provide electricity to surrounding areas, at times at subsidised prices. This tension grows if populations close to the mine grow, perhaps attracted to a source of power or other services. Over time, pressures can increase for project owners to become a de facto energy utility, with a mandate extending beyond the project itself.
For the community at large, electricity provision from individual mines is not a good substitute for a robust electricity approach which integrates resource sector demand.
– Firstly, large industrial loads offer base-load demand that can underpin broader infrastructure development, the benefits of which should extend well beyond the boundaries of a single project.
– Secondly, if resource companies must anticipate supplying electricity beyond their project, this cost will be built into investment cases, reducing project attractiveness.
– Finally, if resource companies usurp the role of regional or district power authorities, appetite to build power sector skills in government bodies can be dampened.
A better approach is to use resource sector demand to underpin capacity additions linked to the national power grid. Stable, reliable loads help increase utilisation and providing another source for power linking resource projects to the grid, lowers investment risks associated with the new capacity. Both effect lower costs for the resource developer and other possible customers.
Although the benefits of integration are clear, there are a number of challenges that need to be overcome to put theory into practice.
– One is that effective integration requires a good understanding of the likely evolution of PNG’s electricity needs, the consequential infrastructure demands, planned resource projects and resulting demand from the sector. The value of integration will be highest when this understanding is in place and may not be possible without it. This work is the subject of a number of programs within PNG at present; ensuring a focus on resource sector integration in long-term planning would be a useful first step.
– Another is that large-capacity generation investments underpinned by the demand from a single resource project can carry a reasonably high level of commercial risk. In such a case, the economics of both the generation and mining projects could vary significantly with the fortunes of either entity. Managing these risks can be difficult even for established mining projects; for newly developed projects or in new resource provinces, it can be especially challenging.
– Finally, reliability must be addressed if resource sector players are to find linking their power supply to the grid or taking power from a remote generator via a grid, attractive. Power outages quickly damage the performance of resource projects, not only through lack of activity while power is absent but due to the additional effort needed to restart processing and other types of complex plants, even when power is restored. Grid-based provision must provide very high levels of reliability for resource sector customers if integration is to be attractive. Models involving ‘investing customers’ – who are served first and as such experience higher reliability – may be a way forward for projects in PNG.
Many resource companies recognise that the social and economic benefits of thoughtful integration with other power users are worth the trouble – provided equal commitment can be found on the other side.
POWERING PNG INTO THE ASIAN CENTURY 23
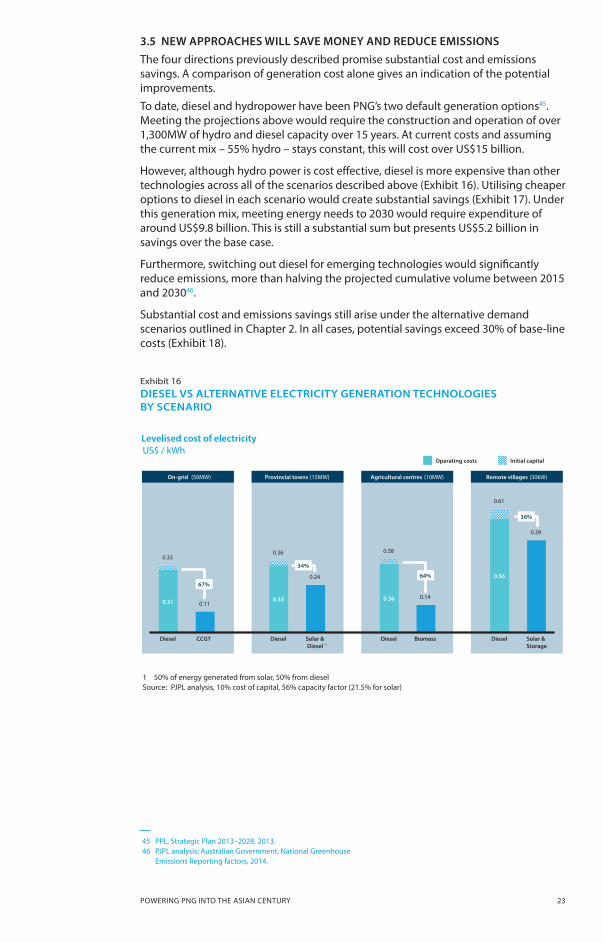
3.5 NEW APPROACHES WILL SAVE MONEY AND REDUCE EMISSIONSThe four directions previously described promise substantial cost and emissions savings. A comparison of generation cost alone gives an indication of the potential improvements.
To date, diesel and hydropower have been PNG’s two default generation options45. Meeting the projections above would require the construction and operation of over 1,300MW of hydro and diesel capacity over 15 years. At current costs and assuming the current mix – 55% hydro – stays constant, this will cost over US$15 billion.
However, although hydro power is cost effective, diesel is more expensive than other technologies across all of the scenarios described above (Exhibit 16). Utilising cheaper options to diesel in each scenario would create substantial savings (Exhibit 17). Under this generation mix, meeting energy needs to 2030 would require expenditure of around US$9.8 billion. This is still a substantial sum but presents US$5.2 billion in savings over the base case.
Furthermore, switching out diesel for emerging technologies would significantly reduce emissions, more than halving the projected cumulative volume between 2015 and 203046.
Substantial cost and emissions savings still arise under the alternative demand scenarios outlined in Chapter 2. In all cases, potential savings exceed 30% of base-line costs (Exhibit 18).
Exhibit 16 DIESEL VS ALTERNATIVE ELECTRICITY GENERATION TECHNOLOGIES BY SCENARIO
Diesel Vs Alternative Power Generation Technologies By Scenario
Source: PJPL analysis, 10% cost of capital, 56% capacity factor (21.5% for solar)
1 50% of energy generated from solar, 50% from diesel
Initial capital Operating costs
On-grid (50MW) Provincial towns (15MW) Agricultural centres (10MW) Remote villages (30kW)
67%
34%
64%
36%
1
0.31 0.33 0.36
0.56
0.33
0.11
0.36
0.24
0.38
0.14
0.61
0.39
Diesel CCGT Diesel Solar & Diesel
Diesel Biomass Diesel Solar & Storage
45 PPL, Strategic Plan 2013–2028, 2013.46 PJPL analysis; Australian Government, National Greenhouse
Emissions Reporting factors, 2014.
1 50% of energy generated from solar, 50% from dieselSource: PJPL analysis, 10% cost of capital, 56% capacity factor (21.5% for solar)
Levelised cost of electricity US$ / kWh

ANZ INSIGHT / ISSUE 6, AUGUST 201524
Capacity
Connection Operating
Total
8.3
0.3 1.2
9.8
Capacity
Connection Operating
Total
2.7
0.3
12.0
15.0
Billion US$ Best alternatives^
Billion US$ Default**
US$5.2 billion saving
* These calculations refer to public access capacity and does therefore not include private o�-grid capacity (such as mining) ** Assumes capacity additions take the same mix as existing capacity, with 55% hydro and remaining capacity from diesel ^ Assumes cheapest alternative for each generation scenario, with 55% of on-grid capacity still from hydro
Source: PJP Analysis
*
*
Demand, Capacity And Investment By Scenario
8.3
8.5
9.8
10.0
2.5
Diesel/Hydro Scenario
Default – balanced growth
Agriculture boom
Institutional failure
Capacity Connection Operating
1
2
3
12.0
12.2
2.9 1.9
15.0
15.4
4.4
0.9
0.9
0.4
Alternatives Diesel/Hydro Alternatives
0.3
0.3
0.2
Source: PJPL Analysis, Emissions based on forecast generation mix and Australian Government’s National Greenhouse Emissions Reporting factors (2014)
Exhibit 17 COST OF PUBLIC ACCESS CAPACITY TO 2030 UNDER DIFFERENT GENERATION MIX
Exhibit 18 DEMAND, CAPACITY AND INVESTMENT BY SCENARIO
* These calculations refer to public access capacity and therefore do not include private off-grid capacity (such as mining)** Assumes capacity additions take the same mix as existing capacity, with 55% hydro and remaining capacity from diesel^ Assumes cheapest alternative for each generation scenario, with 55% of on-grid capacity still from hydro
Source: PJPL analysis, Emissions based on forecast generation mix and Australian Government’s National Greenhouse Emissions Reporting factors, 2014
Default ** Billion US$
Scenario Public investment to 2030 (billions)
Emissions from electricity in 2030 (Mt CO2e)
Best alternatives ^ Billion US$
POWERING PNG INTO THE ASIAN CENTURY 25
4.0 MEETING THE CHALLENGE: BUILDING A FIT-FOR-PURPOSE ELECTRICITY SECTOR
KEY THEMES:
– Appropriate and sustainable investments in the electricity sector will be supported by a reform in electricity pricing that creates the right incentives for supplying high- cost areas as well as utilising the least-cost energy source. – An explicit and well-designed subsidy framework will be a critical link between electricity system development and real demand. – Structurally separating PPL and inviting competition will reduce conflict of interest as well as encourage specialist generators and retailers to participate in lowering the costs and increasing quality of on-grid electricity. – In rural areas, a Rural Electrification Agency (REA) can help facilitate appropriate competition of ideas and approaches from a range of stakeholders. – Stronger involvement by the private sector can foster needed innovation and lower costs off-grid, while regional groups through a community-based approach can help secure traction in implementation.
4.1 REFORM IS NEEDED TO ALLOW INVESTMENT AND INNOVATION TO FLOW
Whatever solution may prove optimal, meeting PNG’s electricity challenge will require an electricity sector capable of moving at speed and with precision. The sector must design, coordinate, deploy and operate sizable additions to PNG’s generation and connection infrastructure in short order.
The variety and complexity of this task will make it difficult to achieve with only the contributions of a small number of dominant central agencies. Today PPL acts as a central agency, with direct oversight from the independent public business regulator and some supervision from PNG’s competition and energy regulators.
Reform is needed to allow for new investments and innovation in both on- and off-grid settings. PPL has a central role to play in future power provision but new and existing players alike must be given the freedom to operate independently, and in parallel, throughout PNG. This requires a change in direction for PPL and the institutions that constitute PNG’s electricity sector (see Appendix 2 for a detailed description of the current institutional framework).
The need for reform has been recognised by the PNG government 47. The addition of the Electricity Management Committee (EMC), a brand new governing body, is the most recent change and additional changes are expected follow.
In order to ensure an environment capable of supporting growth in PNG’s electricity sector, reform must target four important outcomes:
– Structure tariffs and subsidies to offer fair returns on new investments.
– Structurally separate PPL to improve performance and eliminate conflicts of interest.
– Invite competition and consider selectively privatising PPL.
– Introduce a new framework for off-grid provision to introduce competition of ideas and approaches.
47 Government of PNG, Proceedings of the National Stakeholders Consultation Workshop, NEROP, 2015.

ANZ INSIGHT / ISSUE 6, AUGUST 201526
48 The ICCC announced in the 2013 ERC reliability payments will be put into a Reliability Improvement Fund that promotes further investment in reliability initiatives by PPL.
49 ICCC, The Electricity Regulatory Contract, 2013, p. 42.50 ICCC, ‘The final report on PNG Power Limited’s electricity regulatory
contract review’, 2013.51 Ibid.
4.1.1 Structure tariffs and subsidies to offer fair returns on new investments
The current system of tariffs has the benefit of simplicity, being a government-set, flat tariff for all PNG electricity users – in practice a flat tariff for all PPL customers. However, both the process through which tariffs are set and the incentives they produce, act to delay essential investment. vital reforms are needed.
Move on-grid tariffs closer to true costs. The process through which PPL’s tariffs are calculated is intended to ensure tariffs cover operating costs and a fair return on capital. However, PPL’s recent financial performance suggests the calculation process produces results which do not match actual costs and PPL needs a more supportive pricing regime.
Other important factors further frustrate appropriate pricing. Future projects funded by the Reliability Improvement Fund48 are excluded from PPL’s regulatory asset base and therefore do not earn a return49. These projects, intended to be ‘gifted’ to PPL, have the unintended effect of further suppressing tariffs below actual costs.
New suppliers of on-grid power will be important if PNG is to mobilise necessary investment. Yet while tariffs remain unrealistically low and government subsidy policies remain opaque, only entities that can call on government backing can easily invest in PNG’s electricity market. Genuinely new competitors will find entry more difficult.
Include fuel costs in set tariffs. At present, tariff caps apply only to non-fuel costs and as such changes in fuel costs can be directly passed through to customers50. While PPL’s financials are weak and their expertise in procuring fuel is being developed, this may be appropriate. But over time this acts to embed inefficient diesel generation as a preferred form of generation. Other, newer forms of generation can have higher non-fuel costs but lower overall costs. While PPL is insulated against fuel costs, there is little incentive to adopt new modes of generation that would be beneficial for consumers and for PPL.
A cap that includes fuel costs would also incentivise efficiency across the existing diesel generation fleet and avoid electricity users wearing the cost – every quarter – of a fuel risk they can do nothing to manage.
Allow geographically differentiated tariffs. The analysis in previous chapters suggests the cost of rural and regional electricity should fall substantially through the adoption of emerging electricity technologies. However, it also makes clear that for the foreseeable future rural and remote electricity consumers will be more expensive to supply than those in urban areas or within grid range.
The existing flat tariff structure encourages PPL to expand its coverage in easy-to-serve areas, where it earns an attractive margin, but to avoid expansion in high-cost areas, where every new connection requires implicit subsidisation (Exhibit 19). At a minimum, differentiated tariffs would remove this incentive. Allowing electricity users and suppliers to be aware of these differential costs of supply, and charge for them, will be critical to future investment in rural and off-grid provision.
In 2013, reforms to the Electricity Regulatory Contract (ERC) allowed geographic differentiation51. There seems little reason to delay this reform.

POWERING PNG INTO THE ASIAN CENTURY 27
Introduce an explicit and well-designed subsidy framework. Maintaining affordability under differentiated tariffs will require a change in the way subsidies are set. Electricity is a basic need and subsidies are appropriate. However, unintended consequences are common in subsidy design and so the process by which they are developed must be of high quality. Subsidies or deferred payments also need to ensure affordability of the actual electricity connection – a dilemma dealt with in Box 6.
At present, the internal cross-subsidisation forced on PPL replaces an important policy decision – the size and form of subsidies to rural and other disadvantaged electricity users. More transparency is required to arrive at the best structure for PNG’s electricity goals.
Exhibit 19 TARIFF PRICE VERSUS COST OF OPERATION Toea/kWh
Tari� Price Versus Cost of Operation
66
40
66
90
66
110
Tari� price
PPL costs
Tari� price
PPL costs
Tari� price
PPL costs
Current structure
Provincial towns Remote villages
Regulated return Operating costs
Source: ICCC, The �nal report on PNG Power Limited’s electricity regulatory contract review, 2013; PJPL analysis
Tari� price
Uniform national tari�
50 50
95 95
110 110
Tari� price
PPL costs
Tari� price
PPL costs
Tari� price
PPL costs
Proposed structure
On-grid (Ramu & POM)
On-grid (Ramu & POM) Provincial towns Remote villages
Subsidy
Adjusted regulated
return
Explicit subsidy
ILLUSTRATIVE RESIDENTIAL COSTS
Source: ICCC, The final report on PNG Power Limited’s electricity regulatory contract review, 2013; PJPL analysis
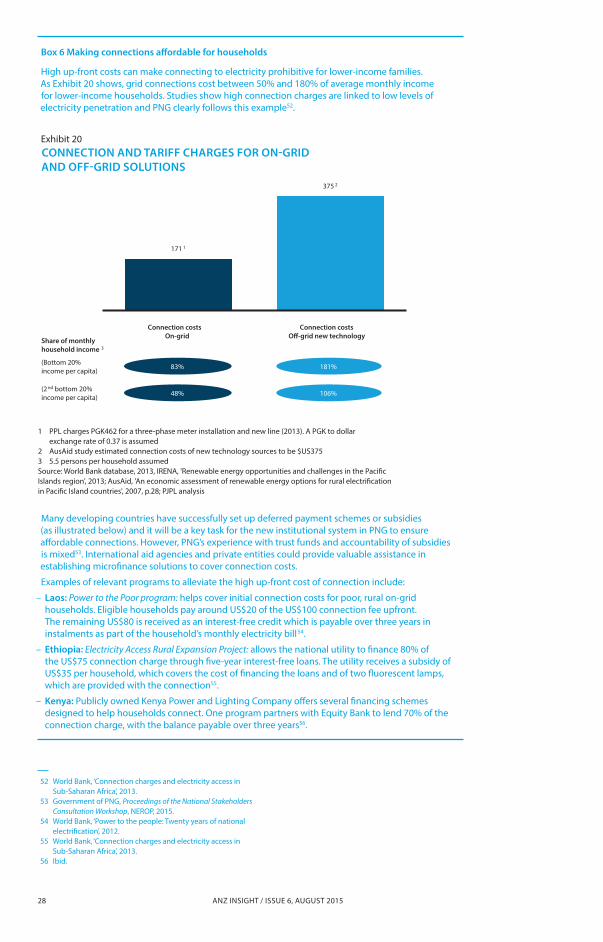
ANZ INSIGHT / ISSUE 6, AUGUST 201528
Connection and Tari� Charges For On-grid and O�-grid Solutions
Source: World Bank database (2013), IRENA, Renewable energy opportunities and challenges in the Paci�c Islands region, 2013; AusAid , An Economic Assessment of Renewable Energy Options for Rural Electri�cation in Paci�c Island Countries, 2007, p.28; PJPL analysis
171 1
375 2
(Bottom 20% income per capita)
83%
Connection costs On-grid
Connection costs O�-grid new technology
181%
(2 nd bottom 20% income per capita) 48% 106%
Share of monthly household income 3
1 PPL charges PGK462 for a three phase meter installation and new line (2013). A PGK to dollar exchange rate of 0.37 is assumed 2 AusAid study estimated connection costs of new technology sources to be $375 3 5.5 persons per household assumed
Box 6 Making connections affordable for households
High up-front costs can make connecting to electricity prohibitive for lower-income families. As Exhibit 20 shows, grid connections cost between 50% and 180% of average monthly income for lower-income households. Studies show high connection charges are linked to low levels of electricity penetration and PNG clearly follows this example52.
Exhibit 20 CONNECTION AND TARIFF CHARGES FOR ON-GRID AND OFF-GRID SOLUTIONS
Many developing countries have successfully set up deferred payment schemes or subsidies (as illustrated below) and it will be a key task for the new institutional system in PNG to ensure affordable connections. However, PNG’s experience with trust funds and accountability of subsidies is mixed53. International aid agencies and private entities could provide valuable assistance in establishing microfinance solutions to cover connection costs.
Examples of relevant programs to alleviate the high up-front cost of connection include:
– Laos: Power to the Poor program: helps cover initial connection costs for poor, rural on-grid households. Eligible households pay around US$20 of the US$100 connection fee upfront. The remaining US$80 is received as an interest-free credit which is payable over three years in instalments as part of the household’s monthly electricity bill54.
– Ethiopia: Electricity Access Rural Expansion Project: allows the national utility to finance 80% of the US$75 connection charge through five-year interest-free loans. The utility receives a subsidy of US$35 per household, which covers the cost of financing the loans and of two fluorescent lamps, which are provided with the connection55.
– Kenya: Publicly owned Kenya Power and Lighting Company offers several financing schemes designed to help households connect. One program partners with Equity Bank to lend 70% of the connection charge, with the balance payable over three years56.
52 World Bank, ‘Connection charges and electricity access in Sub-Saharan Africa’, 2013.53 Government of PNG, Proceedings of the National Stakeholders
Consultation Workshop, NEROP, 2015.54 World Bank, ‘Power to the people: Twenty years of national
electrification’, 2012.55 World Bank, ‘Connection charges and electricity access in
Sub-Saharan Africa’, 2013.56 Ibid.
1 PPL charges PGK462 for a three-phase meter installation and new line (2013). A PGK to dollar exchange rate of 0.37 is assumed2 AusAid study estimated connection costs of new technology sources to be $US3753 5.5 persons per household assumedSource: World Bank database, 2013, IRENA, 'Renewable energy opportunities and challenges in the Pacific Islands region', 2013; AusAid, 'An economic assessment of renewable energy options for rural electrification in Pacific Island countries', 2007, p.28; PJPL analysis
POWERING PNG INTO THE ASIAN CENTURY 29
4.1.2 Structurally separate PPL to improve performance and eliminate conflicts of interest
Given its ongoing significance for electricity provision in PNG, achieving an optimal structure for PPL will be a key part of any energy solution. PPL currently operates as a vertically integrated quasi-monopoly and is responsible for making, moving and selling electricity57. Coordination of these functions – each with distinct skills and priorities – is certainly difficult and has been a significant challenge for PPL (Box 7).
A structural separation of PPL into its component parts would help improve its performance. Operating as one entity in three separate businesses – each with different needs and priorities – presents PPL with a number of diverging mandates. Separation of generation, transmission and retail will help identify improvement opportunities. With PPL set to maintain a central role in PNG’s electricity sector for some time, improved PPL performance will benefit many.
Although addressing PPL’s performance will help improve outcomes, a more important benefit will be the reduction of actual and perceived conflicts of interest between PPL and new entrants. Those seeking to introduce new models for electricity sales must be sure they will receive the level of service they need from PPL. Electricity sector players should only have to deal with a competitor who is also a supplier or customer when absolutely necessary. The experience in other industries and jurisdictions is even that the perception of these conflicts dampens innovation and investment.
Box 7 A state of emergency
At the start of 2015, the Minister for Public Enterprise and State Investment, Ben Micah, declared a State of Emergency in relation to the supply of critical services, reportedly with the approval of the National Executive Council (NEC). The State of Emergency was declared to help collect overdue electricity bills for PPL, which was in financial distress. According to Minister Micah, PPL was owed K138 million and 30% of the electricity provided by PPL was never paid for. With a declaration of a State of Emergency, the Minister responsible was given leeway to use police and defence force personnel to support debt collection58.
In addition, Minister Micah temporarily suspended and replaced the Board with an interim governor. The government also intervened in tariff setting in 2014. Although in financial distress, PPL was prevented from raising tariffs by the NEC, even when proposed rises were prompted by growing fuel costs and were approved by the Independent Consumer and Competition Commision (ICCC).
57 ICCC, 'The final report on PNG Power Limited’s electricity regulatory contract review’, 2013; ICCC, Electricity Regulatory Contract, 2013.58 PPL, 2015; Business Advantage PNG, ‘Papua New Guinea’s energy sector
faces two-month state of emergency’, 2015.
ANZ INSIGHT / ISSUE 6, AUGUST 201530
POWERING PNG INTO THE ASIAN CENTURY 31
4.1.3 Invite competition and consider selectively privatising PPL
Structural separation of PPL will not solve PNG’s electricity challenges alone. There is a need to introduce competition to ensure enough investment and innovation in the electricity sector. Despite a limited set of opportunities, private sector activity and performance in generation is currently superior to that of PPL. Although private sector electricity retailers do not yet exist in PNG, other sectors in PNG – such as telecommunication – and electricity industries elsewhere have benefited from private companies’ superior track records in innovation and efficient operations59. PPL itself recognises this: involvement from Digicel helped PPL establish the successful EasyPay system, which allows upfront payment of electricity bills from mobile phones.
Invite private sector competition. The case for some private sector involvement in generation and distribution is strong – introducing competition has been an effective means of improving performance in many countries60. Generation businesses in particular can be very attractive to commercial investors61. Private sector involvement also allows the public sector to avoid many of the commercial risks and specialisation needs associated with generation.
The introduction of private sector players cannot occur without the pricing reforms previously described. All electricity sector players require distinct signals of the value of investment in generation, transmission, connection and sales. Private sector players can also respond well to features of subsidies designed to encourage achievement of social goals.
On-grid private sector involvement in generation is already growing with Independent Power Producers (IPPs) enabled by a new Third Party Access Code62 and an acknowledgement by the PNG government that private participation is needed. However, the existing access process is onerous, partly due to a pricing framework that necessitates a protracted electricity supply agreement process. It is of utmost importance that regulation and clear market mechanisms are set up to guarantee transparency, ease of business and fair tender processes to ensure that on-grid private generation can introduce least-cost energy sources to the grid.
Consider selectively privatising parts of PPL when timing is right. Whether privatisation should follow the introduction of competition is an open question. Bold Thinking made the case for an ongoing privatisation of PNG’s SOEs as a way of helping them compete and electricity is an important example of this.
Experience in other settings has demonstrated the benefits and challenges of privatising electricity provision (see Box 8). The privatisation of PPL’s retail and generation units might be undertaken to preserve the value of state assets in the face of private competition. After the liberalisation of retail markets, publicly owned retailers typically underperform against private competitors, losing market share and profitability63. Early privatisation can act to preserve value relative to a delayed offer. However, rushed privatisation presents its own hazards64. If privatisation is undertaken, it must be with sufficient regulatory support.
Experience suggests that privatisation of transmission, however, must be done with extreme care if at all. As a natural monopoly, transmission requires sophisticated regulation. If managed poorly privatisation of transmission assets can lead to wasteful duplicative infrastructure. Privatisation of transmission is not, nor should it be the first priority in a broader electricity reform program.
59 Zhang et al., ‘Electricity sector reform in developing countries’, Journal of Regulatory Economics, 2008. 60 Ibid.61 Oni, ‘Power sector privatisation in Nigeria’, Mayer Brown JSM, 2014. 62 The Code is currently under review by key stakeholders: Government of PNG,
Proceedings of the National Stakeholders Consultation Workshop, NEROP, 2015.63 Telikom PNG has significantly underperformed against private competitors and
lost market share in Telecommunication since market reforms in 2007.64 Jamasb et al., ‘Electricity sector reform in developing countries’, World Bank, 2005.

ANZ INSIGHT / ISSUE 6, AUGUST 201532
Box 8 The peril and promise of privatisation
Competition and privatisation are often introduced when the alternative – state-based provision – has failed. As such, their impact should be compared to a low-performance base case.
Introducing competition is well supported as a route to improved electricity service delivery, having been effective across a wide sample of nations65. However, the privatisation of state utilities is more controversial. Macro-economic surveys of privatisation often conclude that privatisation alone does not lead to obvious performance gains66. In many cases privatisation has been much more challenging than anticipated and has not delivered obvious benefits, particularly for disadvantaged and rural communities67. However, privatisation has been successful in some cases – with outcomes in Chile and Argentina praised. In Chile privatisation has been particularly successful in rural areas – with electricity access improved from 38% to 86% in two decades68.
Privatisation seems to work within a particular regulatory environment, with powerful governance key to success69. In cases where privatisation has been rushed, the results have been costly70. As such, if privatisation is the solution in PNG, it is critical that it be implemented deliberately, slowly and with full structural support.
4.1.4 Introduce a new framework for off-grid provision to introduce competition of ideas and approaches
In the off-grid setting information is limited and significant business model innovation will be needed. Serving communities is likely to require different models, skill sets and infrastructure across geographies, with the nature of these currently unclear. Private enterprises and NGOs are better positioned to undertake this exploration process, given their smaller organisations and greater incentives to adapt rapidly.
The correction of price signals and subsidies described above will present an opportunity to make serving rural communities an attractive private sector proposition, rather than a burden on the broader system. Private and NGO sector activity should be encouraged in off-grid settings and be facilitated by well-designed regulation and monitoring.
Although the case for deploying private enterprise in off-grid settings is clear, social outcomes must remain a focus. Private sector involvement without sufficient incentives for social provision has led to well-documented failures elsewhere71. This goes beyond the subsidies, described above, that are necessary to bridge the gap between cost and ability to pay. It extends into the design of arrangements that ensure suppliers prioritise increasing access and levels of service, rather than delivering capacity or volume improvements only.
The need for independent governance and monitoring of private entities and NGOs is obvious but not always easy to provide. Any regulator requires sufficient technical and, importantly, commercial and negotiation skills to hold new players to account.
65 Zhang et al., ‘Electricity sector reform in developing countries’, The Journal of Regulatory Economics, 2008.66 Parker and Kirkpatrick, ‘Privatisation in developing countries’
The Journal of Development Studies, 2005; Zhang et al., ‘Electricity sector reform in developing countries’, The Journal of Regulatory Economics, 2008.67 Jamasb et al, ‘Electricity sector reform in developing countries’,
World Bank, 2005.68 Pollitt, ‘Electricity reform in Chile’, The Journal of Network Industries, 2004.69 Kessides, The impacts of electricity sector preforms in developing
countries, The Electricity Journal, 2012; Parker and Kirkpatrick, ‘Privatisation in Developing Countries’, The Journal of Development Studies, 2005.70 Jamasb et al., 'Electricity sector reform in developing countries',
World Bank, 2005.71 Bolivian and venezuelan water supply case studies – see e.g.
‘Public sector alternatives to water supply and sewerage privatisation’, International Journal of Water Resources Development, 2010; Prasad. N.,
'Privatisation results: Private sector participation in water services after 15 years', Development Policy Review, 2006.

POWERING PNG INTO THE ASIAN CENTURY 33
A Rural Electrification Agency (REA) might help support the establishment of new rural electrification models72. An REA could facilitate a tender process that allows a range of entities to provide service within certain mandates. The REA might also provide a backstop if tender processes are unsuccessful and develop and distribute information regarding remote area electricity needs in order to reduce investment and operation risk.
Clearly, whatever off-grid model is chosen through the National Electrification Roll-Out Plan (NEROP) process, electrification in off-grid settings will rely on emerging technologies whose capabilities are rapidly changing. Organisations will require very different human and operational capacities if they are to succeed in this environment. PPL – already responding to significant on-grid challenges – cannot be solely responsible for driving off-grid improvements.
4.2 A POSSIBLE FUTURE STATE FOR PNG’S ELECTRICITY SECTOR
The reforms proposed above will mean rapid change for all involved in PNG’s electricity sector. A possible future state for PNG’s electricity sector is presented below in Exhibit 21. Obviously significant further thinking on the subject is critical and no simple model can fully portray the complete picture of the institutional changes needed.
This proposed end-game involves the four reforms foreshadowed above. These include an unbundled PPL and introduction of competition on the electricity grid. Within PPL’s original service areas, a market operator (previously part of PPL but now an independent government agency) would manage the pool of generated electricity and ensure its allocation to a number of retail entities. These entities distribute and sell to customers, while an electricity regulator ensures monitoring of the electricity market. PPL may operate both generation and retail enterprises within this system; however, this operation should be on the same terms as private sector participants.
Exhibit 21 POSSIBLE FUTURE ON- AND OFF-GRID INSTITUTIONAL FRAMEWORK
Potential Future On and O�-grid Institutional Framework
Generation - Supply
Rural Electri�cation Agency • Tender process/project management
• Funding administration • Information & best practice sharing
Original PPL service areas
O�-grid (hybrid market)
IPPS PPL
Transmission
Retail - Demand
Market operator (transmission & power pool
management)
Buy electricity
Sell electricity to market operator
Community based
(Wantok )
Private sector based
Private company
establishes and delivers
electricity services
Public-private partnership
REA owns assets
but private company
installs and operates
Government entities
State-owned enterprises
Private companies
Private companies PPL
Source: PJPL analysis; Government of PNG, Proceedings of the National Stakeholders’ Consultation Workshop, NEROP, 2015; Alliance for Rural Electri�cation, Hybrid mini-grids for rural electri�cation: Lessons learned, 2014
(Non-exhaustiveexamples)
Government Electricity Department (EMC/DPE)
• Policy formulation • Funding
Electricity Regulator (ICCC) • Economic & technical
regulation • Market monitoring
72 Work conducted for NEROP has identified a number of models capable of delivering increased electricity performance, many of which are inspired by successes elsewhere. See: Government of PNG, Proceedings
of the National Stakeholders Consultation Workshop, NEROP, 2015.
Source: PJPL analysis; Government of PNG, Proceedings of the National Stakeholders Consultation Workshop, NEROP, 2015; Alliance for Rural Electrification, ‘Hybrid mini-grids for rural electrification: Lessons learned’, 2014
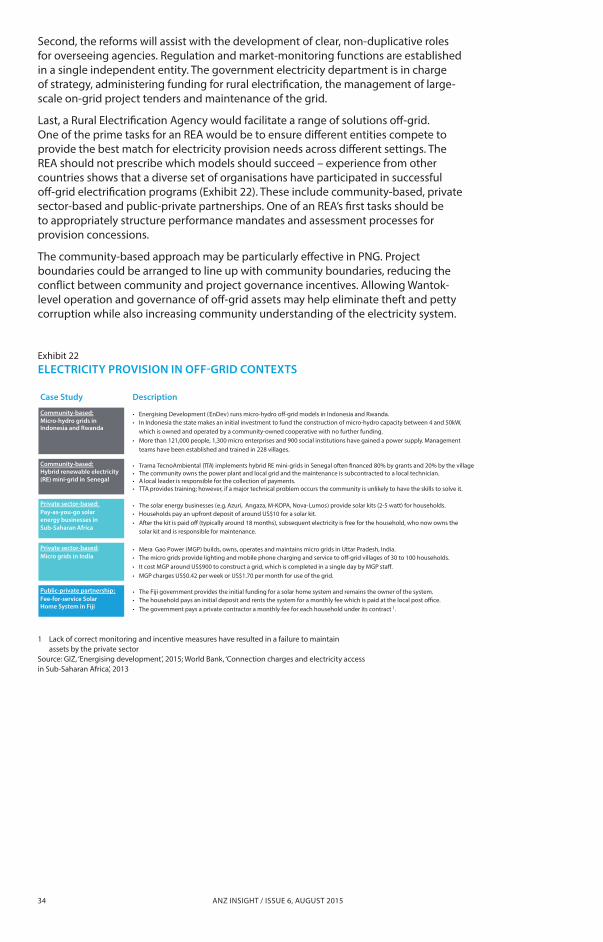
ANZ INSIGHT / ISSUE 6, AUGUST 201534
Second, the reforms will assist with the development of clear, non-duplicative roles for overseeing agencies. Regulation and market-monitoring functions are established in a single independent entity. The government electricity department is in charge of strategy, administering funding for rural electrification, the management of large-scale on-grid project tenders and maintenance of the grid.
Last, a Rural Electrification Agency would facilitate a range of solutions off-grid. One of the prime tasks for an REA would be to ensure different entities compete to provide the best match for electricity provision needs across different settings. The REA should not prescribe which models should succeed – experience from other countries shows that a diverse set of organisations have participated in successful off-grid electrification programs (Exhibit 22). These include community-based, private sector-based and public-private partnerships. One of an REA’s first tasks should be to appropriately structure performance mandates and assessment processes for provision concessions.
The community-based approach may be particularly effective in PNG. Project boundaries could be arranged to line up with community boundaries, reducing the conflict between community and project governance incentives. Allowing Wantok-level operation and governance of off-grid assets may help eliminate theft and petty corruption while also increasing community understanding of the electricity system.
Exhibit 22 ELECTRICITY PROVISION IN OFF-GRID CONTEXTS
Electricity Provision In O�-grid Contexts
Case Study Description
Community-based: Micro-hydro grids in Indonesia and Rwanda
• Energising Development (EnDev) runs micro-hydro o�-grid models in Indonesia and Rwanda. • In Indonesia the state makes an initial investment to fund the construction of micro-hydro capacity between 4 and 50kW,
which is owned and operated by a community-owned cooperative with no further funding. • More than 121,000 people, 1,300 micro enterprises and 900 social institutions have gained a power supply. Management
teams have been established and trained in 228 villages.
Community-based: Hybrid renewable electricity (RE) mini-grid in Senegal
• Trama TecnoAmbiental (TTA) implements hybrid RE mini-grids in Senegal often �nanced 80% by grants and 20% by the village. • The community owns the power plant and local grid and the maintenance is subcontracted to a local technician. • A local leader is responsible for the collection of payments. • TTA provides training; however, if a major technical problem occurs the community is unlikely to have the skills to solve it.
Private sector-based: Pay-as-you-go solar energy businesses in Sub-Saharan Africa
• The solar energy businesses (e.g. Azuri, Angaza, M-KOPA, Nova-Lumos) provide solar kits (2-5 watt) for households. • Households pay an upfront deposit of around US$10 for a solar kit.• After the kit is paid o� (typically around 18 months), subsequent electricity is free for the household, who now owns the
solar kit and is responsible for maintenance.
Private sector-based: Micro grids in India
• Mera Gao Power (MGP) builds, owns, operates and maintains micro grids in Uttar Pradesh, India. • The micro grids provide lighting and mobile phone charging and service to o�-grid villages of 30 to 100 households. • It cost MGP around US$900 to construct a grid, which is completed in a single day by MGP sta�. • MGP charges US$0.42 per week or US$1.70 per month for use of the grid.
Public-private partnership: Fee-for-service Solar Home System in Fiji
• The Fiji government provides the initial funding for a solar home system and remains the owner of the system. • The household pays an initial deposit and rents the system for a monthly fee which is paid at the local post o�ce. • The government pays a private contractor a monthly fee for each household under its contract .1
Source: GIZ, Energising Development, 2015; Energising Development, Business Models for MHP village grids, 2013; World Bank, Connection Charges and Electricity Access in Sub-Saharan Africa, 2013
1 Lack of correct monitoring and incentive measures have resulted in a failure to maintain assets by the private sector
1 Lack of correct monitoring and incentive measures have resulted in a failure to maintain assets by the private sectorSource: GIZ, ‘Energising development’, 2015; World Bank, ‘Connection charges and electricity access in Sub-Saharan Africa’, 2013
POWERING PNG INTO THE ASIAN CENTURY 35
5.0 IMPLICATIONS FOR STAKEHOLDERS SEEKING TO SUPPORT PNG’S ELECTRICITY DEVELOPMENT
KEY THEMES:
– Government must help PPL to identify a sustainable model, explore avenues to build a predictable business environment and align initiatives with PNG’s social reality. – Private entities and NGOs should help focus policy reforms to ensure efficiency and ease of business. – Electricity entrepreneurs wishing to support PNG’s development should communicate new on and off-grid business models suitable to PNG to gain support. – Best-practice off-grid case studies will help guide policy and funding – private entities and NGOs alike should set up test studies in PNG. – International investors and aid programs should allocate investment towards clean, off-grid solutions.
5.1 GOVERNMENT CONVERSATIONS ON THE ROAD TO SUCCESS
Much remains to be defined and the reforms and models suggested above are only a starting point. However, the wealth of programs currently under way suggests extensive focus and effort will be dedicated to establishing a secure electricity future for PNG. Government and institutional conversations must address the following key questions.
5.1.1 What is the best way forward for PPL and off-grid electricity provision?
PPL has a central role to play in future power provision in PNG and attention must be dedicated to improving its financial wellbeing and sustainability. The challenges of electricity provision in PNG go beyond fixing PPL’s current financial distress to a more long-term view of central provision. In immediate terms, PPL must be supported to ensure it recovers appropriate revenue and can establish stable governance. It is essential tariffs are restructured to provide PPL and other private entities with suitable funding models.
Looking forward, the arrangement of the organisations responsible for administrating and providing electricity supply will be central to success. Questions to consider include:
– How best to unbundle PPL to help ensure organisational focus, clear mandates and appropriate transfer pricing?
– What institutional arrangements would represent an ideal end-game for PNG’s electricity sector and avoid institutional duplication?
– What are the steps necessary to reach this end-game at a pace that can be absorbed by those involved?
– What is the best government entity to facilitate an innovative, hybrid off-grid electrification model?
– What accountability measures and subsidy designs could ensure appropriate social return?
Above we have attempted to illustrate a possible end-scenario, a depiction which is obviously notional but designed to raise key issues. Government and other stakeholders must continue to engage in shaping the outcome in what will be a difficult but valuable journey.

ANZ INSIGHT / ISSUE 6, AUGUST 201536
5.1.2 How can an appropriate and predictable environment for stakeholders involved in electricity provision be established?
Private and public entities will need to work together to accomplish appropriate electricity provision in PNG. This will require strong regulatory processes and a more predictable operating environment.
As discussed in Bold Thinking, ongoing efforts to improve the effectiveness of PNG’s regulatory and governance framework will bring widespread benefits in many sectors. The electricity sector is no different – large electricity projects have often run over budget or struggled to deliver. Similarly, District or Provincial Services Improvement Program (DSIP or PSIP) projects73 have experienced a number of issues stemming from a lack of appropriate accountability measures.
The structural and technological changes described above are highly dependent on improvements in the regulatory and law enforcement system and ongoing conversations must address needed improvement in this area.
5.1.3 How should electricity reform align with other government initiatives and PNG’s cultural landscape?
Reform in the electricity sector will take place as part of a wider reform process and new bodies will have to operate effectively within a distinct culture which has frustrated some previous development efforts74.
Effective development in the electricity sector requires clarity regarding the roles of national and provincial government. Although not covered in this research, to be effective a new institutional framework must be in line with government initiatives in other sectors. The current government preference towards decentralisation must be taken into account when reforming the electricity sector. Establishing clear national and provincial mandates will ensure that previous issues – such as those which plagued the C-Centres – are not repeated.
Remote electricity provision should be compatible with local community networks, standards and attitudes to be most effective. Aligning the boundaries of electrification concessions with local or provincial governments or communities may help, without sacrificing scale, but so will realistic expectations about how quickly roll-out in rural areas can progress.
Funding and support must also be appropriately designed and must take care to limit the amount of potential benefits lost to governance failures or, of equal concern, inefficient ongoing maintenance. Policy-makers might look to India’s Barefoot College and Pollinate75, among many others, as examples of models that have evolved to address community governance failures and challenging maintenance tasks.
73 World Bank, ‘How capital projects are allocated in PNG villages’, 2011.74 Mana, ‘Anti-corruption strategy for provincial government in
PNG’, ANU, 1999.75 Barefoot College is a school and NGO based in Tilonia in India which
focuses on training and equipping village residents to construct and maintain power, health and education infrastructure. The college has famously insisted on training grandmothers who are most likely to remain with their village after training. Pollinate is an NGO operating in suburban India, which delivers solar light sources to people living in poverty and has an innovative relationship-based approach to maintenance designed to ensure infrastructure remains productive.

POWERING PNG INTO THE ASIAN CENTURY 37
5.2 PRIVATE ENTITIES AND NGOS – ENGAGE IN DIALOGUE WITH GOVERNMENT TO DEVELOP THE FUTURE ELECTRICITY MARKET
Achieving 70% electrification by 2030 through on- and off-grid solutions presents many opportunities for non-government entities. However, to improve the likelihood of private sector and NGO delivery success, private entities must attend to market reforms.
Appropriate policy reforms will support later community and private sector delivery. As such, non-governmental stakeholders must engage in early dialogue with government to help build appropriate policy. Dialogue is essential to ensure policies create an environment that facilitates private involvement, ensures ease of doing business and directs development towards national goals.
5.3 ELECTRICITY ENTREPRENEURS – COMMUNICATE NEW MODELS TO GAIN SUPPORT
In order for policy to support generation from new technology and innovative off-grid models, clarity on early technology business offerings will be needed. Electricity entrepreneurs with new operating models should be encouraged to make these known to other stakeholders such that support can be rendered. Whether these models involve large investments in capacity generation such as biomass, Combined Cycle Gas Turbine (CCGT) or hydro, or involve small-scale business solutions for remote villages or agricultural business is not important. Clarity will help policy-makers identify solutions with merit in PNG and develop policy and funding support.
In addition, NGOs and private entities alike should start engaging with provincial and central governments to test new off-grid solutions. Creating early best-practice cases in provinces willing to engage with private entities will improve learning and smooth the journey ahead. Operating in a geographically and culturally diverse country like PNG will be challenging and learning should be supported by all stakeholders.
5.4 AID AGENCIES AND INVESTORS – DIRECT INVESTMENT TOWARDS CLEAN, OFF-GRID SOLUTIONS
Increasing electrification rates in PNG should represent an attractive opportunity for international aid programs and private investors. International aid agencies and investors can help ensure future electricity development efforts are most effective by:
– Directing increased funding towards programs that seek to develop remote off-grid capacity based on new energy technology – not diesel
– Ensuring that funding is also focused on securing affordable connections for poor households
– Targeting funds using models such as microfinance solutions or the purchase and ‘gifting’ of physical assets, as opposed to direct funding arrangements
There is an opportunity for investors to prioritise electricity solutions that ensure increased social access and allow for innovative off-grid solutions. Although significant central grid improvements and capacity additions are also needed, the opportunity presented by rural electrification in PNG must not be ignored.

ANZ INSIGHT / ISSUE 6, AUGUST 201538
5.5 INDUSTRIAL AND RESOURCE SECTOR – HELP RESOLVE THE INTEGRATION CHALLENGE
Integrating resource sector projects within PNG’s broader electrification program may not be easy but the long-term payoffs for those who seek to broaden already positive contributions to their local communities – and perhaps communities elsewhere on the PNG power grid – are clear.
Section 3.5 identified some of the commercial and technical questions that need to be resolved and finding answers to these is part of the challenge.
In addition, actions that create or support the capabilities of local power authorities may be another high leverage, low-cost contribution to power system development. Existing power provision bodies suffer from a lack of organisational and human capital which damages outcomes across the system. Private entities might engage with this problem by supporting human capital development amongst the commercial and technical staff of IPPs or a number of other initiatives. Seeking out channels to do this appropriately may be a fruitful first step.
5.6 CONCLUDING THOUGHTS
The Asian Century presents significant opportunities for PNG – not only to claim a share of swelling Eastern fortunes but to improve the wellbeing of each of its citizens. These opportunities demand action supported by a concerted planning effort on behalf of local and international stakeholders and energy must be a point of focus.
PNG’s development challenge is significant and its solutions will be underpinned by sufficient and broad electricity access. With PNG’s development challenge being primarily rural, new delivery models capable of delivering access in economically and geographically challenging contexts are central to success. The funding model of PPL and the revenue pathways of the sector need to be examined carefully with support applied where needed rather than through circuitous cross-subsidies and constraints.
The extent of ongoing efforts to engender coordination between stakeholders and support national planning is heartening. With new models emerging for electricity provision now is the time to reassess PNG’s electricity approach. The size of the prize necessitates an immediate and focused evaluation, allowing PNG to set a course for decades to come.

POWERING PNG INTO THE ASIAN CENTURY 39
APPENDIX 1: METHODOLOGY
APPENDIX 1.1: CALCULATING ELECTRICITY DEMAND
Electricity demand is calculated in three broad sets: resource sector, commercial and industrial (C&I) and residential:
– Resource industry: resource sector energy use such as mining
– Commercial and industrial
– On-grid: non-resource sector commercial and industrial use on the grid
– Off-grid: non-resource sector commercial and industrial use not on the grid, mostly in urban centres or towns
– Residential
– Urban on-grid: residential use on the grid in areas such as Port Moresby
– Rural on-grid: residential use in rural areas close enough to the grid to connect, for example outside urban centres in the highlands
– Urban off-grid (Provincial): residential use in large population centres outside grid range
– Rural off-grid (Village): residential use in rural areas outside grid range
The demand model uses many inputs from various sources. However, this methodology section is intended to provide an overview of the general modelling process and as such does not outline all assumptions or inputs.
Resource Industry consumption Resource industry demand is modelled using GDP and an intensity per dollar GDP figure. Two key assumptions underlie the model:
– The vast majority of non-PPL recorded electricity consumption in PNG in 2014 was from resource industry activity. Current demand in the resource sector is determined using the difference between PPL electricity sales and overall electricity consumption in PNG. This figure is then combined with resource sector contribution to GDP to build an electricity intensity per unit GDP figure. This figure – 0.9kWh/US$GDP – is high and as such changes in assumptions regarding the resource sector are significant for overall energy demand.
– The contribution of mining and resources to PNG’s GDP will remain relatively constant. Real mining and non-mining GDP is modelled to 2030 using a constant split from 2014. The contribution of mining to GDP in 2014 was 13.6% and as such mining is modelled as remaining highly significant to GDP. Mining contribution to GDP could evolve in a number of ways, including rising to make up a much larger share of GDP or falling as non-mining economic activity picks up.
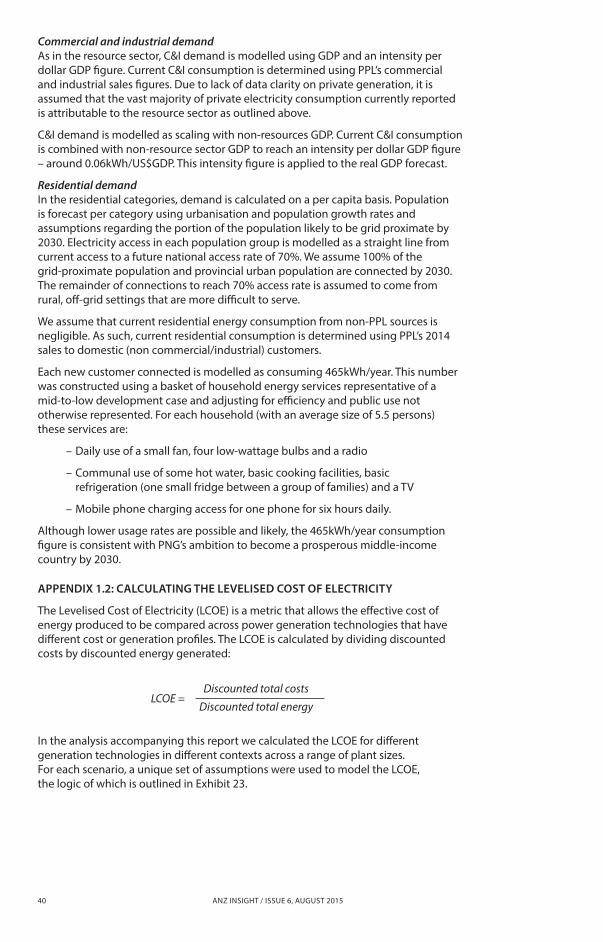
ANZ INSIGHT / ISSUE 6, AUGUST 201540
Commercial and industrial demand As in the resource sector, C&I demand is modelled using GDP and an intensity per dollar GDP figure. Current C&I consumption is determined using PPL’s commercial and industrial sales figures. Due to lack of data clarity on private generation, it is assumed that the vast majority of private electricity consumption currently reported is attributable to the resource sector as outlined above.
C&I demand is modelled as scaling with non-resources GDP. Current C&I consumption is combined with non-resource sector GDP to reach an intensity per dollar GDP figure – around 0.06kWh/US$GDP. This intensity figure is applied to the real GDP forecast.
Residential demand In the residential categories, demand is calculated on a per capita basis. Population is forecast per category using urbanisation and population growth rates and assumptions regarding the portion of the population likely to be grid proximate by 2030. Electricity access in each population group is modelled as a straight line from current access to a future national access rate of 70%. We assume 100% of the grid-proximate population and provincial urban population are connected by 2030. The remainder of connections to reach 70% access rate is assumed to come from rural, off-grid settings that are more difficult to serve.
We assume that current residential energy consumption from non-PPL sources is negligible. As such, current residential consumption is determined using PPL’s 2014 sales to domestic (non commercial/industrial) customers.
Each new customer connected is modelled as consuming 465kWh/year. This number was constructed using a basket of household energy services representative of a mid-to-low development case and adjusting for efficiency and public use not otherwise represented. For each household (with an average size of 5.5 persons) these services are:
– Daily use of a small fan, four low-wattage bulbs and a radio
– Communal use of some hot water, basic cooking facilities, basic refrigeration (one small fridge between a group of families) and a Tv
– Mobile phone charging access for one phone for six hours daily.
Although lower usage rates are possible and likely, the 465kWh/year consumption figure is consistent with PNG’s ambition to become a prosperous middle-income country by 2030.
APPENDIX 1.2: CALCULATING THE LEVELISED COST OF ELECTRICITY
The Levelised Cost of Electricity (LCOE) is a metric that allows the effective cost of energy produced to be compared across power generation technologies that have different cost or generation profiles. The LCOE is calculated by dividing discounted costs by discounted energy generated:
In the analysis accompanying this report we calculated the LCOE for different generation technologies in different contexts across a range of plant sizes. For each scenario, a unique set of assumptions were used to model the LCOE, the logic of which is outlined in Exhibit 23.
LCOE =Discounted total costs
Discounted total energy

POWERING PNG INTO THE ASIAN CENTURY 41
Exhibit 23 LEVELISED COST OF ELECTRICITY CALCULATION METHODOLOGY
A range of sources were used to develop the inputs for each variable listed in the above model, which vary depending on which scenario is being modelled. Some inputs, such as installation costs and fuel efficiency (used to calculate fuel costs), are non-linear functions whose values depend on another variable, usually capacity. Exhibit 24 illustrates the relationship between capacity and installation cost and between capacity and efficiency.
Exhibit 24 INSTALLATION COST AND GENERATOR EFFICIENCY VERSUS CAPACITY
Plant capacity is a key driver of levelised cost, as evidenced in the above Exhibits. As such the LCOE for each technology and scenario was calculated over a range of appropriate capacity sizes using the methodology in Exhibit 23. The LCOE curves for cost versus capacity in Chapter 3 are the primary output from this analysis.
LCOE ($/kWh)
Discounted total costs ($)
Discounted total energy (kWh)
Discount factor (% p.a.)
Initial capital ($)
Total O&M ($)
Lifespan (years)
Fixed O&M ($/year)
($/year)
Variable O&M
Cost per kW ($/kW)
($/ kW)
Capacity (kW)
Cost per kW
Capacity (kW)
Cost per unit energy ($/ kWh)
Annual energy (kWh)
Capacity (kW)
Capacity factor (%)
Annual energy (kWh)
Hours in the year (h)
+
+
+
+
0
5,000
10,000
15,000
20,000
25,000
0 50 100 150 200
Hydro electric plant installation cost versus capacity US$ per kW
Capacity (MW)
ADB pre-feasibility study estimates
Source: ADB Technical Assistance Consultant’s Report, Papua New Guinea: Power Sector Development Plan; http://grist.org/solar-power/2011-10-31-distributed-solar-power-gets-more-a�ordable/; http://emp.lbl.gov/sites/all/�les/lbnl-6858e%20Data%20�le.xls; GRI Technical Paper, Natural Gas Power Systems For The Distributed Generation Market
Existing micro-hydro installations in PNG
Gas turbine generator e�ciency versus capacity Lower heating value (%)
Capacity (MW)
0%
10%
20%
30%
40%
50%
60%
0 5 10 15 20 25
CCGT
OCGT
Installation Cost and Generator E�ciency Versus Capacity
Source: ADB Technical Assistance Consultant’s Report, ‘Papua New Guinea: Power Sector Development Plan’; GRI Technical Paper, ‘Natural gas power systems for the distributed generation market’
Hydro electric plant installation cost versus capacity US$ per kW
Gas turbine generator efficiency versus capacity Lower heating value (%)

ANZ INSIGHT / ISSUE 6, AUGUST 201542
APPENDIX 1.3: CALCULATING THE COST OF NEW CAPACITY
The cost of new capacity and operation is calculated cumulatively across the period between 2014 and 2030. Costs are identified in three groups – connection costs, installation costs and operation costs – and across four demand sources – on-grid hydro, on-grid non-hydro, off-grid provincial and remote rural. Specific generation types are selected for each category and as such LCOEs change with demand source. If demand sources change – for example if more demand comes from activity in provincial towns – costs will change as well, even if overall volume does not.
Connection costs are calculated using two sets of inputs – the costs of connections in rural and urban areas and the number of people to be connected in these areas. The latter inputs are sourced from the above demand modelling, while connection costs are taken from external sources.
Installation and operation costs are based on assumptions regarding the size of systems in any given setting. A default installation size is chosen per technology in each demand category, based on the technology itself and the average load size in that category. Costs are allocated based on the number of such systems needed to satisfy demand in any given category in 2030.
Operation costs are similarly differentiated by scenario, technology type and scale. Operation costs are modelled ramping up with demand in any given category, which is determined through the approach described above.
Although the technology types for demand sources change in different scenarios, on-grid hydro remains constant in both the default and new technologies scenarios.
The current institutions in PNG’s electricity sector are illustrated in Exhibit 25 and the role of each is described in Exhibit 26.
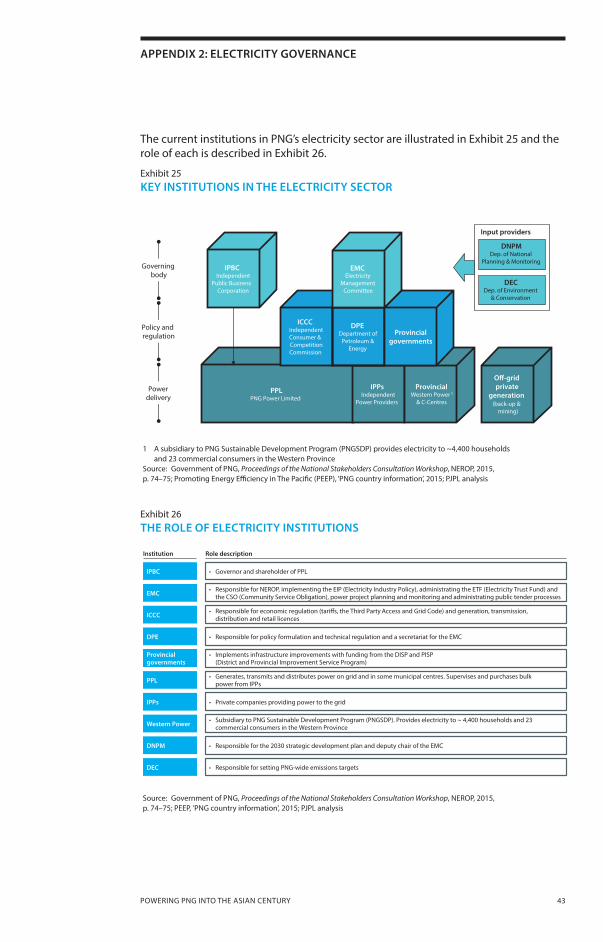
POWERING PNG INTO THE ASIAN CENTURY 43
APPENDIX 2: ELECTRICITY GOVERNANCE
The current institutions in PNG’s electricity sector are illustrated in Exhibit 25 and the role of each is described in Exhibit 26.
Exhibit 25 KEY INSTITUTIONS IN THE ELECTRICITY SECTOR
Exhibit 26 THE ROLE OF ELECTRICITY INSTITUTIONS
Key Institutions in the Electricity Sector
Source: Government of PNG, Proceedings of the National Stakeholders’ Consultation Workshop (NEROP), 2015, p.74-75; PEEP PNG country information, 2015; PJPL analysis
1 A subsidiary to PNG Sustainable Development Program (PNGSDP) provides electricity to ~4,400 households and 23 commercial consumers in Western Province
PPL PNG Power Limited
IPPs Independent
Power Providers
Provincial Western Power 1
& C-Centres
O�-grid private
generation (back-up &
mining)
ICCC Independent Consumer & Competition Commission
DPE Department of Petroleum &
Energy
Provincial governments
Governing body
IPBC Independent
Public Business Corporation
EMC Electricity
Management Committee
Policy and regulation
Power delivery
Input providers
DEC Dep. of Environment
& Conservation
DNPM Dep. of National
Planning & Monitoring
1 A subsidiary to PNG Sustainable Development Program (PNGSDP) provides electricity to ~4,400 households and 23 commercial consumers in the Western Province Source: Government of PNG, Proceedings of the National Stakeholders Consultation Workshop, NEROP, 2015, p. 74–75; Promoting Energy Efficiency in The Pacific (PEEP), ‘PNG country information’, 2015; PJPL analysis
Source: Government of PNG, Proceedings of the National Stakeholders Consultation Workshop, NEROP, 2015, p. 74–75; PEEP, 'PNG country information', 2015; PJPL analysis
THE ROLE OF ELECTRICITY INSTITUTIONS
Institution Role description
IPBC • Governor and shareholder of PPL
ICCC • Responsible for economic regulation (tari�s, the Third Party Access and Grid Code) and generation, transmission, distribution and retail licences
EMC • Responsible for NEROP, implementing the EIP (Electricity Industry Policy), administrating the ETF (Electricity Trust Fund) and the CSO (Community Service Obligation), power project planning and monitoring and administrating public tender processes
DPE • Responsible for policy formulation and technical regulation and a secretariat for the EMC
Provincial governments
• Implements infrastructure improvements with funding from the DISP and PISP (District and Provincial Improvement Service Program)
PPL • Generates, transmits and distributes power on grid and in some municipal centres. Supervises and purchases bulk power from IPPs
IPPs • Private companies providing power to the grid
Western Power • Subsidiary to PNG Sustainable Development Program (PNGSDP). Provides electricity to ~ 4,400 households and 23 commercial consumers in the Western Province
DNPM • Responsible for the 2030 strategic development plan and deputy chair of the EMC
DEC • Responsible for setting PNG-wide emissions targets
Source: Government of PNG, Proceedings of the National Stakeholders’ Consultation Workshop (NEROP), 2015, p.74-75, p.74-75; PEEP PNG country information, 2015; PJPL analysis

ANZ INSIGHT / ISSUE 6, AUGUST 201544
ABOUT PORT JACKSON PARTNERS
Port Jackson Partners is a leading Australian strategy consulting firm trusted by CEOs, Boards and senior managers to advise on their most critical business challenges and help them set corporate direction, define business strategies, resolve important commercial issues and shape organisations in order to transform performance and enhance value.
ABOUT THE AUTHOR
Grant Mitchell is a Director of Port Jackson Partners. Grant solves strategic problems for the Boards and CEOs of Australia’s leading companies in the resources, agriculture, transport, financial services and energy sectors, among others. Grant also authored ANZ’s 2013 insight report Bold Thinking: Imagining PNG in the Asian Century.
Richard McKeon and Zoe Whitton from Port Jackson Partners and Anne Ramskov from Quartz + Co, performed much of the research and created the analyses that underpin this report.
HOLLY WALES
The illustrations in this report are the work of artist Holly Wales.
FOR MORE INFORMATION
The ANZ insight series is an initiative of ANZ Corporate Communications.
For further information contact:
Paul Edwards Group General Manager Corporate Communications ANZ Level 10, 833 Collins Street Melbourne victoria 3008 Australia
Email: [email protected]

POWERING PNG INTO THE ASIAN CENTURY

AUSTRALIA AND NEW ZEALAND BANKING GROUP LIMITED ABN 11 005 357 522
www.bluenotes.anz.com