Embed Size (px)
Citation preview
Global Markets – Asia Team :
Paul Gruenwald Chief Economist, Asia +65 6216 1814 [email protected]
Tamara Henderson Director, Currency and Rates Strategy +65 6216 1845 [email protected]
Chang Wei Liang Analyst, Economic Research +65 6216 1838 [email protected]
Research Interns:
Chong Jun Jie
Vimal Balasubramaniam
Zhou Hao
Naresh Navaratnaraja
3 February 2009
Emerging Asia Economics Monthly – February 2009
Our Vision:
For Economics & Markets Research to be the most respected, sought-after and commercially valued source of economics and markets research and information on Australia, New Zealand, the Pacific and Asia.
Highlights • Asian trade has taken a direct hit from the global recession. All
economies in our report now have negative year-on-year export growth. The NIEs have been hit hardest.
• There does appear to be some domestic demand in the region. While industrial production has fallen in tandem with exports, a few economies (China, India, Indonesia, the Philippines) are holding onto respectable consumption momentum. Will it last?
• 2009 will be a sub-par year for the region. Moreover, there is little to be done in the near term except to nurture whatever domestic demand there is, including by using fiscal stimulus, and to wait for a recovery in the advanced economies.
• USD-AXJ will remain in an uptrend, but the momentum should slow. MYR, SGD and TWD are seen as under-performers as the currencies with large export exposures play catch-up. CNY will continue to tread water.
• Emerging Asian rates should out-perform US counterparts. Many Asian central banks still have ample monetary policy ammunition and stronger government finances means supply is less of a concern. IDR rates are our favourite market.
Table of Contents Feature Article: Is “Hot Money” Leaving China? 2
FX and Rates Strategy Overview: New Year, Similar Story 5
FX and Policy Rate Forecasts …………………………………………………. 6
FX Cross Rate Forecasts …………………………………………………………. 7
Long-Term Foreign Currency Government Bond Ratings … 8
Sovereign CDS Spreads ………………………………………………………….. 8
Country Updates & FX and Rates Strategy:
• China……………………………………………………………………………………. 9
• Hong Kong……………………………………………………………………………. 11
• India……………………………………………………………………………………… 13
• Indonesia……………………………………………………………………………… 15
• Malaysia……………………………………………………………………………….. 17
• Philippines……………………………………………………………………………. 19
• Singapore…………………………………………………………………………….. 21
• South Korea…………………………………………………………………………. 23
• Taiwan…..…………………………………………………………………………….. 25
• Thailand………………………………………………………………………………… 27
• Vietnam………………………………………………………………………………… 29
Emerging Asia Economics Monthly – February 2009
Page 2
Feature Article: Is “Hot Money” Leaving China?
This article investigates the recent evolution of Chinese official reserves, including the noticeable slowing of the rate of increase in late 2008. We conclude that short-term capital or “hot money” outflows emerged in Q4. These outflows coincide with a marked shift in USD-CNY expectations on-shore as well as those expressed in the non-deliverable forward market. However, the size of these outflows is currently too small to pose a balance of payments threat and we see no change in exchange rate policy as a result of recent developments.
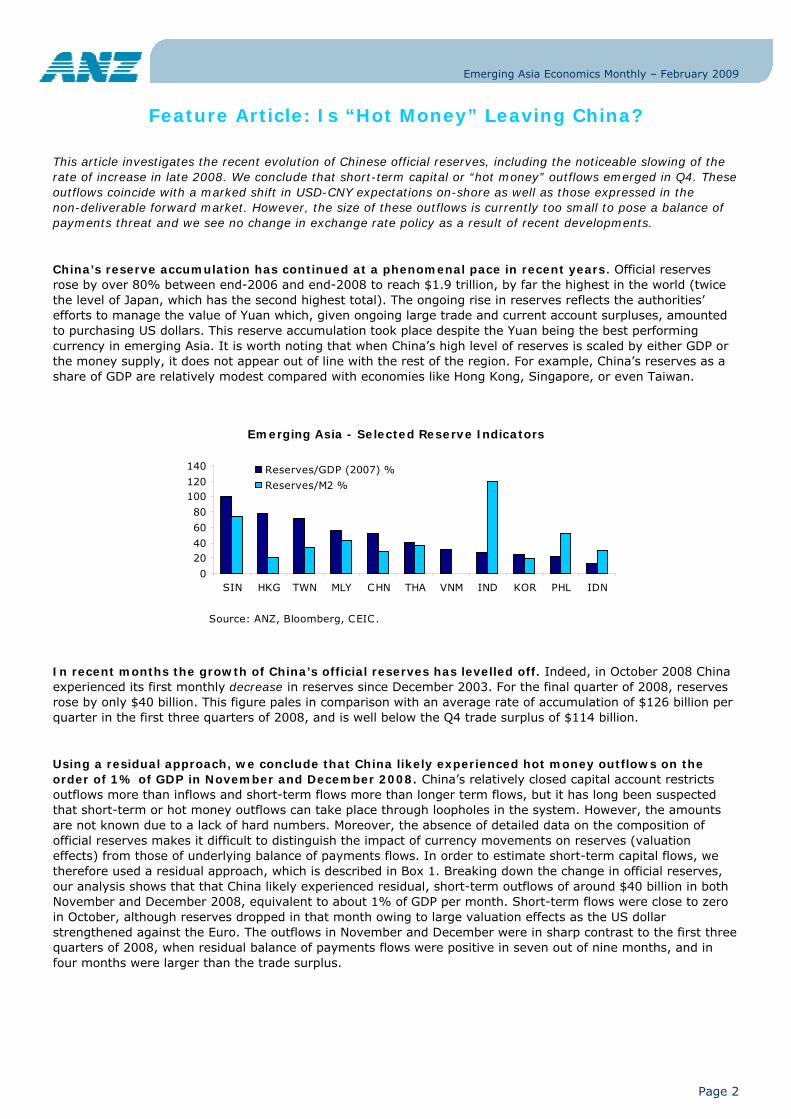
China’s reserve accumulation has continued at a phenomenal pace in recent years. Official reserves rose by over 80% between end-2006 and end-2008 to reach $1.9 trillion, by far the highest in the world (twice the level of Japan, which has the second highest total). The ongoing rise in reserves reflects the authorities’ efforts to manage the value of Yuan which, given ongoing large trade and current account surpluses, amounted to purchasing US dollars. This reserve accumulation took place despite the Yuan being the best performing currency in emerging Asia. It is worth noting that when China’s high level of reserves is scaled by either GDP or the money supply, it does not appear out of line with the rest of the region. For example, China’s reserves as a share of GDP are relatively modest compared with economies like Hong Kong, Singapore, or even Taiwan.
Emerging Asia - Selected Reserve Indicators
0
2040
60
80
100120
140
SIN HKG TWN MLY CHN THA VNM IND KOR PHL IDN
Reserves/GDP (2007) %
Reserves/M2 %
Source: ANZ, Bloomberg, CEIC.
In recent months the growth of China’s official reserves has levelled off. Indeed, in October 2008 China experienced its first monthly decrease in reserves since December 2003. For the final quarter of 2008, reserves rose by only $40 billion. This figure pales in comparison with an average rate of accumulation of $126 billion per quarter in the first three quarters of 2008, and is well below the Q4 trade surplus of $114 billion.
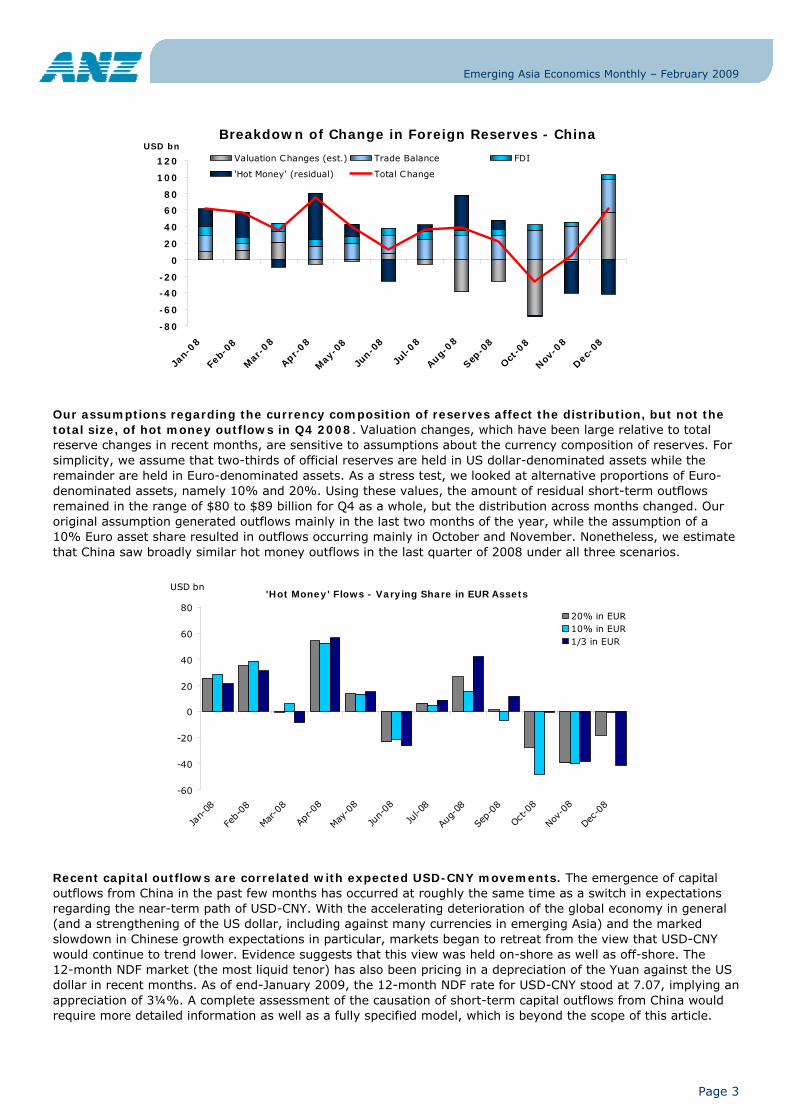
Using a residual approach, we conclude that China likely experienced hot money outflows on the order of 1% of GDP in November and December 2008. China’s relatively closed capital account restricts outflows more than inflows and short-term flows more than longer term flows, but it has long been suspected that short-term or hot money outflows can take place through loopholes in the system. However, the amounts are not known due to a lack of hard numbers. Moreover, the absence of detailed data on the composition of official reserves makes it difficult to distinguish the impact of currency movements on reserves (valuation effects) from those of underlying balance of payments flows. In order to estimate short-term capital flows, we therefore used a residual approach, which is described in Box 1. Breaking down the change in official reserves, our analysis shows that that China likely experienced residual, short-term outflows of around $40 billion in both November and December 2008, equivalent to about 1% of GDP per month. Short-term flows were close to zero in October, although reserves dropped in that month owing to large valuation effects as the US dollar strengthened against the Euro. The outflows in November and December were in sharp contrast to the first three quarters of 2008, when residual balance of payments flows were positive in seven out of nine months, and in four months were larger than the trade surplus.
Emerging Asia Economics Monthly – February 2009
Page 3
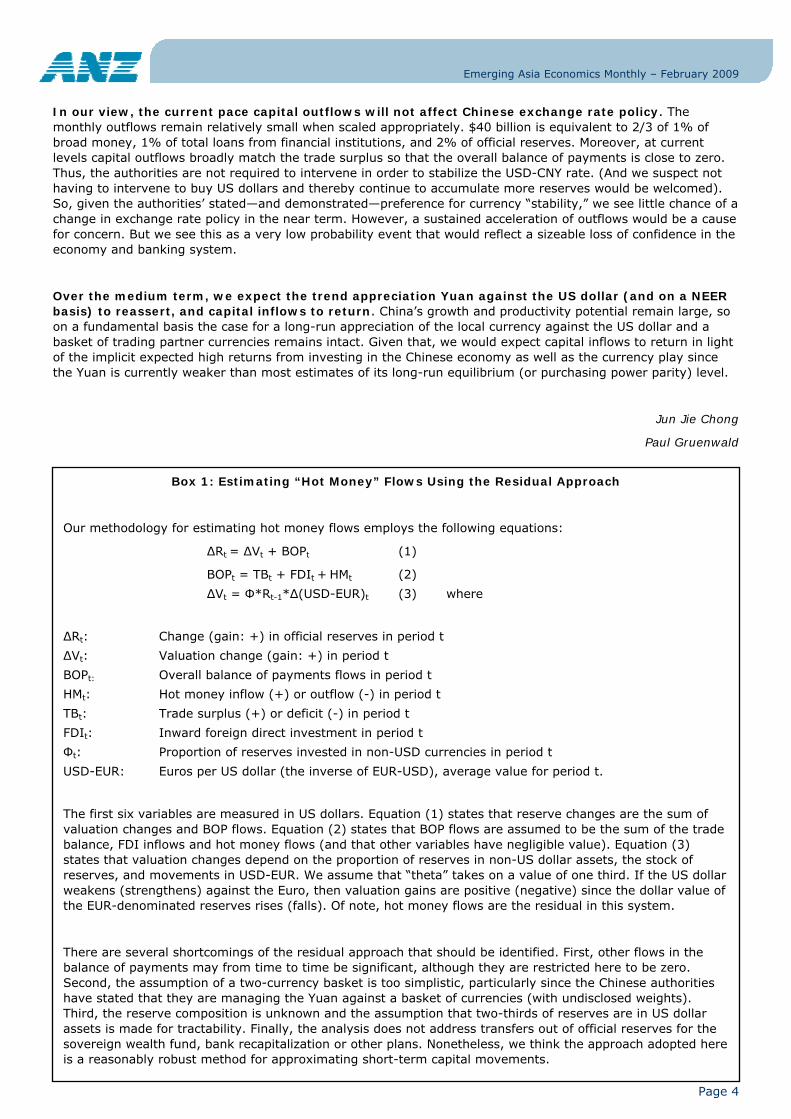
Our assumptions regarding the currency composition of reserves affect the distribution, but not the total size, of hot money outflows in Q4 2008. Valuation changes, which have been large relative to total reserve changes in recent months, are sensitive to assumptions about the currency composition of reserves. For simplicity, we assume that two-thirds of official reserves are held in US dollar-denominated assets while the remainder are held in Euro-denominated assets. As a stress test, we looked at alternative proportions of Euro-denominated assets, namely 10% and 20%. Using these values, the amount of residual short-term outflows remained in the range of $80 to $89 billion for Q4 as a whole, but the distribution across months changed. Our original assumption generated outflows mainly in the last two months of the year, while the assumption of a 10% Euro asset share resulted in outflows occurring mainly in October and November. Nonetheless, we estimate that China saw broadly similar hot money outflows in the last quarter of 2008 under all three scenarios.
Recent capital outflows are correlated with expected USD-CNY movements. The emergence of capital outflows from China in the past few months has occurred at roughly the same time as a switch in expectations regarding the near-term path of USD-CNY. With the accelerating deterioration of the global economy in general (and a strengthening of the US dollar, including against many currencies in emerging Asia) and the marked slowdown in Chinese growth expectations in particular, markets began to retreat from the view that USD-CNY would continue to trend lower. Evidence suggests that this view was held on-shore as well as off-shore. The 12-month NDF market (the most liquid tenor) has also been pricing in a depreciation of the Yuan against the US dollar in recent months. As of end-January 2009, the 12-month NDF rate for USD-CNY stood at 7.07, implying an appreciation of 3¼%. A complete assessment of the causation of short-term capital outflows from China would require more detailed information as well as a fully specified model, which is beyond the scope of this article.
Breakdown of Change in Foreign Reserves - China
-80
-60
-40
-20
0
20
40
60
80
100
120
Jan-
08
Feb-
08
Mar
-08
Apr-08
May
-08
Jun-0
8
Jul-0
8
Aug-08
Sep-0
8
Oct-0
8
Nov-0
8
Dec-0
8
Valuation Changes (est.) Trade Balance FDI
'Hot Money' (residual) Total Change
USD bn
'Hot Money' Flows - Varying Share in EUR Assets
-60
-40
-20
0
20
40
60
80
Jan-
08
Feb-
08
Mar-0
8
Apr-0
8
May-0
8
Jun-
08
Jul-0
8
Aug-
08
Sep-
08
Oct-0
8
Nov-0
8
Dec-0
8
20% in EUR10% in EUR1/3 in EUR
USD bn
Emerging Asia Economics Monthly – February 2009
Page 4
In our view, the current pace capital outflows will not affect Chinese exchange rate policy. The monthly outflows remain relatively small when scaled appropriately. $40 billion is equivalent to 2/3 of 1% of broad money, 1% of total loans from financial institutions, and 2% of official reserves. Moreover, at current levels capital outflows broadly match the trade surplus so that the overall balance of payments is close to zero. Thus, the authorities are not required to intervene in order to stabilize the USD-CNY rate. (And we suspect not having to intervene to buy US dollars and thereby continue to accumulate more reserves would be welcomed). So, given the authorities’ stated—and demonstrated—preference for currency “stability,” we see little chance of a change in exchange rate policy in the near term. However, a sustained acceleration of outflows would be a cause for concern. But we see this as a very low probability event that would reflect a sizeable loss of confidence in the economy and banking system.
Over the medium term, we expect the trend appreciation Yuan against the US dollar (and on a NEER basis) to reassert, and capital inflows to return. China’s growth and productivity potential remain large, so on a fundamental basis the case for a long-run appreciation of the local currency against the US dollar and a basket of trading partner currencies remains intact. Given that, we would expect capital inflows to return in light of the implicit expected high returns from investing in the Chinese economy as well as the currency play since the Yuan is currently weaker than most estimates of its long-run equilibrium (or purchasing power parity) level.
Jun Jie Chong
Paul Gruenwald
Overview: FX and Rates Strategy in 2009
Box 1: Estimating “Hot Money” Flows Using the Residual Approach
Our methodology for estimating hot money flows employs the following equations:
ΔRt = ΔVt + BOPt (1)
BOPt = TBt + FDIt + HMt (2)
ΔVt = Ф*Rt-1*Δ(USD-EUR)t (3) where
ΔRt: Change (gain: +) in official reserves in period t
ΔVt: Valuation change (gain: +) in period t
BOPt: Overall balance of payments flows in period t
HMt: Hot money inflow (+) or outflow (-) in period t
TBt: Trade surplus (+) or deficit (-) in period t
FDIt: Inward foreign direct investment in period t
Фt: Proportion of reserves invested in non-USD currencies in period t
USD-EUR: Euros per US dollar (the inverse of EUR-USD), average value for period t.
The first six variables are measured in US dollars. Equation (1) states that reserve changes are the sum of valuation changes and BOP flows. Equation (2) states that BOP flows are assumed to be the sum of the trade balance, FDI inflows and hot money flows (and that other variables have negligible value). Equation (3) states that valuation changes depend on the proportion of reserves in non-US dollar assets, the stock of reserves, and movements in USD-EUR. We assume that “theta” takes on a value of one third. If the US dollar weakens (strengthens) against the Euro, then valuation gains are positive (negative) since the dollar value of the EUR-denominated reserves rises (falls). Of note, hot money flows are the residual in this system.
There are several shortcomings of the residual approach that should be identified. First, other flows in the balance of payments may from time to time be significant, although they are restricted here to be zero. Second, the assumption of a two-currency basket is too simplistic, particularly since the Chinese authorities have stated that they are managing the Yuan against a basket of currencies (with undisclosed weights). Third, the reserve composition is unknown and the assumption that two-thirds of reserves are in US dollar assets is made for tractability. Finally, the analysis does not address transfers out of official reserves for the sovereign wealth fund, bank recapitalization or other plans. Nonetheless, we think the approach adopted here is a reasonably robust method for approximating short-term capital movements.
Emerging Asia Economics Monthly – February 2009
Page 5
FX and Rates Strategy Overview:
New Year, Similar Story
Market Outlook In 2009, markets will be hoping for signs of a trough in the global downturn. Until then, risk appetite will remain suppressed amid protracted volatility, which will support rates markets and keep the currencies in emerging Asia under pressure. Although we expect the uptrend in USD-AXJ to remain intact in H1, the momentum should slow as aggressive fiscal and monetary policy responses from around the globe will be expected to eventually start to bear fruit.
FX Strategy In 2008, the currencies of countries with current account deficits or small surpluses — Korea, India, Indonesia, the Philippines and Thailand — led emerging Asia lower versus the US dollar. In 2009, the currencies of countries with large export exposures — Malaysia, Singapore and Taiwan — are expected to feel the heat, albeit less so given that these are tightly managed currencies.
As we also believe that the peak in USD-KRW and USD-INR has already occurred (near 1500 and 50, respectively), these currencies are strong candidates for out-performance against the Malaysian ringgit, Singapore dollar, and Taiwan dollar—all of which have yet to trough in our view. In January, this theme was already playing out in the case of the Indian rupee, but not so for the Korean won, which remains beset by sharp volatility.
Turning to the Chinese Yuan, speculation about a possible devaluation has intensified in the wake of painful Q4 data and rhetoric from Obama’s Treasury Secretary Geithner, with twelve-month NDFs indicating expectations for a devaluation of 3%. However, we continue to believe that the authorities will prefer to reap the long-term political gains from USD-CNY stability, especially since economic gains from a devaluation would be short-lived at best. Notably, during the Asian crisis in 1997/98, the authorities kept the CNY steady amid sharply weaker currencies in the rest of the region.
• Corporates should hedge MYR, SGD and TWD export exposures and balance sheet risk.
• Real money funds with AXJ allocations should under-weight MYR, SGD and TWD.
• Leveraged funds should take advantage of dips to buy USD-MYR, USD-SGD, and USD-TWD forward outright.
Rates Strategy Central banks in much of emerging Asia have already cut policy rates aggressively, but unlike the US Federal Reserve, many Asian central banks still have ample monetary “space” to ease further. Meanwhile, government finances in much of emerging Asia are sufficiently strong to absorb announced fiscal stimulus programmes, in contrast with US Treasuries which have become expensive and where concerns about supply have begun to weigh on the market.
Within emerging Asia, we are most bullish on IDR rates markets (currency hedged), anticipating out-performance within AXJ in 2009. We like IDR rates for three reasons: 1/ Bank Indonesia is only just getting started with rate cuts, whereas the rest of the region is beyond the half-way mark to say the least; 2/ Indonesia has enough surplus financing from 2008 to cover much of the 2009 budget, reducing worries about supply; and 3/ IDR bonds offer good value and attractive yields, having sold off massively during 2008.
• Real money funds with emerging Asia in their benchmark should increase the allocation in emerging Asia; others should increase off index allocations in emerging Asia. Duration extensions for Indonesia are recommended, but should be currency hedged. Specific MYR, SGD or TWD allocations should also be currency hedged.
• Leveraged funds should opt for receiver positions in emerging Asian rates.
Tamara Henderson
Emerging Asia Economics Monthly – February 2009
Page 6
Foreign Exchange and Policy Rate Forecasts
Current Mar 09 Jun 09 Sep 09 Dec 09 Mar 10 Jun 10
China USD/CNY, eop 6.838 6.84 6.84 6.84 6.84 6.84 6.84
AUD/CNY, eop 4.427 4.30 4.00 3.80 3.70 3.70 3.80
PBoC base lending rate 5.31 5.04 4.77 4.50 4.50 4.50 4.50
USD/HKD, eop 7.756 7.76 7.77 7.80 7.80 7.80 7.80
AUD/HKD, eop 5.015 4.90 4.50 4.40 4.20 4.20 4.40
Hong Kong
HKMA discount rate 0.50 0.50 0.25 0.25 0.25 0.50 1.00
India USD/INR, eop 48.99 49.0 49.0 48.0 48.0 47.0 47.0
AUD/INR, eop 31.68 30.9 28.4 26.9 25.9 25.4 26.3
RBI repo rate 5.50 5.00 4.50 4.00 4.00 4.00 4.50
Indonesia USD/IDR, eop 11,370 11,350 11,500 11,900 11,600 11,600 11,300
AUD/IDR, eop 7,347 7,200 6,700 6,700 6,300 6,300 6,300
BI rate 8.75 8.00 7.00 6.00 6.00 6.00 6.00
Malaysia USD/MYR, eop 3.61 3.64 3.74 3.80 3.80 3.80 3.75
AUD/MYR, eop 2.33 2.29 2.17 2.13 2.05 2.05 2.10
BNM overnight rate 2.50 2.00 1.50 1.00 1.00 1.00 1.00
Philippines USD/PHP, eop 47.36 47.5 48.5 49.3 49.5 49.5 48.8
AUD/PHP, eop 30.48 29.9 28.1 27.6 26.7 26.7 27.3
BSP reverse repo rate 5.00 4.75 4.25 4.00 4.00 4.00 4.00
Singapore USD/SGD, eop 1.51 1.54 1.58 1.62 1.66 1.66 1.63
AUD/SGD, eop 0.97 0.97 0.92 0.91 0.90 0.90 0.91
3M SGD SIBOR 0.65 0.65 0.55 0.55 0.65 0.75 0.95
S Korea USD/KRW, eop 1,383 1,375 1,400 1,400 1,375 1,350 1,325
AUD/KRW, eop 890 870 810 780 740 730 740
BoK overnight call rate 2.50 1.50 1.00 1.00 1.00 1.50 2.00
Taiwan USD/TWD, eop 33.69 34.2 35.2 36.0 36.0 35.5 35.0
AUD/TWD, eop 21.69 22.6 22.2 20.9 20.2 19.2 18.9
CBC discount rate 1.50 1.50 1.00 0.50 0.50 1.00 1.25
Thailand USD/THB, eop 34.92 35.8 37.6 39.4 39.4 38.8 38.8
AUD/THB, eop 22.54 22.6 21.8 22.1 21.3 21.0 21.7
BoT repo rate 2.00 1.50 1.00 0.50 0.50 0.50 0.50
Vietnam USD/VND, eop 17,484 17,500 17,800 18,100 18,500 18,500 18,000
AUD/VND, eop 11,324 11,000 10,300 10,100 10,000 10,000 10,100
SBV base lending rate 7.00 6.00 5.00 5.00 5.00 5.00 5.00
Emerging Asia Economics Monthly – February 2009
Page 7
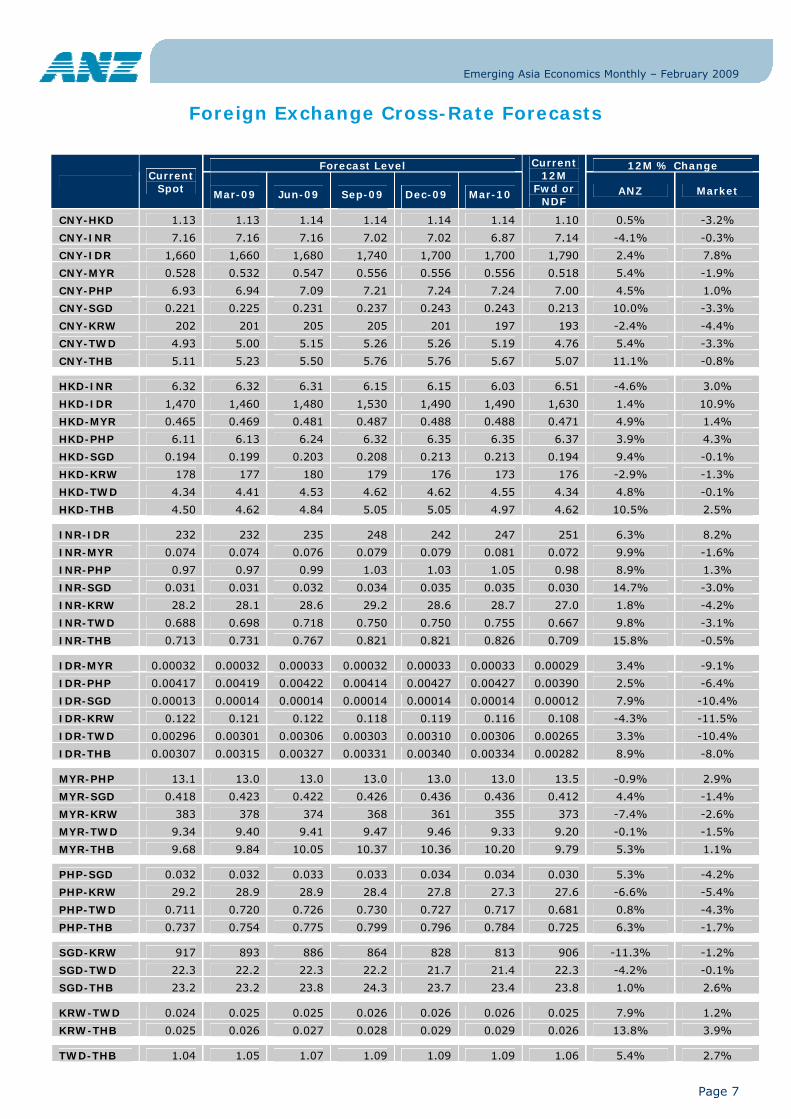
Foreign Exchange Cross-Rate Forecasts
Forecast Level 12M % Change
Current
Spot
Mar-09 Jun-09 Sep-09 Dec-09 Mar-10
Current 12M
Fwd or NDF
ANZ Market
CNY-HKD 1.13 1.13 1.14 1.14 1.14 1.14 1.10 0.5% -3.2%
CNY-INR 7.16 7.16 7.16 7.02 7.02 6.87 7.14 -4.1% -0.3%
CNY-IDR 1,660 1,660 1,680 1,740 1,700 1,700 1,790 2.4% 7.8%
CNY-MYR 0.528 0.532 0.547 0.556 0.556 0.556 0.518 5.4% -1.9%
CNY-PHP 6.93 6.94 7.09 7.21 7.24 7.24 7.00 4.5% 1.0%
CNY-SGD 0.221 0.225 0.231 0.237 0.243 0.243 0.213 10.0% -3.3%
CNY-KRW 202 201 205 205 201 197 193 -2.4% -4.4%
CNY-TWD 4.93 5.00 5.15 5.26 5.26 5.19 4.76 5.4% -3.3%
CNY-THB 5.11 5.23 5.50 5.76 5.76 5.67 5.07 11.1% -0.8% HKD-INR 6.32 6.32 6.31 6.15 6.15 6.03 6.51 -4.6% 3.0%
HKD-IDR 1,470 1,460 1,480 1,530 1,490 1,490 1,630 1.4% 10.9%
HKD-MYR 0.465 0.469 0.481 0.487 0.488 0.488 0.471 4.9% 1.4%
HKD-PHP 6.11 6.13 6.24 6.32 6.35 6.35 6.37 3.9% 4.3%
HKD-SGD 0.194 0.199 0.203 0.208 0.213 0.213 0.194 9.4% -0.1%
HKD-KRW 178 177 180 179 176 173 176 -2.9% -1.3%
HKD-TWD 4.34 4.41 4.53 4.62 4.62 4.55 4.34 4.8% -0.1%
HKD-THB 4.50 4.62 4.84 5.05 5.05 4.97 4.62 10.5% 2.5% INR-IDR 232 232 235 248 242 247 251 6.3% 8.2%
INR-MYR 0.074 0.074 0.076 0.079 0.079 0.081 0.072 9.9% -1.6%
INR-PHP 0.97 0.97 0.99 1.03 1.03 1.05 0.98 8.9% 1.3%
INR-SGD 0.031 0.031 0.032 0.034 0.035 0.035 0.030 14.7% -3.0%
INR-KRW 28.2 28.1 28.6 29.2 28.6 28.7 27.0 1.8% -4.2%
INR-TWD 0.688 0.698 0.718 0.750 0.750 0.755 0.667 9.8% -3.1%
INR-THB 0.713 0.731 0.767 0.821 0.821 0.826 0.709 15.8% -0.5% IDR-MYR 0.00032 0.00032 0.00033 0.00032 0.00033 0.00033 0.00029 3.4% -9.1%
IDR-PHP 0.00417 0.00419 0.00422 0.00414 0.00427 0.00427 0.00390 2.5% -6.4%
IDR-SGD 0.00013 0.00014 0.00014 0.00014 0.00014 0.00014 0.00012 7.9% -10.4%
IDR-KRW 0.122 0.121 0.122 0.118 0.119 0.116 0.108 -4.3% -11.5%
IDR-TWD 0.00296 0.00301 0.00306 0.00303 0.00310 0.00306 0.00265 3.3% -10.4%
IDR-THB 0.00307 0.00315 0.00327 0.00331 0.00340 0.00334 0.00282 8.9% -8.0% MYR-PHP 13.1 13.0 13.0 13.0 13.0 13.0 13.5 -0.9% 2.9%
MYR-SGD 0.418 0.423 0.422 0.426 0.436 0.436 0.412 4.4% -1.4%
MYR-KRW 383 378 374 368 361 355 373 -7.4% -2.6%
MYR-TWD 9.34 9.40 9.41 9.47 9.46 9.33 9.20 -0.1% -1.5%
MYR-THB 9.68 9.84 10.05 10.37 10.36 10.20 9.79 5.3% 1.1% PHP-SGD 0.032 0.032 0.033 0.033 0.034 0.034 0.030 5.3% -4.2%
PHP-KRW 29.2 28.9 28.9 28.4 27.8 27.3 27.6 -6.6% -5.4%
PHP-TWD 0.711 0.720 0.726 0.730 0.727 0.717 0.681 0.8% -4.3%
PHP-THB 0.737 0.754 0.775 0.799 0.796 0.784 0.725 6.3% -1.7% SGD-KRW 917 893 886 864 828 813 906 -11.3% -1.2%
SGD-TWD 22.3 22.2 22.3 22.2 21.7 21.4 22.3 -4.2% -0.1%
SGD-THB 23.2 23.2 23.8 24.3 23.7 23.4 23.8 1.0% 2.6% KRW-TWD 0.024 0.025 0.025 0.026 0.026 0.026 0.025 7.9% 1.2%
KRW-THB 0.025 0.026 0.027 0.028 0.029 0.029 0.026 13.8% 3.9% TWD-THB 1.04 1.05 1.07 1.09 1.09 1.09 1.06 5.4% 2.7%

Emerging Asia Economics Monthly – February 2009
Page 8
Long-Term Foreign Currency Government Bond Ratings
Moody's S&P Fitch
Investment Grade
China A1 A+ A+
Hong Kong Aa2 AA+ AA
India Baa2 BBB- BBB-
Korea A2 A A+
Malaysia A3 A- A-
Singapore Aaa AAA AAA
Taiwan Aa3 AA- A+
Thailand Baa1 BBB+ BBB+
Sub-Investment Grade
Cambodia B1 B+ NR
Indonesia Ba3 BB- BB
Philippines B1 BB- BB
Vietnam Ba3 BB BB-
*denotes an upgrade;
# denotes a downgrade over previous month
Source: Bloomberg
Sovereign CDS Spreads
Source: Bloomberg Source: Bloomberg
5Yr Sovereign CDS Spread (HY)
0
200
400
600
800
1000
1200
1400
Jan-08
Feb-08
Mar-08
Apr-08
May-08
Jun-08Jul-0
8
Aug-08
Sep-08Oct-0
8Nov-08
Dec-08Jan
-09
IndonesiaVietnamPhilippines
5Yr Sovereign CDS Spread (IG)
0
100
200
300
400
500
600
700
800
Jan-08
Feb-08
Mar-08
Apr-08
May-08
Jun-08Jul-0
8
Aug-08
Sep-08Oct-0
8
Nov-08
Dec-08
Jan-09
China
Malaysia
Thailand
Korea
Emerging Asia Economics Monthly – February 2009
Page 9
Country Update: China
Economic Data - China Monthly data May-08 Jun-08 Jul-08 Aug-08 Sep-08 Oct-08 Nov-08 Dec-08
Industrial Production, % y/y 16.0 16.0 14.7 12.8 11.4 8.2 5.4 5.7
Retail Sales, % y/y 21.6 23.0 23.3 23.2 23.2 22.0 20.8 19.0 Consumer Price Index, % y/y 7.7 7.1 6.3 4.9 4.6 4.0 2.4 1.2 Exports, % y/y 28.1 17.7 26.9 21.1 21.3 19.1 -2.2 -2.8 Imports, % y/y 40.1 31.2 33.6 22.9 20.9 15.4 -18.0 -21.3 Trade Balance, US$ bn 20.2 21.4 25.3 28.7 29.4 35.2 40.1 39.0 Foreign Exchange Reserves, US$ bn 1,797.0 1,808.8 1,845.2 1,884.2 1,905.6 1,879.7 1,884.7 1,946.0 Quarterly data Mar-07 Jun-07 Sep-07 Dec-07 Mar-08 Jun-08 Sep-08 Dec-08
Real GDP, % y/y 13.0 14.0 13.0 12.0 10.6 10.1 9.0 6.8 -Primary Sector ytd 4.4 4.0 4.3 3.7 2.8 3.5 4.5 5.5 -Secondary sector ytd 14.6 15.0 14.8 14.7 11.5 11.3 10.5 9.3 -Tertiary sector ytd 12.7 13.5 14.0 13.8 10.9 10.5 10.3 9.5 Nominal GDP, RMB tn 5.3 11.2 17.4 25.7 6.1 13.1 20.2 30.1 Current Account, US$ bn (semi- N/A 162.9 N/A 371.8 N/A 191.7 N/A N/A Capital Account, US$ bn (semi-annual) N/A 1.5 N/A 3.1 N/A 1.7 N/A N/A Source:CEIC
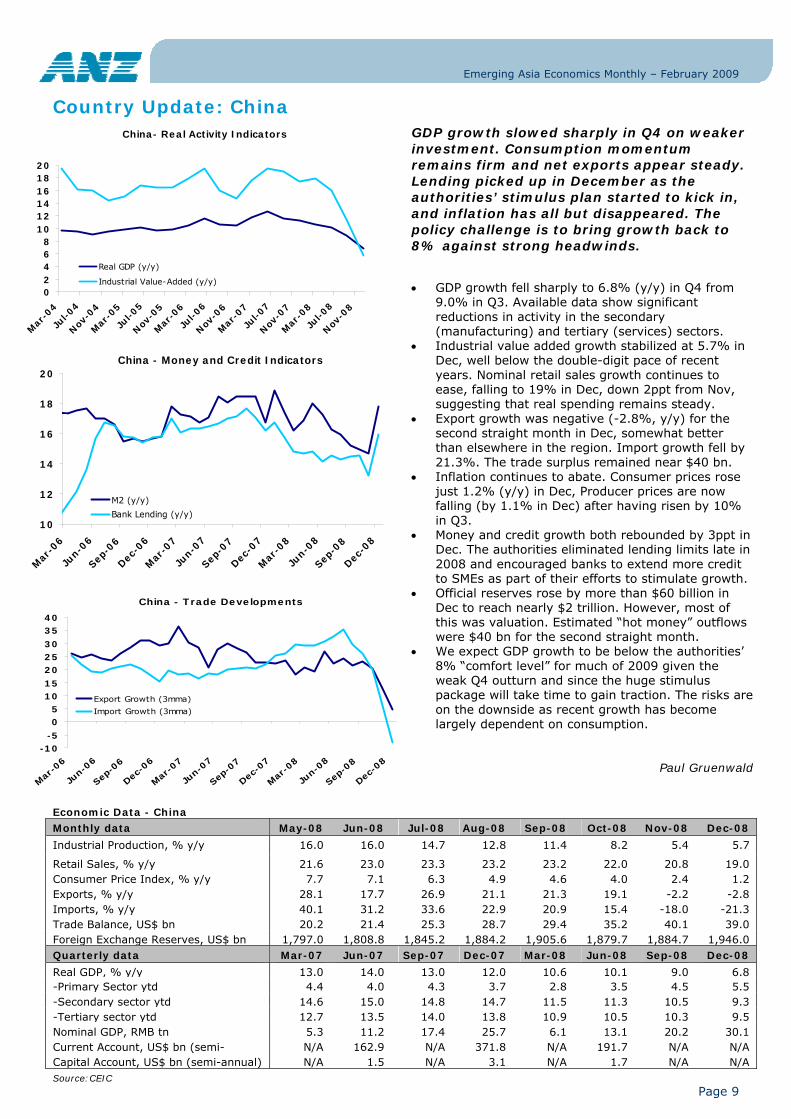
GDP growth slowed sharply in Q4 on weaker investment. Consumption momentum remains firm and net exports appear steady. Lending picked up in December as the authorities’ stimulus plan started to kick in, and inflation has all but disappeared. The policy challenge is to bring growth back to 8% against strong headwinds.
• GDP growth fell sharply to 6.8% (y/y) in Q4 from 9.0% in Q3. Available data show significant reductions in activity in the secondary (manufacturing) and tertiary (services) sectors.
• Industrial value added growth stabilized at 5.7% in Dec, well below the double-digit pace of recent years. Nominal retail sales growth continues to ease, falling to 19% in Dec, down 2ppt from Nov, suggesting that real spending remains steady.
• Export growth was negative (-2.8%, y/y) for the second straight month in Dec, somewhat better than elsewhere in the region. Import growth fell by 21.3%. The trade surplus remained near $40 bn.
• Inflation continues to abate. Consumer prices rose just 1.2% (y/y) in Dec, Producer prices are now falling (by 1.1% in Dec) after having risen by 10% in Q3.
• Money and credit growth both rebounded by 3ppt in Dec. The authorities eliminated lending limits late in 2008 and encouraged banks to extend more credit to SMEs as part of their efforts to stimulate growth.
• Official reserves rose by more than $60 billion in Dec to reach nearly $2 trillion. However, most of this was valuation. Estimated “hot money” outflows were $40 bn for the second straight month.
• We expect GDP growth to be below the authorities’ 8% “comfort level” for much of 2009 given the weak Q4 outturn and since the huge stimulus package will take time to gain traction. The risks are on the downside as recent growth has become largely dependent on consumption.
Paul Gruenwald
China- Real Activity Indicators
02468
101214161820
Mar
-04
Jul-0
4
Nov
-04
Mar
-05
Jul-0
5
Nov
-05
Mar
-06
Jul-0
6
Nov
-06
Mar
-07
Jul-0
7
Nov
-07
Mar
-08
Jul-0
8
Nov
-08
Real GDP (y/y)
Industrial Value-Added (y/y)
China - Money and Credit Indicators
10
12
14
16
18
20
Mar
-06
Jun-0
6
Sep-0
6
Dec-0
6
Mar
-07
Jun-0
7
Sep-0
7
Dec-0
7
Mar
-08
Jun-0
8
Sep-0
8
Dec-0
8
M2 (y/y)
Bank Lending (y/y)
China - Trade Developments
-10-5
05
1015
202530
3540
Mar
-06
Jun-0
6
Sep-0
6
Dec-0
6
Mar
-07
Jun-0
7
Sep-0
7
Dec-0
7
Mar
-08
Jun-0
8
Sep-0
8
Dec-0
8
Export Growth (3mma)
Import Growth (3mma)
Emerging Asia Economics Monthly – February 2009
Page 10
China: FX and Rates Strategy
Market Forecasts - China FX Current Ytd Mar-09 Jun-09 Sep-09 Dec-09 Mar-10 Jun-10
USD-CNY 6.838 0.2% 6.84 6.84 6.84 6.84 6.84 6.84 AUD-CNY 4.427 -7.7% 4.30 4.00 3.80 3.70 3.70 3.80 NZD-CNY 3.480 -11.9% 3.60 3.20 3.10 3.00 3.10 3.10 JPY-CNY 0.076 1.3% 0.070 0.068 0.068 0.067 0.065 0.063 EUR-CNY 8.828 -7.4% 8.55 8.21 7.66 7.39 7.39 7.52 Rates Current Ytd Mar-09 Jun-09 Sep-09 Dec-09 Mar-10 Jun-10
PBOC's 1-year base lending rate 5.31 0 5.04 4.77 4.50 4.50 4.50 4.50 3-month SHIBOR 1.39 -39 1.1 1.0 0.8 0.8 0.8 1.0 2-year IRS (onshore vs 7-day repo fix) 1.10 3 0.8 0.7 0.6 0.6 0.6 0.7 10-year IRS 2.28 49 2.2 2.1 2.1 2.1 2.1 2.1
Sources: ANZ and Bloomberg
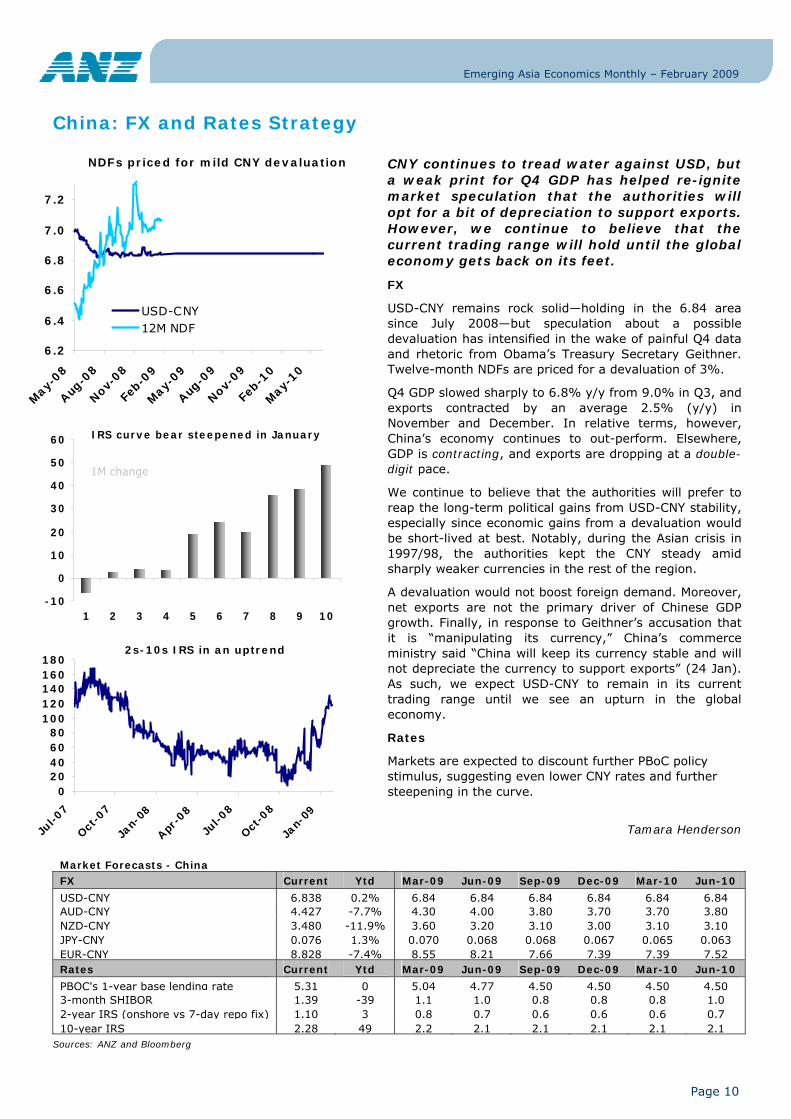
CNY continues to tread water against USD, but a weak print for Q4 GDP has helped re-ignite market speculation that the authorities will opt for a bit of depreciation to support exports. However, we continue to believe that the current trading range will hold until the global economy gets back on its feet.
FX
USD-CNY remains rock solid—holding in the 6.84 area since July 2008—but speculation about a possible devaluation has intensified in the wake of painful Q4 data and rhetoric from Obama’s Treasury Secretary Geithner. Twelve-month NDFs are priced for a devaluation of 3%.
Q4 GDP slowed sharply to 6.8% y/y from 9.0% in Q3, and exports contracted by an average 2.5% (y/y) in November and December. In relative terms, however, China’s economy continues to out-perform. Elsewhere, GDP is contracting, and exports are dropping at a double-digit pace.
We continue to believe that the authorities will prefer to reap the long-term political gains from USD-CNY stability, especially since economic gains from a devaluation would be short-lived at best. Notably, during the Asian crisis in 1997/98, the authorities kept the CNY steady amid sharply weaker currencies in the rest of the region.
A devaluation would not boost foreign demand. Moreover, net exports are not the primary driver of Chinese GDP growth. Finally, in response to Geithner’s accusation that it is “manipulating its currency,” China’s commerce ministry said “China will keep its currency stable and will not depreciate the currency to support exports” (24 Jan). As such, we expect USD-CNY to remain in its current trading range until we see an upturn in the global economy.
Rates
Markets are expected to discount further PBoC policy stimulus, suggesting even lower CNY rates and further steepening in the curve.
Tamara Henderson
NDFs priced for mild CNY devaluation
6.2
6.4
6.6
6.8
7.0
7.2
May-
08
Aug-0
8
Nov-08
Feb-0
9
May-
09
Aug-0
9
Nov-09
Feb-1
0
May
-10
USD-CNY12M NDF
IRS curve bear steepened in January
-10
0
10
20
30
40
50
60
1 2 3 4 5 6 7 8 9 10
1M change
2s-10s IRS in an uptrend
020406080
100120140160180
Jul-0
7
Oct-0
7
Jan-
08
Apr-0
8
Jul-0
8
Oct-0
8
Jan-
09
Emerging Asia Economics Monthly – February 2009
Page 11
Country Update: Hong Kong
Economic Data - Hong Kong Monthly data May-08 Jun-08 Jul-08 Aug-08 Sep-08 Oct-08 Nov-08 Dec-08
Retail Sales, % y/y 13.1 11.7 13.7 10.2 7.0 0.3 1.2 N/A Composite Consumer Price Index 5.6 6.1 6.3 4.5 3.1 1.7 3.1 2.1 Exports, % y/y 10.3 -0.6 11.1 1.9 3.6 9.4 -5.3 -11.4 Imports, % y/y 15.4 1.3 15.4 1.5 3.9 11.3 -7.9 -16.2 Trade Balance, US$ bn -3.5 -3.1 -2.5 -1.6 -2.1 -1.8 -1.1 -1.5 Foreign Exchange Reserves, US$ bn 154.2 152.1 153.3 153.2 153.7 149.3 160.5 178.1 Quarterly data Mar-07 Jun-07 Sep-07 Dec-07 Mar-08 Jun-08 Sep-08 Dec-08
Industrial Production, % y/y -1.6 -2.3 -2.0 -0.3 -4.4 -4.2 -6.7 N/A Real GDP, % y/y 5.5 6.2 6.8 6.9 7.3 4.2 1.7 N/A -Private consumption 4.5 6.6 10.6 9.5 7.9 3.2 0.2 N/A -Government consumption 2.3 3.0 1.5 2.3 0.3 3.0 2.3 N/A -Gross fixed capital formation 0.8 8.1 -0.5 8.2 9.9 3.5 3.0 N/A Nominal GDP, HKD bn 373.6 380.1 413.8 448.7 410.2 404.3 429.7 N/A Current Account, US$ bn 8.4 3.5 7.7 6.1 6.6 4.5 9.8 N/A Capital & Financial Account, US$ bn -10.2 -5.1 -9.6 -8.3 -4.3 -2.6 -11.9 N/A
Sources: Bloomberg, CEIC
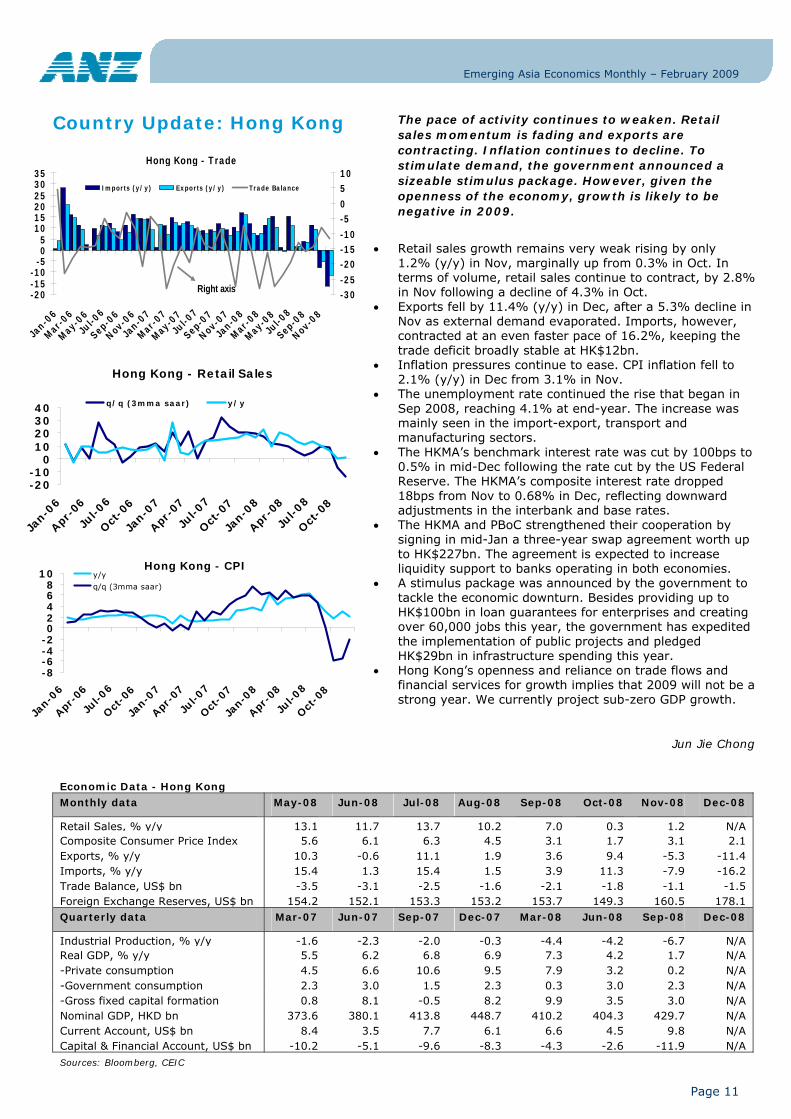
The pace of activity continues to weaken. Retail sales momentum is fading and exports are contracting. Inflation continues to decline. To stimulate demand, the government announced a sizeable stimulus package. However, given the openness of the economy, growth is likely to be negative in 2009.
• Retail sales growth remains very weak rising by only
1.2% (y/y) in Nov, marginally up from 0.3% in Oct. In terms of volume, retail sales continue to contract, by 2.8% in Nov following a decline of 4.3% in Oct.
• Exports fell by 11.4% (y/y) in Dec, after a 5.3% decline in Nov as external demand evaporated. Imports, however, contracted at an even faster pace of 16.2%, keeping the trade deficit broadly stable at HK$12bn.
• Inflation pressures continue to ease. CPI inflation fell to 2.1% (y/y) in Dec from 3.1% in Nov.
• The unemployment rate continued the rise that began in Sep 2008, reaching 4.1% at end-year. The increase was mainly seen in the import-export, transport and manufacturing sectors.
• The HKMA’s benchmark interest rate was cut by 100bps to 0.5% in mid-Dec following the rate cut by the US Federal Reserve. The HKMA’s composite interest rate dropped 18bps from Nov to 0.68% in Dec, reflecting downward adjustments in the interbank and base rates.
• The HKMA and PBoC strengthened their cooperation by signing in mid-Jan a three-year swap agreement worth up to HK$227bn. The agreement is expected to increase liquidity support to banks operating in both economies.
• A stimulus package was announced by the government to tackle the economic downturn. Besides providing up to HK$100bn in loan guarantees for enterprises and creating over 60,000 jobs this year, the government has expedited the implementation of public projects and pledged HK$29bn in infrastructure spending this year.
• Hong Kong’s openness and reliance on trade flows and financial services for growth implies that 2009 will not be a strong year. We currently project sub-zero GDP growth.
Jun Jie Chong
Hong Kong - CPI
-8-6-4-202468
10
Jan-0
6
Apr-0
6
Jul-0
6
Oct
-06
Jan-0
7
Apr-0
7
Jul-0
7
Oct
-07
Jan-0
8
Apr-0
8
Jul-0
8
Oct
-08
y/y
q/q (3mma saar)
Hong Kong - Trade
-20-15-10
-505
101520253035
Jan-0
6
Mar-06
May-06
Jul-0
6
Sep-06
Nov-06
Jan-0
7
Mar-07
May-07
Jul-0
7
Sep-07
Nov-07
Jan-0
8
Mar-08
May-08
Jul-0
8
Sep-08
Nov-08
-30-25
-20-15-10
-50
510
Imports (y/y) Exports (y/y) Trade Balance
Right axis
Hong Kong - Retail Sales
-20-10
010203040
Jan-0
6
Apr-0
6
Jul-0
6
Oct
-06
Jan-0
7
Apr-0
7
Jul-0
7
Oct
-07
Jan-0
8
Apr-0
8
Jul-0
8
Oct
-08
q/q (3mma saar) y/y
Emerging Asia Economics Monthly – February 2009
Page 12
Hong Kong: FX and Rates Strategy
Market Forecasts - Hong Kong FX Current Ytd (%) Mar-09 Jun-09 Sep-09 Dec-09 Mar-10 Jun-10
USD-HKD 7.756 0.1% 7.755 7.770 7.800 7.800 7.800 7.800 AUD-HKD 5.015 -7.9% 4.9 4.5 4.4 4.2 4.2 4.4 NZD-HKD 3.954 -11.9% 4.0 3.7 3.5 3.4 3.5 3.6 JPY-HKD 0.087 1.3% 0.079 0.078 0.077 0.076 0.074 0.072 EUR-HKD 9.997 -7.7% 9.7 9.3 8.7 8.4 8.4 8.6 Rates Current Ytd (bps) Mar-09 Jun-09 Sep-09 Dec-09 Mar-10 Jun-10
HKMA's discount rate 0.50 0 0.50 0.25 0.25 0.25 0.50 1.00 3-month HIBOR 0.95 0 0.8 0.7 0.7 0.8 1.1 1.3 2-year IRS (onshore vs 3M HIBOR) 1.47 -2 1.3 1.2 1.2 1.3 1.6 1.8 10-year IRS 2.36 43 2.3 2.3 2.3 2.3 2.4 2.5
Sources: ANZ, Bloomberg
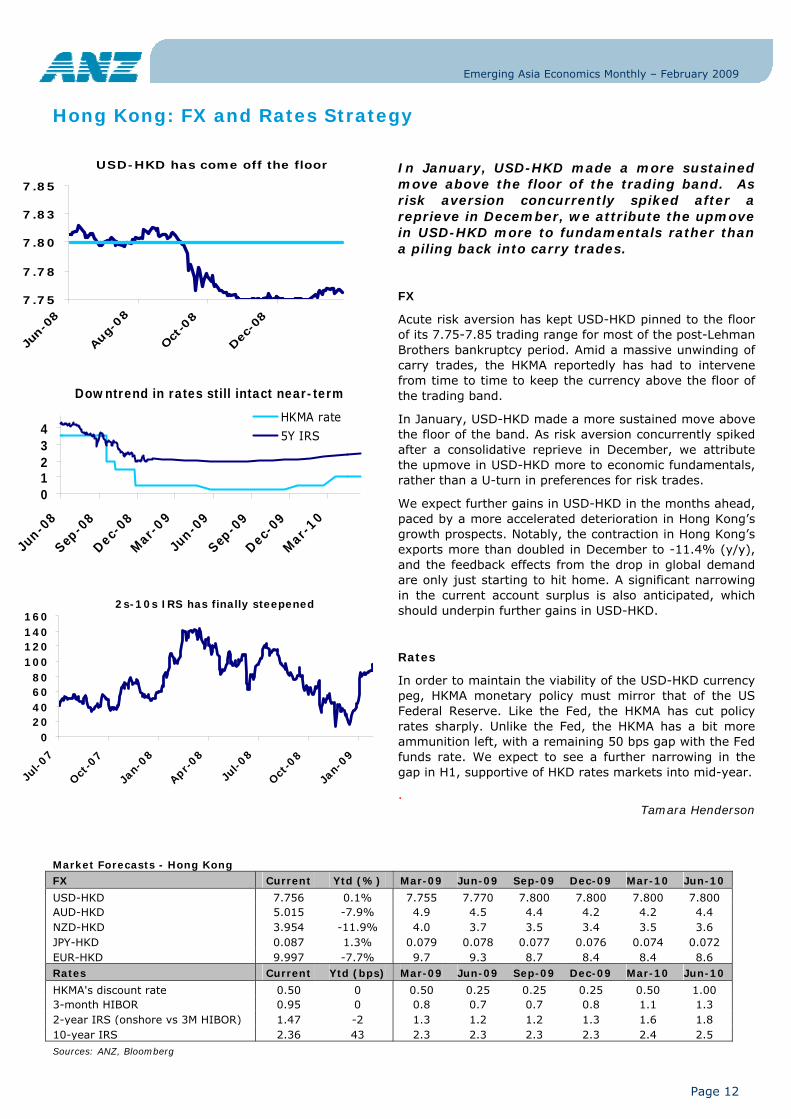
In January, USD-HKD made a more sustained move above the floor of the trading band. As risk aversion concurrently spiked after a reprieve in December, we attribute the upmove in USD-HKD more to fundamentals rather than a piling back into carry trades.
FX
Acute risk aversion has kept USD-HKD pinned to the floor of its 7.75-7.85 trading range for most of the post-Lehman Brothers bankruptcy period. Amid a massive unwinding of carry trades, the HKMA reportedly has had to intervene from time to time to keep the currency above the floor of the trading band.
In January, USD-HKD made a more sustained move above the floor of the band. As risk aversion concurrently spiked after a consolidative reprieve in December, we attribute the upmove in USD-HKD more to economic fundamentals, rather than a U-turn in preferences for risk trades.
We expect further gains in USD-HKD in the months ahead, paced by a more accelerated deterioration in Hong Kong’s growth prospects. Notably, the contraction in Hong Kong’s exports more than doubled in December to -11.4% (y/y), and the feedback effects from the drop in global demand are only just starting to hit home. A significant narrowing in the current account surplus is also anticipated, which should underpin further gains in USD-HKD.
Rates
In order to maintain the viability of the USD-HKD currency peg, HKMA monetary policy must mirror that of the US Federal Reserve. Like the Fed, the HKMA has cut policy rates sharply. Unlike the Fed, the HKMA has a bit more ammunition left, with a remaining 50 bps gap with the Fed funds rate. We expect to see a further narrowing in the gap in H1, supportive of HKD rates markets into mid-year.
. Tamara Henderson
USD-HKD has come off the floor
7.75
7.78
7.80
7.83
7.85
Jun-
08
Aug-
08
Oct
-08
Dec
-08
Downtrend in rates still intact near-term
01234
Jun-0
8
Sep-0
8
Dec-0
8
Mar
-09
Jun-0
9
Sep-0
9
Dec-0
9
Mar
-10
HKMA rate
5Y IRS
2s-10s IRS has finally steepened
020406080
100120140160
Jul-0
7
Oct-0
7
Jan-
08
Apr-08
Jul-0
8
Oct-0
8
Jan-
09

Emerging Asia Economics Monthly – February 2009
Page 13
Country Update: India
Economic Data - India Monthly data May-08 Jun-08 Jul-08 Aug-08 Sep-08 Oct-08 Nov-08 Dec-08
Industrial Production, % y/y 4.4 5.4 6.4 1.7 5.5 -0.3 2.4 N/A Automobile Sales, % y/y 9.2 8.7 15.3 11.7 15.2 -9.3 -10.4 -11.8 Wholesale Price Index, % y/y 9.4 12.0 12.5 12.9 12.1 10.7 8.3 5.9 Exports, % y/y 27.6 38.4 35.7 26.9 10.4 -12.1 -9.9 N/A Imports, % y/y 38.7 32.3 57.2 51.2 43.3 10.6 6.1 N/A Trade Balance, US$ bn -11.2 -9.3 -11.9 -13.9 -10.6 -10.5 -10.1 N/A Foreign Exchange Reserves, US$ bn 304.9 302.3 295.9 286.1 277.3 244.0 239.0 N/A Quarterly data Mar-07 Jun-07 Sep-07 Dec-07 Mar-08 Jun-08 Sep-08 Dec-08
Real GDP, % y/y 9.7 9.2 9.3 8.8 8.8 7.9 7.6 N/A -Agriculture 4.9 4.4 4.7 6.0 2.9 3.0 2.7 N/A -Industry 12.6 9.9 10.0 8.8 8.0 7.4 6.5 N/A -Services 10.3 11.0 10.5 10.4 11.2 10.0 9.6 N/A Nominal GDP, INR tn 10.4 9.9 9.8 11.4 11.9 11.5 11.7 N/A Current Account, US$ bn 4.2 -6.7 -4.3 -4.5 -1.5 -9.8 -12.5 N/A Capital Account, US$ bn 15.8 17.8 33.2 31.0 26.0 11.8 8.2 N/A Sources: Bloomberg, CEIC
Exports shrank again in November and industrial production improved. Reflecting lower retail oil prices and lower borrowing costs, domestic demand is supporting activity. Inflation fell towards the RBI’s comfort level of 5% paving way for more rate cuts. GDP growth should moderate to around 5% this year.
• Exports registered a 9.9% (y/y) decline in Nov, and import growth slowed to 6.1% as a result of low commodity prices. Net exports are a drag on growth.
• Industrial production surprisingly improved to 2.4% (y/y) in Nov, following a contraction of 0.3% in Oct. Manufacturing PMI was at 44.4 for Dec, below the 50 threshold, signalling further contraction.
• The WPI fell to 5.6% (y/y) in the week ending January 10, nearing the RBI’s comfort level of 5%, creating further room for easing monetary policy.
• Net FDI contracted by 26.1% (y/y) in Oct. Net foreign equity investment fell by $0.9bn in Jan, after posting a rise of $0.3bn in Dec. Worsening risk appetite due to another wave of global financial deterioration caused the BSE Sensex to fall by 10% last month.
• The RBI noted that the transmission of the policy interest rate signal in the credit market has been subdued and, to the markets’ surprise, left the repo rate unchanged at 5.50% at its Jan meeting.
• Fiscal measures announced on 7 Dec and 2 Jan contain targeted tax-rate reductions for the real estate and exports sectors, while planned fiscal expenditure has been increased by 6.4% of 2008 GDP. Further scope to increase government expenditure remains constrained, although the authorities have hinted at a second relief package.
• We expect GDP growth to continue to moderate and forecast a 5 to 5½% expansion this year. Any support to GDP growth will come from domestic consumption, and measures undertaken by the authorities are expected to hold up domestic demand.
Vimal Balasubramaniam
India - Trade
-20
-10
0
10
20
30
40
50
60
70
Jan-0
8
Feb-
08
Mar
-08
Apr-0
8
May
-08
Jun-0
8
Jul-0
8
Aug-0
8
Sep-0
8
Oct
-08
Nov
-08
Exports growth (y/y) Imports growth (y/y)
India - Domestic Vehicle Sales & Industrial Production
-25
-20
-15
-10
-5
0
5
10
15
20
Jan-0
8
Feb-
08
Mar
-08
Apr-0
8
May
-08
Jun-0
8
Jul-0
8
Aug-0
8
Sep-0
8
Oct-0
8
Nov-0
8
Dec-0
8
Industrial Production (y/y) Domestic Vehicle Sales (y/y)
India - FDI & Foreign Equity Investment
-6
-4
-2
0
2
4
6
8
Jan-0
8
Feb-
08
Mar
-08
Apr-0
8
May
-08
Jun-0
8
Jul-0
8
Aug-0
8
Sep-0
8
Oct
-08
Nov
-08
Dec-0
8
Foreign Equity investment (US$bn) FDI (US$bn)

Emerging Asia Economics Monthly – February 2009
Page 14
India: FX and Rates Strategy
Market Forecasts - India FX Current Ytd (%) Mar-09 Jun-09 Sep-09 Dec-09 Mar-10 Jun-10
USD-INR 48.99 0.4% 49.0 49.0 48.0 48.0 47.0 47.0 AUD-INR 31.68 -7.4% 31 28 27 26 25 26 NZD-INR 24.93 -11.6% 25 23 22 21 21 22 JPY-INR 0.55 2.0% 0.50 0.49 0.48 0.47 0.45 0.44 EUR-INR 63.16 -7.2% 61 59 54 52 51 52 Rates Current Ytd (bps) Mar-09 Jun-09 Sep-09 Dec-09 Mar-10 Jun-10
RBI's repo rate 5.50 -100 5.00 4.50 4.00 4.00 4.00 4.50 3-month MIBOR 8.00 -89 7.3 6.8 6.6 6.6 6.7 6.9 2-year IRS (vs NSE MIBOR) 4.21 -23 3.5 3.0 2.8 2.8 3.0 3.1 10-year IRS 5.31 48 5.1 4.9 4.8 4.8 4.9 4.9 Sources: ANZ and Bloomberg
Portfolio outflows continue to slow and India’s trade deficit continues to narrow, reducing pressure on the rupee. Meanwhile, inflation is back near the RBI’s comfort zone of 5%, but the central bank disappointed bond markets by failing to cut interest rates in January.
FX
We think we’ve already seen the peak in USD-INR during this upcycle, although another foray above the 50 level cannot be ruled out given that financial markets remain whippy amid further fallout in the banking sector and much weaker than expected performance in the global economy in Q4.
Net foreign portfolio equity outflows were a key driver of rupee weakness in 2008, but outflows are progressively slowing. Year-to-date, these flows have improved by 75%! Also, India’s trade deficit continues to narrow, which reduces the amount of external financing required to support the current account deficit.
The INR helped lead USD-AXJ higher last year, with INR under-performing all of AXJ with the exception of the KRW. In sharp contrast, we expect 2009 to be a period of out-performance for the INR as the currencies of countries with extremely large export exposures (e.g. Malaysia, Singapore and Taiwan) play “catch-up” (albeit to a much more limited degree given that these currencies are more tightly managed).
Rates
INR rates markets have come under pressure as the RBI opted for a steady hand instead of a rate cut in January. Inflation is back near the RBI’s comfort zone of 5%, but banks have failed to pass on enough of the RBI’s hefty 350 bps of monetary stimulus.
Meanwhile, concerns about supply are building, with the RBI recently stating that the fiscal deficit would be “substantially higher” than previously estimated. Ultimately, we expect the RBI to continue cutting its policy rate, which should bring the bulls back to the Indian rates market. Until then, we expect more bear-steepening.
Tamara Henderson
USD-INR gains seen capped
39
41
43
45
47
49
51
May
-08
Aug-08
Nov
-08
Feb-
09
May
-09
Aug-09
Nov
-09
Feb-
10
May
-10
IRS curve steepened in January
-30-20-10
0102030405060
1 2 3 4 5 6 7 8 9 10
1M chg
2s-10s IRS in an uptrend
-40-20
020406080
100120140
May
-08
Jul-08
Sep-
08
Nov
-08
Jan-
09
Emerging Asia Economics Monthly – February 2009
Page 15
Country Update: Indonesia
Economic Data - Indonesia Monthly data May-08 Jun-08 Jul-08 Aug-08 Sep-08 Oct-08 Nov-08 Dec-08
Industrial Production, % y/y 4.0 1.3 2.6 2.9 0.2 7.0 N/A N/A Retail Sales Index, % y/y 7.5 7.4 6.5 13.7 3.2 -15.5 -23.9 N/A Consumer Price Index, % y/y 10.4 11.0 11.9 11.8 11.9 11.6 11.5 11.1 Exports, % y/y 31.6 34.1 24.8 29.9 30.2 4.7 -2.4 N/A Imports, % y/y 49.8 63.4 68.8 45.4 38.5 40.3 -5.6 N/A Trade Balance, US$ bn 3.2 3.0 1.8 2.4 3.0 2.0 2.5 N/A Foreign Exchange Reserves, US$ bn 54.9 56.8 58.0 55.9 54.6 48.4 47.8 49.2 Quarterly data Mar-07 Jun-07 Sep-07 Dec-07 Mar-08 Jun-08 Sep-08 Dec-08
Real GDP, % y/y 6.1 6.4 6.5 6.3 6.3 6.4 6.1 N/A -Private consumption 4.7 4.7 5.1 5.6 5.7 5.5 5.3 N/A -Government consumption 3.7 3.8 3.3 2.0 3.6 5.5 20.5 N/A -Gross fixed capital expenditure 7.0 6.9 10.4 12.1 15.6 13.1 12.0 N/A Nominal GDP, IDR tn 920.2 962.8 1,033.3 1,041.1 1,125.0 1,236.5 1,343.8 N/A Current Account, US$ bn 2.6 2.2 2.1 3.4 2.6 -1.2 -0.6 N/A Capital & Financial Account, US$ bn 1.8 2.0 -1.0 0.7 -1.6 2.6 0.5 N/A Sources: Bloomberg, CEIC
Indonesia - Net Foreign Equity Flows (20d MA)
-300-200-100
0
100200300400
Jan-0
8
Feb-
08
Mar
-08
Apr-0
8
May
-08
Jun-0
8
Jul-0
8
Aug-0
8
Sep-0
8
Oct-0
8
Nov-0
8
Dec-0
8
Jan-0
9
Indonesia - Trade 3mma
-100
10203040506070
Jan-0
6
Apr-0
6
Jul-0
6
Oct
-06
Jan-0
7
Apr-0
7
Jul-0
7
Oct
-07
Jan-0
8
Apr-0
8
Jul-0
8
Oct
-08
exportsimports
Indonesia - Auto sales y/y
-100
-50
0
50
100
150
Jan-0
6
Apr-0
6
Jul-0
6
Oct
-06
Jan-0
7
Apr-0
7
Jul-0
7
Oct
-07
Jan-0
8
Apr-0
8
Jul-0
8
Oct
-08
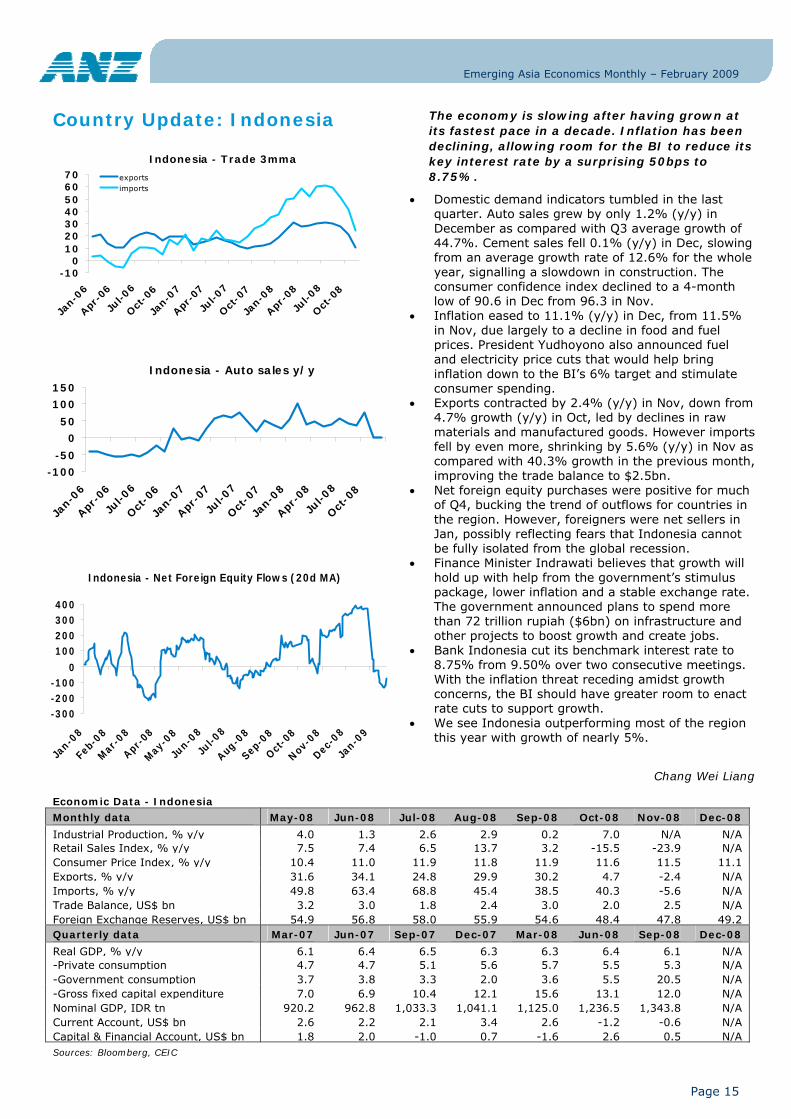
The economy is slowing after having grown at its fastest pace in a decade. Inflation has been declining, allowing room for the BI to reduce its key interest rate by a surprising 50bps to 8.75%.
• Domestic demand indicators tumbled in the last quarter. Auto sales grew by only 1.2% (y/y) in December as compared with Q3 average growth of 44.7%. Cement sales fell 0.1% (y/y) in Dec, slowing from an average growth rate of 12.6% for the whole year, signalling a slowdown in construction. The consumer confidence index declined to a 4-month low of 90.6 in Dec from 96.3 in Nov.
• Inflation eased to 11.1% (y/y) in Dec, from 11.5% in Nov, due largely to a decline in food and fuel prices. President Yudhoyono also announced fuel and electricity price cuts that would help bring inflation down to the BI’s 6% target and stimulate consumer spending.
• Exports contracted by 2.4% (y/y) in Nov, down from 4.7% growth (y/y) in Oct, led by declines in raw materials and manufactured goods. However imports fell by even more, shrinking by 5.6% (y/y) in Nov as compared with 40.3% growth in the previous month, improving the trade balance to $2.5bn.
• Net foreign equity purchases were positive for much of Q4, bucking the trend of outflows for countries in the region. However, foreigners were net sellers in Jan, possibly reflecting fears that Indonesia cannot be fully isolated from the global recession.
• Finance Minister Indrawati believes that growth will hold up with help from the government’s stimulus package, lower inflation and a stable exchange rate. The government announced plans to spend more than 72 trillion rupiah ($6bn) on infrastructure and other projects to boost growth and create jobs.
• Bank Indonesia cut its benchmark interest rate to 8.75% from 9.50% over two consecutive meetings. With the inflation threat receding amidst growth concerns, the BI should have greater room to enact rate cuts to support growth.
• We see Indonesia outperforming most of the region this year with growth of nearly 5%.
Chang Wei Liang
Emerging Asia Economics Monthly – February 2009
Page 16
Indonesia: FX and Rates Strategy
Market Forecasts - Indonesia FX Current Ytd (%) Mar-09 Jun-09 Sep-09 Dec-09 Mar-10 Jun-10
USD-IDR 11,370 2.2% 11,350 11,500 11,900 11,600 11,600 11,300 AUD-IDR 7,347 -7.7% 7,200 6,700 6,700 6,300 6,300 6,300 NZD-IDR 5,795 -11.7% 5,900 5,400 5,400 5,100 5,200 5,200 JPY-IDR 127 1.9% 120 120 120 110 110 100 EUR-IDR 14,675 -7.3% 14,200 13,800 13,300 12,500 12,500 12,400 Rates Current Ytd (bps) Mar-09 Jun-09 Sep-09 Dec-09 Mar-10 Jun-10
BI's bank rate 8.75 -50 8.00 7.00 6.00 6.00 6.00 6.00 3-month JIBOR 10.71 -142 9.7 8.7 8.0 8.0 8.0 8.1 2-year IRS (versus IDR fix) 13.50 -50 12.5 11.5 10.8 10.8 10.8 10.9 10-year IRS 9.50 0 9.2 8.8 8.6 8.6 8.6 8.6 Sources: ANZ and Bloomberg
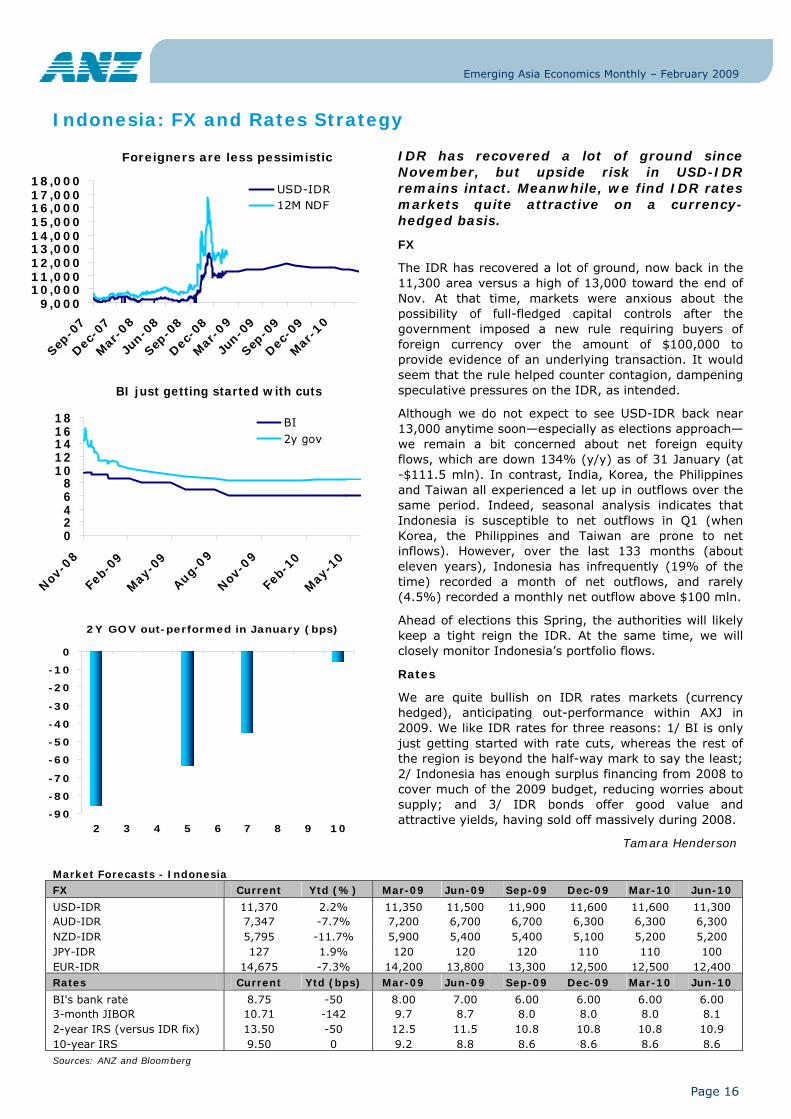
IDR has recovered a lot of ground since November, but upside risk in USD-IDR remains intact. Meanwhile, we find IDR rates markets quite attractive on a currency-hedged basis.
FX
The IDR has recovered a lot of ground, now back in the 11,300 area versus a high of 13,000 toward the end of Nov. At that time, markets were anxious about the possibility of full-fledged capital controls after the government imposed a new rule requiring buyers of foreign currency over the amount of $100,000 to provide evidence of an underlying transaction. It would seem that the rule helped counter contagion, dampening speculative pressures on the IDR, as intended.
Although we do not expect to see USD-IDR back near 13,000 anytime soon—especially as elections approach—we remain a bit concerned about net foreign equity flows, which are down 134% (y/y) as of 31 January (at -$111.5 mln). In contrast, India, Korea, the Philippines and Taiwan all experienced a let up in outflows over the same period. Indeed, seasonal analysis indicates that Indonesia is susceptible to net outflows in Q1 (when Korea, the Philippines and Taiwan are prone to net inflows). However, over the last 133 months (about eleven years), Indonesia has infrequently (19% of the time) recorded a month of net outflows, and rarely (4.5%) recorded a monthly net outflow above $100 mln.
Ahead of elections this Spring, the authorities will likely keep a tight reign the IDR. At the same time, we will closely monitor Indonesia’s portfolio flows.
Rates
We are quite bullish on IDR rates markets (currency hedged), anticipating out-performance within AXJ in 2009. We like IDR rates for three reasons: 1/ BI is only just getting started with rate cuts, whereas the rest of the region is beyond the half-way mark to say the least; 2/ Indonesia has enough surplus financing from 2008 to cover much of the 2009 budget, reducing worries about supply; and 3/ IDR bonds offer good value and attractive yields, having sold off massively during 2008.
Tamara Henderson
Foreigners are less pessimistic
9,00010,00011,00012,00013,00014,00015,00016,00017,00018,000
Sep-0
7
Dec-0
7
Mar
-08
Jun-0
8
Sep-0
8
Dec-0
8
Mar
-09
Jun-0
9
Sep-0
9
Dec-0
9
Mar
-10
USD-IDR12M NDF
BI just getting started with cuts
02468
1012141618
Nov-0
8
Feb-
09
May
-09
Aug-09
Nov-0
9
Feb-
10
May
-10
BI2y gov
2Y GOV out-performed in January (bps)
-90
-80
-70
-60
-50
-40
-30
-20
-10
0
2 3 4 5 6 7 8 9 10
Emerging Asia Economics Monthly – February 2009
Page 17
Country Update: Malaysia
Economic Data - Malaysia Monthly data May-08 Jun-08 Jul-08 Aug-08 Sep-08 Oct-08 Nov-08 Dec-08
Industrial Production, % y/y 2.9 2.3 2.4 1.2 -1.7 -2.8 -7.7 N/A Manufacturing Sales, % y/y 15.1 18.1 16.2 13.4 8.6 2.1 -1.6 N/A Consumer Price Index, % y/y 3.8 7.7 8.5 8.5 8.2 7.6 5.7 4.4 Exports, % y/y 22.9 18.6 25.3 10.7 15.0 -2.6 -4.9 N/A Imports, % y/y 9.4 12.5 15.0 4.4 11.4 -5.3 -8.6 N/A Trade Balance, USD bn 4.8 3.9 4.4 3.7 4.3 2.7 3.2 N/A Foreign Exchange Reserves, US$ bn 119.4 120.0 119.3 116.9 104.5 94.9 92.1 85.7 Quarterly data Mar-07 Jun-07 Sep-07 Dec-07 Mar-08 Jun-08 Sep-08 Dec-08
Retail Sales, % y/y 25.3 33.0 39.7 35.7 19.8 23.8 25.4 N/A Real GDP, % y/y 5.5 5.7 6.7 7.3 7.4 6.7 4.7 N/A -Private consumption 7.6 12.3 13.0 10.2 11.7 9.0 8.1 N/A -Government consumption 7.3 10.4 6.0 4.2 14.7 10.9 6.9 N/A -Gross fixed capital formation 9.5 6.0 12.8 10.2 6.0 5.6 3.1 N/A Nominal GDP, MYR bn 144.6 154.3 166.3 176.7 175.4 189.4 198.7 N/A Current Account, US$ bn 5.7 7.3 8.6 8.0 7.5 11.3 11.2 N/A Capital & Financial Account, US$ bn 0.8 2.2 -9.0 -5.2 8.3 -3.8 -17.8 N/A Sources: Bloomberg, CEIC
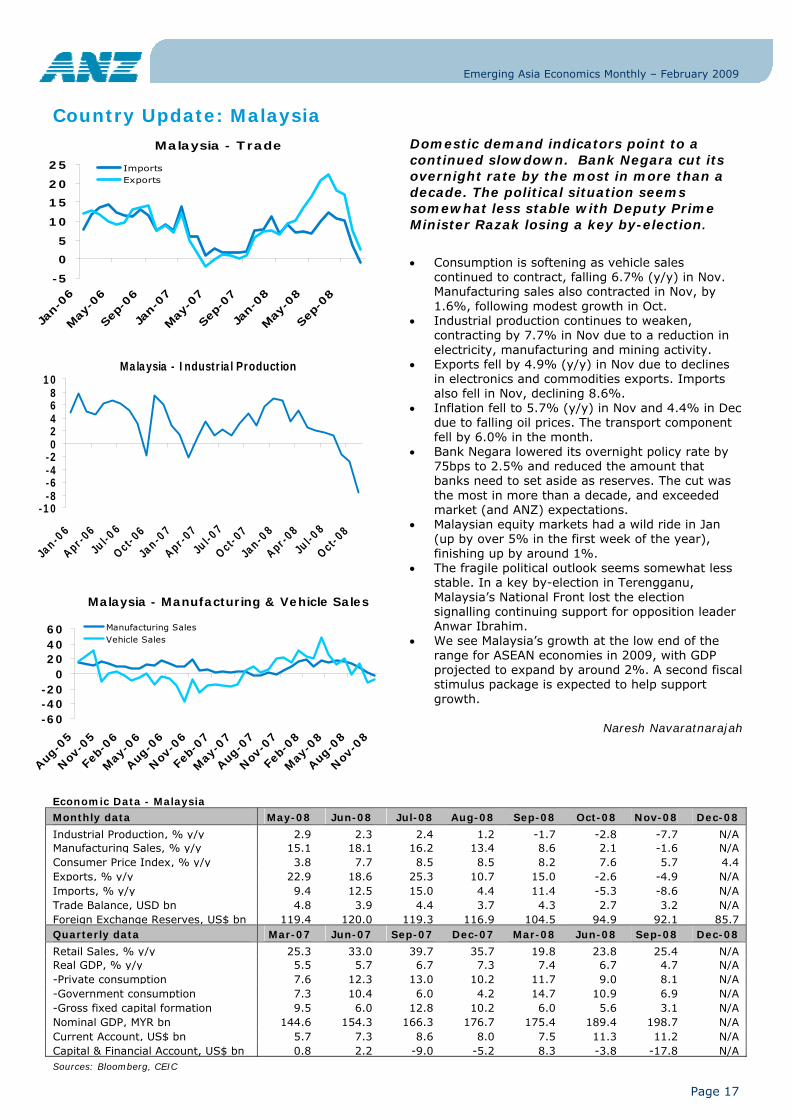
Domestic demand indicators point to a continued slowdown. Bank Negara cut its overnight rate by the most in more than a decade. The political situation seems somewhat less stable with Deputy Prime Minister Razak losing a key by-election.
• Consumption is softening as vehicle sales
continued to contract, falling 6.7% (y/y) in Nov. Manufacturing sales also contracted in Nov, by 1.6%, following modest growth in Oct.
• Industrial production continues to weaken, contracting by 7.7% in Nov due to a reduction in electricity, manufacturing and mining activity.
• Exports fell by 4.9% (y/y) in Nov due to declines in electronics and commodities exports. Imports also fell in Nov, declining 8.6%.
• Inflation fell to 5.7% (y/y) in Nov and 4.4% in Dec due to falling oil prices. The transport component fell by 6.0% in the month.
• Bank Negara lowered its overnight policy rate by 75bps to 2.5% and reduced the amount that banks need to set aside as reserves. The cut was the most in more than a decade, and exceeded market (and ANZ) expectations.
• Malaysian equity markets had a wild ride in Jan (up by over 5% in the first week of the year), finishing up by around 1%.
• The fragile political outlook seems somewhat less stable. In a key by-election in Terengganu, Malaysia’s National Front lost the election signalling continuing support for opposition leader Anwar Ibrahim.
• We see Malaysia’s growth at the low end of the range for ASEAN economies in 2009, with GDP projected to expand by around 2%. A second fiscal stimulus package is expected to help support growth.
Naresh Navaratnarajah
Malaysia - Trade
-5
0
5
10
15
20
25
Jan-
06
May
-06
Sep-
06
Jan-
07
May
-07
Sep-
07
Jan-
08
May
-08
Sep-
08
ImportsExports
Malaysia - Industrial Production
-10-8-6-4-202468
10
Jan-0
6
Apr-06
Jul-0
6
Oct-0
6
Jan-0
7
Apr-07
Jul-0
7
Oct-0
7
Jan-0
8
Apr-08
Jul-0
8
Oct-0
8
Malaysia - Manufacturing & Vehicle Sales
-60-40-20
0204060
Aug-0
5
Nov
-05
Feb-
06
May
-06
Aug-0
6
Nov
-06
Feb-
07
May
-07
Aug-0
7
Nov
-07
Feb-
08
May
-08
Aug-0
8
Nov
-08
Manufacturing Sales Vehicle Sales
Emerging Asia Economics Monthly – February 2009
Page 18
Malaysia: FX and Rates Strategy
Market Forecasts - Malaysia FX Current Ytd (%) Mar-09 Jun-09 Sep-09 Dec-09 Mar-10 Jun-10
USD-MYR 3.61 4.0% 3.64 3.74 3.80 3.80 3.80 3.75 AUD-MYR 2.33 -4.0% 2.3 2.2 2.1 2.1 2.1 2.1 NZD-MYR 1.84 -8.0% 1.9 1.8 1.7 1.7 1.7 1.7 JPY-MYR 4.24 1.2% 3.7 3.7 3.8 3.7 3.6 3.5 EUR-MYR 4.66 -3.5% 4.6 4.5 4.3 4.1 4.1 4.1 Rates Current Ytd (bps) Mar-09 Jun-09 Sep-09 Dec-09 Mar-10 Jun-10
BNM's overnight policy rate 2.50 -75 2.00 1.50 1.00 1.00 1.00 1.00 3-month KLIBOR 2.60 -77 2.1 1.6 1.1 1.1 1.1 1.2 2-year IRS (vs 3M KLIBOR) 2.29 -53 1.8 1.3 0.8 0.8 0.8 0.9 10-year IRS 3.44 -6 3.3 3.1 2.9 2.9 2.9 3.0 Sources: ANZ and Bloomberg
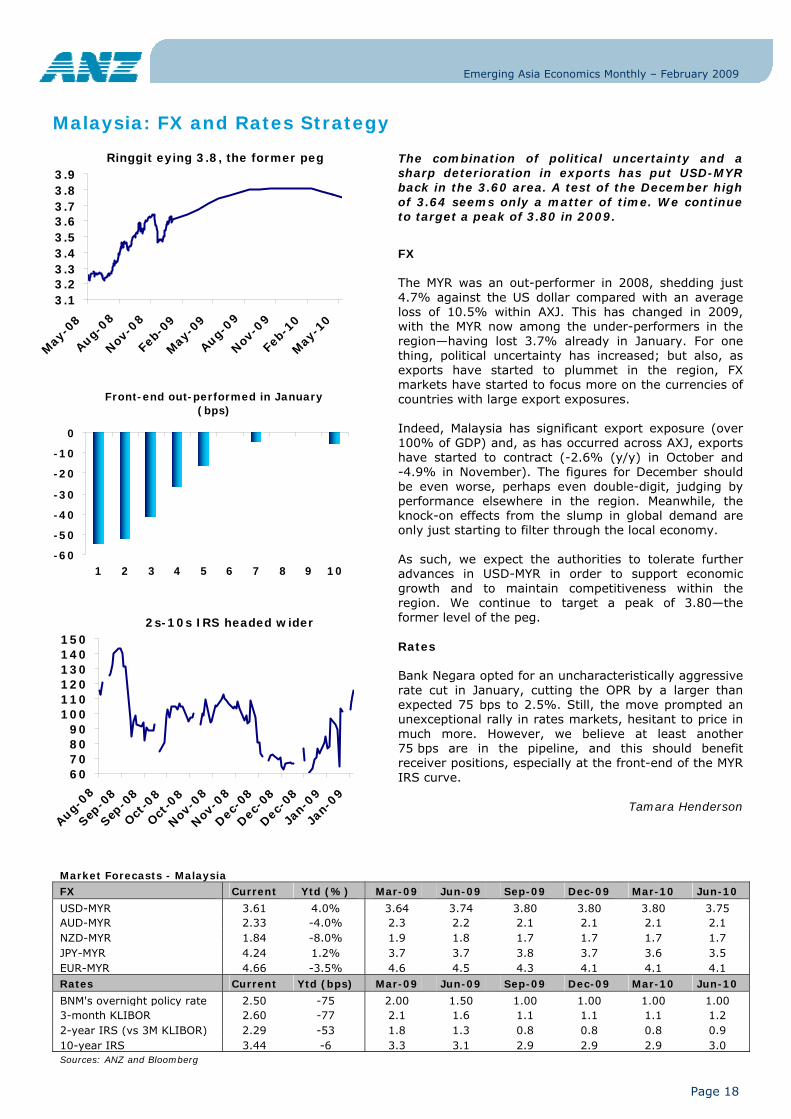
The combination of political uncertainty and a sharp deterioration in exports has put USD-MYR back in the 3.60 area. A test of the December high of 3.64 seems only a matter of time. We continue to target a peak of 3.80 in 2009.
FX The MYR was an out-performer in 2008, shedding just 4.7% against the US dollar compared with an average loss of 10.5% within AXJ. This has changed in 2009, with the MYR now among the under-performers in the region—having lost 3.7% already in January. For one thing, political uncertainty has increased; but also, as exports have started to plummet in the region, FX markets have started to focus more on the currencies of countries with large export exposures. Indeed, Malaysia has significant export exposure (over 100% of GDP) and, as has occurred across AXJ, exports have started to contract (-2.6% (y/y) in October and -4.9% in November). The figures for December should be even worse, perhaps even double-digit, judging by performance elsewhere in the region. Meanwhile, the knock-on effects from the slump in global demand are only just starting to filter through the local economy. As such, we expect the authorities to tolerate further advances in USD-MYR in order to support economic growth and to maintain competitiveness within the region. We continue to target a peak of 3.80—the former level of the peg. Rates Bank Negara opted for an uncharacteristically aggressive rate cut in January, cutting the OPR by a larger than expected 75 bps to 2.5%. Still, the move prompted an unexceptional rally in rates markets, hesitant to price in much more. However, we believe at least another 75 bps are in the pipeline, and this should benefit receiver positions, especially at the front-end of the MYR IRS curve.
Tamara Henderson
Ringgit eying 3.8, the former peg
3.13.23.33.43.53.63.73.83.9
May
-08
Aug-08
Nov-0
8
Feb-
09
May
-09
Aug-09
Nov-0
9
Feb-
10
May
-10
Front-end out-performed in January (bps)
-60
-50
-40
-30
-20
-10
0
1 2 3 4 5 6 7 8 9 10
2s-10s IRS headed wider
60708090
100110120130140150
Aug-08
Sep-0
8
Sep-0
8
Oct-0
8
Oct-0
8
Nov-0
8
Nov-0
8
Dec-0
8
Dec-0
8
Dec-0
8
Jan-
09
Jan-
09
Emerging Asia Economics Monthly – February 2009
Page 19
Country Update: Philippines
Philippines - GDP Growth by Components
-15
-10
-5
0
5
10
15
20
Mar-
07
Jun-0
7
Sep-0
7
Dec-0
7
Mar-
08
Jun-0
8
Sep-0
8
Dec-0
8
GDP Consumption
Investment Exports
Economic Data - Philippines Monthly data May-08 Jun-08 Jul-08 Aug-08 Sep-08 Oct-08 Nov-08 Dec-08
Manufacturing Production Value- 8.6 7.5 10.3 6.3 12.5 9.2 1.4 N/A Passenger Car Sales, % y/y -0.5 17.4 31.0 20.6 12.3 -5.9 2.0 -19.5 Consumer Price Index, % y/y 9.5 11.4 12.3 12.4 11.8 11.2 9.9 8.0 Exports, % y/y 2.3 8.8 4.4 6.6 1.1 -14.8 -11.4 N/A Imports, % y/y 10.9 12.7 16.0 1.1 2.5 -11.1 -31.5 N/A Trade Balance, US$ bn -0.5 -0.8 -1.4 -0.6 -0.4 -0.6 N/A N/A Foreign Exchange Reserves, US$ bn 31.8 32.1 32.4 32.5 32.3 31.8 32.4 N/A Quarterly data Mar-07 Jun-07 Sep-07 Dec-07 Mar-08 Jun-08 Sep-08 Dec-08
Real GDP, % y/y 7.0 8.3 7.1 6.4 4.7 4.4 5.0 4.5 -Private consumption 5.9 5.6 5.7 6.2 5.2 4.1 4.4 4.5 -Government consumption 9.5 11.9 6.4 4.6 1.9 -1.5 13.4 4.7 -Gross fixed capital formation 10.3 20.9 8.8 6.7 2.9 3.0 7.0 1.9 Nominal GDP, peso bn 1,524.1 1,618.6 1,613.8 1,891.8 1,668.0 1,837.9 1,864.9 2,126.8 Current Account, US$ bn 1.9 1.7 1.0 1.7 0.9 0.8 -0.5 N/A Capital & Financial Account, US$ bn 0.5 -0.4 3.3 -0.5 0.7 0.5 0.5 N/A Sources: Bloomberg, CEIC
Philippines - Trade 3mma
-15
-10
-5
0
5
10
15
20
25
Jan-
06
Apr-0
6
Jul-0
6
Oct
-06
Jan-0
7
Apr-0
7
Jul-0
7
Oct
-07
Jan-
08
Apr-0
8
Jul-0
8
Oct
-08
exportsimports
Philippines - Remittances 3mma
0
5
10
15
20
25
30
35
40
Jan-0
6
Mar
-06
May
-06
Jul-0
6
Sep-0
6
Nov
-06
Jan-0
7
Mar
-07
May
-07
Jul-0
7
Sep-0
7
Nov
-07
Jan-0
8
Mar
-08
May
-08
Jul-0
8
Sep-0
8
Nov
-08
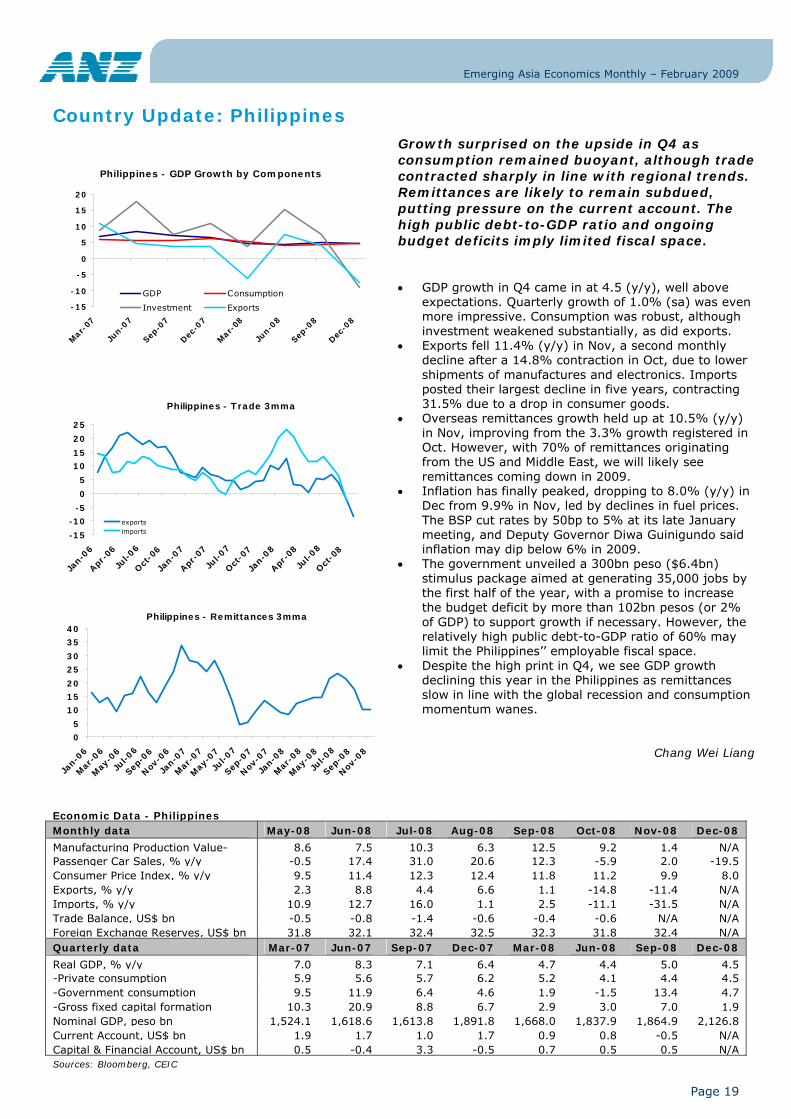
Growth surprised on the upside in Q4 as consumption remained buoyant, although trade contracted sharply in line with regional trends. Remittances are likely to remain subdued, putting pressure on the current account. The high public debt-to-GDP ratio and ongoing budget deficits imply limited fiscal space.
• GDP growth in Q4 came in at 4.5 (y/y), well above expectations. Quarterly growth of 1.0% (sa) was even more impressive. Consumption was robust, although investment weakened substantially, as did exports.
• Exports fell 11.4% (y/y) in Nov, a second monthly decline after a 14.8% contraction in Oct, due to lower shipments of manufactures and electronics. Imports posted their largest decline in five years, contracting 31.5% due to a drop in consumer goods.
• Overseas remittances growth held up at 10.5% (y/y) in Nov, improving from the 3.3% growth registered in Oct. However, with 70% of remittances originating from the US and Middle East, we will likely see remittances coming down in 2009.
• Inflation has finally peaked, dropping to 8.0% (y/y) in Dec from 9.9% in Nov, led by declines in fuel prices. The BSP cut rates by 50bp to 5% at its late January meeting, and Deputy Governor Diwa Guinigundo said inflation may dip below 6% in 2009.
• The government unveiled a 300bn peso ($6.4bn) stimulus package aimed at generating 35,000 jobs by the first half of the year, with a promise to increase the budget deficit by more than 102bn pesos (or 2% of GDP) to support growth if necessary. However, the relatively high public debt-to-GDP ratio of 60% may limit the Philippines’’ employable fiscal space.
• Despite the high print in Q4, we see GDP growth declining this year in the Philippines as remittances slow in line with the global recession and consumption momentum wanes.
Chang Wei Liang
Emerging Asia Economics Monthly – February 2009
Page 20
Philippines: FX and Rates Strategy
Market Forecasts - Philippines FX Current Ytd (%) Mar-09 Jun-09 Sep- Dec- Mar-10 Jun-USD-PHP 47.36 -0.3% 47.5 48.5 49.3 49.5 49.5 48.8 AUD-PHP 30.48 -8.5% 29.9 28.1 27.6 26.7 26.7 27.3 NZD-PHP 24.07 -12.3% 24.7 22.8 22.2 21.8 22.3 22.4 JPY-PHP 0.53 1.4% 0.485 0.485 0.488 0.485 0.471 0.452 EUR-PHP 61.07 -7.8% 59.4 58.2 55.2 53.5 53.5 53.7 Rates Current Ytd (bps) Mar-09 Jun-09 Sep- Dec- Mar-10 Jun-BSP's overnight reverse repo rate 5.00 -50 4.75 4.25 4.00 4.00 4.00 4.00 3-month PHIBOR 5.31 6 4.8 4.1 3.8 3.8 3.9 4.1 2-year IRS (versus 3M IB ref rate) 3.83 -25 3.3 2.6 2.3 2.3 2.5 2.6 10-year IRS 5.73 -38 5.6 5.3 5.2 5.2 5.3 5.3 Sources: ANZ and Bloomberg
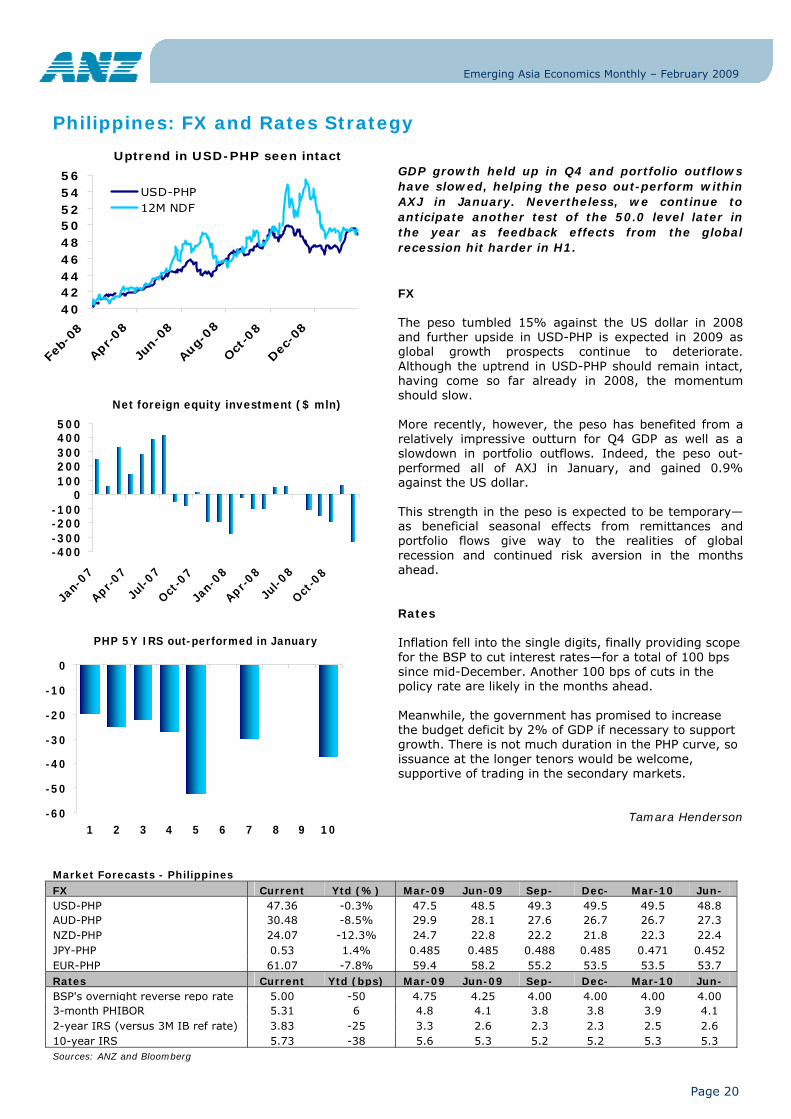
GDP growth held up in Q4 and portfolio outflows have slowed, helping the peso out-perform within AXJ in January. Nevertheless, we continue to anticipate another test of the 50.0 level later in the year as feedback effects from the global recession hit harder in H1.
FX The peso tumbled 15% against the US dollar in 2008 and further upside in USD-PHP is expected in 2009 as global growth prospects continue to deteriorate. Although the uptrend in USD-PHP should remain intact, having come so far already in 2008, the momentum should slow. More recently, however, the peso has benefited from a relatively impressive outturn for Q4 GDP as well as a slowdown in portfolio outflows. Indeed, the peso out-performed all of AXJ in January, and gained 0.9% against the US dollar. This strength in the peso is expected to be temporary—as beneficial seasonal effects from remittances and portfolio flows give way to the realities of global recession and continued risk aversion in the months ahead. Rates Inflation fell into the single digits, finally providing scope for the BSP to cut interest rates—for a total of 100 bps since mid-December. Another 100 bps of cuts in the policy rate are likely in the months ahead. Meanwhile, the government has promised to increase the budget deficit by 2% of GDP if necessary to support growth. There is not much duration in the PHP curve, so issuance at the longer tenors would be welcome, supportive of trading in the secondary markets.
Tamara Henderson
Net foreign equity investment ($ mln)
-400-300-200-100
0100200300400500
Jan-
07
Apr-07
Jul-0
7
Oct-0
7
Jan-
08
Apr-08
Jul-0
8
Oct-0
8
PHP 5Y IRS out-performed in January
-60
-50
-40
-30
-20
-10
0
1 2 3 4 5 6 7 8 9 10
Uptrend in USD-PHP seen intact
404244464850525456
Feb-
08
Apr-08
Jun-
08
Aug-
08
Oct
-08
Dec
-08
USD-PHP12M NDF
Emerging Asia Economics Monthly – February 2009
Page 21
Country Update: Singapore
Economic Data - Singapore Monthly data May-08 Jun-08 Jul-08 Aug-08 Sep-08 Oct-08 Nov-08 Dec-08
Industrial Production, % y/y -13.4 2.4 -21.9 -11.9 3.0 -12.2 -6.6 -13.5 Retail Sales, % y/y 4.9 -3.6 11.4 4.0 7.2 -3.4 -3.4 N/A Consumer Price Index, % y/y 7.5 7.5 6.5 6.4 6.7 6.4 5.5 4.3 Domestic Exports (Non-oil), % y/y -10.5 -10.6 -5.8 -13.9 -5.7 -15.5 -17.5 -20.8 Imports (Non-oil), % y/y 3.6 3.1 4.3 0.1 12.6 -2.2 -12.4 -14.0 Trade Balance, US$ bn 1.7 1.4 1.5 2.6 1.5 0.4 1.0 0.7 Foreign Exchange Reserves, US$ bn 174.9 175.3 175.6 171.5 169.1 162.5 165.8 168.9 Quarterly data Mar-07 Jun-07 Sep-07 Dec-07 Mar-08 Jun-08 Sep-08 Dec-08
Real GDP, % y/y 7.0 9.1 9.5 5.4 6.9 2.3 -0.6 N/A -Private consumption 2.4 5.3 5.6 5.1 4.5 5.1 4.7 N/A -Government consumption 0.3 3.9 0.7 5.1 14.4 4.6 10.2 N/A -Gross fixed capital formation 21.4 27.6 17.0 16.5 30.2 24.1 13.1 N/A Nominal GDP sa, SGD bn 57.7 60.5 62.5 62.5 65.5 64.2 63.6 N/A Current Account, US$ bn 9.8 9.7 12.1 7.5 7.4 6.7 7.5 N/A Capital & Financial Account, US$ bn -8.7 -2.5 -7.4 0.1 0.6 -5.4 -8.7 N/A Sources: Bloomberg, CEIC
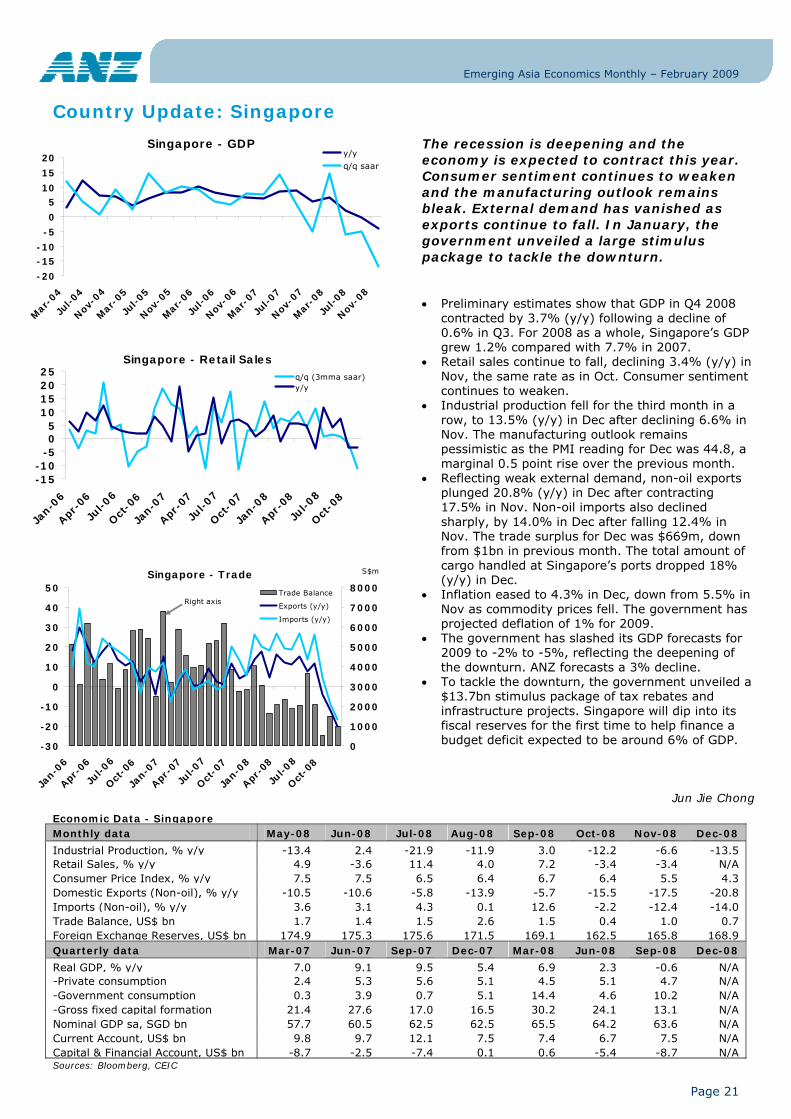
The recession is deepening and the economy is expected to contract this year. Consumer sentiment continues to weaken and the manufacturing outlook remains bleak. External demand has vanished as exports continue to fall. In January, the government unveiled a large stimulus package to tackle the downturn.
• Preliminary estimates show that GDP in Q4 2008 contracted by 3.7% (y/y) following a decline of 0.6% in Q3. For 2008 as a whole, Singapore’s GDP grew 1.2% compared with 7.7% in 2007.
• Retail sales continue to fall, declining 3.4% (y/y) in Nov, the same rate as in Oct. Consumer sentiment continues to weaken.
• Industrial production fell for the third month in a row, to 13.5% (y/y) in Dec after declining 6.6% in Nov. The manufacturing outlook remains pessimistic as the PMI reading for Dec was 44.8, a marginal 0.5 point rise over the previous month.
• Reflecting weak external demand, non-oil exports plunged 20.8% (y/y) in Dec after contracting 17.5% in Nov. Non-oil imports also declined sharply, by 14.0% in Dec after falling 12.4% in Nov. The trade surplus for Dec was $669m, down from $1bn in previous month. The total amount of cargo handled at Singapore’s ports dropped 18% (y/y) in Dec.
• Inflation eased to 4.3% in Dec, down from 5.5% in Nov as commodity prices fell. The government has projected deflation of 1% for 2009.
• The government has slashed its GDP forecasts for 2009 to -2% to -5%, reflecting the deepening of the downturn. ANZ forecasts a 3% decline.
• To tackle the downturn, the government unveiled a $13.7bn stimulus package of tax rebates and infrastructure projects. Singapore will dip into its fiscal reserves for the first time to help finance a budget deficit expected to be around 6% of GDP.
Jun Jie Chong
Singapore - GDP
-20
-15-10
-5
0
510
15
20
Mar
-04
Jul-0
4
Nov-0
4
Mar
-05
Jul-0
5
Nov-0
5
Mar
-06
Jul-0
6
Nov-0
6
Mar
-07
Jul-0
7
Nov-0
7
Mar
-08
Jul-0
8
Nov-0
8
y/y
q/q saar
Singapore - Retail Sales
-15-10
-505
10152025
Jan-0
6
Apr-0
6
Jul-0
6
Oct
-06
Jan-0
7
Apr-0
7
Jul-0
7
Oct
-07
Jan-0
8
Apr-0
8
Jul-0
8
Oct
-08
q/q (3mma saar)y/y
Singapore - Trade
-30
-20
-10
0
10
20
30
40
50
Jan-0
6
Apr-0
6
Jul-0
6
Oct
-06
Jan-0
7
Apr-0
7
Jul-0
7
Oct
-07
Jan-0
8
Apr-0
8
Jul-0
8
Oct
-08
0
1000
2000
3000
4000
5000
6000
7000
8000Trade Balance
Exports (y/y)
Imports (y/y)
Right axis
S$m
Emerging Asia Economics Monthly – February 2009
Page 22
Singapore: FX and Rates Strategy
Market Forecasts - Singapore FX Current Ytd (%) Mar-09 Jun-09 Sep-09 Dec-09 Mar-10 Jun-10
USD-SGD 1.508 5.5% 1.54 1.58 1.62 1.66 1.66 1.63 AUD-SGD 0.972 -3.3% 0.97 0.92 0.91 0.90 0.90 0.91 NZD-SGD 0.770 -7.0% 0.80 0.74 0.73 0.73 0.75 0.75 JPY-SGD 1.688 7.1% 1.57 1.58 1.60 1.63 1.58 1.51 EUR-SGD 1.944 -2.7% 1.93 1.90 1.81 1.79 1.79 1.79 Rates Current Ytd (bps) Mar-09 Jun-09 Sep-09 Dec-09 Mar-10 Jun-10
3-month SIBOR 0.65 -31 0.65 0.55 0.55 0.65 0.75 0.95 2-year IRS (onshore vs 6M SOR) 1.47 -10 1.5 1.4 1.2 1.2 1.3 1.5 10-year IRS 2.39 12 2.4 2.4 2.3 2.3 2.3 2.4
Sources: ANZ and Bloomberg
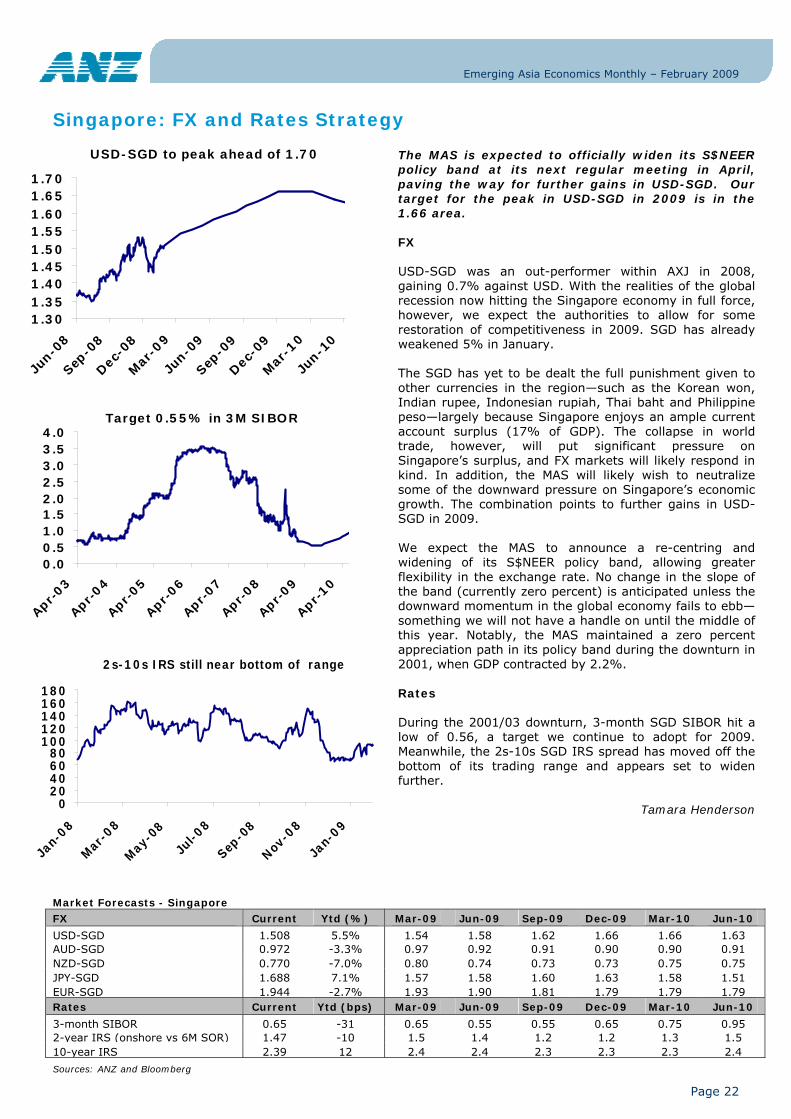
The MAS is expected to officially widen its S$NEER policy band at its next regular meeting in April, paving the way for further gains in USD-SGD. Our target for the peak in USD-SGD in 2009 is in the 1.66 area. FX USD-SGD was an out-performer within AXJ in 2008, gaining 0.7% against USD. With the realities of the global recession now hitting the Singapore economy in full force, however, we expect the authorities to allow for some restoration of competitiveness in 2009. SGD has already weakened 5% in January. The SGD has yet to be dealt the full punishment given to other currencies in the region—such as the Korean won, Indian rupee, Indonesian rupiah, Thai baht and Philippine peso—largely because Singapore enjoys an ample current account surplus (17% of GDP). The collapse in world trade, however, will put significant pressure on Singapore’s surplus, and FX markets will likely respond in kind. In addition, the MAS will likely wish to neutralize some of the downward pressure on Singapore’s economic growth. The combination points to further gains in USD-SGD in 2009. We expect the MAS to announce a re-centring and widening of its S$NEER policy band, allowing greater flexibility in the exchange rate. No change in the slope of the band (currently zero percent) is anticipated unless the downward momentum in the global economy fails to ebb—something we will not have a handle on until the middle of this year. Notably, the MAS maintained a zero percent appreciation path in its policy band during the downturn in 2001, when GDP contracted by 2.2%. Rates During the 2001/03 downturn, 3-month SGD SIBOR hit a low of 0.56, a target we continue to adopt for 2009. Meanwhile, the 2s-10s SGD IRS spread has moved off the bottom of its trading range and appears set to widen further.
Tamara Henderson
USD-SGD to peak ahead of 1.70
1.301.351.401.451.501.551.601.651.70
Jun-0
8
Sep-0
8
Dec-0
8
Mar
-09
Jun-0
9
Sep-0
9
Dec-0
9
Mar
-10
Jun-1
0
Target 0.55% in 3M SIBOR
0.00.51.01.52.02.53.03.54.0
Apr-03
Apr-04
Apr-05
Apr-06
Apr-07
Apr-08
Apr-09
Apr-10
2s-10s IRS still near bottom of range
020406080
100120140160180
Jan-
08
Mar
-08
May
-08
Jul-0
8
Sep-0
8
Nov-0
8
Jan-
09

Emerging Asia Economics Monthly – February 2009
Page 23
Country Update: South Korea
Economic Data - South Korea Monthly data May-08 Jun-08 Jul-08 Aug-08 Sep-08 Oct-08 Nov-08 Dec-08 Industrial Production, % y/y 8.6 6.6 8.7 1.9 6.1 -2.3 -14.0 -18.6 Retail Sales, % y/y 10.1 6.8 12.3 10.4 4.7 1.5 -1.0 N/A Consumer Price Index, % y/y 4.9 5.5 5.9 5.6 5.1 4.8 4.5 4.1 Exports, % y/y 26.9 16.4 35.6 18.1 27.6 7.8 -19.5 -17.9 Imports, % y/y 29.6 32.7 47.0 36.4 45.4 10.3 -15.0 -21.6 Trade Balance, USD bn 0.7 -0.6 -2.0 -3.8 -2.1 1.0 0.0 0.5 Foreign Exchange Reserves, US$ bn 258.7 258.5 247.9 243.4 240.4 212.8 201.0 201.0 Quarterly data Mar-07 Jun-07 Sep-07 Dec-07 Mar-08 Jun-08 Sep-08 Dec-08 Real GDP, % y/y 4.0 4.9 5.1 5.7 5.8 4.8 3.8 -3.4 -Private consumption 4.1 4.4 4.8 4.6 3.4 2.3 1.1 -4.4 -Government consumption 6.3 6.9 4.5 5.6 3.9 4.0 4.4 4.9 -Gross fixed capital formation 7.2 5.5 1.3 2.9 0.5 0.1 1.4 -8.4 Nominal GDP, KRW tn 204.8 221.6 226.9 247.9 218.7 241.1 242.6 N/A Current Account, US$ bn -1.9 1.1 2.0 -0.8 -0.1 1.8 -1.3 0.9 Capital & Financial Account, US$ bn 4.7 -0.3 -3.9 0.3 0.4 -3.6 -4.4 -4.8 Source: Bloomberg, CEIC
Growth fell spectacularly in Q4, which was the worst quarter since 1998. Investment and consumption plunged while net exports provided an offset as imports collapsed. The government is stepping up spending, but negative growth looks inescapable in 2009.
• GDP growth fell by a staggering 5.6% in Q4 (q/q saar) or 22.4% annualized! Private consumption dropped by almost 5% in the quarter while investment, led by facilities, dropped 15%. Government consumption was a bright spot.
• Trade continues to collapse. Export growth was -17.9% in Dec, with shipments to all markets save Japan falling sharply. Imports were down by 21.6% in the same period. The trade account was in modest surplus.
• Consumer price inflation fell to 4.1% (y/y) in Dec as the index was flat. Transportation costs continued to decline. Producer price inflation fell to 5.6 in the period, with the index falling 1.7% for the month on lower commodity prices.
• January 2009 business confidence fell to 52, below the nadir of the tech bust in early 2001, reaching its lowest point since early 1998.
• The Bank of Korea rate cut its policy rate by 50bp to 2.50% on 9 January, the fifth reduction since Oct. On fiscal policy, the government remains open to further stimulus measures. Korea has considerable fiscal space to help support growth.
• Following the dismal Q4 outturn, negative GDP growth for 2009 looks inescapable. We are looking for a decline of around 3 percent, although by the final quarter of the year growth may turn positive.
• We do not see a repeat of the balance of payments crisis of 1997-98, but with the sharp drop in growth and the attendant credit quality deterioration, bank balance sheets are at risk.
Paul Gruenwald
GDP Growth
-8
-6
-4
-2
0
2
4
6
8
Mar
-04
Jun-0
4
Sep-
04
Dec
-04
Mar
-05
Jun-0
5
Sep-
05
Dec
-05
Mar
-06
Jun-0
6
Sep-
06
Dec
-06
Mar
-07
Jun-0
7
Sep-
07
Dec
-07
Mar
-08
Jun-0
8
Sep-
08
Dec
-08
GDP q/q
GDP y/y
South Korea - Store Sales
-8
-6
-4
-2
0
2
4
6
8
10
12
Mar
-06
Jun-0
6
Sep-0
6
Dec-0
6
Mar
-07
Jun-0
7
Sep-0
7
Dec-0
7
Mar
-08
Jun-0
8
Sep-0
8
Dec-0
8
Department stores 3mma
Discount stores 3mma
South Korea - Trade Developments
-10
0
10
20
30
40
50
Mar
-06
Jun-0
6
Sep-0
6
Dec-0
6
Mar
-07
Jun-0
7
Sep-0
7
Dec-0
7
Mar
-08
Jun-0
8
Sep-0
8
Dec-0
8
Exports 3mma
Imports 3mma
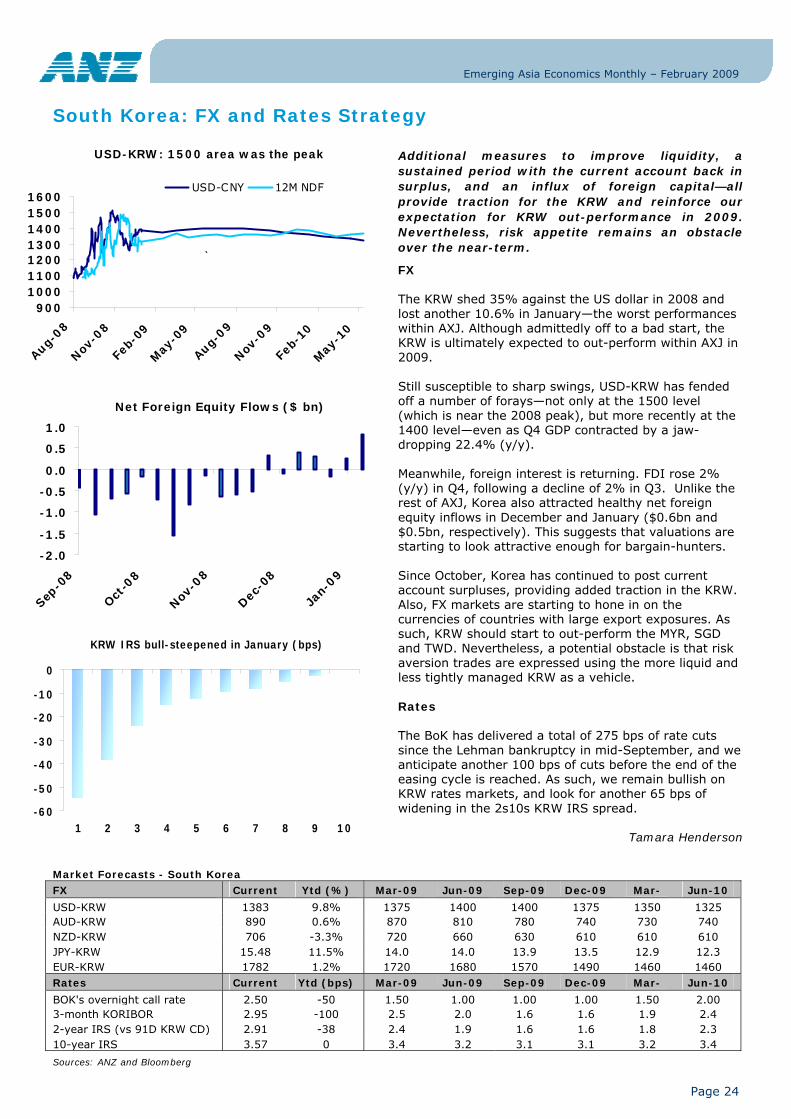
Emerging Asia Economics Monthly – February 2009
Page 24
South Korea: FX and Rates Strategy
Market Forecasts - South Korea FX Current Ytd (%) Mar-09 Jun-09 Sep-09 Dec-09 Mar- Jun-10
USD-KRW 1383 9.8% 1375 1400 1400 1375 1350 1325 AUD-KRW 890 0.6% 870 810 780 740 730 740 NZD-KRW 706 -3.3% 720 660 630 610 610 610 JPY-KRW 15.48 11.5% 14.0 14.0 13.9 13.5 12.9 12.3 EUR-KRW 1782 1.2% 1720 1680 1570 1490 1460 1460 Rates Current Ytd (bps) Mar-09 Jun-09 Sep-09 Dec-09 Mar- Jun-10
BOK's overnight call rate 2.50 -50 1.50 1.00 1.00 1.00 1.50 2.00 3-month KORIBOR 2.95 -100 2.5 2.0 1.6 1.6 1.9 2.4 2-year IRS (vs 91D KRW CD) 2.91 -38 2.4 1.9 1.6 1.6 1.8 2.3 10-year IRS 3.57 0 3.4 3.2 3.1 3.1 3.2 3.4
Sources: ANZ and Bloomberg
Additional measures to improve liquidity, a sustained period with the current account back in surplus, and an influx of foreign capital—all provide traction for the KRW and reinforce our expectation for KRW out-performance in 2009. Nevertheless, risk appetite remains an obstacle over the near-term.
FX The KRW shed 35% against the US dollar in 2008 and lost another 10.6% in January—the worst performances within AXJ. Although admittedly off to a bad start, the KRW is ultimately expected to out-perform within AXJ in 2009. Still susceptible to sharp swings, USD-KRW has fended off a number of forays—not only at the 1500 level (which is near the 2008 peak), but more recently at the 1400 level—even as Q4 GDP contracted by a jaw-dropping 22.4% (y/y). Meanwhile, foreign interest is returning. FDI rose 2% (y/y) in Q4, following a decline of 2% in Q3. Unlike the rest of AXJ, Korea also attracted healthy net foreign equity inflows in December and January ($0.6bn and $0.5bn, respectively). This suggests that valuations are starting to look attractive enough for bargain-hunters. Since October, Korea has continued to post current account surpluses, providing added traction in the KRW. Also, FX markets are starting to hone in on the currencies of countries with large export exposures. As such, KRW should start to out-perform the MYR, SGD and TWD. Nevertheless, a potential obstacle is that risk aversion trades are expressed using the more liquid and less tightly managed KRW as a vehicle. Rates The BoK has delivered a total of 275 bps of rate cuts since the Lehman bankruptcy in mid-September, and we anticipate another 100 bps of cuts before the end of the easing cycle is reached. As such, we remain bullish on KRW rates markets, and look for another 65 bps of widening in the 2s10s KRW IRS spread.
Tamara Henderson
USD-KRW: 1500 area was the peak
9001000110012001300140015001600
Aug-08
Nov-0
8
Feb-
09
May
-09
Aug-09
Nov-0
9
Feb-
10
May
-10
USD-CNY 12M NDF
`
Net Foreign Equity Flows ($ bn)
-2.0
-1.5
-1.0
-0.5
0.0
0.5
1.0
Sep-0
8
Oct-0
8
Nov-0
8
Dec-0
8
Jan-
09
KRW IRS bull-steepened in January (bps)
-60
-50
-40
-30
-20
-10
0
1 2 3 4 5 6 7 8 9 10
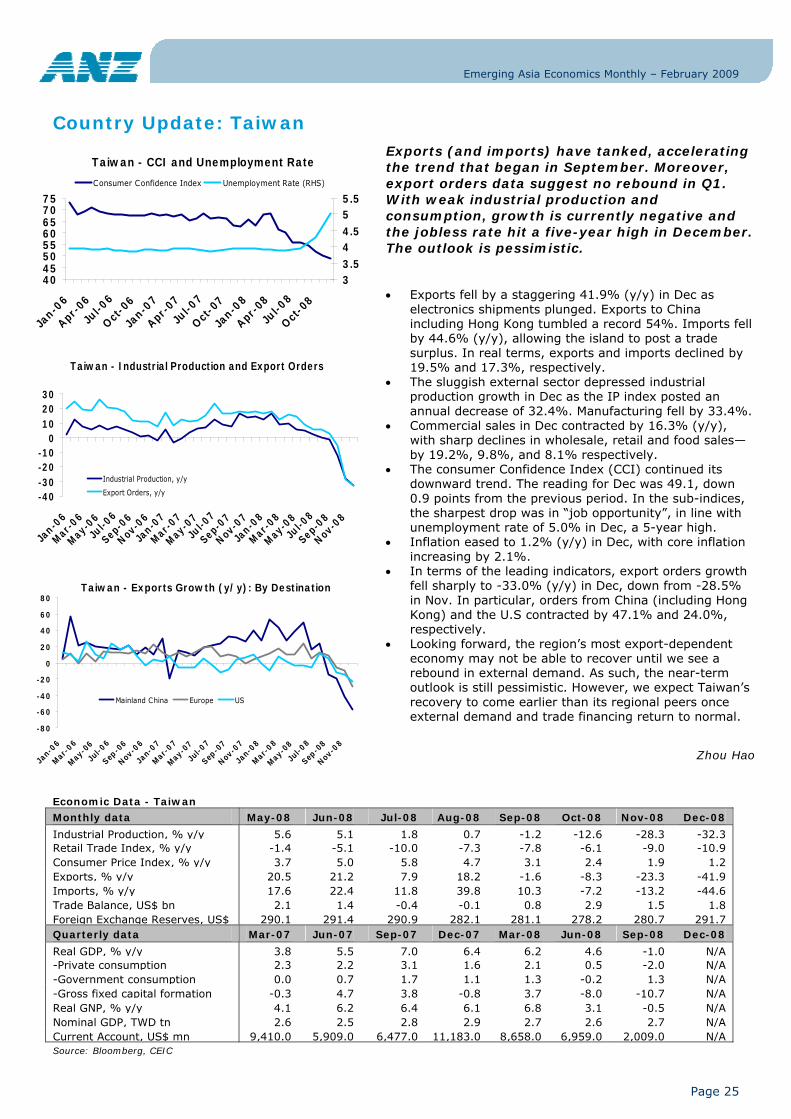
Emerging Asia Economics Monthly – February 2009
Page 25
Country Update: Taiwan
Economic Data - Taiwan Monthly data May-08 Jun-08 Jul-08 Aug-08 Sep-08 Oct-08 Nov-08 Dec-08
Industrial Production, % y/y 5.6 5.1 1.8 0.7 -1.2 -12.6 -28.3 -32.3 Retail Trade Index, % y/y -1.4 -5.1 -10.0 -7.3 -7.8 -6.1 -9.0 -10.9 Consumer Price Index, % y/y 3.7 5.0 5.8 4.7 3.1 2.4 1.9 1.2 Exports, % y/y 20.5 21.2 7.9 18.2 -1.6 -8.3 -23.3 -41.9 Imports, % y/y 17.6 22.4 11.8 39.8 10.3 -7.2 -13.2 -44.6 Trade Balance, US$ bn 2.1 1.4 -0.4 -0.1 0.8 2.9 1.5 1.8 Foreign Exchange Reserves, US$ 290.1 291.4 290.9 282.1 281.1 278.2 280.7 291.7 Quarterly data Mar-07 Jun-07 Sep-07 Dec-07 Mar-08 Jun-08 Sep-08 Dec-08
Real GDP, % y/y 3.8 5.5 7.0 6.4 6.2 4.6 -1.0 N/A -Private consumption 2.3 2.2 3.1 1.6 2.1 0.5 -2.0 N/A -Government consumption 0.0 0.7 1.7 1.1 1.3 -0.2 1.3 N/A -Gross fixed capital formation -0.3 4.7 3.8 -0.8 3.7 -8.0 -10.7 N/A Real GNP, % y/y 4.1 6.2 6.4 6.1 6.8 3.1 -0.5 N/A Nominal GDP, TWD tn 2.6 2.5 2.8 2.9 2.7 2.6 2.7 N/A Current Account, US$ mn 9,410.0 5,909.0 6,477.0 11,183.0 8,658.0 6,959.0 2,009.0 N/A Source: Bloomberg, CEIC
Exports (and imports) have tanked, accelerating the trend that began in September. Moreover, export orders data suggest no rebound in Q1. With weak industrial production and consumption, growth is currently negative and the jobless rate hit a five-year high in December. The outlook is pessimistic.
• Exports fell by a staggering 41.9% (y/y) in Dec as electronics shipments plunged. Exports to China including Hong Kong tumbled a record 54%. Imports fell by 44.6% (y/y), allowing the island to post a trade surplus. In real terms, exports and imports declined by 19.5% and 17.3%, respectively.
• The sluggish external sector depressed industrial production growth in Dec as the IP index posted an annual decrease of 32.4%. Manufacturing fell by 33.4%.
• Commercial sales in Dec contracted by 16.3% (y/y), with sharp declines in wholesale, retail and food sales—by 19.2%, 9.8%, and 8.1% respectively.
• The consumer Confidence Index (CCI) continued its downward trend. The reading for Dec was 49.1, down 0.9 points from the previous period. In the sub-indices, the sharpest drop was in “job opportunity”, in line with unemployment rate of 5.0% in Dec, a 5-year high.
• Inflation eased to 1.2% (y/y) in Dec, with core inflation increasing by 2.1%.
• In terms of the leading indicators, export orders growth fell sharply to -33.0% (y/y) in Dec, down from -28.5% in Nov. In particular, orders from China (including Hong Kong) and the U.S contracted by 47.1% and 24.0%, respectively.
• Looking forward, the region’s most export-dependent economy may not be able to recover until we see a rebound in external demand. As such, the near-term outlook is still pessimistic. However, we expect Taiwan’s recovery to come earlier than its regional peers once external demand and trade financing return to normal.
Zhou Hao
Taiwan - CCI and Unemployment Rate
4045505560657075
Jan-0
6
Apr-0
6
Jul-0
6
Oct-0
6
Jan-0
7
Apr-0
7
Jul-0
7
Oct-0
7
Jan-0
8
Apr-0
8
Jul-0
8
Oct-0
8
33.544.555.5
Consumer Confidence Index Unemployment Rate (RHS)
Taiwan - Industrial Production and Export Orders
-40-30-20-10
0102030
Jan-0
6
Mar-06
May-06
Jul-0
6
Sep-06
Nov-06
Jan-0
7
Mar-07
May-07
Jul-0
7
Sep-07
Nov-07
Jan-0
8
Mar-08
May-0
8
Jul-0
8
Sep-08
Nov-0
8
Industrial Production, y/y
Export Orders, y/y
Taiwan - Exports Growth (y/y): By Destination
-80
-60
-40
-20
0
20
40
60
80
Jan-
06
Mar
-06
May
-06
Jul-0
6
Sep-0
6
Nov-0
6
Jan-
07
Mar
-07
May
-07
Jul-0
7
Sep-0
7
Nov-0
7
Jan-
08
Mar
-08
May
-08
Jul-0
8
Sep-0
8
Nov-0
8
Mainland China Europe US

Emerging Asia Economics Monthly – February 2009
Page 26
Taiwan: FX and Rates Strategy
Market Forecasts - Taiwan FX Current Ytd (%) Mar-09 Jun-09 Sep-09 Dec-09 Mar-10 Jun-10
USD-TWD 33.69 2.7% 34.2 35.2 36.0 36.0 35.5 35.0 AUD-TWD 21.69 -6.0% 22.6 22.2 20.9 20.2 19.2 18.9 NZD-TWD 17.21 -9.5% 19.8 19.4 19.1 18.0 17.4 16.8 JPY-TWD 0.376 4.0% 0.349 0.359 0.360 0.356 0.348 0.333 EUR-TWD 43.33 -5.5% 42.8 42.2 41.0 38.9 38.3 37.8 Rates Current Ytd (bps) Mar-09 Jun-09 Sep-09 Dec-09 Mar-10 Jun-10
CBC's discount rate 1.50 -50 1.50 1.00 0.50 0.50 1.00 1.25 3-month CP 0.74 -34 0.5 0.4 0.4 0.4 0.6 0.9 2-year IRS (versus 3M CP) 0.88 -18 0.6 0.5 0.5 0.5 0.8 1.0 10-year IRS 1.55 11 1.5 1.4 1.4 1.4 1.5 1.6
Sources: ANZ and Bloomberg
The TWD has started to play a bit of “catch-up” within AXJ, falling 3% against the USD in January—compared with a relatively benign 1% loss for 2008 as a whole. The catalyst was a 42% (y/y) drop in December exports. As the economic outlook for Q1 remains bleak, further gains in USD-TWD are expected in the months ahead.
FX Within AXJ, Taiwan is one of the more exposed economies to a global slowdown, with exports nearly 75% of GDP. As such, a 42% (y/y) hit to exports in December and prospects for further fallout in Q1 has not gone unnoticed by currency markets or by the authorities, who tightly manage the TWD. The CBC has even said that it does not favour appreciation in the TWD. Indeed, the TWD has already slipped 3% against the USD in January—compared with a 1% loss for all of 2008. Further gains in USD-TWD are expected in the months ahead, although seasonal flows should help the pair tread water over the near-term. Net foreign portfolio flows remained negative in January at -$1.6bn, but the pace of outflows has slowed—for a gain of 14% (y/y). Rates We expect another 50 bps of rate cuts before the CBC brings an end to its easing cycle. With the policy rate now at 1.50%, however, the CBC has less ammunition than other central banks in the region. As such, TWD rates markets are likely to under-perform. We maintain a neutral view on the curve, which was relatively unresponsive to the cumulative 212.5 bps of cuts in 2008.
Tamara Henderson
USD-TWD yet to fully align with AXJ
28
29
30
31
32
33
34
May
-08
Jul-0
8
Sep-0
8
Nov-0
8
Jan-
09
USD-TWD 12M NDF
TWD IRS curve steepened in January (bps)
-30-25-20-15-10
-505
1015
1 2 3 4 5 6 7 8 9 10
2Y IRS to trough near 0.50%
0.00.51.01.52.02.53.03.54.0
May
-08
Aug-
08
Nov
-08
Feb-
09
May
-09
Aug-
09
Nov
-09
Feb-
10
May
-10
CBC 2Y IRS
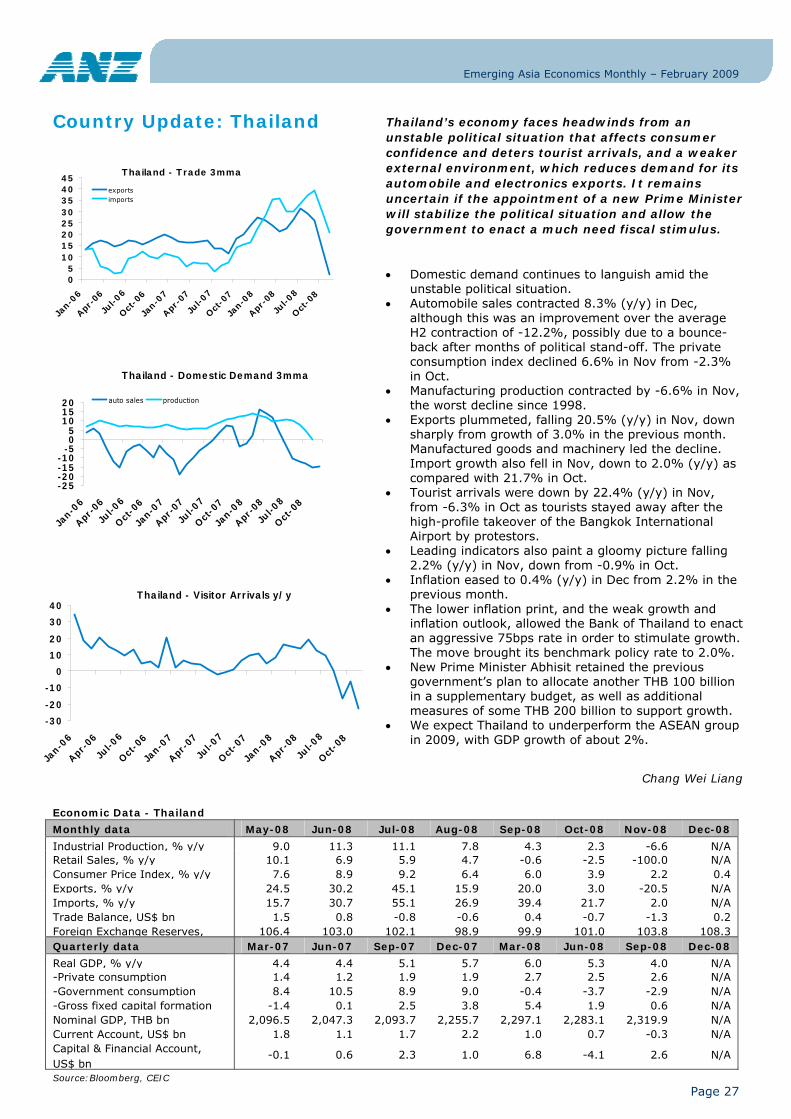
Emerging Asia Economics Monthly – February 2009
Page 27
Country Update: Thailand
Economic Data - Thailand Monthly data May-08 Jun-08 Jul-08 Aug-08 Sep-08 Oct-08 Nov-08 Dec-08
Industrial Production, % y/y 9.0 11.3 11.1 7.8 4.3 2.3 -6.6 N/A Retail Sales, % y/y 10.1 6.9 5.9 4.7 -0.6 -2.5 -100.0 N/A Consumer Price Index, % y/y 7.6 8.9 9.2 6.4 6.0 3.9 2.2 0.4 Exports, % y/y 24.5 30.2 45.1 15.9 20.0 3.0 -20.5 N/A Imports, % y/y 15.7 30.7 55.1 26.9 39.4 21.7 2.0 N/A Trade Balance, US$ bn 1.5 0.8 -0.8 -0.6 0.4 -0.7 -1.3 0.2 Foreign Exchange Reserves, 106.4 103.0 102.1 98.9 99.9 101.0 103.8 108.3 Quarterly data Mar-07 Jun-07 Sep-07 Dec-07 Mar-08 Jun-08 Sep-08 Dec-08
Real GDP, % y/y 4.4 4.4 5.1 5.7 6.0 5.3 4.0 N/A -Private consumption 1.4 1.2 1.9 1.9 2.7 2.5 2.6 N/A -Government consumption 8.4 10.5 8.9 9.0 -0.4 -3.7 -2.9 N/A -Gross fixed capital formation -1.4 0.1 2.5 3.8 5.4 1.9 0.6 N/A Nominal GDP, THB bn 2,096.5 2,047.3 2,093.7 2,255.7 2,297.1 2,283.1 2,319.9 N/A Current Account, US$ bn 1.8 1.1 1.7 2.2 1.0 0.7 -0.3 N/A Capital & Financial Account, US$ bn
-0.1 0.6 2.3 1.0 6.8 -4.1 2.6 N/A
Source:Bloomberg, CEIC
Thailand - Visitor Arrivals y/y
-30
-20
-10
0
10
20
30
40
Jan-0
6
Apr-0
6
Jul-0
6
Oct-0
6
Jan-0
7
Apr-0
7
Jul-0
7
Oct-0
7
Jan-0
8
Apr-0
8
Jul-0
8
Oct-0
8
Thailand - Trade 3mma
05
1015202530354045
Jan-0
6
Apr-0
6
Jul-0
6
Oct
-06
Jan-0
7
Apr-0
7
Jul-0
7
Oct
-07
Jan-0
8
Apr-0
8
Jul-0
8
Oct
-08
exportsimports
Thailand - Domestic Demand 3mma
-25-20-15-10
-505
101520
Jan-0
6
Apr-0
6
Jul-0
6
Oct-0
6
Jan-0
7
Apr-0
7
Jul-0
7
Oct-0
7
Jan-0
8
Apr-0
8
Jul-0
8
Oct-0
8
auto sales production
Thailand’s economy faces headwinds from an unstable political situation that affects consumer confidence and deters tourist arrivals, and a weaker external environment, which reduces demand for its automobile and electronics exports. It remains uncertain if the appointment of a new Prime Minister will stabilize the political situation and allow the government to enact a much need fiscal stimulus.
• Domestic demand continues to languish amid the unstable political situation.
• Automobile sales contracted 8.3% (y/y) in Dec, although this was an improvement over the average H2 contraction of -12.2%, possibly due to a bounce-back after months of political stand-off. The private consumption index declined 6.6% in Nov from -2.3% in Oct.
• Manufacturing production contracted by -6.6% in Nov, the worst decline since 1998.
• Exports plummeted, falling 20.5% (y/y) in Nov, down sharply from growth of 3.0% in the previous month. Manufactured goods and machinery led the decline. Import growth also fell in Nov, down to 2.0% (y/y) as compared with 21.7% in Oct.
• Tourist arrivals were down by 22.4% (y/y) in Nov, from -6.3% in Oct as tourists stayed away after the high-profile takeover of the Bangkok International Airport by protestors.
• Leading indicators also paint a gloomy picture falling 2.2% (y/y) in Nov, down from -0.9% in Oct.
• Inflation eased to 0.4% (y/y) in Dec from 2.2% in the previous month.
• The lower inflation print, and the weak growth and inflation outlook, allowed the Bank of Thailand to enact an aggressive 75bps rate in order to stimulate growth. The move brought its benchmark policy rate to 2.0%.
• New Prime Minister Abhisit retained the previous government’s plan to allocate another THB 100 billion in a supplementary budget, as well as additional measures of some THB 200 billion to support growth.
• We expect Thailand to underperform the ASEAN group in 2009, with GDP growth of about 2%.
Chang Wei Liang
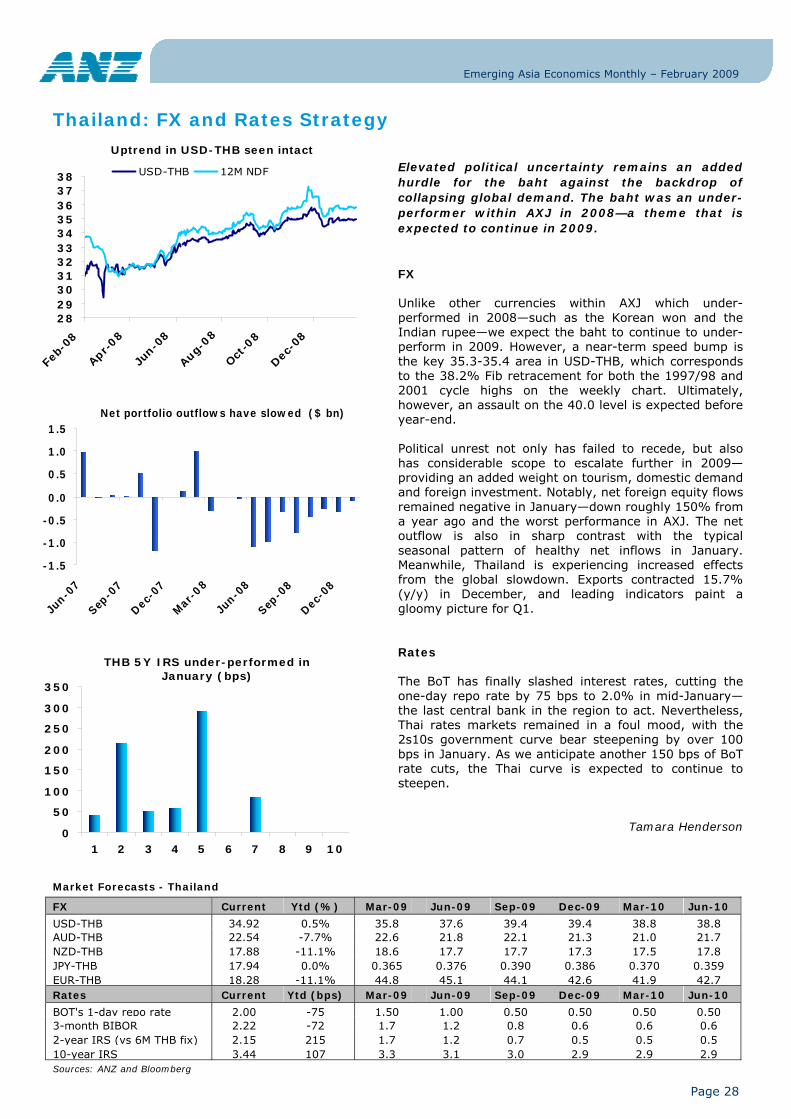
Emerging Asia Economics Monthly – February 2009
Page 28
Thailand: FX and Rates Strategy
Market Forecasts - Thailand
FX Current Ytd (%) Mar-09 Jun-09 Sep-09 Dec-09 Mar-10 Jun-10
USD-THB 34.92 0.5% 35.8 37.6 39.4 39.4 38.8 38.8 AUD-THB 22.54 -7.7% 22.6 21.8 22.1 21.3 21.0 21.7 NZD-THB 17.88 -11.1% 18.6 17.7 17.7 17.3 17.5 17.8 JPY-THB 17.94 0.0% 0.365 0.376 0.390 0.386 0.370 0.359 EUR-THB 18.28 -11.1% 44.8 45.1 44.1 42.6 41.9 42.7 Rates Current Ytd (bps) Mar-09 Jun-09 Sep-09 Dec-09 Mar-10 Jun-10
BOT's 1-day repo rate 2.00 -75 1.50 1.00 0.50 0.50 0.50 0.50 3-month BIBOR 2.22 -72 1.7 1.2 0.8 0.6 0.6 0.6 2-year IRS (vs 6M THB fix) 2.15 215 1.7 1.2 0.7 0.5 0.5 0.5 10-year IRS 3.44 107 3.3 3.1 3.0 2.9 2.9 2.9 Sources: ANZ and Bloomberg
Uptrend in USD-THB seen intact
2829303132333435363738
Feb-
08
Apr-08
Jun-0
8
Aug-08
Oct-0
8
Dec-0
8
USD-THB 12M NDF
Net portfolio outflows have slowed ($ bn)
-1.5
-1.0
-0.5
0.0
0.5
1.0
1.5
Jun-0
7
Sep-0
7
Dec-0
7
Mar
-08
Jun-0
8
Sep-0
8
Dec-0
8
THB 5Y IRS under-performed in January (bps)
0
50
100
150
200
250
300
350
1 2 3 4 5 6 7 8 9 10
Elevated political uncertainty remains an added hurdle for the baht against the backdrop of collapsing global demand. The baht was an under-performer within AXJ in 2008—a theme that is expected to continue in 2009.
FX Unlike other currencies within AXJ which under-performed in 2008—such as the Korean won and the Indian rupee—we expect the baht to continue to under-perform in 2009. However, a near-term speed bump is the key 35.3-35.4 area in USD-THB, which corresponds to the 38.2% Fib retracement for both the 1997/98 and 2001 cycle highs on the weekly chart. Ultimately, however, an assault on the 40.0 level is expected before year-end. Political unrest not only has failed to recede, but also has considerable scope to escalate further in 2009—providing an added weight on tourism, domestic demand and foreign investment. Notably, net foreign equity flows remained negative in January—down roughly 150% from a year ago and the worst performance in AXJ. The net outflow is also in sharp contrast with the typical seasonal pattern of healthy net inflows in January. Meanwhile, Thailand is experiencing increased effects from the global slowdown. Exports contracted 15.7% (y/y) in December, and leading indicators paint a gloomy picture for Q1. Rates The BoT has finally slashed interest rates, cutting the one-day repo rate by 75 bps to 2.0% in mid-January—the last central bank in the region to act. Nevertheless, Thai rates markets remained in a foul mood, with the 2s10s government curve bear steepening by over 100 bps in January. As we anticipate another 150 bps of BoT rate cuts, the Thai curve is expected to continue to steepen.
Tamara Henderson
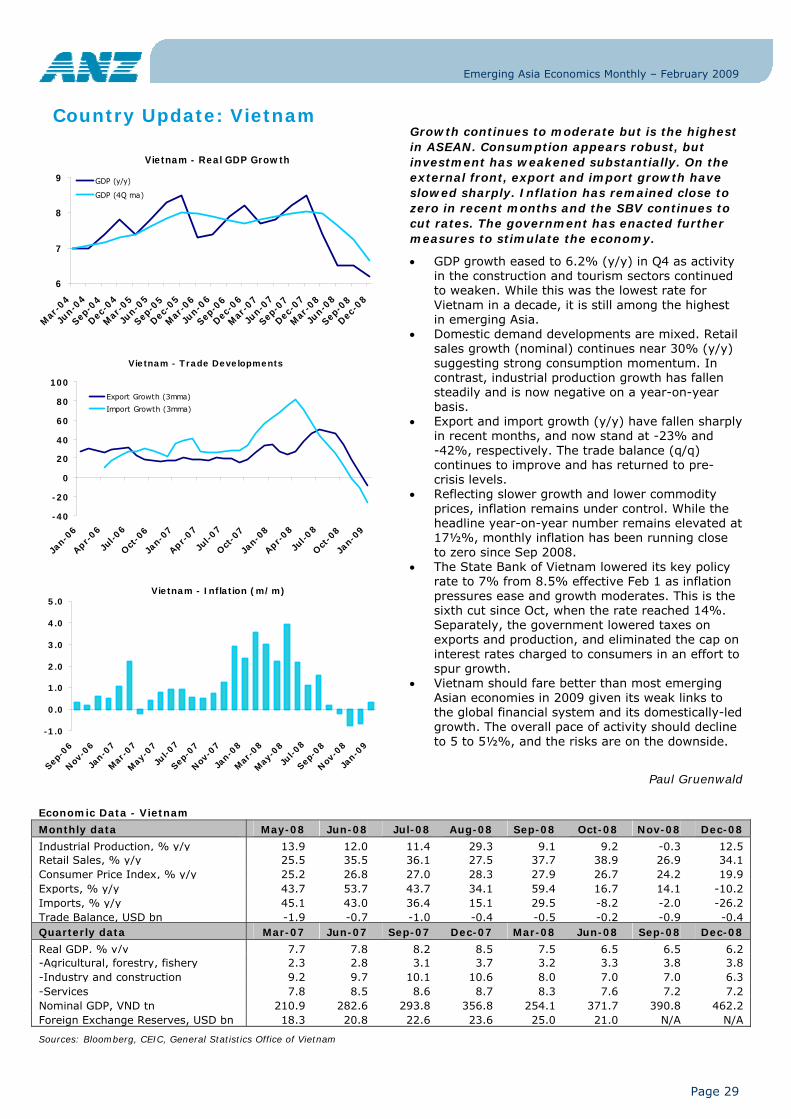
Emerging Asia Economics Monthly – February 2009
Page 29
Country Update: Vietnam
Economic Data - Vietnam
Monthly data May-08 Jun-08 Jul-08 Aug-08 Sep-08 Oct-08 Nov-08 Dec-08
Industrial Production, % y/y 13.9 12.0 11.4 29.3 9.1 9.2 -0.3 12.5 Retail Sales, % y/y 25.5 35.5 36.1 27.5 37.7 38.9 26.9 34.1 Consumer Price Index, % y/y 25.2 26.8 27.0 28.3 27.9 26.7 24.2 19.9 Exports, % y/y 43.7 53.7 43.7 34.1 59.4 16.7 14.1 -10.2 Imports, % y/y 45.1 43.0 36.4 15.1 29.5 -8.2 -2.0 -26.2 Trade Balance, USD bn -1.9 -0.7 -1.0 -0.4 -0.5 -0.2 -0.9 -0.4 Quarterly data Mar-07 Jun-07 Sep-07 Dec-07 Mar-08 Jun-08 Sep-08 Dec-08
Real GDP, % y/y 7.7 7.8 8.2 8.5 7.5 6.5 6.5 6.2 -Agricultural, forestry, fishery 2.3 2.8 3.1 3.7 3.2 3.3 3.8 3.8 -Industry and construction 9.2 9.7 10.1 10.6 8.0 7.0 7.0 6.3 -Services 7.8 8.5 8.6 8.7 8.3 7.6 7.2 7.2 Nominal GDP, VND tn 210.9 282.6 293.8 356.8 254.1 371.7 390.8 462.2 Foreign Exchange Reserves, USD bn 18.3 20.8 22.6 23.6 25.0 21.0 N/A N/A
Sources: Bloomberg, CEIC, General Statistics Office of Vietnam
Growth continues to moderate but is the highest in ASEAN. Consumption appears robust, but investment has weakened substantially. On the external front, export and import growth have slowed sharply. Inflation has remained close to zero in recent months and the SBV continues to cut rates. The government has enacted further measures to stimulate the economy.
• GDP growth eased to 6.2% (y/y) in Q4 as activity in the construction and tourism sectors continued to weaken. While this was the lowest rate for Vietnam in a decade, it is still among the highest in emerging Asia.
• Domestic demand developments are mixed. Retail sales growth (nominal) continues near 30% (y/y) suggesting strong consumption momentum. In contrast, industrial production growth has fallen steadily and is now negative on a year-on-year basis.
• Export and import growth (y/y) have fallen sharply in recent months, and now stand at -23% and -42%, respectively. The trade balance (q/q) continues to improve and has returned to pre-crisis levels.
• Reflecting slower growth and lower commodity prices, inflation remains under control. While the headline year-on-year number remains elevated at 17½%, monthly inflation has been running close to zero since Sep 2008.
• The State Bank of Vietnam lowered its key policy rate to 7% from 8.5% effective Feb 1 as inflation pressures ease and growth moderates. This is the sixth cut since Oct, when the rate reached 14%. Separately, the government lowered taxes on exports and production, and eliminated the cap on interest rates charged to consumers in an effort to spur growth.
• Vietnam should fare better than most emerging Asian economies in 2009 given its weak links to the global financial system and its domestically-led growth. The overall pace of activity should decline to 5 to 5½%, and the risks are on the downside.
Paul Gruenwald
Vietnam - Real GDP Growth
6
7
8
9
Mar
-04
Jun-0
4
Sep-0
4
Dec-0
4
Mar
-05
Jun-0
5
Sep-0
5
Dec-0
5
Mar
-06
Jun-0
6
Sep-0
6
Dec-0
6
Mar
-07
Jun-0
7
Sep-0
7
Dec-0
7
Mar
-08
Jun-0
8
Sep-0
8
Dec-0
8
GDP (y/y)
GDP (4Q ma)
Vietnam - Inflation (m/m)
-1.0
0.0
1.0
2.0
3.0
4.0
5.0
Sep-0
6
Nov
-06
Jan-0
7
Mar
-07
May
-07
Jul-0
7
Sep-0
7
Nov
-07
Jan-0
8
Mar
-08
May
-08
Jul-0
8
Sep-0
8
Nov
-08
Jan-0
9
Vietnam - Trade Developments
-40
-20
0
20
40
60
80
100
Jan-
06
Apr-06
Jul-0
6
Oct
-06
Jan-
07
Apr-07
Jul-0
7
Oct
-07
Jan-
08
Apr-08
Jul-0
8
Oct
-08
Jan-
09
Export Growth (3mma)
Import Growth (3mma)
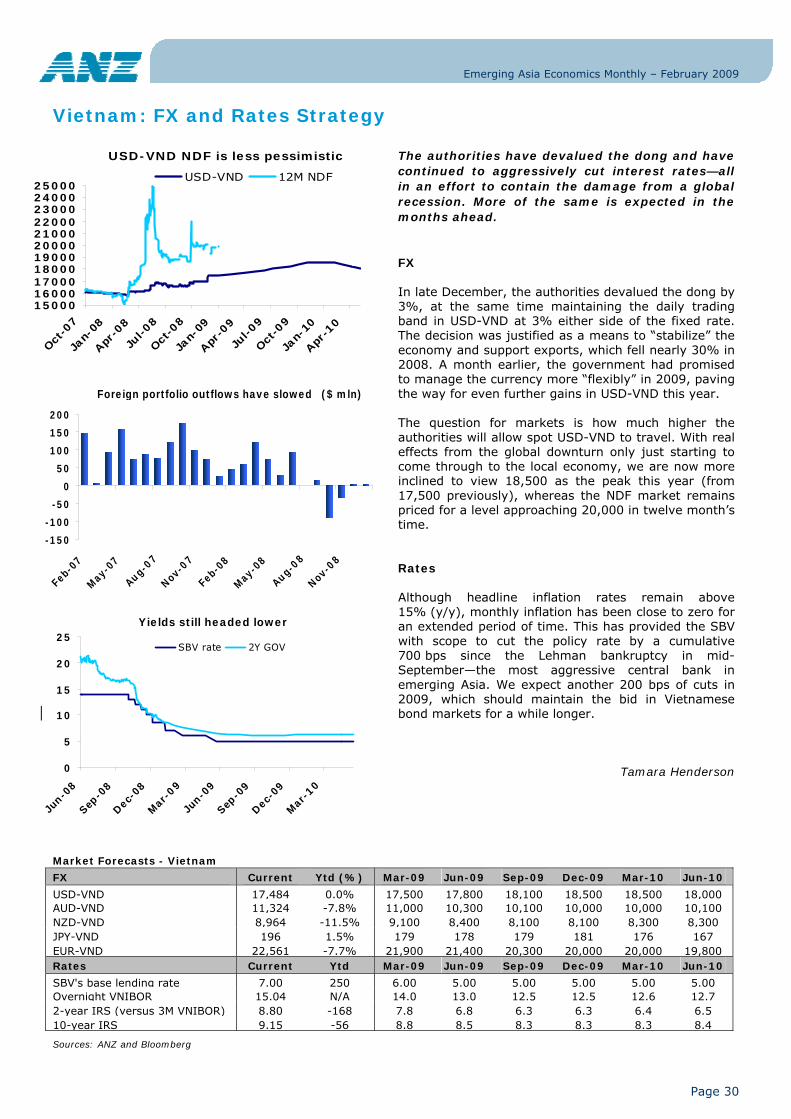
Emerging Asia Economics Monthly – February 2009
Page 30
Vietnam: FX and Rates Strategy
Market Forecasts - Vietnam FX Current Ytd (%) Mar-09 Jun-09 Sep-09 Dec-09 Mar-10 Jun-10
USD-VND 17,484 0.0% 17,500 17,800 18,100 18,500 18,500 18,000 AUD-VND 11,324 -7.8% 11,000 10,300 10,100 10,000 10,000 10,100 NZD-VND 8,964 -11.5% 9,100 8,400 8,100 8,100 8,300 8,300 JPY-VND 196 1.5% 179 178 179 181 176 167 EUR-VND 22,561 -7.7% 21,900 21,400 20,300 20,000 20,000 19,800 Rates Current Ytd Mar-09 Jun-09 Sep-09 Dec-09 Mar-10 Jun-10
SBV's base lending rate 7.00 250 6.00 5.00 5.00 5.00 5.00 5.00 Overnight VNIBOR 15.04 N/A 14.0 13.0 12.5 12.5 12.6 12.7 2-year IRS (versus 3M VNIBOR) 8.80 -168 7.8 6.8 6.3 6.3 6.4 6.5 10-year IRS 9.15 -56 8.8 8.5 8.3 8.3 8.3 8.4
Sources: ANZ and Bloomberg
The authorities have devalued the dong and have continued to aggressively cut interest rates—all in an effort to contain the damage from a global recession. More of the same is expected in the months ahead.
FX
In late December, the authorities devalued the dong by 3%, at the same time maintaining the daily trading band in USD-VND at 3% either side of the fixed rate. The decision was justified as a means to “stabilize” the economy and support exports, which fell nearly 30% in 2008. A month earlier, the government had promised to manage the currency more “flexibly” in 2009, paving the way for even further gains in USD-VND this year. The question for markets is how much higher the authorities will allow spot USD-VND to travel. With real effects from the global downturn only just starting to come through to the local economy, we are now more inclined to view 18,500 as the peak this year (from 17,500 previously), whereas the NDF market remains priced for a level approaching 20,000 in twelve month’s time. Rates Although headline inflation rates remain above 15% (y/y), monthly inflation has been close to zero for an extended period of time. This has provided the SBV with scope to cut the policy rate by a cumulative 700 bps since the Lehman bankruptcy in mid-September—the most aggressive central bank in emerging Asia. We expect another 200 bps of cuts in 2009, which should maintain the bid in Vietnamese bond markets for a while longer.
Tamara Henderson
Foreign portfolio outflows have slowed ($ mln)
-150
-100
-50
0
50
100
150
200
Feb-
07
May-0
7
Aug-07
Nov-07
Feb-
08
May-0
8
Aug-08
Nov-08
USD-VND NDF is less pessimistic
1500016000170001800019000200002100022000230002400025000
Oct
-07
Jan-
08
Apr-0
8
Jul-08
Oct
-08
Jan-
09
Apr-0
9
Jul-09
Oct
-09
Jan-
10
Apr-1
0
USD-VND 12M NDF
Yields still headed lower
0
5
10
15
20
25
Jun-0
8
Sep-0
8
Dec-0
8
Mar
-09
Jun-0
9
Sep-0
9
Dec-0
9
Mar
-10
SBV rate 2Y GOV
Emerging Asia Economics Monthly – February 2009
Page 31
Contacts ANZ Economics & Markets Research Saul Eslake Chief Economist +61 3 9273 6251 [email protected] Fiona Allen Business Manager +61 3 9273 6224 [email protected] Industry and Strategic Research Julie Toth Senior Economist +61 3 9273 6252 [email protected]
Paul Deane Rural and Regional Economist +61 3 9273 6295 [email protected]
Australian Economics and Interest Rates Research
Warren Hogan Head of Australian Economics and Interest Rates Research +61 2 9227 1562 [email protected]
Katie Dean Senior Economist +61 3 9273 1381 [email protected]
Riki Polygenis Economist +61 3 9273 4060 [email protected]
Dr. Alex Joiner Economist +61 3 9273 6123 [email protected]
Patricia Gacis Strategist +61 2 9227 1272 [email protected]
Global Markets Credit Research
Jason Hill Global Markets Credit Analyst 0434 312 356 [email protected]
Commodities Research
Mark Pervan Head of Commodities Research +61 3 9273 3716 [email protected]
Amber Rabinov Economist +61 3 9273 4853 [email protected]
Doug Whitehead Soft Commodity Strategist +61 3 9273 6684 [email protected]
Natalie Robertson Graduate Analyst +61 3 9273 3415 [email protected]
Property and Financial System Research
Paul Braddick Head of Property and Financial System Research +61 3 9273 5987 [email protected]
Ange Montalti Senior Economist +61 3 9273 6288 [email protected]
Dr. Alex Joiner Economist +61 3 9273 6123 [email protected]
Stephanie Wayne Research Analyst +61 3 9273 4075 [email protected]
Foreign Exchange and International Economics Research
Amy Auster Head of Foreign Exchange and International Economics Research +61 3 9273 5417 [email protected]
Tony Morriss Senior Currency Strategist +61 2 9226 6757 [email protected]
Amber Rabinov Economist +61 3 9273 4853 [email protected]
Foreign Exchange and Interest Rates Research (London)
Tim Riddell Currency and Interest Rate Strategist [email protected]
Asian Economics Research (Singapore)
Paul Gruenwald Chief Economist. Asia +65 6419 7902 [email protected]
Tamara Henderson Director, Currency & Rates Strategy +65 6216 1845 [email protected] Chang Wei Liang Analyst, Economic Research +65 6216 1838 [email protected]
New Zealand Economics Research (Wellington)
Cameron Bagrie Chief Economist, New Zealand +64 4 802 2212 [email protected]
Khoon Goh Senior Economist +64 4 802 2357 [email protected]
Philip Borkin Economist +64 4 802 2199 [email protected]
Steve Edwards Economist +64 4 802 2217 [email protected]
Kevin Wilson Rural Economist +64 4 802 2361 [email protected]
David Croy Interest Rate Strategist +64 4 802 2286 [email protected]
Research and Information Services
Marilla Rough Senior Information Officer +61 3 9273 6263 [email protected]
Manesha Jayasuriya Publications Coordinator +61 3 9273 4121 [email protected]
Emerging Asia Economics Monthly – February 2009
Page 32
Important Notice
Australia and New Zealand Banking Group Limited is represented in:
AUSTRALIA by:
Australia and New Zealand Banking Group Limited ABN 11 005 357 522
14th Floor 100 Queen Street, Melbourne, Victoria, 3000, Australia
Telephone +61 3 9273 6224 Fax +61 3 9273 5711
UNITED KINGDOM by:
Australia and New Zealand Banking Group Limited
ABN 11 005 357 522
40 Bank Street, Canary Wharf, London, E14 5EJ, United Kingdom
Telephone +44 20 3229 2121 Fax +44 20 7378 2378
UNITED STATES OF AMERICA by:
ANZ Securities, Inc. (Member of FINRA and SIPC)
6th Floor 1177 Avenue of the Americas
New York, NY 10036, United States of America
Tel: +1 212 801 9160 Fax: +1 212 801 9163
NEW ZEALAND by:
ANZ National Bank Limited
Level 7, 1-9 Victoria Street, Wellington, New Zealand
Telephone +64 4 802 2000 This document (“document”) is distributed to you in Australia and the United Kingdom by Australia and New Zealand Banking Group Limited ABN 11 005 357 522 (“ANZ”) and in New Zealand by ANZ National Bank Limited (“ANZ NZ”). ANZ holds an Australian Financial Services licence no. 234527 and is authorised in the UK by the Financial Services Authority (“FSA”).
This document is being distributed in the United States by ANZ Securities, Inc. (“ANZ S”) (an affiliated company of ANZ), which accepts responsibility for its content. Further information on any securities referred to herein may be obtained from ANZ S upon request. Any US person(s) receiving this document and wishing to effect transactions in any securities referred to herein should contact ANZ S, not its affiliates.
This document is being distributed in the United Kingdom by ANZ for the information of its market counterparties and intermediate customers only. It is not intended for and must not be distributed to private customers. In the UK, ANZ is regulated by the FSA. Nothing here excludes or restricts any duty or liability to a customer which ANZ may have under the UK Financial Services and Markets Act 2000 or under the regulatory system as defined in the Rules of the FSA.
This document is issued on the basis that it is only for the information of the particular person to whom it is provided. This document may not be reproduced, distributed or published by any recipient for any purpose. This document does not take into account your personal needs and financial circumstances. Under no circumstances is this document to be used or considered as an offer to sell, or a solicitation of an offer to buy.
In addition, from time to time ANZ, ANZ NZ, ANZ S, their affiliated companies, or their respective associates and employees may have an interest in any financial products (as defined by the Australian Corporations Act 2001), securities or other investments, directly or indirectly the subject of this document (and may receive commissions or other remuneration in relation to the sale of such financial products, securities or other investments), or may perform services for, or solicit business from, any company the subject of this document. If you have been referred to ANZ, ANZ NZ, ANZ S or their affiliated companies by any person, that person may receive a benefit in respect of any transactions effected on your behalf, details of which will be available upon request.
The information herein has been obtained from, and any opinions herein are based upon, sources believed reliable. The views expressed in this document accurately reflect the author’s personal views, including those about any and all of the securities and issuers referred to herein. The author however makes no representation as to its accuracy or completeness and the information should not be relied upon as such. All opinions and estimates herein reflect the author’s judgement on the date of this document and are subject to change without notice. No part of the author's compensation was, is or will directly or indirectly relate to specific recommendations or views expressed about any securities or issuers in this document. ANZ, ANZ NZ, ANZ S, their affiliated companies, their respective directors, officers, and employees disclaim any responsibility, and shall not be liable, for any loss, damage, claim, liability, proceedings, cost or expense (“Liability”) arising directly or indirectly (and whether in tort (including negligence), contract, equity or otherwise) out of or in connection with the contents of and/or any omissions from this communication except where a Liability is made non-excludable by legislation.
Where the recipient of this publication conducts a business, the provisions of the Consumer Guarantees Act 1993 (NZ) shall not apply.