Embed Size (px)
Citation preview
Anxiety and depression in a sample of UK college students: a study of prevalence, comorbidity, and quality of life
Article
Accepted Version
Jenkins, P. E., Ducker, I., Gooding, R., James, M. and Rutter-Eley, E. (2020) Anxiety and depression in a sample of UK college students: a study of prevalence, comorbidity, and quality of life. Journal of American College Health. ISSN 1940-3208 doi: https://doi.org/10.1080/07448481.2019.1709474 Available at http://centaur.reading.ac.uk/88148/
It is advisable to refer to the publisher’s version if you intend to cite from the work. See Guidance on citing .
To link to this article DOI: http://dx.doi.org/10.1080/07448481.2019.1709474
Publisher: Taylor & Francis
All outputs in CentAUR are protected by Intellectual Property Rights law, including copyright law. Copyright and IPR is retained by the creators or other copyright holders. Terms and conditions for use of this material are defined in

the End User Agreement .
www.reading.ac.uk/centaur
CentAUR
Central Archive at the University of Reading
Reading’s research outputs online
Anxiety and depression in a sample of UK college students: A study of prevalence,
comorbidity, and quality of life
Abstract
Objective: This study sought to estimate the prevalence of depression and anxiety in UK
college students and examine associations between mental health symptoms and quality of
life (QoL). Associations between psychiatric comorbidity and degree of QoL impairment
were also investigated.
Participants: Participants (N = 286) were recruited from a UK university (76.1% ≤20 years-
old; 86.8% female; 71.1% White).
Methods: Self-report measures of depression, anxiety, and QoL were completed online.
Group differences and within-group associations were examined with Chi-square analyses,
linear regressions, and ANOVAs.
Results: Prevalence rates were in line with global estimates and suggest female students are
at elevated risk of mental health problems. Symptom severity and comorbidity were
associated with greater QoL impairment.
Conclusions: Presence of depression, anxiety, or both was associated with QoL impairment.
Findings develop understanding of the impact of mental health problems on QoL and could
inform appropriate screening and effective interventions for student mental health.
Keywords: Depression; Anxiety; College students; Quality of life; Comorbidity
Word count: 2824 Words; Abstract: 150 Words
Introduction
Individuals enrolled in higher education courses (hereafter referred to as “college students”)
represent a high-risk group for the experience of mental health problems and associated
impairment. The majority of all lifetime cases of psychiatric disorders have developed by the
age of 24,1,2 and the prevalence of mental health problems in college populations is likely to
be increasing.3,4 The presence of mental health problems is “clearly associated”5(p97) with
poorer educational outcomes and, in the UK, 94% of higher education providers reported
increased demand for counselling services over the most recent five years.4
Although several prevalence studies have been conducted, use of appropriate screening
instruments has not been widespread.6 Furthermore, few studies have been carried out in the
United Kingdom (UK), leading to unclear estimates of the scope and impact of mental health
problems. Recent surveys have suggested that around one in five UK students experience
mental health problems (e.g.,4), in line with studies using standardized instruments. For
example, Macaskill7 reported “psychiatric caseness” in 17.3% of undergraduates at a
university in the north of England, and a study in Northern Ireland, conducted as part of the
World Health Organisation (WHO) World Mental Health International College Student
Initiative (see http://www.hcp.med.harvard.edu/wmh/college_student_survey.php), reported
that nearly a quarter of first-year undergraduate students reported a major depressive episode
or anxiety disorder in the year prior to starting university.8 Worldwide, it appears that around
one-third of college students report current (i.e., within the last 12 months) mental health
problems (e.g., see 9,10).
Often overlooked in such studies is an estimate of comorbidity, where more than one
psychiatric disorder is present simultaneously. Such comorbidity has been shown to be
common in general population surveys1 (see also 11) and is associated with greater
impairment than one syndrome alone (e.g.,12). In one of the few studies conducted in college
samples, Eisenberg, Golberstein and Hunt13 concluded that the presence of both anxiety and
depression was associated with poorer educational outcomes than depression alone. In
addition, whilst more information is needed to establish prevalence rates in students,8 detailed
data on the impact of these symptoms on functioning would also be illustrative (see 14).
Quality of life (QoL) is defined by the WHO as an individual’s “perception of their position
in life in the context of the culture and value systems in which they live and in relation to
their goals, expectations, standards and concerns”15(p1405). Impairment in QoL – particularly
that related to illness, known as health-related quality of life (HRQoL) – is strongly
associated with poorer health status and has therefore become an important metric within
mental health.16 Roberts, Lenton, Keetharuth, and Brazier17 concluded that there is currently
a “dearth of country specific data on the impact of mental health conditions,”(p1) and that this
is particularly apparent in the UK. Estimating the impact of an illness (e.g., by measuring
HRQoL) can provide an assessment of health status for an individual or sample, as well as
enable standardised comparisons between the diverse health conditions likely to be seen in
epidemiological studies. Further, studies of student mental health which include an
assessment of HRQoL offer a unique perspective16 and can provide information to help
improve the academic and social functioning of those identified as being at high risk.18
Results can also provide insights into help-seeking, given the relationship between
individuals’ reported HRQoL and odds of receiving treatment for a mental health problem.19
Studies of students support the relationship between mental health symptoms and
impairment. For example, a number of studies have found that students who screened
positive for depression scored lower on a number of HRQoL domains,20,21 with social
functioning and close relationships particularly affected.14 However, past research has rarely
considered the specific impact of comorbidity and often provided limited exploration of the
association between mental health symptoms and HRQoL.
The objectives of the present study were to provide an estimate of the prevalence of
depression and anxiety in students at a university in England and to examine associations
between mental health symptoms and HRQoL. A further goal was to explore the association
between psychiatric comorbidity and HRQoL impairment in this population.
Materials and Methods
Participants and procedure
Undergraduate and postgraduate students in the School of Psychology and Clinical Language
Sciences (PCLS) at an urban university in the southeast of England were approached via
student webmail lists or through a dedicated research participation scheme (where
participation results in partial degree credit). Procedures for obtaining informed consent were
included as part of the survey and participants were free to withhold answers or stop
completing the survey at any time. Two-hundred and eighty-six participants completed the
online survey between November 2018 and January 2019. Demographic questions were
asked first, followed by the remaining measures of interest, which were presented in the order
given below.
Ethics approval
The study was reviewed by the PCLS Ethics Committee and resources regarding mental
health support groups were provided to all participants upon completion of the study. The
study was performed in accordance with ethical standards as laid down in the 1964
Declaration of Helsinki and its later amendments.
Measures
Participants were asked to indicate their age, the gender with which they identified, and their
ethnicity. As part of a larger study, other measures were included but only those relevant to
this study are reported here:
1. The PHQ-2 has been developed as a brief screening measure for depression.22 It
comprises two items of the PHQ-9,23 concerning symptoms over the previous two
weeks. Specifically, it asks how often participants have been bothered by: (1) “little
interest or pleasure in doing things”; and (2) “feeling, down, depressed, or hopeless”.
Items are scored on a 0 – 3 scale (ranging from “not at all” to “nearly every day”). A
cutoff of ≥3 has been suggested for diagnosis of any depressive disorder, with a
specificity of 86%.24 The measure has demonstrated good psychometric properties in
similar samples25 and the Spearman-Brown coefficient (a preferred alternative to
Cronbach’s for indicating the reliability of two-item scales)26 in the current study was
0.821.
2. The GAD-2 has been developed as a brief screening measure for anxiety.27 It
comprises two items of the longer GAD-7,28 concerning symptoms over the previous
two weeks. Scoring is the same as the PHQ-2 and a cutoff of ≥3 has been suggested
for diagnosis of any anxiety disorder, with a specificity of 88%.27 Like the PHQ-2,
the GAD-2 has demonstrated good psychometric properties in US students.25 The
Spearman-Brown coefficient was 0.863.
3. The RAND 36-Item Health Survey 1.0 (SF-36)29,30 is a measure of QoL used for
assessing the burden of different health states. Developed at RAND as part of the
Medical Outcomes Study,29 it produces scores based on eight health concepts,
specifically: Physical Functioning (PF), Role limitations due to Physical health
problems (RP), Bodily Pain (BP), General Health (GH), Vitality (energy / fatigue)
(VT), Social Functioning (SF), Role limitations due to Emotional problems (RE), and
Mental Health (psychological distress and psychological well-being) (MH). All 36
items are scored individually and then converted to form a 0 – 100 scale, with higher
scores indicating better functioning. The SF-36 has been widely used as a measure of
HRQoL and has demonstrated good psychometric properties across countries.31
Cronbach’s α coefficients ranged from 0.74 (RP) to 0.89 (PF), indicating good
internal consistency of the subscales.
Statistical analyses
Correlations between variables were examined using Spearman’s rho (rs), adjusted for non-
normality by reporting estimated bias-corrected (95%) confidence intervals with 5000
replications. Chi-square analyses were used to investigate the prevalence of mental health
symptoms by gender. Linear regressions were conducted to examine the associations of
HRQoL with PHQ-2 and GAD-2 scores, in addition to sociodemographic variables.
Examination of tolerance values and variance inflation factors suggested absence of
multicollinearity issues. However, as most data were not normally distributed, groups were
compared using Welch’s W ANOVA with a post hoc Games-Howell test. Hypothesis testing
was conducted at the 0.05 significance level (two-tailed). Based on a four-group ANOVA, a
sample size of 280 is required to detect a medium-sized effect (e.g.,32) with a power of 0.95.33
Estimate of non-response
Overall response rate is a poor index of response bias (e.g.,34) and, although used in previous
studies (e.g.,35), comparison of respondents to non-respondents on demographic data (where
this is known) is also not ideal. In the current study, it was not possible to use more
sophisticated methods (e.g., the R-indicator)36 due to limited data on the wider
(nonresponding) population. We therefore report demographic data to provide some
information on the characteristics of responders and the wider population (see Table 1).
[Insert Table 1 here]
Results
Sample description
The final sample included data from 286 individuals. The mean (SD) age (of 285 who
provided data) was 20.51 (4.19) years and the majority identified as female, with one
individual not identifying with either male or female gender. Given overall student numbers
in the School of PCLS, the survey response rate was 26.9% and the demographic profile was
similar to the wider school (see Table 1). The majority of the sample described their
ethnicity as White, with the remainder identifying as Asian (19.2%), Black (3.5%), Mixed
(3.1%), or Other (2.4%). Mean (SD) PHQ-2 score was 2.06 (1.84) and 2.74 (1.92) for the
GAD-2.
Missing data
Proportion of missing data was low and no question was omitted by more than seven
individuals (2.45%). The majority of individuals (284; 99.30%) completed the PHQ-2 and
285 (99.65%) the GAD-2. A smaller proportion (n = 269; 94.06%) completed the SF-36.
Missing scores were calculated using recommended proration procedures. Following this,
total missing data for the PHQ-2, GAD-2, and SF-36 was less than 0.5%, with two-hundred
and seventy-seven cases (96.85%) providing complete data for analysis. Little’s Missing

Completely at Random test was not statistically significant (p = 0.168), suggesting that data
was missing at random. As such, we did not perform further missing data imputation.
Creation of subgroups
Correlations between variables of interest are shown in Table 2, suggesting strong
associations between mental health problems and HRQoL. To investigate correlates of
comorbidity, four groups were created based on responses to the GAD-2 and PHQ-2: no
disorder (n = 145; 51.1%); depression-only (n = 19; 6.7%); anxiety-only (n = 41; 14.4%); and
both depression and anxiety (n = 79; 27.8%). Degree of illness severity was estimated in line
with the procedure of Kroenke et al;32 specifically, PHQ-2 and GAD-2 scores were combined
(also known as the PHQ-4) and classified as Normal (0-2; n = 88), Mild (3-5; n = 92),
Moderate (6-8; n = 53), and Severe (9-12; n = 51).
[Insert Table 2 here]
Prevalence of common mental health problems
As shown in Table 3, 37.2% of females and 16.7% of males screened positive for depression
and 45.7% and 16.7% screened positive for an anxiety disorder. Further, 29.8% of females
and 13.9% of males screened positive for both disorders. Females were more than four times
as likely as males to screen positive for anxiety (OR = 4.21, 95% CIs = 1.69 – 10.47) and
nearly three times as likely to screen positive for depression (OR = 2.96, 95% CIs = 1.19 –
7.39).
[Insert Table 3 here]
Associations between mental health problems and quality of life
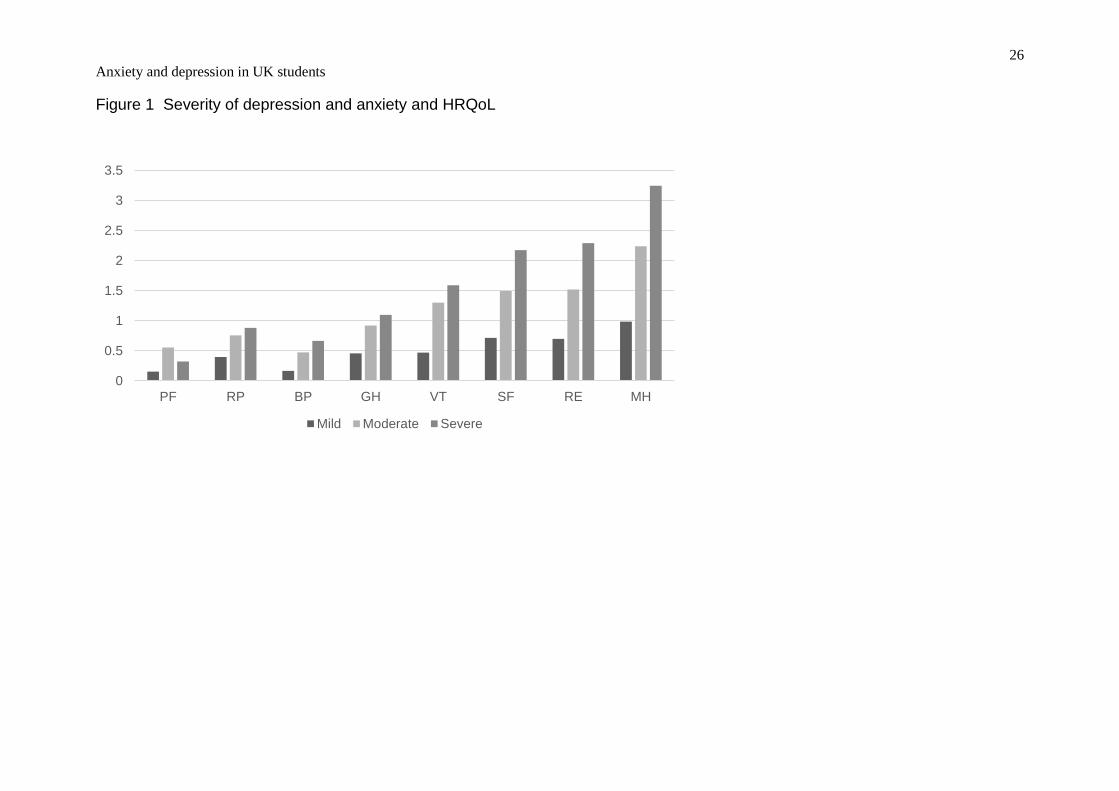
Figure 1 shows the association between symptom severity (depression and anxiety) and SF-
36 scores. The change in SF-36 scores is shown as the difference between each severity
group (Mild, Moderate, Severe) and the Normal group, used as a reference group (e.g.,32).
The effect size is calculated as the difference in means divided by the pooled SD, where
values of 0.2, 0.5, and 0.8 represent small, medium, and large effect sizes, respectively. With
the exception of PF, the data suggest that increasing symptom severity is associated with
greater impairment in HRQoL; these appear more pronounced in domains associated with
mental (rather than physical) health.
[Insert Figure 1 here]
Results of regression analyses for all SF-36 subscales are shown in Table 4. PHQ-2 and
GAD-2 did not uniquely predict variance in PF, although the overall model (including
sociodemographic information) was significant, explaining 4.3% of the variance. PHQ-2
scores were uniquely associated with RP whereas GAD-2 scores were uniquely associated
with BP. All other SF-36 subscales (GH, VT, SF, RE, MH) were strongly associated with
both PHQ-2 and GAD-2 scores, which explained relatively large proportions of variance.
[Insert Table 4 here]
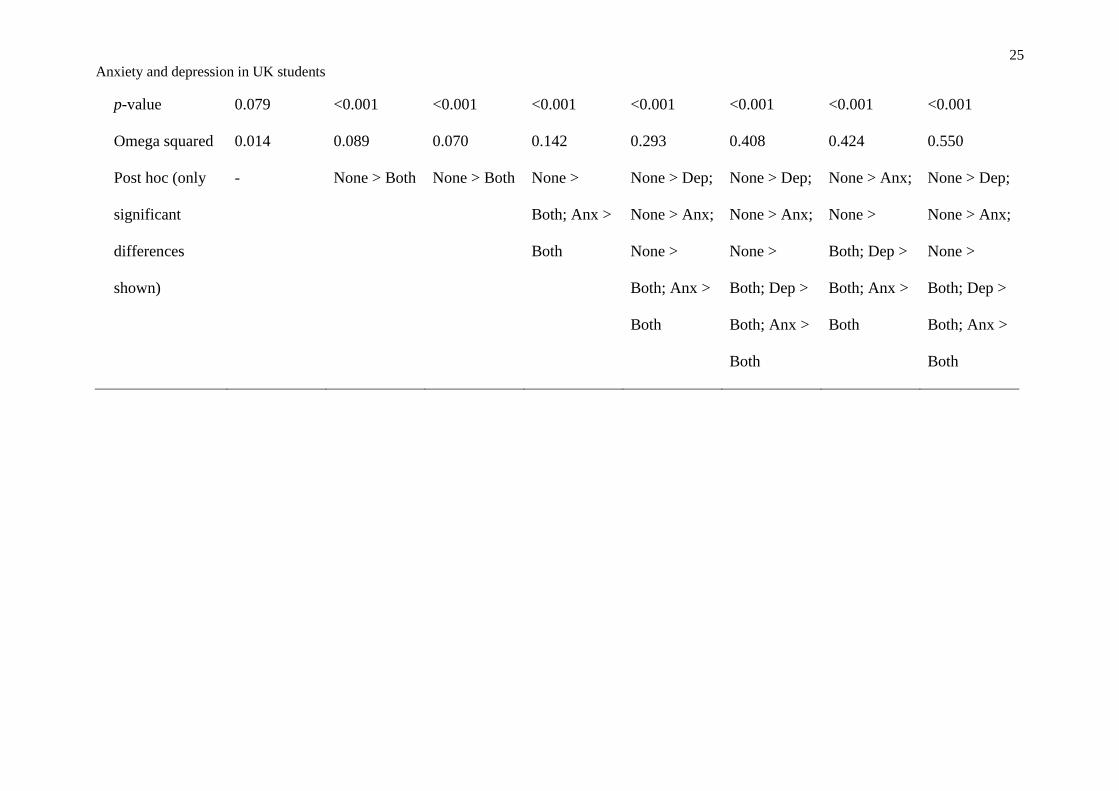
Psychiatric comorbidity and quality of life
Table 5 shows SF-36 subscale scores for the total sample. In addition, scores are presented
for four groups according to screening with the PHQ-2 and GAD-2: None (did not screen
positive for either depression or anxiety); Depression (screened positive for depression);
Anxiety (screened positive for anxiety); and Both (screened positive for both depression and
anxiety).
[Insert Table 5 here]
Screening positive for at least two psychiatric disorders was consistently associated with
significant impairment in HRQoL, with the exception of PF, which was equal across groups.
Screening positive for one disorder was associated with levels of impairment between the
other two groups in some domains (SF, MH), but statistically similar to the unaffected group
in others (RP, BP).
Discussion
An emerging literature has begun to describe the extent and impact of mental health problems
in college students. The current report builds on existing prevalence studies by investigating
the association between these problems and quality of life. Overall rates of depression and
anxiety in this UK sample are in line with US and global estimates (e.g.,10), and also suggest
that females are at greater risk of depression and, in particular, anxiety. This latter finding is
in line with epidemiological studies suggesting recent increases in mental health problems in
women aged 16 – 24 (e.g.,38), although studies of students have produced mixed findings
regarding gender differences (e.g., see 4,10). One limitation is that many studies, including the
current one, focus on internalising, as opposed to externalizing, disorders.9
As predicted, the severity of symptoms of depression and anxiety was associated with greater
HRQoL impairment, with the exception of physical functioning, and mental health
impairment was more strongly associated with symptoms of depression and anxiety than
impaired physical functioning. In line with previous suggestions (e.g.,13), symptom severity
appears to be progressively impairing across most areas of HRQoL. These findings
(alongside the prevalence estimates) are particularly concerning given the suggestion that the
severity of mental health problems in students is increasing.4
The third goal of the current study was to investigate the correlates of psychiatric
comorbidity, finding prevalence rates similar to those in previous studies. For example,
Bitsika and Sharpley39 reported that 33.2% of their sample of Australian university students
screened positive for both anxiety and depression (27.8% in the current sample) and
Bruffaerts et al5 found that 36.1% of those who had one mental health problem also had
another. Furthermore, findings of the currents study suggest that comorbidity is associated
with greater impairments in HRQoL than one disorder alone (e.g.,12,32), representing a
particularly prevalent and disabling phenomenon which should be afforded consideration in
approaches to student mental health and wellbeing.
The findings have implications for the provision of support for students with mental health
problems and highlight the impairment that may result. While some symptoms were more
strongly associated with specific areas of impairment than others, the findings suggest that
comorbidity is not only common but particularly impairing. Taken together, results call for
coordinated and effective interventions to reduce mental health problems in students, as well
as appropriate screening to identify those in need.4,9
The current study had a number of strengths and limitations. The suite of measures has been
widely used in similar samples and included a well-validated measure of HRQoL.
Confidence intervals are reported around estimates and the sample size was adequate for
looking at group differences, although some subsamples were small and replication is
indicated. Prevalence estimates are likely to be higher than other studies (e.g.,8,9) due to the
short time horizon of the PHQ-2 and GAD-2, which focused on two common mental health
problems. Regarding gender differences, although females are generally the majority in such
studies (e.g.,9), the current sample demonstrated an over-representation and subsequent
interpretations should consider this, as well as the comparatively young age of respondents.
This may have been influenced by the sampling strategy, which was suboptimal, although
does not necessarily compromise data quality. Nonetheless, a risk of bias remains and more
detailed information on the sample might have allowed a more accurate estimate of
nonresponse bias, although results compare favourably to similar studies in this area.4,6-11
Data on year of study (including undergraduate or postgraduate status), urbanicity,
relationship status, and socio-economic status was not collected. These variables have been
controlled for in previous studies14 or found to be associated with mental health symptoms
(e.g., 11), and may have provided additional information.
In summary, the findings add to a growing literature describing the prevalence and severity of
mental health problems in university samples. The study also provides data on HRQoL,
suggesting that the presence of anxiety, depression, or, particularly, both disorders was
associated with significant impairments in self-reported health status. Future studies should
consider changes over the course of study, given previous associations with year of study and
mental health symptoms (e.g.,40), and evaluate the support given to those with mental health
problems in higher education.

Declaration of interest: The authors do not declare any conflict of interest with respect to
this publication.
Compliance with ethical standards: All participants provided informed consent prior to
their inclusion in the study. The study was approved by the School of Psychology and
Clinical Language Sciences Ethics Committee.
References
1. Kessler RC, Berglund P, Demler O, Jin R, Merikangas KR, Walters EE. Lifetime
prevalence and age-of-onset distributions of DSM-IV disorders in the National
Comorbidity Survey Replication. Arch Gen Psychiatry. 2005;62:593-602. doi:
10.1001/archpsyc.62.6.593.
2. Kim-Cohen J, Caspi A, Moffitt TE, Harrington H-L, Milne BJ, Poulton R. Prior juvenile
diagnoses in adults with mental disorder: developmental follow-back of a prospective-
longitudinal cohort. Arch Gen Psychiatry. 2003;60:709-717. doi:
10.1001/archpsyc.60.7.709
3. Hunt J, Eisenberg D. Mental health problems and help-seeking behavior among college
students. J Adolesc Health. 2010;46:3-10. doi: 10.1016/j.jadohealth.2009.08.008
4. Thorley C. Not by degrees: Improving student mental health in the UK's Universities.
Institute for Public Policy Research. 2017.
http://www.ippr.org/research/publications/not-by-degrees. Accessed November 18 2019.
5. Bruffaerts R, Mortier P, Kiekens G, Auerbach R, Cuijpers P, Demyttenaere K, Green JG,
Nock MK, Kessler RC. Mental health problems in college freshmen: prevalence and
academic functioning. J Affect Disord. 2018;225:97-103. doi: 10.1016/j.jad.2017.07.044
6. Stallman HM. Psychological distress in university students: a comparison with general
population data. Aust Psychol. 2010;45:249-257. doi: 10.1080/00050067.2010.482109
7. Macaskill A. The mental health of university students in the United Kingdom. Br J Guid
Counc. 2013;41:426-441. doi: 10.1080/03069885.2012.743110
8. McLafferty M, Lapsley CR, Ennis E, Armour C, Murphy S, Bunting BP, Bjourson AJ,
Murray EK, O'Neill SM. Mental health, behavioural problems and treatment seeking
among students commencing university in Northern Ireland. PLoS One.
2017;12:e0188785. doi: 10.1371/journal.pone.0188785
9. Auerbach RP, Mortier P, Bruffaerts R, et al. WHO World Mental Health Surveys
international college student project: prevalence and distribution of mental disorders. J
Abnorm Psychol. 2018;127:623-638. http://dx.doi.org/10.1037/abn0000362
10. Ibrahim AK, Kelly SJ, Adams CE, Glazebrook C. A systematic review of studies of
depression prevalence in university students. J Psychiatr Res. 2013;47:391-400. doi:
10.1016/j.jpsychires.2012.11.015
11. Eisenberg D, Gollust SE, Golberstein E, Hefner JL. Prevalence and correlates of
depression, anxiety, and suicidality among university students. Am J Orthopsychiatry.
2007;77:534-542. doi: 10.1037/0002-9432.77.4.534
12. Saris IMJ, Aghajani M, van der Werff SJA, van der Wee NJA, Penninx BWJH. Social
functioning in patients with depressive and anxiety disorders. Acta Psychiatr Scand.
2017;136:352-361. doi: 10.1111/acps.12774
13. Eisenberg D, Golberstein E, Hunt JB. Mental health and academic success in college. B
E J Econom Anal Policy. 2009;9. doi: 10.2202/1935-1682.2191
14. Alonso J, Liu Z, Evans‐Lacko S, et al. Treatment gap for anxiety disorders is global:
results of the World Mental Health Surveys in 21 countries. Depress Anxiety.
2018;35:195-208. doi: 10.1002/da.22711
15. WHOQOL Group. The World Health Organization quality of life assessment
(WHOQOL): position paper from the World Health Organization. Soc Sci Med.
1995;41:1403-1409. doi: 10.1016/0277-9536(95)00112-K
16. Revicki DA, Kleinman L, Cella D. A history of health-related quality of life outcomes in
psychiatry. Dialogues Clin Neurosci. 2014;16:127-135.
17. Roberts J, Lenton P, Keetharuth AD, Brazier J. Quality of life impact of mental health
conditions in England: results from the adult psychiatric morbidity surveys. Health Qual
Life Outcomes. 2014;12:6. doi: 10.1186/1477-7525-12-6
18. Verger P, Guagliardo V, Gilbert F, Rouillon F, Kovess-Masfety V. Psychiatric disorders
in students in six French universities: 12-month prevalence, comorbidity, impairment and
help-seeking. Soc Psychiatry Psychiatr Epidemiol. 2010;45:189-199. doi:
10.1007/s00127-009-0055-z
19. Forrest LN, Smith AR, Swanson SA. Characteristics of seeking treatment among U.S.
adolescents with eating disorders. Int J Eat Disord. 2017;50:826-833. doi:
10.1002/eat.22702
20. Paro HB, Morales NM, Silva CH, Rezende CH, Pinto RM, Morales RR, Mendonça TM,
Prado MM. Health‐related quality of life of medical students. Med Educ. 2010;44:227-
235. doi: 10.1111/j.1365-2923.2009.03587.x
21. Gan G-G, Hue Y-L. Anxiety, depression and quality of life of medical students in
Malaysia. Med J Malaysia. 2019;74:57-61.
22. Kroenke K, Spitzer RL, Williams JB. The Patient Health Questionnaire-2: validity of a
two-item depression screener. Med Care. 2003;41:1284-1292. doi:
10.1097/01.MLR.0000093487.78664.3C
23. Kroenke K, Spitzer RL, Williams JB. The PHQ‐9: validity of a brief depression severity
measure. J Gen Intern Med. 2001;16:606-613. doi: 10.1046/j.1525-
1497.2001.016009606.x
24. Löwe B, Kroenke K, Gräfe K. Detecting and monitoring depression with a two-item
questionnaire (PHQ-2). J Psychosom Res. 2005;58:163-171. doi:
10.1016/j.jpsychores.2004.09.006
25. Khubchandani J, Brey R, Kotecki J, Kleinfelder J, Anderson J. The psychometric
properties of PHQ-4 depression and anxiety screening scale among college students.
Arch Psychiatr Nurs. 2016;30:457-462. doi: 10.1016/j.apnu.2016.01.014
26. Eisinga R, te Grotenhuis M, Pelzer B. The reliability of a two-item scale: Pearson,
Cronbach, or Spearman-Brown? Int J Public Health. 2013;58:637-642. doi:
10.1007/s00038-012-0416-3
27. Kroenke K, Spitzer RL, Williams JB, Monahan PO, Löwe B. Anxiety disorders in
primary care: prevalence, impairment, comorbidity, and detection. Ann Intern Med.
2007;146:317-325. doi: 10.7326/0003-4819-146-5-200703060-00004
28. Spitzer RL, Kroenke K, Williams JB, Löwe B. A brief measure for assessing generalized
anxiety disorder: the GAD-7. Arch Intern Med. 2006;166:1092-1097. doi:
10.1001/archinte.166.10.1092
29. Hays RD, Sherbourne CD, Mazel RM. User's manual for the Medical Outcomes Study
(MOS) core measures of health-related quality of life. Santa Monica, CA: RAND; 1995.
30. Ware JE, Sherbourne CD. The MOS 36-item short-form health survey (SF-36): I.
conceptual framework and item selection. Med Care. 1992;30:473-483. doi:
10.1097/00005650-199206000-00002
31. Ware JE Jr, Kosinski M, Gandek B, Aaronson NK, Apolone G, Bech P, et al. The factor
structure of the SF-36 Health Survey in 10 countries: Results from the IQOLA Project. J
Clin Epidemiol. 1998;51:1159-1165. doi: 10.1016/S0895-4356(98)00107-3
32. Kroenke K, Spitzer RL, Williams JBW, Löwe B. An ultra-brief screening scale for
anxiety and depression: the PHQ–4. Psychosomatics. 2009;50:613-621. doi:
10.1016/S0033-3182(09)70864-3
33. Faul F, Erdfelder E, Lang A-G, Buchner A. G*Power 3: a flexible statistical power
analysis program for the social, behavioral, and biomedical sciences. Behav Res
Methods. 2007;39:175-191. doi: 10.3758/BF03193146
34. Peytcheva E, Groves RM. Using variation in response rates of demographic subgroups as
evidence of nonresponse bias in survey estimates. J Off Stat. 2009;25:193-201.
35. Barclay S, Todd C, Finlay I, Grande G, Wyatt P. Not another questionnaire! Maximizing
the response rate, predicting non-response and assessing non-response bias in postal
questionnaire studies of GPs. Fam Pract. 2002;19:105-111. doi: 10.1093/fampra/19.1.105
36. Schouten B, Cobben F, Bethlehem J. Indicators for the representativeness of survey
response. Surv Methodol. 2009;35:101-113.
37. Higher Education Statistics Agency (HESA). Higher Education Student Statistics: UK,
2016/17 – Student numbers and characteristics. https://www.hesa.ac.uk/news/11-01-
2018/sfr247-higher-education-student-statistics/numbers. Accessed April 25, 2019.
38. McManus S, Bebbington P, Jenkins R, Brugha T. Mental health and wellbeing in
England: Adult Psychiatric Morbidity Survey 2014. Leeds, UK: NHS Digital; 2016.
39. Bitsika V, Sharpley CF. Comorbidity of anxiety-depression among Australian university
students: implications for student counsellors. Br J Guid Counc. 2012;40:385-394. doi:
10.1080/03069885.2012.701271
40. Asante KO, Andoh-Arthur J. Prevalence and determinants of depressive symptoms
among university students in Ghana. J Affect Disord. 2015;171:161-166. doi:
10.1016/j.jad.2014.09.025
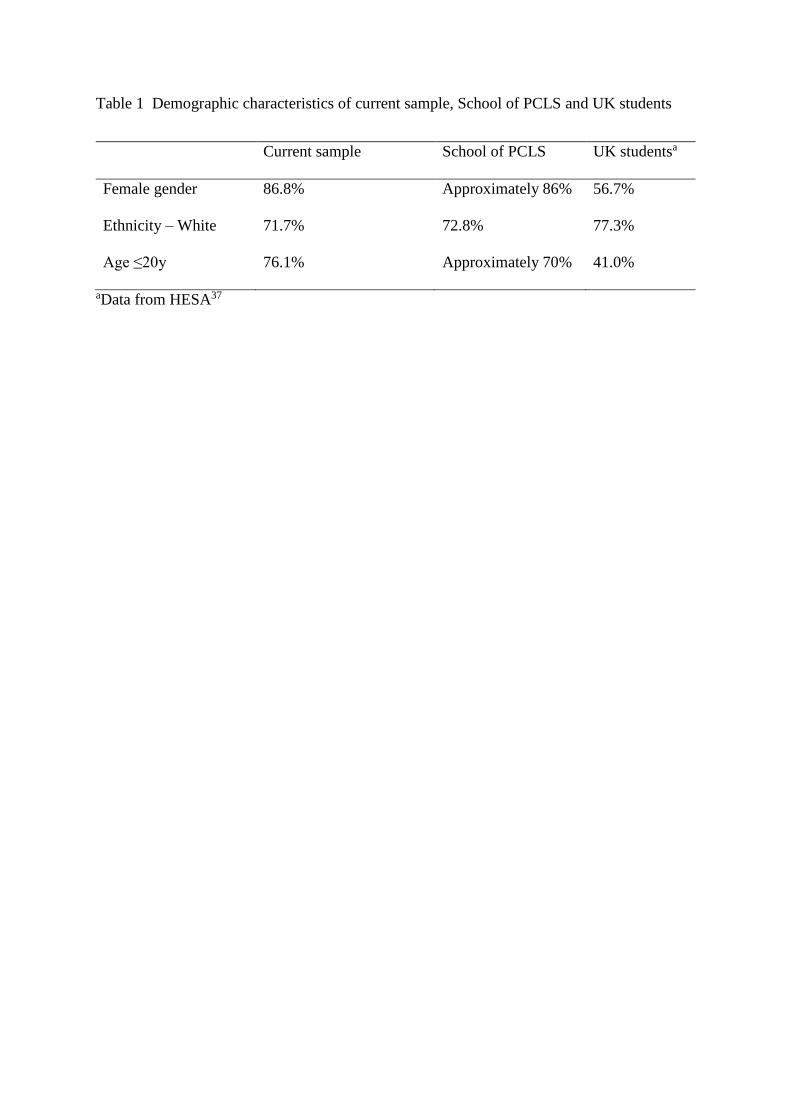
Table 1 Demographic characteristics of current sample, School of PCLS and UK students
Current sample School of PCLS UK studentsa
Female gender 86.8% Approximately 86% 56.7%
Ethnicity – White 71.7% 72.8% 77.3%
Age ≤20y 76.1% Approximately 70% 41.0%
aData from HESA37
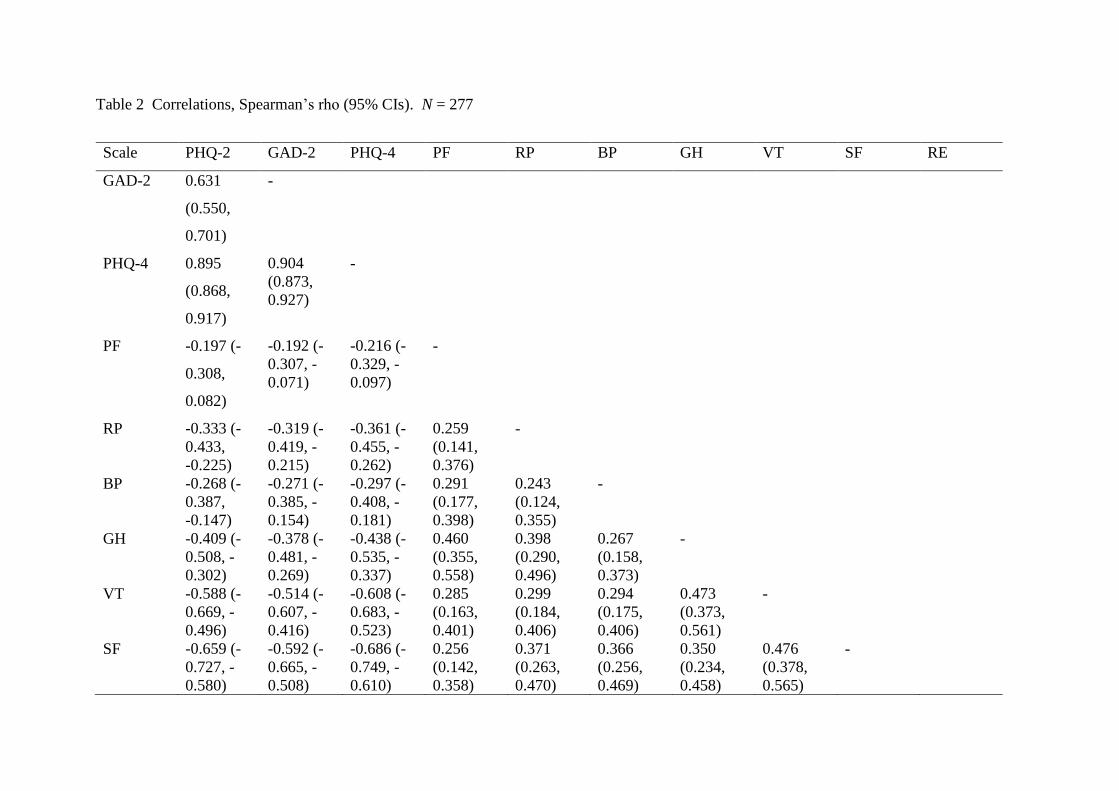
Table 2 Correlations, Spearman’s rho (95% CIs). N = 277
Scale PHQ-2 GAD-2 PHQ-4 PF RP BP GH VT SF RE
GAD-2 0.631
(0.550,
0.701)
-
PHQ-4 0.895
(0.868,
0.917)
0.904
(0.873,
0.927)
-
PF -0.197 (-
0.308,
0.082)
-0.192 (-
0.307, -
0.071)
-0.216 (-
0.329, -
0.097)
-
RP -0.333 (-
0.433,
-0.225)
-0.319 (-
0.419, -
0.215)
-0.361 (-
0.455, -
0.262)
0.259
(0.141,
0.376)
-
BP -0.268 (-
0.387,
-0.147)
-0.271 (-
0.385, -
0.154)
-0.297 (-
0.408, -
0.181)
0.291
(0.177,
0.398)
0.243
(0.124,
0.355)
-
GH -0.409 (-
0.508, -
0.302)
-0.378 (-
0.481, -
0.269)
-0.438 (-
0.535, -
0.337)
0.460
(0.355,
0.558)
0.398
(0.290,
0.496)
0.267
(0.158,
0.373)
-
VT -0.588 (-
0.669, -
0.496)
-0.514 (-
0.607, -
0.416)
-0.608 (-
0.683, -
0.523)
0.285
(0.163,
0.401)
0.299
(0.184,
0.406)
0.294
(0.175,
0.406)
0.473
(0.373,
0.561)
-
SF -0.659 (-
0.727, -
0.580)
-0.592 (-
0.665, -
0.508)
-0.686 (-
0.749, -
0.610)
0.256
(0.142,
0.358)
0.371
(0.263,
0.470)
0.366
(0.256,
0.469)
0.350
(0.234,
0.458)
0.476
(0.378,
0.565)
-

RE -0.596 (-
0.668, -
0.515)
-0.638 (-
0.709, -
0.553)
-0.680 (-
0.742, -
0.605)
0.239
(0.120,
0.349)
0.324
(0.214,
0.431)
0.171
(0.058,
0.281)
0.363
(0.254,
0.464)
0.509
(0.415,
0.597)
0.591
(0.508,
0.668)
-
MH -0.768 (-
0.816, -
0.709)
-0.709 (-
0.769, -
0.639)
-0.818 (-
0.857, -
0.769)
0.278
(0.161,
0.388)
0.370
(0.262,
0.471)
0.272
(0.160,
0.377)
0.496
(0.389,
0.593)
0.644
(0.560,
0.719)
0.672
(0.589,
0.739)
0.659
(0.586,
0.724)
Note: all correlations significant at p <0.01
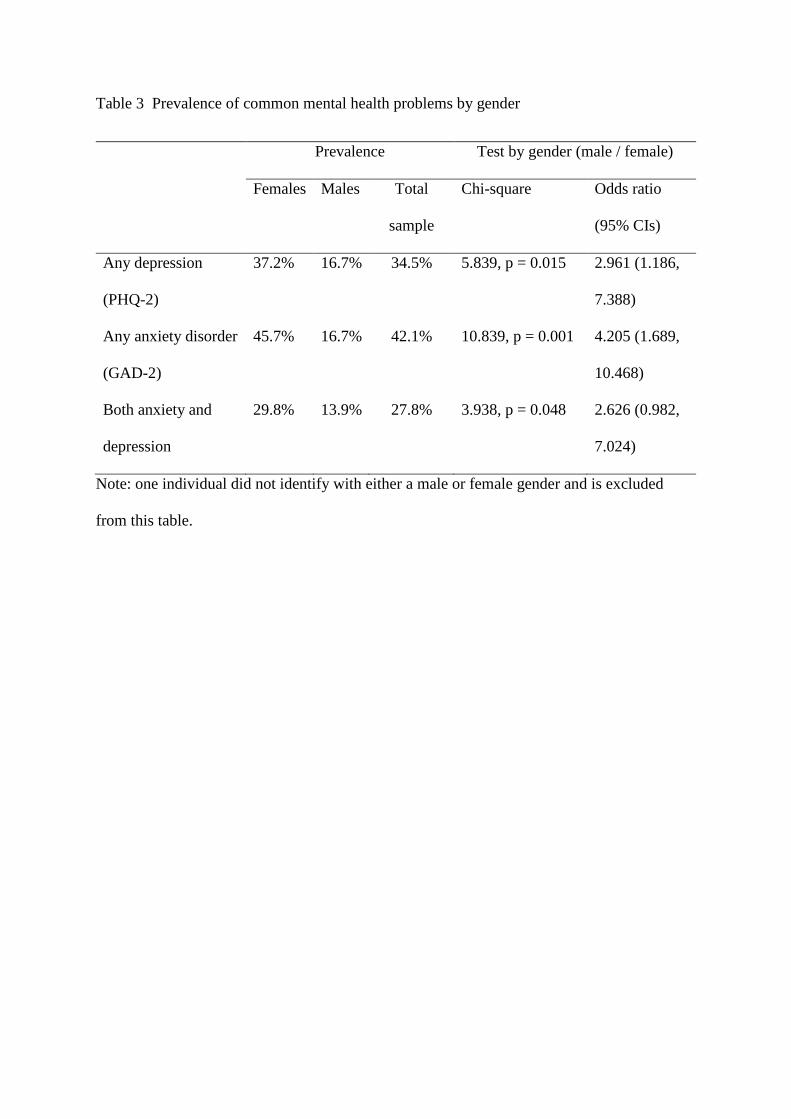
Table 3 Prevalence of common mental health problems by gender
Prevalence Test by gender (male / female)
Females Males Total
sample
Chi-square Odds ratio
(95% CIs)
Any depression
(PHQ-2)
37.2% 16.7% 34.5% 5.839, p = 0.015 2.961 (1.186,
7.388)
Any anxiety disorder
(GAD-2)
45.7% 16.7% 42.1% 10.839, p = 0.001 4.205 (1.689,
10.468)
Both anxiety and
depression
29.8% 13.9% 27.8% 3.938, p = 0.048 2.626 (0.982,
7.024)
Note: one individual did not identify with either a male or female gender and is excluded
from this table.

Table 4 Associations of symptoms of depression and anxiety with HRQoL
Dependent
variable
% variance
explaineda
β-weight (p-value)
SF-36 subscale PHQ-2 GAD-2
PF 3.0 -0.092 (0.247) -0.106 (0.188)
RP 11.0 -0.229 (0.003) -0.147 (0.058)
BP 9.1 -0.068 (0.375) -0.265 (0.001)
GH 17.8 -0.273 (<0.001) -0.205 (0.006)
VT 33.1 -0.411 (<0.001) -0.237 (<0.001)
SF 45.8 -0.481 (<0.001) -0.281 (<0.001)
RE 37.1 -0.280 (<0.001) -0.411 (<0.001)
MH 63.8 -0.559 (<0.001) -0.341 (<0.001)
aVariance explained as change in R2 when adding PHQ-2 and GAD-2 to sociodemographic
variables (age, gender, ethnicity).

24
Anxiety and depression in UK students
Table 5 HRQoL in the total sample and groups according to responses on the PHQ-2 (Depression) and GAD-2 (Anxiety)
SF-36 Subscale, mean (SD)
PF RP BP GH VT SF RE MH
Total sample 89.52
(16.53)
82.27
(28.22)
77.98
(18.42)
59.03
(20.17)
42.29
(19.33)
68.49
(23.88)
44.00
(40.78)
58.24
(20.34)
Screening
None 92.05
(14.68)
90.91
(20.02)
82.72
(16.17)
66.04
(17.63)
51.66
(16.12)
81.64
(18.05)
66.91
(34.87)
71.70
(12.19)
Depression 85.79
(20.90)
76.32
(28.23)
78.20
(18.77)
54.21
(21.36)
35.26
(18.59)
65.13
(18.90)
42.11
(39.82)
51.37
(15.96)
Anxiety 89.15
(14.70)
81.71
(25.63)
75.41
(20.43)
58.17
(20.24)
40.73
(17.70)
67.99
(18.97)
32.52
(37.63)
57.56
(12.39)
Both 86.01
(18.80)
68.35
(35.74)
70.58
(18.78)
47.85
(19.04)
27.59
(15.50)
45.41
(18.36)
10.13
(22.24)
35.54
(14.79)
ANOVA (Welch)
W 2.368 10.178 8.099 16.565 40.159 66.103 70.441 116.158
25
Anxiety and depression in UK students
p-value 0.079 <0.001 <0.001 <0.001 <0.001 <0.001 <0.001 <0.001
Omega squared 0.014 0.089 0.070 0.142 0.293 0.408 0.424 0.550
Post hoc (only
significant
differences
shown)
- None > Both None > Both None >
Both; Anx >
Both
None > Dep;
None > Anx;
None >
Both; Anx >
Both
None > Dep;
None > Anx;
None >
Both; Dep >
Both; Anx >
Both
None > Anx;
None >
Both; Dep >
Both; Anx >
Both
None > Dep;
None > Anx;
None >
Both; Dep >
Both; Anx >
Both
26
Anxiety and depression in UK students
Figure 1 Severity of depression and anxiety and HRQoL
0
0.5
1
1.5
2
2.5
3
3.5
PF RP BP GH VT SF RE MH
Mild Moderate Severe