Embed Size (px)
Citation preview
Vision
We view business as a means to the material and social wellbeing of the investors, employees and the society at large, leading to accretion of wealth through financial and moral gains as a part of the process of the human civilization.
Mission
Our Mission is to produce and provide quality & innovative healthcare relief for people, maintain stringently ethical standard in business operation also ensuring benefit to the shareholders, stakeholders and the society at large.
Objectives
Our objectives are to conduct transparent business operation based on market mechanism within the legal & social frame work with aims to attain the mission reflected by our vision.
Corporate Focus
Our vision, our mission and our objectives are to emphasise on the quality of product, process and services leading to growth of the company imbibed with good governance practices.
1 | P a g e
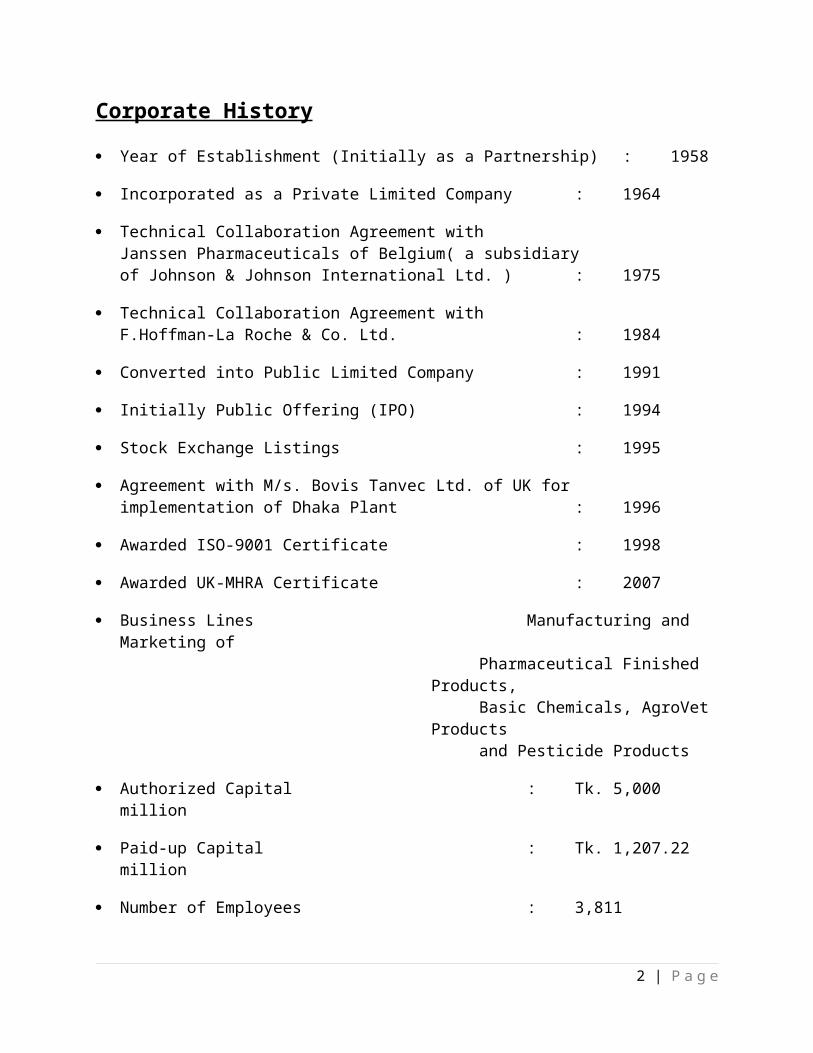
Corporate History
Year of Establishment (Initially as a Partnership) : 1958
Incorporated as a Private Limited Company : 1964
Technical Collaboration Agreement withJanssen Pharmaceuticals of Belgium( a subsidiary of Johnson & Johnson International Ltd. ) : 1975
Technical Collaboration Agreement withF.Hoffman-La Roche & Co. Ltd. : 1984
Converted into Public Limited Company : 1991
Initially Public Offering (IPO) : 1994
Stock Exchange Listings : 1995
Agreement with M/s. Bovis Tanvec Ltd. of UK forimplementation of Dhaka Plant : 1996
Awarded ISO-9001 Certificate : 1998
Awarded UK-MHRA Certificate : 2007
Business Lines Manufacturing and Marketing ofPharmaceutical Finished Products,Basic Chemicals, AgroVet Productsand Pesticide Products
Authorized Capital : Tk. 5,000 million
Paid-up Capital : Tk. 1,207.22 million
Number of Employees : 3,811
Subsidiary Company : Square Spinnings Ltd. Square Cephalosporins Ltd. Square Biotechs Ltd. Square Multi Fabrics Ltd.
Associate Company : Square Textiles Ltd. Square Knit Fabrics Ltd. Square Fashions Ltd. Square Hospitals Ltd.
2 | P a g e
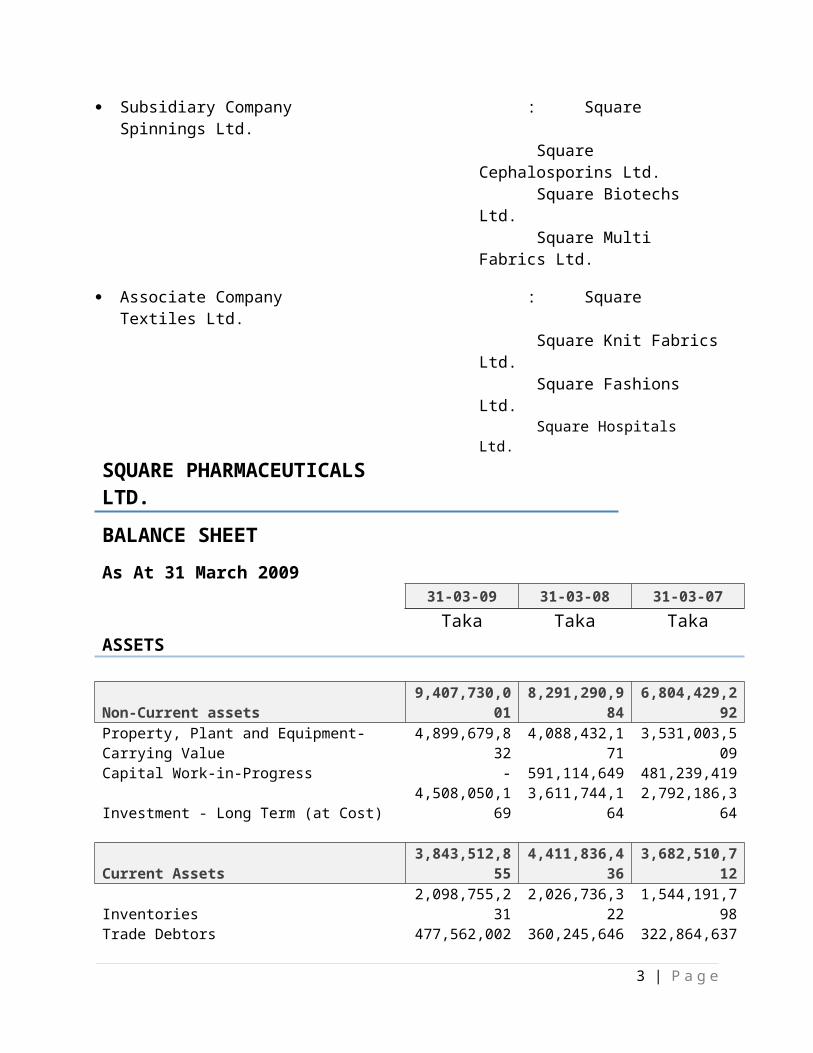
SQUARE PHARMACEUTICALS LTD.
3 | P a g e
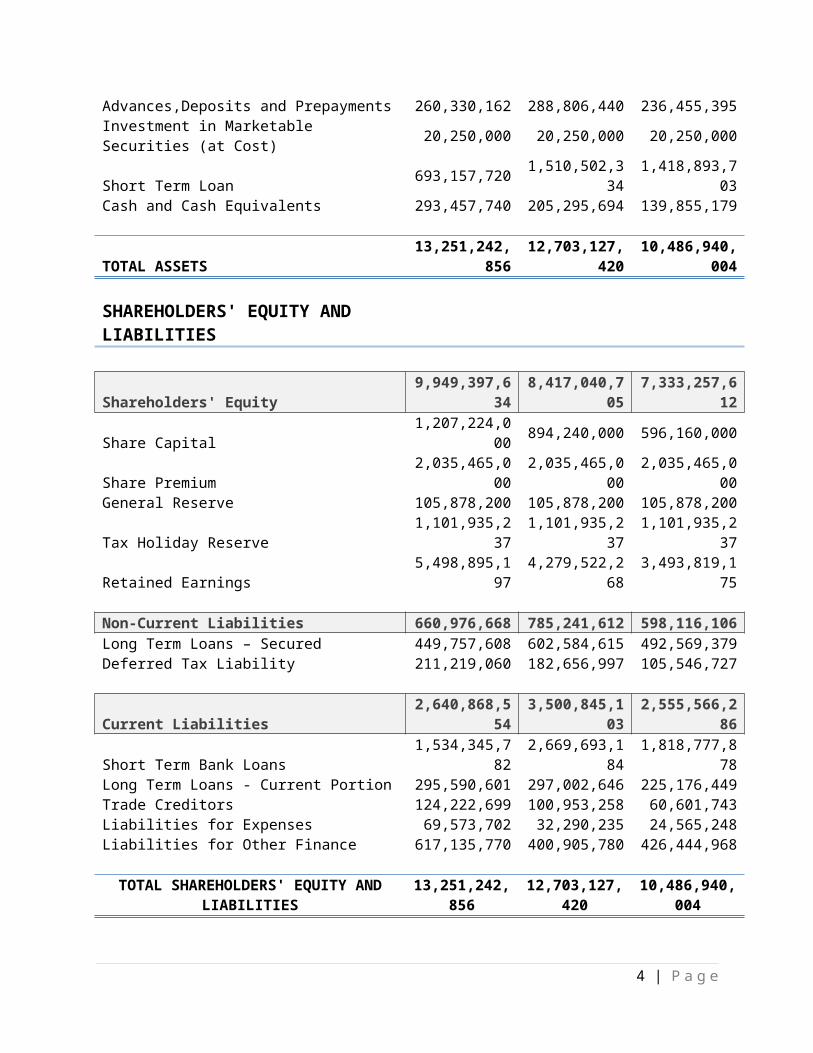
BALANCE SHEET
As At 31 March 200931-03-09 31-03-08 31-03-07
Taka Taka TakaASSETS
Non-Current assets 9,407,730,001 8,291,290,984 6,804,429,292Property, Plant and Equipment-Carrying Value 4,899,679,832 4,088,432,171 3,531,003,509Capital Work-in-Progress - 591,114,649 481,239,419Investment - Long Term (at Cost) 4,508,050,169 3,611,744,164 2,792,186,364
Current Assets 3,843,512,855 4,411,836,436 3,682,510,712Inventories 2,098,755,231 2,026,736,322 1,544,191,798Trade Debtors 477,562,002 360,245,646 322,864,637Advances,Deposits and Prepayments 260,330,162 288,806,440 236,455,395Investment in Marketable Securities (at Cost) 20,250,000 20,250,000 20,250,000Short Term Loan 693,157,720 1,510,502,334 1,418,893,703Cash and Cash Equivalents 293,457,740 205,295,694 139,855,179
TOTAL ASSETS 13,251,242,856 12,703,127,420 10,486,940,004
SHAREHOLDERS' EQUITY AND LIABILITIES
Shareholders' Equity 9,949,397,634 8,417,040,705 7,333,257,612Share Capital 1,207,224,000 894,240,000 596,160,000Share Premium 2,035,465,000 2,035,465,000 2,035,465,000General Reserve 105,878,200 105,878,200 105,878,200Tax Holiday Reserve 1,101,935,237 1,101,935,237 1,101,935,237Retained Earnings 5,498,895,197 4,279,522,268 3,493,819,175
Non-Current Liabilities 660,976,668 785,241,612 598,116,106Long Term Loans – Secured 449,757,608 602,584,615 492,569,379Deferred Tax Liability 211,219,060 182,656,997 105,546,727
Current Liabilities 2,640,868,554 3,500,845,103 2,555,566,286Short Term Bank Loans 1,534,345,782 2,669,693,184 1,818,777,878Long Term Loans - Current Portion 295,590,601 297,002,646 225,176,449Trade Creditors 124,222,699 100,953,258 60,601,743Liabilities for Expenses 69,573,702 32,290,235 24,565,248Liabilities for Other Finance 617,135,770 400,905,780 426,444,968
4 | P a g e
TOTAL SHAREHOLDERS' EQUITY AND LIABILITIES 13,251,242,856 12,703,127,420 10,486,940,004
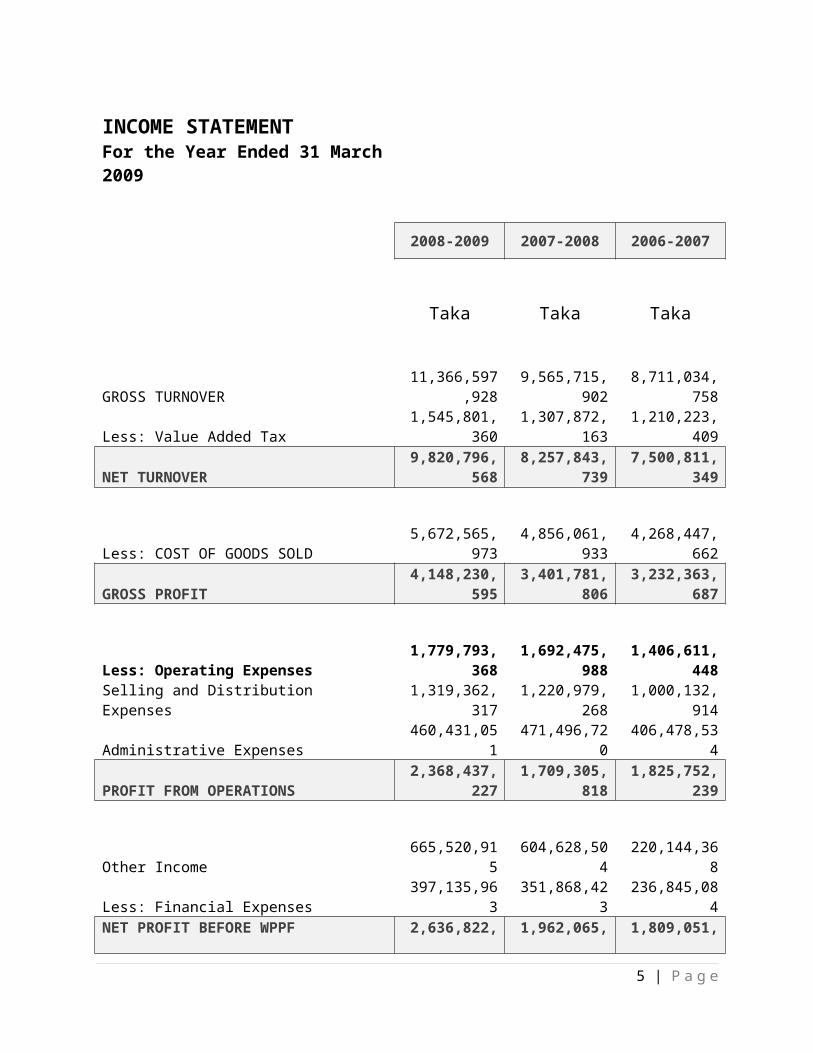
INCOME STATEMENT
For the Year Ended 31 March 2009
2008-2009 2007-2008 2006-2007
Taka Taka Taka
GROSS TURNOVER 11,366,597,928 9,565,715,902 8,711,034,758
Less: Value Added Tax 1,545,801,360 1,307,872,163 1,210,223,409
NET TURNOVER 9,820,796,568 8,257,843,739 7,500,811,349
Less: COST OF GOODS SOLD 5,672,565,973 4,856,061,933 4,268,447,662
GROSS PROFIT 4,148,230,595 3,401,781,806 3,232,363,687
Less: Operating Expenses 1,779,793,368 1,692,475,988 1,406,611,448
Selling and Distribution Expenses 1,319,362,317 1,220,979,268 1,000,132,914
Administrative Expenses 460,431,051 471,496,720 406,478,534
PROFIT FROM OPERATIONS 2,368,437,227 1,709,305,818 1,825,752,239
Other Income 665,520,915 604,628,504 220,144,368
Less: Financial Expenses 397,135,963 351,868,423 236,845,084
NET PROFIT BEFORE WPPF 2,636,822,179 1,962,065,899 1,809,051,523
5 | P a g e
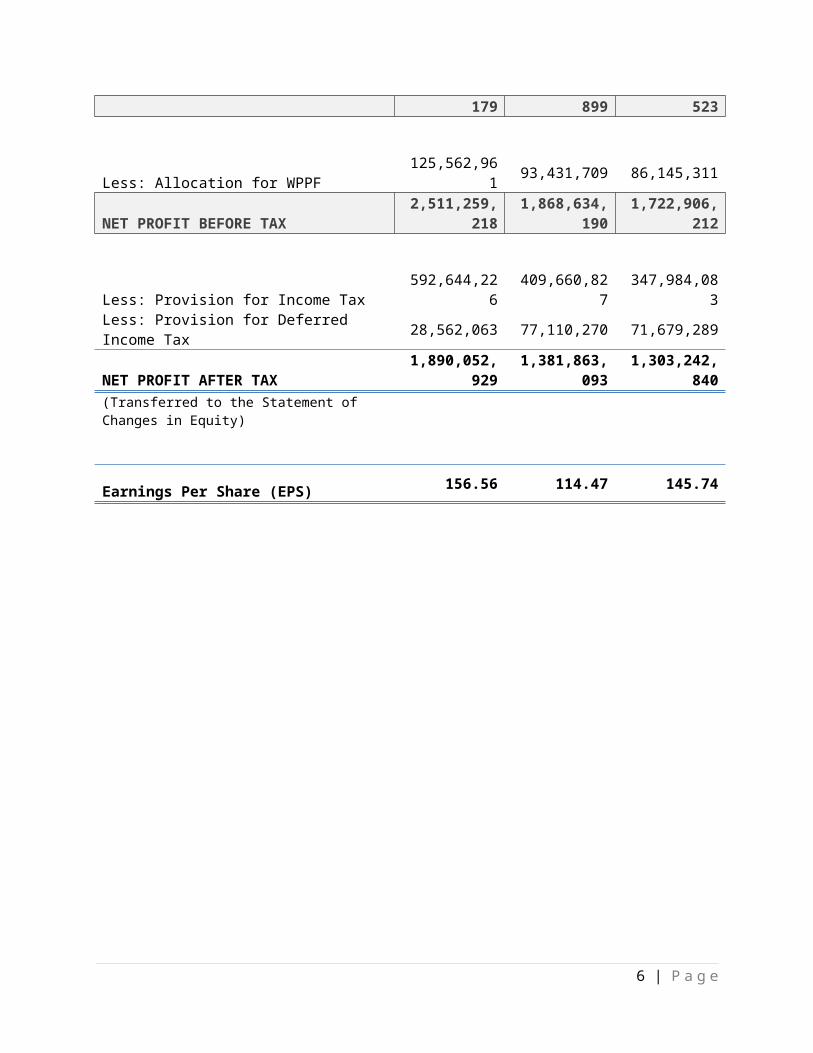
Less: Allocation for WPPF 125,562,961 93,431,709 86,145,311
NET PROFIT BEFORE TAX 2,511,259,218 1,868,634,190 1,722,906,212
Less: Provision for Income Tax 592,644,226 409,660,827 347,984,083
Less: Provision for Deferred Income Tax 28,562,063 77,110,270 71,679,289
NET PROFIT AFTER TAX 1,890,052,929 1,381,863,093 1,303,242,840
(Transferred to the Statement of Changes in Equity)
Earnings Per Share (EPS) 156.56 114.47 145.74
6 | P a g e
RATIO ANALYSIS
Financial ratio analysis is the calculation and comparison of ratios which are derived from the information in a company’s financial statements.
Financial ratios are the analyst’s microscope; they allow them to get a better view of the firm’s financial health than just looking at the raw financial statements
Ratios are used by both internal and external analysts
Internal uses
· Planning
· Evaluation of management
· Focus on return on investment for various assets & assets efficiency
· Understanding how suppliers of funds analyze the firm
External uses
· Credit granting
· Performance monitoring
· Investment decisions
· Making of policies
· Focus on the long term cash flow of the firm
· Focus on the liquidity of the firm
· Focus on the profitability & long term health of the firm
CATEGORIES OF FINANCIAL RATIOS
The accounting ratios can be grouped in to four categories:
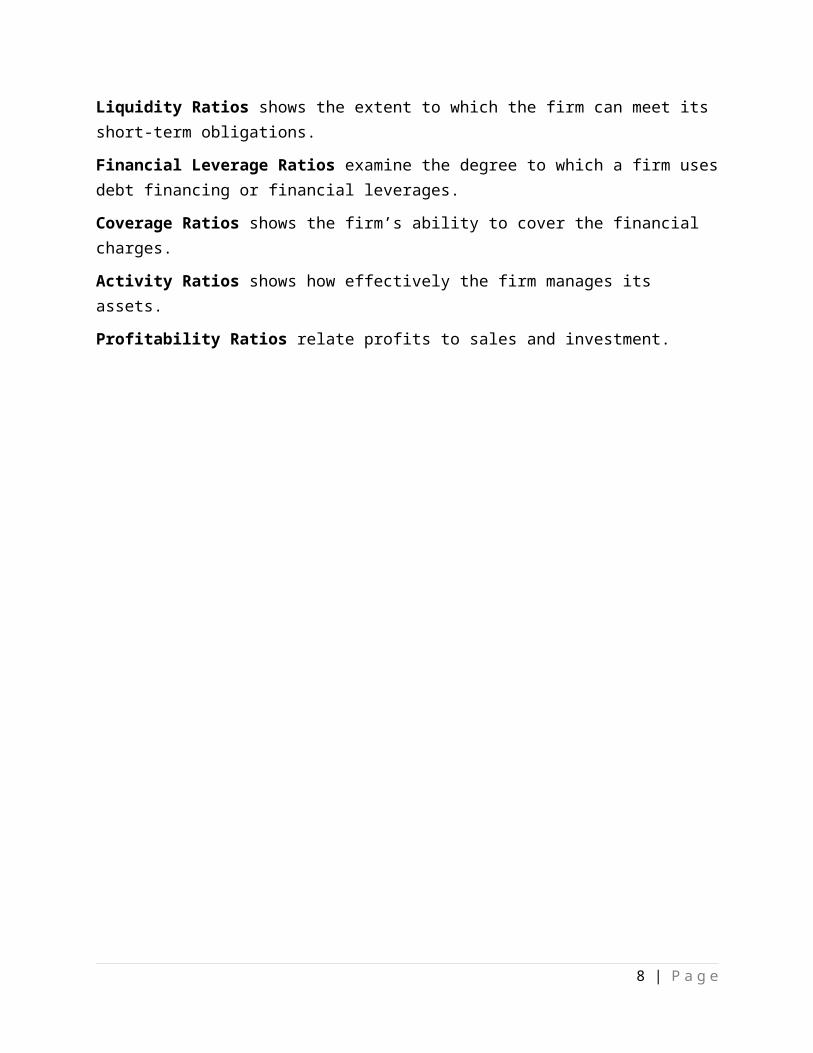
Liquidity Ratios shows the extent to which the firm can meet its short-term obligations.
Financial Leverage Ratios examine the degree to which a firm uses debt financing or financial leverages.
Coverage Ratios shows the firm’s ability to cover the financial charges.
Activity Ratios shows how effectively the firm manages its assets.
Profitability Ratios relate profits to sales and investment.
7 | P a g e
Trend Analysis
Trend analysis is important to compare the fianancial ratios for a company over time. In this way, the analyst is able to detect any immprovement or deterioration in a firm’s financial condition and performance.
The analysis of the trend of financial ratios over time, coupled with a comparison with industry averages, can give analyst valuable insight into changes that have occurred in a firm’s condition and performance. Additional insight can be provided if we extend our analysis to include comparisons with similar competitors in the industry.
8 | P a g e
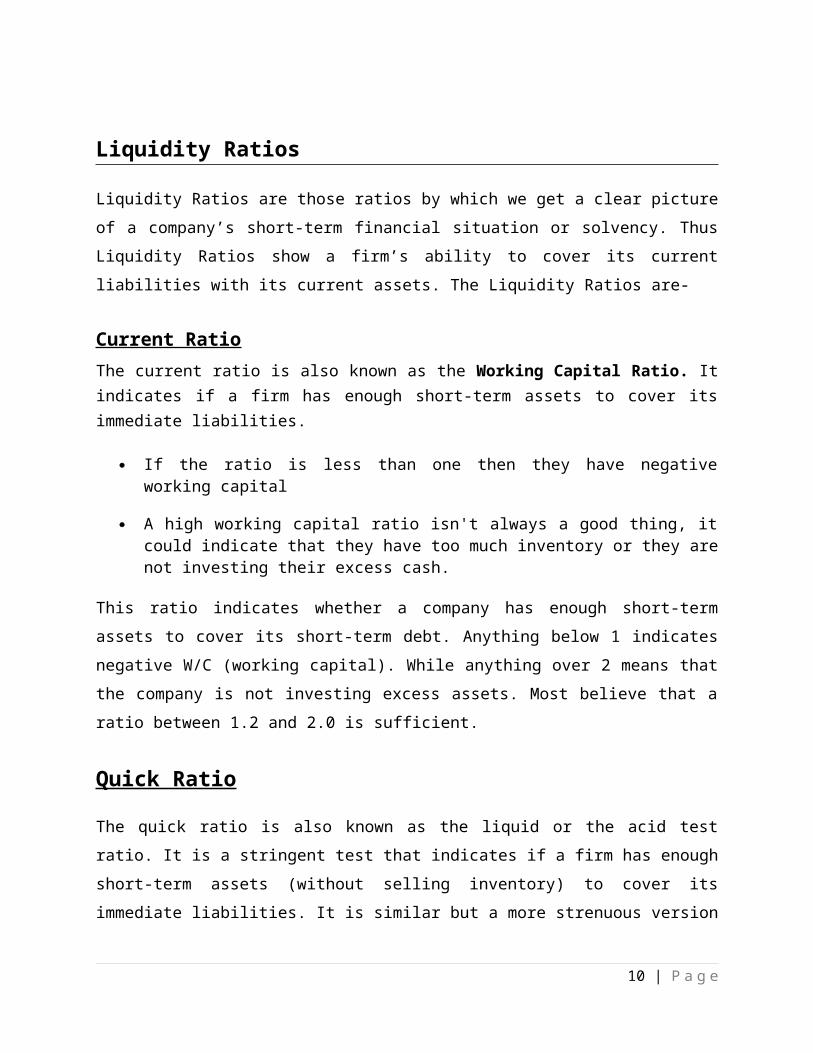
Liquidity Ratios
Liquidity Ratios are those ratios by which we get a clear picture of a company’s short-term
financial situation or solvency. Thus Liquidity Ratios show a firm’s ability to cover its current
liabilities with its current assets. The Liquidity Ratios are-
Current RatioThe current ratio is also known as the Working Capital Ratio. It indicates if a firm has enough short-term assets to cover its immediate liabilities.
If the ratio is less than one then they have negative working capital
A high working capital ratio isn't always a good thing, it could indicate that they have too much inventory or they are not investing their excess cash.
This ratio indicates whether a company has enough short-term assets to cover its short-term
debt. Anything below 1 indicates negative W/C (working capital). While anything over 2 means
that the company is not investing excess assets. Most believe that a ratio between 1.2 and 2.0
is sufficient.
Quick Ratio
The quick ratio is also known as the liquid or the acid test ratio. It is a stringent test that
indicates if a firm has enough short-term assets (without selling inventory) to cover its
immediate liabilities. It is similar but a more strenuous version of the "working capital" ratio,
indicating whether liabilities could be paid without selling inventory.
An extreme version of the working capital ratio because it only uses cash and
equivalents.
The ratio excludes inventory, which for some companies can make up a large portion of its assets.
This ratio is used to determine risk that is not detected by the Working Capital ratio. Companies
with ratios of less than 1 cannot pay their current liabilities and should be looked at with
extreme care. Furthermore if the acid ratio is much lower than the working capital ratio it
9 | P a g e
means that current assets are highly dependent on inventory - retail stores are examples of this
type of business.
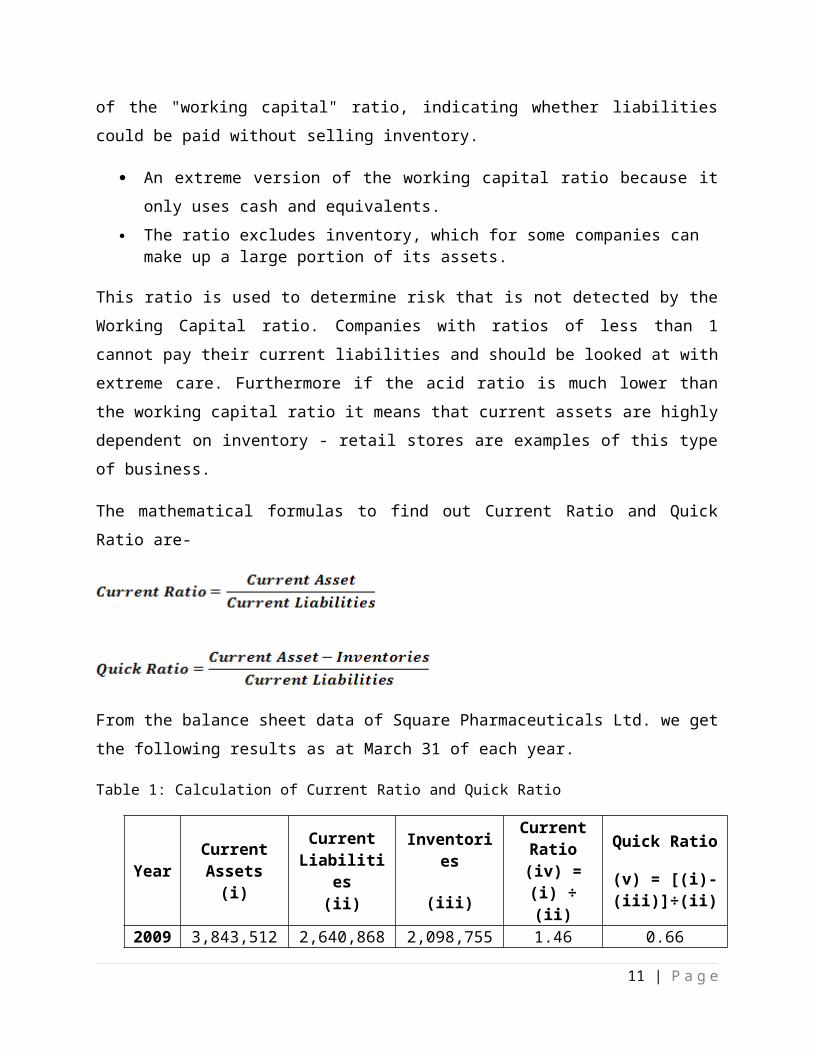
The mathematical formulas to find out Current Ratio and Quick Ratio are-
From the balance sheet data of Square Pharmaceuticals Ltd. we get the following results as at
March 31 of each year.
Table 1: Calculation of Current Ratio and Quick Ratio
YearCurrent Assets
(i)
Current Liabilities
(ii)
Inventories
(iii)
Current Ratio
(iv) = (i) ÷ (ii)
Quick Ratio
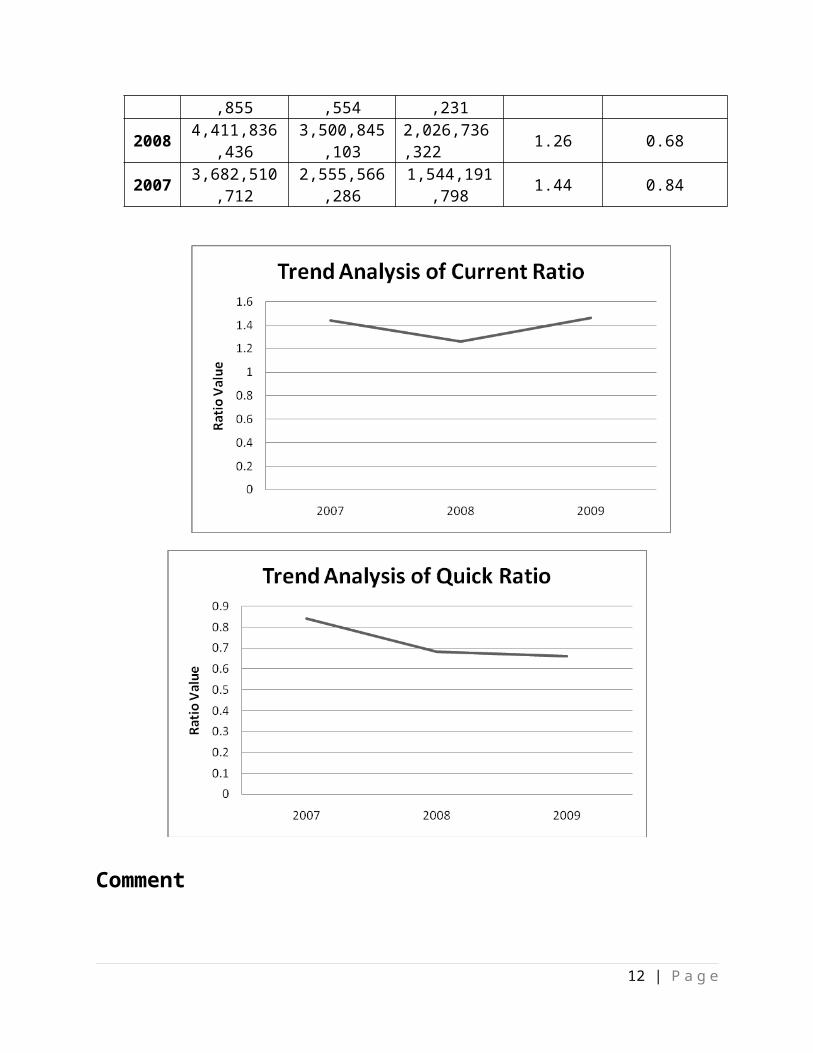
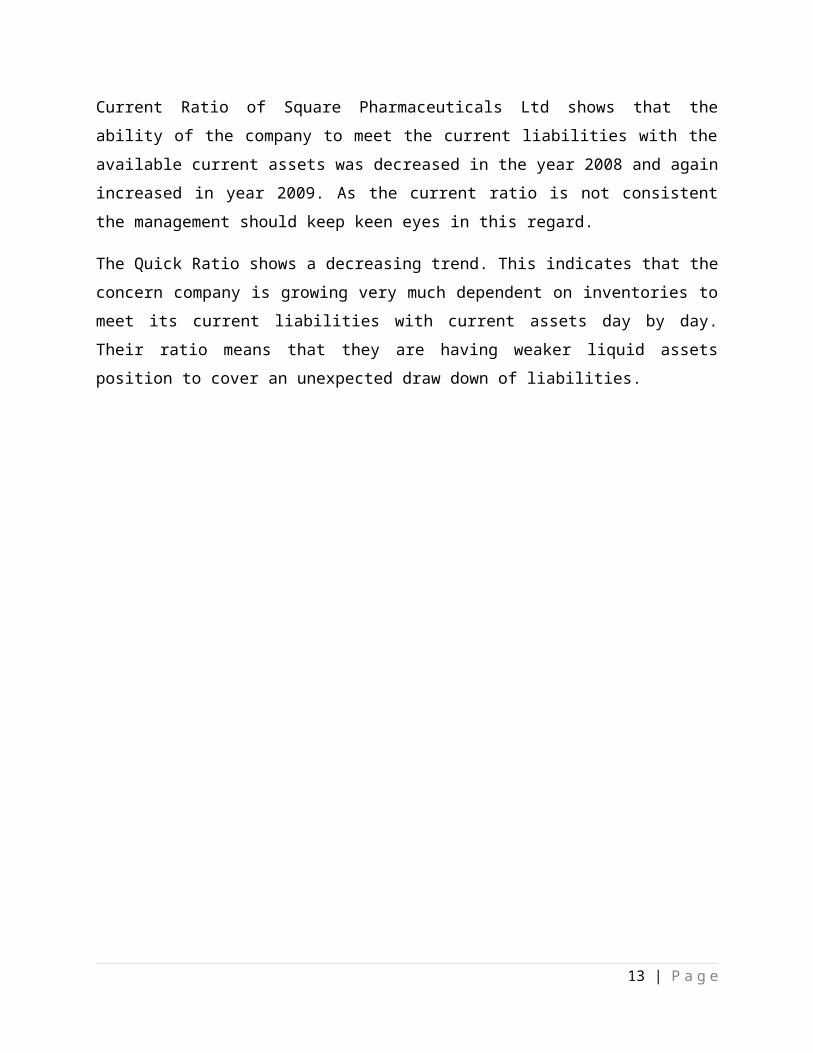
(v) = [(i)-(iii)]÷(ii)2009 3,843,512,855 2,640,868,554 2,098,755,231 1.46 0.662008 4,411,836,436 3,500,845,103 2,026,736,322 1.26 0.682007 3,682,510,712 2,555,566,286 1,544,191,798 1.44 0.84
10 | P a g e
Comment
Current Ratio of Square Pharmaceuticals Ltd shows that the ability of the company to meet the
current liabilities with the available current assets was decreased in the year 2008 and again
increased in year 2009. As the current ratio is not consistent the management should keep keen
eyes in this regard.
The Quick Ratio shows a decreasing trend. This indicates that the concern company is growing
very much dependent on inventories to meet its current liabilities with current assets day by
day. Their ratio means that they are having weaker liquid assets position to cover an
unexpected draw down of liabilities.
11 | P a g e
Financial Leverage Ratios
Financial Leverage Ratios show the extent that debt is used in a company’s capital structure.
Followings are the Financial Leverage Ratios that are found in our concerned company.
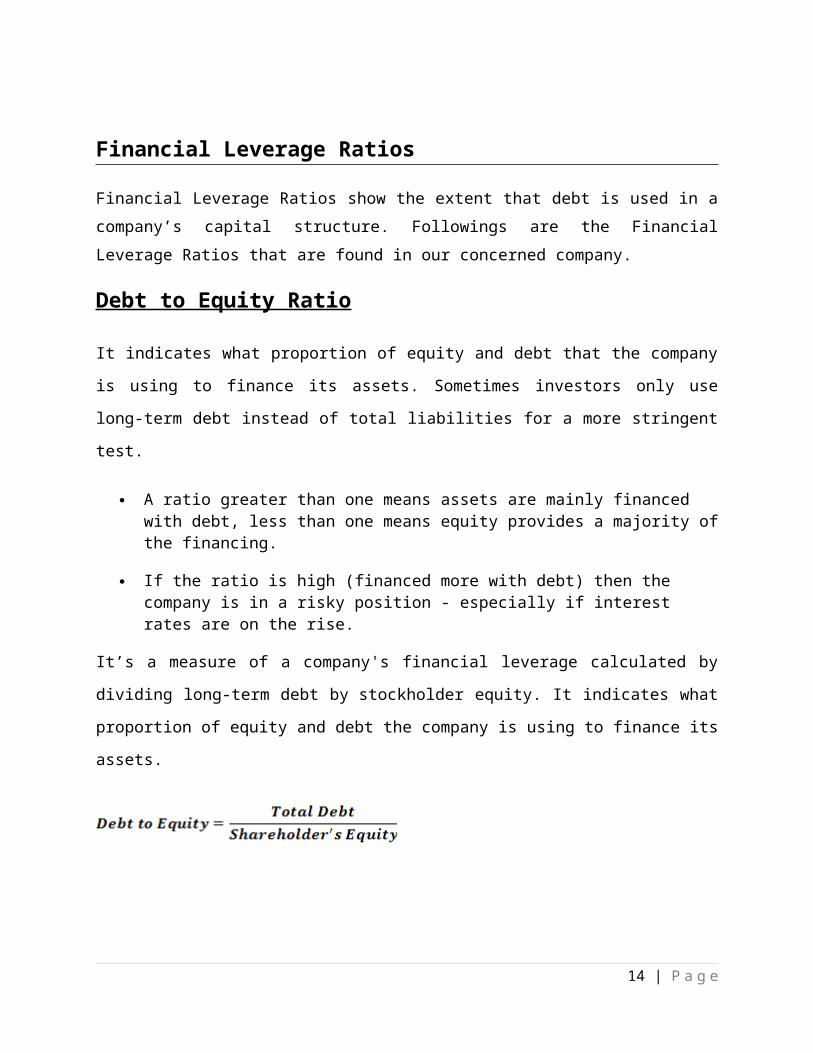
Debt to Equity Ratio
It indicates what proportion of equity and debt that the company is using to finance its assets.
Sometimes investors only use long-term debt instead of total liabilities for a more stringent
test.
A ratio greater than one means assets are mainly financed with debt, less than one means equity provides a majority of the financing.
If the ratio is high (financed more with debt) then the company is in a risky position - especially if interest rates are on the rise.
It’s a measure of a company's financial leverage calculated by dividing long-term debt
by stockholder equity. It indicates what proportion of equity and debt the company is using to
finance its assets.
High Debt-Equity ratio generally means a company has been aggressive in financing its growth
with debt. This can result in volatile earnings as a result of the additional interest expense.
If a lot of debt is used to finance increased operations (high debt to equity), the company could
potentially generate more earnings than it would have without this outside financing. If this
were to increase earnings by a greater amount than the debt cost (interest), then the
shareholders benefit as more earnings are being spread around to the same amount of
shareholders. However, the cost of this debt financing may outweigh the return that the
company generates on the debt through investment and business activities and become too
12 | P a g e
much for the company to handle. This might lead to bankruptcy, which would leave
shareholders with nothing, so it is a delicate balance. This is what the leverage effect is about
and what the debt/equity ratio measures.
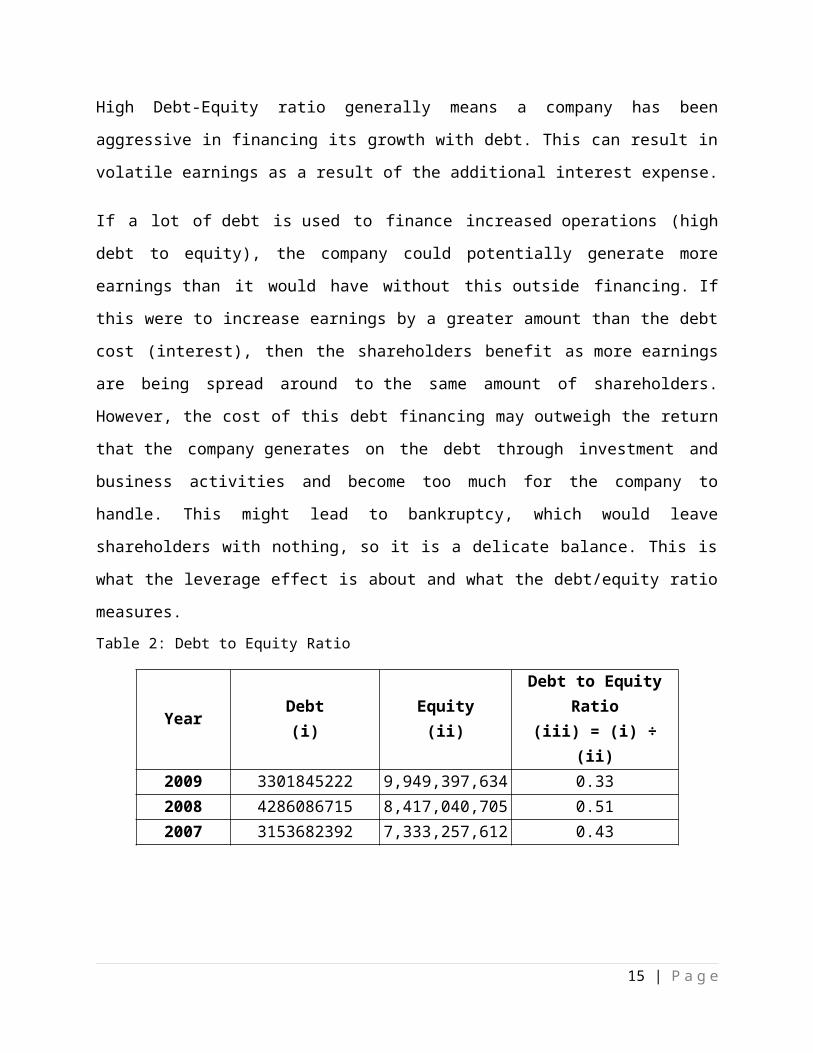
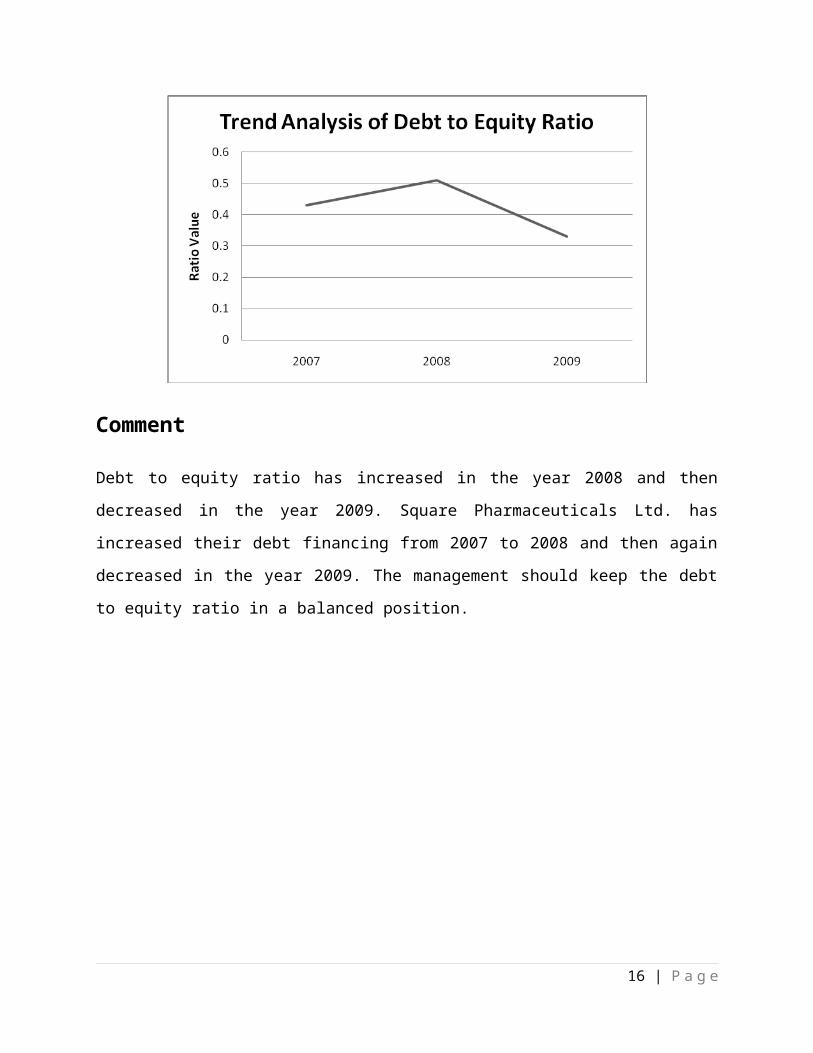
Table 2: Debt to Equity Ratio
YearDebt
(i)Equity
(ii)Debt to Equity Ratio
(iii) = (i) ÷ (ii)2009 3301845222 9,949,397,634 0.332008 4286086715 8,417,040,705 0.512007 3153682392 7,333,257,612 0.43
Comment
Debt to equity ratio has increased in the year 2008 and then decreased in the year 2009. Square
Pharmaceuticals Ltd. has increased their debt financing from 2007 to 2008 and then again
decreased in the year 2009. The management should keep the debt to equity ratio in a
balanced position.
13 | P a g e
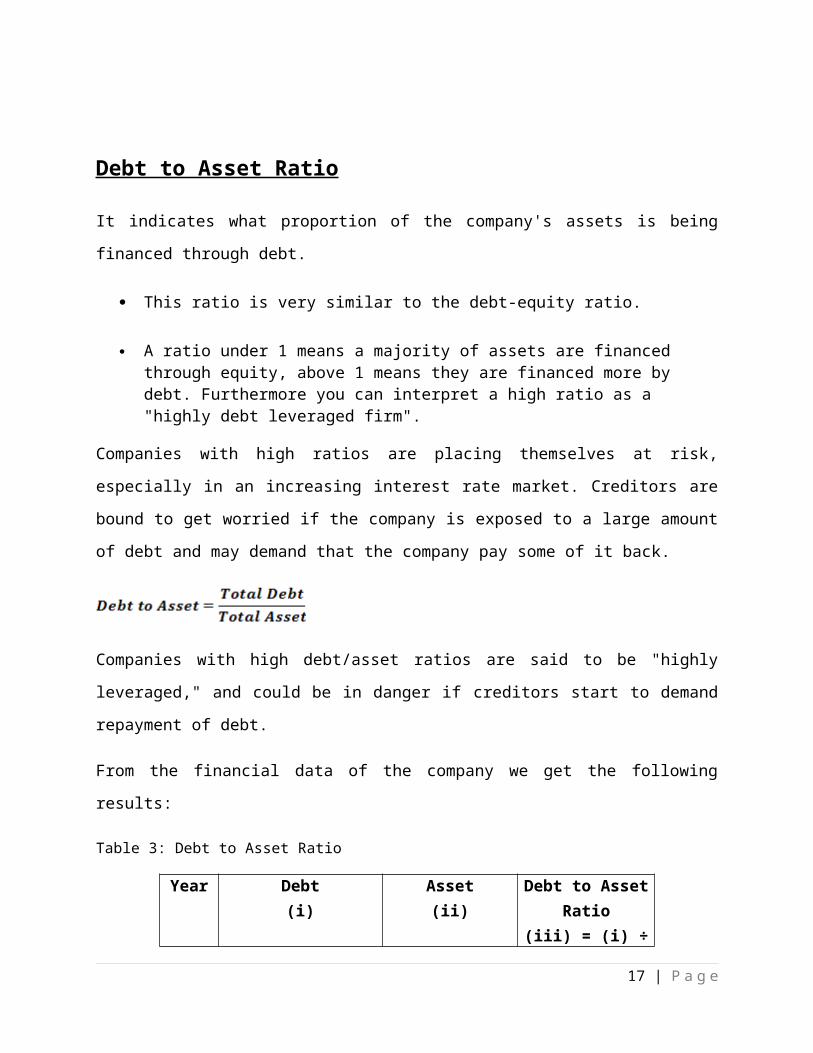
Debt to Asset Ratio
It indicates what proportion of the company's assets is being financed through debt.
This ratio is very similar to the debt-equity ratio.
A ratio under 1 means a majority of assets are financed through equity, above 1 means they are financed more by debt. Furthermore you can interpret a high ratio as a "highly debt leveraged firm".
Companies with high ratios are placing themselves at risk, especially in an increasing interest
rate market. Creditors are bound to get worried if the company is exposed to a large amount of
debt and may demand that the company pay some of it back.
Companies with high debt/asset ratios are said to be "highly leveraged," and could be in danger
if creditors start to demand repayment of debt.
From the financial data of the company we get the following results:
Table 3: Debt to Asset Ratio
YearDebt
(i)Asset
(ii)Debt to Asset Ratio
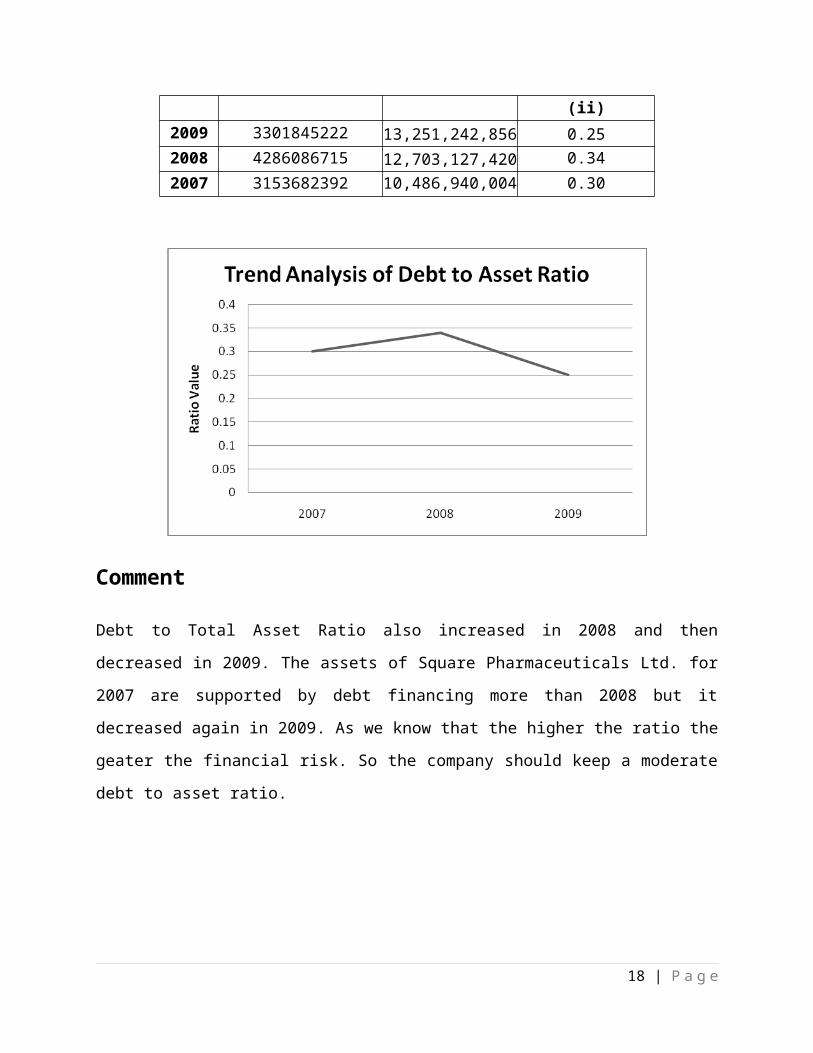
(iii) = (i) ÷ (ii)2009 3301845222 13,251,242,856 0.252008 4286086715 12,703,127,420 0.342007 3153682392 10,486,940,004 0.30
14 | P a g e
Comment
Debt to Total Asset Ratio also increased in 2008 and then decreased in 2009. The assets of
Square Pharmaceuticals Ltd. for 2007 are supported by debt financing more than 2008 but it
decreased again in 2009. As we know that the higher the ratio the geater the financial risk. So
the company should keep a moderate debt to asset ratio.
15 | P a g e
Coverage Ratio
Coverage Ratio relates the financial charges of a firm to its ability to service or cover them.
Interest Coverage Ratio
It indicates a firm’s ability to cover interest charges. It is also called times interest earned.
The higher the ratio the greater the likelidhood that the company could cover its interest payments without difficulty.
The value of the ratio indicates the firm’s ability to cover annual interest by same times with operating income
This rario also sheds some light on the firm’s capacity to take on new debt.
Firms with higher interest coverage ratio are less vulnarable to interest charges and likely to be able to avoid bankrupcy.
From the financial data of the company we get the following results:
Table 4: Interest Coverage Ratio
Year EBIT(i)
Interest Expenses(ii)
Interest Coverage Ratio(iii) = (i) ÷ (ii)
2009 2,368,437,227 397,135,963 5.962008 1,709,305,818 351,868,423 4.862007 1,825,752,239 236,845,084 7.71
16 | P a g e
Comment
The value of the interest coverage ratio decresed in 2008 and then increased again in 2009. The management should try to increase its earnings so that it can cover its interest expenses with relative ease.
17 | P a g e
Activity Ratio
Activity Ratio indicates the quality of receivables and how successful the firm is in its
collections. Mainly activity ratios are the indication of financial activities of a firm’s
collection/marketing department.
Activity Ratio can be divided into six types:
Receivable Turnover
Average Collection Period/Receivable Turnover in days
Payable Turnover
Payable Turnover in days
Inventory Turnover
Total Asset Turnover
Receivable Turnover Ratio
This ratio shows the efficiency of the collection team of the company. How efficient the
collection team is to collect the receivables, i.e. the credit sales. The mathematical formula to
compute the ratio is-
Assuming that all the sales are done in credit, the practical data of the company illustrates the
following result.
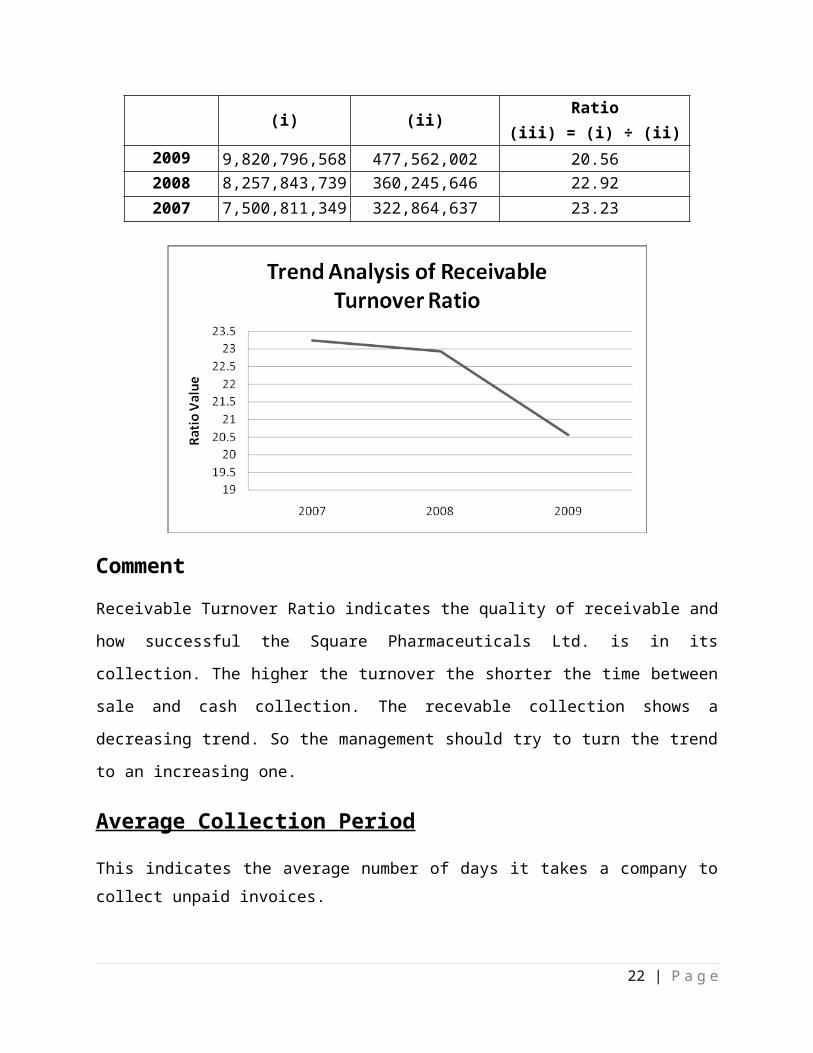
Table 5: Receivable Turnover Ratio
YearNet Sales
(i)Receivables
(ii)Receivable Turnover Ratio
(iii) = (i) ÷ (ii)2009 9,820,796,568 477,562,002 20.562008 8,257,843,739 360,245,646 22.922007 7,500,811,349 322,864,637 23.23
18 | P a g e
Comment
Receivable Turnover Ratio indicates the quality of receivable and how successful the Square
Pharmaceuticals Ltd. is in its collection. The higher the turnover the shorter the time between
sale and cash collection. The recevable collection shows a decreasing trend. So the
management should try to turn the trend to an increasing one.
Average Collection Period
This indicates the average number of days it takes a company to collect unpaid invoices.
A high ratio indicates that the company is having problems getting paid for services or products
The ratio is sometimes seasonally affected, rising during busy seasons and falling during the off-season. To account for this seasonality, the average accounts receivable ((beginning + ending accounts receivable)/2) could be used instead.
Average collection period can be determined by the following formula.
19 | P a g e
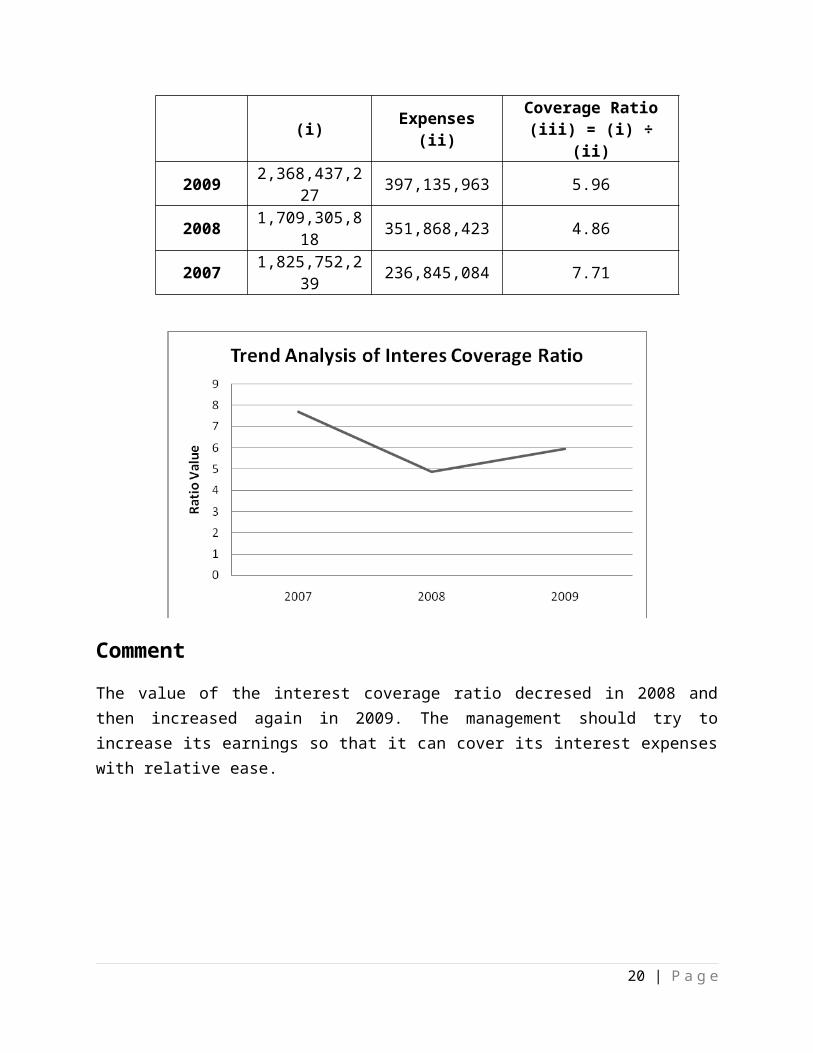
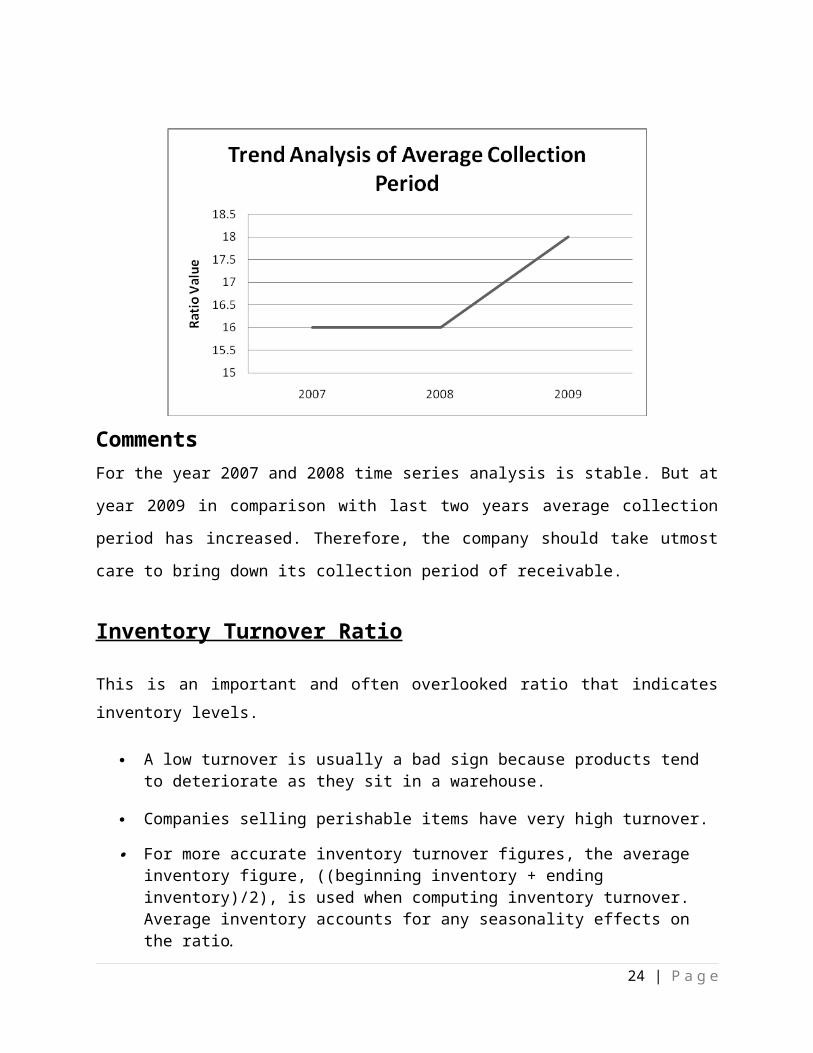
Table 6: Average Collection Period
YearReceivable Turnover
(i)Average Collection Period
(ii) = 365 ÷ (i)2009 20.56 182008 22.92 162007 23.23 16
CommentsFor the year 2007 and 2008 time series analysis is stable. But at year 2009 in comparison with
last two years average collection period has increased. Therefore, the company should take
utmost care to bring down its collection period of receivable.
Inventory Turnover Ratio
This is an important and often overlooked ratio that indicates inventory levels.
A low turnover is usually a bad sign because products tend to deteriorate as they sit in a warehouse.
Companies selling perishable items have very high turnover.
For more accurate inventory turnover figures, the average inventory figure, ((beginning inventory + ending inventory)/2), is used when computing inventory turnover. Average inventory accounts for any seasonality effects on the ratio.
20 | P a g e
Inventory Turnover Ratio indicates the effectiveness of the inventory management of the firm.
It can be defined by the following equation.
Table 7: Inventory Turnover Ratio
YearCost of Goods Sold
(i)Inventory
(ii)Inventory Turnover Ratio
(iii) = (i) ÷ (ii)2009 5,672,565,973 2,098,755,231 2.702008 4,856,061,933 2,026,736,322 2.402007 4,268,447,662 1,544,191,798 2.76
CommentsThe changes in Inventory Turnover Ratio decreased in 2008 comparing to previous year but
increased again in 2009. Though last years trend is an increasing one, still the company should
improve its inventory management to achieve organization’s goals.
Total Asset Turnover Ratio
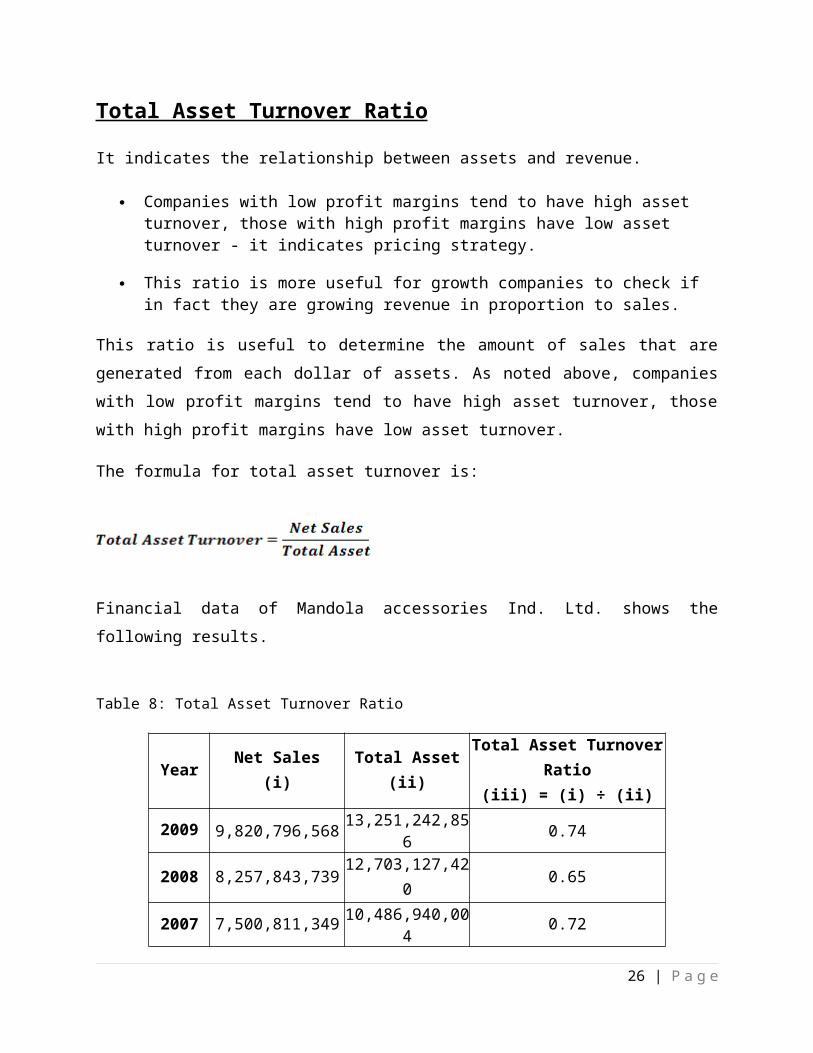
It indicates the relationship between assets and revenue.
21 | P a g e
Companies with low profit margins tend to have high asset turnover, those with high profit margins have low asset turnover - it indicates pricing strategy.
This ratio is more useful for growth companies to check if in fact they are growing revenue in proportion to sales.
This ratio is useful to determine the amount of sales that are generated from each dollar of
assets. As noted above, companies with low profit margins tend to have high asset turnover,
those with high profit margins have low asset turnover.
The formula for total asset turnover is:
Financial data of Mandola accessories Ind. Ltd. shows the following results.
Table 8: Total Asset Turnover Ratio
YearNet Sales
(i)Total Asset
(ii)Total Asset Turnover Ratio
(iii) = (i) ÷ (ii)2009 9,820,796,568 13,251,242,856 0.742008 8,257,843,739 12,703,127,420 0.652007 7,500,811,349 10,486,940,004 0.72
22 | P a g e

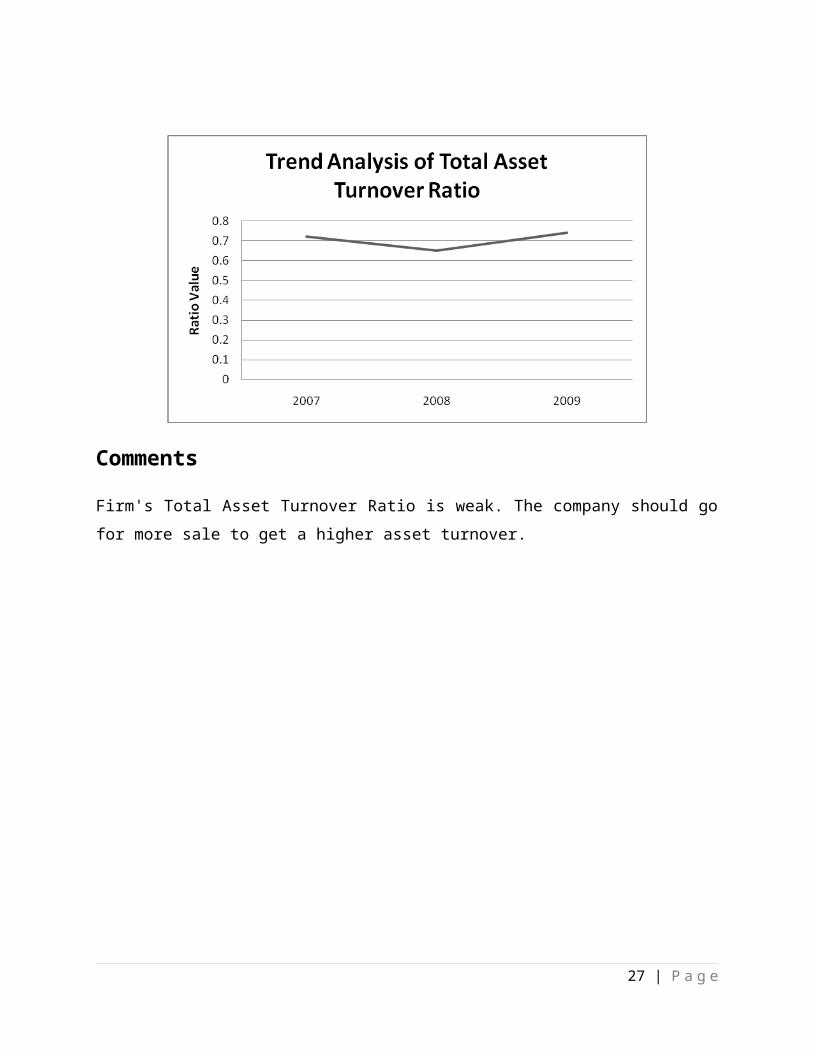
Comments
Firm's Total Asset Turnover Ratio is weak. The company should go for more sale to get a higher
asset turnover.
23 | P a g e
Profitability Ratio
Profitability Ratio can be divided into four parts:
Gross Profit Margin Ratio
Net Profit Margin Ratio
Return on Investment Ratio
Return on Equity Ratio
Gross Profit Ratio
Indicates what the company's pricing policy is and what the true mark-up margins are.
The results may skew if the company has a very large range of products.
This is very useful when comparing against the margins of previous years.
A 33% gross margin means products are marked up 50% and so on.
The gross margin is not an exact estimate of the company's pricing strategy but it does give a
good indication of financial health. Without an adequate gross margin, a company will be
unable to pay its operating and other expenses and build for the future.
The gross profit margin ratio tells us the profit a business makes on its cost of sales, or cost of
goods sold. It is a very simple idea and it tells us how much gross profit per 1 TK. of turnover
our business is earning. Gross profit is the profit we earn before we take off any administration
costs, selling costs and so on. So we should have a much higher gross profit margin than net
profit margin.
From the profit and loss account of the company we get the following results.
24 | P a g e
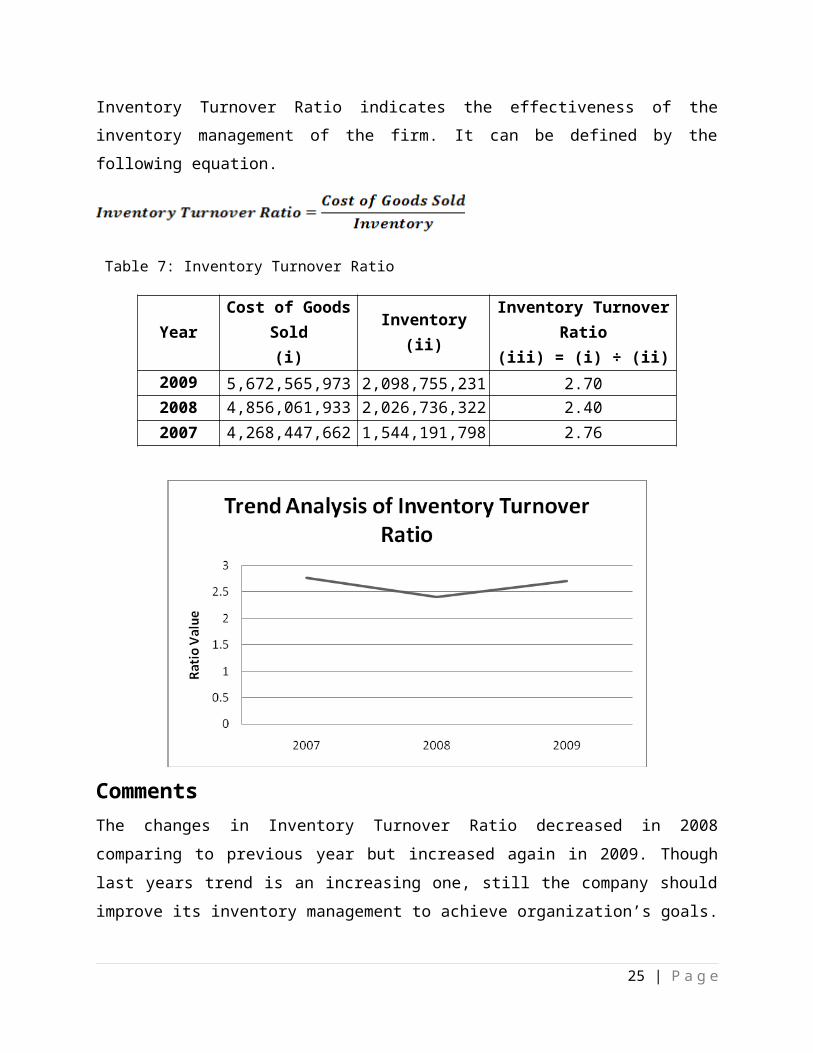
Table 9: Gross Profit Margin Ratio
YearGross profit
(i)Net Sales
(ii)Gross Profit Margin
(iii) = (i) ÷ (ii)2009 4,148,230,595 9,820,796,568 0.422008 3,401,781,806 8,257,843,739 0.412007 3,232,363,687 7,500,811,349 0.43
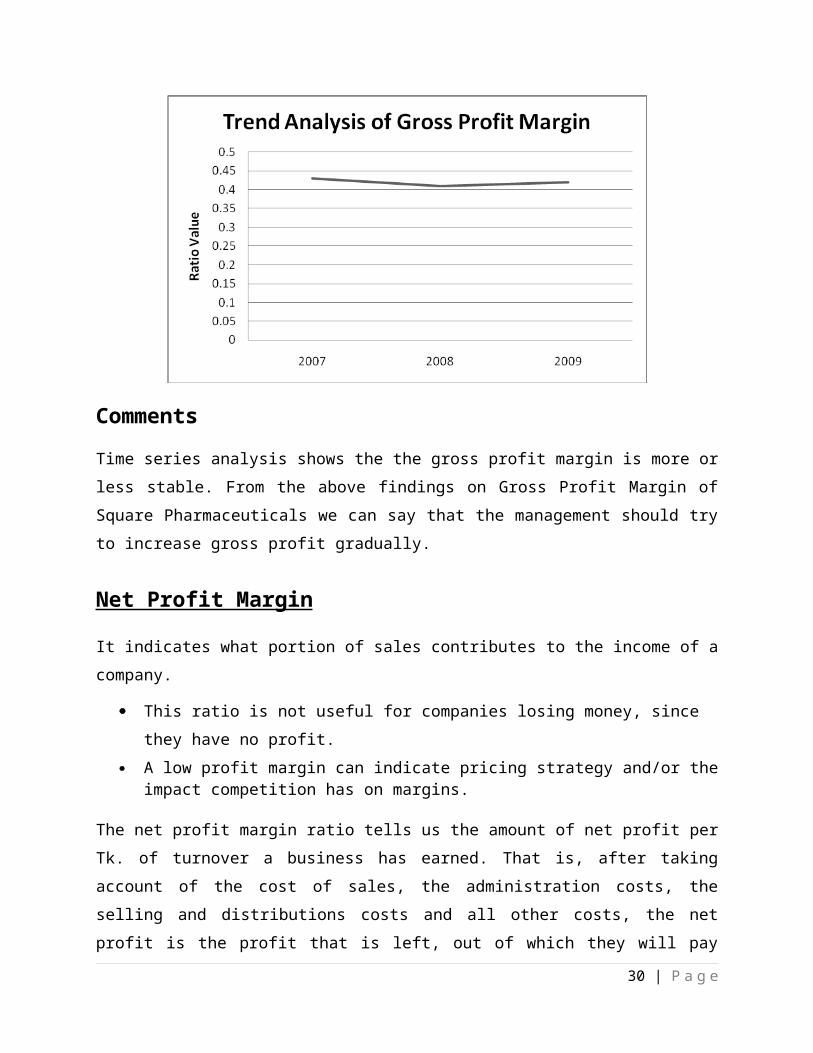
Comments
Time series analysis shows the the gross profit margin is more or less stable. From the above
findings on Gross Profit Margin of Square Pharmaceuticals we can say that the management
should try to increase gross profit gradually.
Net Profit Margin
It indicates what portion of sales contributes to the income of a company.
This ratio is not useful for companies losing money, since they have no profit.
A low profit margin can indicate pricing strategy and/or the impact competition has on margins.
The net profit margin ratio tells us the amount of net profit per Tk. of turnover a business has
earned. That is, after taking account of the cost of sales, the administration costs, the selling
25 | P a g e
and distributions costs and all other costs, the net profit is the profit that is left, out of which
they will pay interest, tax, dividends and so on. The formula to calculate the said ratio is defined
as
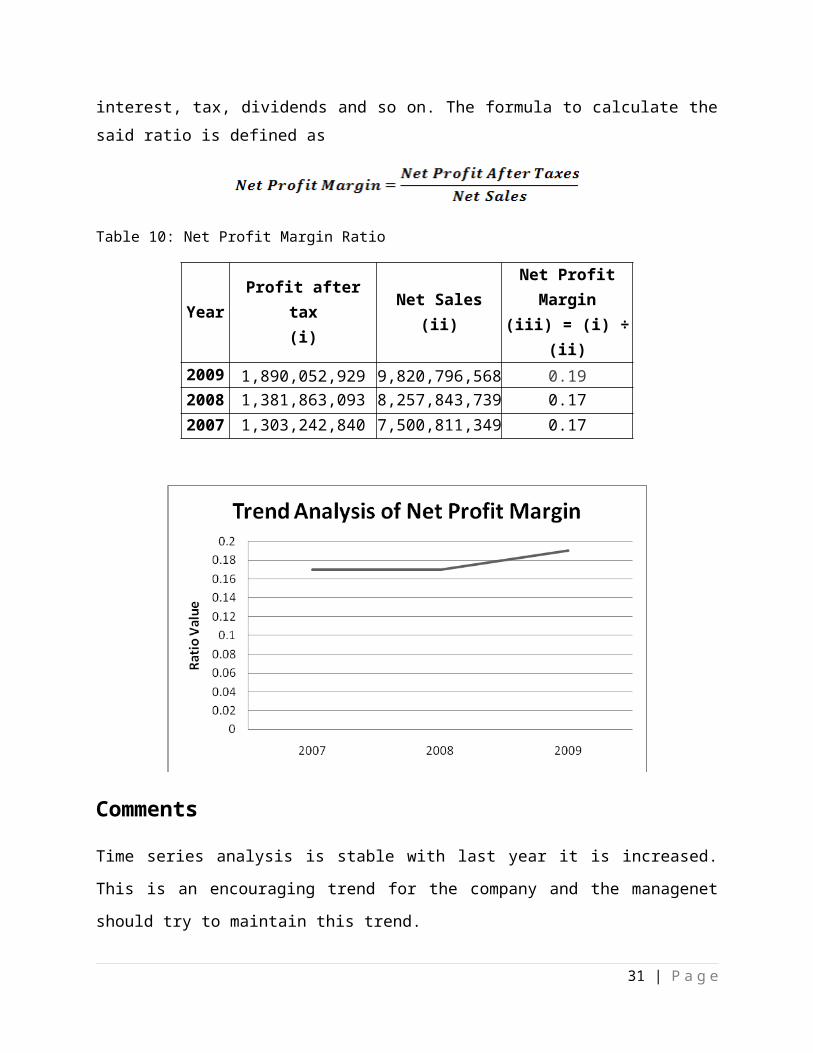
Table 10: Net Profit Margin Ratio
YearProfit after tax
(i)Net Sales
(ii)Net Profit Margin
(iii) = (i) ÷ (ii)2009 1,890,052,929 9,820,796,568 0.192008 1,381,863,093 8,257,843,739 0.172007 1,303,242,840 7,500,811,349 0.17
Comments
Time series analysis is stable with last year it is increased. This is an encouraging trend for the
company and the managenet should try to maintain this trend.
Return on Investment
It indicates what return a company is generating on the firm's investments/assets.
26 | P a g e
The ROA is often referred to as ROI
We add the interest expense to ignore the costs associated with funding those assets.
This is an important ratio for companies deciding whether or not to initiate a new project. The
basis of this ratio is that if a company is going to start a project they expect to earn a return on
it, ROA is the return they would receive. Simply put, if ROA is above the rate that the company
borrows at then the project should be accepted, if not then it is rejected.
This ratio indicates the profitability on the assets of the firm after all expenses and taxes. The
method for calculating this ratio is as below.
Table 11: Return on Investment Rate
YearProfit after tax
(i)Asset
(ii)Return on Investment
(iii) = (i) ÷ (ii)2009 1,890,052,929 13,251,242,856 0.142008 1,381,863,093 12,703,127,420 0.112007 1,303,242,840 10,486,940,004 0.12
27 | P a g e
Comments
SquareTrend analysis of Return on Investment Ratio shows that after 2007 it decreased but for the next year it increased. Profit in 2007 is 12%, in 2008 is 11% and in 2009 is 14%. The company should take necessary steps to maintain this trend.
Return on Equity
Indicates what return a company is generating on the owners' investment.
For high growth companies you should expect a higher ROE.
Averaging ROE over the past few years can give a better idea of the historical growth.
Sometimes ROE is referred to as Stockholder's return on investment, it tells the rate that
shareholders are earning on their shares. The Return on Equity Ratio tells us how much profit
we earn from the investments the shareholders have made in their company. The
mathematical formula is as
28 | P a g e
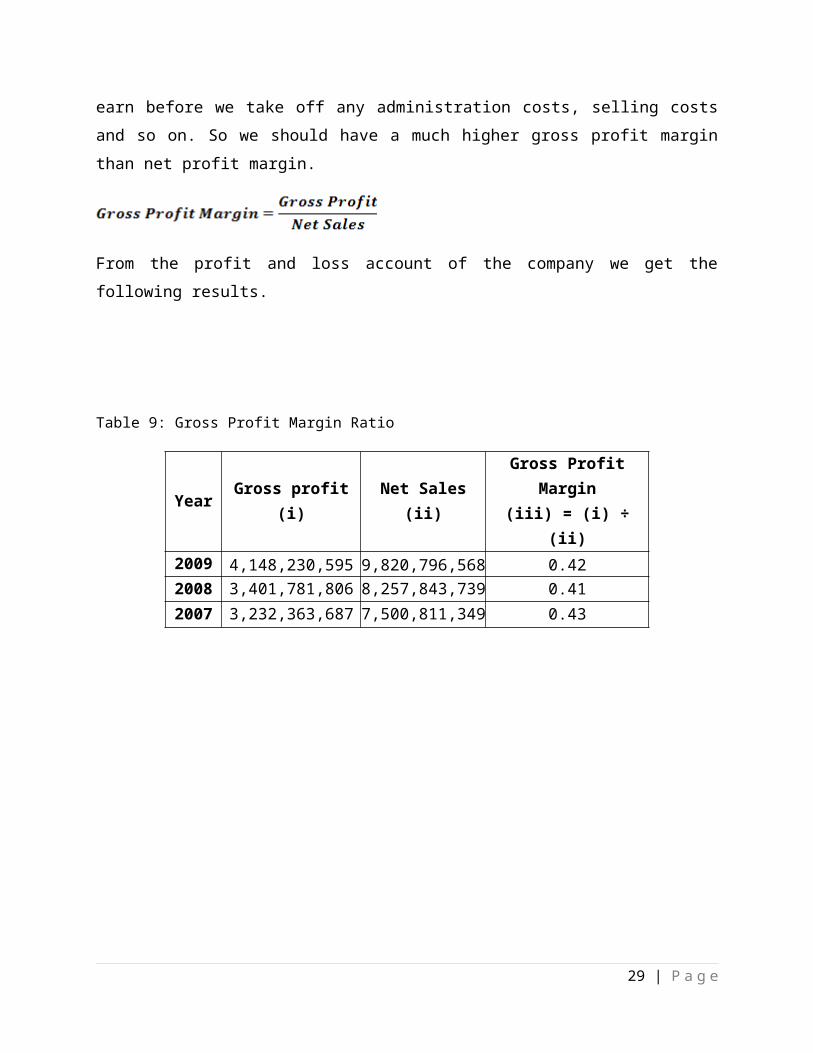
Table 12: Return on Equity Ratio
YearProfit after tax
(i)Shareholders’ Equity
(ii)Return on Equity
(iii) = (i) ÷ (ii)2009 1,890,052,929 9,949,397,634 0.192008 1,381,863,093 8,417,040,705 0.162007 1,303,242,840 7,333,257,612 0.18
Comments
Return on Equity indicates the profitability to the shareholders of Square Pharmaceuticals Ltd
after all expenses and taxes. Which is 18% in 2007, 16% in 2008 and 19% in 2009. The investors
of the company got more benefits in 2007 and 2009. In the middle of that period their benefits
declined in a significant manner in 2008.
29 | P a g e
Summary & Conclusion
Considering all the Financial Ratios of Square Pharmaceuticals Ltd we can infer that at present
the overall condition of this company is good. Square Pharmaceuticals Ltd had a mixed period
from the year 2007 to 2009. Though the ROI is increasing gradually and ROE is not stable, it has
decreased in 2008 but then again went up in 2009. Company's gross profit margin is stable at
around 42% constant rate. Net profit margin was stable at 17% over 2007-08 and showed an
increasing trend in 2009 to reach 19%. But the company had a weak asset turnover ratio over
this period.
But we find that their financial management is as stronger as required to attract large number
of shareholders. At the end, we can conclude that, the company has strong growth rate in
recent years with a strong market reputation. But still the company should keep keen eyes in
management operation to improve the financial condition.
30 | P a g e
Source
Square Pharmaceuticals Ltd.
1. Annual Report 2008-2009
2. Annual Report 2007-2008
31 | P a g e