Embed Size (px)
Citation preview

8/7/2019 anuj kumar final report
http://slidepdf.com/reader/full/anuj-kumar-final-report 1/95
[1]

8/7/2019 anuj kumar final report
http://slidepdf.com/reader/full/anuj-kumar-final-report 2/95
[2]

8/7/2019 anuj kumar final report
http://slidepdf.com/reader/full/anuj-kumar-final-report 3/95
RESEARCH METHODOLOGY
RESEARCE METHOLOGY refers to the various sequential steps along with arationale of each such step to adopt by a researcher in studying a problemwith certain object or objectives in view .It would be appropriate to mention that research projects are notsusceptible to any one complete and inflexible sequence of steps and type
of problems to be studied will determine the particular steps to be takenand their order too .However, the following steps provide useful procedural guidelines so farresearch methodology is concerned;
1-Tentative selection of the problem.
2-Selecting the research problem.
3-Design of the research project.
4-Sample design.
5-Analysis of data.
6-Preparation of the report.
[3]

8/7/2019 anuj kumar final report
http://slidepdf.com/reader/full/anuj-kumar-final-report 4/95
Education in IndiaGet Tips Ideas to Improve
Teacher Training DiplomaPre & Primary Teaching Course Teachers' Training Course in India
Research EducationAccess full-text academic books and journals. Online research – Questia
Improve Teaching SkillsEarn a Degree or Masters in Education Leadership online
Top Schools in IndiaFree Listing of All Board Schools in India. Find School Full Details
[4]

8/7/2019 anuj kumar final report
http://slidepdf.com/reader/full/anuj-kumar-final-report 5/95
History of educationFrom Wikipedia, the free encyclopedia
School of Aristotle, fresco by Gustav Spangenberg.
The history of education is the history of teaching and learning. Each generation, sincethe beginning of human existence, has sought to pass on cultural and social values,traditions, morality, religion and skills to the next generation.[1] The passing on of culture is also known as enculturation and the learning of social values and behavioursis socialization. The history of the curricula of such education reflects human history itself, the history of knowledge, beliefs, skills and cultures of humanity.[2][3]
In pre-literate societies, education was achieved orally and through observation andimitation. The young learned informally from their parents, extended family and grandparents. At later stages of their lives, they received instruction of a more structured andformal nature, imparted by people not necessarily related, in the context of initiation,religion or ritual.[4][5][6]
As the customs and knowledge of ancient civilizations became more complex, manyskills would have been learned from an experienced person on the job, in animalhusbandry, agriculture, fishing, preparation and preservation of food, construction,stone work , metal work , boat building, the making of weapons and defensis, themilitary skills and many other occupations.
With the development of writing, it became possible for stories, poetry, knowledge,beliefs, and customs to be recorded and passed on more accurately to people out of
earshot and to future generations. In many societies, the spread of literacy was slow;orality and illiteracy remained predominant for much of the population for centuriesand even millennia.[7] Literacy in preindustrial societies was associated with civiladministration, law, long distance trade or commerce, and religion.[8] A formalschooling in literacy was often only available to a small part of the population, either atreligious institutions or for the wealthy who could afford to pay for their tutors. Theearliest known universities, or places of higher education, started teaching a millenniumor more ago.
Universal education of all children in literacy has been a recent development, notoccurring in many countries until after 1850 CE. Even today, in some parts of the
[5]

8/7/2019 anuj kumar final report
http://slidepdf.com/reader/full/anuj-kumar-final-report 6/95
world, literacy rates are below 60 per cent (for example, in Afghanistan, Pakistan, Bangladesh). Schools, colleges and universities have not been the only methods of formal education and training. Many professions have additional training requirements,and in Europe, from the Middle Ages until recent times, the skills of a trade were notgenerally learnt in a classroom, but rather by serving an apprenticeship.
Nowadays, formal education consists of systematic instruction, teaching and trainingby professional teachers. This consists of the application of pedagogy and thedevelopment of curricula.
India
In ancient India, during the Vedic period from about 1500 BC to 600 BC, mosteducation was based on the Veda (hymns, formulas, and incantations, recited or chanted by priests of a pre-Hindu tradition) and later Hindu texts and scriptures.
Vedic education included: proper pronunciation and recitation of the Veda, the rules of sacrifice, grammar and derivation, composition, versification and meter, understandinglalala of secrets of nature, reasoning including logic, the sciences, and the skillsnecessary for an occupation.[26] Some medical knowledge existed and was taught. Thereis mention in the Veda of herbal medicines for various conditions or diseases, includingfever, cough, baldness, snake bite and others.[26]
Education, at first freely available in Vedic society, became over time more
discriminatory as the caste system, originally based on occupation, evolved, with thebrahman (priests) being the most privileged of the castes.[26]
The oldest of the Upanishads - another part of Hindu scriptures - date from around 500BC. These texts encouraged an exploratory learning process where teachers andstudents were co-travellers in a search for truth. The teaching methods used reasoningand questioning. Nothing was labeled as the final answer .[26]
The Gurukul system of education supported traditional Hindu residential schools of learning; typically the teacher's house or a monastery. Education was free, but studentsfrom well-to-do families paid "Gurudakshina," a voluntary contribution after thecompletion of their studies. At the Gurukuls, the teacher imparted knowledge of Religion, Scriptures, Philosophy, Literature, Warfare, Statecraft, Medicine, Astrology
and History. The corpus of Sanskrit literature encompasses a rich tradition of poetryand drama as well as technical scientific, philosophical and generally Hindu religious texts, though many central texts of Buddhism and Jainism have also been composed inSanskrit.
Two epic poems formed part of ancient Indian education. The Mahabharata, part of which may date back to the 8th century BC,[27] discusses human goals (purpose,pleasure, duty, and liberation), attempting to explain the relationship of the individualto society and the world (the nature of the 'Self ') and the workings of karma. The other epic poem, Ramayana, is shorter, although it has 24,000 verses. It is thought to have
[6]

8/7/2019 anuj kumar final report
http://slidepdf.com/reader/full/anuj-kumar-final-report 7/95
been compiled between about 400 BC and 200 AD. The epic exploresthemes of human existence and the concept of dharma.[27]
A
DISSERTATION
ON
“MARKETING STRTEGY OF DTH OPERATOR IN RUDAPUR RESON”
“In partial fulfillment of the requirement of Uttarakhand Technical
University for the award of degree in Master of Business Administration”
SUBMITTED TO: SUBMITTED BY:
Mr. Anshu Shukla Prabhaker Singh
(Management faculty) MBA IVth Sem (2009-11)
S.I.M.T, Rudrapur Roll No. 094900047
[7]
8/7/2019 anuj kumar final report
http://slidepdf.com/reader/full/anuj-kumar-final-report 8/95
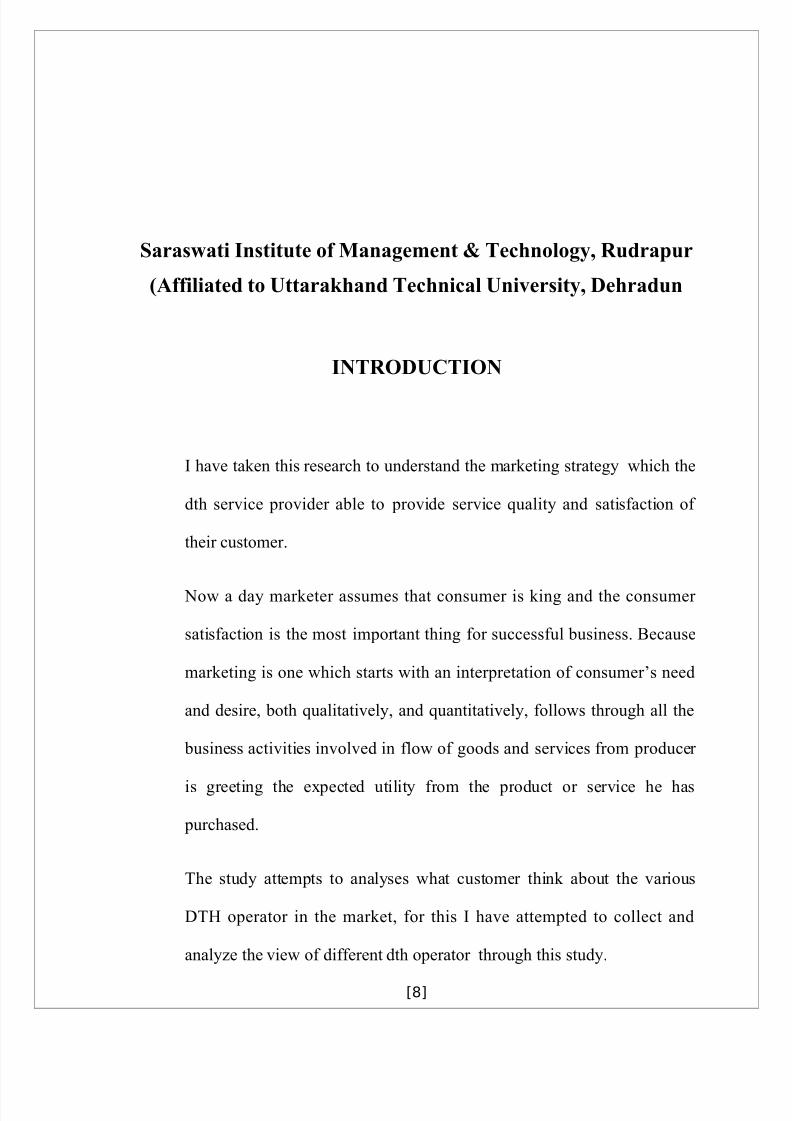
Saraswati Institute of Management & Technology, Rudrapur
(Affiliated to Uttarakhand Technical University, Dehradun
INTRODUCTION
I have taken this research to understand the marketing strategy which the
dth service provider able to provide service quality and satisfaction of
their customer.
Now a day marketer assumes that consumer is king and the consumer
satisfaction is the most important thing for successful business. Because
marketing is one which starts with an interpretation of consumer’s need
and desire, both qualitatively, and quantitatively, follows through all the
business activities involved in flow of goods and services from producer
is greeting the expected utility from the product or service he has
purchased.
The study attempts to analyses what customer think about the various
DTH operator in the market, for this I have attempted to collect and
analyze the view of different dth operator through this study.
[8]

8/7/2019 anuj kumar final report
http://slidepdf.com/reader/full/anuj-kumar-final-report 9/95
PREFACE
t suffix to theoretical knowledge; one can not merely rely upon the theoretical
knowledge. Classroom make the fundamental concept clear, but practical survey
has significant role play in subject of business management to development
managerial skills, it is necessary that they combine their classroom’s learning
with the knowledge of real business environment.
I am extremely happy to present this research report before the esteemed
tearcher/management, entitled MARKETING STRTEGY OF DTH
OPERATOR IN RUDAPUR RESON.
It has not only helped me to enhance my knowledge about various field of
marketing and company’s responsibility towards customer service but also
[9]

8/7/2019 anuj kumar final report
http://slidepdf.com/reader/full/anuj-kumar-final-report 10/95
gave new dimension to my knowledge about psychology and consumer
preference towards dth service providers.
ACKNOWLEDGEMENT
Hard work & dedication is a key to success. No task is the single man’s effort.
Similarly this research report has been made possible through the direct &
indirect cooperation of various persons to whom I wish to express my gratitude.
This Report has been made possible through the direct cooperative of various for
whom I wish my express my appreciation & gratitude.
I take this opportunity to thank my guide Mrs. Pooja Johari , H.O.D of
management department, for his constant guidance, suggestions for
[10]

8/7/2019 anuj kumar final report
http://slidepdf.com/reader/full/anuj-kumar-final-report 11/95
improvement and constant encouragement during writing of this research report.
DECLARATION
This research has been undertaken for the partial fulfillment of the requirements
for the award of degree of MBA (master of business administration) from
Uttarakhand Technical University, dehradun.
[11]
8/7/2019 anuj kumar final report
http://slidepdf.com/reader/full/anuj-kumar-final-report 12/95
Further, I declare that this study is my original work & the analysis and findings
are for Academic purpose only. This study has not been presented in any
seminar or submitted elsewhere for the award of any degree or diploma.
Counter signed by: Signature ofstudent
Mrs. Pooja Johari (Prabhaker Singh)
H.O.D (management department)
TABLE OF CONTENTS
➢ Preface
➢ Acknowledgement
➢ Student Declaration
➢ College Certificate
[12]

8/7/2019 anuj kumar final report
http://slidepdf.com/reader/full/anuj-kumar-final-report 13/95
➢ Table of Contents
➢ Abstract or Summary
➢ Introduction
➢ Research Methodology
➢ Review of Literature
➢ Empirical Analysis
➢ Findings
➢ Conclusion
➢ Suggestion & Recommendation
➢
[13]

8/7/2019 anuj kumar final report
http://slidepdf.com/reader/full/anuj-kumar-final-report 14/95
➢
[14]

8/7/2019 anuj kumar final report
http://slidepdf.com/reader/full/anuj-kumar-final-report 15/95
➢ Questionnaire
➢ Bibliography
[15]

8/7/2019 anuj kumar final report
http://slidepdf.com/reader/full/anuj-kumar-final-report 16/95
OBJECTIVES OF THE STUDY
To study the evaluation of Direct To Home(DTH) with particular
reference to India.
To ascertain the attributer which influenced the customer’s in
selecting a
particular dth operator. To study the marketing straegy towards different Dth service
providers in Rudrapur city.
To assess the problems faced by the DTH operator in rudrapur city.
To offer valuable suggestions to improve the marketing stategy of
dth operators.
[16]

8/7/2019 anuj kumar final report
http://slidepdf.com/reader/full/anuj-kumar-final-report 17/95
NEED OF THE STUDY
Exchange of information becomes the necessity of life to a common man.
In the modern world an individual tends to communicate anything to
everything right from the place where he/she stands. Even while riding
vehicle he / she wants communicate within a fraction of second at quick
speed with clear voice, without any disturbance. Like line crossing, out of
order, etc. most of which lack in the connection given by the department of
tele-communication. Cell phones emerges as a boon quench such a thirst,
the by providing facilities, which a common man cannot imagine. Though
[17]

8/7/2019 anuj kumar final report
http://slidepdf.com/reader/full/anuj-kumar-final-report 18/95
cell phone industry has its origin in the recent past and the growth has been
excellent.
Day by day many new competitors enter the market with new attractive
schemes, provide additional facilities, add new features to existing ones,
reduce the charges her incoming and outgoing calls, introduce varieties of
handsets, models a healthy competition that benefits the subscribers.
Hence in this context, it is important to study the functioning of cellular
phone services and the utilization of their services by the telephones.
SCOPE OF STUDY
The present study is contained to Rudrapur city and it is decided to
consider Dis Tv, Tata Sky ,Relaince tv ,Big Tv. DTH service rendered to
the supplayer. In Rudrapur city there are various dth services available.
Sack as Tata, relaince, and etc. but the dth operators has been selected to
[18]

8/7/2019 anuj kumar final report
http://slidepdf.com/reader/full/anuj-kumar-final-report 19/95
study the marketing in it is the most popular private dth operators. The
main objectives of this study is to analyze the marketing strategy and
problems, faced by Airtel, Tata, etc., dth operators in Rudrapur city has
been taken for the current research work.
INTRODUCTION
DTH?
DTH stands for Direct-To-Home television. DTH is defined as thereception of satellite programmes with a personal dish in an individualhome.
DTH does away with the need for the local cable operator and puts thebroadcaster directly in touch with the consumer. Only cable operators can
[19]

8/7/2019 anuj kumar final report
http://slidepdf.com/reader/full/anuj-kumar-final-report 20/95
receive satellite programmes and they then distribute them to individualhomes.
How does DTH work?
A DTH network consists of a broadcasting centre, satellites, encoders,multiplexers, modulators and DTH receivers.
A DTH service provider has to lease Ku-band transponders from thesatellite. The encoder converts the audio, video and data signals into thedigital format and the multiplexer mixes these signals. At the user end,there will be a small dish antenna and set-top boxes to decode and view
numerous channels. On the user's end, receiving dishes can be as small as45 cm in diametre.
DTH is an encrypted transmission that travels to the consumer directlythrough a satellite. DTH transmission is received directly by the consumer at his end through the small dish antenna. A set-top box, unlike the regular cable connection, decodes the encrypted transmission.
How does DTH really differ from cable TV?
The way DTH reaches a consumer's home is different from the way cableTV does. In DTH, TV channels would be transmitted from the satellite to asmall dish antenna mounted on the window or rooftop of the subscriber'shome. So the broadcaster directly connects to the user. The middlemen likelocal cable operators are not there in the picture.
[20]

8/7/2019 anuj kumar final report
http://slidepdf.com/reader/full/anuj-kumar-final-report 21/95
MARKET
The term market is derived from Latin Word ‘Mercatus’, which means ‘to
trade’ that is purchasing and selling of goods. It also means merchandise
truthic place of business.
According to Pyle, “Market includes both place and region in which
buyers and sellers or in free competition with one another”.
MARKETING
Marketing includes all the impacts involved in the exchange process of
transferring the possession and ownership of goods or services from the
producer to the ultimate consumer’s.
MARKETING FORMULA
a. The foremost step is business aims at profit.
b. For profit making he can sell the products.
c. For selling the product he should create customers.
d. For creating the customer’s, customer’s needs of preferences to be
identified and satisfied.e. To satisfy the customer’s new product to be produced.
Marketing is trying to learn,
Who buy the products or services?
[21]

8/7/2019 anuj kumar final report
http://slidepdf.com/reader/full/anuj-kumar-final-report 22/95
How do they buy?
When do they buy?
Where do they buy?
Why do they buy?
How often they buy?
Marketing Strategy
The marketing concept of building an organization around the profitablesatisfaction of customer needs has helped firms to achieve success in high-growth, moderately competitive markets. However, to be successful in marketsin which economic growth has leveled and in which there exist manycompetitors who follow the marketing concept, a well-developed marketingstrategy is required. Such a strategy considers a portfolio of products and takesinto account the anticipated moves of competitors in the market.
Marketing Research for Strategic Decision Making
The two most common uses of marketing research are for diagnostic analysisto understand the market and the firm's current performance, and opportunityanalysis to define any unexploited opportunities for growth. Marketing researchstudies include consumer studies, distribution studies, semantic scaling,multidimensional scaling, intelligence studies, projections, and conjointanalysis. A few of these are outlined below.
• Semantic scaling: a very simple rating of how consumers perceive thephysical attributes of a product, and what the ideal values of thoseattributes would be. Semantic scaling is not very accurate since theconsumers are polled according to an ordinal ranking so mathematicalaveraging is not possible. For example, 8 is not necessarily twice as
much as 4 in an ordinal ranking system. Furthermore, each person usesthe scale differently.
• Multidimensional scaling (MDS) addresses the problems associated withsemantic scaling by polling the consumer for pair-wise comparisonsbetween products or between one product and the ideal. Theassumption is that while people cannot report reliably which attributesdrive their choices, they can report perceptions of similarities betweenbrands. However, MDS analyses do not indicate the relative importancebetween attributes.
[22]

8/7/2019 anuj kumar final report
http://slidepdf.com/reader/full/anuj-kumar-final-report 23/95
• Conjoint analysis infers the relative importance of attributes bypresenting consumers with a set of features of two hypothetical productsand asking them which product they prefer. This question is repeatedover several sets of attribute values. The results allow one to predictwhich attributes are the more important, the combination of attributevalues that is the most preferred. From this information, the expectedmarket share of a given design can be estimated.
Multi-Product Resource Allocation
The most common resource allocation methods are:
• Percentage of sales
• Executive judgement
• All-you-can-afford
• Match competitors
• Last year based
Another method is called decision calculus. Managers are asked four questions:
What would sales be with:
1. no sales force
2. half the current effort
3. 50% greater effort
4. a saturation level of effort.
5. Marketing Plan This is a bare-bones marketing plan template. It contains headings for the basicessentials including situation analysis, market segmentation, alternatives,recommended strategy and its implications.
6. Market Segmentation An introduction to market segmentation and some bases for segmenting consumer
markets and business markets.7. The Marketing Mix
Diagram of the 4 P's of marketing (product, price, place, and promotion) and a list of some of the decisions to made for each.
8. The Product Life Cycle An overview of the product life cycle and marketing mix decisions for each stage.
9. The Product Diffusion Curve Shows the bell-shaped curve describing product diffusion and the different groups of consumers that can be characterized by the curve.
10.Positioning Al Ries and Jack Trout popularized the concept of product positioning. This is asummary of the ideas put forth in their marketing classic, Positioning: The Battle for
[23]

8/7/2019 anuj kumar final report
http://slidepdf.com/reader/full/anuj-kumar-final-report 24/95
Your Mind .
11.Marketing Warfare A summary of Al Ries and Jack Trout's marketing bestseller viewing marketing from amilitary perspective. Principles of offensive, defensive, flanking, and guerrilla marketingstrategies are presented.
12.Market Share Calculating market share, reasons to increase market share, drivers of market share,and why a firm might not want to increase market share.
13.Marketing Strategy Overview of marketing strategy issues, strategic decision making using marketingresearch results, multi-product resource allocation, product diffusion, and productmanagement strategies.
14.Marketing Research Marketing research, including problem definition, research design, data types andsources, sampling plan, data collection, data analysis, and reporting of the results.
15.Questionnaire Design Covers the questionnaire design process for the marketing survey, including questionstructure and wording, response types, question order, and the testing of thequestionnaire.
16.Conjoint Analysis A brief introduction to conjoint analysis, including how it can improve the accuracy of determining consumer preferences and the steps involved.
17.
Marketing Plan Outline
I. Executive Summary
A high-level summary of the marketing plan.
II. The Challenge
Brief description of product to be marketed and associated goals, such as salesfigures and strategic goals.
III. Situation Analysis
Company Analysis
• Goals
• Focus
• Culture
• Strengths
• Weaknesses
[24]

8/7/2019 anuj kumar final report
http://slidepdf.com/reader/full/anuj-kumar-final-report 25/95
• Market share
Customer Analysis
• Number
• Type
• Value drivers
• Decision process
• Concentration of customer base for particular products
Competitor Analysis
• Market position
• Strengths
• Weaknesses
• Market shares
Collaborators
• Subsidiaries, joint ventures, and distributors, etc.
Climate
Macro-environmental PEST analysis :
• Political and legal environment
• Economic environment
• Social and cultural environment
• Technological environment
SWOT Analysis
A SWOT analysis of the business environment can be performed by organizingthe environmental factors as follows:
• The firm's internal attributes can be classed as strengths and
weaknesses.• The external environment presents opportunities and threats.
IV. Market Segmentation
Present a description of the market segmentation as follows:
Segment 1
• Description
• Percent of sales
[25]

8/7/2019 anuj kumar final report
http://slidepdf.com/reader/full/anuj-kumar-final-report 26/95
• What they want
• How they use product
• Support requirements
• How to reach them
• Price sensitivity
Segment 2
V. Alternative Marketing Strategies
List and discuss the alternatives that were considered before arriving at therecommended strategy. Alternatives might include discontinuing a product, re-branding, positioning as a premium or value product, etc.
VI. Selected Marketing Strategy
Discuss why the strategy was selected, then the marketing mix decisions (4P's) of product, price, place (distribution), and promotion.
Product
The product decisions should consider the product's advantages and how theywill be leveraged. Product decisions should include:
• Brand name
• Quality
• Scope of product line
• Warranty
• Packaging
Price
Discuss pricing strategy, expected volume, and decisions for the followingpricing variables:
• List price
• Discounts
• Bundling
• Payment terms and financing options
[26]

8/7/2019 anuj kumar final report
http://slidepdf.com/reader/full/anuj-kumar-final-report 27/95
• Leasing options
Distribution (Place)
Decision variables include:
• Distribution channels, such as direct, retail, distributors & intermediates
• Motivating the channel - for example, distributor margins
• Criteria for evaluating distributors
• Locations
• Logistics, including transportation, warehousing, and order fulfilment
Promotion
• Advertising, including how much and which media.
• Public relations
• Promotional programs
• Budget; determine break-even point for any additional spending
• Projected results of the promotional programs
VII. Short & Long-Term Projections
The selected strategy's immediate effects, expected long-term results, and anyspecial actions required to achieve them. This section may include forecasts of revenues and expenses as well as the results of a break-even analysis.
VIII. Conclusion
Summarize all of the above.
Market Segmentation
The division of a market into different homogeneous groups of consumers isknown as market segmentation.
Rather than offer the same marketing mix to vastly different customers, marketsegmentation makes it possible for firms to tailor the marketing mix for specifictarget markets, thus better satisfying customer needs. Not all elements of themarketing mix are necessarily changed from one segment to the next. For example, in some cases only the promotional campaigns would differ.
A market segment should be:
• measurable
[27]

8/7/2019 anuj kumar final report
http://slidepdf.com/reader/full/anuj-kumar-final-report 28/95
• accessible by communication and distribution channels
• different in its response to a marketing mix
• durable (not changing too quickly)
• substantial enough to be profitable
A market can be segmented by various bases, and industrial markets aresegmented somewhat differently from consumer markets, as described below.
Consumer Market Segmentation
A basis for segmentation is a factor that varies among groups within a market,but that is consistent within groups. One can identify four primary bases onwhich to segment a consumer market:
• Geographic segmentation is based on regional variables such asregion, climate, population density, and population growth rate.
• Demographic segmentation is based on variables such as age,gender, ethnicity, education, occupation, income, and family status.
• Psychographic segmentation is based on variables such as values,attitudes, and lifestyle.
•
Behavioral segmentation is based on variables such as usage rateand patterns, price sensitivity, brand loyalty, and benefits sought.
The optimal bases on which to segment the market depend on the particular situation and are determined by marketing research, market trends, andmanagerial judgment.
Business Market Segmentation
While many of the consumer market segmentation bases can be applied tobusinesses and organizations, the different nature of business markets oftenleads to segmentation on the following bases:
• Geographic segmentation - based on regional variables such ascustomer concentration, regional industrial growth rate, and internationalmacroeconomic factors.
• Customer type - based on factors such as the size of the organization,its industry, position in the value chain, etc.
• Buyer behavior - based on factors such as loyalty to suppliers, usagepatterns, and order size.
[28]

8/7/2019 anuj kumar final report
http://slidepdf.com/reader/full/anuj-kumar-final-report 29/95
Profiling the Segments
The identified market segments are summarized by profiles, often given adescriptive name. From these profiles, the attractiveness of each segment canbe evaluated and a target market segment selected.
The Marketing Mix
(The 4 P's of Marketing)
The major marketing management decisions can be classified in one of thefollowing four categories:
• Product
• Price
• Place (distribution)
• Promotion
These variables are known as the marketing mix or the 4 P's of marketing.They are the variables that marketing managers can control in order to best
satisfy customers in the target market. The marketing mix is portrayed in thefollowing diagram:
The Marketing Mix
Product Place
TargetMarket
[29]

8/7/2019 anuj kumar final report
http://slidepdf.com/reader/full/anuj-kumar-final-report 30/95
Price Promotion
The firm attempts to generate a positive response in the target market byblending these four marketing mix variables in an optimal manner.
Product
The product is the physical product or service offered to the consumer. In thecase of physical products, it also refers to any services or conveniences thatare part of the offering.
Product decisions include aspects such as function, appearance, packaging,service, warranty, etc.
Price
Pricing decisions should take into account profit margins and the probablepricing response of competitors. Pricing includes not only the list price, but also
discounts, financing, and other options such as leasing.
Place
Place (or placement) decisions are those associated with channels of distribution that serve as the means for getting the product to the targetcustomers. The distribution system performs transactional, logistical, andfacilitating functions.
Distribution decisions include market coverage, channel member selection,logistics, and levels of service.
Promotion
Promotion decisions are those related to communicating and selling to potentialconsumers. Since these costs can be large in proportion to the product price, abreak-even analysis should be performed when making promotion decisions. Itis useful to know the value of a customer in order to determine whether additional customers are worth the cost of acquiring them.
Promotion decisions involve advertising, public relations, media types, etc.
Summary of Marketing Mix Decisions
[30]

8/7/2019 anuj kumar final report
http://slidepdf.com/reader/full/anuj-kumar-final-report 31/95
Product Price Place Promotion
Functionality
Appearance
Quality
Packaging
Brand
Warranty
Service/Support
List price
Discounts
Allowances
Financing
Leasing options
Channel members
Channel motivation
Market coverage
Locations
Logistics
Service levels
Advertising
Personal selling
Public relations
Message
Media
Budget
PositioningInformation Overload
Ries and Trout explain that while positioning begins with a product, the conceptreally is about positioning that product in the mind of the customer. Thisapproach is needed because consumers are bombarded with a continuousstream of advertising, with advertisers spending several hundred dollarsannually per consumer in the U.S. The consumer's mind reacts to this highvolume of advertising by accepting only what is consistent with prior knowledge
or experience.It is quite difficult to change a consumer's impression once it is formed.Consumers cope with information overload by oversimplifying and are likely toshut out anything inconsistent with their knowledge and experience. In an over-communicated environment, the advertiser should present a simplifiedmessage and make that message consistent with what the consumer alreadybelieves by focusing on the perceptions of the consumer rather than on thereality of the product.
Getting Into the Mind of the Consumer
The easiest way of getting into someone's mind is to be first. It is very easy toremember who is first, and much more difficult to remember who is second.Even if the second entrant offers a better product, the first mover has a largeadvantage that can make up for other shortcomings.
However, all is not lost for products that are not the first. By being the first toclaim a unique position in the mind the consumer, a firm effectively can cutthrough the noise level of other products. For example, Miller Lite was not thefirst light beer, but it was the first to be positioned as a light beer, complete witha name to support that position. Similarly, Lowenbrau was the most popular
[31]

8/7/2019 anuj kumar final report
http://slidepdf.com/reader/full/anuj-kumar-final-report 32/95
German beer sold in America, but Beck's Beer successfully carved a uniqueposition using the advertising,
"You've tasted the German beer that's the most popular in America. Now tastethe German beer that's the most popular in Germany."
Consumers rank brands in their minds. If a brand is not number one, then to besuccessful it somehow must relate itself to the number one brand. A campaignthat pretends that the market leader does not exist is likely to fail. Avis triedunsuccessfully for years to win customers, pretending that the number oneHertz did not exist. Finally, it began using the line,
"Avis in only No. 2 in rent-a-cars, so why go with us? We try harder." After launching the campaign, Avis quickly became profitable. Whether Avisactually tried harder was not particularly relevant to their success. Rather,consumers finally were able to relate Avis to Hertz, which was number one intheir minds.
Another example is that of the soft-drink 7-Up, which was No. 3 behind Cokeand Pepsi. By relating itself to Coke and Pepsi as the "Uncola", 7-Up was ableto establish itself in the mind of the consumer as a desirable alternative to thestandard colas.
When there is a clear market leader in the mind of the consumer, it can be
nearly impossible to displace the leader, especially in the short-term. On theother hand, a firm usually can find a way to position itself in relation to themarket leader so that it can increase its market share. It usually is a mistake,however, to challenge the leader head-on and try to displace it.
Positioning of a Leader
Historically, the top three brands in a product category occupy market share ina ratio of 4:2:1. That is, the number one brand has twice the market share of number two, which has twice the market share of number three. Ries and Troutargue that the success of a brand is not due to the high level of marketing
acumen of the company itself, but rather, it is due to the fact that the companywas first in the product category. They use the case of Xerox to make thispoint. Xerox was the first plain-paper copier and was able to sustain itsleadership position. However, time after time the company failed in other product categories in which it was not first.
Similarly, IBM failed when it tried to compete with Xerox in the copier market,and Coca-Cola failed in its effort to use Mr. Pibb to take on Dr. Pepper. Theseexamples support the point that the success of a brand usually is due to itsbeing first in the market rather than the marketing abilities of the company. The
[32]

8/7/2019 anuj kumar final report
http://slidepdf.com/reader/full/anuj-kumar-final-report 33/95
power of the company comes from the power of its brand, not the other wayaround.
With this point in mind, there are certain things that a market leader should doto maintain the leadership position. First, Ries and Trout emphasize what itshould not do, and that is boast about being number one. If a firm does so,then customers will think that the firm is insecure in its position if it mustreinforce it by saying so.
If a firm was the first to introduce a product, then the advertising campaignshould reinforce this fact. Coca-Cola's "the real thing" does just that, andimplies that other colas are just imitations.
Another strategy that a leader can follow to maintain its position is themultibrand strategy. This strategy is to introduce multiple brands rather thanchanging existing ones that hold leadership positions. It often is easier andcheaper to introduce a new brand rather than change the positioning of anexisting brand. Ries and Trout call this strategy a single-position strategybecause each brand occupies a single, unchanging position in the mind of theconsumer.
Finally, change is inevitable and a leader must be willing to embrace changerather than resist it. When new technology opens the possibility of a newmarket that may threaten the existing one, a successful firm should consider
entering the new market so that it will have the first-mover advantage in it. For example, in the past century the New York Central Railroad lost its leadershipas air travel became possible. The company might have been able to maintainits leadership position had it used its resources to form an airline division.
Sometimes it is necessary to adopt a broader name in order to adapt tochange. For example, Haloid changed its name to Haloid Xerox and later tosimply Xerox. This is a typical pattern of changing Name 1 to an expandedName 1 - Name 2 , and later to just Name 2 .
Positioning of a Follower
Second-place companies often are late because they have chosen to spendvaluable time improving their product before launching it. According to Ries andTrout, it is better to be first and establish leadership.
If a product is not going to be first, it then must find an unoccupied position inwhich it can be first. At a time when larger cars were popular, Volkswagenintroduced the Beetle with the slogan "Think small." Volkswagen was not thefirst small car, but they were the first to claim that position in the mind of theconsumer.
Other positions that firms successfully have claimed include:
[33]

8/7/2019 anuj kumar final report
http://slidepdf.com/reader/full/anuj-kumar-final-report 34/95
• age (Geritol)
• high price (Mobil 1 synthetic engine lubricant)
• gender (Virginia Slims)
• time of day (Nyquil night-time cold remedy)
• place of distribution (L'eggs in supermarkets)
• quantity (Schaefer - "the one beer to have when you're having more thanone.")
It most likely is a mistake to build a brand by trying to appeal to everyone.
There are too many brands that already have claimed a position and havebecome entrenched leaders in their positions. A product that seeks to beeverything to everyone will end up being nothing to everyone.
Market Share
Sales figures do not necessarily indicate how a firm is performing relative to itscompetitors. Rather, changes in sales simply may reflect changes in the marketsize or changes in economic conditions.
The firm's performance relative to competitors can be measured by the
proportion of the market that the firm is able to capture. This proportion isreferred to as the firm's market share and is calculated as follows:
Market Share = Firm's Sales / Total Market Sales
Sales may be determined on a value basis (sales price multiplied by volume) or on a unit basis (number of units shipped or number of customers served).
While the firm's own sales figures are readily available, total market sales aremore difficult to determine. Usually, this information is available from tradeassociations and market research firms.
Reasons to Increase Market ShareMarket share often is associated with profitability and thus many firms seek toincrease their sales relative to competitors. Here are some specific reasonsthat a firm may seek to increase its market share:
• Economies of scale - higher volume can be instrumental in developinga cost advantage.
• Sales growth in a stagnant industry - when the industry is notgrowing, the firm still can grow its sales by increasing its market share.
[34]

8/7/2019 anuj kumar final report
http://slidepdf.com/reader/full/anuj-kumar-final-report 35/95
• Reputation - market leaders have clout that they can use to their advantage.
• Increased bargaining power - a larger player has an advantage innegotiations with suppliers and channel members.
Ways to Increase Market Share
The market share of a product can be modeled as:
Share of Market = Share of Preference x Share of Voice x Share of Distribution
According to this model, there are three drivers of market share:
• Share of preference - can be increased through product, pricing, andpromotional changes.
• Share of voice - the firm's proportion of total promotional expenditures inthe market. Thus, share of voice can be increased by increasingadvertising expenditures.
• Share of distribution - can be increased through more intensivedistribution.
From these drivers we see that market share can be increased by changing the
variables of the marketing mix.
• Product - the product attributes can be changed to provide more valueto the customer, for example, by improving product quality.
• Price - if the price elasticity of demand is elastic (that is, > 1), adecrease in price will increase sales revenue. This tactic may notsucceed if competitors are willing and able to meet any price cuts.
• Distribution - add new distribution channels or increase the intensity of distribution in each channel.
• Promotion - increasing advertising expenditures can increase market
share, unless competitors respond with similar increases.
[35]

8/7/2019 anuj kumar final report
http://slidepdf.com/reader/full/anuj-kumar-final-report 36/95
RESEARCH METHODOLOGY
Search of knowledge. A careful investigation or enquiry. A systematic
effort to gain new knowledge. Those are called an “Research” Research is
[36]

8/7/2019 anuj kumar final report
http://slidepdf.com/reader/full/anuj-kumar-final-report 37/95
a movement of knowledge from known to unknown from the available
place to the required place.
According to Clifford wode, “Defining and re-defining problems
formulating the hypothesis or jusested solutions. Collecting, organizing
and evaluating data. Making detections and reaching conclusions to
determine whether fit the formulating the hypothesis” The Purpose of
research to find out solutions to the problem, which has not been
discovered by anybody.
3.1. Research methods:
Those methods which are used by the researcher during the course of studying are research problem are termed on research methods.
3.2. Research methodology:
The research methodology, not only the research methods are but also
consider the logic behind the methods. They are in the contest of our
research studied. And explain why we are using a particular method or
techniques and we are not using others.
Descriptive research design:
[37]

8/7/2019 anuj kumar final report
http://slidepdf.com/reader/full/anuj-kumar-final-report 38/95
In includes surveys, and facts finding enquires of different kinds. The
manor purpose of descriptive research is description of state of affairs on it
exists at present. The main character of this method is that the researcher
has no control threw over the variables. He can report what has happen or
what is happening.
Nature of data:
In this study secondary data are used.
Collection of data:
The data were collected from the respondents through the distribution of
questionnaire.
Area of the study:
This study covers Rudrapur city only.
Sample size:
The sample size of this study is 104.
Tools for analysis:
Along with the usual statistical tools such as tables, percentages, bar
charts, chi-squire test we sued for analyzing the data and arriving at the
conclusion.
[38]

8/7/2019 anuj kumar final report
http://slidepdf.com/reader/full/anuj-kumar-final-report 39/95
[39]
8/7/2019 anuj kumar final report
http://slidepdf.com/reader/full/anuj-kumar-final-report 40/95
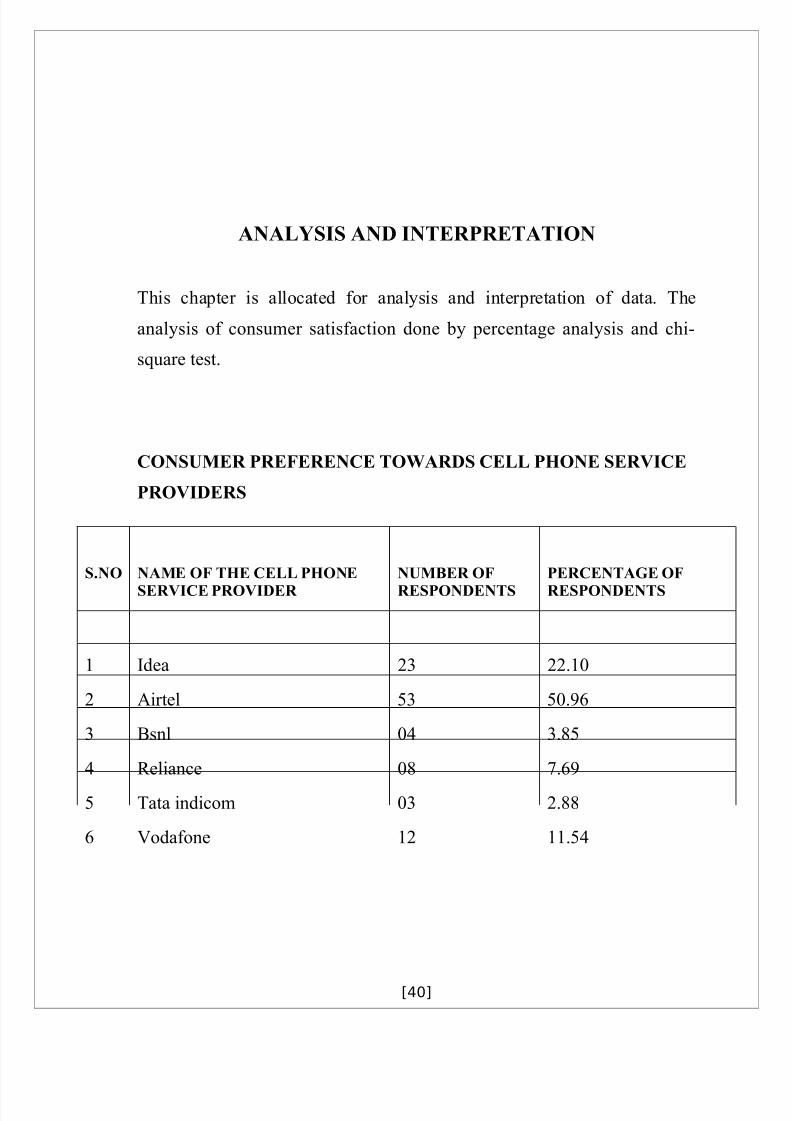
ANALYSIS AND INTERPRETATION
This chapter is allocated for analysis and interpretation of data. The
analysis of consumer satisfaction done by percentage analysis and chi-
square test.
CONSUMER PREFERENCE TOWARDS CELL PHONE SERVICE
PROVIDERS
S.NO NAME OF THE CELL PHONE
SERVICE PROVIDER
NUMBER OF
RESPONDENTS
PERCENTAGE OF
RESPONDENTS
1 Idea 23 22.10
2 Airtel 53 50.96
3 Bsnl 04 3.85
4 Reliance 08 7.69
5 Tata indicom 03 2.88
6 Vodafone 12 11.54
[40]

8/7/2019 anuj kumar final report
http://slidepdf.com/reader/full/anuj-kumar-final-report 41/95
INFERENCE:
Most of the respondents are using Airtel (50.96%) and 22.12% of
respondents are using Idea. Others are used different cell phone service
providers.
[41]

8/7/2019 anuj kumar final report
http://slidepdf.com/reader/full/anuj-kumar-final-report 42/95
CONSUMER’S PREFERENCE TOWARDS CELL PHONE SERVICE PROVIDERS ON THE BASIS OFAGE GROUP
UPTO 20 YEARS 21 - 30 YEARS 31 - 40 YEARS 41 AND ABOVE TOTALs.no.
NAME OF THECELL PHONESERVICEPROVIDER
NO. OFRESPONDENT
PERCENTEOFRESPONDT
NO. OFRESPONDT
PERCENTEOFRESPONDT
NO. OFRESPONDT
PERCENTGEOFRESPONDET
NO. OFRESPONDET
PERCENTAEOFRESPONDET
NO. OFRESPONDET
% OFRESPONDET
1 IDEA 5 20 12 18.75 4 80 2 20 23 22.11
2 AIRTEL 15 60 33 51.56 1 20 4 40 53 50.96
3 BSNL 1 4 2 3.13 0 0 1 10 4 3.84
4 RELIANCE 0 0 5 7.81 0 0 3 30 8 7.69
5TATAINDICOM 0 0 3 4.69 0 0 0 0 3 2.88
6 VODAFONE 4 16 9 12.5 0 0 0 0 13 12.5
[42]

8/7/2019 anuj kumar final report
http://slidepdf.com/reader/full/anuj-kumar-final-report 43/95
INFERENCE:Among respondents upto 20 years of age group, majority of them (i.e. 60%) are
using airtel folllowed by Idea users(20%). Consumers in the age group of 21 – 30
years 51% of respondents are mostly prefer airtel (ie 51%) and 18% of the
respondents are using Idea. 80% of customers are using Idea, who are in the age
group of 31 – 40 years. 41 and above – 40% of the respondents are using Airtel
and 30% of respondents are using Reliance.
COMPOSITION OF RESPONDENTS ON THE BASIS OF MARITAL
STATUS
S.NO MARITALSTATUS
NUMBER OFRESPONDENTS
PERCENTAGEOFRESPONDENTS
1 MARRIED 30 28.85
2 UNMARRIED 74 71.15
3 TOTAL 104 100
[43]

8/7/2019 anuj kumar final report
http://slidepdf.com/reader/full/anuj-kumar-final-report 44/95
INFERENCE:
The married respondents are using cell phones in 28.85%, but the unmarried
respondents are using cell phones in 71%.
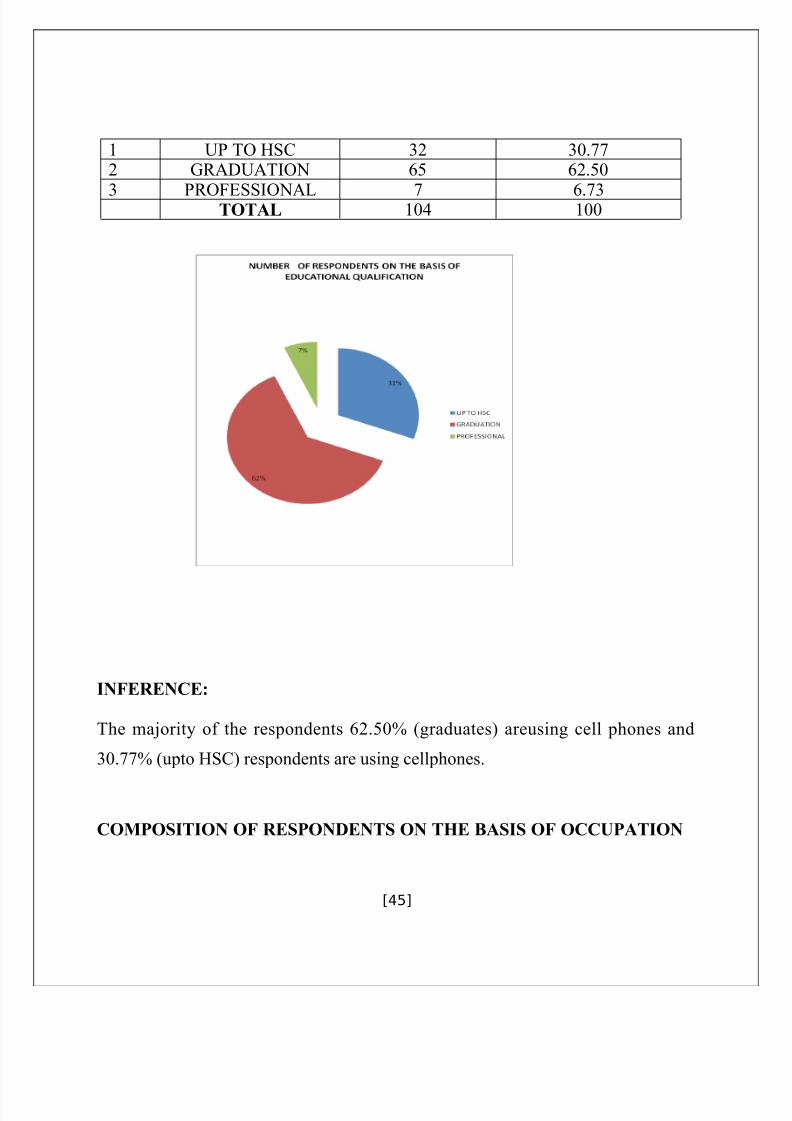
COMPOSITION OF RESPONDENTS ON THE BASIS OF EDUCATION
QUALIFICATION
S.NO EDUCATIONALQUALIFICATION
NUMBER OFRESPONDENTS
PERCENTAGE OFRESPONDENTS
[44]
8/7/2019 anuj kumar final report
http://slidepdf.com/reader/full/anuj-kumar-final-report 45/95
1 UP TO HSC 32 30.772 GRADUATION 65 62.50
3 PROFESSIONAL 7 6.73TOTAL 104 100
INFERENCE:
The majority of the respondents 62.50% (graduates) areusing cell phones and
30.77% (upto HSC) respondents are using cellphones.
COMPOSITION OF RESPONDENTS ON THE BASIS OF OCCUPATION
[45]
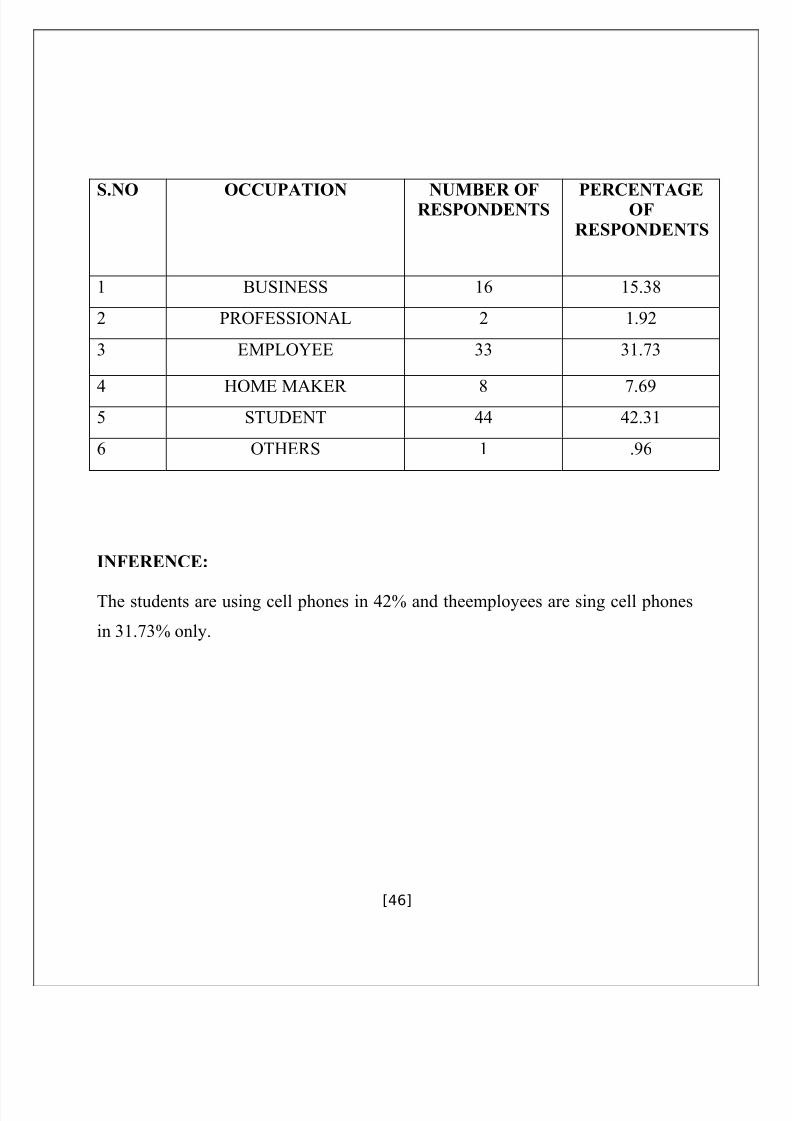
8/7/2019 anuj kumar final report
http://slidepdf.com/reader/full/anuj-kumar-final-report 46/95
S.NO OCCUPATION NUMBER OFRESPONDENTS PERCENTAGEOFRESPONDENTS
1 BUSINESS 16 15.38
2 PROFESSIONAL 2 1.92
3 EMPLOYEE 33 31.73
4 HOME MAKER 8 7.695 STUDENT 44 42.31
6 OTHERS 1 .96
INFERENCE:
The students are using cell phones in 42% and theemployees are sing cell phones
in 31.73% only.
[46]

8/7/2019 anuj kumar final report
http://slidepdf.com/reader/full/anuj-kumar-final-report 47/95
[47]

8/7/2019 anuj kumar final report
http://slidepdf.com/reader/full/anuj-kumar-final-report 48/95
[48]

8/7/2019 anuj kumar final report
http://slidepdf.com/reader/full/anuj-kumar-final-report 49/95
COMPOSITION OF RESPONDENTS ON THE BASIS OF FAMILYINCOME (PER MONTH)
S.NO FAMILYINCOME
NUMBER OFRESPONDENTS
PERCENTAGEOF
RESPONDENTS1 LESS THAN
Rs.5,00032 30.77
2 Rs.5,001 TO10,000
48 46.15
3 Rs.10,001 TO15,000
12 11.54
4 ABOVE 15,000 12 11.54
TOTAL 104 100
INFERENCE:
46% of respondents are get monthly income of Rs.5,000 – Rs.10,000, and 30% of
respondents are get monthly income as less than Rs.5,000.
[49]

8/7/2019 anuj kumar final report
http://slidepdf.com/reader/full/anuj-kumar-final-report 50/95
[50]

8/7/2019 anuj kumar final report
http://slidepdf.com/reader/full/anuj-kumar-final-report 51/95
[51]

8/7/2019 anuj kumar final report
http://slidepdf.com/reader/full/anuj-kumar-final-report 52/95
[52]

8/7/2019 anuj kumar final report
http://slidepdf.com/reader/full/anuj-kumar-final-report 53/95
COMPOSITION OF RESPONDENTS ON THE BASIS OF PURPOSE OF
PURCHASE OF THE CELL PHONES
S.NO PURPOSE NUMBER OFRESPONDENTS
PERCENTAGEOFRESPONDENTS
1 FOR BUSINESS 15 14.422 FOR PERSONAL 89 85.58
TOTAL 104 100
INFERENCE:
15% of respondents are using cell phones for their business, and 89% of
respondents are using cell phones for their personal usage.
CONSUMER’S PREFERENCE TOWARDS CELL PHONE SERVICE
PROVIDER ON THE BASIS OF SCHEME
Prepaid Post paid TotalS.No
SERVICEPROVIDERS
NO. OFRESPONDET
%OFRESPONDEN
T
NO. OFRESPONDT
S
% OFRESPONDE
NT
NO.OF
RESPONDENT
% OFRESPON
DENT
[53]

8/7/2019 anuj kumar final report
http://slidepdf.com/reader/full/anuj-kumar-final-report 54/95
1 IDEA 22 21.15 1 .97 23 22.12
2 AIRTEL 45 43.26 8 7.70 53 50.96
3 BSNL 2 1.96 2 1.92 4 3.85
4 RELIANCE 7 6.73 1 .97 8 7.69
5 TATAINDICOM
1 .97 2 1.92 3 2.88
6 VODAFONE 9 8.65 4 3.85 13 12.50
INFERENCE:
In prepaid, majority of the respondents are using Airtel (43.26%), 21.15% of the
respondents using idea, 1% of the respondents are only using Tata indicom. In post
paid, majority of the respondents 7.70% are using Airtel, and 0.97% of
respondents are using Reliance and Idea.
[54]

8/7/2019 anuj kumar final report
http://slidepdf.com/reader/full/anuj-kumar-final-report 55/95
[55]

8/7/2019 anuj kumar final report
http://slidepdf.com/reader/full/anuj-kumar-final-report 56/95
COMPOSITION OF RESPONDENTS ON THE BASIS OFUSEFULNESS OF CELL PHONES
S.NO USAGE NUMBER OFRESPONDENTS
PERCENTAGE OFRESPONDENTS
1 INCOMING 18 17.31
2 OUTGOING 2 1.92
3 BOTH 78 75
4 SMS 6 5.77
TOTAL 104 100
INFERENCE:
75% of the respondents are using cell phones for incoming and outgoing, but
5.77% of respondents are only using cell phones for SMS.
[56]

8/7/2019 anuj kumar final report
http://slidepdf.com/reader/full/anuj-kumar-final-report 57/95
[57]

8/7/2019 anuj kumar final report
http://slidepdf.com/reader/full/anuj-kumar-final-report 58/95
CONSUMER’S SATISFACTION LEVEL ON THE BASIS OF PRICE OF THE CELL PHONE
PROVIDERS
HIGHLY SATISFACTORY SATISFACTORY NON-SATISFACTORY TOTAL
S.NO
NAME OFTHE CELL
PHONESERVICE
PROVIDER
NO. OFRESPONDET
% OFRESPONDNT
NO. OFRESPONDE
NTS
% OFRESPONDENT
NO. OFRESPONDET
% OFRESPONDENTS
NO. OFRESPONDET
% OFRESPONDE
NT
1 IDEA 4 15.38 15 21.42 4 50.00 23 22.12
2 AIRTEL 18 69.23 35 50.00 0 00.00 53 50.96
3 BSNL 0 00.00 3 4.29 1 12.50 4 3.85
4 RELIANCE 0 00.00 7 10.00 1 12.50 8 7.69
5 TATAINDICOM
0 0.00 3 4.29 0 00.00 3 2.88
6 VODAFONE 4 15.38 7 10.00 2 25.00 13 12.50
Total 26 100 70 100 8 100 104 100
[58]

8/7/2019 anuj kumar final report
http://slidepdf.com/reader/full/anuj-kumar-final-report 59/95
INFERENCE:
69% of the resondnets are highly satisfied for the price of Airtel service provider
and 15 % of respondents are only highly satisfied for the price of idea and
Vodafone. 50% of the respondents are satisfied (average) for the price of the
[59]
8/7/2019 anuj kumar final report
http://slidepdf.com/reader/full/anuj-kumar-final-report 60/95
Airtel, and 4% of the respondents are satisfied (average) for the price of BSNL and
Tata indicom. 50% of respondents are dissatisfied for the price of the idea, and no
percentage of respondents for the price of Airtel and Tata indicom.
[60]
8/7/2019 anuj kumar final report
http://slidepdf.com/reader/full/anuj-kumar-final-report 61/95
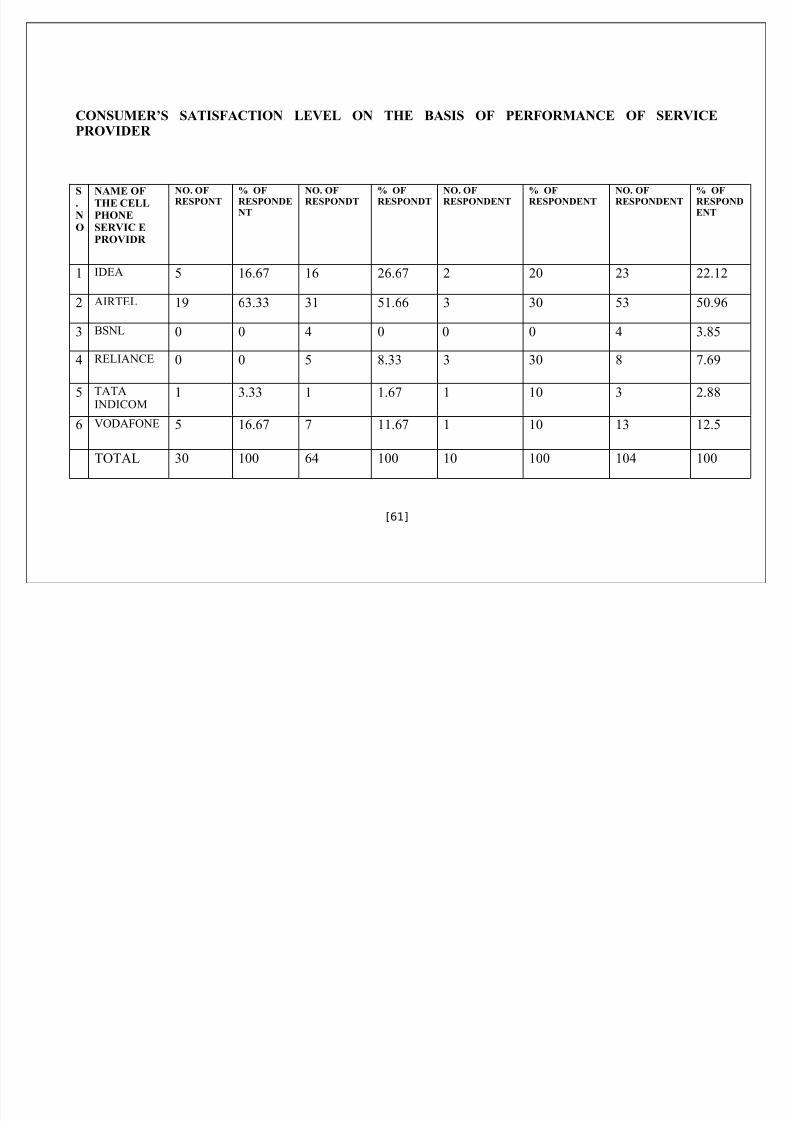
CONSUMER’S SATISFACTION LEVEL ON THE BASIS OF PERFORMANCE OF SERVICEPROVIDER
S.N
O
NAME OFTHE CELLPHONE
SERVIC EPROVIDR
NO. OFRESPONT % OFRESPONDENT
NO. OFRESPONDT % OFRESPONDT NO. OFRESPONDENT % OFRESPONDENT NO. OFRESPONDENT % OFRESPONDENT
1 IDEA 5 16.67 16 26.67 2 20 23 22.12
2 AIRTEL 19 63.33 31 51.66 3 30 53 50.96
3 BSNL 0 0 4 0 0 0 4 3.85
4 RELIANCE 0 0 5 8.33 3 30 8 7.69
5 TATAINDICOM
1 3.33 1 1.67 1 10 3 2.88
6 VODAFONE 5 16.67 7 11.67 1 10 13 12.5
TOTAL 30 100 64 100 10 100 104 100
[61]

8/7/2019 anuj kumar final report
http://slidepdf.com/reader/full/anuj-kumar-final-report 62/95
INFERENCE:
[62]

8/7/2019 anuj kumar final report
http://slidepdf.com/reader/full/anuj-kumar-final-report 63/95
63% of respondents are highly satisfied for the performance of Airtel service
Provider, and 3.33% of respondents are only highly satisfied for the performance
of Tata indicom. 51.66% of respondents are satisfied (average) for theperformance of Airtel service provider and 1.67 % of respondents only satisfied
(average) for the Tata indicom service. No% of respondents are dissatisfied in
BSNL service.
[63]

8/7/2019 anuj kumar final report
http://slidepdf.com/reader/full/anuj-kumar-final-report 64/95
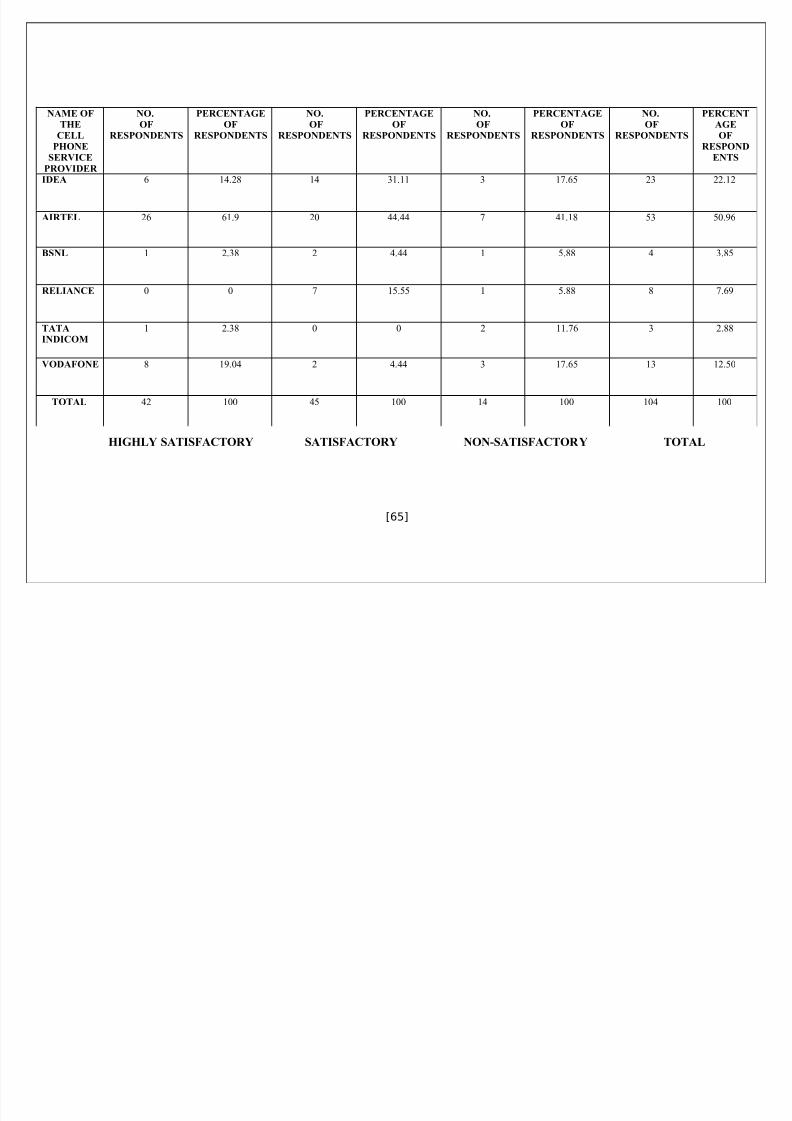
CONSUMER’S SATISFACTION LEVEL ON THE BASIS OF AFTER SALES SERVICE OF THE
SERVICE PROVIDER
[64]
8/7/2019 anuj kumar final report
http://slidepdf.com/reader/full/anuj-kumar-final-report 65/95
HIGHLY SATISFACTORY SATISFACTORY NON-SATISFACTORY TOTAL
[65]
NAME OFTHE
CELLPHONE
SERVICE
PROVIDER
NO.OF
RESPONDENTS
PERCENTAGEOF
RESPONDENTS
NO.OF
RESPONDENTS
PERCENTAGEOF
RESPONDENTS
NO.OF
RESPONDENTS
PERCENTAGEOF
RESPONDENTS
NO.OF
RESPONDENTS
PERCENTAGEOF
RESPONDENTS
IDEA 6 14.28 14 31.11 3 17.65 23 22.12
AIRTEL 26 61.9 20 44.44 7 41.18 53 50.96
BSNL 1 2.38 2 4.44 1 5.88 4 3.85
RELIANCE 0 0 7 15.55 1 5.88 8 7.69
TATAINDICOM
1 2.38 0 0 2 11.76 3 2.88
VODAFONE 8 19.04 2 4.44 3 17.65 13 12.50
TOTAL 42 100 45 100 14 100 104 100

8/7/2019 anuj kumar final report
http://slidepdf.com/reader/full/anuj-kumar-final-report 66/95
INFERENCE:
Majority of the respondents (61.90%) are highly satisfied about after sales service and
Airtel and no% of respondents are highly satisfied about the after sales service of Reliance. 44.44% and 31.11% of respondents are satisfied (average) about after sales
service of Airtel and Idea. 41% of respondents are dissatisfied about after sales service of
[66]

8/7/2019 anuj kumar final report
http://slidepdf.com/reader/full/anuj-kumar-final-report 67/95
Airtel and 5.8% of respondents are only dissatisfied about the after sales service of BSNL
and Reliance.
[67]
8/7/2019 anuj kumar final report
http://slidepdf.com/reader/full/anuj-kumar-final-report 68/95
CONSUMER’S SATISFACTION LEVEL ON THE BASIS OF SCHEMES AT THE TIME OF PURCHASING
THE PARTICULAR CELL PHONE SERVICE PROVIDER
[68]

8/7/2019 anuj kumar final report
http://slidepdf.com/reader/full/anuj-kumar-final-report 69/95
HIGHLY SATISFACTORY SATISFACTORY NON-SATISFACTORY TOTAL
[69]
NAME OF
THECELL PHONE
SERVICE
PROVIDER
NO.
OFRESPONDENT
S
PERCENTAGE
OFRESPONDENT
S
NO.
OFRESPONDENT
S
PERCENTAGE
OFRESPONDENT
S
NO.
OFRESPONDENT
S
PERCENTAGE
OFRESPONDENT
S
NO.
OFRESPONDENT
S
PERCENTAGE
OFRESPONDENT
S
IDEA 8 26.44 13 20.63 2 18.18 23 22.12
AIRTEL 16 53.33 33 52.38 4 36.36 53 50.96
BSNL 0 0 4 6.35 0 0 4 3.85
RELIANCE 2 3.33 3 4.76 4 36.36 8 7.69
TATAINDICOM
0 0 2 3.17 1 9.09 3 2.88
VODAFONE
4 16.67 8 12.7 0 0 13 12.50
TOTAL 30 100 63 100 11 100 104 100

8/7/2019 anuj kumar final report
http://slidepdf.com/reader/full/anuj-kumar-final-report 70/95
INFERENCE:
53.33% of respondents are highly satisfied about the schemes at the time of purchasing the Airtel and no% of respondents are highly satisfied about the schemesat the time of purchasing the BSNL and Tata indicom. 52.38% of the respondents aresatisfied (average) about the schemes of the time of purchasing Airtel. And 3% of therespondents are only satisfied (average) about the schemes at the time of purchasing
[70]
8/7/2019 anuj kumar final report
http://slidepdf.com/reader/full/anuj-kumar-final-report 71/95
Tata indicom. No% of respondents are dissatisfied about the schemes at the time of purchasing of BSNL and Vodafone and 36% of respondents are dissatisfied at the
time of purchasing the Airtel.
[71]
8/7/2019 anuj kumar final report
http://slidepdf.com/reader/full/anuj-kumar-final-report 72/95
CONSUMER’S SATISFACTION LEVEL THE BASIS OF PERIODICAL OFFERS PROVIDED BY THE
SERVICE PROVIDERS
[72]

8/7/2019 anuj kumar final report
http://slidepdf.com/reader/full/anuj-kumar-final-report 73/95
HIGHLY SATISFACTORY SATISFACTORY NON-SATISFACTORY TOTAL
[73]
NAME OF
THECELL PHONE
SERVICE
PROVIDER
NO.
OFRESPONDENT
S
PERCENTAGE
OFRESPONDENT
S
NO.
OFRESPONDENT
S
PERCENTAGE
OFRESPONDENT
S
NO.
OFRESPONDENT
S
PERCENTAGE
OFRESPONDENT
S
NO.
OFRESPONDENT
S
PERCENTAGE
OFRESPONDENT
S
IDEA 7 25.00 12 26.67 4 12.9 23 22.12
AIRTEL 14 50.00 25 55.56 14 45.16 53 50.96
BSNL 3 10.71 0 0 1 3.23 4 3.85
RELIANCE 2 7.14 3 6.67 3 9.68 8 7.69
TATAINDICOM
0 0.00 1 2.22 2 6.45 3 2.88
VODAFONE
3 10.34 3 6.67 7 22.58 13 12.50
TOTAL 29 100 44 100 31 100 104 100

8/7/2019 anuj kumar final report
http://slidepdf.com/reader/full/anuj-kumar-final-report 74/95
INFERENCE:
On the basis of periodical offers 50% of Airtel respondents are highly satisfied, andno percentage of respondents are highly satisfied in Tata indicom. 55% of therespondents are satisfied (average) of the Airtel’s periodical offers. 45% of the
[74]
8/7/2019 anuj kumar final report
http://slidepdf.com/reader/full/anuj-kumar-final-report 75/95
respondents are dissatisfied of the Airtel’s periodical offers and 3% of respondents areonly dissatisfied about the BSNL’s periodical offers.
[75]
8/7/2019 anuj kumar final report
http://slidepdf.com/reader/full/anuj-kumar-final-report 76/95
CONSUMER’S SATISFACTION LEVEL ON THE BASIS OF OUTGOING CALL CHARGES OF SERVICE
PROVIDERS
[76]

8/7/2019 anuj kumar final report
http://slidepdf.com/reader/full/anuj-kumar-final-report 77/95
HIGHLY SATISFACTORY SATISFACTORY NON-SATISFACTORY TOTAL
[77]
NAME OF
THECELL PHONE
SERVICE
PROVIDER
NO.
OFRESPONDENT
S
PERCENTAGE
OFRESPONDENT
S
NO.
OFRESPONDENT
S
PERCENTAGE
OFRESPONDENT
S
NO.
OFRESPONDENT
S
PERCENTAGE
OFRESPONDENT
S
NO.
OFRESPONDENT
S
PERCENTAGE
OFRESPONDENT
S
IDEA 8 25.81 9 20 6 21.43 23 22.12
AIRTEL 15 48.39 27 60 11 39.29 53 50.96
BSNL 1 3.23 1 2.22 2 7.14 4 3.85
RELIANCE 2 6.45 2 4.44 4 14.29 8 7.69
TATAINDICOM
0 0 1 2.22 2 7.14 3 2.88
VODAFONE
5 16.12 5 11.11 3 10.71 13 12.5
TOTAL 31 100 45 100 28 100 104 100

8/7/2019 anuj kumar final report
http://slidepdf.com/reader/full/anuj-kumar-final-report 78/95
[78]

8/7/2019 anuj kumar final report
http://slidepdf.com/reader/full/anuj-kumar-final-report 79/95
INFERENCE:
On the basis of outging call charges, 48% of Airtel respondents are highly satisfied
and no% of respondents are satisfied for the outgoing call charges and Tata indicom.
60% of respondents are satisfied (average) about the outgoing call charges of airtel
and 2% of respondents only satisfied (average) in BSNL and Tata indicom’s outgoing
call charges. 39.2% of respondents are dissatisfied about the outgoing call charges of
[79]
8/7/2019 anuj kumar final report
http://slidepdf.com/reader/full/anuj-kumar-final-report 80/95
Airtel, 7% of the respondents are only dissatisfied about the outgoing call charges of
BSNL and Tata indicom.
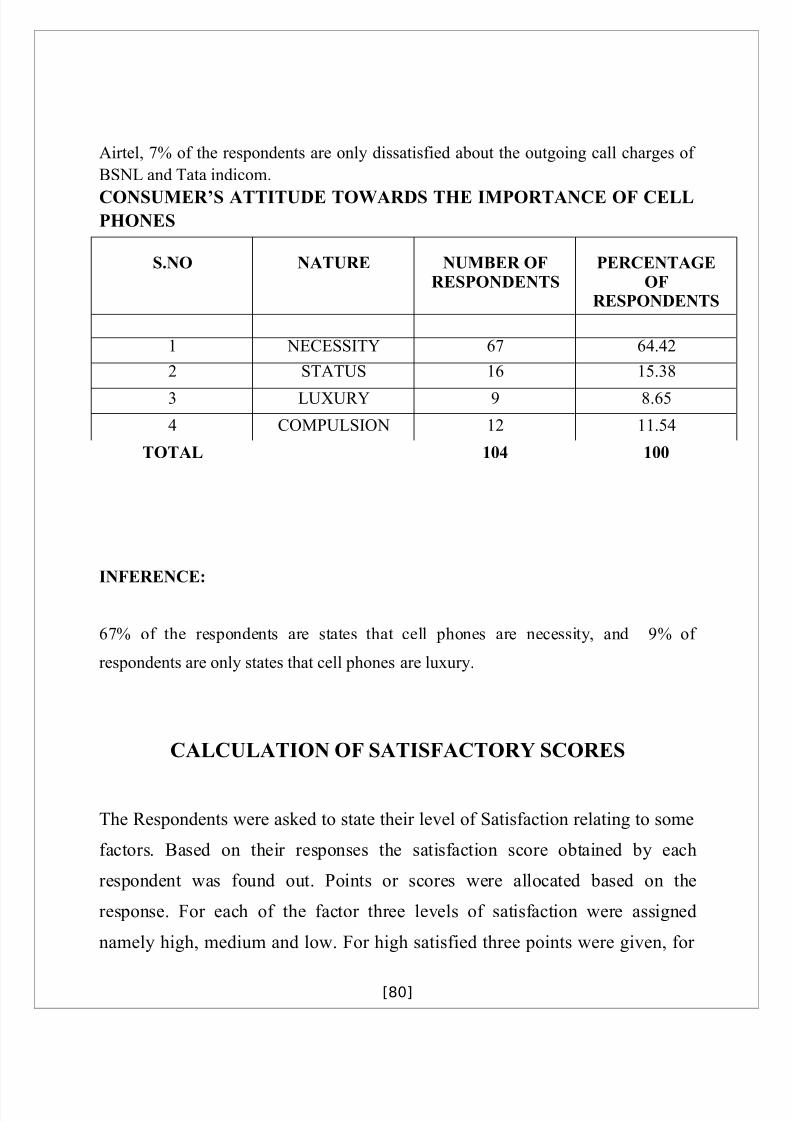
CONSUMER’S ATTITUDE TOWARDS THE IMPORTANCE OF CELLPHONES
S.NO NATURE NUMBER OFRESPONDENTS
PERCENTAGEOF
RESPONDENTS
1 NECESSITY 67 64.42
2 STATUS 16 15.38
3 LUXURY 9 8.65
4 COMPULSION 12 11.54
TOTAL 104 100
INFERENCE:
67% of the respondents are states that cell phones are necessity, and 9% of
respondents are only states that cell phones are luxury.
CALCULATION OF SATISFACTORY SCORES
The Respondents were asked to state their level of Satisfaction relating to some
factors. Based on their responses the satisfaction score obtained by each
respondent was found out. Points or scores were allocated based on the
response. For each of the factor three levels of satisfaction were assigned
namely high, medium and low. For high satisfied three points were given, for
[80]

8/7/2019 anuj kumar final report
http://slidepdf.com/reader/full/anuj-kumar-final-report 81/95
satisfied two and for not satisfied one point was given. The total scores secured
by each respondent was thus arrived at. All the hundred respondents were
classified based on their level of satisfaction. Those who have obtained up to 20
points were classified under low satisfaction category, Respondents with 21 –
30 points were classified under medium satisfaction category and those with
more than 30 points were classified under high satisfaction category.
NUMBER OF RESPONDENTS AND LEVEL OFSATISFACTION
LEVEL OFSATISFACTION
NO. OFRESPONDENTS
HIGH SATISFACTION 33
MEDIUM SATISFACTION 50
LOW SATISFACTION 17
TOTAL 100
[81]

8/7/2019 anuj kumar final report
http://slidepdf.com/reader/full/anuj-kumar-final-report 82/95
FINDINGS
This chapter is allocated to express the findings in this study. Statistical tools
are applied to analyze the data. It includes the result of each and every tables,
charts.
[82]

8/7/2019 anuj kumar final report
http://slidepdf.com/reader/full/anuj-kumar-final-report 83/95
FINDINGS FROM PERCENTAGE ANALYSIS:
On the basis of consumer preference, majority of the peoples are
preferred Airtel.
On the basis of age group, most of the respondents (60%), are using
Airtel, who are in the category of upto 20 years.
®On the basis of marital status mostly unmarried respondents are using
cell phones than married respondents.
On the basis of educational qualification, most of the graduates are using
cell phones.
On the basis of occupation, the students are only used cell phones in more
level.
On the basis of family income, 30% of the respondents are using cell
phones, who are all get family income of less than Rs.5,000.
Majority of the peoples are buy the cell phones by influencing their family members.
3.8% of respondents are only influenced by advertisements.
Majority of the peoples are using cell phones for personal usage.
Majority of the peoples are using prepaid scheme.
Majority of the peoples are using cell phones for both incoming and
outgoing.
Less than 20% of the peoples are only less awarred about services
provided by the services provider.
Majority of the peoples are seeking brand image, for their service
provider.
Majority of the respondents are highly satisfied about the price of Airtel.
[83]

8/7/2019 anuj kumar final report
http://slidepdf.com/reader/full/anuj-kumar-final-report 84/95
No peoples are highly satisfied about the price of BSNL, Reliance, Tata
indicom.
No peoples are dissatisfied about the price of the Airtel.
On the basis of performance, no peoples are highly satisfied in BSNL,
Reliance.
No peoples are dissatisfied about the performance of BSNL serviceprovider.
On the basis of after sales service, the majority of the respondents arehighly satisfied in Airtel.
No peoples are highly satisfied about the after sales service of BSNL.
Minority (5%) people are only dissatisfied about the after sales services
of BSNL and Reliance.
On the basis of schemes at the time of the service, 55% of peoples are
highly satisfied.
On the basis of periodical offers, majority of the peoples highly satisfied
in Airtel.
On the basis of outgoing call charges, majority of people are highly
satisfied in Airtel.
No people are highly satisfied about the outgoing call charges of Tata
indicome.
On the basis of consumer’s attitude, majority of the people are states that
cell phones are necessity to all.
[84]

8/7/2019 anuj kumar final report
http://slidepdf.com/reader/full/anuj-kumar-final-report 85/95
SUGGESTIONS
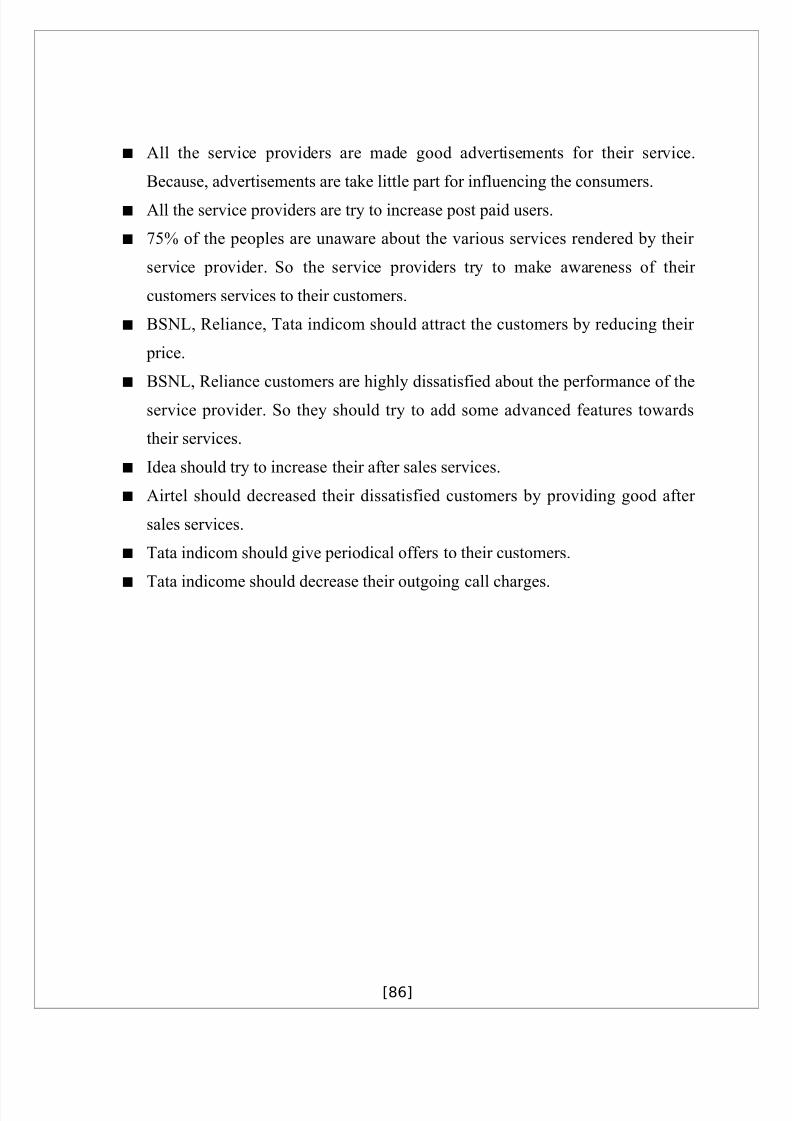
BSNL, Tata indicom should try to expand their customer’s network.
Reliance, and Tata indicom should try to attract the young peoples. (upto 20
years)
Airtel should try to attract old peoples also.
[85]
8/7/2019 anuj kumar final report
http://slidepdf.com/reader/full/anuj-kumar-final-report 86/95
All the service providers are made good advertisements for their service.
Because, advertisements are take little part for influencing the consumers.
All the service providers are try to increase post paid users.
75% of the peoples are unaware about the various services rendered by their
service provider. So the service providers try to make awareness of their
customers services to their customers.
BSNL, Reliance, Tata indicom should attract the customers by reducing their
price.
BSNL, Reliance customers are highly dissatisfied about the performance of the
service provider. So they should try to add some advanced features towards
their services.
Idea should try to increase their after sales services.
Airtel should decreased their dissatisfied customers by providing good after
sales services.
Tata indicom should give periodical offers to their customers.
Tata indicome should decrease their outgoing call charges.
[86]

8/7/2019 anuj kumar final report
http://slidepdf.com/reader/full/anuj-kumar-final-report 87/95
LIMITATIONS OF THE STUDY
[87]

8/7/2019 anuj kumar final report
http://slidepdf.com/reader/full/anuj-kumar-final-report 88/95
Though the detailed investigation is made in the present study, uit has got the
following limitations.
1. This study is restricted only to the Coimbatore city. So, the results may not be
applicable to other areas.
2. This study is based on the prevailing customer’s satisfaction. But the
customer’s satisfaction may change according to time, fashion, technology,
development, etc.
[88]
8/7/2019 anuj kumar final report
http://slidepdf.com/reader/full/anuj-kumar-final-report 89/95
CONCLUSION
[89]

8/7/2019 anuj kumar final report
http://slidepdf.com/reader/full/anuj-kumar-final-report 90/95
This is an information era significance of information cannot be over emphasized.
This study attempts to find out the satisfaction of consumer regarding cell phone
service providers. This decade, most of the peoples using cell phones. So, service
providers are increasing in more level. So service provider are should over come
another one’s competition. So, it leads to adding new features, schemes, periodical
offers to their service. So, the consumers get maximum benefit from their service
provider.
Now-a-days, cell phones are very necessity to all. Because, it is give safety to the men
and women also. And no person are feel cell phones are luxury one. So most of the
persons are also should preferred these cell phones to their children.
[90]

8/7/2019 anuj kumar final report
http://slidepdf.com/reader/full/anuj-kumar-final-report 91/95
BIBLIOGRAPHY
[91]

8/7/2019 anuj kumar final report
http://slidepdf.com/reader/full/anuj-kumar-final-report 92/95
BOOKS:
MARKETING MANAGEMENT - V.S. Ramaswamy, S.Namakumari
RESEARCH METHODOLOGY - C.R.Kothari
OPERATION RESEARCH – Vittal
INTERNET SOURCE:
www.mrvfonv.com
www.scribc.comwww.managementparadise.com
[92]

8/7/2019 anuj kumar final report
http://slidepdf.com/reader/full/anuj-kumar-final-report 93/95
“A STUDY OF CONSUMER’S PREFERENCE AND SATISFACTIONTOWARDS VARIOUS CELL PHONE SERVICE PROVIDES”
QUESTIONNAIRE
1. Name :
2. Sex : a. Male b. Female
3. Age : a. Up to 20 yrs b.21-30 yrs
4. Marital Status : a. Married b. Unmarried
5. Educational Qualification
a.Up to Hs b. Graduation c. Professional
d. Others _____________________________________(Pls Specify)
6. Occupation :
a. Business b. Professional c. Employee
d. Home maker e. Student f. Others
7. Family income (P/m) :
a. Less than Rs.5, 000/- b. Rs. 5,000/- to 10,000/-
c. Rs. 10,000/- to 15,000/- d. Above Rs. 15, 000/-
8. Which cell phone (Service Provider) do you possess ?
a.Idea b. Airtel c. BSNL d. Reliance
e. TATA Indicom f. Vodafone g. Others
9. Who influenced you to by the particular cell phone service
provider ?
a. Family Member b. Neighbours c. Relations
d. Friends e. Advertisement f. Dealers g. Others
10. Why do you buy the cell phones ?
a. For business b. For personal
11. Which type of scheme is most preferable by you ?
a. Period b. Postpaid
[93]

8/7/2019 anuj kumar final report
http://slidepdf.com/reader/full/anuj-kumar-final-report 94/95
12. If you have postpaid / prepaid connection mention scheme Name &
Monthly rental charges ?
13. Are you used Cell Phone (Service Provider) mainly for
a. Incoming b. Outgoing c. Both d. SMS Messaging
14. Are you aware of the following details relating in your
connection ?
(Pre / Postpaid connection)
S. No Aware Neutral Unaware
a. Scheme
b. Balance of Talk charges
c. Periodical offers
d. Call waiting & Call
Diverting option
e. Modes of payment
15. Are you influenced by the following factors relating in your connection ?
S. No Aware Neutral Unaware
a. Monthly rental charges
b. Charges for cell phones
to land lines
c. Signal of tower Networking
d. Cost of schemee. Incoming (in days)
f. Number of outgoings calls
g. Outgoings call charges
16. What factor influenced you to decide your Cell Phones service ?
a. Deposit amount d. Credit facility for your connection
[94]

8/7/2019 anuj kumar final report
http://slidepdf.com/reader/full/anuj-kumar-final-report 95/95
b. Brand Image e. Customer care service
c. Availability f. Service charges
17. Satisfaction about the particular cell phone service provider ?
Highly Satisfacotry Satisfactory NonSatisfacotry
PricePerformanceCapacityAfter sale serviceEasy processschemesVarious facilitiesPeriodical offer Mode of paymentOutgoing call
charges
18. Do you face any difficulty in your cell phone connection ?
a. Yes b. No
19. If yes, please point out the problem ?
a. Coverage b. Service c. Clarity
d. Network busy e. Others
20. You consider mobile as a
N i b S L


![· 2020. 6. 6. · ANUJ KANDOI Total Central Government]State Government s Total Financial ... ANUJ KANODI HUF SAROJ BALA RITIKA KANDOI KAVITHA AGARWAL PRAVEEN KUMAR AGARWAL PAN](https://img.pdfslide.us/doc/110x75/5fbce0e3e7170f4597670cc6/2020-6-6-anuj-kandoi-total-central-governmentstate-government-s-total-financial.jpg)