Embed Size (px)
Citation preview
IMPLEMENTATION OF AN INTERACTIVE DATABASE INTERFACE UTILIZING HTML, PHP, JAVASCRIPT, AND MYSQL IN SUPPORT OF WATER QUALITY ASSESSMENTS IN THE NORTHEASTERN NORTH CAROLINA PASQUOTANK WATERSHED
Antonio Guion, Kathryne Burton, Hagen Hodgkins, Derek Morris Jr., 2015 Database Team

ABSTRACT
The Center of Excellence in Remote Sensing Education and Research (CERSER) has implemented three research projects during the summer Research Experience for Undergraduates (REU) program gathering water quality data for local waterways. The data has been compiled manually utilizing pen and paper and then entered into a spreadsheet. With the spread of electronic devices capable of interacting with databases, the development of an electronic method of entering and manipulating the water quality data was pursued during this project.
This project focused on the development of an interactive database to gather, display, and analyze data collected from local waterways. The database and entry form were built in MySQL on a PHP server allowing participants to enter data from anywhere Internet access is available. This project then researched applying this data to the Google Maps site to provide labeling and information to users. The NIA server at http://nia.ecsu.edu is used to host the application for download and for storage of the databases.
This project was built on water quality data gathered by the Summer Research Experience for Undergraduate teams during the summers of 2014, 2013, and 2011.
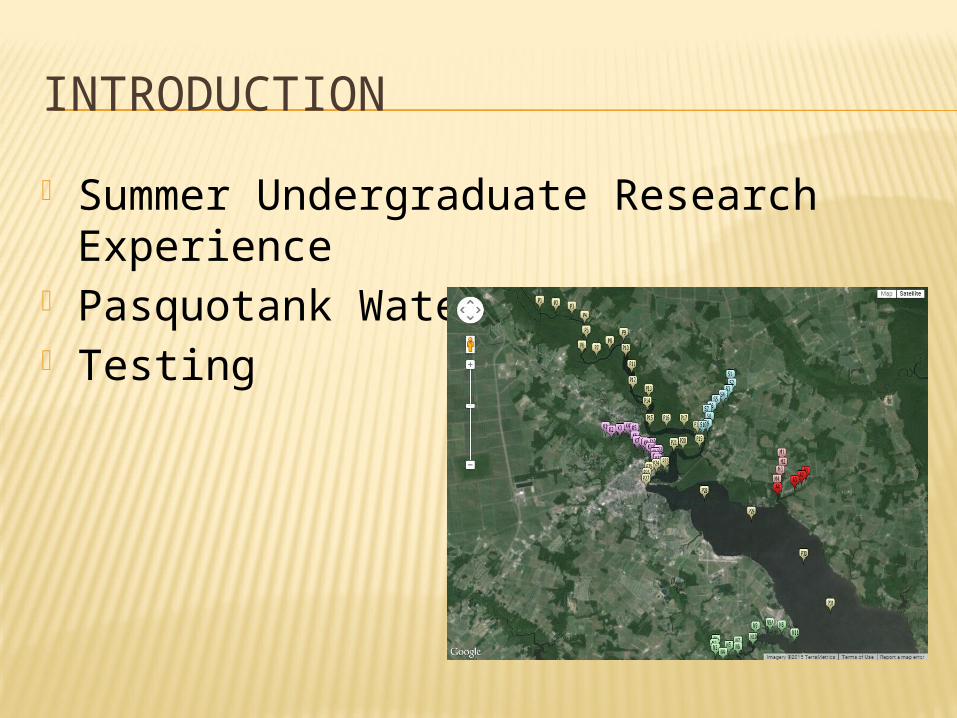
INTRODUCTION
Summer Undergraduate Research Experience
Pasquotank Watershed Testing
GOALS
Combine Spreadsheets Create Database Create Data Show, Modification, Entry,
Delete pages Create data visualization page
SOFTWARE/LANGUAGES
HTML Google Maps phpMyAdmin Dreamweaver
SOFTWARE/LANGUAGES
PHP MySQL XML JavaScript
METHODOLOGY
Combine Spreadsheets Create Database Create Data Pages Create Visualization of Data
COMBINE SPREADSHEETS
Standardize Spreadsheets Turbidity Units of Measurement Wind Direction
Latitude/Longitude Symbols File Combination
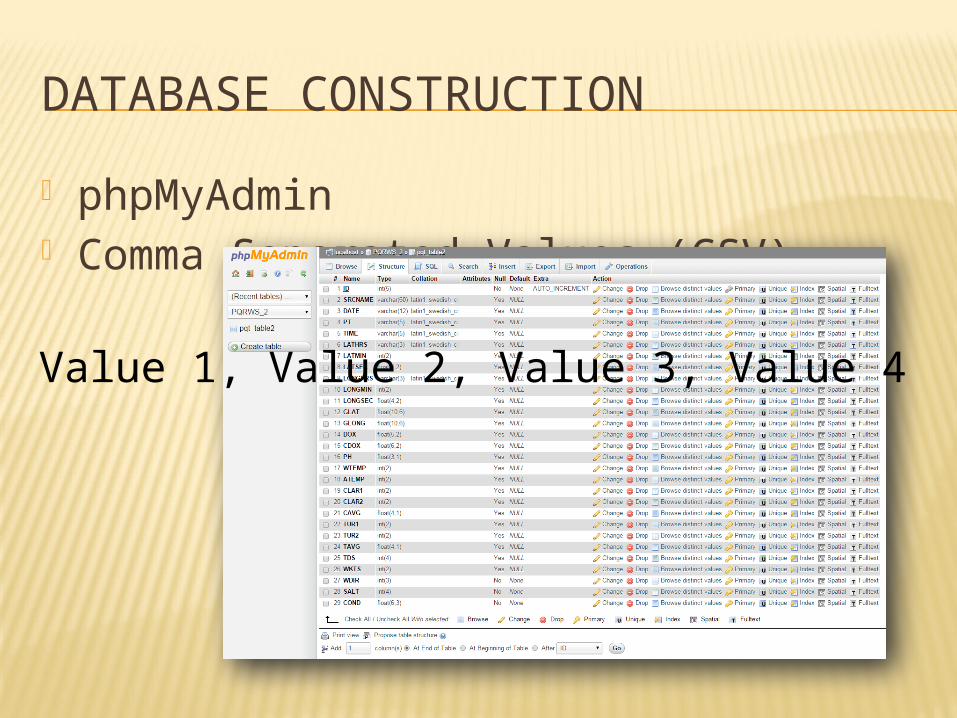
DATABASE CONSTRUCTION
phpMyAdmin Comma Separated Values (CSV)
Value 1, Value 2, Value 3, Value 4
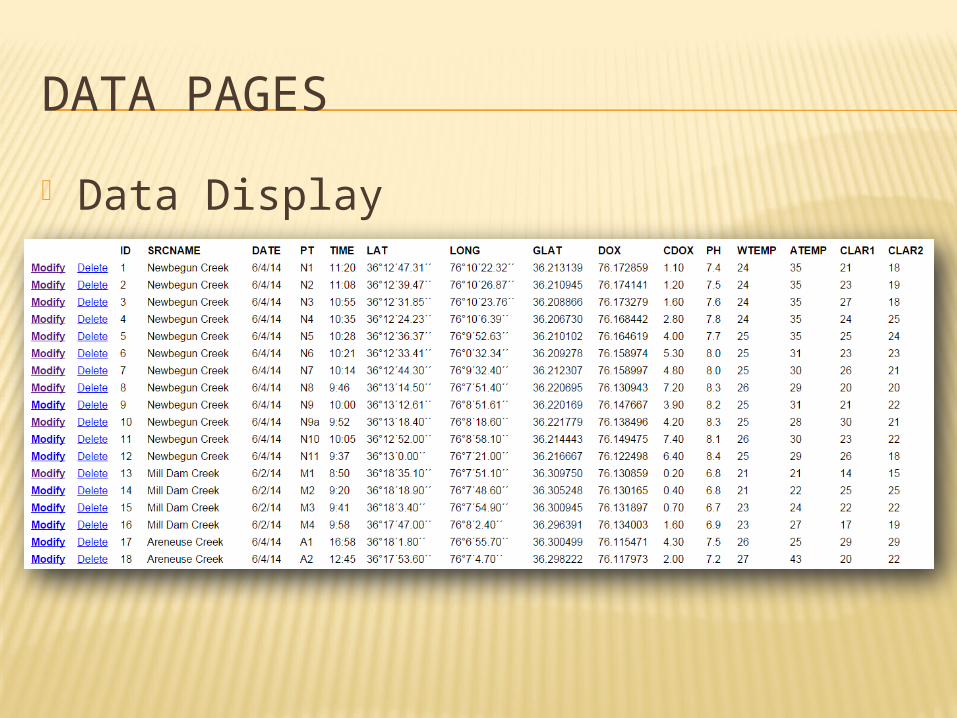
DATA PAGES
Data Display
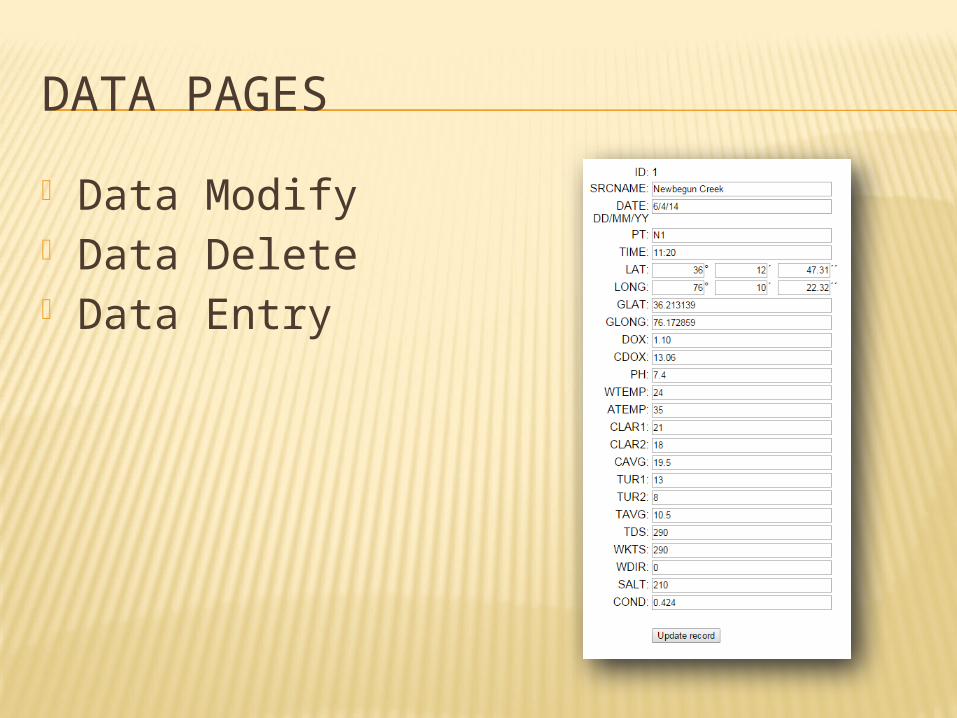
DATA PAGES
Data Modify Data Delete Data Entry
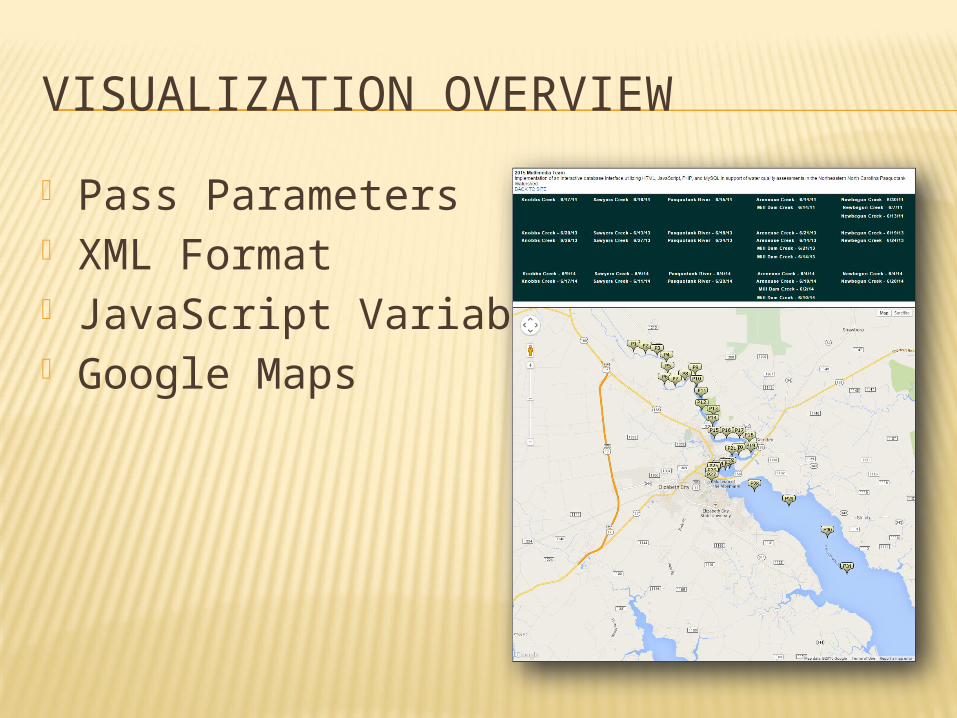
VISUALIZATION OVERVIEW
Pass Parameters XML Format JavaScript Variables Google Maps
SELECT * FROM pqt_table2 WHERE DATE=%s AND SRCNAME=%s ORDER BY 'ID' ASC
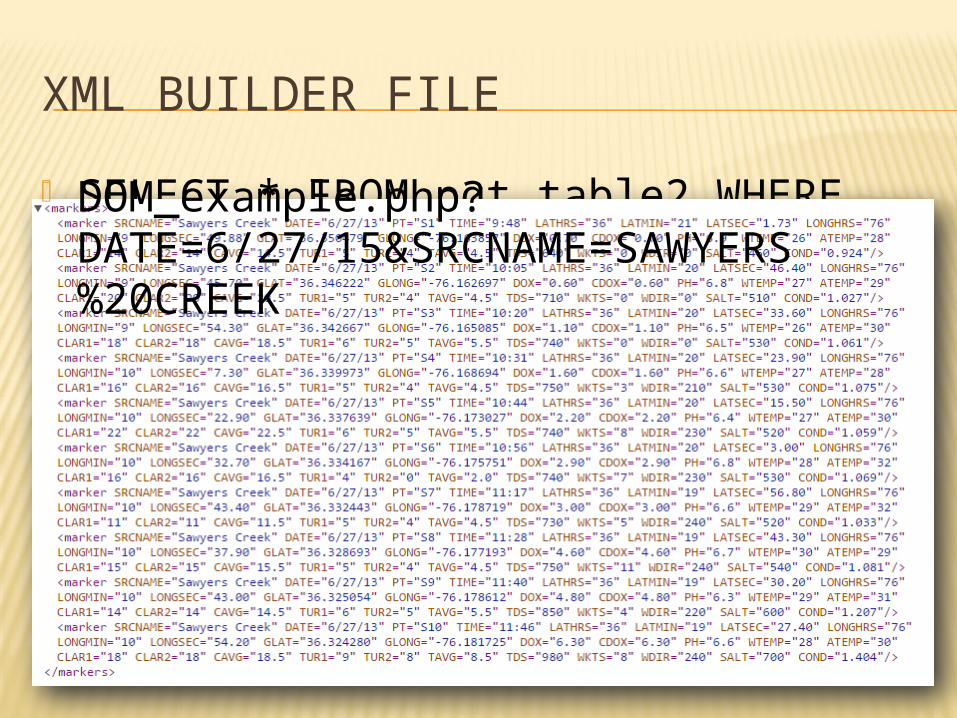
XML BUILDER FILE
DOM_example.php?DATE=6/27/15&SRCNAME=SAWYERS%20CREEK
GOOGLE MAPS DISPLAY
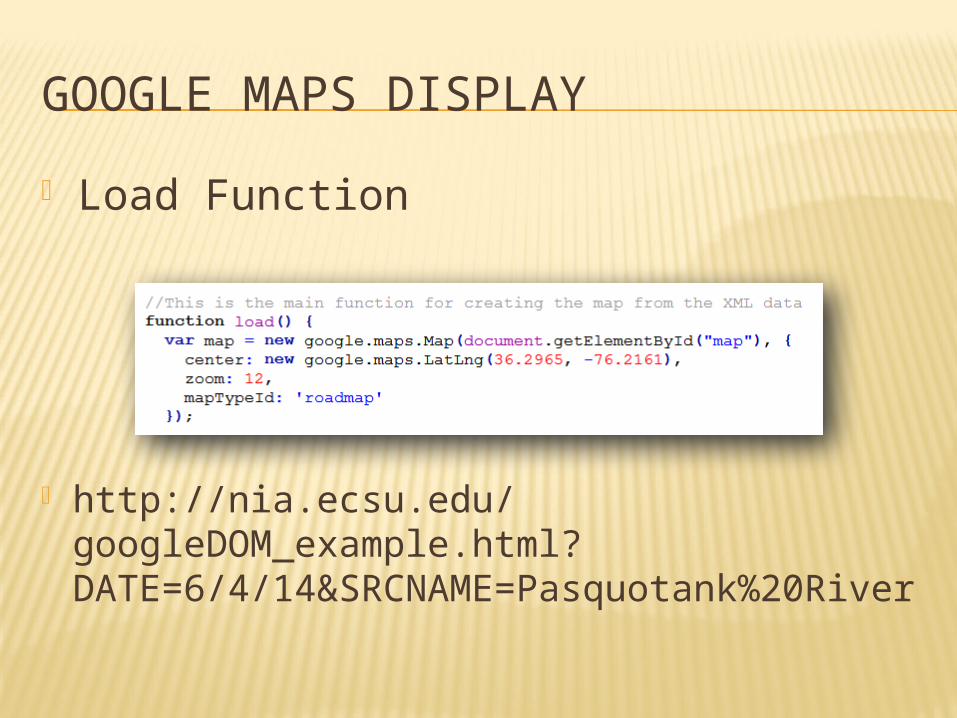
Load Function
http://nia.ecsu.edu/googleDOM_example.html?DATE=6/4/14&SRCNAME=Pasquotank%20River
GOOGLE MAPS DISPLAY
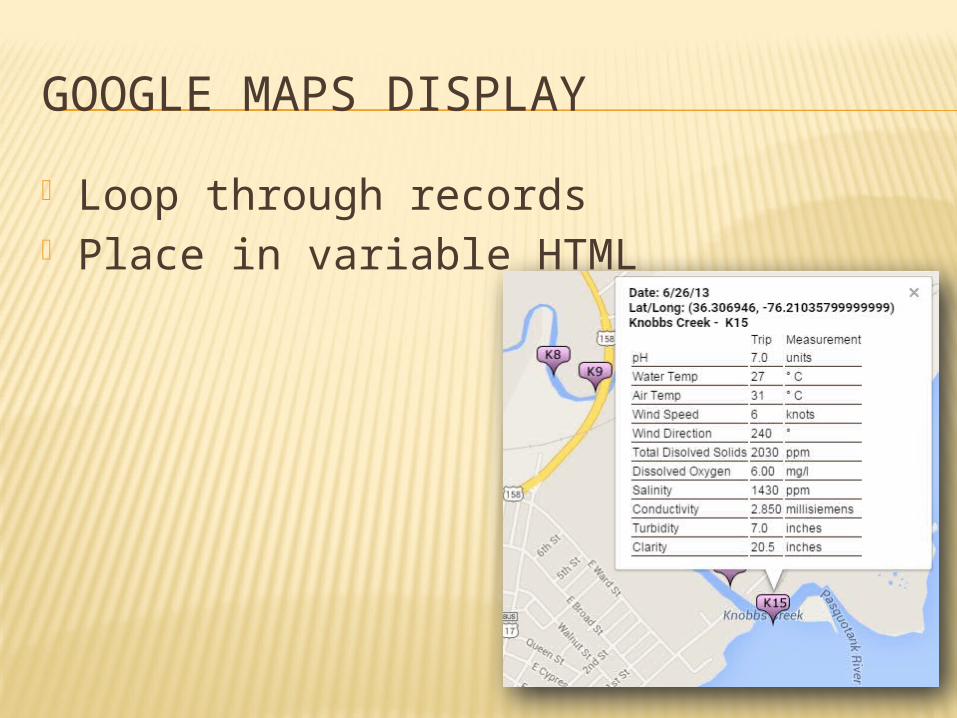
Loop through records Place in variable HTML
GOOGLE MAPS DISPLAY
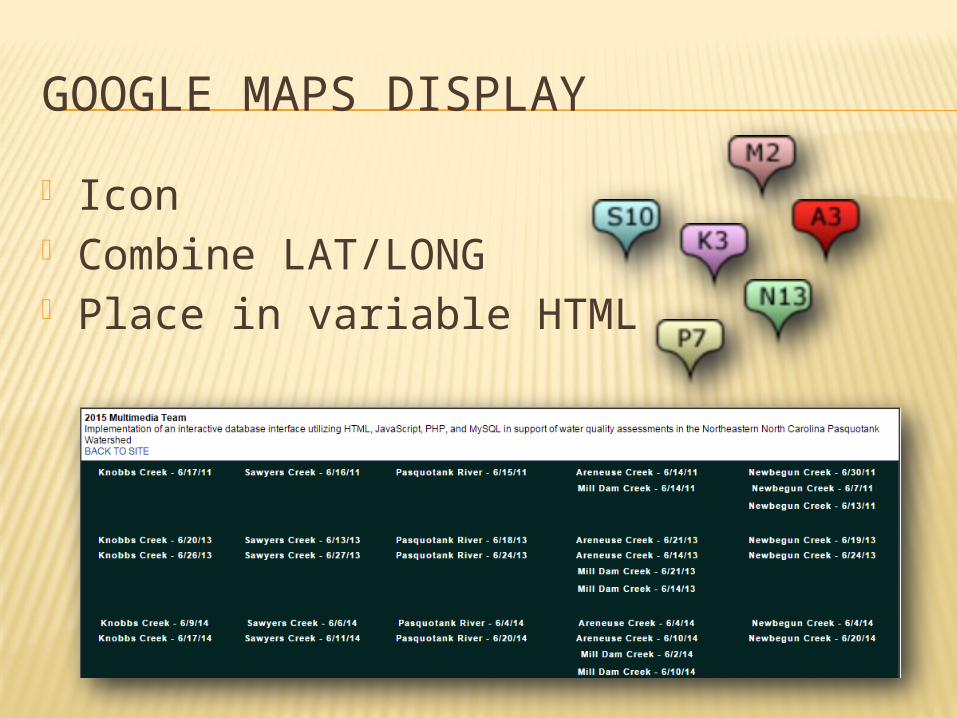
Icon Combine LAT/LONG Place in variable HTML
RESULTS
Spreadsheets Data Show, Modify, Entry, and Delete Google Files
CONCLUSION
Accuracy Analyzation Increased Enhancements
FUTURE WORK
Date Format MM/DD/YY to YYYY-MM-DD Search Capability Mobile Application Visual Design Delete Pause

ACKNOWLEDGEMENTS
Dr. Linda Hayden

QUESTIONS