Embed Size (px)
Citation preview

PassMark Software Pty. Ltd. www.passmark.com
ACN: 099 321 392
Antivirus, Internet Security and Total Security Products Performance Benchmarking (2009)
Vista/Dual Core Hardware
September 2008
Document: Antivirus, Internet Security and Total Security Performance Benchmarking
Authors: Karen Lai, David Wren
Company: PassMark Software Pty Ltd (www.passmark.com)
Date: 08/Sep/08
Edition: Edition 1
File: antivirus_09-performance-testing-ed1.docx
S O F T W A R E
PassMark
Benchmark Report PERFORMANCE TESTING of 2009 PRODUCTS
PassMark® Software 8-Sep-08 Page 2 of 68
TABLE OF CONTENTS
TABLE OF CONTENTS ....................................................................................................................... 2
REVISION HISTORY ........................................................................................................................... 5
REFERENCES ....................................................................................................................................... 5
EXECUTIVE SUMMARY .................................................................................................................... 6
OVERALL RANKING BY PRODUCT CATEGORY ....................................................................... 7
INTERNET SECURITY (IS) PRODUCTS ..................................................................................................... 7 ANTIVIRUS (AV) PRODUCTS ................................................................................................................. 7 TOTAL SECURITY (TS) PRODUCTS ........................................................................................................ 8
PRODUCTS TESTED ........................................................................................................................... 9
INTERNET SECURITY (IS) PRODUCTS ..................................................................................................... 9 ANTIVIRUS (AV) PRODUCTS ................................................................................................................. 9 TOTAL SECURITY (TS) PRODUCTS ...................................................................................................... 10
ORIGINAL SET OF METRICS – CRITERIA MEASURED ......................................................... 11
BENCHMARK 1 – BOOT TIME............................................................................................................... 11 BENCHMARK 2 – SCAN SPEED ............................................................................................................. 11 BENCHMARK 3 – USER INTERFACE LAUNCH SPEED ............................................................................ 11 BENCHMARK 4 – MEMORY UTILIZATION ............................................................................................ 11 BENCHMARK 5 – IE LAUNCH SPEED .................................................................................................... 11
NEW SET OF METRICS – CRITERIA MEASURED .................................................................... 12
BENCHMARK 6 – INSTALLATION TIME ................................................................................................ 12 BENCHMARK 7 – INSTALLATION SIZE ................................................................................................. 12 BENCHMARK 8 – REGISTRY KEY COUNT ............................................................................................. 12 BENCHMARK 9 – FILE COPY, MOVE AND DELETE ............................................................................... 12 BENCHMARK 10 – INSTALLING THIRD PARTY APPLICATIONS ............................................................. 12 BENCHMARK 11 – BINARY FILE DOWNLOAD SPEED ........................................................................... 12 BENCHMARK 12 – FILE FORMAT CONVERSION ................................................................................... 13 BENCHMARK 13 – FILE COMPRESSION AND DECOMPRESSION ............................................................. 13 BENCHMARK 14 – FILE WRITE, OPEN AND CLOSE .............................................................................. 13
TEST RESULTS – INTERNET SECURITY (IS) PRODUCTS ...................................................... 14
BENCHMARK 1 – BOOT TIME............................................................................................................... 14 BENCHMARK 2 – SCAN SPEED ............................................................................................................. 14 BENCHMARK 3A – INITIAL UI LAUNCH TIME ...................................................................................... 15 BENCHMARK 3B – SUBSEQUENT UI LAUNCH TIME ............................................................................. 15 BENCHMARK 4 – MEMORY UTILIZATION ............................................................................................ 16 BENCHMARK 5A – INITIAL IE LAUNCH TIME ...................................................................................... 16 BENCHMARK 5B – SUBSEQUENT IE LAUNCH TIME ............................................................................. 17 BENCHMARK 6 – INSTALLATION TIME ................................................................................................ 17 BENCHMARK 7 – INSTALLATION SIZE ................................................................................................. 18 BENCHMARK 8 – REGISTRY KEY COUNT ............................................................................................. 18 BENCHMARK 9 – FILE COPY, MOVE AND DELETE ............................................................................... 19 BENCHMARK 10 – INSTALLATION OF THIRD PARTY APPLICATIONS .................................................... 19 BENCHMARK 11 – BINARY FILE DOWNLOAD SPEED ........................................................................... 20 BENCHMARK 12 – FILE FORMAT CONVERSION ................................................................................... 20 BENCHMARK 13 – FILE COMPRESSION AND DECOMPRESSION ............................................................. 21 BENCHMARK 14 – FILE WRITE, OPEN AND CLOSE .............................................................................. 21
TEST RESULTS – ANTIVIRUS (AV) PRODUCTS ........................................................................ 22
BENCHMARK 1 – BOOT TIME............................................................................................................... 22 BENCHMARK 2 – SCAN SPEED ............................................................................................................. 22 BENCHMARK 3A – INITIAL UI LAUNCH TIME ...................................................................................... 23 BENCHMARK 3B – SUBSEQUENT UI LAUNCH TIME ............................................................................. 23 BENCHMARK 4 – MEMORY UTILIZATION ............................................................................................ 24 BENCHMARK 5A – INITIAL IE LAUNCH TIME ...................................................................................... 24 BENCHMARK 5B – SUBSEQUENT IE LAUNCH TIME ............................................................................. 25 BENCHMARK 6 – INSTALLATION TIME ................................................................................................ 25

Benchmark Report PERFORMANCE TESTING of 2009 PRODUCTS
PassMark® Software 8-Sep-08 Page 3 of 68
BENCHMARK 7 – INSTALLATION SIZE ................................................................................................. 26 BENCHMARK 8 – REGISTRY KEY COUNT ............................................................................................. 26 BENCHMARK 9 – FILE COPY, MOVE AND DELETE ............................................................................... 27 BENCHMARK 10 – INSTALLATION OF THIRD PARTY APPLICATIONS .................................................... 27 BENCHMARK 11 – BINARY FILE DOWNLOAD SPEED ........................................................................... 28 BENCHMARK 12 – FILE FORMAT CONVERSION ................................................................................... 28 BENCHMARK 13 – FILE COMPRESSION AND DECOMPRESSION ............................................................. 29 BENCHMARK 14 – FILE WRITE, OPEN AND CLOSE .............................................................................. 29
TEST RESULTS – TOTAL SECURITY (TS) PRODUCTS ............................................................ 30
BENCHMARK 1 – BOOT TIME............................................................................................................... 30 BENCHMARK 2 – SCAN SPEED ............................................................................................................. 30 BENCHMARK 3A – INITIAL UI LAUNCH TIME ...................................................................................... 31 BENCHMARK 3B – SUBSEQUENT UI LAUNCH TIME ............................................................................. 31 BENCHMARK 4 – MEMORY UTILIZATION ............................................................................................ 32 BENCHMARK 5A – INITIAL IE LAUNCH TIME ...................................................................................... 32 BENCHMARK 5B – SUBSEQUENT IE LAUNCH TIME ............................................................................. 33 BENCHMARK 6 – INSTALLATION TIME ................................................................................................ 33 BENCHMARK 7 – INSTALLATION SIZE ................................................................................................. 34 BENCHMARK 8 – REGISTRY KEY COUNT ............................................................................................. 34 BENCHMARK 9 – FILE COPY, MOVE AND DELETE ............................................................................... 35 BENCHMARK 10 – INSTALLATION OF THIRD PARTY APPLICATIONS .................................................... 35 BENCHMARK 11 – BINARY FILE DOWNLOAD SPEED ........................................................................... 36 BENCHMARK 12 – FILE FORMAT CONVERSION ................................................................................... 36 BENCHMARK 13 – FILE COMPRESSION AND DECOMPRESSION ............................................................. 37 BENCHMARK 14 – FILE WRITE, OPEN AND CLOSE .............................................................................. 37
WHAT THIS REPORT DOESN’T COVER ..................................................................................... 38
DISCLAIMER & DISCLOSURE ....................................................................................................... 39
DISCLAIMER OF LIABILITY .................................................................................................................. 39 DISCLOSURE ........................................................................................................................................ 39 TRADEMARKS...................................................................................................................................... 39
CONTACT DETAILS & MORE INFORMATION ......................................................................... 39
DOWNLOAD LINK ................................................................................................................................ 39
APPENDIX 1 – TEST METHOD – HOW DID WE CONDUCT THESE TESTS? ....................... 40
COMMON METHODOLOGY ................................................................................................................... 40 BENCHMARK 1 – BOOT TIME............................................................................................................... 40 BENCHMARK 2 – TOTAL SCAN SPEED ................................................................................................. 40 BENCHMARK 3 – UI LAUNCH SPEED ................................................................................................... 41 BENCHMARK 4 – MEMORY UTILIZATION ............................................................................................ 41 BENCHMARK 5 – IE LAUNCH SPEED.................................................................................................... 42 BENCHMARK 6 – INSTALLATION TIME ................................................................................................ 42 BENCHMARK 7 – INSTALLATION SIZE ................................................................................................. 42 BENCHMARK 8 – REGISTRY KEY COUNT ............................................................................................. 42 BENCHMARKS 9-14 – REAL-TIME PERFORMANCE ............................................................................... 43 BENCHMARKS 9 – FILE COPY, MOVE AND DELETE ............................................................................. 43 BENCHMARK 10 – THIRD PARTY PROGRAM INSTALLATION ................................................................ 44 BENCHMARK 11 – BINARY FILE DOWNLOAD SPEED ........................................................................... 44 BENCHMARK 12 – FILE FORMAT CONVERSION (MP3 WAV, MP3 WMA) ................................ 45 BENCHMARK 13 – FILE COMPRESSION AND DECOMPRESSION ............................................................. 45 BENCHMARK 14 – FILE WRITE, OPEN AND CLOSE .............................................................................. 46
APPENDIX 2 – TEST ENVIRONMENT ........................................................................................... 47
APPENDIX 3A – INTERNET SECURITY RAW RESULTS.......................................................... 48
BOOT TIME .......................................................................................................................................... 48 SCAN SPEED ........................................................................................................................................ 48 INITIAL UI LAUNCH SPEED .................................................................................................................. 49 SUBSEQUENT UI LAUNCH SPEED ........................................................................................................ 49 MEMORY UTILIZATION ....................................................................................................................... 50 INITIAL IE LAUNCH SPEED .................................................................................................................. 50
Benchmark Report PERFORMANCE TESTING of 2009 PRODUCTS
PassMark® Software 8-Sep-08 Page 4 of 68
SUBSEQUENT IE LAUNCH SPEED ......................................................................................................... 51 INSTALLATION TIME............................................................................................................................ 51 INSTALLATION SIZE ............................................................................................................................. 52 REGISTRY KEY COUNT ........................................................................................................................ 52 FILE COPY, MOVE AND DELETE .......................................................................................................... 53 THIRD PARTY PROGRAM INSTALLATION ............................................................................................. 53 BINARY DOWNLOAD SPEED ................................................................................................................ 54 FILE FORMAT CONVERSION................................................................................................................. 54 FILE COMPRESSION AND DECOMPRESSION .......................................................................................... 55 FILE WRITE, OPEN AND CLOSE ........................................................................................................... 55
APPENDIX 3B – ANTIVIRUS RAW RESULTS .............................................................................. 56
BOOT TIME .......................................................................................................................................... 56 SCAN SPEED ........................................................................................................................................ 56 INITIAL UI LAUNCH SPEED .................................................................................................................. 57 SUBSEQUENT UI LAUNCH SPEED ........................................................................................................ 57 MEMORY UTILIZATION ....................................................................................................................... 58 INITIAL IE LAUNCH SPEED .................................................................................................................. 58 SUBSEQUENT IE LAUNCH SPEED ......................................................................................................... 59 INSTALLATION TIME............................................................................................................................ 59 INSTALLATION SIZE ............................................................................................................................. 60 REGISTRY KEY COUNT ........................................................................................................................ 60 FILE COPY, MOVE AND DELETE .......................................................................................................... 61 THIRD PARTY PROGRAM INSTALLATION ............................................................................................. 61 BINARY DOWNLOAD SPEED ................................................................................................................ 62 FILE FORMAT CONVERSION................................................................................................................. 62 FILE COMPRESSION AND DECOMPRESSION .......................................................................................... 63 FILE WRITE, OPEN AND CLOSE ........................................................................................................... 63
APPENDIX 3C – TOTAL SECURITY RAW RESULTS ................................................................ 64
BOOT TIME .......................................................................................................................................... 64 SCAN SPEED ........................................................................................................................................ 64 INITIAL UI LAUNCH SPEED .................................................................................................................. 64 SUBSEQUENT UI LAUNCH SPEED ........................................................................................................ 65 MEMORY UTILIZATION ....................................................................................................................... 65 HTTP DOWNLOAD SPEED ................................................................................................................... 65 INITIAL IE LAUNCH SPEED .................................................................................................................. 65 SUBSEQUENT IE LAUNCH SPEED ......................................................................................................... 66 INSTALLATION TIME............................................................................................................................ 66 INSTALLATION SIZE ............................................................................................................................. 66 REGISTRY KEY COUNT ........................................................................................................................ 66 FILE COPY, MOVE AND DELETE .......................................................................................................... 67 THIRD PARTY PROGRAM INSTALLATION ............................................................................................. 67 BINARY DOWNLOAD SPEED ................................................................................................................ 67 FILE FORMAT CONVERSION................................................................................................................. 67 FILE COMPRESSION AND DECOMPRESSION .......................................................................................... 68 FILE WRITE, OPEN AND CLOSE ........................................................................................................... 68
Benchmark Report PERFORMANCE TESTING of 2009 PRODUCTS
PassMark® Software 8-Sep-08 Page 5 of 68
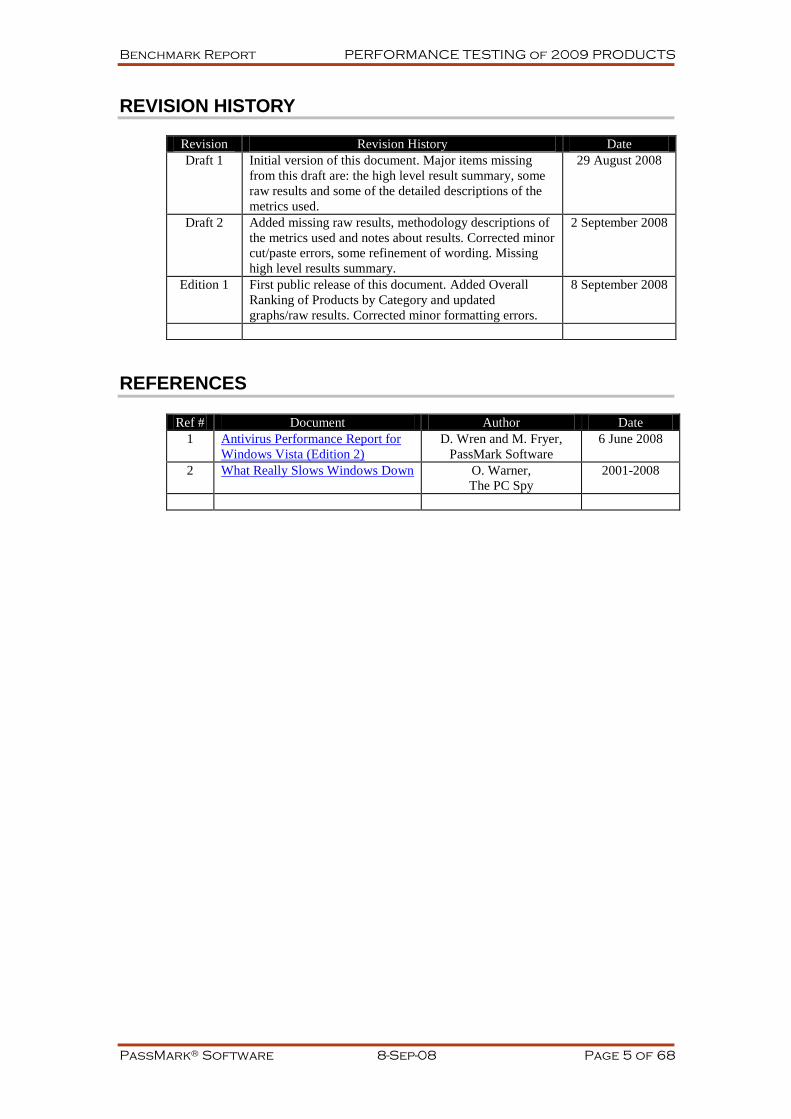
REVISION HISTORY
Revision Revision History Date
Draft 1 Initial version of this document. Major items missing
from this draft are: the high level result summary, some
raw results and some of the detailed descriptions of the
metrics used.
29 August 2008
Draft 2 Added missing raw results, methodology descriptions of
the metrics used and notes about results. Corrected minor
cut/paste errors, some refinement of wording. Missing
high level results summary.
2 September 2008
Edition 1 First public release of this document. Added Overall
Ranking of Products by Category and updated
graphs/raw results. Corrected minor formatting errors.
8 September 2008
REFERENCES
Ref # Document Author Date
1 Antivirus Performance Report for
Windows Vista (Edition 2)
D. Wren and M. Fryer,
PassMark Software
6 June 2008
2 What Really Slows Windows Down O. Warner,
The PC Spy
2001-2008

Benchmark Report PERFORMANCE TESTING of 2009 PRODUCTS
PassMark® Software 8-Sep-08 Page 6 of 68
Executive Summary
PassMark has executed performance benchmark testing on thirty-one Antivirus, Internet
Security and Total Security products from various vendors between July and August 2008. The
results within this document are intended to complement and extend previous test results
collected by PassMark for Symantec in March 2008 (please see Reference #1: Antivirus
Performance Report for Windows Vista, Edition 2).
PassMark will continue to execute performance benchmark testing on selected 2009 versions of
Antivirus, Internet Security and Total Security products during September and October 2008. A
follow-up report comparing the findings in this report with our new results will be released later
this year.
Testing was performed on all products using several new performance metrics. The new metrics
were:
Installation Size.
Installation Time.
Registry Key Count.
Copying, moving and deleting different types of common files.
Installing third party applications.
Downloading binary files from websites.
File format conversion.
File compression and decompression.
File write, open and close.
For twelve previously untested products, measurements were also made against the original
performance metrics:
Boot time.
Total Scan speed.
UI launch speed (initial and subsequent).
Memory utilization.
IE launch speed (initial and subsequent).
These tests were not re-executed for products tested in October 2007. For these products, we
have included our results from last year as part of our findings in this report for ease of
comparison between products.
No attempt was made to measure the effectiveness of threat detection, as this aspect of the
products is covered by other industry benchmarks such as Virus Bulletin
(http://www.virusbtn.com) and AV Comparatives (http://www.av-comparatives.org). This
report is solely focused on measuring how responsive the applications are and by how
extensively the applications utilize the resources of the machine.
Testing was performed on a dual core Vista machine; the same machine used in previous
testing. The products themselves are divided into three groups:
Antivirus (AV) products are defined in this report as products which are primarily
focused on detecting and remediating viruses and spyware.
Internet Security (IS) products provides all the virus and spyware removal features of
an AV, as well as additional functions to provide greater Internet protection. These
features may include protection against phishing, root kit detection, firewalls and
scanning of web pages and HTTP data.
Total Security (TS) products provide data migration and backup features on top of all
security features common to IS products.

Benchmark Report PERFORMANCE TESTING of 2009 PRODUCTS
PassMark® Software 8-Sep-08 Page 7 of 68
Overall Ranking by Product Category
In the following tables, the products have been ranked by their overall score in comparison to
other products from that category. The Best Possible Score represents a category‟s maximum
score, i.e. the score of a hypothetical product which has ranked first in every test in that
category. This figure varies between categories because different amounts of products were
tested for each category (IS: 10, AV: 12, TS: 5), for example, in the Total Security category, the
best possible score would be 80 (5 products x 16 tests).
Internet Security (IS) Products
Product Name Score
Norton Internet Security 2009 154
ESET Smart Security 2008 154
Kaspersky Internet Security 8 141
AVG Internet Security 2008 129
Panda Internet Security 2008 129
Norton Internet Security 2008 115
F-Secure Internet Security 2009 BETA 112
McAfee Internet Security 2008 111
G-Data Internet Security 2008 108
Trend Micro Internet Security 2008 97
Best Possible Score 176
Antivirus (AV) Products
Product Name Score
Norton Antivirus 2009 145
ESET NOD32 Antivirus 3.0 143
Avira AntiVir Free AV 8 129
Avast! Antivirus 4.8 124
Rising Security Antivirus 116
Kaspersky Antivirus 8 101
SourceNext Virus Security ZERO 2008 99
AVG Free AV&AS 2008 94
Norton Antivirus 2008 94
Trend Micro Antivirus 2008 75
G-Data Antivirus 2008 64
McAfee VirusScanPlus 2008 64
Best Possible Score 192
Benchmark Report PERFORMANCE TESTING of 2009 PRODUCTS
PassMark® Software 8-Sep-08 Page 8 of 68
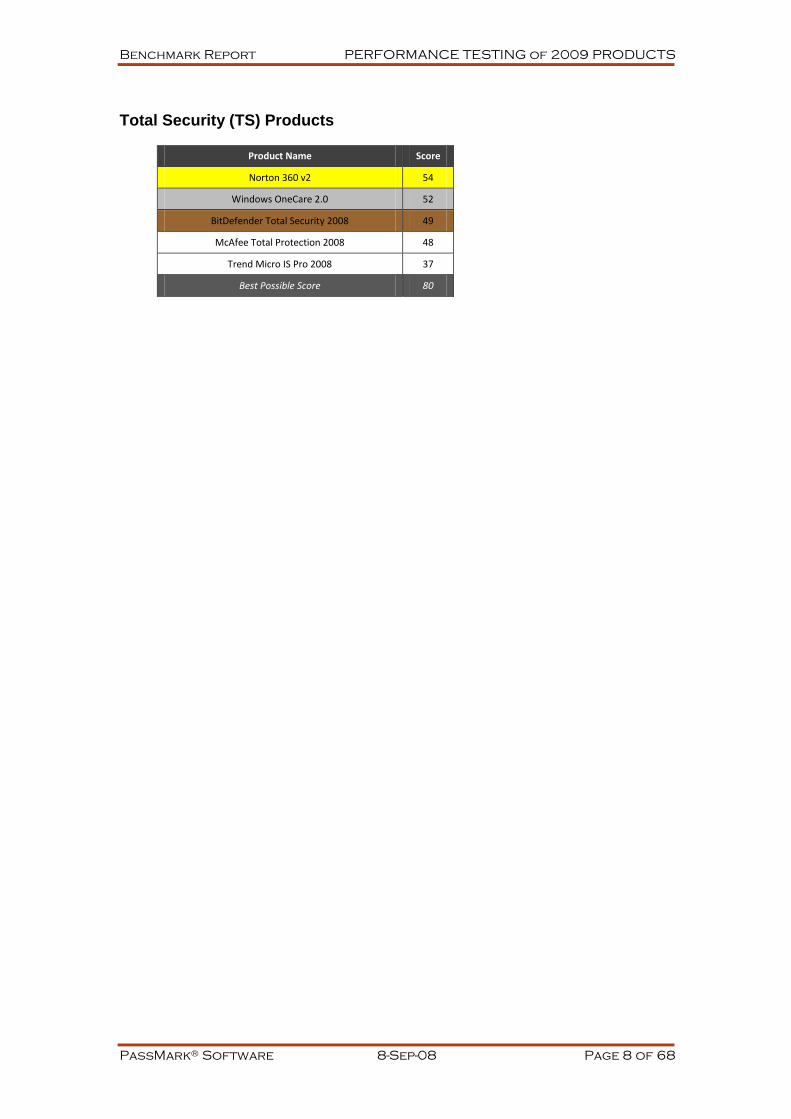
Total Security (TS) Products
Product Name Score
Norton 360 v2 54
Windows OneCare 2.0 52
BitDefender Total Security 2008 49
McAfee Total Protection 2008 48
Trend Micro IS Pro 2008 37
Best Possible Score 80

Benchmark Report PERFORMANCE TESTING of 2009 PRODUCTS
PassMark® Software 8-Sep-08 Page 9 of 68
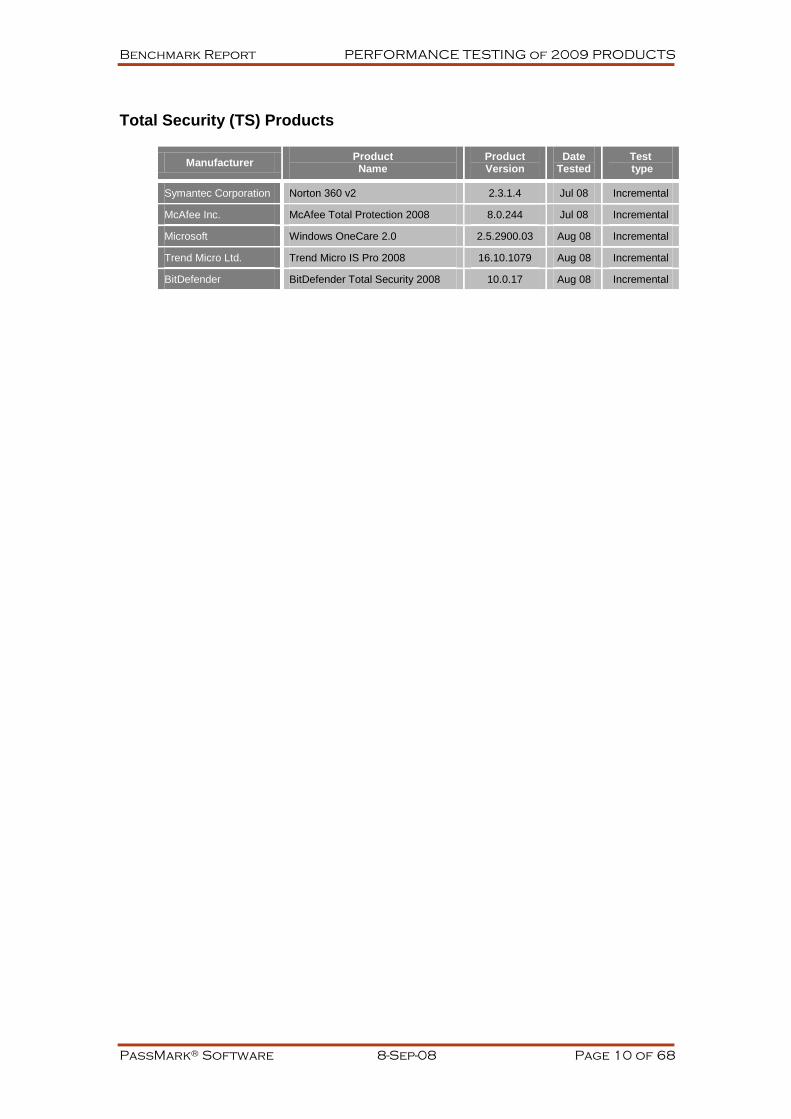
Products Tested
This report compares our results for the following versions of products:
Internet Security (IS) Products
Manufacturer Product Name
Product Version
Date Tested
Test type
Symantec Corporation Norton Internet Security 2008 15.0.0.60 Aug 08 Incremental
Symantec Corporation Norton Internet Security 2009 16.0.0.125 Sep 08 Full
Kaspersky Labs Kaspersky Internet Security 8 (2009)
8.0.0.357 Jul 08 Full
McAfee Inc McAfee Internet Security 2008 8.1.175 Aug 08 Full
AVG Technologies AVG Internet Security 2008 8.0.138 Jul 08 Full
Trend Micro Ltd. Trend Micro Internet Security 2008 16.10.1079 Jul 08 Incremental
G Data Software G Data Internet Security 2008 18.0.7227.533 Jul 08 Incremental
ESET ESET Smart Security 2008 3.0.650.0 Aug 08 Incremental
F-Secure F-Secure Internet Security 2009 [BETA]
8.40.128 Aug 08 Full
Panda Security Panda Internet Security 2008 12.00.00 Aug 08 Incremental
Antivirus (AV) Products
Manufacturer Product Name
Product Version
Date Tested
Test type
Symantec Corporation Norton Antivirus 2008 15.5.0.23 Aug 08 Incremental
Symantec Corporation Norton Antivirus 2009 16.0.0.125 Sep 08 Full
Kaspersky Labs Kaspersky Antivirus 8 (2009) 8.0.0.357 Jul 08 Full
McAfee Inc. McAfee VirusScanPlus 2008 12.1.110 Aug 08 Incremental
AVG Technologies AVG Free AV&AS 2008 8.138.1332 Jul 08 Full
Trend Micro Ltd. Trend Micro Antivirus 2008 16.10.1079 Jul 08 Incremental
SourceNext Corporation
SourceNext Virus Security ZERO 2008
9.4.00 Aug 08 Incremental
G Data Software G-Data Antivirus 2008 18.0.7227.533 Jul 08 Incremental
ESET ESET NOD32 Antivirus 3.0 3.0.667.0 Jul 08 Full
Avira gmbH Avira AntiVir Free AV 8 8.1.0.326 Jul 08 Full
ALWIL Software Avast! Antivirus 4.8 4.8.1229 Jul 08 Full
Beijing Rising Int. Software Co.
Rising Security Antivirus 20.55.11 Jul 08 Full
Benchmark Report PERFORMANCE TESTING of 2009 PRODUCTS
PassMark® Software 8-Sep-08 Page 10 of 68
Total Security (TS) Products
Manufacturer Product Name
Product Version
Date Tested
Test type
Symantec Corporation Norton 360 v2 2.3.1.4 Jul 08 Incremental
McAfee Inc. McAfee Total Protection 2008 8.0.244 Jul 08 Incremental
Microsoft Windows OneCare 2.0 2.5.2900.03 Aug 08 Incremental
Trend Micro Ltd. Trend Micro IS Pro 2008 16.10.1079 Aug 08 Incremental
BitDefender BitDefender Total Security 2008 10.0.17 Aug 08 Incremental

Benchmark Report PERFORMANCE TESTING of 2009 PRODUCTS
PassMark® Software 8-Sep-08 Page 11 of 68
Original Set of Metrics – Criteria Measured
This original set of metrics was used in the previous test. These metrics were selected because
they provided an indication of the product‟s performance in a number of key areas which
impacted on the user experience. All metrics are objective and can be replicated and reproduced
by third parties if required.
Please see ‘Appendix 1 – Test method – How did we conduct these tests?’ for detailed test
methodologies.
Benchmark 1 – Boot Time
The time taken for the machine to boot was measured. It is typical for antiviral or security suite
applications to be launched at Windows start-up. This typically adds some amount of time to the
boot time for the machine. Our aim was to measure the additional time added to the boot process
as a result of installing these applications. Shorter boot times indicate that the application has
less impact on the normal operation of the machine.
Benchmark 2 – Scan Speed
All these products have functionality designed to detect viruses and various other forms of
malware by scanning files on the system. This test measured the amount of time required to scan
a typical set of clean files. The sample set used against all products was 1.2GB worth of data,
made up of typical Window‟s files from the Windows system folder and Office files.
Benchmark 3 – User Interface Launch Speed
The time taken to start the User Interface of the product was measured. This is one measure of
how responsive an application appears to a user. Both the initial launch time and the subsequent
launch times, to allow for caching effects, were measured. For simplicity only the more critical
initial times are used in this report.
Benchmark 4 – Memory Utilization
The amount of RAM used by the product was measured while the machine and product were in
an idle state, running in the background. All processes used by the application were identified
and the total RAM usage calculated. The less RAM an application uses while resident in the
background the better. Idle state measurements were made, as opposed to RAM used while
actively scanning, because it is easier to measure the stable idle state and the aim was to see
what resources were being used on a permanent basis.
Benchmark 5 – IE launch Speed
The time taken to start the user interface of Internet Explorer was measured. This is one measure
of how the product impacts on the responsiveness of the system. Both the initial launch time and
the subsequent launch times, to allow for caching effects, were measured. For simplicity only
the more critical initial times are used in this report.

Benchmark Report PERFORMANCE TESTING of 2009 PRODUCTS
PassMark® Software 8-Sep-08 Page 12 of 68
New Set of Metrics – Criteria Measured
New to this report, this additional set of metrics was selected to supplement and extend the
initial set of metrics in testing to a user‟s experience of a software product. These new
benchmarks include installation speed, the amount of installation space a product will occupy on
a user‟s hard drive and the amount of keys added to the Registry after installation.
Benchmarks 9 through to 14 comprise of a script-based “performance obstacle course”. Each of
these benchmarks were designed to provide performance results in the context of the end user
experience by mimicking performance of tasks that end users may perform on a real-time or
daily basis.
Please refer to ‘Appendix 1 – Test method – How did we conduct these tests?’ for detailed test
methodologies.
Benchmark 6 – Installation Time
It is important that a user has good first impressions of a product. The speed and ease of the
installation process will strongly impact this initial experience. This test measures the minimum
Installation Time a product requires to be fully functional and ready for use by the end user.
Lower times represent products which are quicker for a user to install.
Benchmark 7 – Installation Size
New technologies push the size limits of hard drives every year. Despite this, the installation
size test remains popular among reviewers and home users alike due to its ease of replication. A
product‟s Installation Size has been defined as the difference between the snapshot of the Disk
Space (C: drive) before and after the product is installed on the system. The smaller the
difference is between these disk space snapshots, the less disk space a product will take up on a
user‟s hard disk.
Benchmark 8 – Registry Key Count
A large registry increases a machine‟s use of resources. This is likely to negatively impact
system performance, especially on much older machines. This test measures the amount of keys
and values added to registry, after rebooting the test machines, following a successful product
installation. Lower numbers mean that a product has had less impact on the registry.
Benchmark 9 – File Copy, Move and Delete
This metric measured the amount of time required to move, copy and delete a sample set of
files. The sample file set contains several types of file formats that a Windows user would
encounter in daily use. These formats include documents (e.g. Microsoft Office documents,
Adobe PDF, Zip files, etc), media formats (e.g. images, movies and music) and system files
(e.g. executables, libraries, etc).
Benchmark 10 – Installing Third Party Applications
This metric measured the amount of time required to install and uninstall third party programs.
Benchmark 11 – Binary File Download Speed
The metric measured the amount of time required to download a variety of binary files through
HTTP. Binary files used in this test include file formats that users would typically download
from the web such as images, archives, music files and movie files.

Benchmark Report PERFORMANCE TESTING of 2009 PRODUCTS
PassMark® Software 8-Sep-08 Page 13 of 68
Benchmark 12 – File Format Conversion
This test measures the amount of time required to convert an MP3 file to a WAV and
subsequently, convert the same MP3 file to a WMA format.
Benchmark 13 – File Compression and Decompression
This metric measures the amount of time required to compression and decompression of
different types of files. Files formats used in this test included documents, movies and images.
Benchmark 14 – File Write, Open and Close
This benchmark was derived from Oli Warner‟s File I/O test at http://www.thepcspy.com
(please see Reference #2: What Really Slows Windows Down). This metric measures the
amount of time required for the system to write a file, then open and close that file.
Benchmark Report PERFORMANCE TESTING of 2009 PRODUCTS
PassMark® Software 8-Sep-08 Page 14 of 68
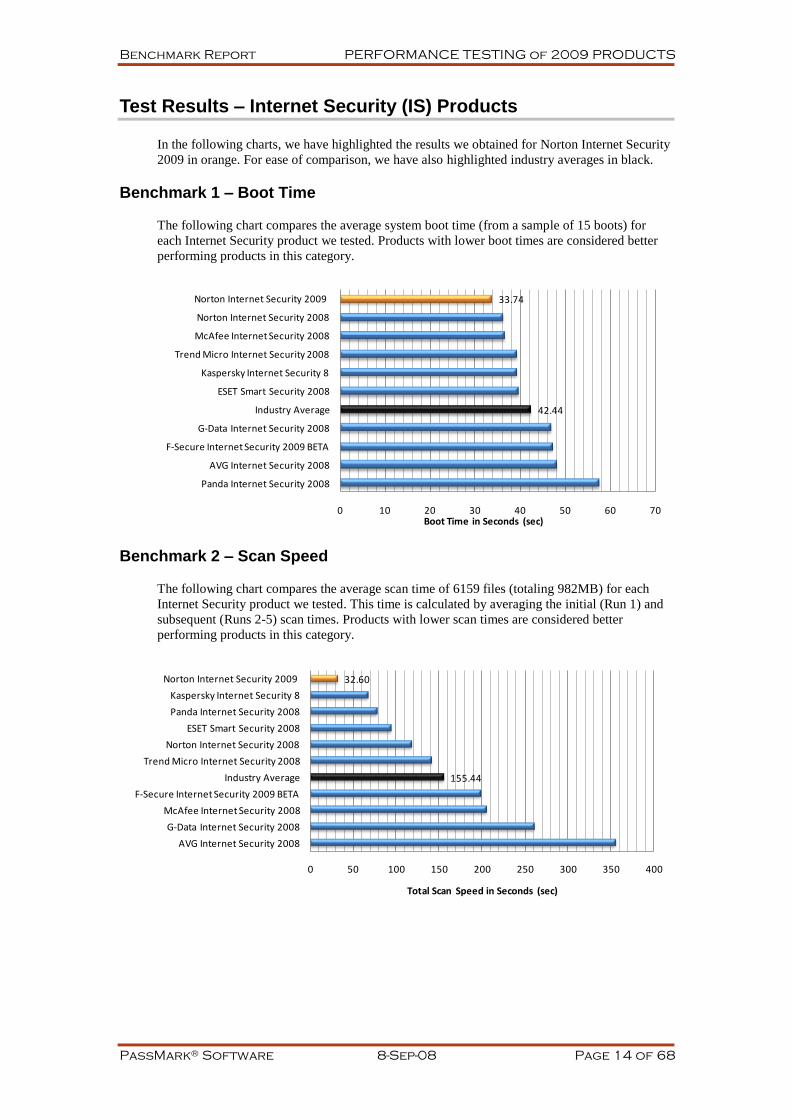
Test Results – Internet Security (IS) Products
In the following charts, we have highlighted the results we obtained for Norton Internet Security
2009 in orange. For ease of comparison, we have also highlighted industry averages in black.
Benchmark 1 – Boot Time
The following chart compares the average system boot time (from a sample of 15 boots) for
each Internet Security product we tested. Products with lower boot times are considered better
performing products in this category.
Benchmark 2 – Scan Speed
The following chart compares the average scan time of 6159 files (totaling 982MB) for each
Internet Security product we tested. This time is calculated by averaging the initial (Run 1) and
subsequent (Runs 2-5) scan times. Products with lower scan times are considered better
performing products in this category.
42.44
33.74
0 10 20 30 40 50 60 70
Panda Internet Security 2008
AVG Internet Security 2008
F-Secure Internet Security 2009 BETA
G-Data Internet Security 2008
Industry Average
ESET Smart Security 2008
Kaspersky Internet Security 8
Trend Micro Internet Security 2008
McAfee Internet Security 2008
Norton Internet Security 2008
Norton Internet Security 2009
Boot Time in Seconds (sec)
155.44
32.60
0 50 100 150 200 250 300 350 400
AVG Internet Security 2008
G-Data Internet Security 2008
McAfee Internet Security 2008
F-Secure Internet Security 2009 BETA
Industry Average
Trend Micro Internet Security 2008
Norton Internet Security 2008
ESET Smart Security 2008
Panda Internet Security 2008
Kaspersky Internet Security 8
Norton Internet Security 2009
Total Scan Speed in Seconds (sec)

Benchmark Report PERFORMANCE TESTING of 2009 PRODUCTS
PassMark® Software 8-Sep-08 Page 15 of 68
Benchmark 3a – Initial UI Launch Time
The following chart compares the average launch times of the User Interface (after rebooting the
machine) for each Internet Security product we tested. Products with lower UI launch times are
considered better performing products in this category.
Benchmark 3b – Subsequent UI Launch Time
The following chart compares the average launch times of the User Interface by restarting the
Internet Security application (without rebooting the machine) for each Internet Security product
tested. Lower times are better. Products with lower UI launch times are considered better
performing products in this category.
1,628.39
253.68
0 500 1,000 1,500 2,000 2,500 3,000 3,500 4,000 4,500 5,000
Trend Micro Internet Security 2008
Panda Internet Security 2008
F-Secure Internet Security 2009 BETA
AVG Internet Security 2008
G-Data Internet Security 2008
Industry Average
McAfee Internet Security 2008
Kaspersky Internet Security 8
Norton Internet Security 2008
Norton Internet Security 2009
ESET Smart Security 2008
Initial UI Launch Speed in Milliseconds (ms)
1,175.21
268.49
0 500 1,000 1,500 2,000 2,500 3,000 3,500 4,000
Trend Micro Internet Security 2008
Panda Internet Security 2008
F-Secure Internet Security 2009 BETA
AVG Internet Security 2008
Industry Average
McAfee Internet Security 2008
Kaspersky Internet Security 8
G-Data Internet Security 2008
Norton Internet Security 2008
Norton Internet Security 2009
ESET Smart Security 2008
Subsequent UI Launch Speed in Milliseconds (ms)

Benchmark Report PERFORMANCE TESTING of 2009 PRODUCTS
PassMark® Software 8-Sep-08 Page 16 of 68
Benchmark 4 – Memory Utilization
The following chart compares the average amount of RAM used while idle for each Internet
Security product tested. This average is taken from a sample of ten memory snapshots taken at
roughly 60 seconds apart after reboot. Products with lower idle RAM usage are considered
better performing products in this category.
Benchmark 5a – Initial IE Launch Time
The following chart compares the average launch times of Internet Explorer after rebooting the
machine for each Internet Security product we tested. Products with lower IE launch times are
considered better performing products in this category.
50.20
6.92
0 10 20 30 40 50 60 70 80 90 100
Panda Internet Security 2008
G-Data Internet Security 2008
McAfee Internet Security 2008
F-Secure Internet Security 2009 BETA
AVG Internet Security 2008
Trend Micro Internet Security 2008
Industry Average
ESET Smart Security 2008
Kaspersky Internet Security 8
Norton Internet Security 2008
Norton Internet Security 2009
Memory Usage in Megabytes (MB)
950.43
598.08
0 500 1,000 1,500 2,000 2,500
Norton Internet Security 2008
G-Data Internet Security 2008
AVG Internet Security 2008
Trend Micro Internet Security 2008
Industry Average
McAfee Internet Security 2008
Panda Internet Security 2008
Norton Internet Security 2009
Kaspersky Internet Security 8
ESET Smart Security 2008
F-Secure Internet Security 2009 BETA
Initial IE Launch Speed in Milliseconds (ms)
Benchmark Report PERFORMANCE TESTING of 2009 PRODUCTS
PassMark® Software 8-Sep-08 Page 17 of 68
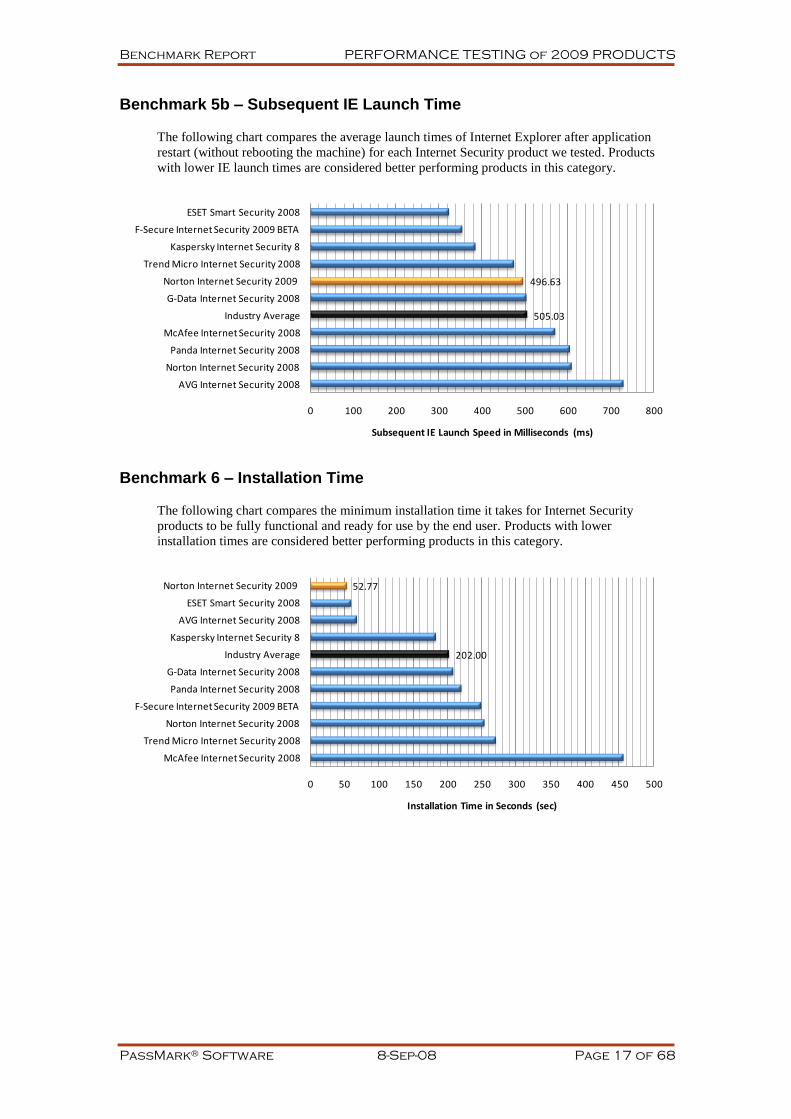
Benchmark 5b – Subsequent IE Launch Time
The following chart compares the average launch times of Internet Explorer after application
restart (without rebooting the machine) for each Internet Security product we tested. Products
with lower IE launch times are considered better performing products in this category.
Benchmark 6 – Installation Time
The following chart compares the minimum installation time it takes for Internet Security
products to be fully functional and ready for use by the end user. Products with lower
installation times are considered better performing products in this category.
505.03
496.63
0 100 200 300 400 500 600 700 800
AVG Internet Security 2008
Norton Internet Security 2008
Panda Internet Security 2008
McAfee Internet Security 2008
Industry Average
G-Data Internet Security 2008
Norton Internet Security 2009
Trend Micro Internet Security 2008
Kaspersky Internet Security 8
F-Secure Internet Security 2009 BETA
ESET Smart Security 2008
Subsequent IE Launch Speed in Milliseconds (ms)
202.00
52.77
0 50 100 150 200 250 300 350 400 450 500
McAfee Internet Security 2008
Trend Micro Internet Security 2008
Norton Internet Security 2008
F-Secure Internet Security 2009 BETA
Panda Internet Security 2008
G-Data Internet Security 2008
Industry Average
Kaspersky Internet Security 8
AVG Internet Security 2008
ESET Smart Security 2008
Norton Internet Security 2009
Installation Time in Seconds (sec)

Benchmark Report PERFORMANCE TESTING of 2009 PRODUCTS
PassMark® Software 8-Sep-08 Page 18 of 68
Benchmark 7 – Installation Size
The following chart compares the installation sizes of Internet Security products. Products with
lower installation sizes are considered better performing products in this category.
Benchmark 8 – Registry Key Count
The following chart compares the amount of Registry Keys created during product installation,
for each Internet Security product we tested. Products with lower key counts are considered
better performing products in this category.
709.82
142.46
0 200 400 600 800 1,000 1,200
Trend Micro Internet Security 2008
Panda Internet Security 2008
Norton Internet Security 2008
McAfee Internet Security 2008
AVG Internet Security 2008
G-Data Internet Security 2008
Industry Average
F-Secure Internet Security 2009 BETA
Kaspersky Internet Security 8
ESET Smart Security 2008
Norton Internet Security 2009
Installation size in Megabytes (MB)
4,880
2,582
0 2,000 4,000 6,000 8,000 10,000 12,000
Norton Internet Security 2008
G-Data Internet Security 2008
Kaspersky Internet Security 8
McAfee Internet Security 2008
Trend Micro Internet Security 2008
Industry Average
Panda Internet Security 2008
F-Secure Internet Security 2009 BETA
Norton Internet Security 2009
ESET Smart Security 2008
AVG Internet Security 2008
Number of Registry Keys added after Installation

Benchmark Report PERFORMANCE TESTING of 2009 PRODUCTS
PassMark® Software 8-Sep-08 Page 19 of 68
Benchmark 9 – File Copy, Move and Delete
The following chart compares the average speed of file copying, moving and deleting for each
Internet Security product we tested. Products with lower times are considered better performing
products in this category.
Benchmark 10 – Installation of Third Party Applications
The following chart compares the average speed of installation of third party applications for
each Internet Security product we tested. Products with lower times are considered better
performing products in this category.
76.79
69.49
0 10 20 30 40 50 60 70 80 90 100
AVG Internet Security 2008
G-Data Internet Security 2008
Trend Micro Internet Security 2008
F-Secure Internet Security 2009 BETA
Norton Internet Security 2009
Industry Average
McAfee Internet Security 2008
Panda Internet Security 2008
Norton Internet Security 2008
ESET Smart Security 2008
Kaspersky Internet Security 8
File Copy, Move and Delete - Time in Seconds (sec)
51.63
50.82
0 10 20 30 40 50 60 70
Trend Micro Internet Security 2008
G-Data Internet Security 2008
F-Secure Internet Security 2009 BETA
Norton Internet Security 2009
McAfee Internet Security 2008
Industry Average
Kaspersky Internet Security 8
ESET Smart Security 2008
Panda Internet Security 2008
Norton Internet Security 2008
AVG Internet Security 2008
Third Party Program Installation - Time in Seconds (sec)
Benchmark Report PERFORMANCE TESTING of 2009 PRODUCTS
PassMark® Software 8-Sep-08 Page 20 of 68
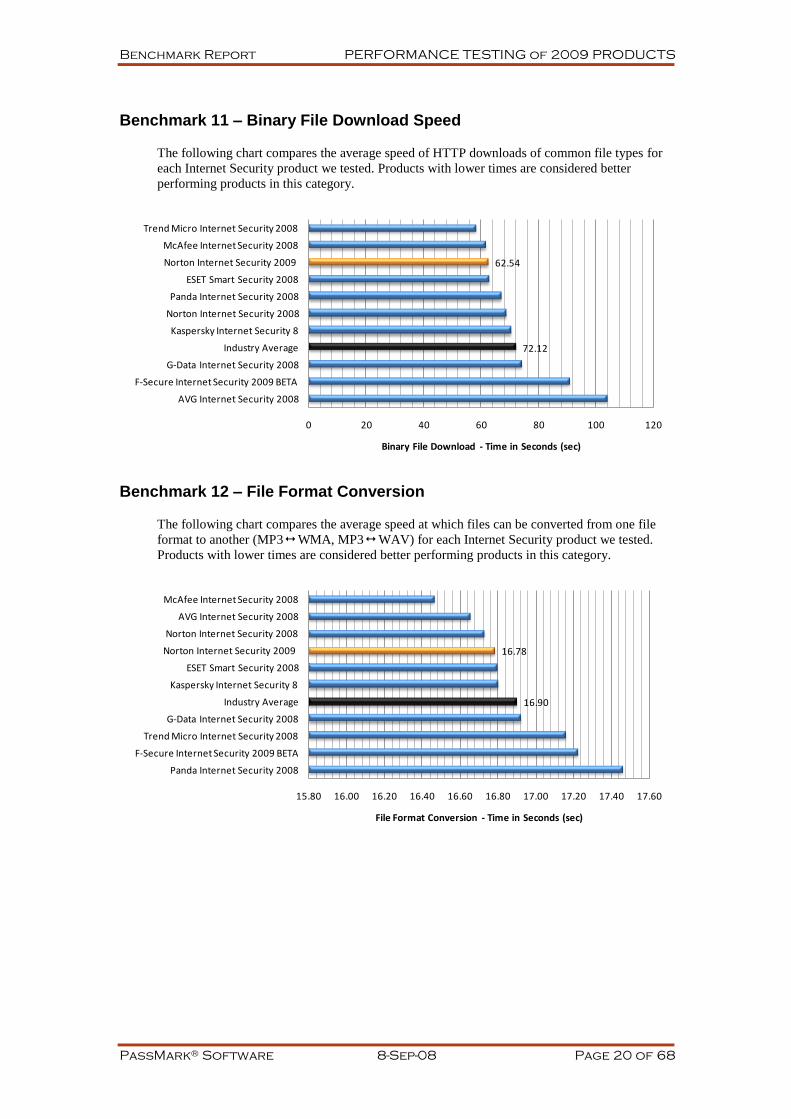
Benchmark 11 – Binary File Download Speed
The following chart compares the average speed of HTTP downloads of common file types for
each Internet Security product we tested. Products with lower times are considered better
performing products in this category.
Benchmark 12 – File Format Conversion
The following chart compares the average speed at which files can be converted from one file
format to another (MP3 WMA, MP3 WAV) for each Internet Security product we tested.
Products with lower times are considered better performing products in this category.
72.12
62.54
0 20 40 60 80 100 120
AVG Internet Security 2008
F-Secure Internet Security 2009 BETA
G-Data Internet Security 2008
Industry Average
Kaspersky Internet Security 8
Norton Internet Security 2008
Panda Internet Security 2008
ESET Smart Security 2008
Norton Internet Security 2009
McAfee Internet Security 2008
Trend Micro Internet Security 2008
Binary File Download - Time in Seconds (sec)
16.90
16.78
15.80 16.00 16.20 16.40 16.60 16.80 17.00 17.20 17.40 17.60
Panda Internet Security 2008
F-Secure Internet Security 2009 BETA
Trend Micro Internet Security 2008
G-Data Internet Security 2008
Industry Average
Kaspersky Internet Security 8
ESET Smart Security 2008
Norton Internet Security 2009
Norton Internet Security 2008
AVG Internet Security 2008
McAfee Internet Security 2008
File Format Conversion - Time in Seconds (sec)
Benchmark Report PERFORMANCE TESTING of 2009 PRODUCTS
PassMark® Software 8-Sep-08 Page 21 of 68
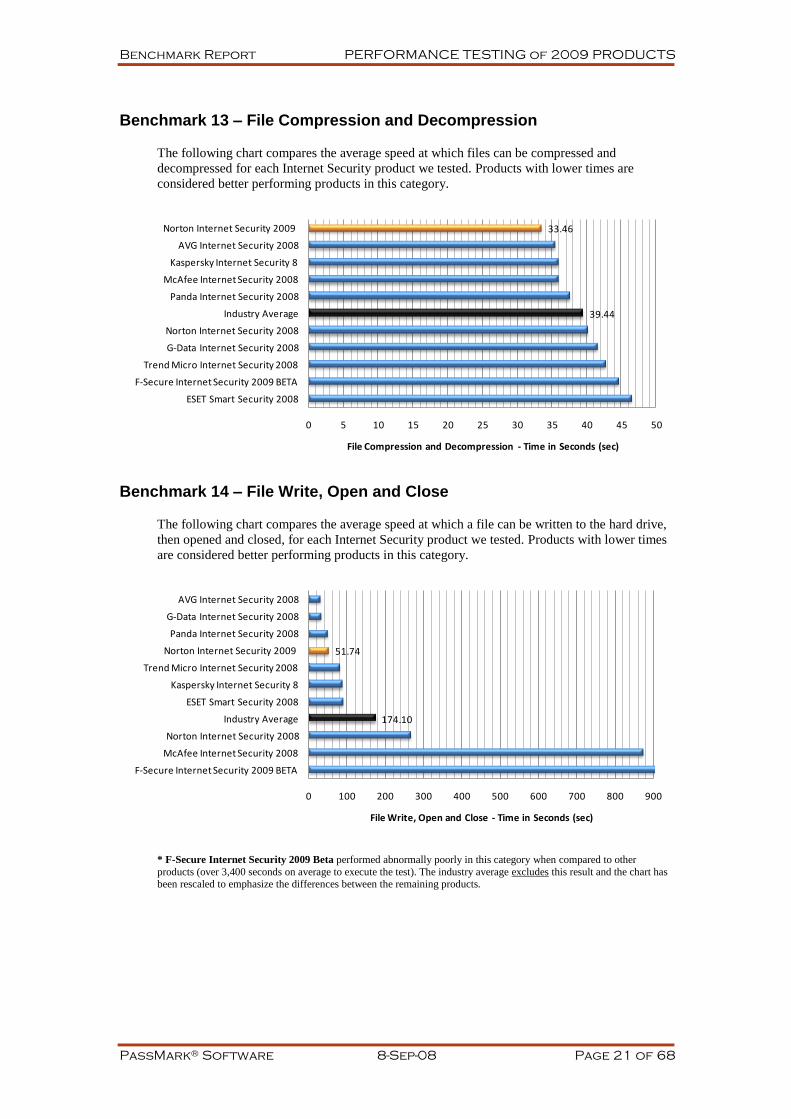
Benchmark 13 – File Compression and Decompression
The following chart compares the average speed at which files can be compressed and
decompressed for each Internet Security product we tested. Products with lower times are
considered better performing products in this category.
Benchmark 14 – File Write, Open and Close
The following chart compares the average speed at which a file can be written to the hard drive,
then opened and closed, for each Internet Security product we tested. Products with lower times
are considered better performing products in this category.
* F-Secure Internet Security 2009 Beta performed abnormally poorly in this category when compared to other
products (over 3,400 seconds on average to execute the test). The industry average excludes this result and the chart has been rescaled to emphasize the differences between the remaining products.
39.44
33.46
0 5 10 15 20 25 30 35 40 45 50
ESET Smart Security 2008
F-Secure Internet Security 2009 BETA
Trend Micro Internet Security 2008
G-Data Internet Security 2008
Norton Internet Security 2008
Industry Average
Panda Internet Security 2008
McAfee Internet Security 2008
Kaspersky Internet Security 8
AVG Internet Security 2008
Norton Internet Security 2009
File Compression and Decompression - Time in Seconds (sec)
174.10
51.74
0 100 200 300 400 500 600 700 800 900
F-Secure Internet Security 2009 BETA
McAfee Internet Security 2008
Norton Internet Security 2008
Industry Average
ESET Smart Security 2008
Kaspersky Internet Security 8
Trend Micro Internet Security 2008
Norton Internet Security 2009
Panda Internet Security 2008
G-Data Internet Security 2008
AVG Internet Security 2008
File Write, Open and Close - Time in Seconds (sec)
Benchmark Report PERFORMANCE TESTING of 2009 PRODUCTS
PassMark® Software 8-Sep-08 Page 22 of 68
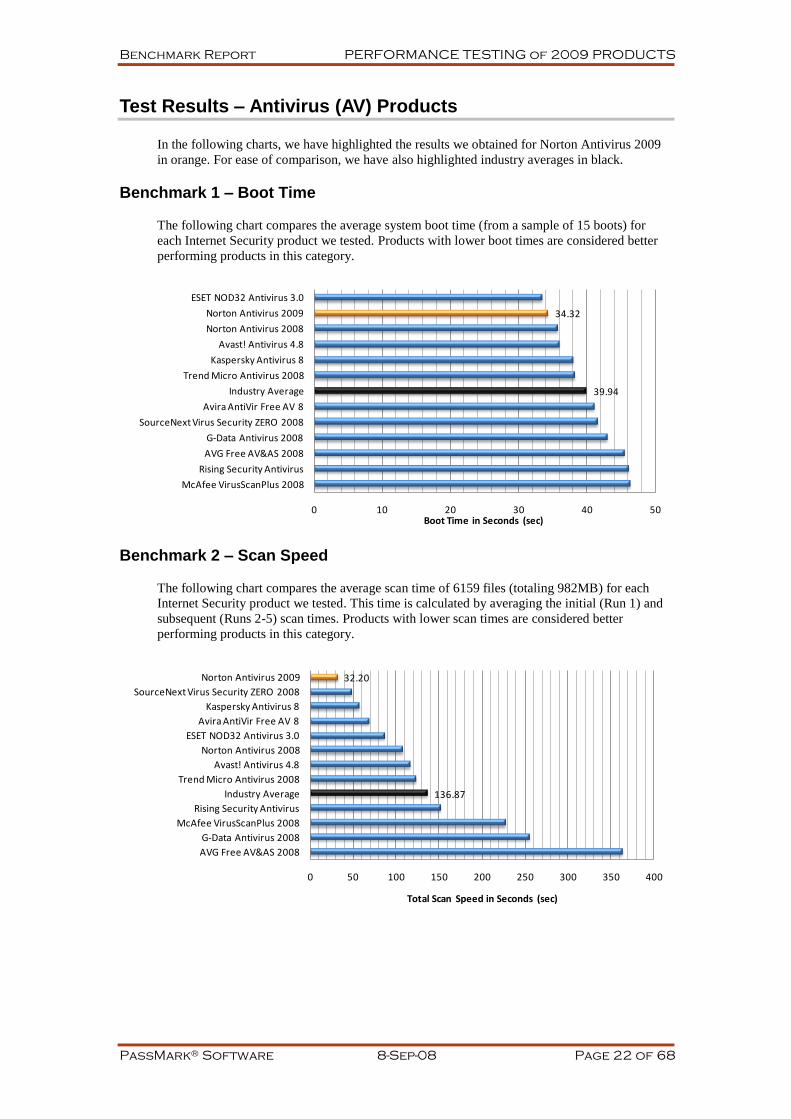
Test Results – Antivirus (AV) Products
In the following charts, we have highlighted the results we obtained for Norton Antivirus 2009
in orange. For ease of comparison, we have also highlighted industry averages in black.
Benchmark 1 – Boot Time
The following chart compares the average system boot time (from a sample of 15 boots) for
each Internet Security product we tested. Products with lower boot times are considered better
performing products in this category.
Benchmark 2 – Scan Speed
The following chart compares the average scan time of 6159 files (totaling 982MB) for each
Internet Security product we tested. This time is calculated by averaging the initial (Run 1) and
subsequent (Runs 2-5) scan times. Products with lower scan times are considered better
performing products in this category.
39.94
34.32
0 10 20 30 40 50
McAfee VirusScanPlus 2008
Rising Security Antivirus
AVG Free AV&AS 2008
G-Data Antivirus 2008
SourceNext Virus Security ZERO 2008
Avira AntiVir Free AV 8
Industry Average
Trend Micro Antivirus 2008
Kaspersky Antivirus 8
Avast! Antivirus 4.8
Norton Antivirus 2008
Norton Antivirus 2009
ESET NOD32 Antivirus 3.0
Boot Time in Seconds (sec)
136.87
32.20
0 50 100 150 200 250 300 350 400
AVG Free AV&AS 2008
G-Data Antivirus 2008
McAfee VirusScanPlus 2008
Rising Security Antivirus
Industry Average
Trend Micro Antivirus 2008
Avast! Antivirus 4.8
Norton Antivirus 2008
ESET NOD32 Antivirus 3.0
Avira AntiVir Free AV 8
Kaspersky Antivirus 8
SourceNext Virus Security ZERO 2008
Norton Antivirus 2009
Total Scan Speed in Seconds (sec)
Benchmark Report PERFORMANCE TESTING of 2009 PRODUCTS
PassMark® Software 8-Sep-08 Page 23 of 68
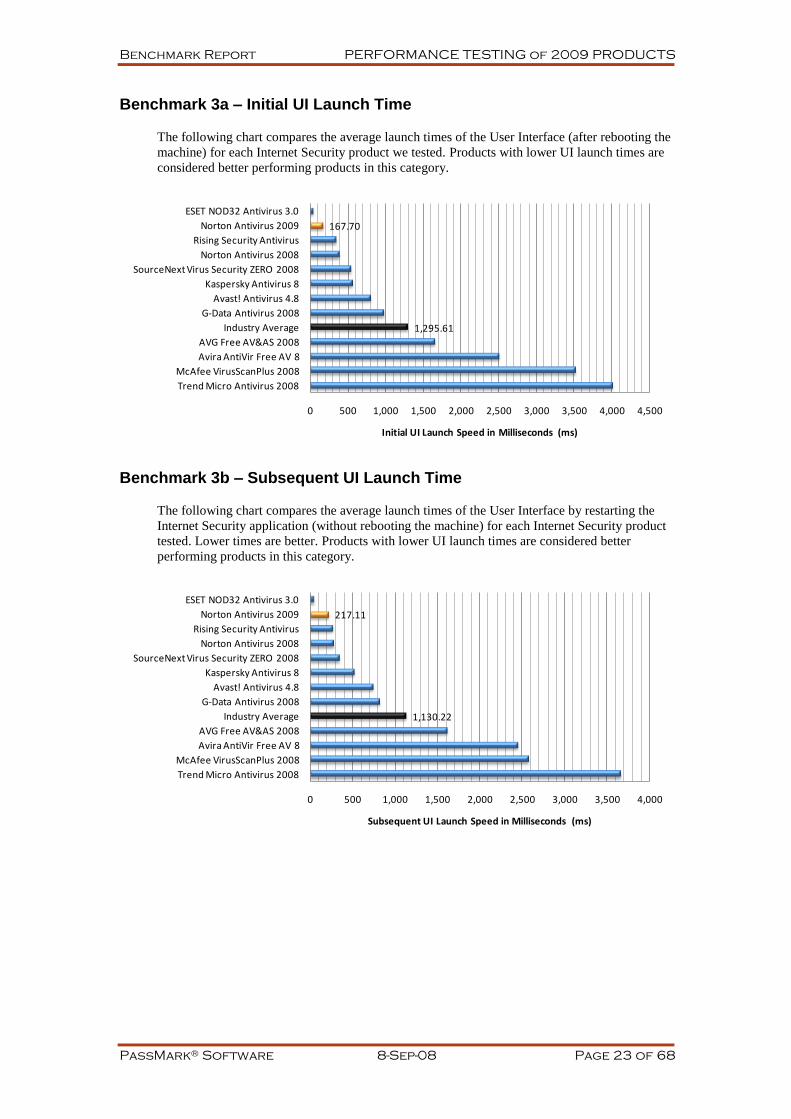
Benchmark 3a – Initial UI Launch Time
The following chart compares the average launch times of the User Interface (after rebooting the
machine) for each Internet Security product we tested. Products with lower UI launch times are
considered better performing products in this category.
Benchmark 3b – Subsequent UI Launch Time
The following chart compares the average launch times of the User Interface by restarting the
Internet Security application (without rebooting the machine) for each Internet Security product
tested. Lower times are better. Products with lower UI launch times are considered better
performing products in this category.
1,295.61
167.70
0 500 1,000 1,500 2,000 2,500 3,000 3,500 4,000 4,500
Trend Micro Antivirus 2008
McAfee VirusScanPlus 2008
Avira AntiVir Free AV 8
AVG Free AV&AS 2008
Industry Average
G-Data Antivirus 2008
Avast! Antivirus 4.8
Kaspersky Antivirus 8
SourceNext Virus Security ZERO 2008
Norton Antivirus 2008
Rising Security Antivirus
Norton Antivirus 2009
ESET NOD32 Antivirus 3.0
Initial UI Launch Speed in Milliseconds (ms)
1,130.22
217.11
0 500 1,000 1,500 2,000 2,500 3,000 3,500 4,000
Trend Micro Antivirus 2008
McAfee VirusScanPlus 2008
Avira AntiVir Free AV 8
AVG Free AV&AS 2008
Industry Average
G-Data Antivirus 2008
Avast! Antivirus 4.8
Kaspersky Antivirus 8
SourceNext Virus Security ZERO 2008
Norton Antivirus 2008
Rising Security Antivirus
Norton Antivirus 2009
ESET NOD32 Antivirus 3.0
Subsequent UI Launch Speed in Milliseconds (ms)
Benchmark Report PERFORMANCE TESTING of 2009 PRODUCTS
PassMark® Software 8-Sep-08 Page 24 of 68
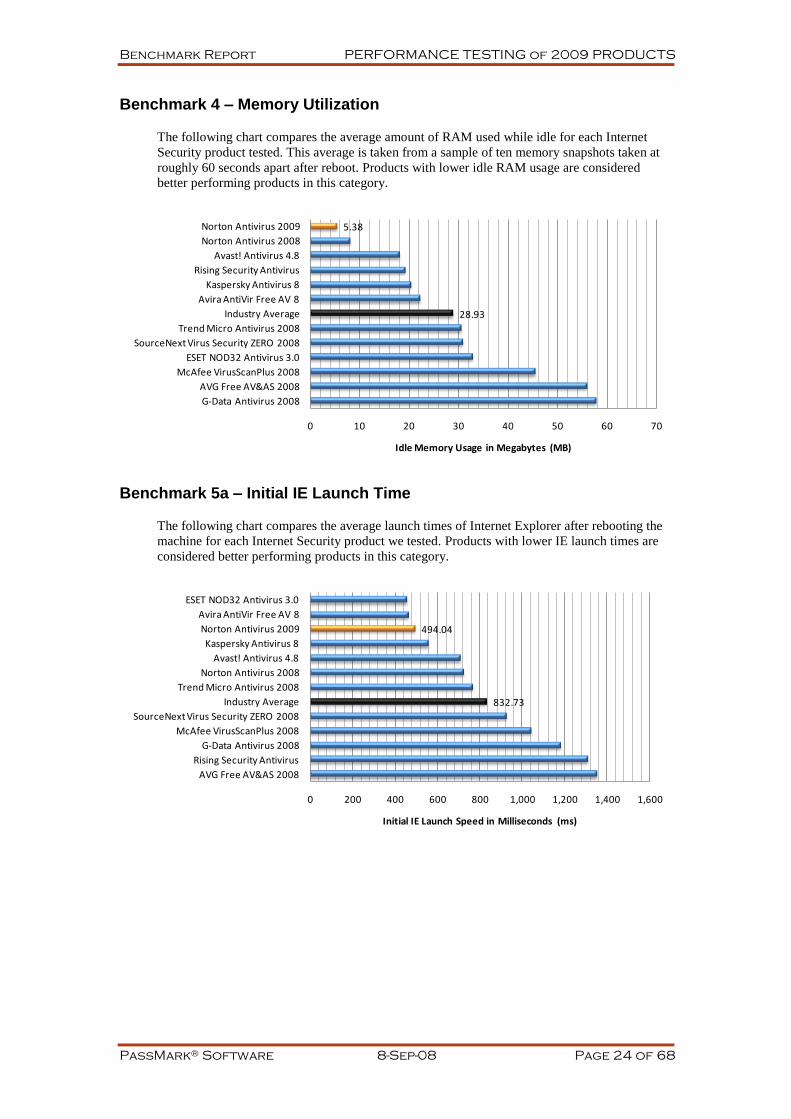
Benchmark 4 – Memory Utilization
The following chart compares the average amount of RAM used while idle for each Internet
Security product tested. This average is taken from a sample of ten memory snapshots taken at
roughly 60 seconds apart after reboot. Products with lower idle RAM usage are considered
better performing products in this category.
Benchmark 5a – Initial IE Launch Time
The following chart compares the average launch times of Internet Explorer after rebooting the
machine for each Internet Security product we tested. Products with lower IE launch times are
considered better performing products in this category.
28.93
5.38
0 10 20 30 40 50 60 70
G-Data Antivirus 2008
AVG Free AV&AS 2008
McAfee VirusScanPlus 2008
ESET NOD32 Antivirus 3.0
SourceNext Virus Security ZERO 2008
Trend Micro Antivirus 2008
Industry Average
Avira AntiVir Free AV 8
Kaspersky Antivirus 8
Rising Security Antivirus
Avast! Antivirus 4.8
Norton Antivirus 2008
Norton Antivirus 2009
Idle Memory Usage in Megabytes (MB)
832.73
494.04
0 200 400 600 800 1,000 1,200 1,400 1,600
AVG Free AV&AS 2008
Rising Security Antivirus
G-Data Antivirus 2008
McAfee VirusScanPlus 2008
SourceNext Virus Security ZERO 2008
Industry Average
Trend Micro Antivirus 2008
Norton Antivirus 2008
Avast! Antivirus 4.8
Kaspersky Antivirus 8
Norton Antivirus 2009
Avira AntiVir Free AV 8
ESET NOD32 Antivirus 3.0
Initial IE Launch Speed in Milliseconds (ms)

Benchmark Report PERFORMANCE TESTING of 2009 PRODUCTS
PassMark® Software 8-Sep-08 Page 25 of 68
Benchmark 5b – Subsequent IE Launch Time
The following chart compares the average launch times of Internet Explorer after application
restart (without rebooting the machine) for each Internet Security product we tested. Products
with lower IE launch times are considered better performing products in this category.
Benchmark 6 – Installation Time
The following chart compares the minimum installation time it takes for Internet Security
products to be fully functional and ready for use by the end user. Products with lower
installation times are considered better performing products in this category.
445.20
403.73
0 200 400 600 800 1,000 1,200
AVG Free AV&AS 2008
McAfee VirusScanPlus 2008
Trend Micro Antivirus 2008
Industry Average
G-Data Antivirus 2008
SourceNext Virus Security ZERO 2008
Norton Antivirus 2009
Norton Antivirus 2008
Kaspersky Antivirus 8
Avast! Antivirus 4.8
ESET NOD32 Antivirus 3.0
Rising Security Antivirus
Avira AntiVir Free AV 8
Subsequent IE Launch Speed in Milliseconds (ms)
132.35
47.27
0 50 100 150 200 250 300 350 400
McAfee VirusScanPlus 2008
Norton Antivirus 2008
G-Data Antivirus 2008
Kaspersky Antivirus 8
Rising Security Antivirus
Industry Average
SourceNext Virus Security ZERO 2008
Avast! Antivirus 4.8
Trend Micro Antivirus 2008
AVG Free AV&AS 2008
ESET NOD32 Antivirus 3.0
Norton Antivirus 2009
Avira AntiVir Free AV 8
Installation Time in Seconds (sec)
Benchmark Report PERFORMANCE TESTING of 2009 PRODUCTS
PassMark® Software 8-Sep-08 Page 26 of 68
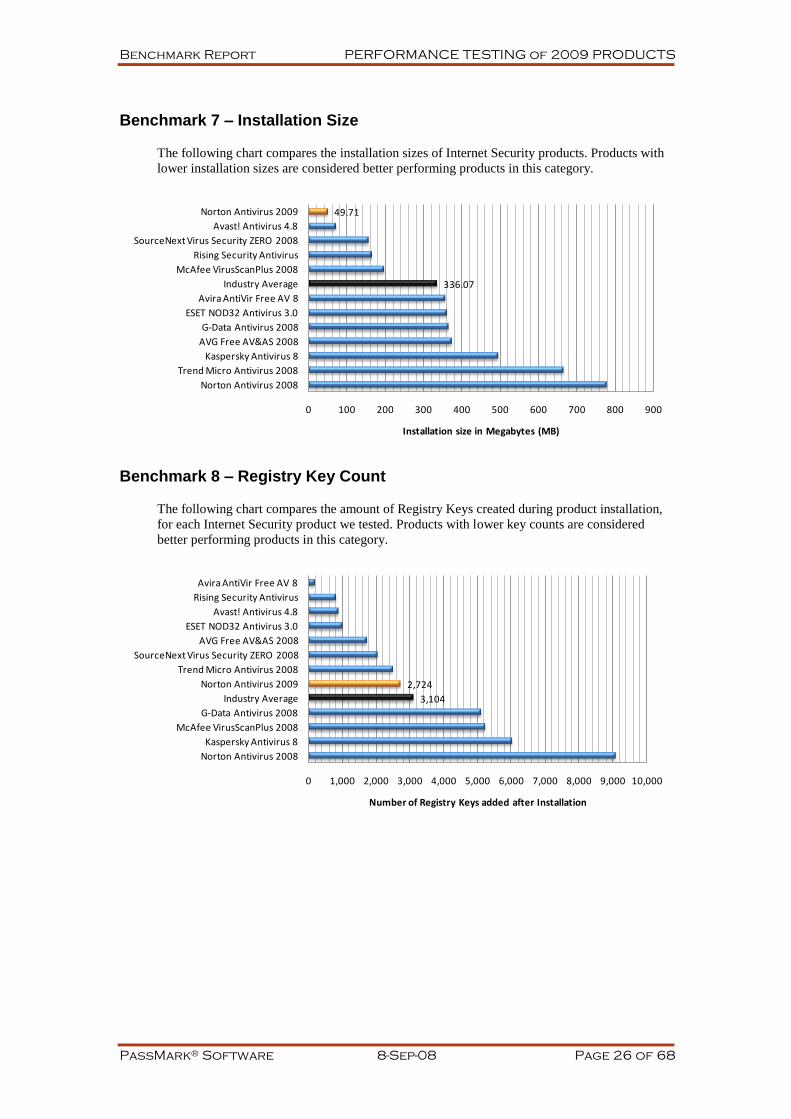
Benchmark 7 – Installation Size
The following chart compares the installation sizes of Internet Security products. Products with
lower installation sizes are considered better performing products in this category.
Benchmark 8 – Registry Key Count
The following chart compares the amount of Registry Keys created during product installation,
for each Internet Security product we tested. Products with lower key counts are considered
better performing products in this category.
336.07
49.71
0 100 200 300 400 500 600 700 800 900
Norton Antivirus 2008
Trend Micro Antivirus 2008
Kaspersky Antivirus 8
AVG Free AV&AS 2008
G-Data Antivirus 2008
ESET NOD32 Antivirus 3.0
Avira AntiVir Free AV 8
Industry Average
McAfee VirusScanPlus 2008
Rising Security Antivirus
SourceNext Virus Security ZERO 2008
Avast! Antivirus 4.8
Norton Antivirus 2009
Installation size in Megabytes (MB)
3,104
2,724
0 1,000 2,000 3,000 4,000 5,000 6,000 7,000 8,000 9,000 10,000
Norton Antivirus 2008
Kaspersky Antivirus 8
McAfee VirusScanPlus 2008
G-Data Antivirus 2008
Industry Average
Norton Antivirus 2009
Trend Micro Antivirus 2008
SourceNext Virus Security ZERO 2008
AVG Free AV&AS 2008
ESET NOD32 Antivirus 3.0
Avast! Antivirus 4.8
Rising Security Antivirus
Avira AntiVir Free AV 8
Number of Registry Keys added after Installation

Benchmark Report PERFORMANCE TESTING of 2009 PRODUCTS
PassMark® Software 8-Sep-08 Page 27 of 68
Benchmark 9 – File Copy, Move and Delete
The following chart compares the average speed of file copying, moving and deleting for each
Internet Security product we tested. Products with lower times are considered better performing
products in this category.
Benchmark 10 – Installation of Third Party Applications
The following chart compares the average speed of installation of third party applications for
each Internet Security product we tested. Products with lower times are considered better
performing products in this category.
77.43
68.27
0 10 20 30 40 50 60 70 80 90
G-Data Antivirus 2008
AVG Free AV&AS 2008
Norton Antivirus 2009
McAfee VirusScanPlus 2008
Norton Antivirus 2008
SourceNext Virus Security ZERO 2008
Industry Average
Trend Micro Antivirus 2008
Rising Security Antivirus
Avira AntiVir Free AV 8
Avast! Antivirus 4.8
Kaspersky Antivirus 8
ESET NOD32 Antivirus 3.0
File Copy, Move and Delete - Time in Seconds (sec)
50.94
47.50
0 10 20 30 40 50 60 70 80
Trend Micro Antivirus 2008
SourceNext Virus Security ZERO 2008
G-Data Antivirus 2008
Kaspersky Antivirus 8
Industry Average
McAfee VirusScanPlus 2008
Avast! Antivirus 4.8
Norton Antivirus 2009
AVG Free AV&AS 2008
ESET NOD32 Antivirus 3.0
Norton Antivirus 2008
Rising Security Antivirus
Avira AntiVir Free AV 8
Third Party Program Installation - Time in Seconds (sec)
Benchmark Report PERFORMANCE TESTING of 2009 PRODUCTS
PassMark® Software 8-Sep-08 Page 28 of 68
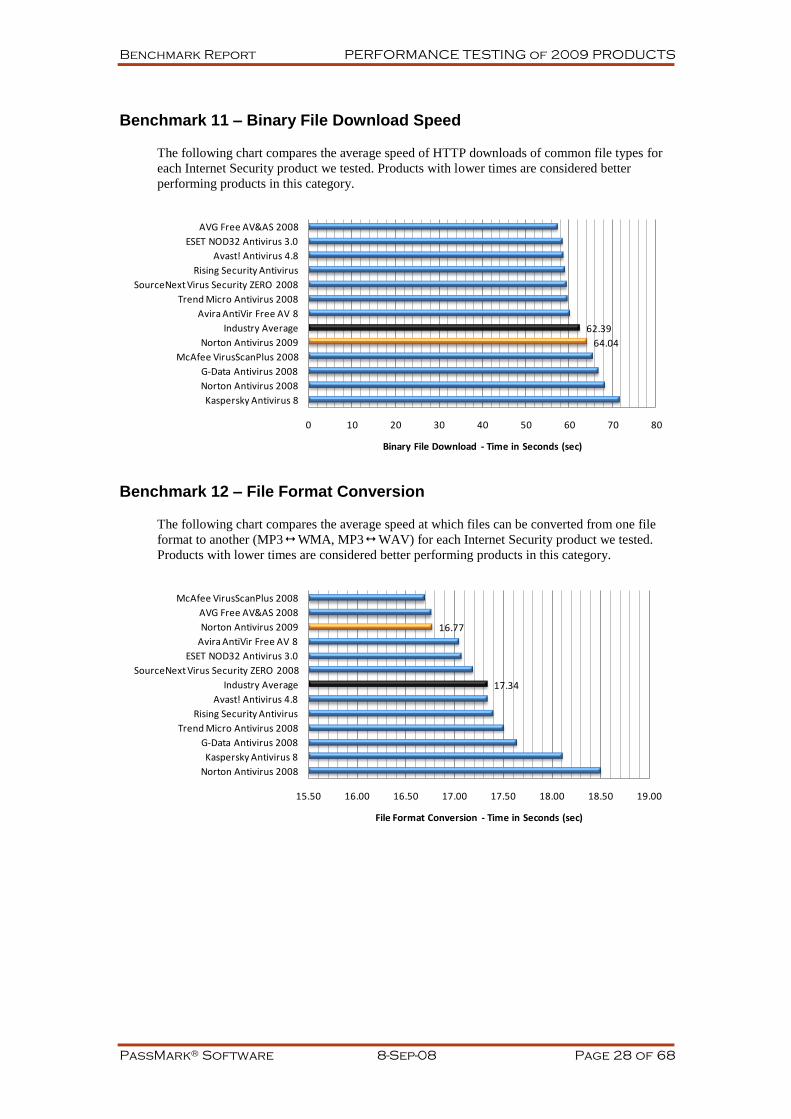
Benchmark 11 – Binary File Download Speed
The following chart compares the average speed of HTTP downloads of common file types for
each Internet Security product we tested. Products with lower times are considered better
performing products in this category.
Benchmark 12 – File Format Conversion
The following chart compares the average speed at which files can be converted from one file
format to another (MP3 WMA, MP3 WAV) for each Internet Security product we tested.
Products with lower times are considered better performing products in this category.
64.04
62.39
0 10 20 30 40 50 60 70 80
Kaspersky Antivirus 8
Norton Antivirus 2008
G-Data Antivirus 2008
McAfee VirusScanPlus 2008
Norton Antivirus 2009
Industry Average
Avira AntiVir Free AV 8
Trend Micro Antivirus 2008
SourceNext Virus Security ZERO 2008
Rising Security Antivirus
Avast! Antivirus 4.8
ESET NOD32 Antivirus 3.0
AVG Free AV&AS 2008
Binary File Download - Time in Seconds (sec)
17.34
16.77
15.50 16.00 16.50 17.00 17.50 18.00 18.50 19.00
Norton Antivirus 2008
Kaspersky Antivirus 8
G-Data Antivirus 2008
Trend Micro Antivirus 2008
Rising Security Antivirus
Avast! Antivirus 4.8
Industry Average
SourceNext Virus Security ZERO 2008
ESET NOD32 Antivirus 3.0
Avira AntiVir Free AV 8
Norton Antivirus 2009
AVG Free AV&AS 2008
McAfee VirusScanPlus 2008
File Format Conversion - Time in Seconds (sec)
Benchmark Report PERFORMANCE TESTING of 2009 PRODUCTS
PassMark® Software 8-Sep-08 Page 29 of 68
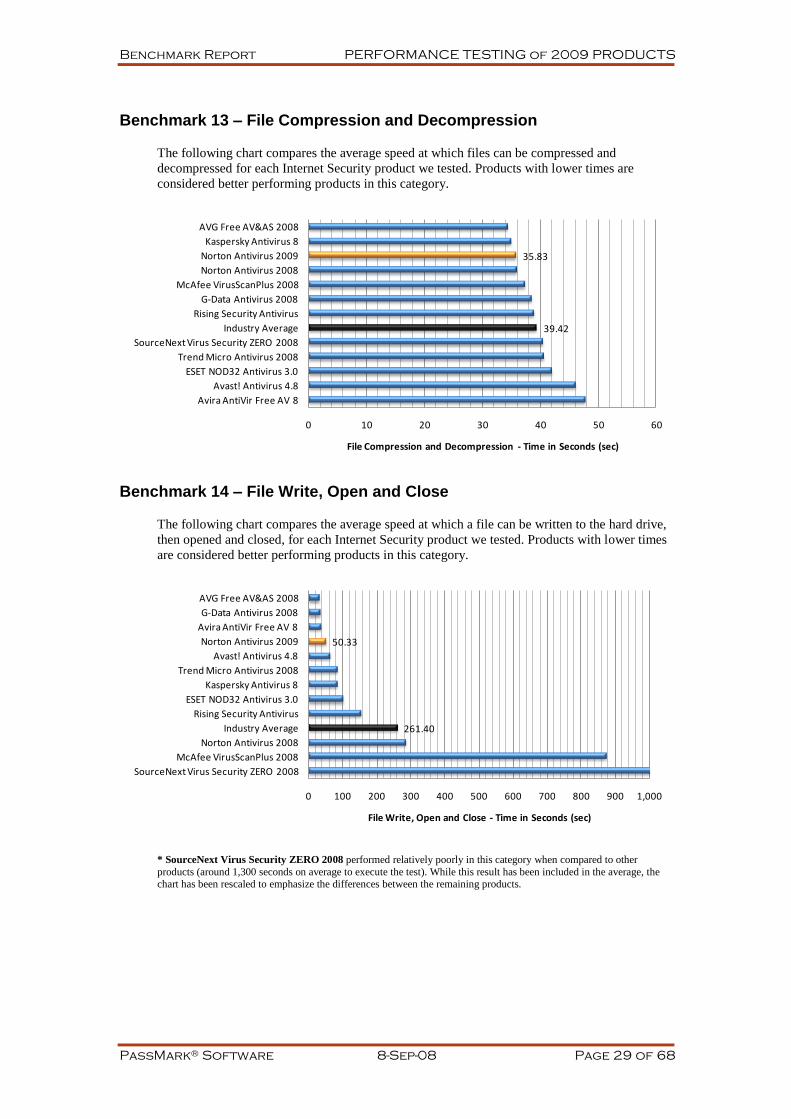
Benchmark 13 – File Compression and Decompression
The following chart compares the average speed at which files can be compressed and
decompressed for each Internet Security product we tested. Products with lower times are
considered better performing products in this category.
Benchmark 14 – File Write, Open and Close
The following chart compares the average speed at which a file can be written to the hard drive,
then opened and closed, for each Internet Security product we tested. Products with lower times
are considered better performing products in this category.
* SourceNext Virus Security ZERO 2008 performed relatively poorly in this category when compared to other
products (around 1,300 seconds on average to execute the test). While this result has been included in the average, the chart has been rescaled to emphasize the differences between the remaining products.
39.42
35.83
0 10 20 30 40 50 60
Avira AntiVir Free AV 8
Avast! Antivirus 4.8
ESET NOD32 Antivirus 3.0
Trend Micro Antivirus 2008
SourceNext Virus Security ZERO 2008
Industry Average
Rising Security Antivirus
G-Data Antivirus 2008
McAfee VirusScanPlus 2008
Norton Antivirus 2008
Norton Antivirus 2009
Kaspersky Antivirus 8
AVG Free AV&AS 2008
File Compression and Decompression - Time in Seconds (sec)
261.40
50.33
0 100 200 300 400 500 600 700 800 900 1,000
SourceNext Virus Security ZERO 2008
McAfee VirusScanPlus 2008
Norton Antivirus 2008
Industry Average
Rising Security Antivirus
ESET NOD32 Antivirus 3.0
Kaspersky Antivirus 8
Trend Micro Antivirus 2008
Avast! Antivirus 4.8
Norton Antivirus 2009
Avira AntiVir Free AV 8
G-Data Antivirus 2008
AVG Free AV&AS 2008
File Write, Open and Close - Time in Seconds (sec)
Benchmark Report PERFORMANCE TESTING of 2009 PRODUCTS
PassMark® Software 8-Sep-08 Page 30 of 68
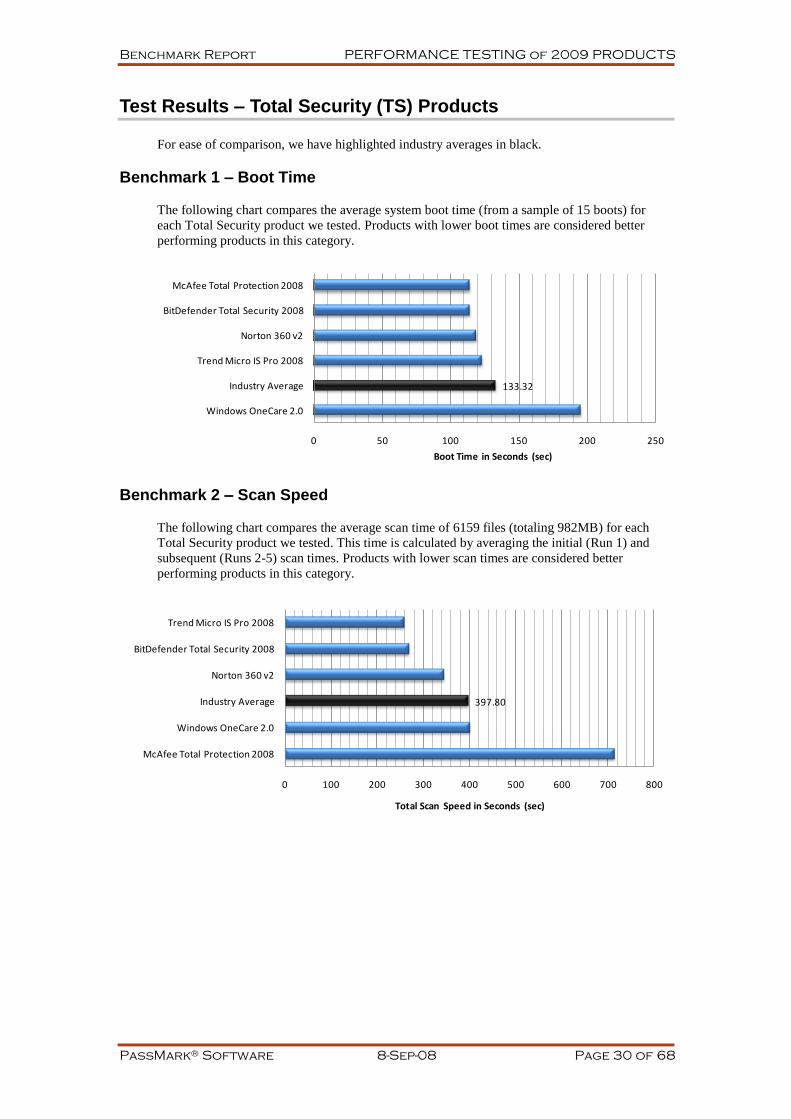
Test Results – Total Security (TS) Products
For ease of comparison, we have highlighted industry averages in black.
Benchmark 1 – Boot Time
The following chart compares the average system boot time (from a sample of 15 boots) for
each Total Security product we tested. Products with lower boot times are considered better
performing products in this category.
Benchmark 2 – Scan Speed
The following chart compares the average scan time of 6159 files (totaling 982MB) for each
Total Security product we tested. This time is calculated by averaging the initial (Run 1) and
subsequent (Runs 2-5) scan times. Products with lower scan times are considered better
performing products in this category.
133.32
0 50 100 150 200 250
Windows OneCare 2.0
Industry Average
Trend Micro IS Pro 2008
Norton 360 v2
BitDefender Total Security 2008
McAfee Total Protection 2008
Boot Time in Seconds (sec)
397.80
0 100 200 300 400 500 600 700 800
McAfee Total Protection 2008
Windows OneCare 2.0
Industry Average
Norton 360 v2
BitDefender Total Security 2008
Trend Micro IS Pro 2008
Total Scan Speed in Seconds (sec)

Benchmark Report PERFORMANCE TESTING of 2009 PRODUCTS
PassMark® Software 8-Sep-08 Page 31 of 68
Benchmark 3a – Initial UI Launch Time
The following chart compares the average launch times of the User Interface (after rebooting the
machine) for each Total Security product we tested. Products with lower UI launch times are
considered better performing products in this category.
Benchmark 3b – Subsequent UI Launch Time
The following chart compares the average launch times of the User Interface by restarting the
Total Security application (without rebooting the machine) for each Total Security product
tested. Lower times are better. Products with lower UI launch times are considered better
performing products in this category.
5,510.65
0 2,000 4,000 6,000 8,000 10,000 12,000
Windows OneCare 2.0
McAfee Total Protection 2008
Industry Average
Trend Micro IS Pro 2008
Norton 360 v2
BitDefender Total Security 2008
Initial UI Launch Speed in Milliseconds (ms)
2,390.70
0 500 1,000 1,500 2,000 2,500 3,000 3,500 4,000
Trend Micro IS Pro 2008
McAfee Total Protection 2008
Industry Average
Windows OneCare 2.0
Norton 360 v2
BitDefender Total Security 2008
Subsequent UI Launch Speed in Milliseconds (ms)
Benchmark Report PERFORMANCE TESTING of 2009 PRODUCTS
PassMark® Software 8-Sep-08 Page 32 of 68
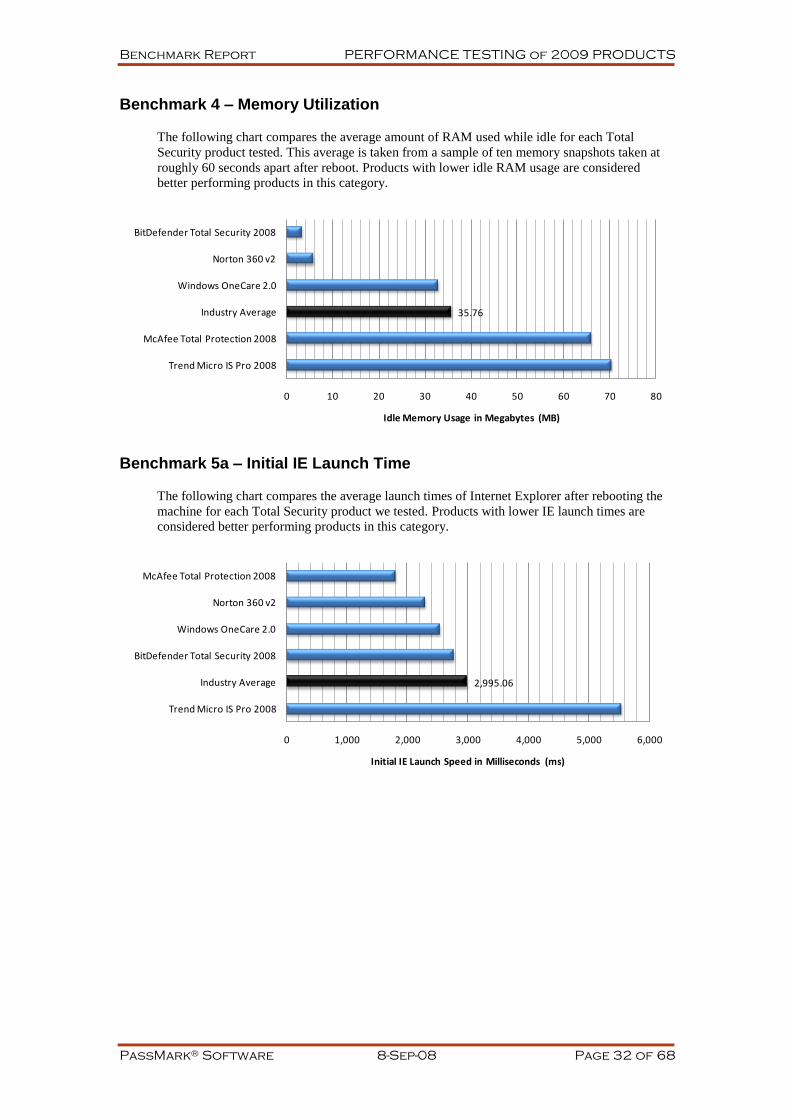
Benchmark 4 – Memory Utilization
The following chart compares the average amount of RAM used while idle for each Total
Security product tested. This average is taken from a sample of ten memory snapshots taken at
roughly 60 seconds apart after reboot. Products with lower idle RAM usage are considered
better performing products in this category.
Benchmark 5a – Initial IE Launch Time
The following chart compares the average launch times of Internet Explorer after rebooting the
machine for each Total Security product we tested. Products with lower IE launch times are
considered better performing products in this category.
35.76
0 10 20 30 40 50 60 70 80
Trend Micro IS Pro 2008
McAfee Total Protection 2008
Industry Average
Windows OneCare 2.0
Norton 360 v2
BitDefender Total Security 2008
Idle Memory Usage in Megabytes (MB)
2,995.06
0 1,000 2,000 3,000 4,000 5,000 6,000
Trend Micro IS Pro 2008
Industry Average
BitDefender Total Security 2008
Windows OneCare 2.0
Norton 360 v2
McAfee Total Protection 2008
Initial IE Launch Speed in Milliseconds (ms)

Benchmark Report PERFORMANCE TESTING of 2009 PRODUCTS
PassMark® Software 8-Sep-08 Page 33 of 68
Benchmark 5b – Subsequent IE Launch Time
The following chart compares the average launch times of Internet Explorer after application
restart (without rebooting the machine) for each Total Security product we tested. Products with
lower IE launch times are considered better performing products in this category.
Benchmark 6 – Installation Time
The following chart compares the minimum installation time it takes for Total Security products
to be fully functional and ready for use by the end user. Products with lower installation times
are considered better performing products in this category.
873.17
0 200 400 600 800 1,000 1,200 1,400 1,600
Trend Micro IS Pro 2008
Norton 360 v2
Industry Average
McAfee Total Protection 2008
BitDefender Total Security 2008
Windows OneCare 2.0
Subsequent IE Launch Speed in Milliseconds (ms)
270.00
0 50 100 150 200 250 300 350 400 450
Norton 360 v2
Windows OneCare 2.0
Industry Average
McAfee Total Protection 2008
Trend Micro IS Pro 2008
BitDefender Total Security 2008
Installation Time in Seconds (sec)

Benchmark Report PERFORMANCE TESTING of 2009 PRODUCTS
PassMark® Software 8-Sep-08 Page 34 of 68
Benchmark 7 – Installation Size
The following chart compares the installation sizes of Total Security products. Products with
lower installation sizes are considered better performing products in this category.
Benchmark 8 – Registry Key Count
The following chart compares the amount of Registry Keys created during product installation,
for each Total Security product we tested. Products with lower key counts are considered better
performing products in this category.
354.34
0 100 200 300 400 500 600 700 800
Norton 360 v2
Industry Average
Trend Micro IS Pro 2008
McAfee Total Protection 2008
Windows OneCare 2.0
BitDefender Total Security 2008
Installation size in Megabytes (MB)
6,989
0 2,000 4,000 6,000 8,000 10,000 12,000 14,000
Norton 360 v2
McAfee Total Protection 2008
Industry Average
Trend Micro IS Pro 2008
BitDefender Total Security 2008
Windows OneCare 2.0
Number of Registry Keys added after Installation
Benchmark Report PERFORMANCE TESTING of 2009 PRODUCTS
PassMark® Software 8-Sep-08 Page 35 of 68
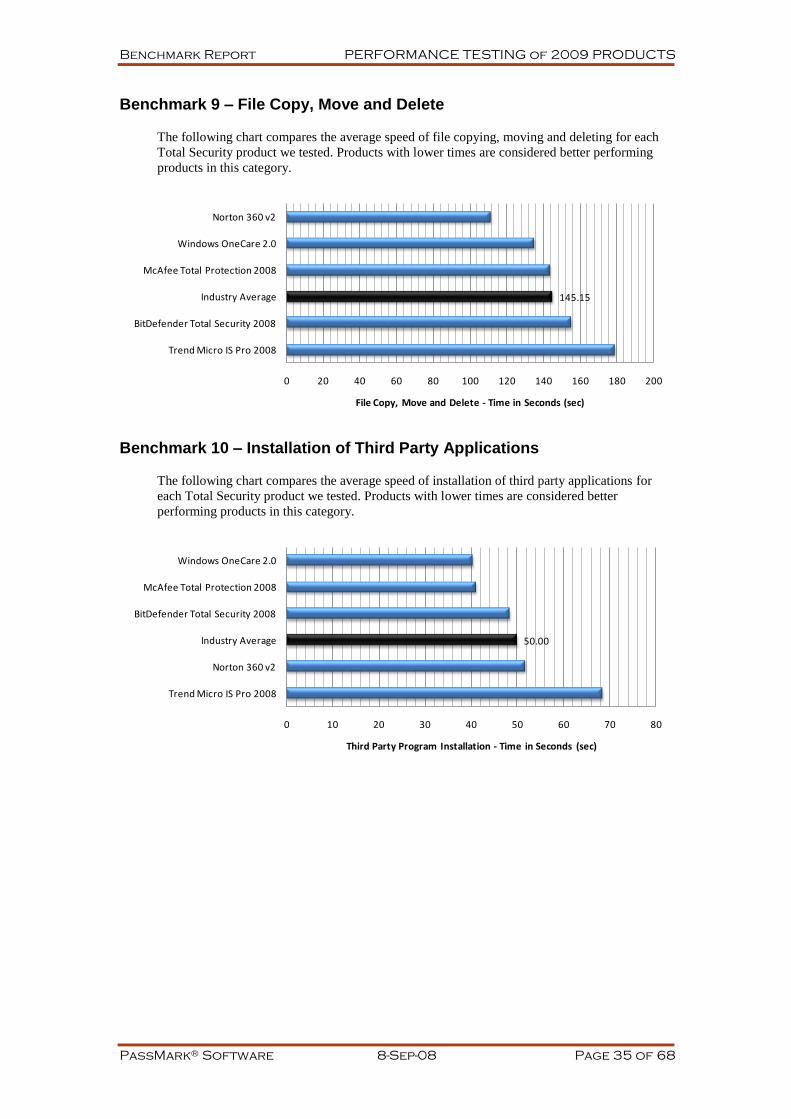
Benchmark 9 – File Copy, Move and Delete
The following chart compares the average speed of file copying, moving and deleting for each
Total Security product we tested. Products with lower times are considered better performing
products in this category.
Benchmark 10 – Installation of Third Party Applications
The following chart compares the average speed of installation of third party applications for
each Total Security product we tested. Products with lower times are considered better
performing products in this category.
145.15
0 20 40 60 80 100 120 140 160 180 200
Trend Micro IS Pro 2008
BitDefender Total Security 2008
Industry Average
McAfee Total Protection 2008
Windows OneCare 2.0
Norton 360 v2
File Copy, Move and Delete - Time in Seconds (sec)
50.00
0 10 20 30 40 50 60 70 80
Trend Micro IS Pro 2008
Norton 360 v2
Industry Average
BitDefender Total Security 2008
McAfee Total Protection 2008
Windows OneCare 2.0
Third Party Program Installation - Time in Seconds (sec)

Benchmark Report PERFORMANCE TESTING of 2009 PRODUCTS
PassMark® Software 8-Sep-08 Page 36 of 68
Benchmark 11 – Binary File Download Speed
The following chart compares the average speed of HTTP downloads of common file types for
each Total Security product we tested. Products with lower times are considered better
performing products in this category.
Benchmark 12 – File Format Conversion
The following chart compares the average speed at which files can be converted from one file
format to another (MP3 WMA, MP3 WAV) for each Total Security product we tested.
Products with lower times are considered better performing products in this category.
102.04
0 20 40 60 80 100 120
Trend Micro IS Pro 2008
Norton 360 v2
Industry Average
BitDefender Total Security 2008
Windows OneCare 2.0
McAfee Total Protection 2008
Binary File Download - Time in Seconds (sec)
30.20
26.00 27.00 28.00 29.00 30.00 31.00 32.00 33.00
Norton 360 v2
Trend Micro IS Pro 2008
Industry Average
Windows OneCare 2.0
BitDefender Total Security 2008
McAfee Total Protection 2008
File Format Conversion - Time in Seconds (sec)
Benchmark Report PERFORMANCE TESTING of 2009 PRODUCTS
PassMark® Software 8-Sep-08 Page 37 of 68
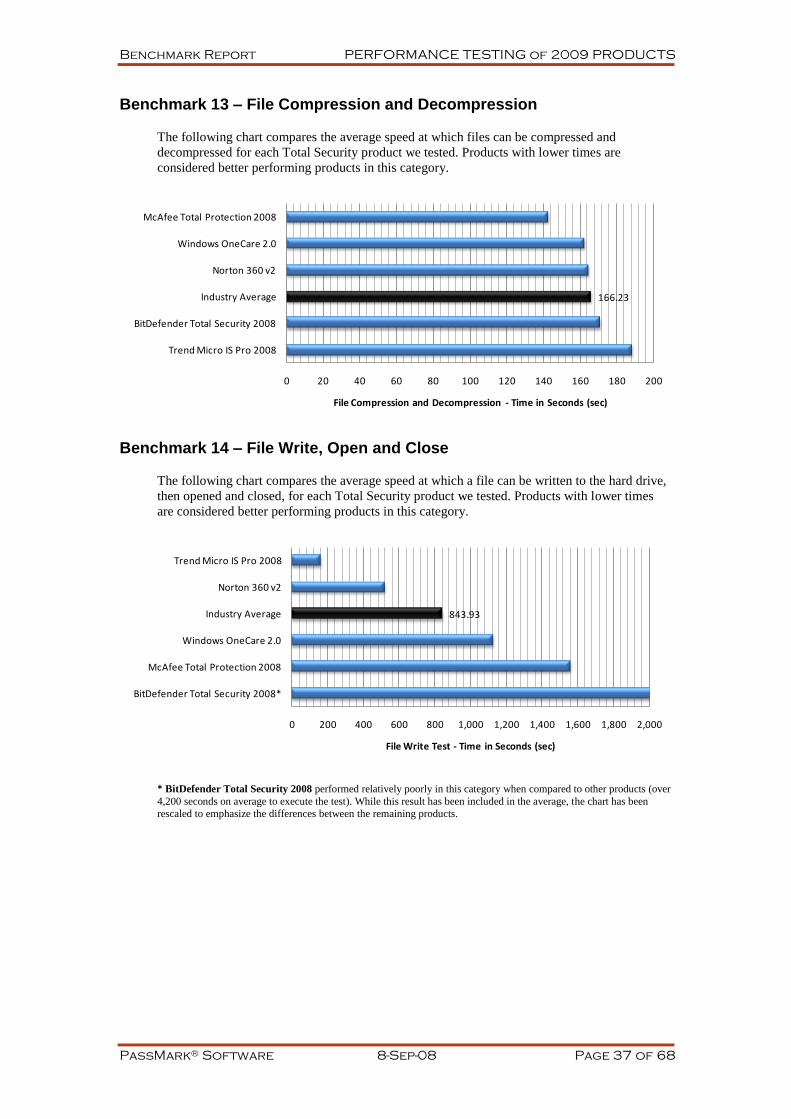
Benchmark 13 – File Compression and Decompression
The following chart compares the average speed at which files can be compressed and
decompressed for each Total Security product we tested. Products with lower times are
considered better performing products in this category.
Benchmark 14 – File Write, Open and Close
The following chart compares the average speed at which a file can be written to the hard drive,
then opened and closed, for each Total Security product we tested. Products with lower times
are considered better performing products in this category.
* BitDefender Total Security 2008 performed relatively poorly in this category when compared to other products (over
4,200 seconds on average to execute the test). While this result has been included in the average, the chart has been
rescaled to emphasize the differences between the remaining products.
166.23
0 20 40 60 80 100 120 140 160 180 200
Trend Micro IS Pro 2008
BitDefender Total Security 2008
Industry Average
Norton 360 v2
Windows OneCare 2.0
McAfee Total Protection 2008
File Compression and Decompression - Time in Seconds (sec)
843.93
0 200 400 600 800 1,000 1,200 1,400 1,600 1,800 2,000
BitDefender Total Security 2008*
McAfee Total Protection 2008
Windows OneCare 2.0
Industry Average
Norton 360 v2
Trend Micro IS Pro 2008
File Write Test - Time in Seconds (sec)

Benchmark Report PERFORMANCE TESTING of 2009 PRODUCTS
PassMark® Software 8-Sep-08 Page 38 of 68
What this report doesn’t cover
This report focused on performance measurements such as execution speed and resource usage.
No attempt was made to measure the effectiveness of threat detection, as this aspect of the
products is covered by other industry benchmarks such as Virus Bulletin
(http://www.virusbtn.com) and AV Comparatives (http://www.av-comparatives.org).
The metrics used for this report cover a number of key performance areas and are metrics that
can be replicated and reproduced by third parties, if required.
However there are a number of areas that this report doesn‟t attempt to cover. These areas
include:
CPU usage during local file scanning.
Impact on multitasking foreground tasks while scanning is in progress in the background.
RAM usage during scanning.
Impact on shutdown and hibernation times.
The time a product takes to uninstall.
“Out-of-the-box” virus signature update times.
Impact on e-mail receiving and sending times.
Speed of the products UI when performing common tasks.
Impact on system stability.
Testing on 64-bit operating systems with 64-bit hardware.
Some of these items are subjective and/or not easily measured, others such as signature update
times are likely to change from one week to the next.
It might be of interest to revisit this list during any future tests with a view to adding additional
metrics.
Benchmark Report PERFORMANCE TESTING of 2009 PRODUCTS
PassMark® Software 8-Sep-08 Page 39 of 68
Disclaimer & Disclosure
This report only covers versions of products that were available as at 5 September 2008. The
products we have tested are not an exhaustive list of all products available in these very
competitive product categories.
Disclaimer of Liability
While every effort has been made to ensure that the information presented in this report is
accurate, PassMark Software Pty Ltd assumes no responsibility for errors, omissions, or out-of-
date information and shall not be liable in any manner whatsoever for direct, indirect, incidental,
consequential, or punitive damages resulting from the availability of, use of, access of, or
inability to use this information.
Disclosure
Symantec Corporation funded the production of this report and supplied some of the test scripts
used for the tests (See Appendix 1 – Test method – How did we conduct these tests? below).
Trademarks
All trademarks are the property of their respective owners.
Contact details & more information
PassMark Software Pty Ltd
Suite 202, Level 2
35 Buckingham St.
Surry Hills, 2010
Sydney, Australia
Phone + 61 2 9690 0444
Fax + 61 2 9690 0445
Web www.passmark.com
Download Link
An electronic copy of this report can be found at the following location:
http://www.passmark.com/ftp/antivirus_09-performance-testing-ed1.pdf
Benchmark Report PERFORMANCE TESTING of 2009 PRODUCTS
PassMark® Software 8-Sep-08 Page 40 of 68
Appendix 1 – Test method – How did we conduct these tests?
Common methodology
Norton Ghost was used to create images of the O/S and these clean images were restored before
the test of each product.
Image creation steps
1. Install and activate Windows.
2. Download and install Windows Updates.
3. Disable Automatic Updates.
4. Turn off Windows security notifications.
5. Disable Windows Defender automatic scans to avoid unexpected background activity.
6. Close and disable "start at run" on the Vista sidebar to avoid some background activity.
7. Disable the Windows firewall.
8. Install Ghost.
9. Disable ghost taskbar icon from auto startup in msconfig.
10. Disable windows defender from startup in msconfig.
11. Optimize booting with ProcessIdleTasks (repeated several times).
12. Disable Vista admin prompts to allow for better test automation.
13. Reboot and tell msconfig not to start again.
14. Create image using Norton Ghost.
Benchmark 1 – Boot Time
The machines were rebooted in a cyclic manner. Averages of 15 boot times were taken for each
product on each machine. The start of the boot process was taken to be the end of the BIOS
initialization and the end of the boot process was taken to be when the CPU was idle for five
continuous seconds.
Windows has various functions to optimize the boot process. Therefore, it is important to force
optimization of the system before starting the test (with ProcessIdleTasks) and delete the
Windows pre-fetch folder.
Benchmark 2 – Total Scan Speed
The time it took for each product to scan a set of sample files. The sample used was identical in
all cases and contained a mixture of system files and Office files. In total there were 6159 files
whose combined size was 982MB. Most of these files come from the Windows system folders.
As the file types can influence the scan speed, the breakdown of the main file types, file
numbers and total sizes of the files in the sample set is given here.
.dll 2589 490MB
.exe 695 102MB
.sys 332 23MB
.gif 302 1MB
.doc 281 64MB
.wmf 185 2MB
.png 149 2MB
.html 126 1MB
.nls 80 6MB
.jpg 70 1MB
.ini 59 2MB
.ico 58 <1MB
.mof 43 6MB
.ax 39 4MB
.xls 38 3MB
.ime 35 5MB
.drv 31 1MB
.txt 31 1MB
.chm 30 6MB
.cpl 29 4MB
.mfl 29 3MB
.inf 26 2MB
.hlp 22 3MB
.imd 20 18MB
.py 20 <1MB
.msc 18 1MB
.vbs 18 1MB
.xml 18 1MB
.rtf 16 62MB
.ocx 16 4MB
.tsp 14 1MB
.com 14 <1MB
.xsl 14 <1MB
.h 13 <1MB
.vsd 12 2MB
.scr 12 2MB
.aw 12 2MB
.js 12 1MB
.zip 11 25MB
.lex 9 10MB
.ppt 9 4MB
.acm 9 1MB
.wav 7 5MB
Benchmark Report PERFORMANCE TESTING of 2009 PRODUCTS
PassMark® Software 8-Sep-08 Page 41 of 68
For each product, five samples were taken with the machine rebooted before each sample to
clear any caching effects. Our result is an average of these five samples.
Where possible, PerfScan++ was used to automate the testing process. Additionally, if possible,
the scan was run without launching the product‟s UI. Where it was not possible to use PerfScan
or the product‟s in-built scan speed timer, the samples were taken manually with a stopwatch.
For some of these products, we noticed a substantial difference between the initial scan speed
and subsequent scan speed, due to residual „caching‟ effects. We executed an additional Initial
Scan Speed test on the Vista machine for the Internet Security products that exhibited this
behavior. These products were Norton Internet Security beta 116, Kaspersky Internet Security
2009 and ESET Smart Security.
The Initial Speed test comprised of three to five samples taken after re-imaging to a clean disk
and newly installing each product (including a reboot). The average of these Initial Scan Speed
samples is taken as the initial scan result (i.e. Scan 1) and averaged with four subsequent scan
times to obtain the average Total Scan Speed result.
Benchmark 3 – UI Launch Speed
The launch speed of the product‟s user interface was tested using AppTimer. Each product was
tested for five sets of three launches, with a reboot before each set. When compiling the results
the first of each set was separated out so that there was a set of values for the initial launch after
reboot and a set for subsequent launches.
In some cases, AppTimer did not correctly record the time taken for UI launch. For instance,
some applications would open their window and look like they were ready, but then continued
to be unresponsive. Where this was noticeable the measurement was taken manually with a stop
watch.
Benchmark 4 – Memory Utilization
The Perflog++ utility was used to record process memory usage on the system at boot, and then
every minute for another fifteen minutes after. This was done only once per product and resulted
in a total of 15 samples. However the first sample taken at boot was never counted.
Because this recorded the memory usage of all processes, the products processes needed to be
identified before the results could be processed. For this a program called Sysinternals Process
Explorer was used to create a more detailed record of all the processes, with information such as
company name included. This was run immediately after Perflog finished.

Benchmark Report PERFORMANCE TESTING of 2009 PRODUCTS
PassMark® Software 8-Sep-08 Page 42 of 68
Benchmark 5 – IE Launch Speed
The launch speed of Internet Explorer interface was tested using AppTimer. This test was
practically identical to the UI launch test. Each product was tested for 5 sets of 3 launches, with
a reboot before each set. When compiling the results the first of each set was separated out so
that there was a set of values for the initial launch after reboot and a set for subsequent launches.
Benchmark 6 – Installation Time
This test measures the minimum Installation Time a product requires to be fully functional and
ready for use by the end user. Installation time can usually be divided in three major phases:
The Extraction and Setup phase (green) consists of file extraction, the EULA prompt,
product activation and user configurable options for installation.
The File Copy phase (yellow) occurs when the product is being installed; usually this phase
is indicated by a progress bar.
The Post-Installation phase (tan) is any part of the installation that occurs after the File
Copy phase. This phase varies widely between products; the time recorded in this phase may
include a required reboot to finalize the installation or include the time the program takes to
become idle in the system tray.
To reduce the impact of disk drive variables, each product was copied to the Desktop before
initializing installation. Each step of the installation process was manually timed with a
stopwatch and recorded in as much detail as possible. Where input was required by the end user,
the stopwatch was paused and the input noted in the raw results in parenthesis after the phase
description.
Where possible, all requests by products to pre-scan or post-install scan were declined or
skipped. Where it was not possible to skip a scan, the time to scan was included as part of the
installation time. Where an optional component of the installation formed a reasonable part of
the functionality of the software, it was also installed (e.g. website link checking software as
part of an IS).
Benchmark 7 – Installation Size
The installation size is defined as the difference between the snapshot of the Disk Space (C:
drive) before and after the product is installed on the system.
After copying the installation package to Desktop, a screen capture (Alt + Print Scrn) of the C:
drive properties showing the amount of Used Space was taken and saved to another drive. A
second screen capture was taken of the C: drive showing the amount of Used Space immediately
after a post-installation reboot. To obtain the installation size, we calculated the difference
between the Used Space totals shown in the two snapshots.
Benchmark 8 – Registry Key Count
This test measures the amount of keys and values added to registry, after rebooting the test
machine following a successful product installation. The test was conducted using
RegistryCounter.exe, an application which conducts a count of all keys, errors and values under
HKEY_LOCAL_MACHINE and HKEY_USERS.
Two Registry Key counts are taken, one prior to installation and a second immediately
following a reboot after installation. To obtain our result, we calculated the difference between
the two registry key totals

Benchmark Report PERFORMANCE TESTING of 2009 PRODUCTS
PassMark® Software 8-Sep-08 Page 43 of 68
Benchmarks 9-14 – Real-Time Performance
We used a single script in testing Benchmarks 10-15. The script first defragments the disk
volume (where defragmentation is higher than 15%) and then consecutively executes tests for
Benchmarks 10-15. The script times each phase in these benchmarks using CommandTimer.exe
and appends results to a log file.
Benchmarks 9 – File Copy, Move and Delete
This test measures the amount of time required for the system to copy, move and delete samples
of files in various file formats. This sample was made up of 812 files over 760,867,636 bytes
and can be categorized as documents [26% of total], media files [54% of total] and PE files (i.e.
System Files) [20% of total].
The breakdown of the main file types, file numbers and total sizes of the files in the sample set
is shown in the following table:
File format Category Number Size (bytes)
DOC Documents 8 30,450,176
DOCX Documents 4 13,522,409
PPT Documents 3 5,769,216
PPTX Documents 3 4,146,421
XLS Documents 4 2,660,352
XLSX Documents 4 1,426,054
PDF Documents 73 136,298,049
ZIP Documents 4 6,295,987
7Z Documents 1 92,238
JPG Media 351 31,375,259
GIF Media 6 148,182
MOV Media 7 57,360,371
RM Media 1 5,658,646
AVI Media 8 78,703,408
WMV Media 5 46,126,167
MP3 Media 28 191,580,387
EXE PE 19 2,952,914
DLL PE 104 29,261,568
AX PE 1 18,432
CPL PE 2 2,109,440
CPX PE 2 4,384
DRV PE 10 154,864
ICO PE 1 107,620
MSC PE 1 41,587
NT PE 1 1,688
ROM PE 2 36,611
SCR PE 2 2,250,240
SYS PE 1 37,528,093
TLB PE 3 135,580
TSK PE 1 1,152

Benchmark Report PERFORMANCE TESTING of 2009 PRODUCTS
PassMark® Software 8-Sep-08 Page 44 of 68
File format Category Number Size (bytes)
UCE PE 1 22,984
EXE PE 19 2,952,914
DLL PE 104 29,261,568
AX PE 1 18,432
CPL PE 2 2,109,440
CPX PE 2 4,384
DRV PE 10 154,864
ICO PE 1 107,620
MSC PE 1 41,587
NT PE 1 1,688
ROM PE 2 36,611
SCR PE 2 2,250,240
SYS PE 1 37,528,093
TLB PE 3 135,580
TSK PE 1 1,152
UCE PE 1 22,984
Total 812 760,867,636
This test was conducted three to five times to obtain the average time to copy, move and delete
the sample files, with the test machine rebooted between each sample to remove potential
caching effects.
Benchmark 10 – Third Party Program Installation
This test measured how much time was required to install and uninstall a third party application.
For this test, CommandTimer.exe timed how long it took to install and uninstall the Microsoft
.NET Framework 2.0 (*.msi) application on the test machine.
This test was conducted three to five times to obtain the average time to install/uninstall a third
party program, with the test machine rebooted between each sample to remove potential caching
effects.
Benchmark 11 – Binary File Download Speed
This benchmark measured how much time was required to download a sample set of binary files
of various sizes and types over an isolated segment of the network. The files were hosted on a
server machine running Windows Server 2008 and IIS7. CommandTimer.exe was used in
conjunction with GNU Wget to time and conduct the download test.
The complete sample set of files was made up of 553,638,694 bytes over 484 files and two file
type categories: media files [74% of total] and documents [26% of total]. The breakdown of the
file types, file numbers and total sizes of the files in the sample set is shown in the following
table:
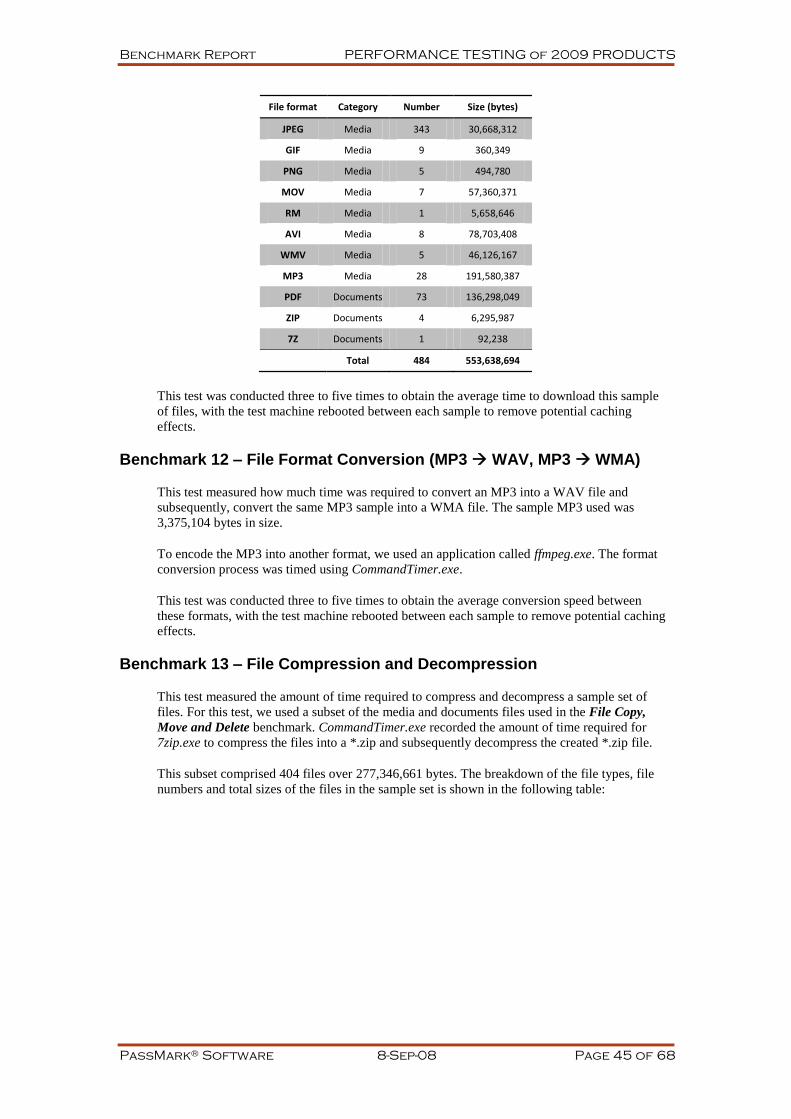
Benchmark Report PERFORMANCE TESTING of 2009 PRODUCTS
PassMark® Software 8-Sep-08 Page 45 of 68
File format Category Number Size (bytes)
JPEG Media 343 30,668,312
GIF Media 9 360,349
PNG Media 5 494,780
MOV Media 7 57,360,371
RM Media 1 5,658,646
AVI Media 8 78,703,408
WMV Media 5 46,126,167
MP3 Media 28 191,580,387
PDF Documents 73 136,298,049
ZIP Documents 4 6,295,987
7Z Documents 1 92,238
Total 484 553,638,694
This test was conducted three to five times to obtain the average time to download this sample
of files, with the test machine rebooted between each sample to remove potential caching
effects.
Benchmark 12 – File Format Conversion (MP3 WAV, MP3 WMA)
This test measured how much time was required to convert an MP3 into a WAV file and
subsequently, convert the same MP3 sample into a WMA file. The sample MP3 used was
3,375,104 bytes in size.
To encode the MP3 into another format, we used an application called ffmpeg.exe. The format
conversion process was timed using CommandTimer.exe.
This test was conducted three to five times to obtain the average conversion speed between
these formats, with the test machine rebooted between each sample to remove potential caching
effects.
Benchmark 13 – File Compression and Decompression
This test measured the amount of time required to compress and decompress a sample set of
files. For this test, we used a subset of the media and documents files used in the File Copy,
Move and Delete benchmark. CommandTimer.exe recorded the amount of time required for
7zip.exe to compress the files into a *.zip and subsequently decompress the created *.zip file.
This subset comprised 404 files over 277,346,661 bytes. The breakdown of the file types, file
numbers and total sizes of the files in the sample set is shown in the following table:

Benchmark Report PERFORMANCE TESTING of 2009 PRODUCTS
PassMark® Software 8-Sep-08 Page 46 of 68
File format Category Number Size (bytes)
DOC Documents 8 30,450,176
DOCX Documents 4 13,522,409
PPT Documents 3 5,769,216
PPTX Documents 3 4,146,421
XLS Documents 4 2,660,352
XLSX Documents 4 1,426,054
JPG Media 351 31,375,259
GIF Media 6 148,182
MOV Media 7 57,360,371
RM Media 1 5,658,646
AVI Media 8 78,703,408
WMV Media 5 46,126,167
Total 404 277,346,661
This test was conducted three to five times to obtain the average file compression and
decompression speed, with the test machine rebooted between each sample to remove potential
caching effects.
Benchmark 14 – File Write, Open and Close
This benchmark was derived from Oli Warner‟s File I/O test at http://www.thepcspy.com
(please see Reference #2: What Really Slows Windows Down).
For this test, we developed OpenClose.exe, an application that looped writing a small file to
disk, then opening and closing that file. CommandTimer.exe was used to time how long the
process took to complete 180,000 cycles.
This test was conducted three to five times to obtain the average file writing, opening and
closing speed, with the test machine rebooted between each sample to remove potential caching
effects.
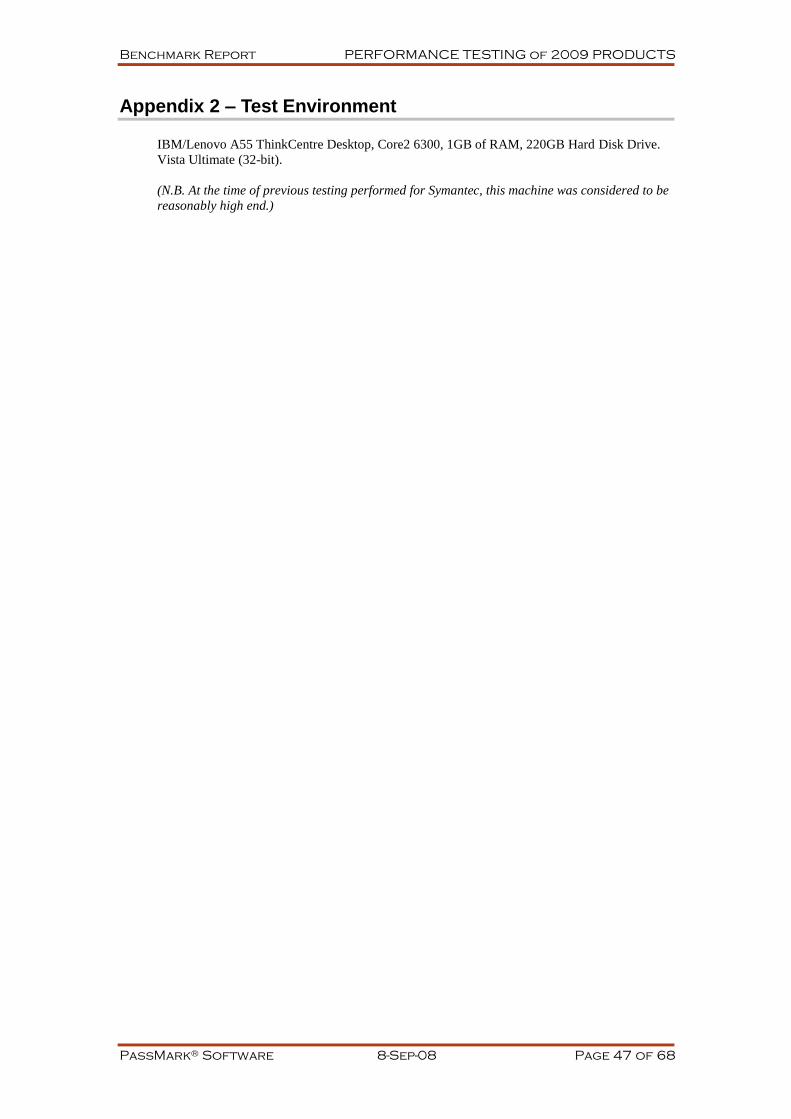
Benchmark Report PERFORMANCE TESTING of 2009 PRODUCTS
PassMark® Software 8-Sep-08 Page 47 of 68
Appendix 2 – Test Environment
IBM/Lenovo A55 ThinkCentre Desktop, Core2 6300, 1GB of RAM, 220GB Hard Disk Drive.
Vista Ultimate (32-bit).
(N.B. At the time of previous testing performed for Symantec, this machine was considered to be
reasonably high end.)
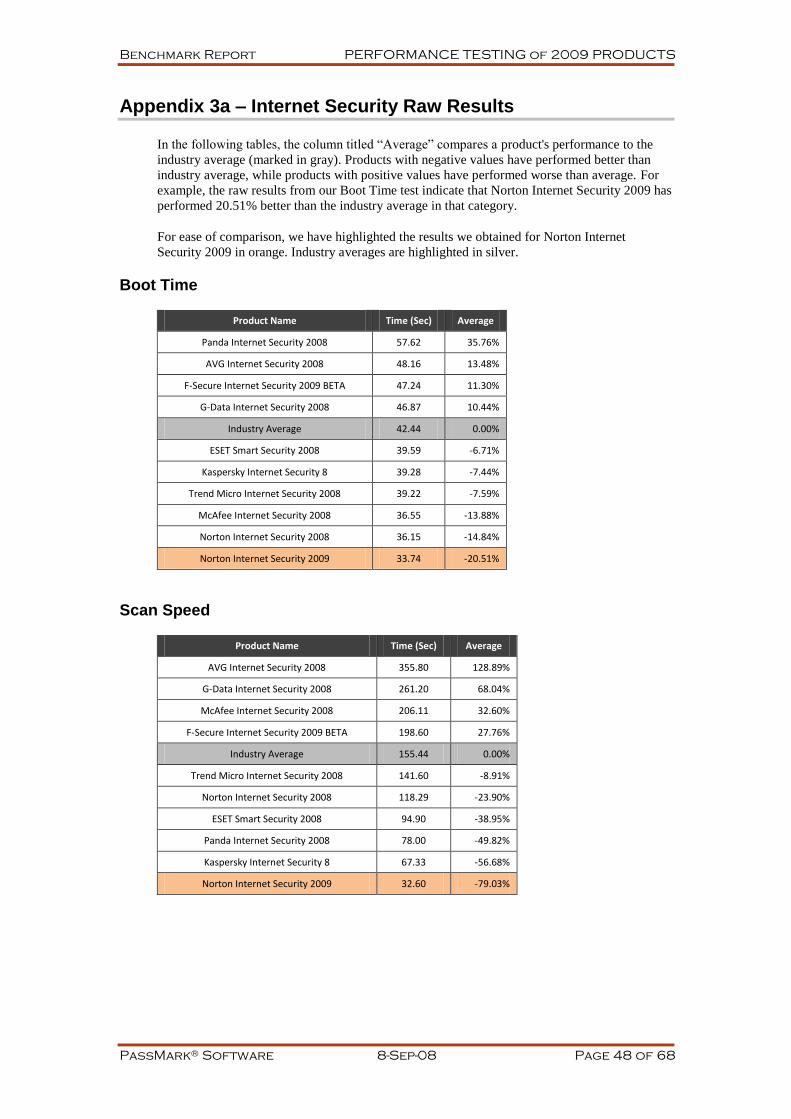
Benchmark Report PERFORMANCE TESTING of 2009 PRODUCTS
PassMark® Software 8-Sep-08 Page 48 of 68
Appendix 3a – Internet Security Raw Results
In the following tables, the column titled “Average” compares a product's performance to the
industry average (marked in gray). Products with negative values have performed better than
industry average, while products with positive values have performed worse than average. For
example, the raw results from our Boot Time test indicate that Norton Internet Security 2009 has
performed 20.51% better than the industry average in that category.
For ease of comparison, we have highlighted the results we obtained for Norton Internet
Security 2009 in orange. Industry averages are highlighted in silver.
Boot Time
Product Name Time (Sec) Average
Panda Internet Security 2008 57.62 35.76%
AVG Internet Security 2008 48.16 13.48%
F-Secure Internet Security 2009 BETA 47.24 11.30%
G-Data Internet Security 2008 46.87 10.44%
Industry Average 42.44 0.00%
ESET Smart Security 2008 39.59 -6.71%
Kaspersky Internet Security 8 39.28 -7.44%
Trend Micro Internet Security 2008 39.22 -7.59%
McAfee Internet Security 2008 36.55 -13.88%
Norton Internet Security 2008 36.15 -14.84%
Norton Internet Security 2009 33.74 -20.51%
Scan Speed
Product Name Time (Sec) Average
AVG Internet Security 2008 355.80 128.89%
G-Data Internet Security 2008 261.20 68.04%
McAfee Internet Security 2008 206.11 32.60%
F-Secure Internet Security 2009 BETA 198.60 27.76%
Industry Average 155.44 0.00%
Trend Micro Internet Security 2008 141.60 -8.91%
Norton Internet Security 2008 118.29 -23.90%
ESET Smart Security 2008 94.90 -38.95%
Panda Internet Security 2008 78.00 -49.82%
Kaspersky Internet Security 8 67.33 -56.68%
Norton Internet Security 2009 32.60 -79.03%
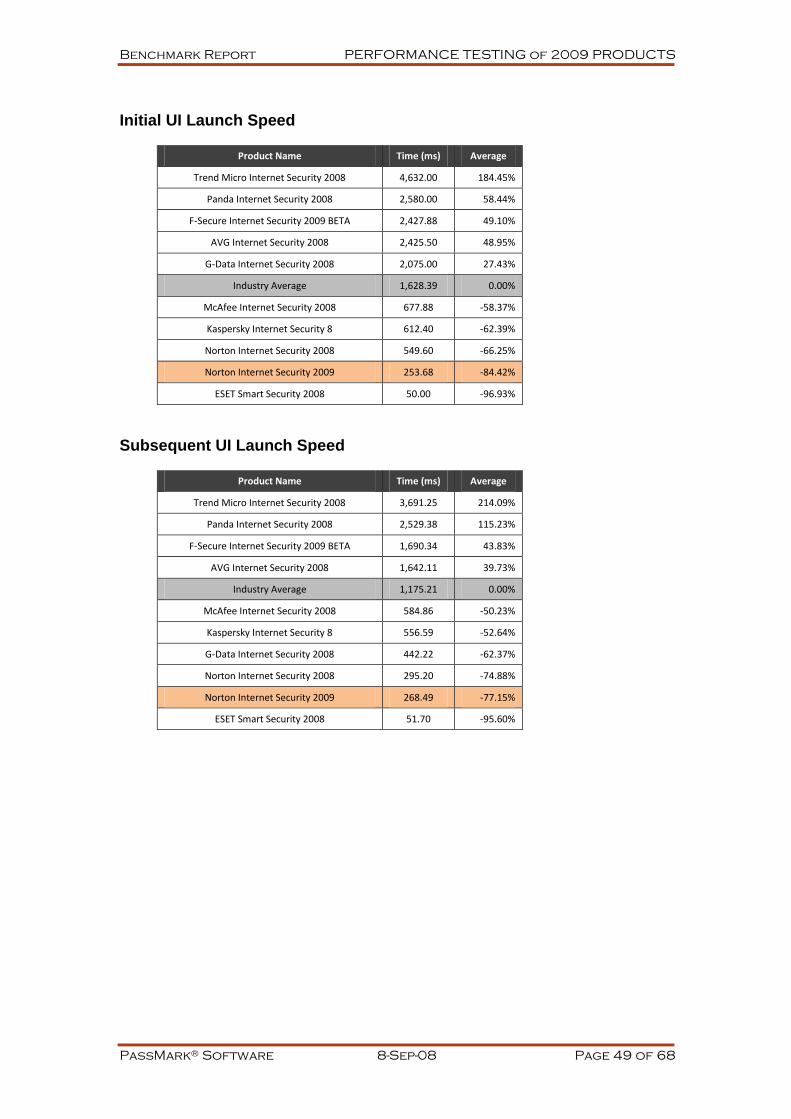
Benchmark Report PERFORMANCE TESTING of 2009 PRODUCTS
PassMark® Software 8-Sep-08 Page 49 of 68
Initial UI Launch Speed
Product Name Time (ms) Average
Trend Micro Internet Security 2008 4,632.00 184.45%
Panda Internet Security 2008 2,580.00 58.44%
F-Secure Internet Security 2009 BETA 2,427.88 49.10%
AVG Internet Security 2008 2,425.50 48.95%
G-Data Internet Security 2008 2,075.00 27.43%
Industry Average 1,628.39 0.00%
McAfee Internet Security 2008 677.88 -58.37%
Kaspersky Internet Security 8 612.40 -62.39%
Norton Internet Security 2008 549.60 -66.25%
Norton Internet Security 2009 253.68 -84.42%
ESET Smart Security 2008 50.00 -96.93%
Subsequent UI Launch Speed
Product Name Time (ms) Average
Trend Micro Internet Security 2008 3,691.25 214.09%
Panda Internet Security 2008 2,529.38 115.23%
F-Secure Internet Security 2009 BETA 1,690.34 43.83%
AVG Internet Security 2008 1,642.11 39.73%
Industry Average 1,175.21 0.00%
McAfee Internet Security 2008 584.86 -50.23%
Kaspersky Internet Security 8 556.59 -52.64%
G-Data Internet Security 2008 442.22 -62.37%
Norton Internet Security 2008 295.20 -74.88%
Norton Internet Security 2009 268.49 -77.15%
ESET Smart Security 2008 51.70 -95.60%

Benchmark Report PERFORMANCE TESTING of 2009 PRODUCTS
PassMark® Software 8-Sep-08 Page 50 of 68
Memory Utilization
Product Name RAM (MB) Average
Panda Internet Security 2008 93.20 85.68%
G-Data Internet Security 2008 76.08 51.57%
McAfee Internet Security 2008 74.21 47.83%
F-Secure Internet Security 2009 BETA 68.39 36.25%
AVG Internet Security 2008 66.46 32.39%
Trend Micro Internet Security 2008 52.35 4.29%
Industry Average 50.20 0.00%
ESET Smart Security 2008 33.38 -33.50%
Kaspersky Internet Security 8 22.38 -55.42%
Norton Internet Security 2008 8.59 -82.88%
Norton Internet Security 2009 6.92 -86.21%
Initial IE Launch Speed
Product Name Time (ms) Average
Norton Internet Security 2008 1,957.80 105.99%
G-Data Internet Security 2008 1,726.75 81.68%
AVG Internet Security 2008 1,187.25 24.92%
Trend Micro Internet Security 2008 1,021.25 7.45%
Industry Average 950.43 0.00%
McAfee Internet Security 2008 877.86 -7.64%
Panda Internet Security 2008 754.00 -20.67%
Norton Internet Security 2009 598.08 -37.07%
Kaspersky Internet Security 8 594.25 -37.48%
ESET Smart Security 2008 433.00 -54.44%
F-Secure Internet Security 2009 BETA 354.04 -62.75%
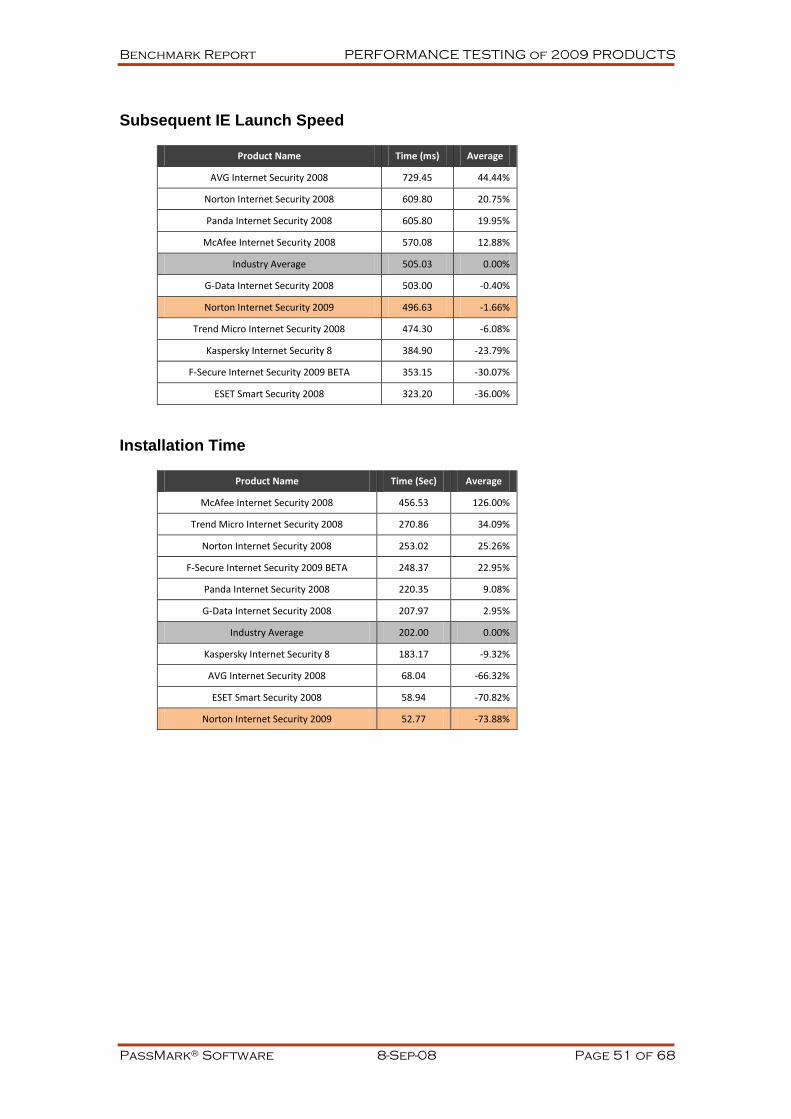
Benchmark Report PERFORMANCE TESTING of 2009 PRODUCTS
PassMark® Software 8-Sep-08 Page 51 of 68
Subsequent IE Launch Speed
Product Name Time (ms) Average
AVG Internet Security 2008 729.45 44.44%
Norton Internet Security 2008 609.80 20.75%
Panda Internet Security 2008 605.80 19.95%
McAfee Internet Security 2008 570.08 12.88%
Industry Average 505.03 0.00%
G-Data Internet Security 2008 503.00 -0.40%
Norton Internet Security 2009 496.63 -1.66%
Trend Micro Internet Security 2008 474.30 -6.08%
Kaspersky Internet Security 8 384.90 -23.79%
F-Secure Internet Security 2009 BETA 353.15 -30.07%
ESET Smart Security 2008 323.20 -36.00%
Installation Time
Product Name Time (Sec) Average
McAfee Internet Security 2008 456.53 126.00%
Trend Micro Internet Security 2008 270.86 34.09%
Norton Internet Security 2008 253.02 25.26%
F-Secure Internet Security 2009 BETA 248.37 22.95%
Panda Internet Security 2008 220.35 9.08%
G-Data Internet Security 2008 207.97 2.95%
Industry Average 202.00 0.00%
Kaspersky Internet Security 8 183.17 -9.32%
AVG Internet Security 2008 68.04 -66.32%
ESET Smart Security 2008 58.94 -70.82%
Norton Internet Security 2009 52.77 -73.88%

Benchmark Report PERFORMANCE TESTING of 2009 PRODUCTS
PassMark® Software 8-Sep-08 Page 52 of 68
Installation Size
Product Name Size (MB) Average
Trend Micro Internet Security 2008 1,130.79 59.31%
Panda Internet Security 2008 893.60 25.89%
Norton Internet Security 2008 890.02 25.39%
McAfee Internet Security 2008 839.08 18.21%
AVG Internet Security 2008 800.11 12.72%
G-Data Internet Security 2008 741.92 4.52%
Industry Average 709.82 0.00%
F-Secure Internet Security 2009 BETA 689.54 -2.86%
Kaspersky Internet Security 8 612.44 -13.72%
ESET Smart Security 2008 358.28 -49.53%
Norton Internet Security 2009 142.46 -79.93%
Registry Key Count
Product Name Keys Average
Norton Internet Security 2008 10,886 123.07%
G-Data Internet Security 2008 6,525 33.71%
Kaspersky Internet Security 8 6,413 31.41%
McAfee Internet Security 2008 5,900 20.90%
Trend Micro Internet Security 2008 5,612 15.00%
Industry Average 4,880 0.00%
Panda Internet Security 2008 4,104 -15.90%
F-Secure Internet Security 2009 BETA 3,080 -36.89%
Norton Internet Security 2009 2,582 -47.09%
ESET Smart Security 2008 1,916 -60.74%
AVG Internet Security 2008 1,782 -63.48%
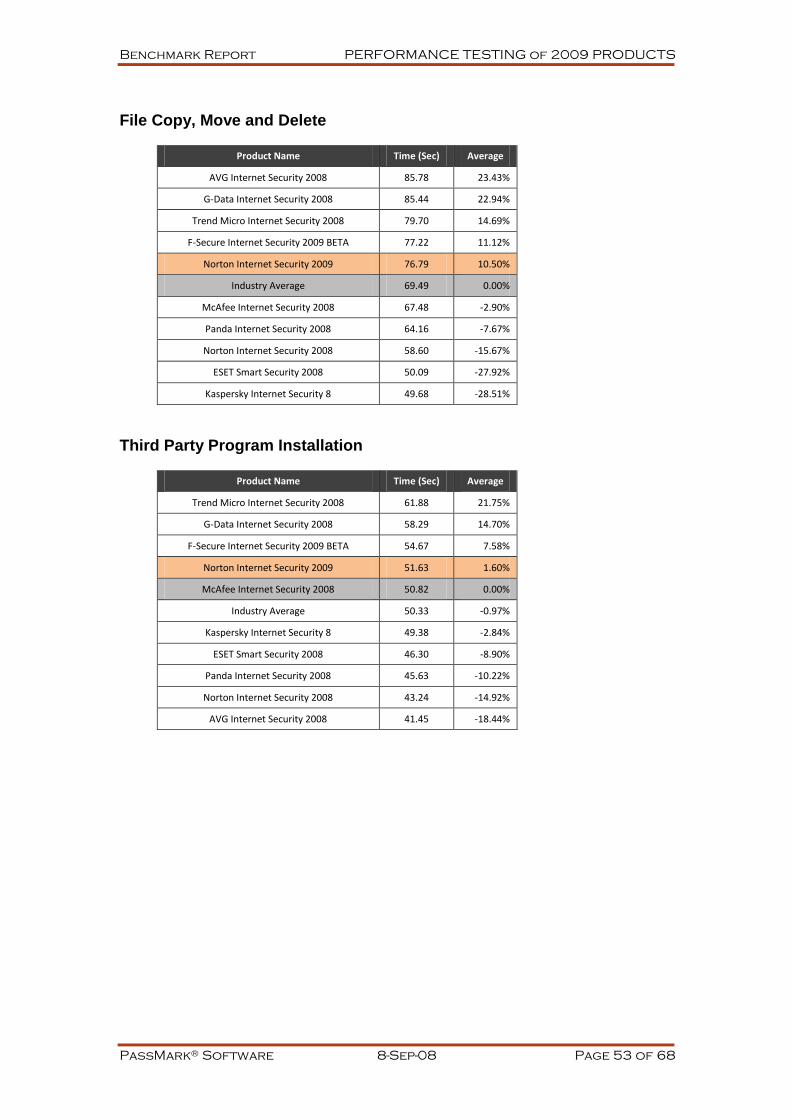
Benchmark Report PERFORMANCE TESTING of 2009 PRODUCTS
PassMark® Software 8-Sep-08 Page 53 of 68
File Copy, Move and Delete
Product Name Time (Sec) Average
AVG Internet Security 2008 85.78 23.43%
G-Data Internet Security 2008 85.44 22.94%
Trend Micro Internet Security 2008 79.70 14.69%
F-Secure Internet Security 2009 BETA 77.22 11.12%
Norton Internet Security 2009 76.79 10.50%
Industry Average 69.49 0.00%
McAfee Internet Security 2008 67.48 -2.90%
Panda Internet Security 2008 64.16 -7.67%
Norton Internet Security 2008 58.60 -15.67%
ESET Smart Security 2008 50.09 -27.92%
Kaspersky Internet Security 8 49.68 -28.51%
Third Party Program Installation
Product Name Time (Sec) Average
Trend Micro Internet Security 2008 61.88 21.75%
G-Data Internet Security 2008 58.29 14.70%
F-Secure Internet Security 2009 BETA 54.67 7.58%
Norton Internet Security 2009 51.63 1.60%
McAfee Internet Security 2008 50.82 0.00%
Industry Average 50.33 -0.97%
Kaspersky Internet Security 8 49.38 -2.84%
ESET Smart Security 2008 46.30 -8.90%
Panda Internet Security 2008 45.63 -10.22%
Norton Internet Security 2008 43.24 -14.92%
AVG Internet Security 2008 41.45 -18.44%

Benchmark Report PERFORMANCE TESTING of 2009 PRODUCTS
PassMark® Software 8-Sep-08 Page 54 of 68
Binary Download Speed
Product Name Time (Sec) Average
AVG Internet Security 2008 104.15 44.41%
F-Secure Internet Security 2009 BETA 91.00 26.17%
G-Data Internet Security 2008 74.17 2.85%
Industry Average 72.12 0.00%
Kaspersky Internet Security 8 70.42 -2.36%
Norton Internet Security 2008 68.76 -4.66%
Panda Internet Security 2008 67.13 -6.92%
ESET Smart Security 2008 62.96 -12.70%
Norton Internet Security 2009 62.54 -13.29%
McAfee Internet Security 2008 61.68 -14.48%
Trend Micro Internet Security 2008 58.42 -19.01%
File Format Conversion
Product Name Time (Sec) Average
Panda Internet Security 2008 17.46 3.33%
F-Secure Internet Security 2009 BETA 17.23 1.92%
Trend Micro Internet Security 2008 17.16 1.53%
G-Data Internet Security 2008 16.92 0.14%
Industry Average 16.90 0.00%
Kaspersky Internet Security 8 16.80 -0.58%
ESET Smart Security 2008 16.80 -0.62%
Norton Internet Security 2009 16.78 -0.69%
Norton Internet Security 2008 16.73 -1.01%
AVG Internet Security 2008 16.65 -1.46%
McAfee Internet Security 2008 16.47 -2.57%
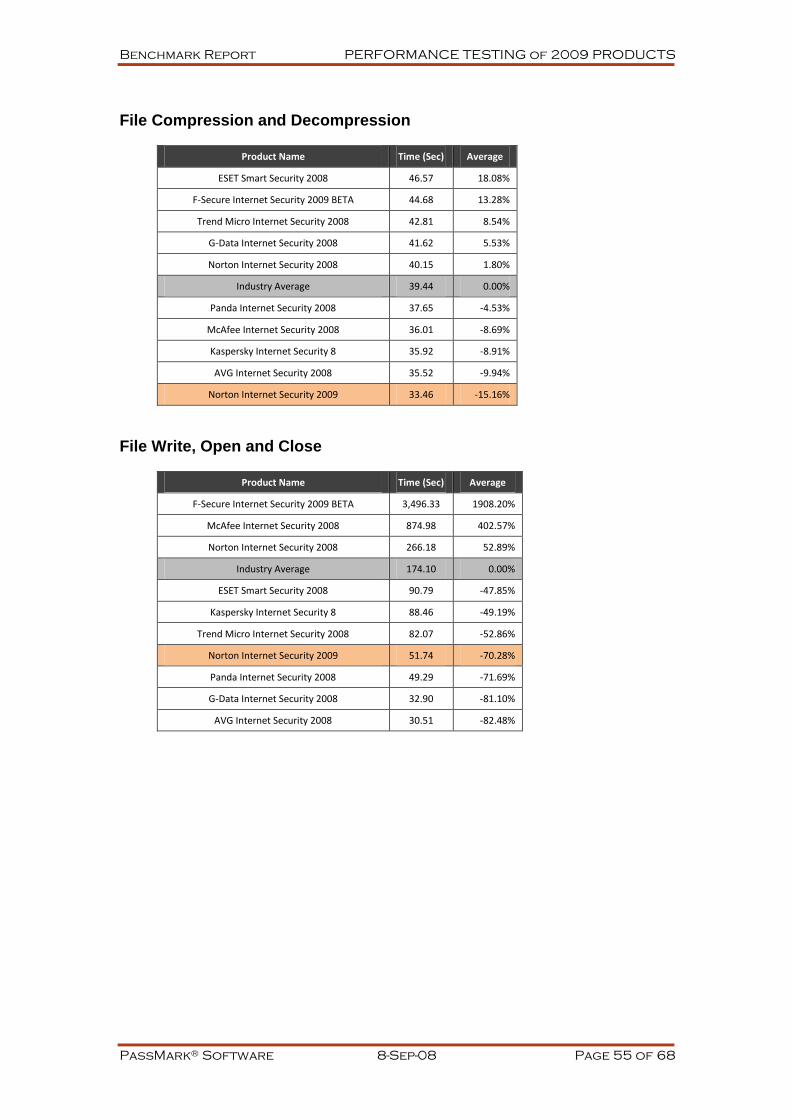
Benchmark Report PERFORMANCE TESTING of 2009 PRODUCTS
PassMark® Software 8-Sep-08 Page 55 of 68
File Compression and Decompression
Product Name Time (Sec) Average
ESET Smart Security 2008 46.57 18.08%
F-Secure Internet Security 2009 BETA 44.68 13.28%
Trend Micro Internet Security 2008 42.81 8.54%
G-Data Internet Security 2008 41.62 5.53%
Norton Internet Security 2008 40.15 1.80%
Industry Average 39.44 0.00%
Panda Internet Security 2008 37.65 -4.53%
McAfee Internet Security 2008 36.01 -8.69%
Kaspersky Internet Security 8 35.92 -8.91%
AVG Internet Security 2008 35.52 -9.94%
Norton Internet Security 2009 33.46 -15.16%
File Write, Open and Close
Product Name Time (Sec) Average
F-Secure Internet Security 2009 BETA 3,496.33 1908.20%
McAfee Internet Security 2008 874.98 402.57%
Norton Internet Security 2008 266.18 52.89%
Industry Average 174.10 0.00%
ESET Smart Security 2008 90.79 -47.85%
Kaspersky Internet Security 8 88.46 -49.19%
Trend Micro Internet Security 2008 82.07 -52.86%
Norton Internet Security 2009 51.74 -70.28%
Panda Internet Security 2008 49.29 -71.69%
G-Data Internet Security 2008 32.90 -81.10%
AVG Internet Security 2008 30.51 -82.48%

Benchmark Report PERFORMANCE TESTING of 2009 PRODUCTS
PassMark® Software 8-Sep-08 Page 56 of 68
Appendix 3b – Antivirus Raw Results
In the following tables, the column titled “Average” compares a product's performance to the
industry average (marked in gray). Products with negative values have performed better than
industry average, while products with positive values have performed worse than average. For
example, the raw results from our Boot Time test indicate that Norton Antivirus 2009 has
performed 14.07% better than the industry average in that category.
For ease of comparison, we have highlighted the results we obtained for Norton Antivirus 2009
in orange. Industry averages are highlighted in silver.
Boot Time
Product Name Time (Sec) Average
McAfee VirusScanPlus 2008 46.34 16.03%
Rising Security Antivirus 46.06 15.31%
AVG Free AV&AS 2008 45.51 13.94%
G-Data Antivirus 2008 43.02 7.71%
SourceNext Virus Security ZERO 2008 41.57 4.09%
Avira AntiVir Free AV 8 41.13 2.99%
Industry Average 39.94 0.00%
Trend Micro Antivirus 2008 38.25 -4.24%
Kaspersky Antivirus 8 37.98 -4.92%
Avast! Antivirus 4.8 35.97 -9.95%
Norton Antivirus 2008 35.75 -10.50%
Norton Antivirus 2009 34.32 -14.07%
ESET NOD32 Antivirus 3.0 33.39 -16.40%
Scan Speed
Product Name Time (Sec) Average
AVG Free AV&AS 2008 364.20 166.10%
G-Data Antivirus 2008 255.40 86.61%
McAfee VirusScanPlus 2008 227.80 66.44%
Rising Security Antivirus 152.40 11.35%
Industry Average 136.87 0.00%
Trend Micro Antivirus 2008 123.20 -9.98%
Avast! Antivirus 4.8 116.87 -14.61%
Norton Antivirus 2008 108.34 -20.85%
ESET NOD32 Antivirus 3.0 86.80 -36.58%
Avira AntiVir Free AV 8 68.80 -49.73%
Kaspersky Antivirus 8 57.60 -57.91%
SourceNext Virus Security ZERO 2008 48.79 -64.35%
Norton Antivirus 2009 32.20 -76.47%

Benchmark Report PERFORMANCE TESTING of 2009 PRODUCTS
PassMark® Software 8-Sep-08 Page 57 of 68
Initial UI Launch Speed
AntiVirus Products
Product Name Time (ms) Average
Trend Micro Antivirus 2008 4,015.00 209.89%
McAfee VirusScanPlus 2008 3,522.50 171.88%
Avira AntiVir Free AV 8 2,509.20 93.67%
AVG Free AV&AS 2008 1,659.98 28.12%
Industry Average 1,295.61 0.00%
G-Data Antivirus 2008 980.00 -24.36%
Avast! Antivirus 4.8 803.10 -38.01%
Kaspersky Antivirus 8 565.40 -56.36%
SourceNext Virus Security ZERO 2008 543.60 -58.04%
Norton Antivirus 2008 390.20 -69.88%
Rising Security Antivirus 343.70 -73.47%
Norton Antivirus 2009 167.70 -87.06%
ESET NOD32 Antivirus 3.0 47.00 -96.37%
Subsequent UI Launch Speed
Product Name Time (ms) Average
Trend Micro Antivirus 2008 3,666.00 224.36%
McAfee VirusScanPlus 2008 2,575.00 127.83%
Avira AntiVir Free AV 8 2,452.70 117.01%
AVG Free AV&AS 2008 1,614.01 42.80%
Industry Average 1,130.22 0.00%
G-Data Antivirus 2008 825.63 -26.95%
Avast! Antivirus 4.8 743.56 -34.21%
Kaspersky Antivirus 8 523.78 -53.66%
SourceNext Virus Security ZERO 2008 348.23 -69.19%
Norton Antivirus 2008 281.20 -75.12%
Rising Security Antivirus 268.49 -76.24%
Norton Antivirus 2009 217.11 -80.79%
ESET NOD32 Antivirus 3.0 47.00 -95.84%

Benchmark Report PERFORMANCE TESTING of 2009 PRODUCTS
PassMark® Software 8-Sep-08 Page 58 of 68
Memory Utilization
Product Name RAM (MB) Average
G-Data Antivirus 2008 57.79 99.77%
AVG Free AV&AS 2008 56.06 93.77%
McAfee VirusScanPlus 2008 45.54 57.42%
ESET NOD32 Antivirus 3.0 32.95 13.90%
SourceNext Virus Security ZERO 2008 30.85 6.62%
Trend Micro Antivirus 2008 30.65 5.94%
Industry Average 28.93 0.00%
Avira AntiVir Free AV 8 22.30 -22.92%
Kaspersky Antivirus 8 20.34 -29.68%
Rising Security Antivirus 19.23 -33.54%
Avast! Antivirus 4.8 18.05 -37.61%
Norton Antivirus 2008 8.02 -72.26%
Norton Antivirus 2009 5.38 -81.41%
Initial IE Launch Speed
Product Name Time (ms) Average
AVG Free AV&AS 2008 1,352.86 62.46%
Rising Security Antivirus 1,311.43 57.49%
G-Data Antivirus 2008 1,182.00 41.94%
McAfee VirusScanPlus 2008 1,043.58 25.32%
SourceNext Virus Security ZERO 2008 928.00 11.44%
Industry Average 832.73 0.00%
Trend Micro Antivirus 2008 765.50 -8.07%
Norton Antivirus 2008 726.40 -12.77%
Avast! Antivirus 4.8 707.75 -15.01%
Kaspersky Antivirus 8 559.60 -32.80%
Norton Antivirus 2009 494.04 -40.67%
Avira AntiVir Free AV 8 464.80 -44.18%
ESET NOD32 Antivirus 3.0 456.80 -45.14%
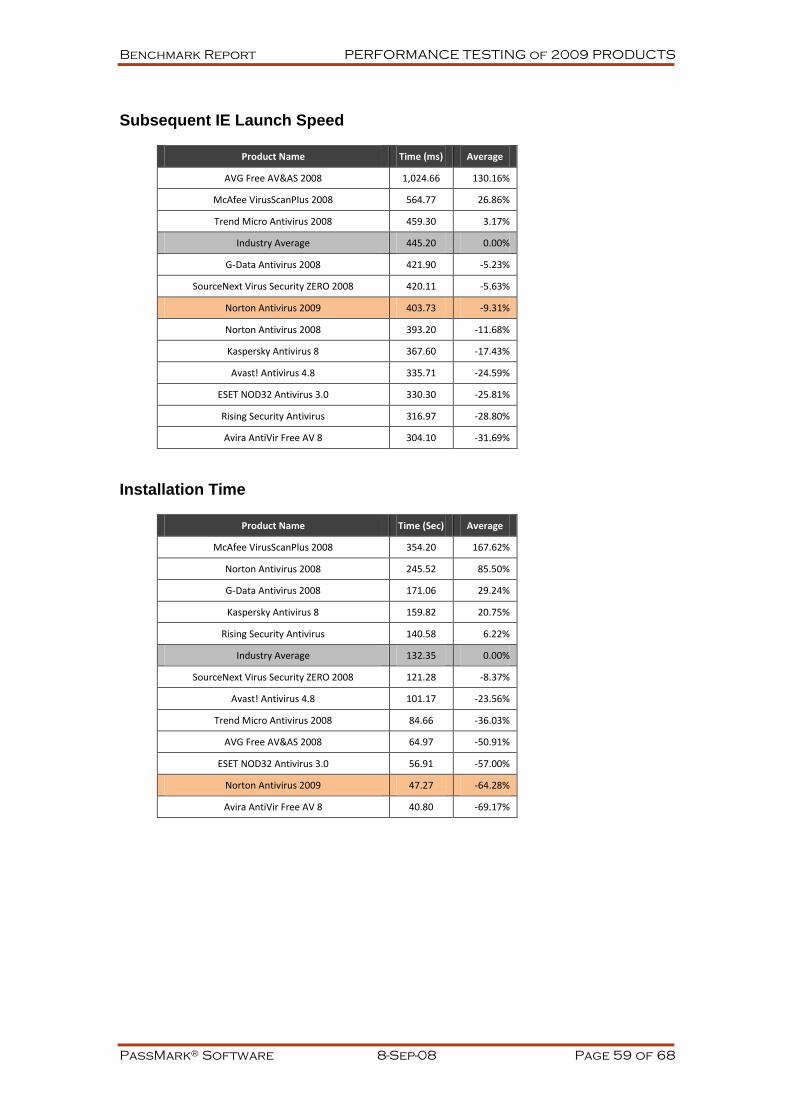
Benchmark Report PERFORMANCE TESTING of 2009 PRODUCTS
PassMark® Software 8-Sep-08 Page 59 of 68
Subsequent IE Launch Speed
Product Name Time (ms) Average
AVG Free AV&AS 2008 1,024.66 130.16%
McAfee VirusScanPlus 2008 564.77 26.86%
Trend Micro Antivirus 2008 459.30 3.17%
Industry Average 445.20 0.00%
G-Data Antivirus 2008 421.90 -5.23%
SourceNext Virus Security ZERO 2008 420.11 -5.63%
Norton Antivirus 2009 403.73 -9.31%
Norton Antivirus 2008 393.20 -11.68%
Kaspersky Antivirus 8 367.60 -17.43%
Avast! Antivirus 4.8 335.71 -24.59%
ESET NOD32 Antivirus 3.0 330.30 -25.81%
Rising Security Antivirus 316.97 -28.80%
Avira AntiVir Free AV 8 304.10 -31.69%
Installation Time
Product Name Time (Sec) Average
McAfee VirusScanPlus 2008 354.20 167.62%
Norton Antivirus 2008 245.52 85.50%
G-Data Antivirus 2008 171.06 29.24%
Kaspersky Antivirus 8 159.82 20.75%
Rising Security Antivirus 140.58 6.22%
Industry Average 132.35 0.00%
SourceNext Virus Security ZERO 2008 121.28 -8.37%
Avast! Antivirus 4.8 101.17 -23.56%
Trend Micro Antivirus 2008 84.66 -36.03%
AVG Free AV&AS 2008 64.97 -50.91%
ESET NOD32 Antivirus 3.0 56.91 -57.00%
Norton Antivirus 2009 47.27 -64.28%
Avira AntiVir Free AV 8 40.80 -69.17%
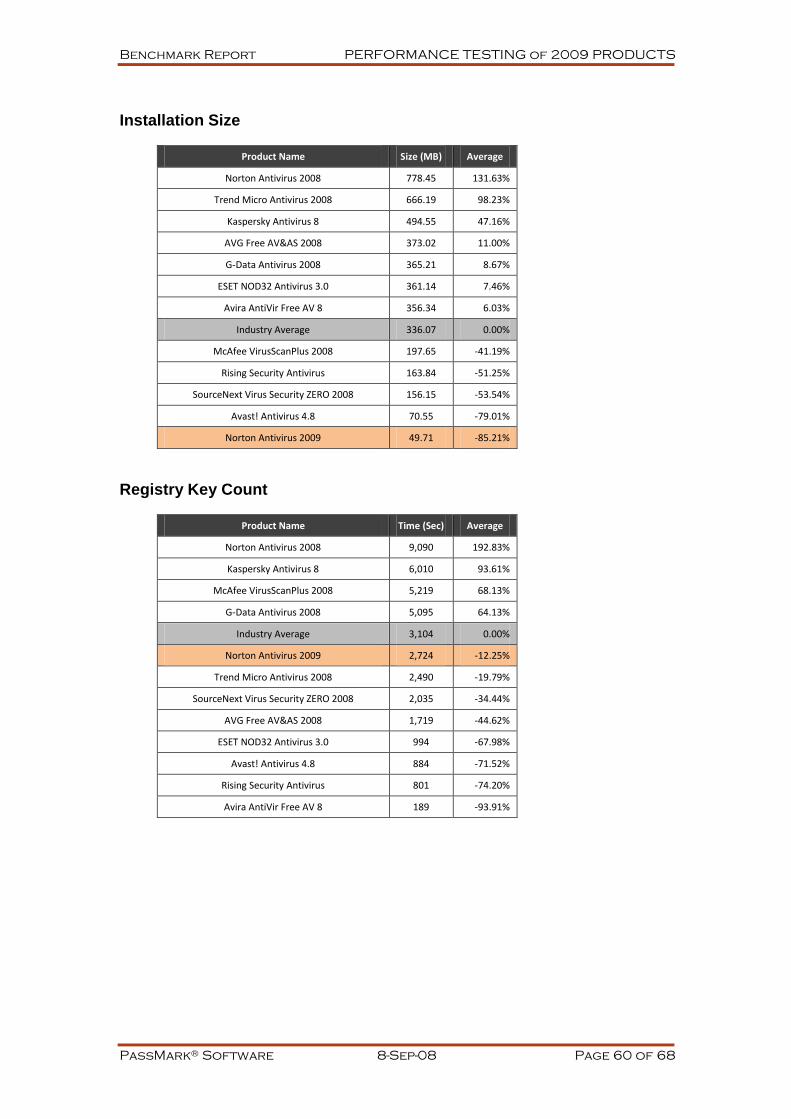
Benchmark Report PERFORMANCE TESTING of 2009 PRODUCTS
PassMark® Software 8-Sep-08 Page 60 of 68
Installation Size
Product Name Size (MB) Average
Norton Antivirus 2008 778.45 131.63%
Trend Micro Antivirus 2008 666.19 98.23%
Kaspersky Antivirus 8 494.55 47.16%
AVG Free AV&AS 2008 373.02 11.00%
G-Data Antivirus 2008 365.21 8.67%
ESET NOD32 Antivirus 3.0 361.14 7.46%
Avira AntiVir Free AV 8 356.34 6.03%
Industry Average 336.07 0.00%
McAfee VirusScanPlus 2008 197.65 -41.19%
Rising Security Antivirus 163.84 -51.25%
SourceNext Virus Security ZERO 2008 156.15 -53.54%
Avast! Antivirus 4.8 70.55 -79.01%
Norton Antivirus 2009 49.71 -85.21%
Registry Key Count
Product Name Time (Sec) Average
Norton Antivirus 2008 9,090 192.83%
Kaspersky Antivirus 8 6,010 93.61%
McAfee VirusScanPlus 2008 5,219 68.13%
G-Data Antivirus 2008 5,095 64.13%
Industry Average 3,104 0.00%
Norton Antivirus 2009 2,724 -12.25%
Trend Micro Antivirus 2008 2,490 -19.79%
SourceNext Virus Security ZERO 2008 2,035 -34.44%
AVG Free AV&AS 2008 1,719 -44.62%
ESET NOD32 Antivirus 3.0 994 -67.98%
Avast! Antivirus 4.8 884 -71.52%
Rising Security Antivirus 801 -74.20%
Avira AntiVir Free AV 8 189 -93.91%
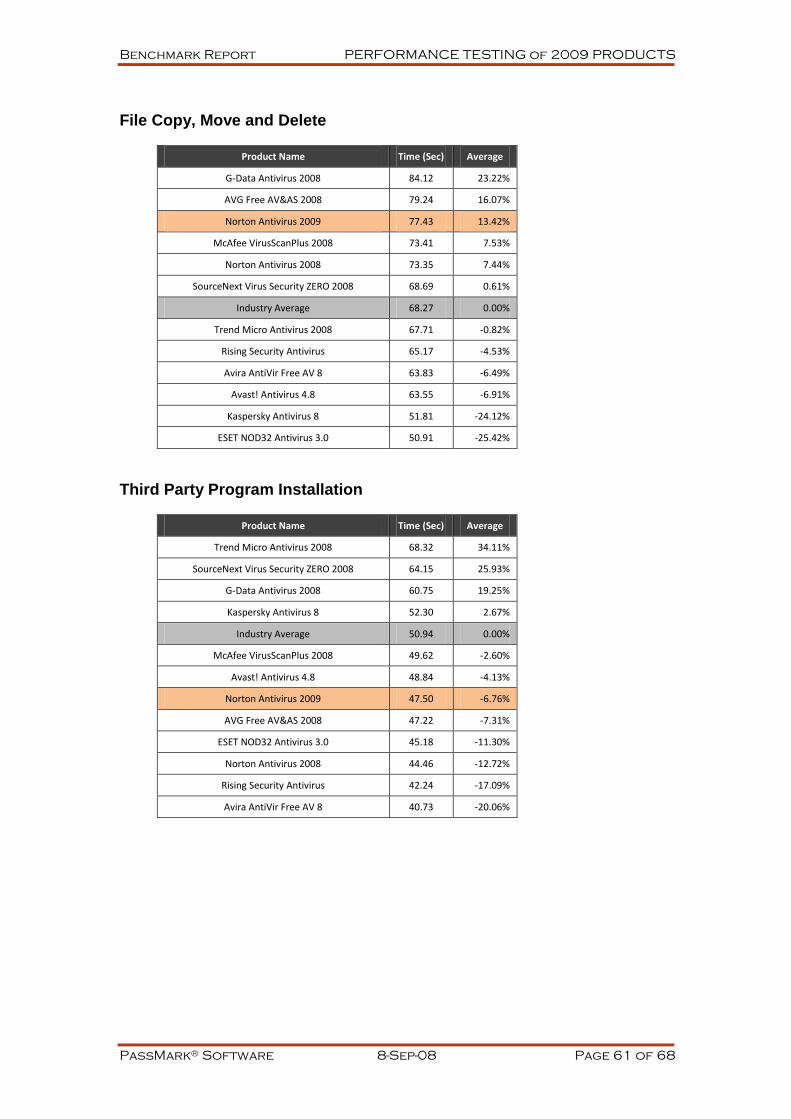
Benchmark Report PERFORMANCE TESTING of 2009 PRODUCTS
PassMark® Software 8-Sep-08 Page 61 of 68
File Copy, Move and Delete
Product Name Time (Sec) Average
G-Data Antivirus 2008 84.12 23.22%
AVG Free AV&AS 2008 79.24 16.07%
Norton Antivirus 2009 77.43 13.42%
McAfee VirusScanPlus 2008 73.41 7.53%
Norton Antivirus 2008 73.35 7.44%
SourceNext Virus Security ZERO 2008 68.69 0.61%
Industry Average 68.27 0.00%
Trend Micro Antivirus 2008 67.71 -0.82%
Rising Security Antivirus 65.17 -4.53%
Avira AntiVir Free AV 8 63.83 -6.49%
Avast! Antivirus 4.8 63.55 -6.91%
Kaspersky Antivirus 8 51.81 -24.12%
ESET NOD32 Antivirus 3.0 50.91 -25.42%
Third Party Program Installation
Product Name Time (Sec) Average
Trend Micro Antivirus 2008 68.32 34.11%
SourceNext Virus Security ZERO 2008 64.15 25.93%
G-Data Antivirus 2008 60.75 19.25%
Kaspersky Antivirus 8 52.30 2.67%
Industry Average 50.94 0.00%
McAfee VirusScanPlus 2008 49.62 -2.60%
Avast! Antivirus 4.8 48.84 -4.13%
Norton Antivirus 2009 47.50 -6.76%
AVG Free AV&AS 2008 47.22 -7.31%
ESET NOD32 Antivirus 3.0 45.18 -11.30%
Norton Antivirus 2008 44.46 -12.72%
Rising Security Antivirus 42.24 -17.09%
Avira AntiVir Free AV 8 40.73 -20.06%
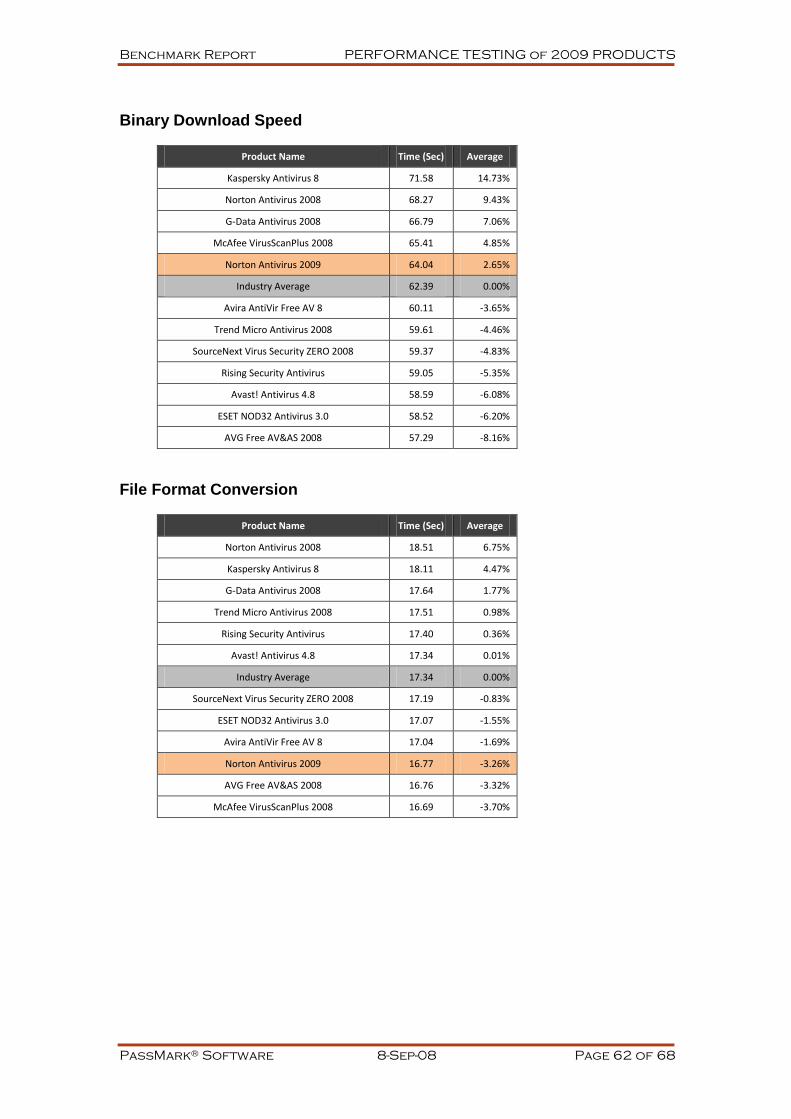
Benchmark Report PERFORMANCE TESTING of 2009 PRODUCTS
PassMark® Software 8-Sep-08 Page 62 of 68
Binary Download Speed
Product Name Time (Sec) Average
Kaspersky Antivirus 8 71.58 14.73%
Norton Antivirus 2008 68.27 9.43%
G-Data Antivirus 2008 66.79 7.06%
McAfee VirusScanPlus 2008 65.41 4.85%
Norton Antivirus 2009 64.04 2.65%
Industry Average 62.39 0.00%
Avira AntiVir Free AV 8 60.11 -3.65%
Trend Micro Antivirus 2008 59.61 -4.46%
SourceNext Virus Security ZERO 2008 59.37 -4.83%
Rising Security Antivirus 59.05 -5.35%
Avast! Antivirus 4.8 58.59 -6.08%
ESET NOD32 Antivirus 3.0 58.52 -6.20%
AVG Free AV&AS 2008 57.29 -8.16%
File Format Conversion
Product Name Time (Sec) Average
Norton Antivirus 2008 18.51 6.75%
Kaspersky Antivirus 8 18.11 4.47%
G-Data Antivirus 2008 17.64 1.77%
Trend Micro Antivirus 2008 17.51 0.98%
Rising Security Antivirus 17.40 0.36%
Avast! Antivirus 4.8 17.34 0.01%
Industry Average 17.34 0.00%
SourceNext Virus Security ZERO 2008 17.19 -0.83%
ESET NOD32 Antivirus 3.0 17.07 -1.55%
Avira AntiVir Free AV 8 17.04 -1.69%
Norton Antivirus 2009 16.77 -3.26%
AVG Free AV&AS 2008 16.76 -3.32%
McAfee VirusScanPlus 2008 16.69 -3.70%

Benchmark Report PERFORMANCE TESTING of 2009 PRODUCTS
PassMark® Software 8-Sep-08 Page 63 of 68
File Compression and Decompression
Product Name Time (Sec) Average
Avira AntiVir Free AV 8 47.76 21.15%
Avast! Antivirus 4.8 46.14 17.04%
ESET NOD32 Antivirus 3.0 41.98 6.49%
Trend Micro Antivirus 2008 40.66 3.14%
SourceNext Virus Security ZERO 2008 40.41 2.51%
Industry Average 39.42 0.00%
Rising Security Antivirus 38.91 -1.30%
G-Data Antivirus 2008 38.58 -2.15%
McAfee VirusScanPlus 2008 37.38 -5.19%
Norton Antivirus 2008 35.97 -8.75%
Norton Antivirus 2009 35.83 -9.12%
Kaspersky Antivirus 8 34.99 -11.23%
AVG Free AV&AS 2008 34.46 -12.60%
File Write, Open and Close
Product Name Time (Sec) Average
SourceNext Virus Security ZERO 2008 1,334.50 410.52%
McAfee VirusScanPlus 2008 874.66 234.60%
Norton Antivirus 2008 286.56 9.62%
Industry Average 261.40 0.00%
Rising Security Antivirus 154.07 -41.06%
ESET NOD32 Antivirus 3.0 102.17 -60.91%
Kaspersky Antivirus 8 84.52 -67.67%
Trend Micro Antivirus 2008 84.46 -67.69%
Avast! Antivirus 4.8 63.64 -75.66%
Norton Antivirus 2009 50.33 -80.75%
Avira AntiVir Free AV 8 36.18 -86.16%
G-Data Antivirus 2008 34.62 -86.75%
AVG Free AV&AS 2008 31.13 -88.09%

Benchmark Report PERFORMANCE TESTING of 2009 PRODUCTS
PassMark® Software 8-Sep-08 Page 64 of 68
Appendix 3c – Total Security Raw Results
In the following tables, the column titled “Average” compares a product's performance to the
industry average (marked in gray). Products with negative values have performed better than
industry average, while products with positive values have performed worse than average. For
example, the following Boot Time table shows that Windows OneCare has performed 46.68%
worse than the Industry Average.
For ease of comparison, industry averages are highlighted in silver.
Boot Time
Product Name Time (Sec) Average
Windows OneCare 2.0 195.55 46.68%
Industry Average 133.32 0.00%
Trend Micro IS Pro 2008 123.21 -7.58%
Norton 360 v2 119.26 -10.55%
BitDefender Total Security 2008 114.34 -14.23%
McAfee Total Protection 2008 114.23 -14.32%
Scan Speed
Product Name Time (Sec) Average
McAfee Total Protection 2008 714.60 79.64%
Windows OneCare 2.0 401.40 0.90%
Industry Average 397.80 0.00%
Norton 360 v2 344.80 -13.32%
BitDefender Total Security 2008 269.40 -32.28%
Trend Micro IS Pro 2008 258.80 -34.94%
Initial UI Launch Speed
Product Name Time (ms) Average
Windows OneCare 2.0 11,178.00 102.84%
McAfee Total Protection 2008 6,147.50 11.56%
Industry Average 5,510.65 0.00%
Trend Micro IS Pro 2008 4,682.00 -15.04%
Norton 360 v2 3,630.00 -34.13%
BitDefender Total Security 2008 1,915.75 -65.24%

Benchmark Report PERFORMANCE TESTING of 2009 PRODUCTS
PassMark® Software 8-Sep-08 Page 65 of 68
Subsequent UI Launch Speed
Product Name Time (ms) Average
Trend Micro IS Pro 2008 3,809.00 59.33%
McAfee Total Protection 2008 3,736.00 56.27%
Industry Average 2,390.70 0.00%
Windows OneCare 2.0 2,258.00 -5.55%
Norton 360 v2 1,080.00 -54.82%
BitDefender Total Security 2008 1,070.50 -55.22%
Memory Utilization
Product Name RAM (MB) Average
Trend Micro IS Pro 2008 70.49 97.10%
McAfee Total Protection 2008 66.05 84.70%
Industry Average 35.76 0.00%
Windows OneCare 2.0 33.00 -7.73%
Norton 360 v2 5.82 -83.73%
BitDefender Total Security 2008 3.45 -90.35%
HTTP Download Speed
Product Name Time (ms) Average
BitDefender Total Security 2008 91,628.47 123.54%
McAfee Total Protection 2008 52,531.29 28.16%
Industry Average 40,988.94 0.00%
Norton 360 v2 22,016.64 -46.29%
Windows OneCare 2.0 20,392.60 -50.25%
Trend Micro IS Pro 2008 18,375.71 -55.17%
Initial IE Launch Speed
Product Name Time (ms) Average
Trend Micro IS Pro 2008 5,553.60 85.43%
Industry Average 2,995.06 0.00%
BitDefender Total Security 2008 2,780.20 -7.17%
Windows OneCare 2.0 2,545.00 -15.03%
Norton 360 v2 2,293.00 -23.44%
McAfee Total Protection 2008 1,803.50 -39.78%
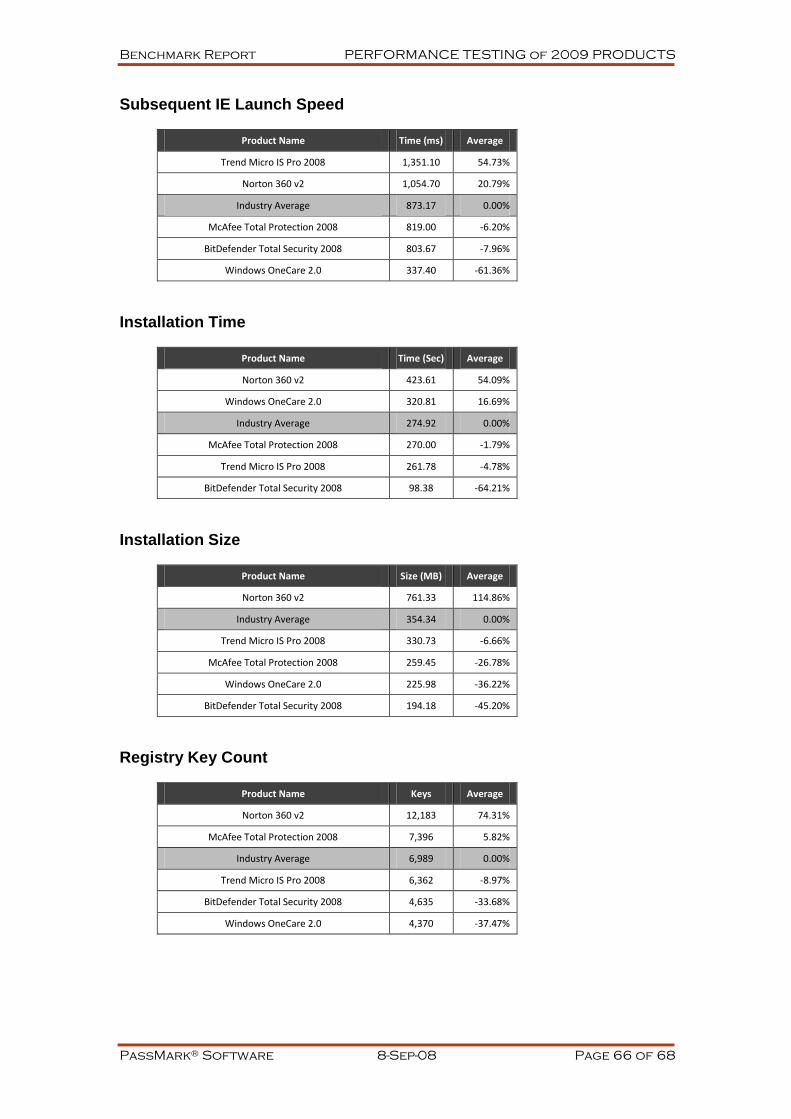
Benchmark Report PERFORMANCE TESTING of 2009 PRODUCTS
PassMark® Software 8-Sep-08 Page 66 of 68
Subsequent IE Launch Speed
Product Name Time (ms) Average
Trend Micro IS Pro 2008 1,351.10 54.73%
Norton 360 v2 1,054.70 20.79%
Industry Average 873.17 0.00%
McAfee Total Protection 2008 819.00 -6.20%
BitDefender Total Security 2008 803.67 -7.96%
Windows OneCare 2.0 337.40 -61.36%
Installation Time
Product Name Time (Sec) Average
Norton 360 v2 423.61 54.09%
Windows OneCare 2.0 320.81 16.69%
Industry Average 274.92 0.00%
McAfee Total Protection 2008 270.00 -1.79%
Trend Micro IS Pro 2008 261.78 -4.78%
BitDefender Total Security 2008 98.38 -64.21%
Installation Size
Product Name Size (MB) Average
Norton 360 v2 761.33 114.86%
Industry Average 354.34 0.00%
Trend Micro IS Pro 2008 330.73 -6.66%
McAfee Total Protection 2008 259.45 -26.78%
Windows OneCare 2.0 225.98 -36.22%
BitDefender Total Security 2008 194.18 -45.20%
Registry Key Count
Product Name Keys Average
Norton 360 v2 12,183 74.31%
McAfee Total Protection 2008 7,396 5.82%
Industry Average 6,989 0.00%
Trend Micro IS Pro 2008 6,362 -8.97%
BitDefender Total Security 2008 4,635 -33.68%
Windows OneCare 2.0 4,370 -37.47%

Benchmark Report PERFORMANCE TESTING of 2009 PRODUCTS
PassMark® Software 8-Sep-08 Page 67 of 68
File Copy, Move and Delete
Product Name Time (Sec) Average
Trend Micro IS Pro 2008 179.25 23.49%
BitDefender Total Security 2008 155.45 7.09%
Industry Average 145.15 0.00%
McAfee Total Protection 2008 143.79 -0.94%
Windows OneCare 2.0 135.50 -6.65%
Norton 360 v2 111.78 -22.99%
Third Party Program Installation
Product Name Time (Sec) Average
Trend Micro IS Pro 2008 68.44 36.88%
Norton 360 v2 51.71 3.43%
Industry Average 50.00 0.00%
BitDefender Total Security 2008 48.36 -3.27%
McAfee Total Protection 2008 41.06 -17.88%
Windows OneCare 2.0 40.42 -19.16%
Binary Download Speed
Product Name Time (Sec) Average
Trend Micro IS Pro 2008 113.91 11.63%
Norton 360 v2 107.61 5.46%
Industry Average 102.04 0.00%
BitDefender Total Security 2008 101.42 -0.61%
Windows OneCare 2.0 94.60 -7.29%
McAfee Total Protection 2008 92.65 -9.20%
File Format Conversion
Product Name Time (Sec) Average
Norton 360 v2 32.36 7.16%
Trend Micro IS Pro 2008 31.25 3.46%
Industry Average 30.20 0.00%
Windows OneCare 2.0 29.86 -1.15%
BitDefender Total Security 2008 29.12 -3.57%
McAfee Total Protection 2008 28.42 -5.90%

Benchmark Report PERFORMANCE TESTING of 2009 PRODUCTS
PassMark® Software 8-Sep-08 Page 68 of 68
File Compression and Decompression
Product Name Time (Sec) Average
Trend Micro IS Pro 2008 188.93 13.65%
BitDefender Total Security 2008 171.04 2.90%
Industry Average 166.23 0.00%
Norton 360 v2 165.13 -0.66%
Windows OneCare 2.0 162.86 -2.03%
McAfee Total Protection 2008 143.19 -13.86%
File Write, Open and Close
Product Name Time (Sec) Average
BitDefender Total Security 2008* 4,237.05 402.06%
McAfee Total Protection 2008 1,564.33 85.36%
Windows OneCare 2.0 1,128.28 33.69%
Industry Average 843.93 0.00%
Norton 360 v2 521.16 -38.25%
Trend Micro IS Pro 2008 161.95 -80.81%