Embed Size (px)
Citation preview
ANTIOXIDANT ACTIVITY OF FOOD PROTEINS AND FOOD
PROTEIN HYDROLYSATES
By
Prabhjot Singh
Department of Food Science and Agricultural Chemistry
Macdonald Campus, McGill University,
Montreal, Quebec
A thesis submitted to McGill University in partial fulfillment of
the requirements of the degree of Master of Science
June, 2011
© Prabhjot Singh, 2011
ii
Suggested Short Title:
ANTIOXIDANT ACTIVITY OF FOOD PROTEINS
iii
This thesis is dedicated to my beloved grandparents, Hira Singh and Jaswant
Kaur; my mother, Surinder Kaur and my sister, Sukhwinder Kaur.
iv
ABSTRACT
The objective of this research was to study the antioxidant activity of soybean protein
hydrolysates (SPH) and chickpea protein hydrolysates (CPH) at different concentrations, and to
measure the antioxidant activity of fractions collected from the RP-HPLC analysis of SPH and
CPH. Protein hydrolysates were prepared by the proteolytic enzyme trypsin. The hydrolysates
obtained were subjected to DPPH (1, 1-diphenyl-2 picrylhydrazyl) radical scavenging assay. The
SPH and CPH at concentration of 2.5-10 mg/ml showed antioxidant activity of 16.5-32 % and
3.4-26.8 %. SPH and CPH were fractionated by using RP-HPLC on C18 column. The
antioxidant activity of four SPH and CPH fractions (F I, F II, F III, and F IV) was measured by
using DPPH radical scavenging assay. For SPH, antioxidant activity of F III (47.7 %) was higher
than other fractions at protein concentration of 1 mg/mL and for CPH; F II showed maximum
antioxidant activity 27.9 % at protein concentration 1 mg/mL. The results from the SDS-PAGE
confirmed the hydrolysis of protein samples.
The second part of the study was to measure the impact of high pressure processing
(HPP) on the degree of hydrolysis and antioxidant activity of proteins. High pressure processing
(HPP) of isolated soybean protein (ISP) and isolated chickpea protein (ICP) was done at 400
MPa and 600 MPa for 5 min and 10 min. The degree of hydrolysis of isolated soybean protein
and isolated chickpea protein treated with high pressure processing and with trypsin hydrolysis
showed continuous increase from 12.4 to 24.9 % for SPH and 13.6 to 26.2 % for CPH. The
DPPH radical scavenging assay showed a more than two fold increase in antioxidant activity of
SPH and CPH: 67 % as compared to the 32 % of SPH without HPP and 56.6 % as compared to
the 26.8 % of CPH without HPP at concentration 10 mg/mL. These results show that HPP
increased the degree of hydrolysis and antioxidant activity of protein hydrolysates.
v
RÉSUMÉ
Le but principal de cette recherche constituait l’analyse du potentiel antioxydant, à
diverses concentrations, d’hydrolysats de protéine de soya (HPS) et d’hydrolysats de protéine de
pois chiche (HPP). Les hydrolysats de protéine ont été isolés à l’aide de l’enzyme protéolytique
trypsine. Les HPS et HPP démontraient respectivement un potentiel antioxydant de 16.5 à 32%
et 3.4 à 26.8 % lorsque présents à des concentrations de 2.5 à 10 mg/mL. L’utilisation d’une
colonne C18 a permis de séparer, par CLHP-PI, les HPS et HPP en quatre fractions (F I, F II, F
III, et F IV) qui furent dosées avec du DPPH (1,1-diphényl-2-picrylhydrazyle) afin de comparer
leur pouvoir de scavenging sur les radicaux. Pour les HPS, le potentiel antioxydant de F III (47.7
%) était supérieur à celui des autres échantillons alors que pour les HPP, 27.9 % (F II) était le
seuil maximal. Dans les deux cas, les hydrolysats étaient concentrés à 1mg/mL. L’hydrolyse des
échantillons de protéine a été confirmée par SDS-page.
La deuxième partie de l’étude visait à mesurer l’impact de la pascalisation sur le degré
d’hydrolyse et le potentiel antioxydant des protéines. Des isolats de protéine de soya (IPS) et de
protéine de pois chiche (IPP) ont été traités à haute pression (400 MPa et 600 MPa) pendant 5 et
10 min. Le degré d’hydrolyse des IPS et IPP soumis à la pascalisation et à la trypsin ont
démontré une augmentation constante allant de 12.4 à 24.9 % pour les isolats de protéine de soya
et de 13.6 à 26.2 % pour les isolats de protéine de pois chiche. L’analyse au DPPH du pouvoir
d’épuration des radicaux a montré que le potentiel antioxydant des hydrolysats a plus que
doublé, passant de 32 à 67 % pour les HPS et de 26.8 à 56.6 % pour les HPP, lorsqu’ils étaient
traités par hautes pressions. Cela démontre que la pascalisation améliore le degré d’hydrolyse et
le potentiel antioxydant des hydrolysats de protéines.
vi
ACKNOWLEDGEMENTS
First and foremost I offer my sincerest gratitude to my supervisor, Dr. Inteaz Alli, who
has supported me throughout my thesis with his patience, encouragement, advice, knowledge
and financial help whilst allowing me the place to work under his supervision. I attribute the
level of my Masters degree to his encouragement and effort and without him this thesis, too,
would not have been completed or written. One simply could not wish for a better or friendlier
supervisor. I would also like to express my sincere gratitude to his family for their generosity.
I would like to thank Dr. Salwa Karboune for her valuable help and giving me access to
her laboratory facilities during my research work. Sincere thanks to Dr. H. S. Ramaswamy for
giving me access to use his high pressure processing laboratory.
I would like to thank Dr. Anwer Ayad for his friendship and technical help during my
work. I would like to thank my colleagues Dr. Yu-Wei Chang, Shuting Zhou, and all my friends
from Punjab for their friendship and moral support throughout my work. A special thanks to
Catherine Dube for helping me in French translation of my Abstract. I would like to express my
sincere thanks to our department secretaries, Leslie Ann LaDuke and Diane Chan-Hum, and lab
technician, Eby Noroozi for their support and friendship.
Finally, my deepest gratitude goes to my family members for their encouragement and
support throughout my study. Above all I am grateful to my mother for her selfless support,
immense love and countless blessings which acted as a driving force and led me to achieve my
aim.
vii
TABLE OF CONTENTS
TITLE i
ABSTRACT iv
RESUME v
ACKNOWLEDGEMENTS vi
TABLE OF CONTENTS vii
LIST OF TABLES xi
LIST OF FIGURES xii
ABBREVIATIONS xv
CHAPTER 1 INTRODUCTION 1
1.1 General Introduction 1
1.2 Objectives of Research 2
CHAPTER 2 LITERATURE REVIEW 3
2.1 Protein and Peptides as Antioxidants 3
2.2 Antioxidant Mechanisms of Proteins 4
2.2.1 Lipid Oxidation 4
2.2.2 Sources of Antioxidants 6
2.2.2.1 Synthetic Antioxidants 6
2.2.2.2 Natural Antioxidants 6
2.2.3 Antioxidant Enzymes 7
2.2.3.1 Peroxidases 7
viii
2.2.3.2 Superoxide Dismutase 8
2.2.4 Inactivation and Sequestration of Prooxidative Metals by Proteins 8
2.2.5 Inhibition of Lipid Oxidation by Altering the Physical State of Foods 11
2.2.6 Scavenging Free Radicals and Reactive Oxygen Species by Proteins 12
2.2.7 Non-Radical Reduction of Lipid Hydroperoxides 14
2.3 Methods for Measuring Antioxidant Activity of Proteins 15
2.3.1 DPPH Radical-Scavenging Assay 15
2.3.2 Superoxide Radical-Scavenging Assay 15
2.3.3 Test of Inhibition of Linoleic Acid Autoxidation by Proteins 16
2.3.4 Test of Reducing Power 17
2.3.5 Antioxidant Activity of Food Protein Hydrolysates 17
2.3.5.1 Antioxidant Activity of Wheat Germ Protein Hydrolysates 18
2.3.5.2 Antioxidant Activity of Rice Endosperm Protein Hydrolysates 20
2.4 High Pressure Processing of Proteins 23
2.5 Increasing the Antioxidant Activity of Proteins 24
CHAPTER 3 MATERIALS AND METHODS 26
3.1 Materials 26
3.2 Preparation of Soybean and Chickpea Protein Hydrolysates 26
3.2.1 Enzymatic Hydrolysis of Protein Isolates and HPP Treated Proteins 26
3.2.2 Determination of Degree of Hydrolysis 28
3.2.3 High Pressure Processing (HPP) of Proteins 28
ix
3.3 Antioxidant Activity Assay 31
3.4 Characterization of Proteins and Protein Hydrolysates 31
3.4.1 Polyacrylamide Gel Electrophoresis (PAGE) 31
3.4.1.1 Sodium Dodecyl Sulfate Polyacrylamide Gel Electrophoresis 31
(SDS-PAGE)
3.4.1.1.1 Sample Preparation 31
3.4.1.1.2 Gel Concentration and Preparation 32
3.4.1.1.3 Electrophoresis Running Conditions 32
3.4.1.1.4 Protein Staining and Destaining 32
3.4.2 RP-HPLC Separation of Protein and Protein Hydrolysates 33
CHAPTER 4 RESULTS AND DISCUSSION 34
4.1 Enzymatic Hydrolysis 34
4.1.1 Trypsin Hydrolysis of Isolated Soybean Protein (ISP) and Isolated Chickpea
Protein (ICP) 34
4.2 Antioxidant Activity of Proteins and Protein Hydrolysates 37
4.2.1 Antioxidant Activity of Isolated Soybean Protein (ISP) and Soybean Protein
Hydrolysates (SPH); Isolated Chickpea Protein (ICP) and Chickpea Protein
Hydrolysates (CPH) 37
4.3 Characterization of Proteins and Protein Hydrolysates 40
4.3.1 SDS-PAGE of Isolated Soybean Protein (ISP), Soybean Protein
Hydrolysates (SPH), Isolated Chickpea Protein (ICP) and Chickpea
Protein Hydrolysates (CPH) 40
4.3.2 Reversed Phase HPLC (RP-HPLC) 43
x
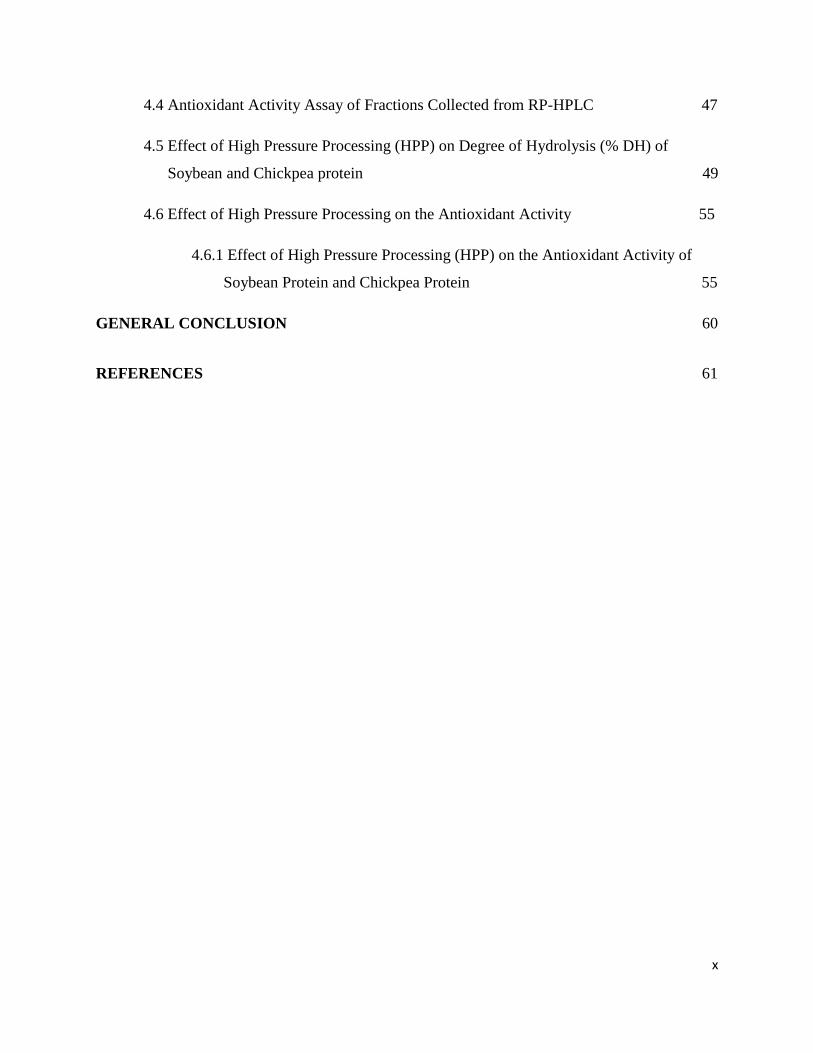
4.4 Antioxidant Activity Assay of Fractions Collected from RP-HPLC 47
4.5 Effect of High Pressure Processing (HPP) on Degree of Hydrolysis (% DH) of
Soybean and Chickpea protein 49
4.6 Effect of High Pressure Processing on the Antioxidant Activity 55
4.6.1 Effect of High Pressure Processing (HPP) on the Antioxidant Activity of
Soybean Protein and Chickpea Protein 55
GENERAL CONCLUSION 60
REFERENCES 61
xi
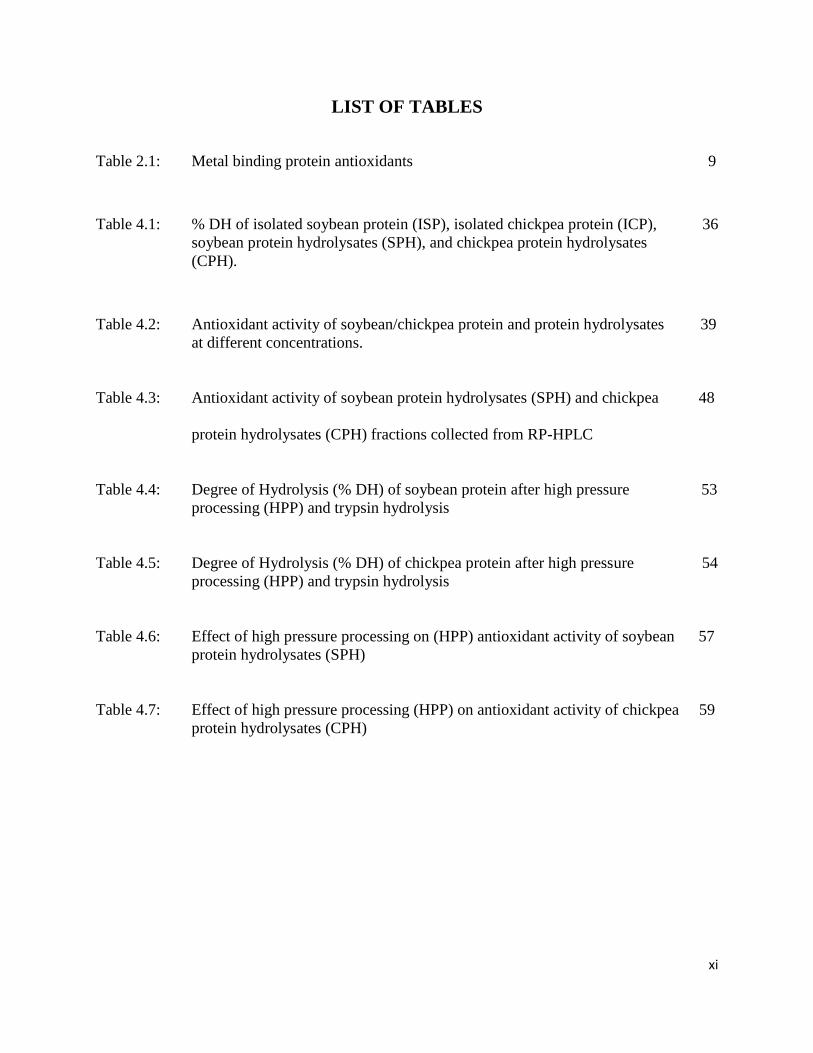
LIST OF TABLES
Table 2.1: Metal binding protein antioxidants 9
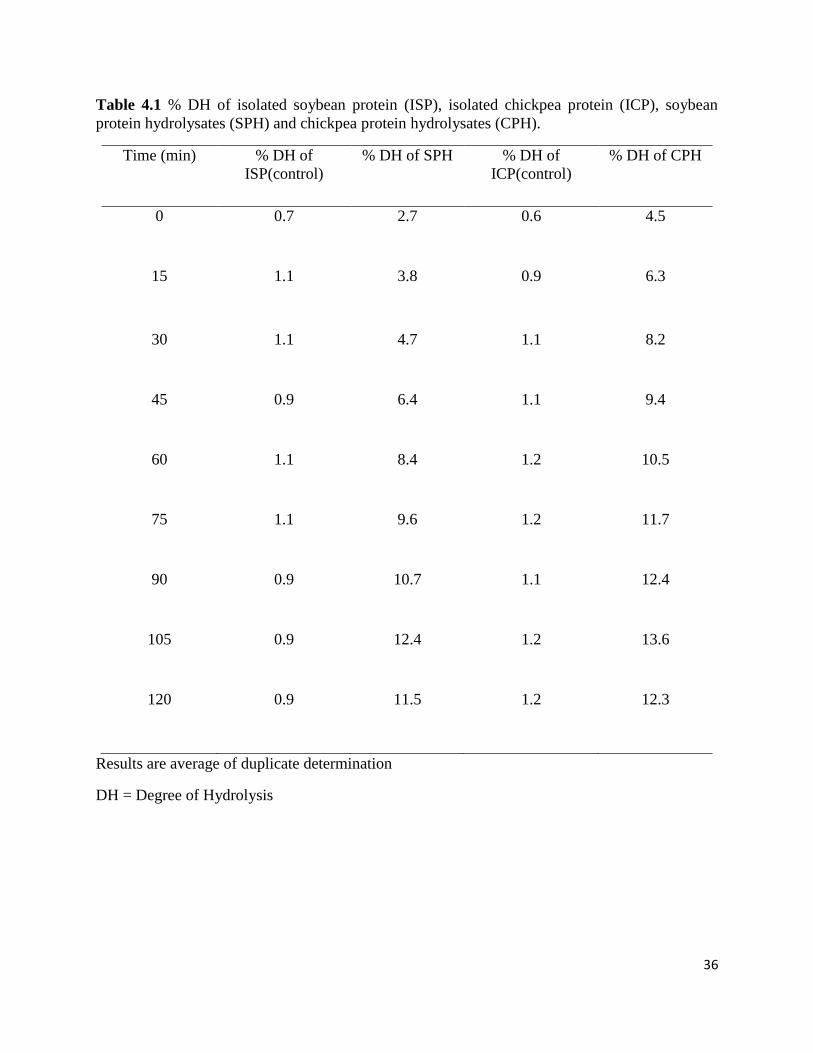
Table 4.1: % DH of isolated soybean protein (ISP), isolated chickpea protein (ICP), 36
soybean protein hydrolysates (SPH), and chickpea protein hydrolysates
(CPH).
Table 4.2: Antioxidant activity of soybean/chickpea protein and protein hydrolysates 39
at different concentrations.
Table 4.3: Antioxidant activity of soybean protein hydrolysates (SPH) and chickpea 48
protein hydrolysates (CPH) fractions collected from RP-HPLC
Table 4.4: Degree of Hydrolysis (% DH) of soybean protein after high pressure 53
processing (HPP) and trypsin hydrolysis
Table 4.5: Degree of Hydrolysis (% DH) of chickpea protein after high pressure 54
processing (HPP) and trypsin hydrolysis
Table 4.6: Effect of high pressure processing on (HPP) antioxidant activity of soybean 57
protein hydrolysates (SPH)
Table 4.7: Effect of high pressure processing (HPP) on antioxidant activity of chickpea 59
protein hydrolysates (CPH)
xii
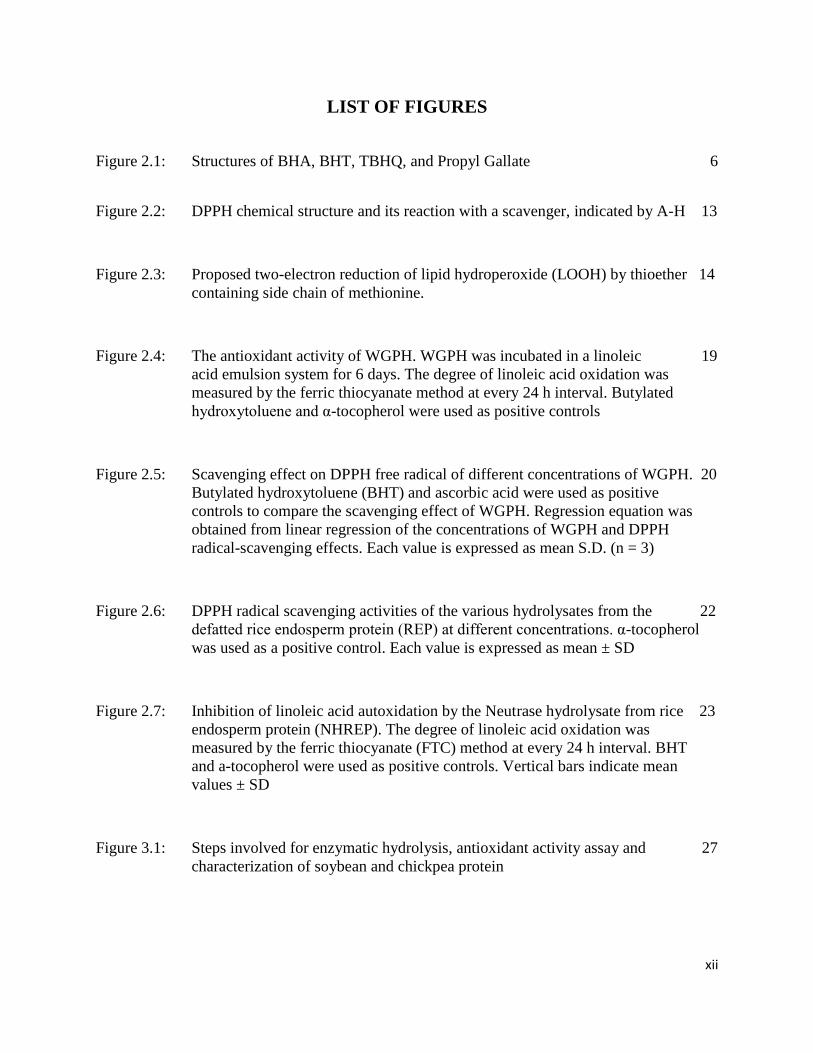
LIST OF FIGURES
Figure 2.1: Structures of BHA, BHT, TBHQ, and Propyl Gallate 6
Figure 2.2: DPPH chemical structure and its reaction with a scavenger, indicated by A-H 13
Figure 2.3: Proposed two-electron reduction of lipid hydroperoxide (LOOH) by thioether 14
containing side chain of methionine.
Figure 2.4: The antioxidant activity of WGPH. WGPH was incubated in a linoleic 19
acid emulsion system for 6 days. The degree of linoleic acid oxidation was
measured by the ferric thiocyanate method at every 24 h interval. Butylated
hydroxytoluene and α-tocopherol were used as positive controls
Figure 2.5: Scavenging effect on DPPH free radical of different concentrations of WGPH. 20
Butylated hydroxytoluene (BHT) and ascorbic acid were used as positive
controls to compare the scavenging effect of WGPH. Regression equation was
obtained from linear regression of the concentrations of WGPH and DPPH
radical-scavenging effects. Each value is expressed as mean S.D. (n = 3)
Figure 2.6: DPPH radical scavenging activities of the various hydrolysates from the 22
defatted rice endosperm protein (REP) at different concentrations. α-tocopherol
was used as a positive control. Each value is expressed as mean ± SD
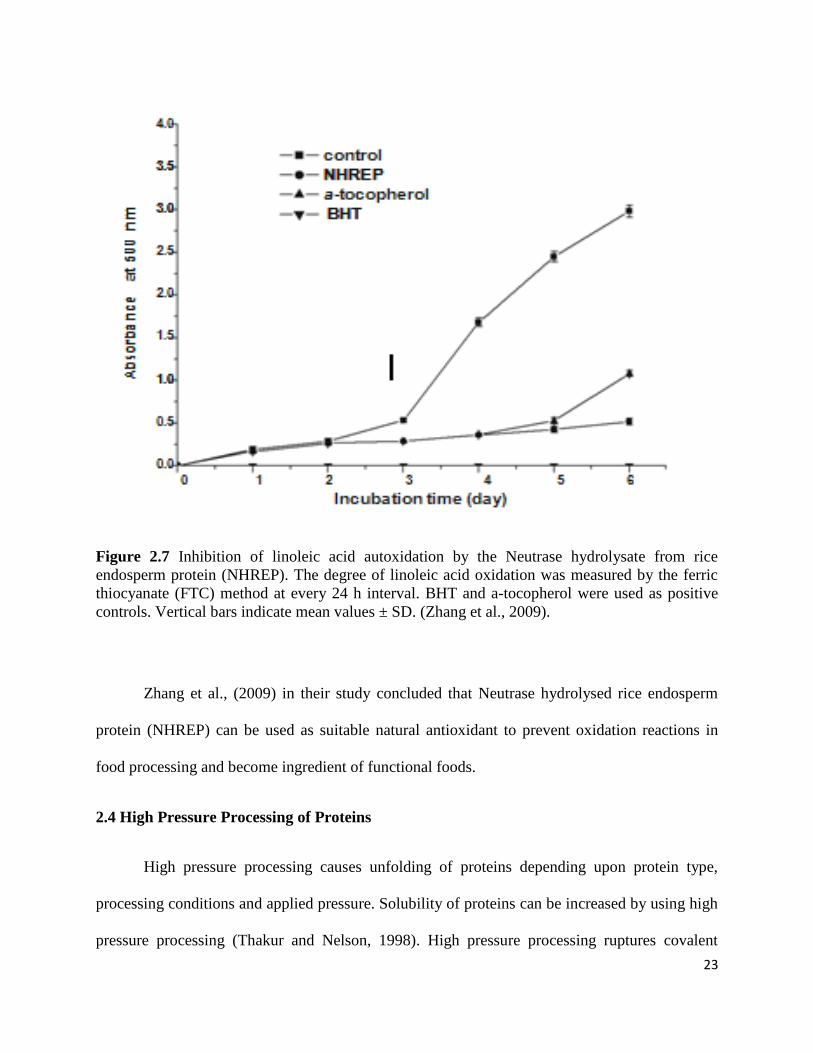
Figure 2.7: Inhibition of linoleic acid autoxidation by the Neutrase hydrolysate from rice 23
endosperm protein (NHREP). The degree of linoleic acid oxidation was
measured by the ferric thiocyanate (FTC) method at every 24 h interval. BHT
and a-tocopherol were used as positive controls. Vertical bars indicate mean
values ± SD
Figure 3.1: Steps involved for enzymatic hydrolysis, antioxidant activity assay and 27
characterization of soybean and chickpea protein
xiii
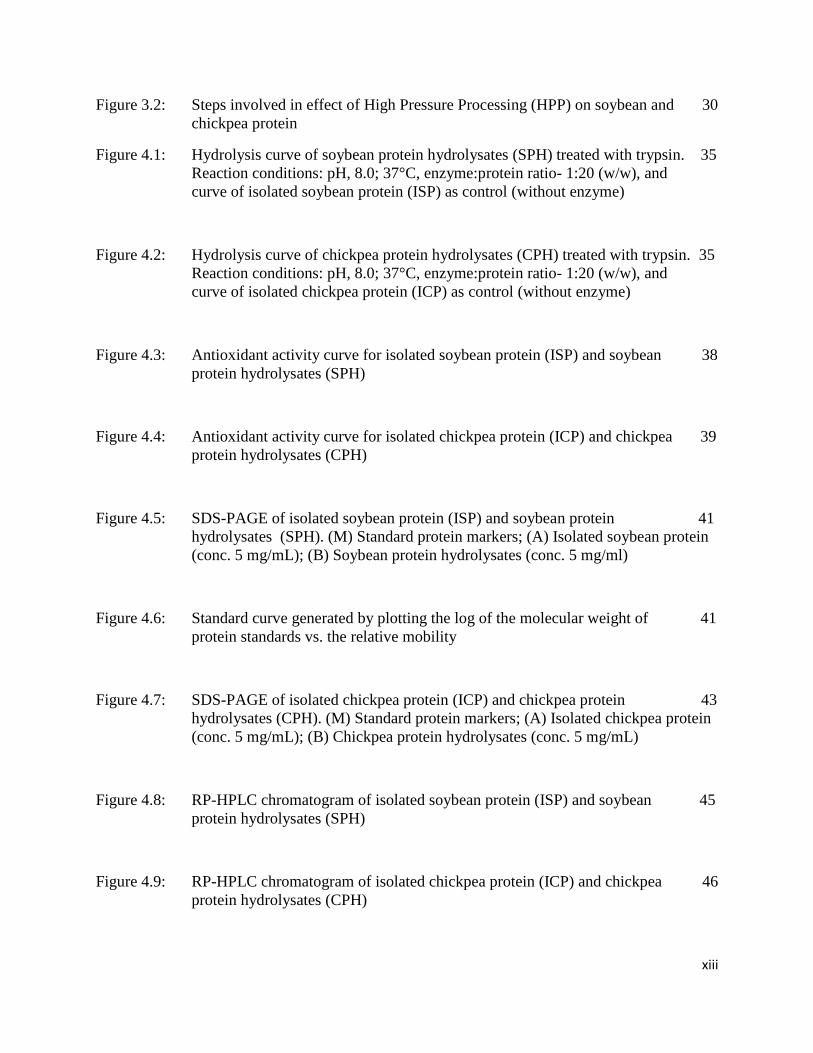
Figure 3.2: Steps involved in effect of High Pressure Processing (HPP) on soybean and 30
chickpea protein
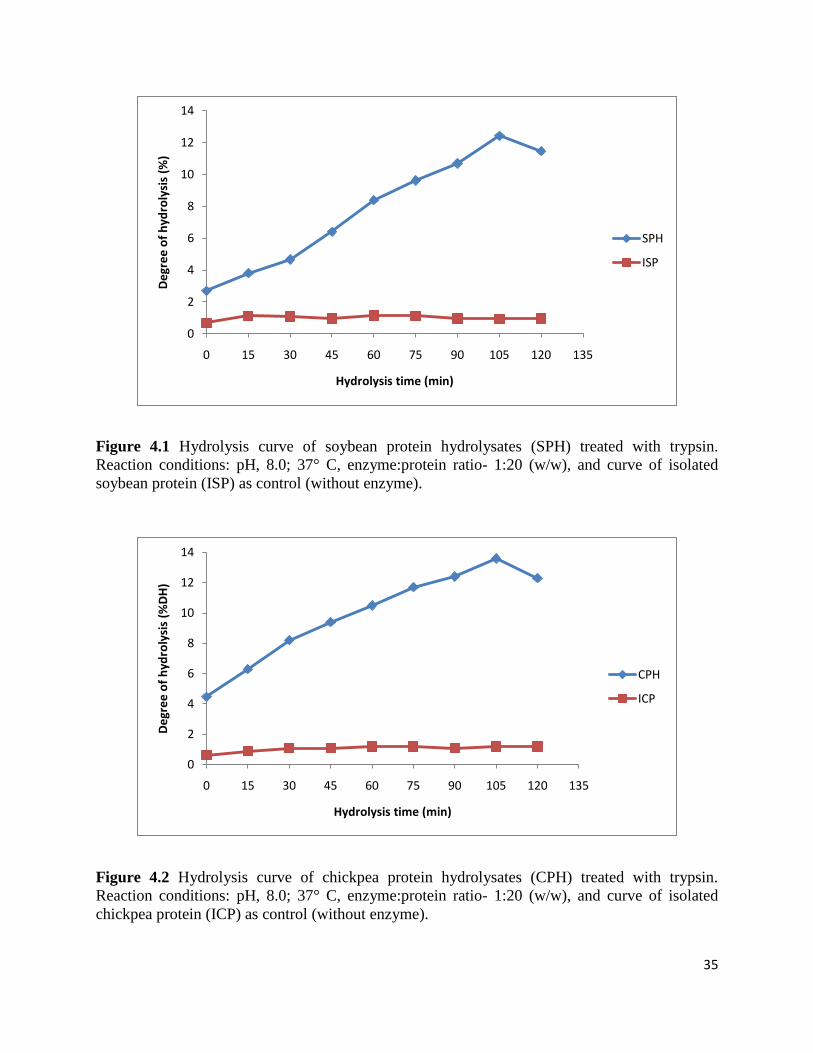
Figure 4.1: Hydrolysis curve of soybean protein hydrolysates (SPH) treated with trypsin. 35
Reaction conditions: pH, 8.0; 37°C, enzyme:protein ratio- 1:20 (w/w), and
curve of isolated soybean protein (ISP) as control (without enzyme)
Figure 4.2: Hydrolysis curve of chickpea protein hydrolysates (CPH) treated with trypsin. 35
Reaction conditions: pH, 8.0; 37°C, enzyme:protein ratio- 1:20 (w/w), and
curve of isolated chickpea protein (ICP) as control (without enzyme)
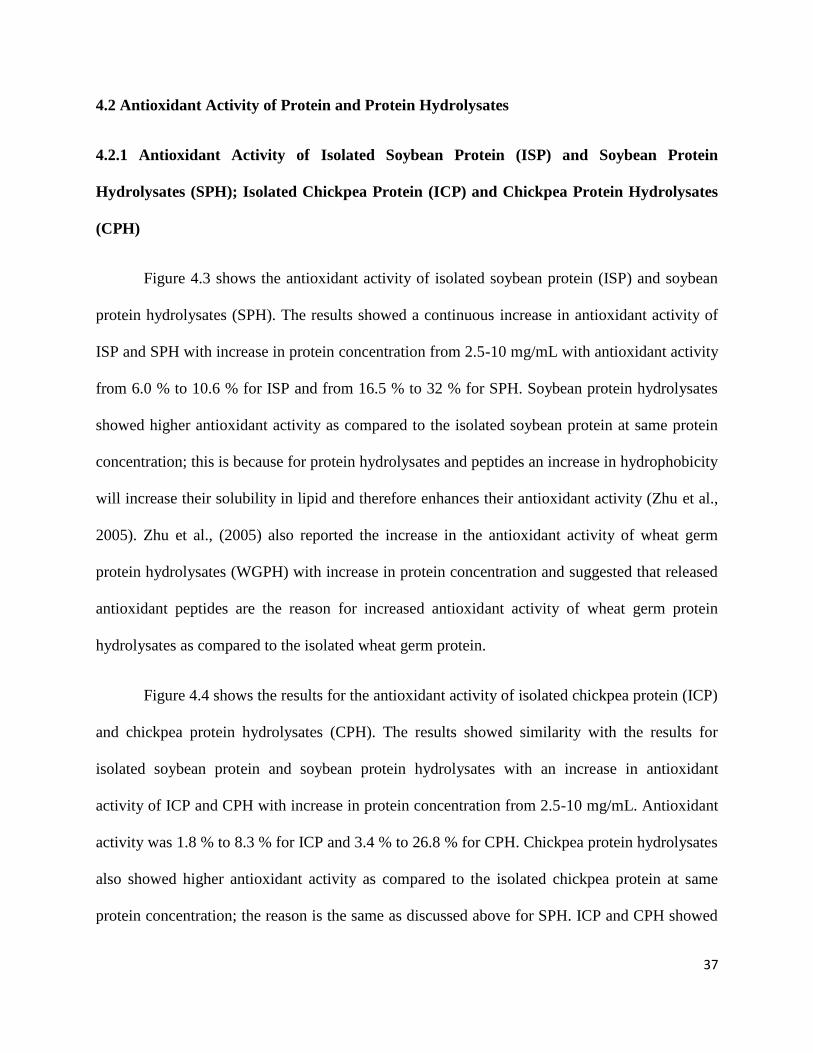
Figure 4.3: Antioxidant activity curve for isolated soybean protein (ISP) and soybean 38
protein hydrolysates (SPH)
Figure 4.4: Antioxidant activity curve for isolated chickpea protein (ICP) and chickpea 39
protein hydrolysates (CPH)
Figure 4.5: SDS-PAGE of isolated soybean protein (ISP) and soybean protein 41
hydrolysates (SPH). (M) Standard protein markers; (A) Isolated soybean protein
(conc. 5 mg/mL); (B) Soybean protein hydrolysates (conc. 5 mg/ml)
Figure 4.6: Standard curve generated by plotting the log of the molecular weight of 41
protein standards vs. the relative mobility
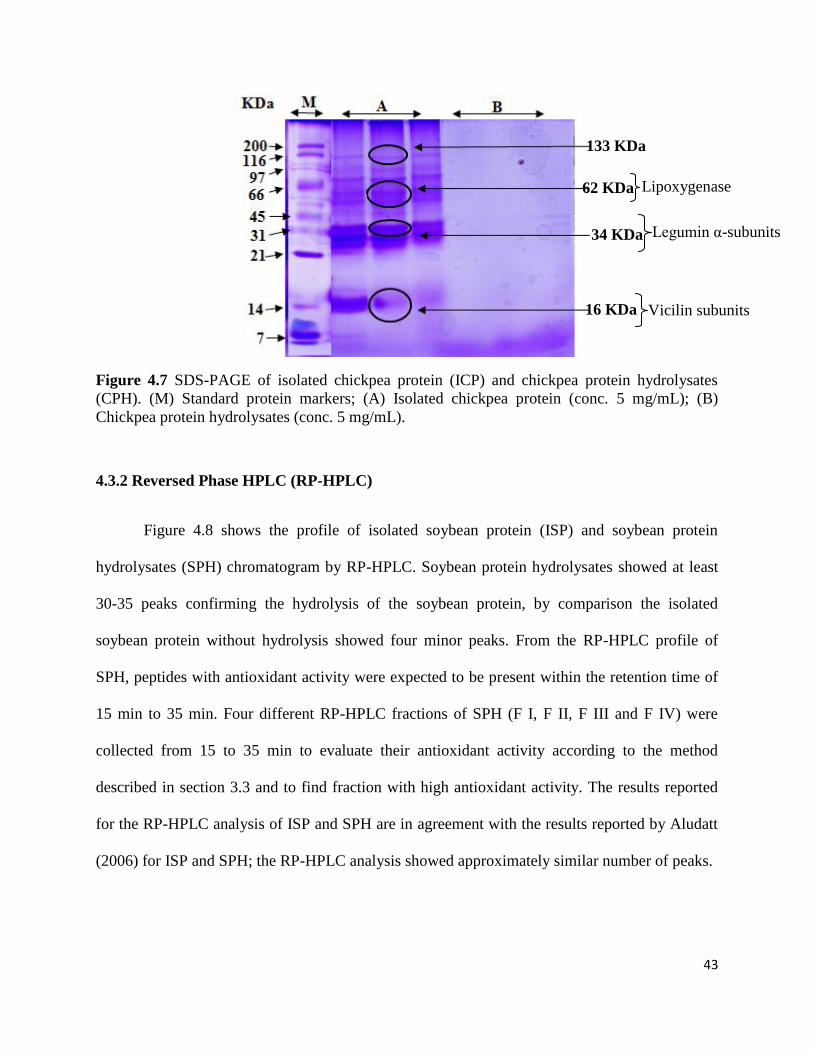
Figure 4.7: SDS-PAGE of isolated chickpea protein (ICP) and chickpea protein 43
hydrolysates (CPH). (M) Standard protein markers; (A) Isolated chickpea protein
(conc. 5 mg/mL); (B) Chickpea protein hydrolysates (conc. 5 mg/mL)
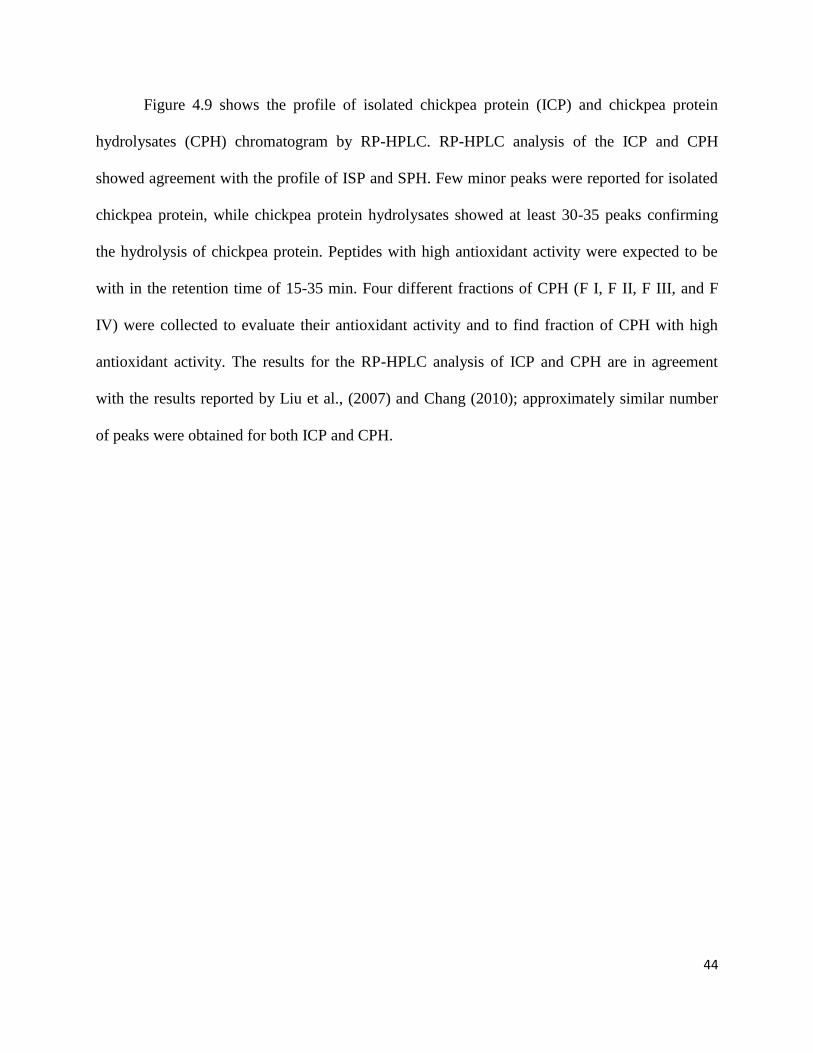
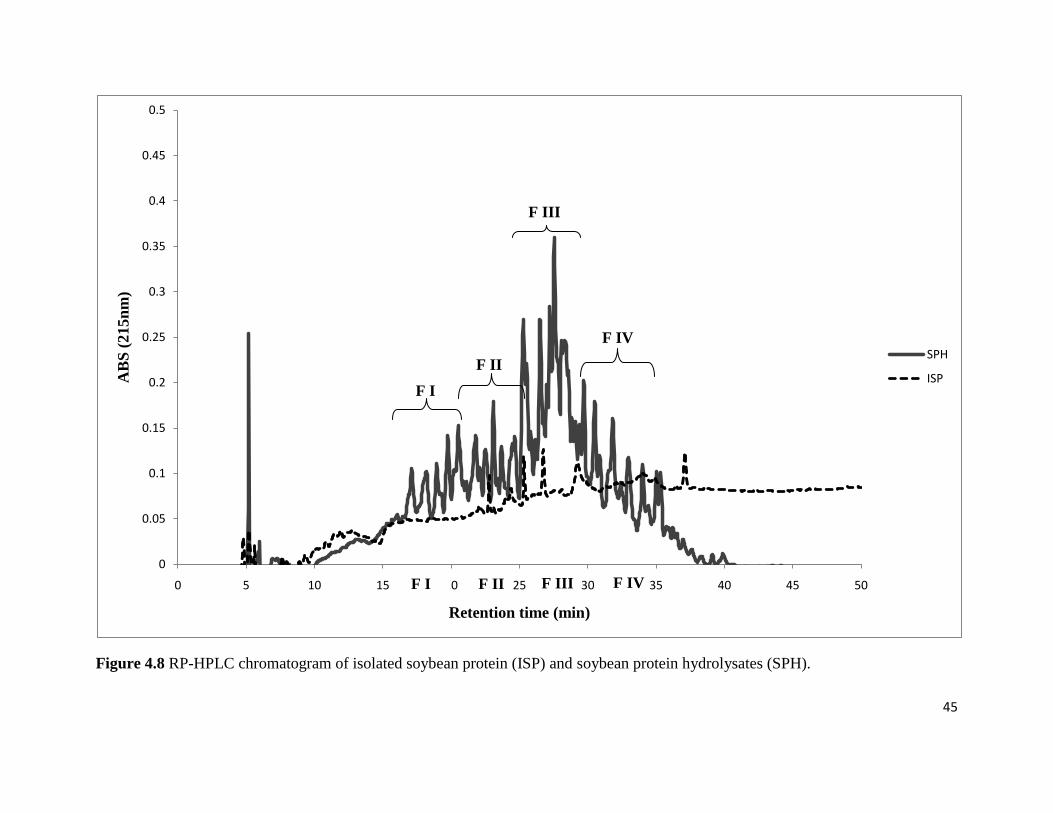
Figure 4.8: RP-HPLC chromatogram of isolated soybean protein (ISP) and soybean 45
protein hydrolysates (SPH)
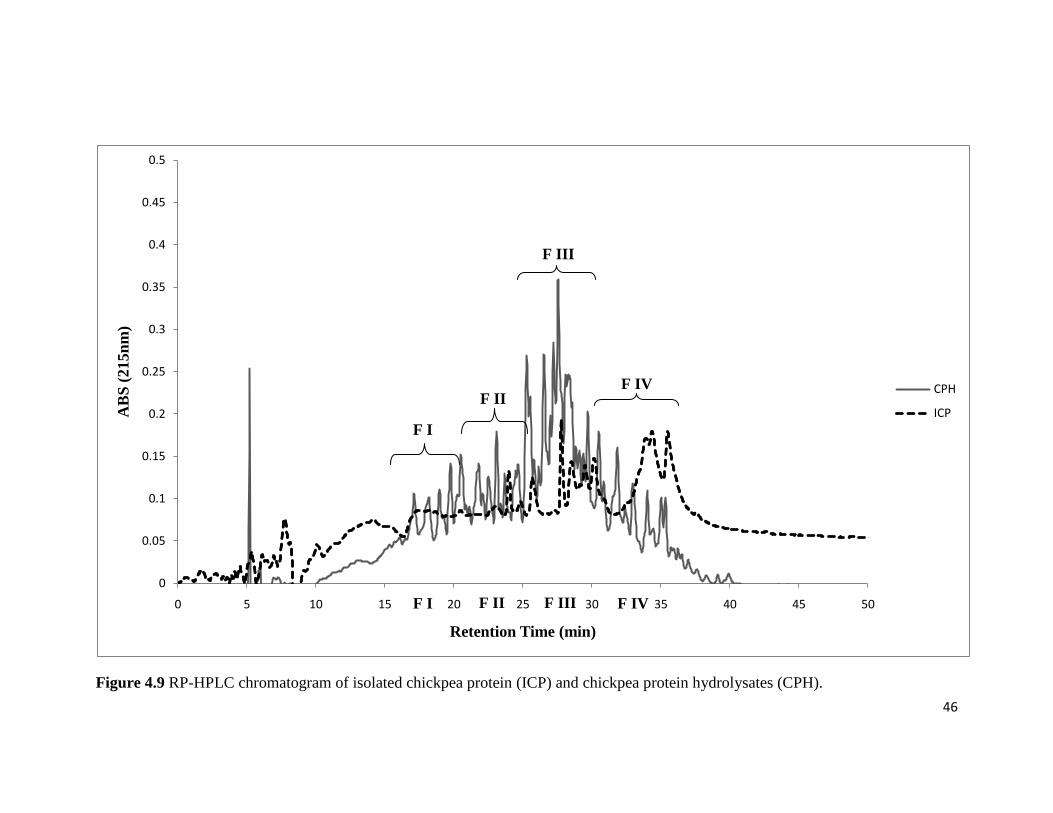
Figure 4.9: RP-HPLC chromatogram of isolated chickpea protein (ICP) and chickpea 46
protein hydrolysates (CPH)
xiv
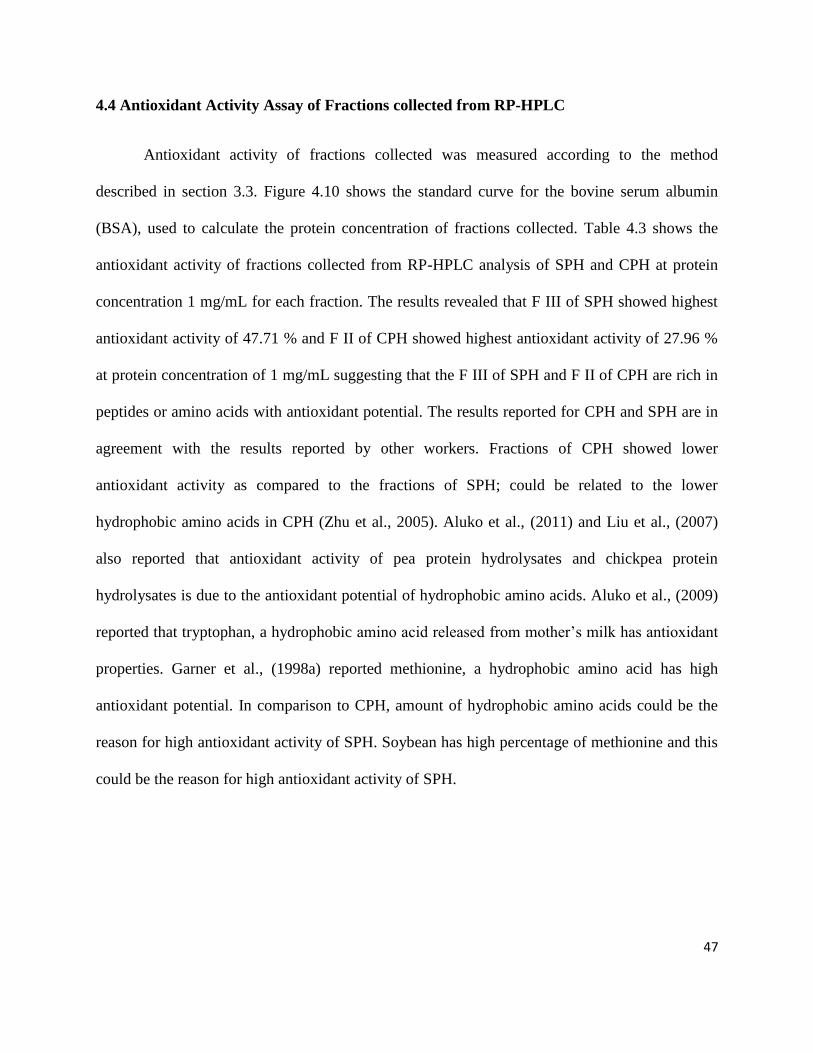
Figure 4.10: Standard curve for the bovine serum albumin used to calculate the protein 48
concentration of fractions collected from RP-HPLC
Figure 4.11: Trypsin hydrolysis curve of soybean protein hydrolysates (SPH) treated 51
with high pressure processing at 400 MPa and 600 MPa for 5 and 10 min
with trypsin and curve for isolated soybean protein (ISP) without trypsin and
without high pressure processing, and soybean protein hydrolysates (SPH)
without high pressure treatment and with trypsin. Reaction conditions: pH,
8.0; 37°C, enzyme-protein ratio- 1:20 (w/w)
Figure 4.12: Trypsin hydrolysis curve of chickpea protein hydrolysates (CPH) treated 52
with high pressure processing at 400 MPa and 600 MPa for 5 and 10 min,
and curve for isolated chickpea protein (ICP) without trypsin and without
high pressure processing, and chickpea protein hydrolysates (CPH) without
high pressure treatment and with trypsin. Reaction conditions: pH, 8.0;
37°C, enzyme -protein ratio- 1:20 (w/w)
Figure 4.13: Plot showing the effect of high pressure processing on the antioxidant activity 56
of soybean protein hydrolysates (SPH) at different concentrations with
different pressure and time interval
Figure 4.14: Plot showing the effect of high pressure processing on the antioxidant activity 58
of chickpea protein hydrolysates (CPH) at different concentrations with
different pressure and time interval
xv
ABBREVIATIONS
AA Antioxidant Activity
ABTS 2, 2’-azinobis (3-ethylbenzothiazaline-6-sulfonic acid
BHA Butylated Hydroxyanisole
BHT Butylated Hydroxytoluene
CPH Chickpea Protein Hydrolysates
DH Degree of Hydrolysis
DPPH 1, 1-diphenyl-2-picrylhydrazyl
EPR Electron Paramagnetic Resonance
ESR Electron Spin Resonance
FTC Ferric Thiocyanate
ICP Isolated Chickpea Protein
ISP Isolated Soybean Protein
LDL Low-density Lipoprotein
MetO Methionine Sulfoxide
MW Molecular Weight
NHREP Neutrase Hydrolysed Rice Endosperm Protein Hydrolysates
OPA o-Phthaldialdehyde
ORAC Oxygen Radical Absorbance Capacity
PAGE Polyacrylamide Gel Electrophoresis
RP-HPLC Reverse Phase- High Performance Liquid Chromatography
SDS Sodium Dodecyl Suplhate
SOD Superoxide Dismutase
SPH Soybean Protein Hydrolysates
TBARS Thiobarbituric Acid Reactive Substances
TBHQ Tert-butyl Hydroquinone
xvi
TBHQ Tert-butyl Hydroquinone
TCA Trichloroacetic Acid
WGPH Wheat Germ Protein Hydrolysates

1
CHAPTER 1
INTRODUCTION
1.1 General Introduction
Proteins are important components of foods and ingredients of food products. In addition
to their nutritional role, proteins can act as functional food ingredients, gelling agents, and
emulsifiers; have water and oil binding capacity and foaming characteristics. Proteins can also
act as free radical scavengers, chelating agents for transition metals, quenchers of singlet oxygen
molecule and decreases the radical damage in biological systems (Zielinski and Kozlowska,
2000). Recently due to concern over the safety of synthetic compounds, interest has been given
to naturally occurring antioxidants for the replacement of potentially toxic synthetic antioxidants.
As the demand for all natural products is increasing, the new technologies with improved natural
antioxidants are also needed. This has led to the new investigations into measuring the
antioxidant potential of biologically active peptides from protein hydrolysates (Li et al., 2007).
Proteins also have ability to inhibit lipid oxidation. Therefore the oxidative stability of the foods
can be increased by protecting the endogenous antioxidant enzymes, enhancing the activity of
the proteins by altering the structure, and by using proteins and peptides with antioxidant activity
as food additives.
Various food protein hydrolysates, for example pea protein hydrolysates (Aluko et al.,
2010), soy protein hydrolysates (Chen et al., 1996), milk protein hydrolysates (Kunio et al.,
2000) and wheat germ protein hydrolysates (Zhu et al., 2006) have ability to inhibit lipid
oxidation in foods. The antioxidant activity of proteins and protein hydrolysates is mainly due to,
inactivation and sequestration of pro-oxidative metals, their ability to scavenge free radicals,
2
non-radical reduction of lipid hydroperoxides; inhibition of lipid oxidation by altering the
physical state of food (Roberto, 2008).
Soybean (Glycine max) and chickpea (Cicer arietinum L.) are important food crops in
Canada and many other countries. Because of their relatively high protein contents (30-46 % for
soybean, 14.9-24.6 % for chickpea), both seeds can be good sources of peptides with antioxidant
potential. There is only little information on the antioxidant and free radical scavenging of
soybean and chickpea protein. Furthermore, there is no information on the effect of high pressure
processing on the solubility and functional properties of these proteins. Therefore it is of interest
to study the antioxidant activity and effect of high pressure processing on soybean and chickpea
proteins.
1.2 Objectives of Research
The overall objective of this research was to study the antioxidant activity of proteins and
protein hydrolysates. The specific objectives of this work were:
1. To investigate the tryptic hydrolysis of soybean and chickpea proteins and to determine
the antioxidant activity of soybean and chickpea protein hydrolysates.
2. To separate soybean and chickpea protein hydrolysates by using RP-HPLC and to collect
fractions at different retention time from RP-HPLC analysis and to investigate the protein
fraction with high antioxidant activity from RP-HPLC analysis.
3. To characterize soybean and chickpea protein hydrolysates using SDS-PAGE.
4. To evaluate the impact of high pressure processing on the degree of hydrolysis and
antioxidant activity of soybean and chickpea proteins.
3
CHAPTER 2
LITERATURE REVIEW
2.1 Proteins and Peptides as Antioxidants
There are several studies that demonstrate the ability of proteins and peptides to inhibit
lipid oxidation in food products. Proteins from various sources like milk protein (Diaz et al.,
2003), soy protein (Park et al., 2005), wheat protein (Zhu et al., 2005), rice protein (Zhang et al.,
2009), potato protein (Wang and Xiong, 2005), and corn protein (Kong and Xiong, 2006) exhibit
antioxidant activity. Procine blood plasma (2.5 %) retards the formation of thiobarbituric acid
reactive substances (TBARS) in both salted ground pork (Faraji et al., 1991) and cooked ground
beef (Shantha and Decker, 1995) due to the presence of antioxidant proteins such as albumin and
transferrin. Whey protein concentrate act as antioxidant in cooked beef (Shantha and Decker,
1995), and soy and whey proteins inhibit lipid oxidation in cooked pork patties containing 2 %
protein (Pena-Ramos and Xiong, 2003). Whey proteins have also been found to inhibit lipid
oxidation in oil-in-water emulsions (Taylor and Richardson, 1980; Allen and Wrieden, 1981a
and b; Donnelly et al., 1998; Tong et al., 2000; Elias et al., 2005).
Peptides resulting from hydrolysis of food proteins also act as antioxidants and inhibit
lipid oxidation in foods. Hydrolysates of whey, casein, soy, and egg yolk proteins inhibit lipid
oxidation in various muscle foods, such as beef, pork, and tuna (Sakanaka and Tachibana, 2006;
Diaz and Decker, 2005; Sakanaka et al., 2005, Pena-Ramos and Xiong, 2003). According to
Chan and Decker (1994), carnosine and anserine are histidine-containing dipeptides found in
skeletal muscle that exhibit antioxidant properties. Lipid oxidation and myoglobin discolouration
in muscle foods can be inhibited by addition of carnosine to muscle foods (Calvert and Decker,
4
1992; Decker and Crum, 1991). Wu et al., (2011) reported that free aromatic amino acids,
tryptophan and tyrosine from egg yolk have ability to inhibit lipid oxidation in foods. Aluko et
al., (2009) showed that tryptophan released from mother’s milk exhibit antioxidant properties.
2.2 Antioxidant Mechanisms of Proteins
2.2.1 Lipid Oxidation
Autooxidation is a process in which oxygen attacks at the susceptible lipids leading to
complex chemical changes, resulting in the rancidity and production of off flavours in the food.
The mechanism of oxidative rancidity or autooxidation of lipids has been well established
(Bateman et al., 1953; Labuza, 1971; Eriksson, 1987). Atmospheric oxygen reacts spontaneously
with organic compounds and degrades the structure of organic compounds, which is mainly
responsible for the loss in quality of the chemical products of industrial importance. The
spontaneous oxidative reaction in food systems can result in the deterioration of lipids (Jadhav et
al., 1996) because fats, oils and vitamins contains different amounts of unsaturated linkages in
their hydrocarbon chains and these unsaturated sites are susceptible to oxidation (Coulter, 1988).
Free-radical chain reaction is the direct reaction of a lipid molecule with a molecule of oxygen
(Jadhav et al., 1996) and the mechanism of autooxidation can be described in three steps: chain
initiation, chain propagation and chain termination (Bateman et al., 1953; Labuza, 1971;
Eriksson, 1987).
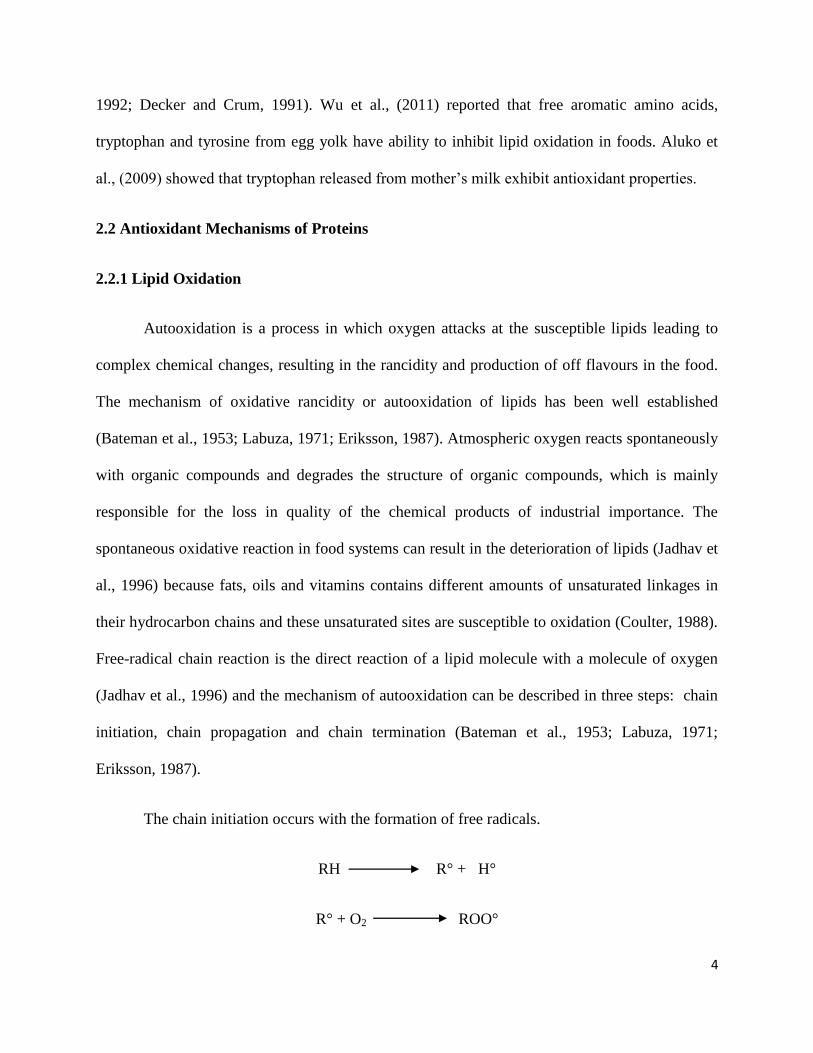
The chain initiation occurs with the formation of free radicals.
RH R° + H°
R° + O2 ROO°
5
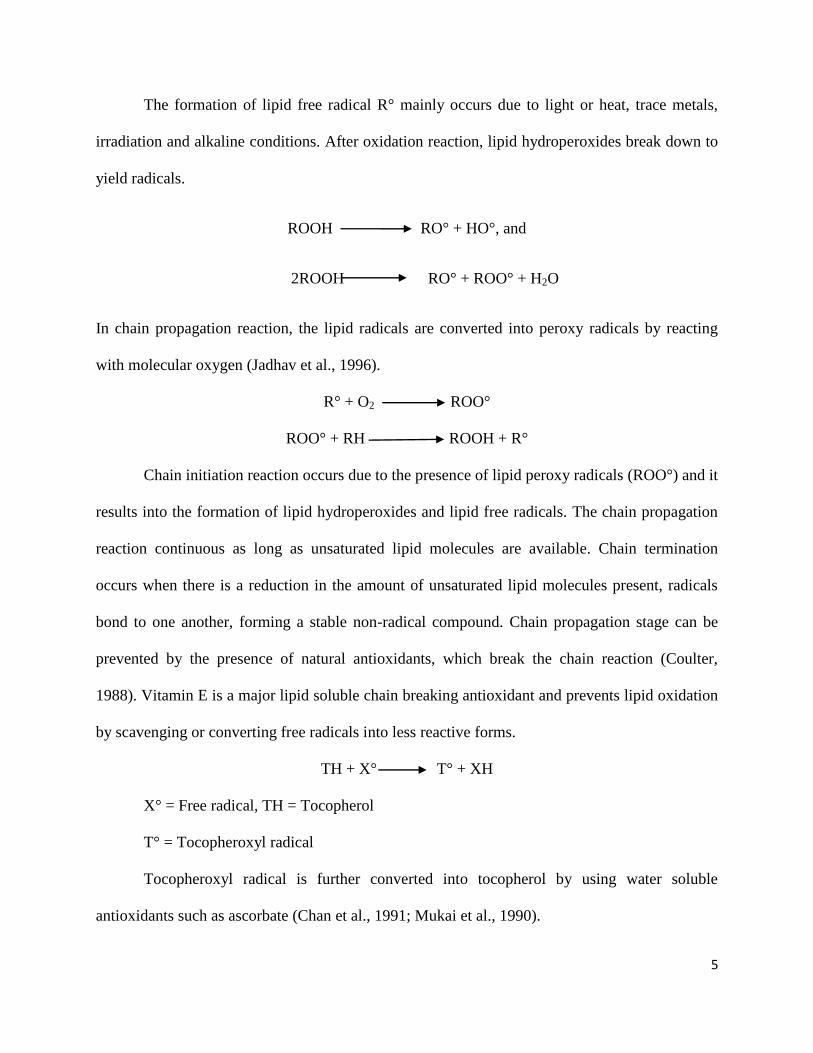
The formation of lipid free radical R° mainly occurs due to light or heat, trace metals,
irradiation and alkaline conditions. After oxidation reaction, lipid hydroperoxides break down to
yield radicals.
ROOH RO° + HO°, and
2ROOH RO° + ROO° + H2O
In chain propagation reaction, the lipid radicals are converted into peroxy radicals by reacting
with molecular oxygen (Jadhav et al., 1996).
R° + O2 ROO°
ROO° + RH ROOH + R°
Chain initiation reaction occurs due to the presence of lipid peroxy radicals (ROO°) and it
results into the formation of lipid hydroperoxides and lipid free radicals. The chain propagation
reaction continuous as long as unsaturated lipid molecules are available. Chain termination
occurs when there is a reduction in the amount of unsaturated lipid molecules present, radicals
bond to one another, forming a stable non-radical compound. Chain propagation stage can be
prevented by the presence of natural antioxidants, which break the chain reaction (Coulter,
1988). Vitamin E is a major lipid soluble chain breaking antioxidant and prevents lipid oxidation
by scavenging or converting free radicals into less reactive forms.
TH + X° T° + XH
X° = Free radical, TH = Tocopherol
T° = Tocopheroxyl radical
Tocopheroxyl radical is further converted into tocopherol by using water soluble
antioxidants such as ascorbate (Chan et al., 1991; Mukai et al., 1990).
6
2.2.2 Sources of Antioxidants
2.2.2.1 Synthetic Antioxidants
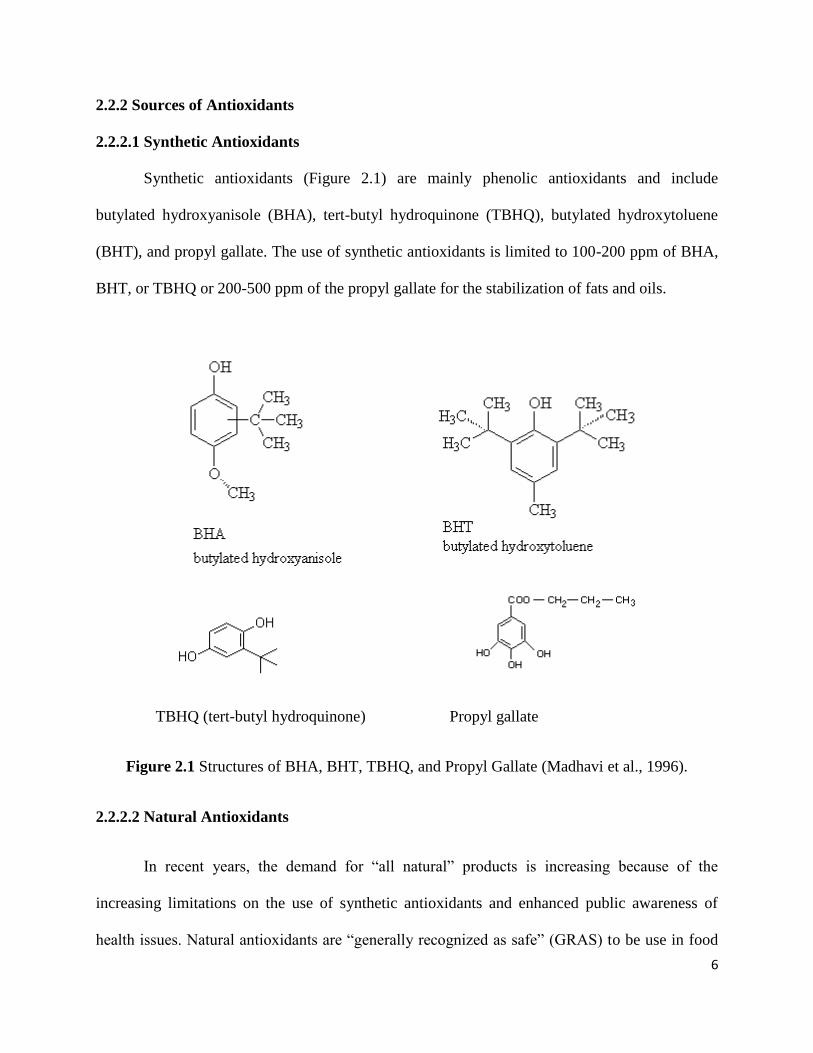
Synthetic antioxidants (Figure 2.1) are mainly phenolic antioxidants and include
butylated hydroxyanisole (BHA), tert-butyl hydroquinone (TBHQ), butylated hydroxytoluene
(BHT), and propyl gallate. The use of synthetic antioxidants is limited to 100-200 ppm of BHA,
BHT, or TBHQ or 200-500 ppm of the propyl gallate for the stabilization of fats and oils.
TBHQ (tert-butyl hydroquinone) Propyl gallate
Figure 2.1 Structures of BHA, BHT, TBHQ, and Propyl Gallate (Madhavi et al., 1996).
2.2.2.2 Natural Antioxidants
In recent years, the demand for “all natural” products is increasing because of the
increasing limitations on the use of synthetic antioxidants and enhanced public awareness of
health issues. Natural antioxidants are “generally recognized as safe” (GRAS) to be use in food
7
components. Many natural food components like oils and oilseeds, proteins and protein
hydrolysates, fruits and vegetables, oat and rice bran, spices, herbs and tea have antioxidant
properties. Natural antioxidants from these food components provide oxidative stability to the
food product.
As antioxidative properties of proteins contribute to the endogenous antioxidant capacity
of foods, therefore proteins can also be used as potential antioxidant additives. Lipid oxidation in
foods can be inhibited by using proteins by their biologically designed mechanisms (e.g.
antioxidant enzymes and iron-binding proteins) or by nonspecific mechanisms (e.g. scavenging
of free radicals and reactive oxygen species). Overall, the antioxidant activity of proteins is
mainly due to interactions between their ability to inactivate reactive oxygen species, chelate
prooxidative transition metals, scavenge free radicals, and reduction of hydroperoxides.
2.2.3 Antioxidant Enzymes
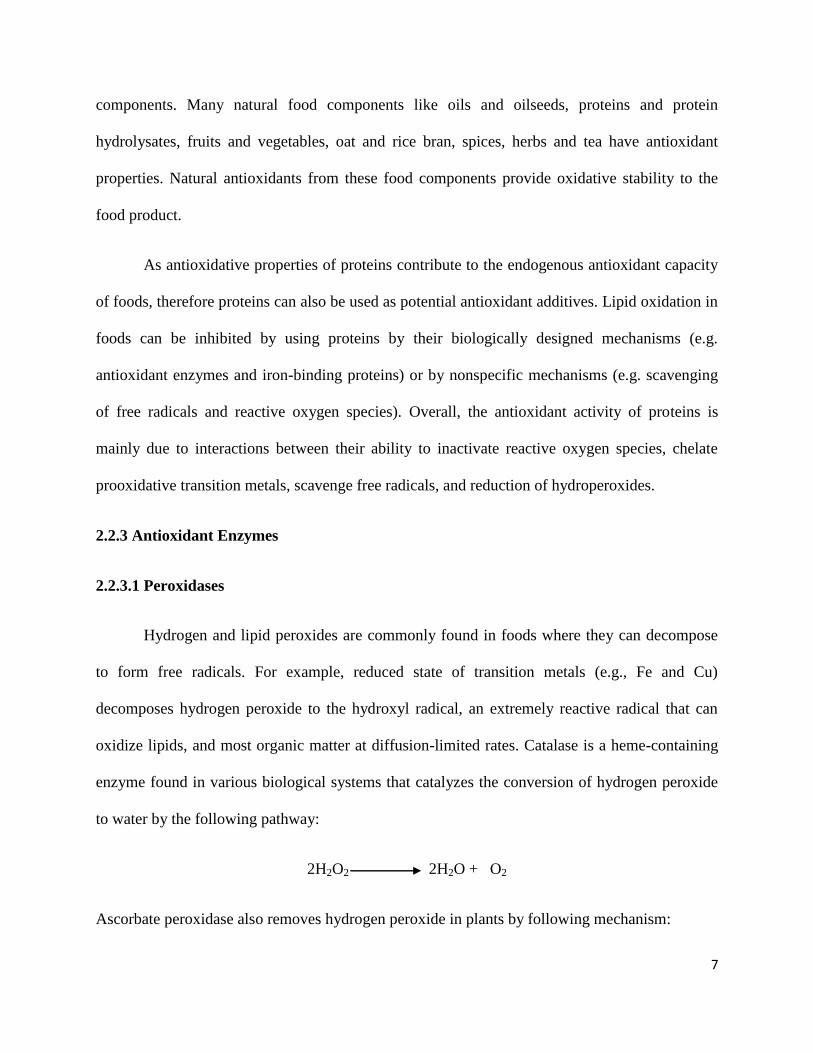
2.2.3.1 Peroxidases
Hydrogen and lipid peroxides are commonly found in foods where they can decompose
to form free radicals. For example, reduced state of transition metals (e.g., Fe and Cu)
decomposes hydrogen peroxide to the hydroxyl radical, an extremely reactive radical that can
oxidize lipids, and most organic matter at diffusion-limited rates. Catalase is a heme-containing
enzyme found in various biological systems that catalyzes the conversion of hydrogen peroxide
to water by the following pathway:
2H2O2 2H2O + O2
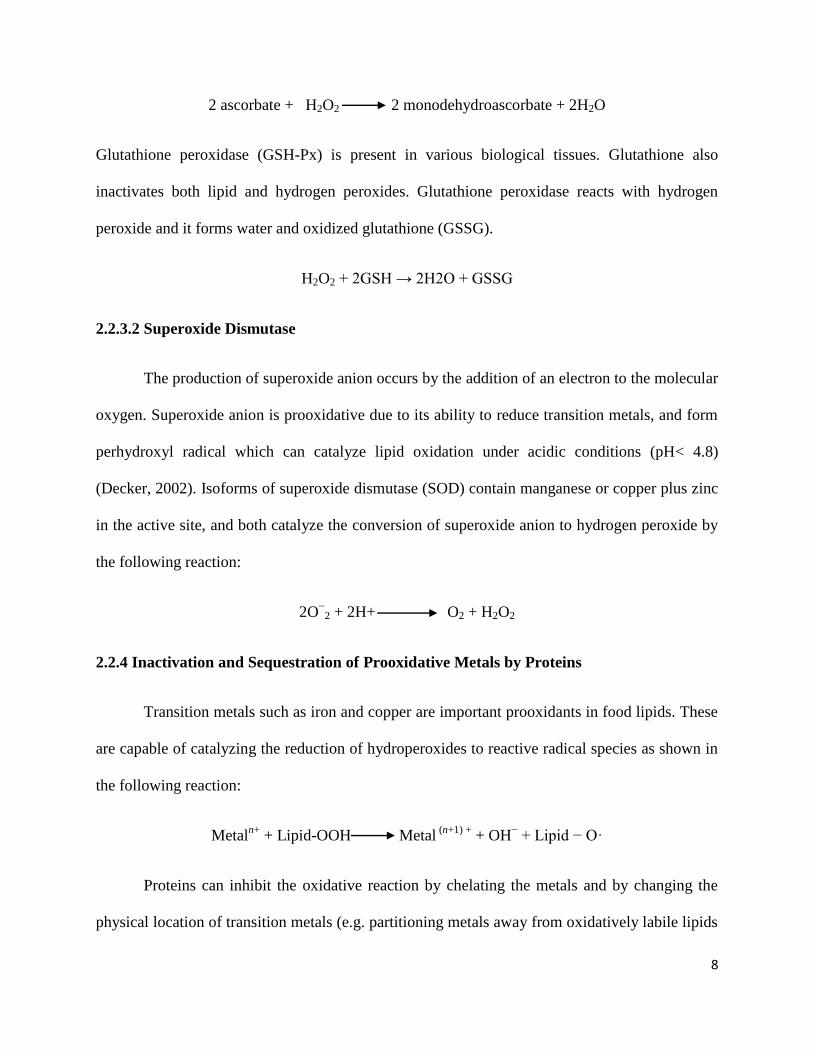
Ascorbate peroxidase also removes hydrogen peroxide in plants by following mechanism:
8
2 ascorbate + H2O2 2 monodehydroascorbate + 2H2O
Glutathione peroxidase (GSH-Px) is present in various biological tissues. Glutathione also
inactivates both lipid and hydrogen peroxides. Glutathione peroxidase reacts with hydrogen
peroxide and it forms water and oxidized glutathione (GSSG).
H2O2 + 2GSH → 2H2O + GSSG
2.2.3.2 Superoxide Dismutase
The production of superoxide anion occurs by the addition of an electron to the molecular
oxygen. Superoxide anion is prooxidative due to its ability to reduce transition metals, and form
perhydroxyl radical which can catalyze lipid oxidation under acidic conditions (pH< 4.8)
(Decker, 2002). Isoforms of superoxide dismutase (SOD) contain manganese or copper plus zinc
in the active site, and both catalyze the conversion of superoxide anion to hydrogen peroxide by
the following reaction:
2O−
2 + 2H+ O2 + H2O2
2.2.4 Inactivation and Sequestration of Prooxidative Metals by Proteins
Transition metals such as iron and copper are important prooxidants in food lipids. These
are capable of catalyzing the reduction of hydroperoxides to reactive radical species as shown in
the following reaction:
Metaln+
+ Lipid-OOH Metal (n+1) +
+ OH− + Lipid − O·
Proteins can inhibit the oxidative reaction by chelating the metals and by changing the
physical location of transition metals (e.g. partitioning metals away from oxidatively labile lipids
9
or hydroperoxides), forming insoluble metal complexes, reducing the chemical reactivity of the
transition metals, and by sterically hindering the interaction of metals and dispersed lipids (Diaz
et al., 2003). Various food proteins function as binding prooxidant metals. Proteins whose
biological function is to chelate and store or transport catalytically inactive metals are found in
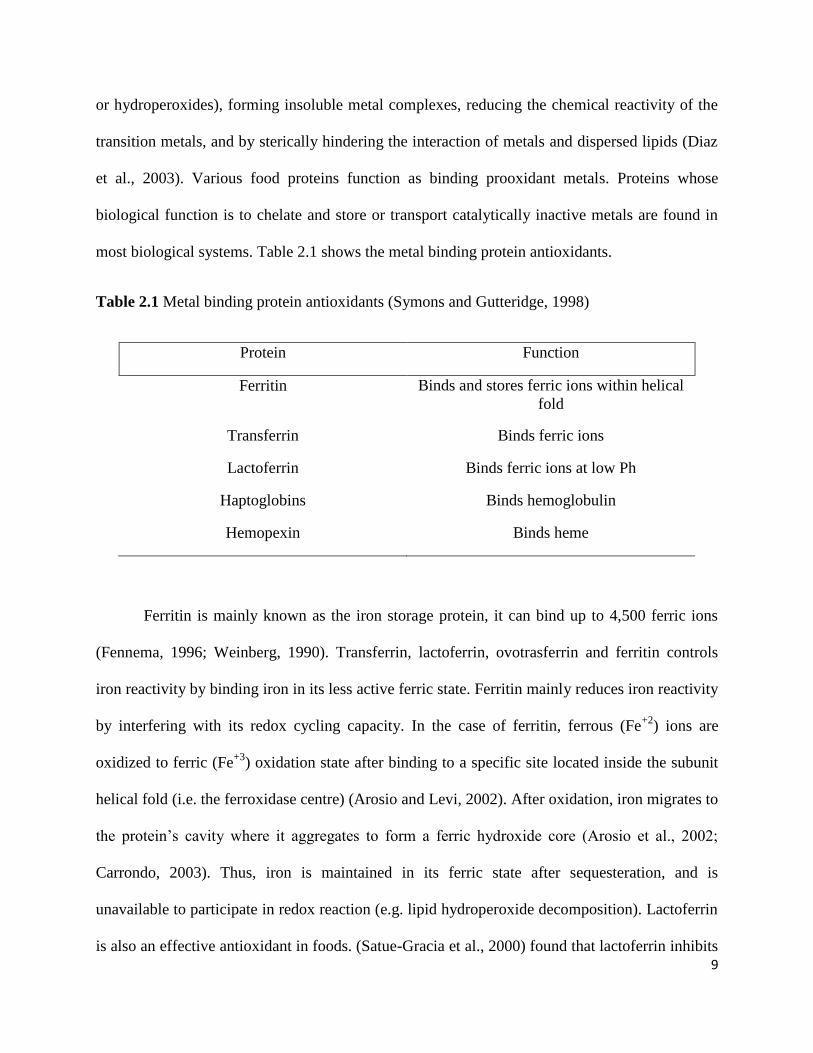
most biological systems. Table 2.1 shows the metal binding protein antioxidants.
Table 2.1 Metal binding protein antioxidants (Symons and Gutteridge, 1998)
Protein Function
Ferritin Binds and stores ferric ions within helical
fold
Transferrin Binds ferric ions
Lactoferrin Binds ferric ions at low Ph
Haptoglobins Binds hemoglobulin
Hemopexin Binds heme
Ferritin is mainly known as the iron storage protein, it can bind up to 4,500 ferric ions
(Fennema, 1996; Weinberg, 1990). Transferrin, lactoferrin, ovotrasferrin and ferritin controls
iron reactivity by binding iron in its less active ferric state. Ferritin mainly reduces iron reactivity
by interfering with its redox cycling capacity. In the case of ferritin, ferrous (Fe+2
) ions are
oxidized to ferric (Fe+3
) oxidation state after binding to a specific site located inside the subunit
helical fold (i.e. the ferroxidase centre) (Arosio and Levi, 2002). After oxidation, iron migrates to
the protein’s cavity where it aggregates to form a ferric hydroxide core (Arosio et al., 2002;
Carrondo, 2003). Thus, iron is maintained in its ferric state after sequesteration, and is
unavailable to participate in redox reaction (e.g. lipid hydroperoxide decomposition). Lactoferrin
is also an effective antioxidant in foods. (Satue-Gracia et al., 2000) found that lactoferrin inhibits
10
lipid oxidation in infant formula. Lactoferrin also inhibits lipid oxidation in milk and mayonnaise
(Nielsen et al., 2004). Haptoglobins and hemopexins are extracellular antioxidants that are
capable of binding hemoglobulin and heme, respectively (Symons and Gutteridge, 1998).
Copper is also a prooxidative transition metal mainly present in food at lower
concentration than iron. Copper is a more effective catalyst than iron in decomposition of
hydroperoxide (Halliwell and Gutteridge, 1990). Proteins also form complexes with copper and
thus can affect lipid oxidation. In various biological tissues, copper is bound by proteins such as
serum albumin (one cupric ion per protein) and ceruloplasmin (six cupric ions per protein).
These proteins inhibit lipid oxidation as in copper-catalyzed oxidation of low-density lipoprotein
(LDL), where oxidation rates are inversely proportional to the concentration of bovine serum
albumin (BSA) (Bourdon et al., 1999; Schnitzer et al., 1997). Various amino acid residues such
as histidine, glutamic acid, aspartic acid, threonine, and phosphorylated serine are known to bind
metals. The ability of a protein to chelate metals is mainly dependent on pH. For example, if the
pH value is above the isoelectric point, a net anionic charge will be established on a protein. This
results in electrostatic attraction between the protein and cationic transition metals, which
ultimately inhibits lipid oxidation reactions.
Various proteins have been reported to bind prooxidative transition metals. These include
casein (Diaz et al., 2005; Diaz et al., 2003), whey protein (Faraji et al., 2004; Tong et al., 2000),
soy proteins (Faraji et al., 2004), bovine serum albumin (Villiere et al., 2005), zein (Kong and
Xiong, 2006), and potato protein (Wang and Xiong, 2005).
The metal-catalyzed decomposition of lipid hydroperoxides is thought to be dominant
oxidative pathway in processed foods, and in particular oil-in-water emulsions (McClements and
11
Decker, 2000). This reaction mainly occurs at the surface of the emulsion droplet because lipid
hydroperoxides are surface active and migrate to the water-oil interface. One way in which
proteins can inhibit lipid oxidation reaction in oil-in-water emulsions is by changing the physical
location of aqueous prooxidants, in this way the metals are moved away from the surface of
emulsion droplet, reducing its ability to decompose lipid hydroperoxides.
2.2.5 Inhibition of Lipid Oxidation by Proteins by Altering the Physical State of Foods
In various food products, lipid oxidation reactions do not occur randomly but instead
occur at specific locations based on the physicochemical properties of the food product. For
example, in the case of metal-catalyzed oxidation in lipid dispersions, surface active lipid
hydroperoxides concentrate at oil-water interfaces. Aqueous phase transition metals can catalyze
the decomposition of these hydroperoxides and produces radical species. Proteins inhibit lipid
oxidation in such lipid dispersions by hindering access of metals to the oil-water interface
through electrostatic repulsion. In protein-stabilized oil-in-water emulsions where lipid oxidation
rates are slower at pH values below the isoelectric point of the proteins. A net cationic charge is
established at the water-oil interface, repelling iron and physically hindering the ability of cations
from binding to the droplet interface (Donnelly et al., 1998; Hu et al., 2003a; Hu et al., 2003b;
Kellerby et al., 2006).
Lipid oxidation rate is also affected by thickness or existence of a thick emulsion droplet
interface that physically inhibits the ability of iron to access lipid hydroperoxides at the droplet
surface. In protein-stabilized oil-in-water emulsions, protein could form a thick interfacial layer
that inhibits metal-lipid interactions. For example, casein forms an interfacial layer around
dispersed oil droplets up to 10 nm compared to 1-2 nm for whey proteins (Dalgleish et al., 1995).
12
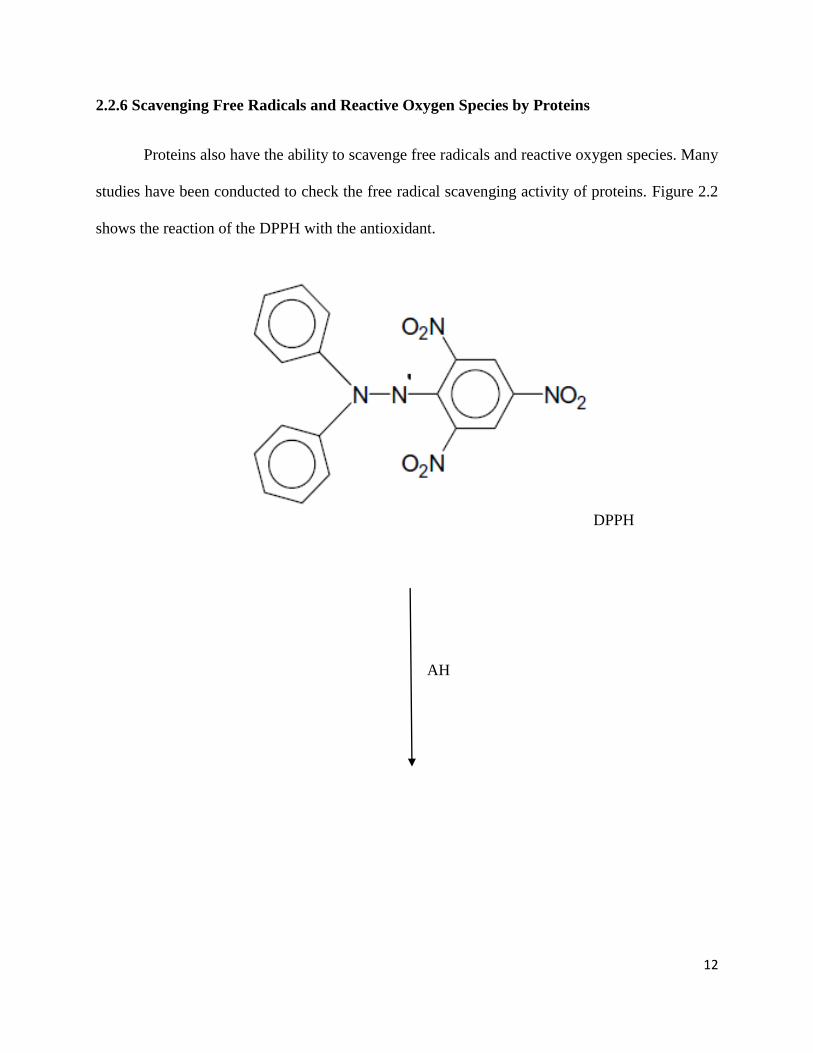
2.2.6 Scavenging Free Radicals and Reactive Oxygen Species by Proteins
Proteins also have the ability to scavenge free radicals and reactive oxygen species. Many
studies have been conducted to check the free radical scavenging activity of proteins. Figure 2.2
shows the reaction of the DPPH with the antioxidant.
DPPH
AH
13
Figure 2.2 DPPH chemical structure and its reaction with a scavenger, indicated by A-H
(Roberto, 2008).
These studies have typically employed the use of free radical generators, and a
determination is made if a given protein can scavenge the radical species produced. For example,
a radical scavenging assay using 1, 1-diphenyl-2-picrylhydrazyl (DPPH) has shown that rice
endosperm protein (Zhang et al., 2009), wheat germ protein (Zhu et al., 2005) and egg yolk
proteins (Sakanaka and Tachibana, 2006) can scavenge free radicals.
A second radical scavenging assay using oxygen radical absorbance capacity (ORAC) is
a common method that measures the ability of a free radical scavenger to quench peroxyl
radicals generated by 2, 2-azo-bis (2-methylpropionamidine) dihydrochloride (AAPH) and
protect the fluorescent marker, fluorescein. Using ORAC, β-lactoglobulin (Elias et al., 2006) and
casein (Diaz et al., 2005) were shown to scavenge peroxyl radicals. Radical scavenging activity
has also been measured by using free radicals generated by 2, 2’-azinobis (3-
ethylbenzothiazoline-6sulfonic acid) (ABTS) to show that zein (Kong and Xiong, 2006) and
potato (Wang and Xiong, 2005) proteins quench free radicals. Proteins and free radicals
interactions can also be measured by electron paramagnetic resonance (EPR) (Davies and
14
Hawkins, 2004) or electron spin resonance (ESR). Using electron paramagnetic resonance,
bovine serum albumin, β-lactoglobulin, and lactoferrin were shown to scavenge free radicals
generated from cumene hydroperoxide and iron (Pazos et al., 2006).
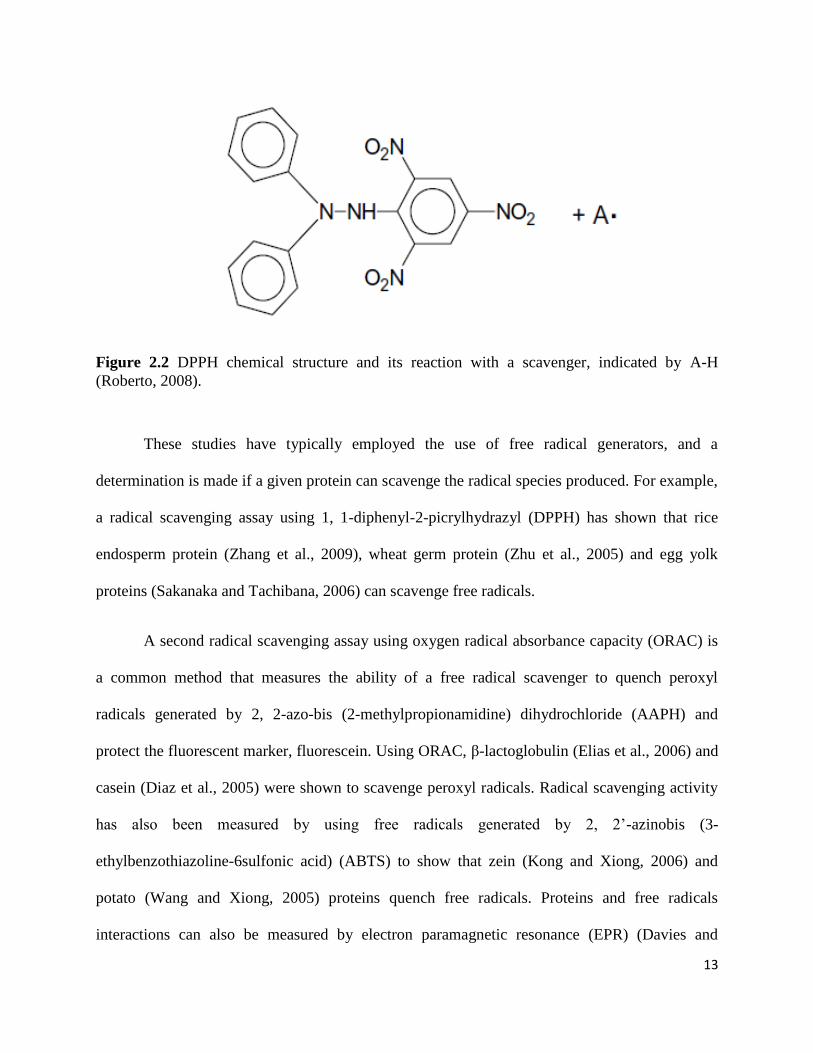
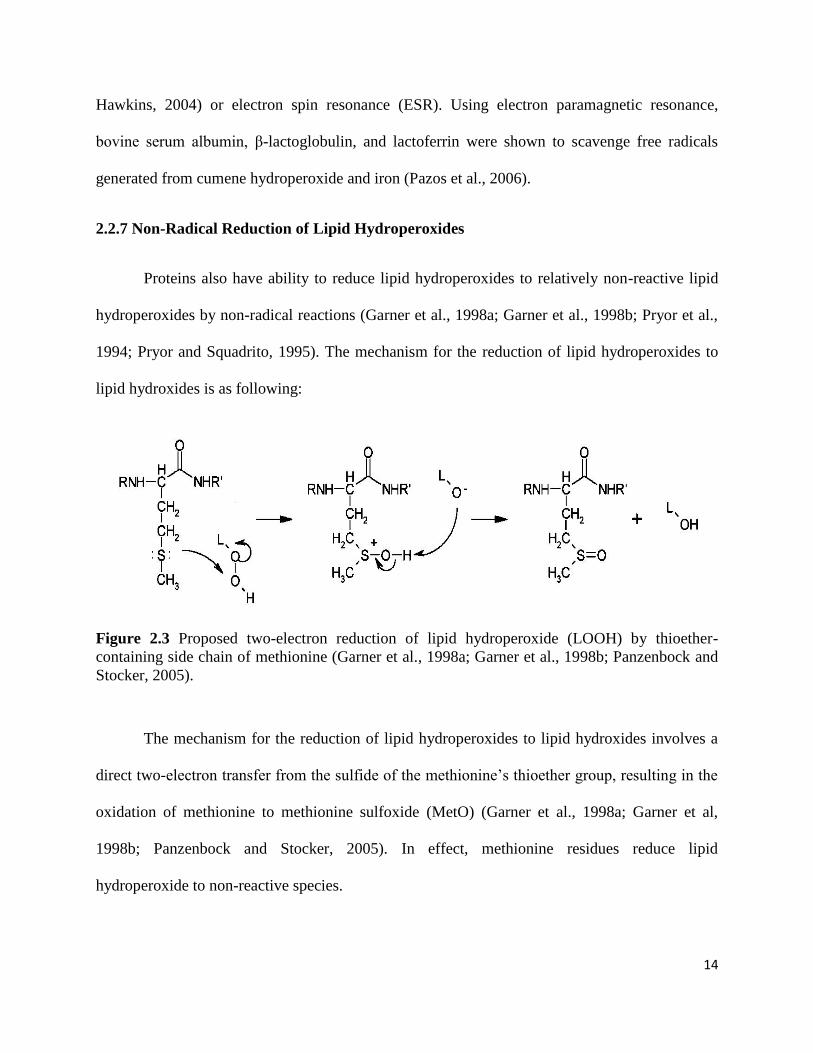
2.2.7 Non-Radical Reduction of Lipid Hydroperoxides
Proteins also have ability to reduce lipid hydroperoxides to relatively non-reactive lipid
hydroperoxides by non-radical reactions (Garner et al., 1998a; Garner et al., 1998b; Pryor et al.,
1994; Pryor and Squadrito, 1995). The mechanism for the reduction of lipid hydroperoxides to
lipid hydroxides is as following:
Figure 2.3 Proposed two-electron reduction of lipid hydroperoxide (LOOH) by thioether-
containing side chain of methionine (Garner et al., 1998a; Garner et al., 1998b; Panzenbock and
Stocker, 2005).
The mechanism for the reduction of lipid hydroperoxides to lipid hydroxides involves a
direct two-electron transfer from the sulfide of the methionine’s thioether group, resulting in the
oxidation of methionine to methionine sulfoxide (MetO) (Garner et al., 1998a; Garner et al,
1998b; Panzenbock and Stocker, 2005). In effect, methionine residues reduce lipid
hydroperoxide to non-reactive species.
15
2.3 Methods for Measuring Antioxidant Activity of Proteins
There are various methods used to measure the antioxidant activity of proteins and
protein hydrolysates. These mainly includes the ability of proteins to scavenge free radicals like
1,1-diphenyl-2-picrylhydrazyl (DPPH), superoxide radical, to test the reducing power of
proteins, to test the inhibition of linoleic acid autooxidation.
2.3.1 DPPH Radical-Scavenging Assay
The scavenging effect of proteins and protein hydrolysates fractions on 1, 1-diphenyl-2-
picrylhydrazyl (DPPH) free radical is mainly measured by according to the method of shimada et
al., (1992) with little modification. Firstly, a protein solution with different concentrations is
prepared and after centrifugation at 8000 RPM for 20 min, 2 ml of the upper layer is added to the
2 ml solution of 0.1 mM DPPH dissolved in 95 % ethanol. The mixture is then shaken and left
for 30 min in dark at room temperature, and the absorbance of resulting solution is read at 517
nm. A lower absorbance represents a higher DPPH scavenging activity. The scavenging effect is
mainly expressed as shown in the following equation:
DPPH scavenging activity (%) = [(Control absorbance-Sample absorbance)/Control absorbance]
x 100
Control consists of 2 ml of ethanol and 2 ml of 0.1 mM DPPH.
2.3.2 Superoxide Radical Scavenging Assay
The superoxide radical scavenging activity of proteins and protein hydrolysates is
measured at 25°C using the spectrophotometric monitoring of the inhibition of pyrogallol
autoxidation as described by Marklund and Marklund (1974) with some modifications.
16
Superoxide radical scavenging assay is dependent on the reducing activity of a test compound by
an O2- dependent reaction, which releases chromophoric products.
Firstly, protein solution with different concentrations is prepared, and 0.1 ml of the
protein solution is added into 2.8 ml Tris-Hcl-EDTA buffer (0.1 M, pH 8.0), and the mixture is
shaken and heated at 25° C for 10 min. After 10 min of heating, the reaction is initiated by
adding 0.1 ml of pyrogallol solution (3 mM) and then optical density is measured at 325 nm
using a spectrophotometer. The scavenging activity is given as following:
Scavenging activity (%) = [(CA- SA)/CA] X 100
CA = Control absorbance, SA = Sample absorbance
2.3.3 Test of Inhibition of Linoleic Acid Autoxidation by Proteins
The antioxidant activity of proteins and protein hydrolysates with different periods of
incubation is mainly measured in a linoleic acid model system according to the method of Osawa
and Namiki (1985) with little modification. 10 mg of protein or protein hydrolysate is dissolved
in 10 ml of 50 mM phosphate buffer (pH 7.0) and then the mixture is added to a solution of 0.15
ml linoleic acid and 10 ml 99.5 % ethanol. Total volume is then adjusted to 25 ml with double
distilled water. The mixture is than incubated in a conical flask at 40°C in a dark room for 6 or 8
days, and degree of oxidation is mainly evaluated by measuring the ferric thiocyanate (FTC)
values.
FTC value is mainly measured according to the method of Mitsuta et al., (1996).
According to this method, 100 µl of the above reaction is mixed with 4.7 ml of 75 % ethanol, 0.1
ml 30 % ammonium thiocyanate and 0.1 ml of 0.02 M ferrous chloride solution in 3.5 % HCL.
17
After the reaction time of 3 min, the FTC value is measured by reading the absorbance at 500
nm. This absorbance is measured daily up to 6-8 days to know the inhibition of linoleic acid
autooxidation.
2.3.4 Test for Reducing Power
The reducing power of proteins is mainly measured according to Oyaizu (1988) with
little modification. Different concentrations of proteins are added to 2.5 ml of 0.2 M phosphate
buffer (pH 6.6) and 2.5 ml of 1 % potassium ferricyanide. The mixture is incubated at 50°C for
20 min, and then 2.5 ml of 10 % trichloroacetic acid (TCA) is added to the reaction. After the
reaction, centrifugation is done at 6500 g for 10 min. After centrifugation, 2.5 ml of the upper
layer obtained is mixed with 2.5 ml of double distilled water and 0.5 ml of 0.1 % ferric chloride
in 10 ml test tube. After 10 min of reaction time, the absorbance of the resulting solution is
measured at 700 nm. Increased absorbance of the reaction mix indicates increased reducing
power.
2.3.5 Antioxidant Activity of Food Protein Hydrolysates
In recent years, interest in utilizing natural antioxidants has increased substantially
(Shahidi et al., 2006). Due to this the interest has led to new investigations to know the
antioxidant potential of biologically active peptides from protein hydrolysates such as wheat
protein (Zhu et al., 2005), rice protein (Zhang et al., 2009), fish protein (Kim et al., 2001; Wu et
al., 2003), soy protein (Chen et al., 1996; Moure et al., 2006), and milk casein (Kunio et al.,
2000). Enzymatic hydrolysis is widely applied to improve the functional and nutritional
properties of food proteins. Protein hydrolysates derived from enzymatic hydrolysis have various
18
physiological activities such as antioxidant, antimicrobial, antihypertensive, and mineral binding
(Korhonen and Pihlanto, 2003).
2.3.5.1 Antioxidant Activity of Wheat Germ Protein Hydrolysates
Antioxidant and free radical-scavenging activities of wheat germ protein hydrolysates
was studied by Zhu et al., (2005). The main by-product of the oil extraction process is a defatted
wheat germ meal, which has protein content up to 30 % (Ge et al., 2000). The authors used
alcalase 2.4L for the enzymatic hydrolysis of wheat germ protein. Protein hydrolysis of 10 %
(w/v) protein solution with alcalase was carried out at 50°C and pH 8.0 for 6 hours. The enzyme-
substrate ration (E/S) was 0.4 AU/g of protein. The authors measured the antioxidant activity of
the wheat germ protein hydrolysates by measuring the inhibition of linoleic acid autoxidation,
scavenging effect of 1, 1-diphenyl-2-picrylhydrazyl (DPPH), determination of superoxide
radical-scavenging activity, and determination of reducing power.
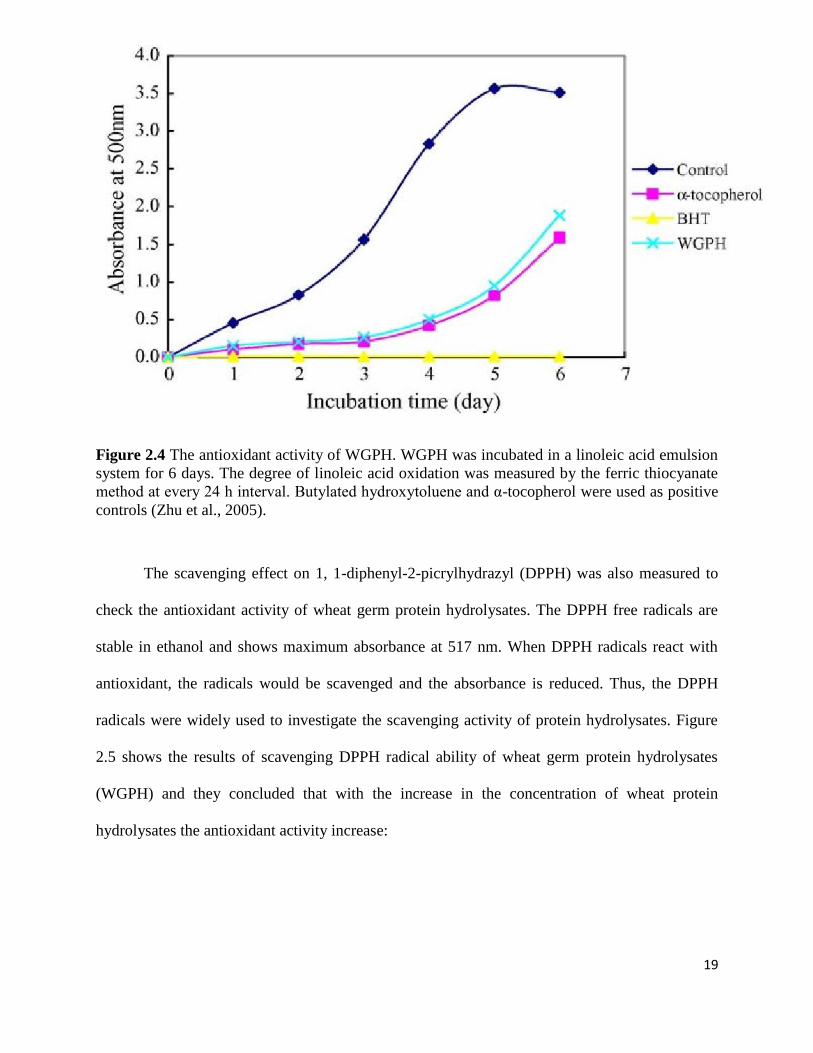
Figure 2.4 shows the antioxidative activity of wheat germ protein hydrolysate measured
in linoleic acid emulsion system and compared with those of α-tocopherol and BHT by Zhu et
al., (2005). From this the authors conclude that wheat germ protein hydrolysates have antioxidant
activity as comparable to α-tocopherol.
19
Figure 2.4 The antioxidant activity of WGPH. WGPH was incubated in a linoleic acid emulsion
system for 6 days. The degree of linoleic acid oxidation was measured by the ferric thiocyanate
method at every 24 h interval. Butylated hydroxytoluene and α-tocopherol were used as positive
controls (Zhu et al., 2005).
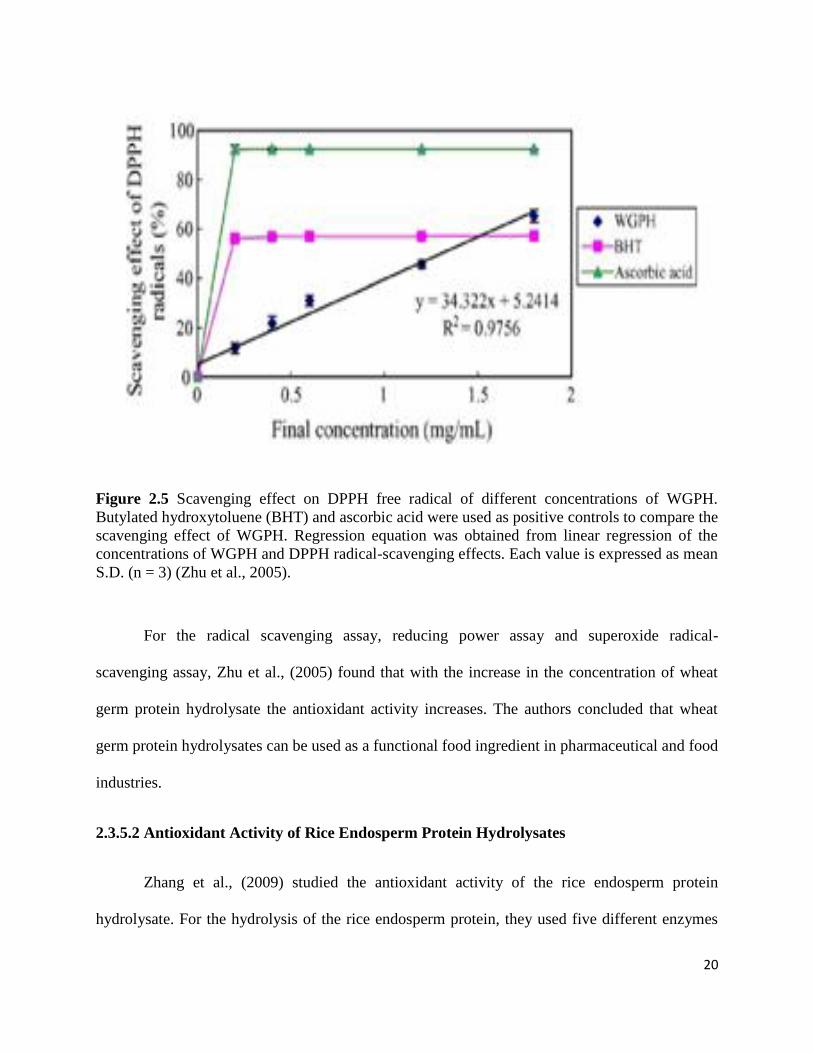
The scavenging effect on 1, 1-diphenyl-2-picrylhydrazyl (DPPH) was also measured to
check the antioxidant activity of wheat germ protein hydrolysates. The DPPH free radicals are
stable in ethanol and shows maximum absorbance at 517 nm. When DPPH radicals react with
antioxidant, the radicals would be scavenged and the absorbance is reduced. Thus, the DPPH
radicals were widely used to investigate the scavenging activity of protein hydrolysates. Figure
2.5 shows the results of scavenging DPPH radical ability of wheat germ protein hydrolysates
(WGPH) and they concluded that with the increase in the concentration of wheat protein
hydrolysates the antioxidant activity increase:
20
Figure 2.5 Scavenging effect on DPPH free radical of different concentrations of WGPH.
Butylated hydroxytoluene (BHT) and ascorbic acid were used as positive controls to compare the
scavenging effect of WGPH. Regression equation was obtained from linear regression of the
concentrations of WGPH and DPPH radical-scavenging effects. Each value is expressed as mean
S.D. (n = 3) (Zhu et al., 2005).
For the radical scavenging assay, reducing power assay and superoxide radical-
scavenging assay, Zhu et al., (2005) found that with the increase in the concentration of wheat
germ protein hydrolysate the antioxidant activity increases. The authors concluded that wheat
germ protein hydrolysates can be used as a functional food ingredient in pharmaceutical and food
industries.
2.3.5.2 Antioxidant Activity of Rice Endosperm Protein Hydrolysates
Zhang et al., (2009) studied the antioxidant activity of the rice endosperm protein
hydrolysate. For the hydrolysis of the rice endosperm protein, they used five different enzymes
21
Alcalase, Chymotrypsin, Neutrase, Papain, and Flavorase based on their optimum hydrolysis
conditions.
After 4 hrs of hydrolysis, the reaction was heated to 85° C for 10 min to inactivate the
enzyme. The results of the hydrolysis showed that degree of hydrolysis (DH) of rice endosperm
protein by Neutrase was 20 %, by Chymotrypsin (22.23 %), Alcalase (16.24 %), Papain (11.72
%), Flavorase (8.23 %) respectively. The authors measured the antioxidant activity of the rice
endosperm protein hydrolysates by measuring the DPPH radical scavenging assay, superoxide
radical scavenging assay, hydroxyl radical scavenging assay, reducing power, ferrous ion-
chelating activity and test of inhibition of linoleic acid autoxidation.
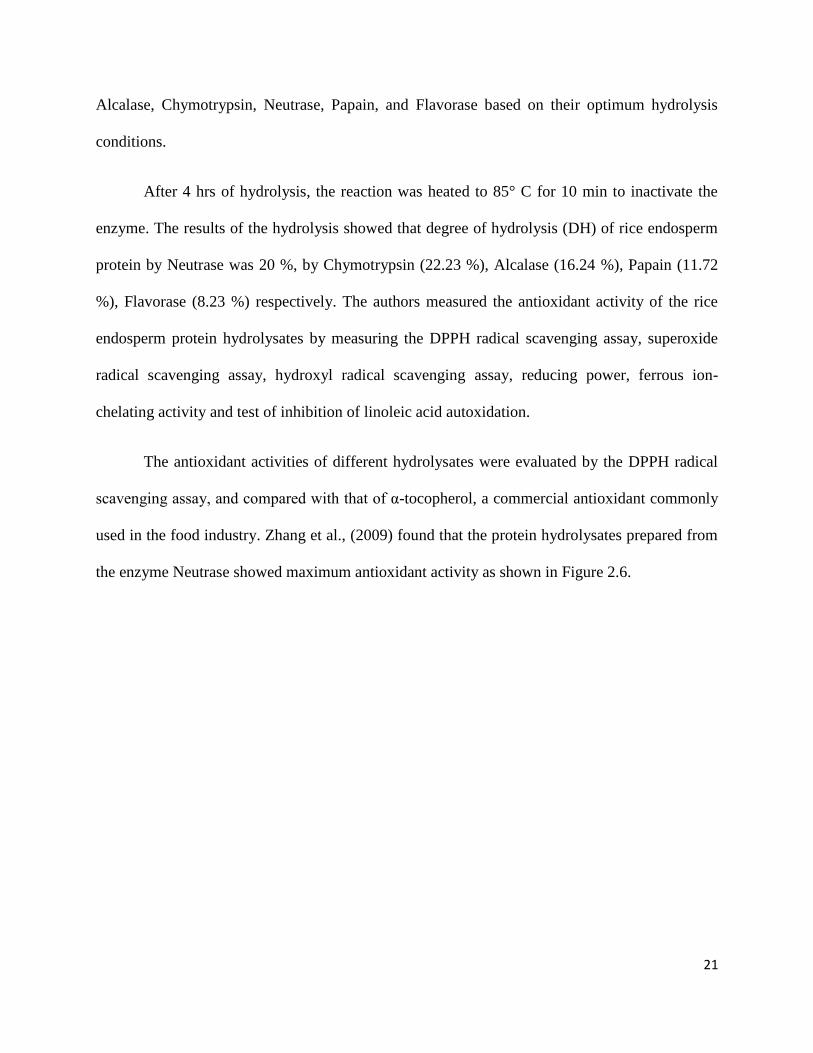
The antioxidant activities of different hydrolysates were evaluated by the DPPH radical
scavenging assay, and compared with that of α-tocopherol, a commercial antioxidant commonly
used in the food industry. Zhang et al., (2009) found that the protein hydrolysates prepared from
the enzyme Neutrase showed maximum antioxidant activity as shown in Figure 2.6.
22
Figure 2.6 DPPH radical scavenging activities of the various hydrolysates from the defatted rice
endosperm protein (REP) at different concentrations. α-tocopherol was used as a positive
control. Each value is expressed as mean ± SD (Zhang et al., 2009).
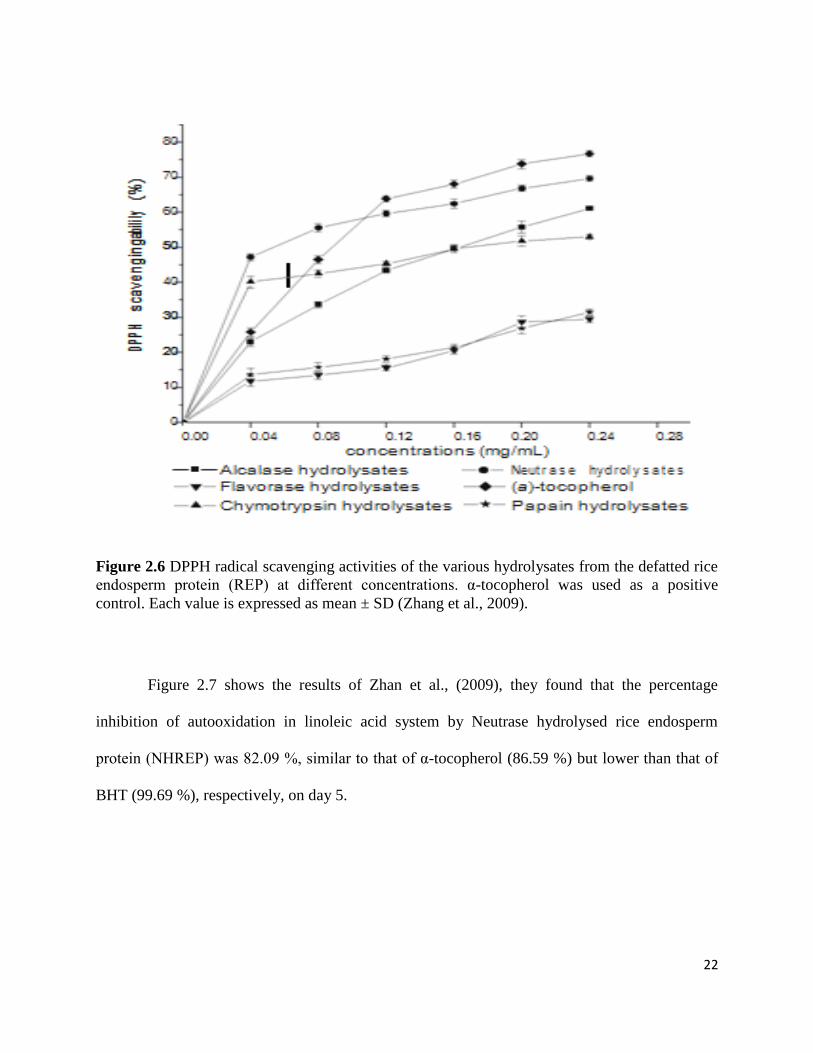
Figure 2.7 shows the results of Zhan et al., (2009), they found that the percentage
inhibition of autooxidation in linoleic acid system by Neutrase hydrolysed rice endosperm
protein (NHREP) was 82.09 %, similar to that of α-tocopherol (86.59 %) but lower than that of
BHT (99.69 %), respectively, on day 5.
23
Figure 2.7 Inhibition of linoleic acid autoxidation by the Neutrase hydrolysate from rice
endosperm protein (NHREP). The degree of linoleic acid oxidation was measured by the ferric
thiocyanate (FTC) method at every 24 h interval. BHT and a-tocopherol were used as positive
controls. Vertical bars indicate mean values ± SD. (Zhang et al., 2009).
Zhang et al., (2009) in their study concluded that Neutrase hydrolysed rice endosperm
protein (NHREP) can be used as suitable natural antioxidant to prevent oxidation reactions in
food processing and become ingredient of functional foods.
2.4 High Pressure Processing of Proteins
High pressure processing causes unfolding of proteins depending upon protein type,
processing conditions and applied pressure. Solubility of proteins can be increased by using high
pressure processing (Thakur and Nelson, 1998). High pressure processing ruptures covalent
24
interactions within protein molecules and further cause’s reformation of inter molecular bonds.
Different types of interactions are responsible for secondary, tertiary and quaternary structure of
proteins. The quaternary structure is mainly held by hydrophobic interactions that are sensitive to
pressure. Even tertiary structure show considerable changes beyond 200 MPa. High pressure
processing can increase the degree of hydrolysis and antioxidant activity of proteins.
2.5 Increasing the Antioxidant Activity of Proteins
Antioxidant activity of proteins can be increased by changing the protein concentration,
reactivity, and physical structure. Many protein antioxidant mechanisms like free radical
scavenging, metal chelation, hydroperoxide reduction are dependent on the amino acids
composition. However, the antioxidant activity of these amino acids residues is limited by the
tertiary structure of the protein, as many amino acids with antioxidant potential can be buried
within the protein core where they are not accessible to prooxidants.
Antioxidant activity of proteins can be increased through the disruption of tertiary
structure (i.e. partial denaturation), in this way it increases the accessibility of the amino acids
with antioxidant potential to the prooxidants. Taylor and Richardson (1980) determined the
antioxidant activity of the heated skim milk in a methyl linolate emulsion with hemoglobin used
as a lipid oxidation catalyst. Taylor and Richardson (1980) showed that heat treatment (70 to
130° C for up to 30 min) increased the antioxidant activity of skim milk. Heat treatment resulted
in an increase in reactive sulfhydryls (starting reactive sulfhydryl concentration of 48 µM was
increased to 71 µM after heating at 130° C for 30 min).
Enzymatic hydrolysis of proteins also increases the exposure of antioxidant amino acids.
Increased antioxidant activity in hydrolyzed proteins has been reported for zein (Kong and
25
Xiong, 2006), dairy (Ostdal et al., 1999; Rival et al., 2001; Pena-Ramos and Xiong, 2003;
Hernandez-Ledesma et al., 2005; Sakanaka et al., 2005; Diaz et al., 2005; Elias et al., 2005),
potato (Wang and Xiong, 2005), gelatin (Park et al., 2005), egg yolk (Sakanaka and Tachibana,
2006), wheat (Zhu et al., 2005) and rice (Zhang et al., 2009) proteins. The observed increase in
antioxidant activity due to hydrolysis may result directly from increased solvent exposure of
amino acids. The higher solubility of proteins increased the free radical scavenging activity
(Ostdal et al., 1999; Rival et al., 2001; Wang and Xiong, 2005; Park et al., 2005; Hernandez-
Ledesma et al., 2005; Sakanaka et al., 2005; Diaz and Decker, 2005; Elias et al., 2006; Kong and
Xiong, 2006; Sakanaka and Tachibana, 2006). Enzymatic hydrolysis of proteins is an important
process to improve the physical, chemical, functional, and nutritional properties of original
proteins. Enzymatic hydrolysis is an effective method to prepare active peptides, which possess
antioxidative properties. Enzymatic hydrolysis of proteins is mainly done by using various
enzyme depending on the substrate. Various enzymes, for e.g. Alcalase, Typsin, Chymotrypsin,
Pepsin, Neutrase etc are used for the hydrolysis of proteins. The hydrolysis is carried out at
specific temperature conditions of enzyme, and hydrolysis is stopped by heating the reaction
mixture at high temperature to inactivate the enzyme.
26
CHAPTER 3
MATERIALS AND METHODS
3.1 Materials
A commercial soybean isolate was obtained by ADM Protein Technologies Inc. (Decatur,
Illinois). Chickpea protein isolate prepared by Chang (2010). Trypsin type IX-S from procine
pancreas, E.C. 3.4.21.4; activity 13100 units/mg protein, DPPH (1, 1-diphenyl-2-picrylhydrazyl)
and OPA (o-phthaldialdehyde) were purchased from Sigma-Aldrich, Canada. All other
chemicals used were of analytical and HPLC grade.
3.2 Preparation of Soybean and Chickpea Protein Hydrolysates
3.2.1 Enzymatic Hydrolysis of Protein Isolates and HPP treated Proteins
The enzymatic hydrolysis of isolated soybean and chickpea protein was carried out by
using the method described by Chanput et al., (2009) and Adebiyi et al., (2008). Dispersions of
soybean and chickpea protein (1 %, w/v) were brought to pH 8.0 with 2N NaOH under mixing
and were incubated with trypsin at 1:20 enzyme to protein ration, in 50 mM sodium phosphate
buffer at 37° C for 2 h. At time intervals between 0 to 120 min, tubes of the digest were removed
from the water bath at 0, 15, 30, 45, 60 and 120 min. The enzyme action was stopped by heating
at 95º C for 10 min. The protein hydrolysates were then centrifuged at 8,000xg for 30 min, and
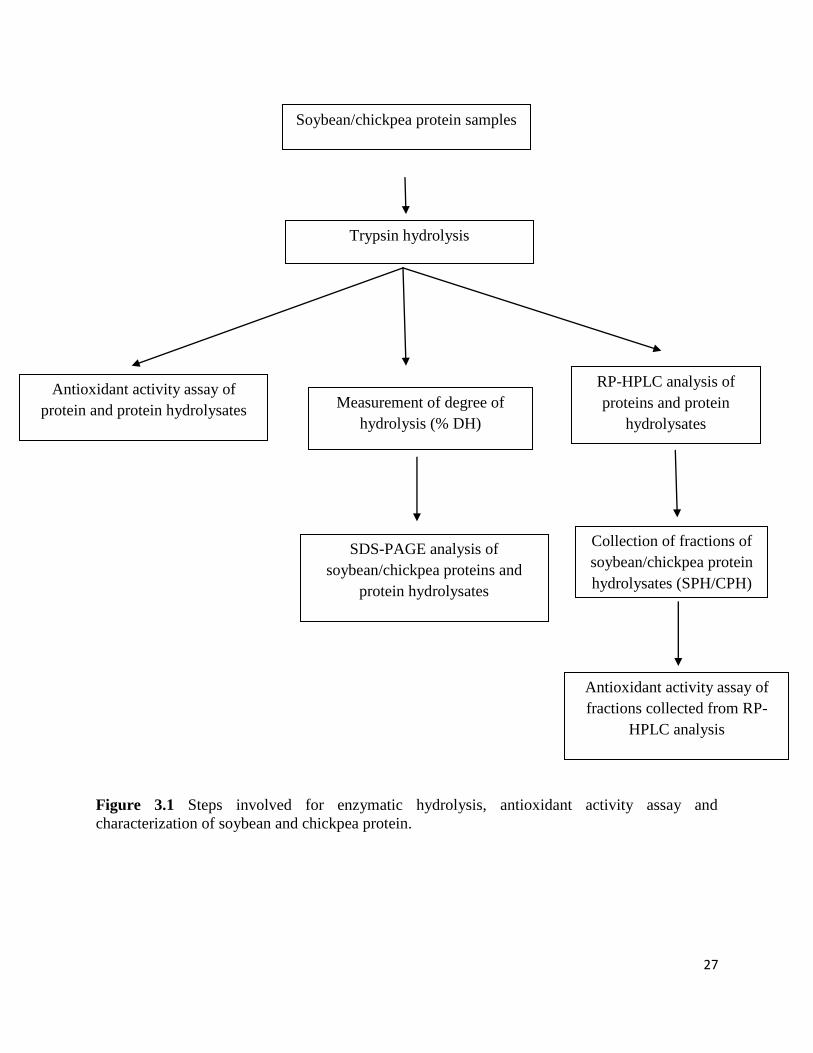
the supernatant was lyophilized. Figure 3.1 shows the steps involved in the enzymatic hydrolysis,
antioxidant activity assay and characterization of soybean and chickpea protein.
27
Figure 3.1 Steps involved for enzymatic hydrolysis, antioxidant activity assay and
characterization of soybean and chickpea protein.
Soybean/chickpea protein samples
Trypsin hydrolysis
Antioxidant activity assay of
protein and protein hydrolysates Measurement of degree of
hydrolysis (% DH)
RP-HPLC analysis of
proteins and protein
hydrolysates
SDS-PAGE analysis of
soybean/chickpea proteins and
protein hydrolysates
Collection of fractions of
soybean/chickpea protein
hydrolysates (SPH/CPH)
Antioxidant activity assay of
fractions collected from RP-
HPLC analysis
28
3.2.2 Determination of Degree of Hydrolysis
The degree of hydrolysis (DH) was measured by using the o-phthaldialdehyde (OPA)
method described by Church et al., 1983. The OPA reagent was prepared by combining the 25
mL 100 mM sodium tetraborate, 2.5 ml 20 % SDS (w/w) and 40 mg OPA (dissolved in 1 mL
methanol) and 100 µL β-mercaptoethanol and diluting to a final volume of 50 mL with distilled
water. 10-50 µL of hydrolysates was added to 2 mL OPA reagent, the solution was mixed and
incubated for 2 min at ambient temperature and the absorbance was measured at 340 nm. The
degree of hydrolysis was calculated by using the equation:
DH (%) = (MW Δ340nm)/ (d.e.p) x 100
Where MW = Average molecular weight of amino acids (120)
Δ340nm = Absorbance at 340 nm
d = Dilution factor
e = Average molar absorption of amino acids (6000 M-1
cm-1
)
P = protein concentration
3.2.3 High Pressure Processing (HPP) of Proteins
Soybean and chickpea protein dispersions at different concentration were packed in low-
density polyethylene bags (Whirl-PakR, USA) and the bags were heat sealed. The air in the bags
was squeezed out as much as possible before sealing. Samples were then transferred to the 5L
pressure treatment chamber (ACIP 6500/5/12VB; ACB Pressure Systems, Nantes, France)
equipped with temperature and pressure regulators. Water was used as the pressure transmitting
29
medium. Soybean and chickpea protein samples were pressure treated at specified pressure
levels (400, and 600 MPa) for 5 and 10 min. The pressurization rate was about 4.4 MPa/s and
released at 26 MPa/s. The initial temperature of the medium was 18° C which quickly increased
to 25 and 28.5° C during adiabatic effect during pressurization of 400 and 600 MPa and
equilibrated to 22 and 26°C during holding period at those pressure levels. All experiments were
carried out in duplicate.
Soybean and chickpea protein dispersions were subjected HPP treatment at 400 MPa and
600 MPa for 5 min and 10 min. High pressure treated protein dispersions were subjected to
trypsin hydrolysis. To measure the impact of high pressure processing, degree of hydrolysis
(%DH) was measure according to the method described in section 3.2.2. Antioxidant activity
assay was performed according to the procedure described in section 3.3 on the soybean and
chickpea protein hydrolysates (SPH/CPH) to measure the effect of high pressure processing.
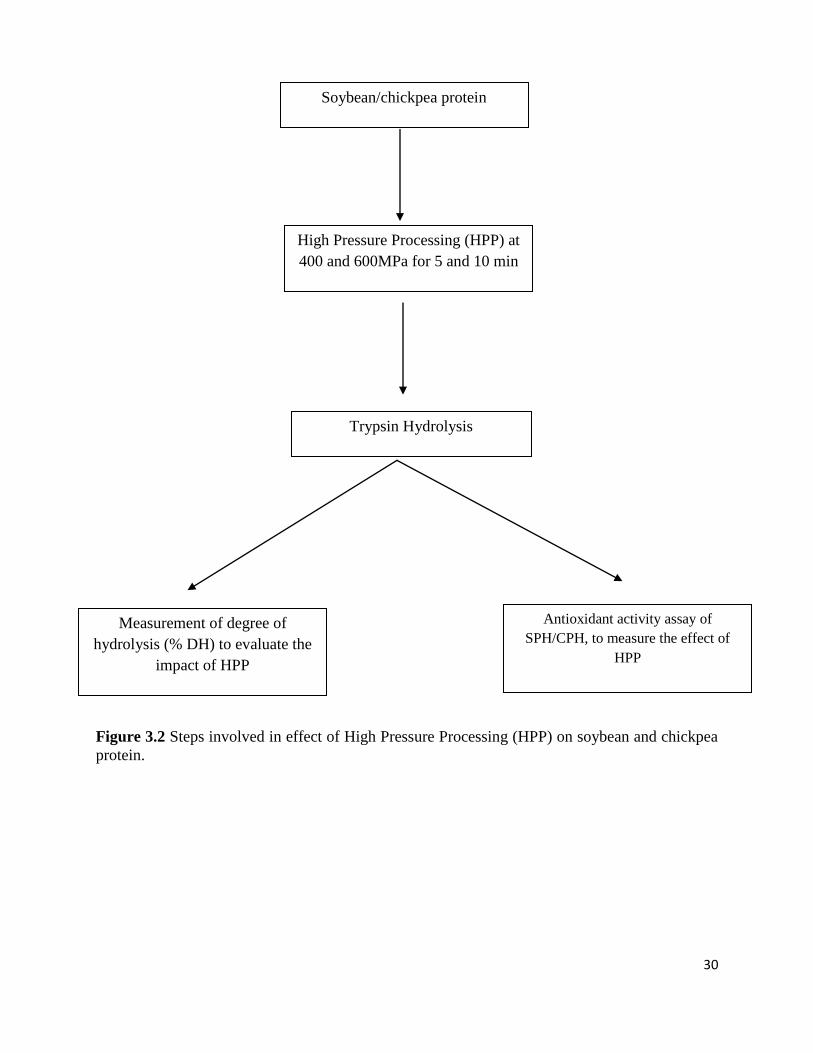
Figure 3.2 shows the steps involved in effect of High Pressure Processing (HPP) on soybean and
chickpea protein.
30
Figure 3.2 Steps involved in effect of High Pressure Processing (HPP) on soybean and chickpea
protein.
Soybean/chickpea protein
High Pressure Processing (HPP) at
400 and 600MPa for 5 and 10 min
Trypsin Hydrolysis
Measurement of degree of
hydrolysis (% DH) to evaluate the
impact of HPP
Antioxidant activity assay of
SPH/CPH, to measure the effect of
HPP
31
3.3 Antioxidant Activity Assay
The antioxidant activity of soybean and chickpea protein isolates/hydrolysates was measured
by using DPPH (1, 1-diphenyl-2-picrylhydrazyl) radical scavenging assay method described by
Shimada et al., (1992). 2 mL each protein sample at different concentrations (0-10 mg/ml) was
added to 2 mL 0.1 mM DPPH dissolved in 95 % ethanol. The solution was mixed well and
incubated for 30 min in dark at room temperature. After incubation the absorbance of the mixture
was measured at 517 nm. Scavenging activity was calculated by using equation:
Scavenging activity (%) = Blank absorbance – Sample absorbance/ Blank absorbance x 100
3.4 Characterization of Proteins and Protein Hydrolysates
3.4.1 Polyacrylamide Gel Electrophoresis (PAGE)
The soybean and chickpea protein/protein hydrolysates were subjected to sodium dodecyl
sulfate polyacrylamide gel electrophoresis (SDS-PAGE). Samples of lyophilized protein and
protein hydrolysates were subjected to SDS-PAGE. Electrophoresis was carried out on a Mini-
Protein III Electrophoresis Cell unit (Bio-Rad, Hercules, CA). SDS-PAGE was carried out
according to the method described by Laemmli, (1970).
3.4.1.1 Sodium Dodecyl Sulfate Polyacrylamide Gel Electrophoresis (SDS-PAGE)
3.4.1.1.1 Sample Preparation
Freeze dried protein samples were dissolved in sample buffer consisting of Tris-HCL (1.5M,
pH 8.8), glycerol, SDS (2 %), 2-mercaptoethanol, bromophenol blue (0.1 %) and distilled water
at a final concentration of 5-10 mg/ml. Samples were heated at 95° C for 5 min before loading
into each sample well.
32
3.4.1.1.2 Gel Concentration and Preparation
Gels of 12 % and 4 % (w/v) acrylamide as separation and stacking gels were used. A 12 %
acrylamide separation gel was prepared with the following reagents: acrylamide, Tris-HCL (1M,
pH 8.8), glycerol, SDS (10 %), distilled water, ammonium persulfate (APS) (10 %) and
tetramethylethylene-diamine (TEMED). The glass plates were fixed and the liquid was pour
between the glass plates and allowed to polymerize for 35-40 min. Similarly, the 4 % acrylamide
gel was prepared with acrylamide, Tris-HCL (0.5 M, pH 6.8), SDS (10 %), distilled water, APS
(10 %) and TEMED. The mixture for stacking gel was poured over the separation gel and a
comb was inserted to form wells for sample loading and allowed to polymerize for 30min. A
Hamilton syringe was used to load 10-15 µL protein samples at a concentration of 5-10 mg/mL
into wells. Protein bands were compared in relation to the mobility of the following marker
proteins and a standard curve of log MW verses RF (relative mobility) values was established for
determination of molecular weights of unknown proteins: myosin (200 kDa), β-galactosidase
(116 kDa), phosphorylase b (97 kDa), serum albumin (66 kDa), ovalbumin (45 kDa), Carbonic
anhydrase (31 kDa), trypsin inhibitor (22 kDa), lysozyme (14 kDa) and aprotinin ( 7 kDa).
3.4.1.1.3 Electrophoresis Running Conditions
The running buffer was consisting of tris-base glycine buffer with 1 % SDS. Electrophoresis
was performed at a constant voltage of 100 V/gel. Electrophoresis run time varied between 1.5-2
h and terminated when the tracking dye front reached the bottom of the gel.
3.4.1.1.4 Protein Staining and Destaining
Gels were removed from the glass plates and immersed in a staining solution containing
Coomassie Blue R-250 (0.1 % w/v) for approximately 18 h. The gels were destained with the
33
destaining solution containing 20 % methanol and 10 % acetic acid until the background colour
was removed.
3.4.2 RP-HPLC Separation of Protein and Protein Hydrolysates
Separation of protein and peptides in protein hydrolysates was performed by using reversed-
phase high performance liquid chromatography (RP-HPLC) according to the method described
by El-Ramahi, (2003) with some modifications. The HPLC was equipped with a dual pump
system for high pressure solvent delivery, a programmable solvent module (model 126,
Beckman, CA) and a UV detector (model 166). The samples of protein and protein hydrolysates
at concentration 5-10 mg/mL were filtered by using 0.45 µm MilliporeTM
membrane filters,
subjected to RP-HPLC analysis. An Octadecyl (C18) reverse phase column (5µm, 250 x 4.6 mm
column, Mallinckrodt Baker, Inc., New Jersey, USA) was used. 100 µL sample was injected into
a 200 µL sample loop and elution was done at a flow rate of 1 mL/min using two solvent
gradient system. Solvent A, 0.1 % trifluoracetic acid (TFA) in water; solvent B, 0.1 % TFA in
70/30 acetonitrile/water. Elution was carried 60 min and detection was carried out at 215 nm.
Chromatographic data were analyzed by Beckman Gold System (version V810, USA) then
translated from print (PRN) format to Microsoft Excel©
worksheet.
34
CHAPTER 4
RESULTS AND DISCUSSION
4.1 Enzymatic Hydrolysis
4.1.1 Trypsin Hydrolysis of Isolated Soybean Protein (ISP) and Isolated Chickpea Protein
(ICP)
Trypsin is an alkaline protease that has been used not only for production of protein
hydrolysates with better functional and nutritional characteristics than the original proteins, but
also for the generation of bioactive peptides. Figures 4.1 and 4.2 shows the hydrolysis curve of
isolated soybean protein (ISP) and isolated chickpea protein (ICP). Table 4.1 shows the values of
% DH. The results reveal that degree of hydrolysis (% DH) increased with increase in time up to
105 min and then decreased. The maximum DH for soybean protein hydrolysates (SPH) and
chickpea protein hydrolysates (CPH) were 12.4 % and 13.6 % respectively after 105 min. The
DH for controls (Isolated soybean protein (ISP) and isolated chickpea protein (ICP) without
enzyme) were 1.1 % and 1.2 % respectively. These findings are in agreement with the results of
enzymatic hydrolysis of other proteins reported by other workers. Ayad (2010) reported that
when flaxseed protein isolate was hydrolysed for 2 h using trypsin, the DH was 9.4 %-24.5 %
after 0.5-2 h of hydrolysis; the % DH increased with increase in enzyme/substrate ratio and time
of hydrolysis. The DH for rice endosperm protein (Zhang et al., 2009) and wheat germ protein
hydrolysates (Zhu et al., 2005) was reported to be 11.7 % and 25 % after 6 h of hydrolysis
respectively; the % DH increased with increase in time of hydrolysis.
35
Figure 4.1 Hydrolysis curve of soybean protein hydrolysates (SPH) treated with trypsin.
Reaction conditions: pH, 8.0; 37° C, enzyme:protein ratio- 1:20 (w/w), and curve of isolated
soybean protein (ISP) as control (without enzyme).
Figure 4.2 Hydrolysis curve of chickpea protein hydrolysates (CPH) treated with trypsin.
Reaction conditions: pH, 8.0; 37° C, enzyme:protein ratio- 1:20 (w/w), and curve of isolated
chickpea protein (ICP) as control (without enzyme).
0
2
4
6
8
10
12
14
0 15 30 45 60 75 90 105 120 135
De
gre
e o
f h
ydro
lysi
s (%
)
Hydrolysis time (min)
SPH
ISP
0
2
4
6
8
10
12
14
0 15 30 45 60 75 90 105 120 135
De
gre
e o
f h
ydro
lysi
s (%
DH
)
Hydrolysis time (min)
CPH
ICP
36
Table 4.1 % DH of isolated soybean protein (ISP), isolated chickpea protein (ICP), soybean
protein hydrolysates (SPH) and chickpea protein hydrolysates (CPH).
Time (min) % DH of
ISP(control)
% DH of SPH % DH of
ICP(control)
% DH of CPH
0 0.7 2.7 0.6 4.5
15 1.1 3.8 0.9 6.3
30 1.1 4.7 1.1 8.2
45 0.9 6.4 1.1 9.4
60 1.1 8.4 1.2 10.5
75 1.1 9.6 1.2 11.7
90 0.9 10.7 1.1 12.4
105 0.9 12.4 1.2 13.6
120 0.9 11.5 1.2 12.3
Results are average of duplicate determination
DH = Degree of Hydrolysis
37
4.2 Antioxidant Activity of Protein and Protein Hydrolysates
4.2.1 Antioxidant Activity of Isolated Soybean Protein (ISP) and Soybean Protein
Hydrolysates (SPH); Isolated Chickpea Protein (ICP) and Chickpea Protein Hydrolysates
(CPH)
Figure 4.3 shows the antioxidant activity of isolated soybean protein (ISP) and soybean
protein hydrolysates (SPH). The results showed a continuous increase in antioxidant activity of
ISP and SPH with increase in protein concentration from 2.5-10 mg/mL with antioxidant activity
from 6.0 % to 10.6 % for ISP and from 16.5 % to 32 % for SPH. Soybean protein hydrolysates
showed higher antioxidant activity as compared to the isolated soybean protein at same protein
concentration; this is because for protein hydrolysates and peptides an increase in hydrophobicity
will increase their solubility in lipid and therefore enhances their antioxidant activity (Zhu et al.,
2005). Zhu et al., (2005) also reported the increase in the antioxidant activity of wheat germ
protein hydrolysates (WGPH) with increase in protein concentration and suggested that released
antioxidant peptides are the reason for increased antioxidant activity of wheat germ protein
hydrolysates as compared to the isolated wheat germ protein.
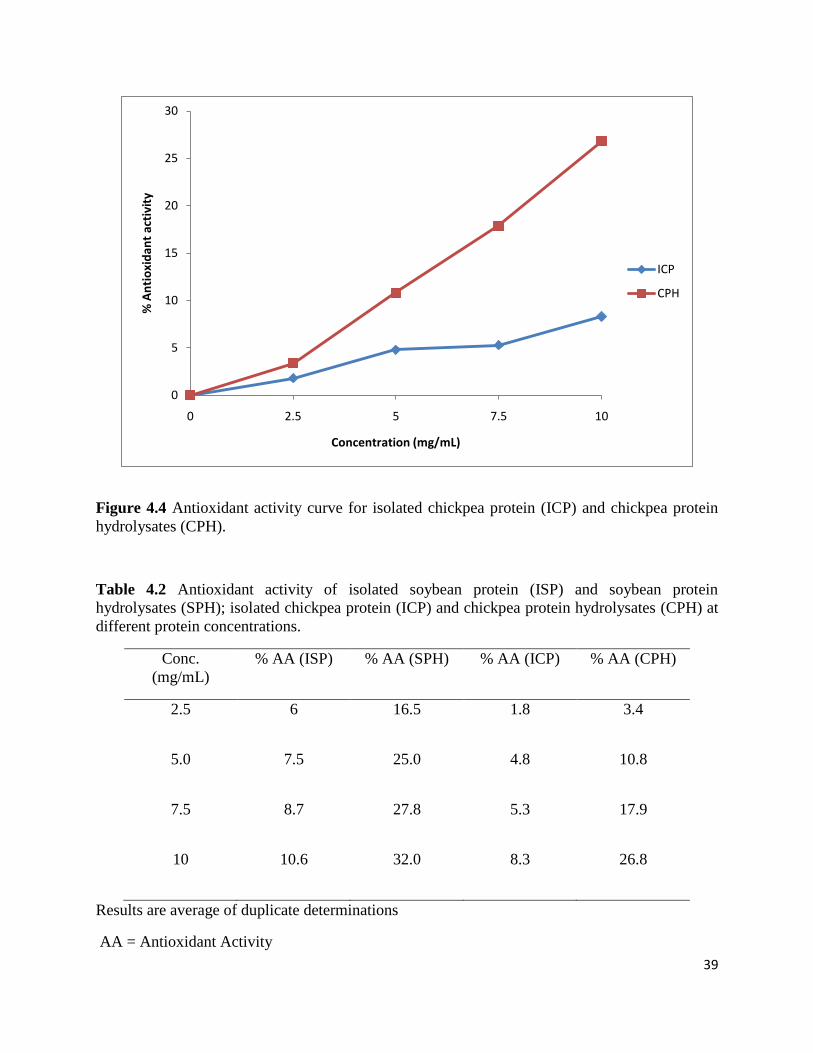
Figure 4.4 shows the results for the antioxidant activity of isolated chickpea protein (ICP)
and chickpea protein hydrolysates (CPH). The results showed similarity with the results for
isolated soybean protein and soybean protein hydrolysates with an increase in antioxidant
activity of ICP and CPH with increase in protein concentration from 2.5-10 mg/mL. Antioxidant
activity was 1.8 % to 8.3 % for ICP and 3.4 % to 26.8 % for CPH. Chickpea protein hydrolysates
also showed higher antioxidant activity as compared to the isolated chickpea protein at same
protein concentration; the reason is the same as discussed above for SPH. ICP and CPH showed
38
lower antioxidant activity as compared to the ISP and SPH, the reason for this can be lower
content of hydrophobic amino acids in chickpea as compared to the soybean protein. Zhang et
al., (2009) also reported an increase in antioxidant activity of rice endosperm protein with an
increase in protein concentration, and that rice endosperm protein hydrolysates have higher
antioxidant activity as compared to the isolated rice endosperm protein. Table 4.2 shows the %
antioxidant activity of soybean/chickpea proteins and hydrolysates at different protein
concentration.
Figure 4.3 Antioxidant activity curve for isolated soybean protein (ISP) and soybean protein
hydrolysates (SPH).
0
5
10
15
20
25
30
35
0 2.5 5 7.5 10
% A
nti
oxi
dan
t ac
tivi
ty
Concentration (mg/mL)
ISP
SPH
39
Figure 4.4 Antioxidant activity curve for isolated chickpea protein (ICP) and chickpea protein
hydrolysates (CPH).
Table 4.2 Antioxidant activity of isolated soybean protein (ISP) and soybean protein
hydrolysates (SPH); isolated chickpea protein (ICP) and chickpea protein hydrolysates (CPH) at
different protein concentrations.
Conc.
(mg/mL)
% AA (ISP) % AA (SPH) % AA (ICP) % AA (CPH)
2.5 6 16.5 1.8 3.4
5.0 7.5 25.0 4.8 10.8
7.5 8.7 27.8 5.3 17.9
10 10.6 32.0 8.3 26.8
Results are average of duplicate determinations
AA = Antioxidant Activity
0
5
10
15
20
25
30
0 2.5 5 7.5 10
% A
nti
oxi
dan
t ac
tivi
ty
Concentration (mg/mL)
ICP
CPH
40
4.3 Characterization of Proteins and Protein hydrolysates
4.3.1 SDS-PAGE of Isolated Soybean Protein (ISP), Soybean Protein Hydrolysates (SPH),
Isolated Chickpea Protein (ICP) and Chickpea Protein Hydrolysates (CPH)
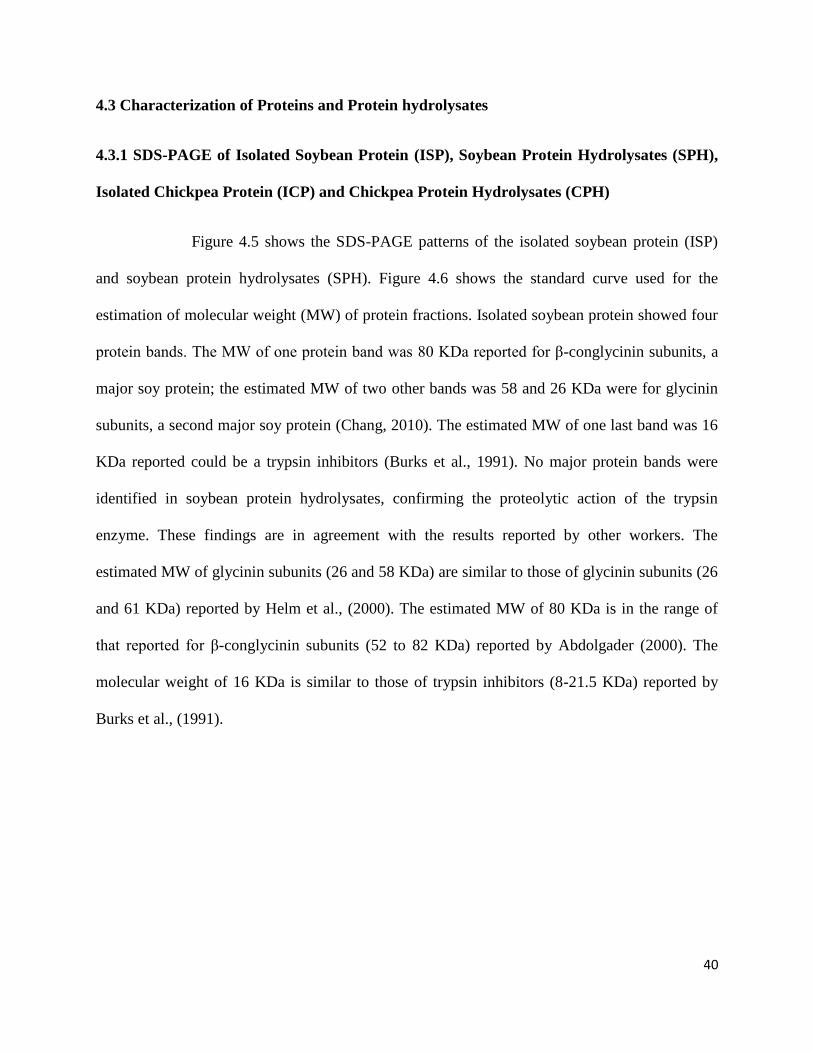
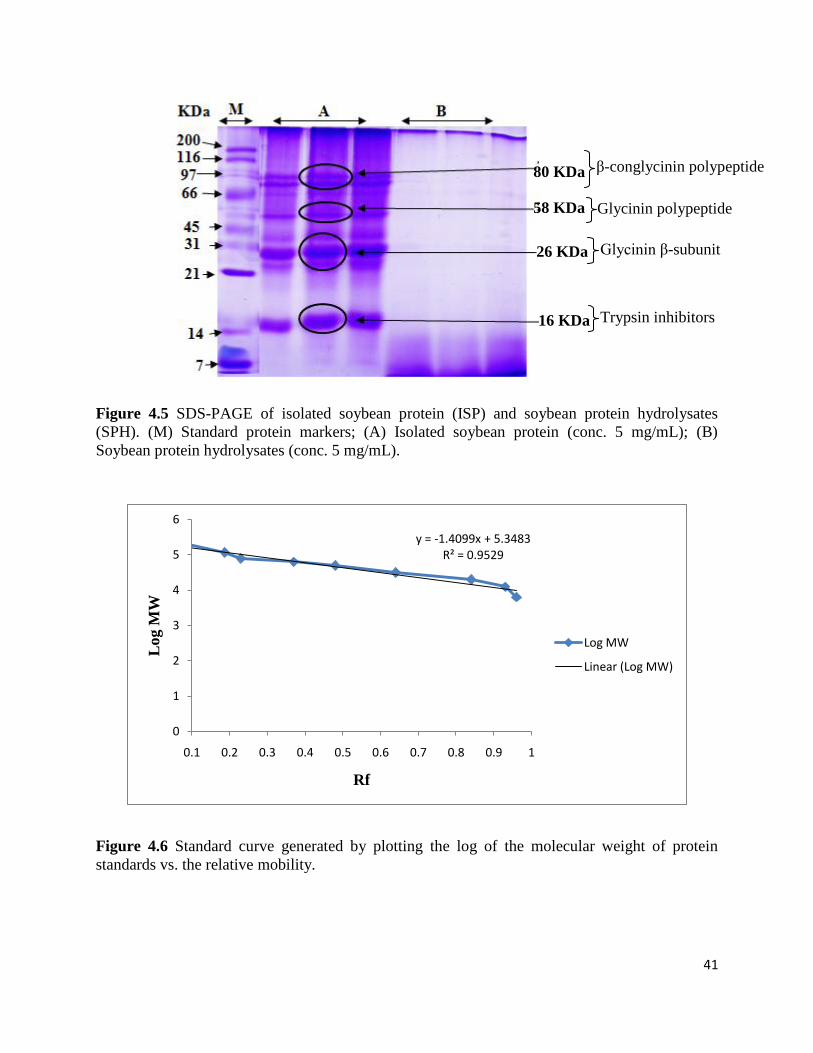
Figure 4.5 shows the SDS-PAGE patterns of the isolated soybean protein (ISP)
and soybean protein hydrolysates (SPH). Figure 4.6 shows the standard curve used for the
estimation of molecular weight (MW) of protein fractions. Isolated soybean protein showed four
protein bands. The MW of one protein band was 80 KDa reported for β-conglycinin subunits, a
major soy protein; the estimated MW of two other bands was 58 and 26 KDa were for glycinin
subunits, a second major soy protein (Chang, 2010). The estimated MW of one last band was 16
KDa reported could be a trypsin inhibitors (Burks et al., 1991). No major protein bands were
identified in soybean protein hydrolysates, confirming the proteolytic action of the trypsin
enzyme. These findings are in agreement with the results reported by other workers. The
estimated MW of glycinin subunits (26 and 58 KDa) are similar to those of glycinin subunits (26
and 61 KDa) reported by Helm et al., (2000). The estimated MW of 80 KDa is in the range of
that reported for β-conglycinin subunits (52 to 82 KDa) reported by Abdolgader (2000). The
molecular weight of 16 KDa is similar to those of trypsin inhibitors (8-21.5 KDa) reported by
Burks et al., (1991).
41
Figure 4.5 SDS-PAGE of isolated soybean protein (ISP) and soybean protein hydrolysates
(SPH). (M) Standard protein markers; (A) Isolated soybean protein (conc. 5 mg/mL); (B)
Soybean protein hydrolysates (conc. 5 mg/mL).
Figure 4.6 Standard curve generated by plotting the log of the molecular weight of protein
standards vs. the relative mobility.
y = -1.4099x + 5.3483R² = 0.9529
0
1
2
3
4
5
6
0.1 0.2 0.3 0.4 0.5 0.6 0.7 0.8 0.9 1
Log M
W
Rf
Log MW
Linear (Log MW)
80 KDa
58 KDa
26 KDa
16 KDa
β-conglycinin polypeptide
Glycinin polypeptide
Glycinin β-subunit
Trypsin inhibitors
42
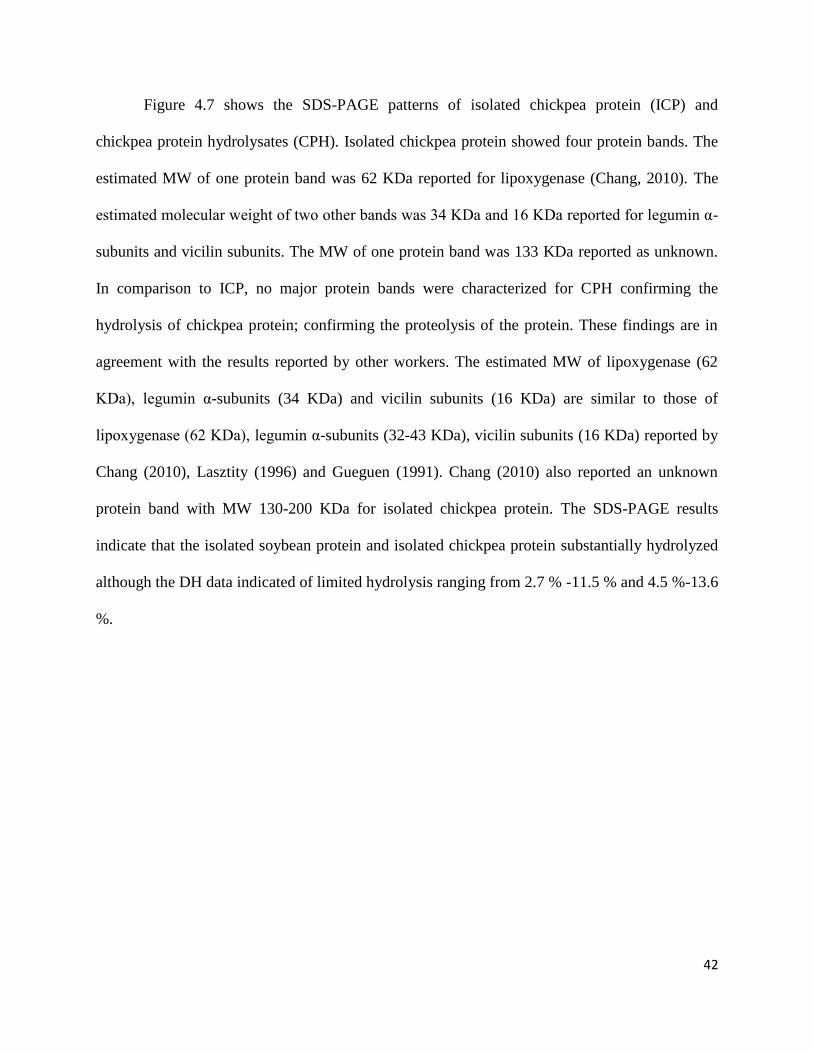
Figure 4.7 shows the SDS-PAGE patterns of isolated chickpea protein (ICP) and
chickpea protein hydrolysates (CPH). Isolated chickpea protein showed four protein bands. The
estimated MW of one protein band was 62 KDa reported for lipoxygenase (Chang, 2010). The
estimated molecular weight of two other bands was 34 KDa and 16 KDa reported for legumin α-
subunits and vicilin subunits. The MW of one protein band was 133 KDa reported as unknown.
In comparison to ICP, no major protein bands were characterized for CPH confirming the
hydrolysis of chickpea protein; confirming the proteolysis of the protein. These findings are in
agreement with the results reported by other workers. The estimated MW of lipoxygenase (62
KDa), legumin α-subunits (34 KDa) and vicilin subunits (16 KDa) are similar to those of
lipoxygenase (62 KDa), legumin α-subunits (32-43 KDa), vicilin subunits (16 KDa) reported by
Chang (2010), Lasztity (1996) and Gueguen (1991). Chang (2010) also reported an unknown
protein band with MW 130-200 KDa for isolated chickpea protein. The SDS-PAGE results
indicate that the isolated soybean protein and isolated chickpea protein substantially hydrolyzed
although the DH data indicated of limited hydrolysis ranging from 2.7 % -11.5 % and 4.5 %-13.6
%.
43
Figure 4.7 SDS-PAGE of isolated chickpea protein (ICP) and chickpea protein hydrolysates
(CPH). (M) Standard protein markers; (A) Isolated chickpea protein (conc. 5 mg/mL); (B)
Chickpea protein hydrolysates (conc. 5 mg/mL).
4.3.2 Reversed Phase HPLC (RP-HPLC)
Figure 4.8 shows the profile of isolated soybean protein (ISP) and soybean protein
hydrolysates (SPH) chromatogram by RP-HPLC. Soybean protein hydrolysates showed at least
30-35 peaks confirming the hydrolysis of the soybean protein, by comparison the isolated
soybean protein without hydrolysis showed four minor peaks. From the RP-HPLC profile of
SPH, peptides with antioxidant activity were expected to be present within the retention time of
15 min to 35 min. Four different RP-HPLC fractions of SPH (F I, F II, F III and F IV) were
collected from 15 to 35 min to evaluate their antioxidant activity according to the method
described in section 3.3 and to find fraction with high antioxidant activity. The results reported
for the RP-HPLC analysis of ISP and SPH are in agreement with the results reported by Aludatt
(2006) for ISP and SPH; the RP-HPLC analysis showed approximately similar number of peaks.
133 KDa
62 KDa
34 KDa
16 KDa
Lipoxygenase
Legumin α-subunits
Vicilin subunits
44
Figure 4.9 shows the profile of isolated chickpea protein (ICP) and chickpea protein
hydrolysates (CPH) chromatogram by RP-HPLC. RP-HPLC analysis of the ICP and CPH
showed agreement with the profile of ISP and SPH. Few minor peaks were reported for isolated
chickpea protein, while chickpea protein hydrolysates showed at least 30-35 peaks confirming
the hydrolysis of chickpea protein. Peptides with high antioxidant activity were expected to be
with in the retention time of 15-35 min. Four different fractions of CPH (F I, F II, F III, and F
IV) were collected to evaluate their antioxidant activity and to find fraction of CPH with high
antioxidant activity. The results for the RP-HPLC analysis of ICP and CPH are in agreement
with the results reported by Liu et al., (2007) and Chang (2010); approximately similar number
of peaks were obtained for both ICP and CPH.
45
Figure 4.8 RP-HPLC chromatogram of isolated soybean protein (ISP) and soybean protein hydrolysates (SPH).
0
0.05
0.1
0.15
0.2
0.25
0.3
0.35
0.4
0.45
0.5
0 5 10 15 20 25 30 35 40 45 50
AB
S (
215n
m)
Retention time (min)
SPH
ISP
F I F II F III F IV
F I
F II
F III
F IV
46
Figure 4.9 RP-HPLC chromatogram of isolated chickpea protein (ICP) and chickpea protein hydrolysates (CPH).
0
0.05
0.1
0.15
0.2
0.25
0.3
0.35
0.4
0.45
0.5
0 5 10 15 20 25 30 35 40 45 50
AB
S (
215n
m)
Retention Time (min)
CPH
ICP
F I F II F III F IV
F I
F II
F III
F IV
47
4.4 Antioxidant Activity Assay of Fractions collected from RP-HPLC
Antioxidant activity of fractions collected was measured according to the method
described in section 3.3. Figure 4.10 shows the standard curve for the bovine serum albumin
(BSA), used to calculate the protein concentration of fractions collected. Table 4.3 shows the
antioxidant activity of fractions collected from RP-HPLC analysis of SPH and CPH at protein
concentration 1 mg/mL for each fraction. The results revealed that F III of SPH showed highest
antioxidant activity of 47.71 % and F II of CPH showed highest antioxidant activity of 27.96 %
at protein concentration of 1 mg/mL suggesting that the F III of SPH and F II of CPH are rich in
peptides or amino acids with antioxidant potential. The results reported for CPH and SPH are in
agreement with the results reported by other workers. Fractions of CPH showed lower
antioxidant activity as compared to the fractions of SPH; could be related to the lower
hydrophobic amino acids in CPH (Zhu et al., 2005). Aluko et al., (2011) and Liu et al., (2007)
also reported that antioxidant activity of pea protein hydrolysates and chickpea protein
hydrolysates is due to the antioxidant potential of hydrophobic amino acids. Aluko et al., (2009)
reported that tryptophan, a hydrophobic amino acid released from mother’s milk has antioxidant
properties. Garner et al., (1998a) reported methionine, a hydrophobic amino acid has high
antioxidant potential. In comparison to CPH, amount of hydrophobic amino acids could be the
reason for high antioxidant activity of SPH. Soybean has high percentage of methionine and this
could be the reason for high antioxidant activity of SPH.
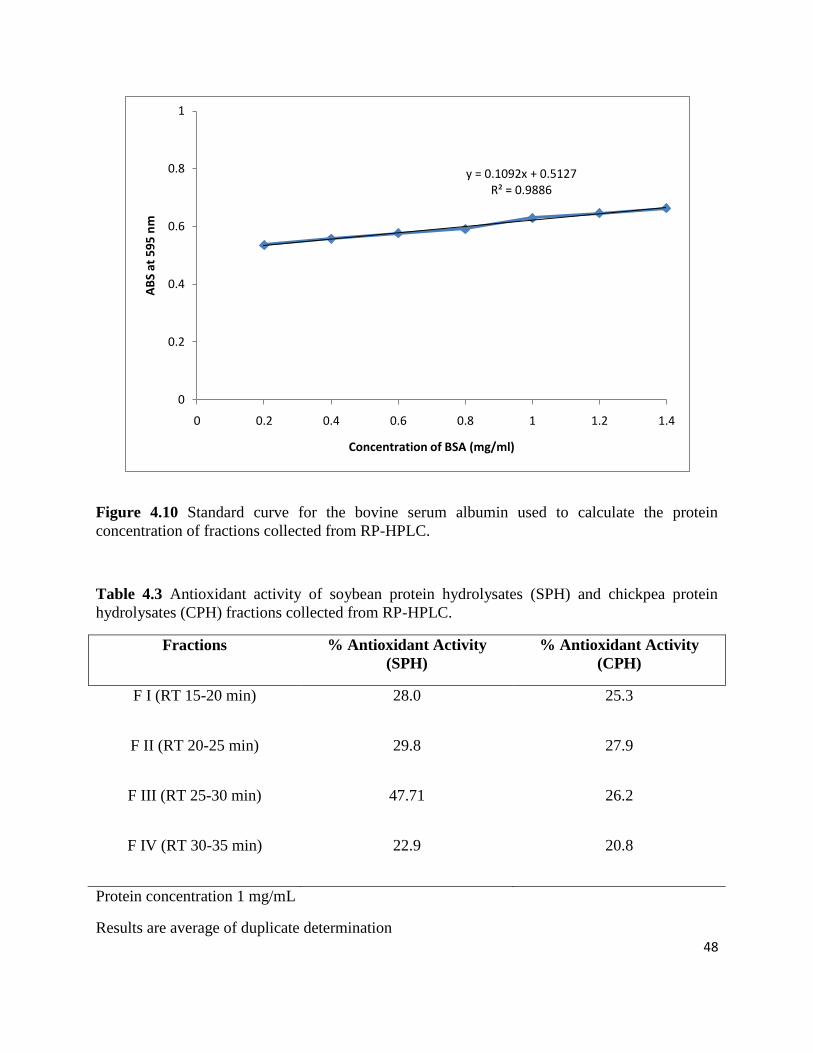
48
Figure 4.10 Standard curve for the bovine serum albumin used to calculate the protein
concentration of fractions collected from RP-HPLC.
Table 4.3 Antioxidant activity of soybean protein hydrolysates (SPH) and chickpea protein
hydrolysates (CPH) fractions collected from RP-HPLC.
Fractions % Antioxidant Activity
(SPH)
% Antioxidant Activity
(CPH)
F I (RT 15-20 min) 28.0 25.3
F II (RT 20-25 min) 29.8 27.9
F III (RT 25-30 min) 47.71 26.2
F IV (RT 30-35 min) 22.9 20.8
Protein concentration 1 mg/mL
Results are average of duplicate determination
y = 0.1092x + 0.5127R² = 0.9886
0
0.2
0.4
0.6
0.8
1
0 0.2 0.4 0.6 0.8 1 1.2 1.4
AB
S at
59
5 n
m
Concentration of BSA (mg/ml)
49
4.5 Effect of High Pressure Processing (HPP) on Degree of Hydrolysis (% DH) of Soybean
and Chickpea protein
Figure 4.11 and Figure 4.12 shows graphs for the degree of hydrolysis (% DH) of
soybean and chickpea proteins treated with High Pressure Processing (HPP) and trypsin
hydrolysis. After high pressure processing treatment followed by trypsin hydrolysis of soybean
and chickpea proteins, the degree of hydrolysis (% DH) showed an increase with pressure and
time when compared to the protein samples with no HPP treatment.
Table 4.4 and Table 4.5 shows the effect of high pressure processing on the degree of
hydrolysis of soybean and chickpea proteins. The highest rate of hydrolysis was achieved for the
protein samples treated at 600 MPa for 10 min with an almost two fold increase in degree of
hydrolysis for both soybean and chickpea protein samples as compared to the soybean and
chickpea protein hydrolysates with no high pressure processing. For soybean protein samples
treated at 400 MPa for 5 min, % DH showed an increase from 0-60 min then decreased; for
protein samples treated at 400 MPa for 10 min, % DH showed an increase from 15-75 min and
then decreased; for protein samples treated at 600 MPa for 5 min and 10 min, % DH showed an
increase from 0-60 min then decreased. The results showed a noticeable relation between % DH
and applied pressure. For SPH treated with HPP, the % DH reached 17.9 %-24.9 % as compared
to the 2.7 %-12.4 % of the soybean protein hydrolysates without high pressure processing.
The results for % DH of CPH with high pressure processing are similar to the results of
SPH treated with high pressure processing. For chickpea protein samples treated at 400 MPa for
5 min and 10 min, % DH showed an increase from 0-90 min then decreased; for chickpea protein
samples treated at 600 MPa for 5 min and 10 min, % DH showed an increase from 0-90 min then
50
decreased. For chickpea protein hydrolysates treated with high pressure processing, the % DH
reached 13.0 %-25.5 % as compared to the 4.5 %-13.6 % of the chickpea protein hydrolysates
without high pressure processing.
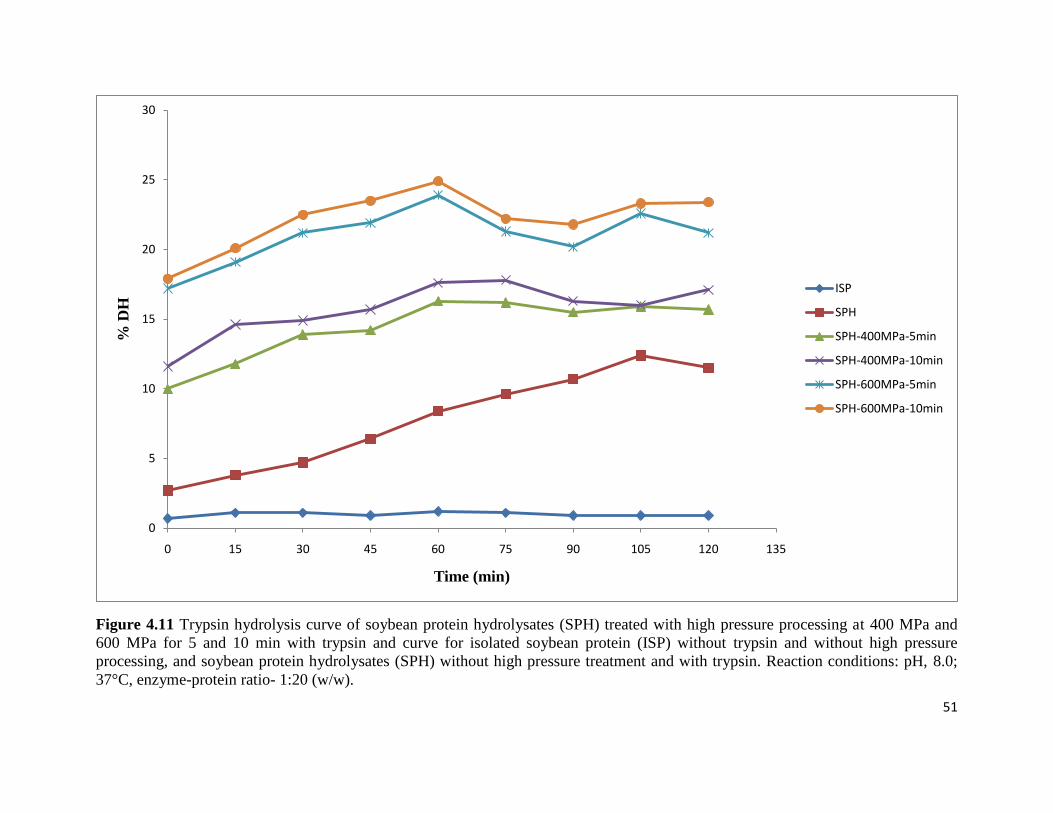
51
Figure 4.11 Trypsin hydrolysis curve of soybean protein hydrolysates (SPH) treated with high pressure processing at 400 MPa and
600 MPa for 5 and 10 min with trypsin and curve for isolated soybean protein (ISP) without trypsin and without high pressure
processing, and soybean protein hydrolysates (SPH) without high pressure treatment and with trypsin. Reaction conditions: pH, 8.0;
37°C, enzyme-protein ratio- 1:20 (w/w).
0
5
10
15
20
25
30
0 15 30 45 60 75 90 105 120 135
% D
H
Time (min)
ISP
SPH
SPH-400MPa-5min
SPH-400MPa-10min
SPH-600MPa-5min
SPH-600MPa-10min
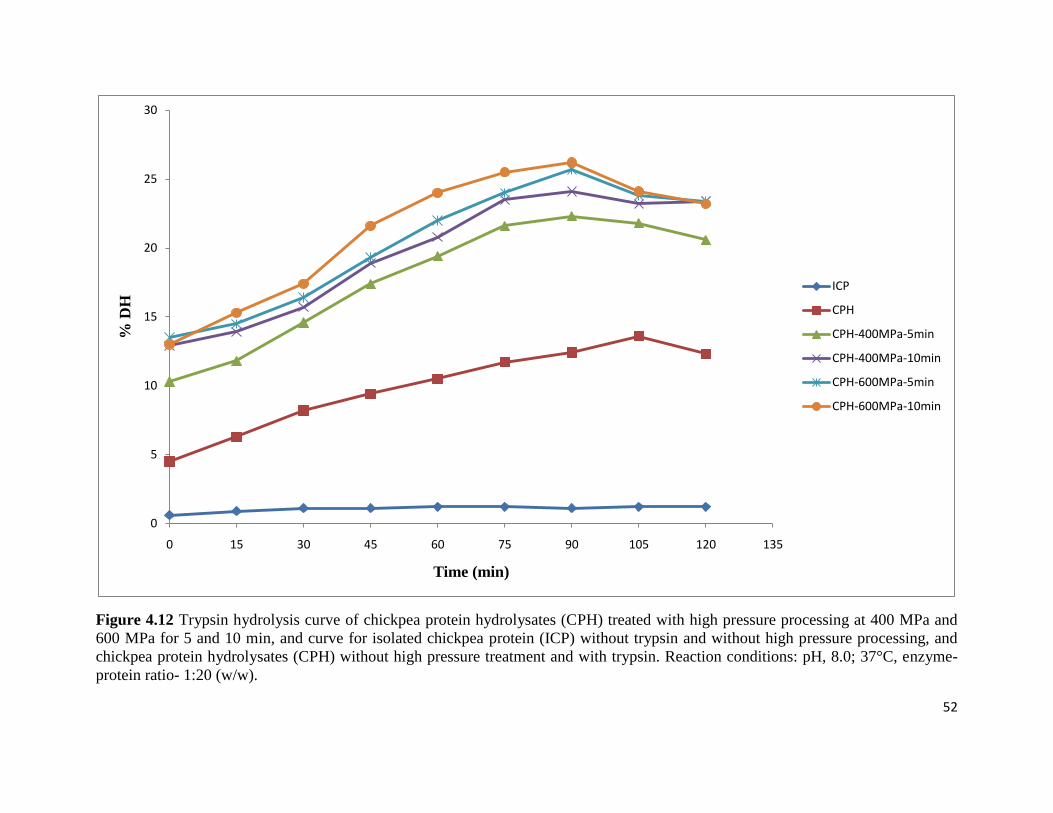
52
Figure 4.12 Trypsin hydrolysis curve of chickpea protein hydrolysates (CPH) treated with high pressure processing at 400 MPa and
600 MPa for 5 and 10 min, and curve for isolated chickpea protein (ICP) without trypsin and without high pressure processing, and
chickpea protein hydrolysates (CPH) without high pressure treatment and with trypsin. Reaction conditions: pH, 8.0; 37°C, enzyme-
protein ratio- 1:20 (w/w).
0
5
10
15
20
25
30
0 15 30 45 60 75 90 105 120 135
% D
H
Time (min)
ICP
CPH
CPH-400MPa-5min
CPH-400MPa-10min
CPH-600MPa-5min
CPH-600MPa-10min
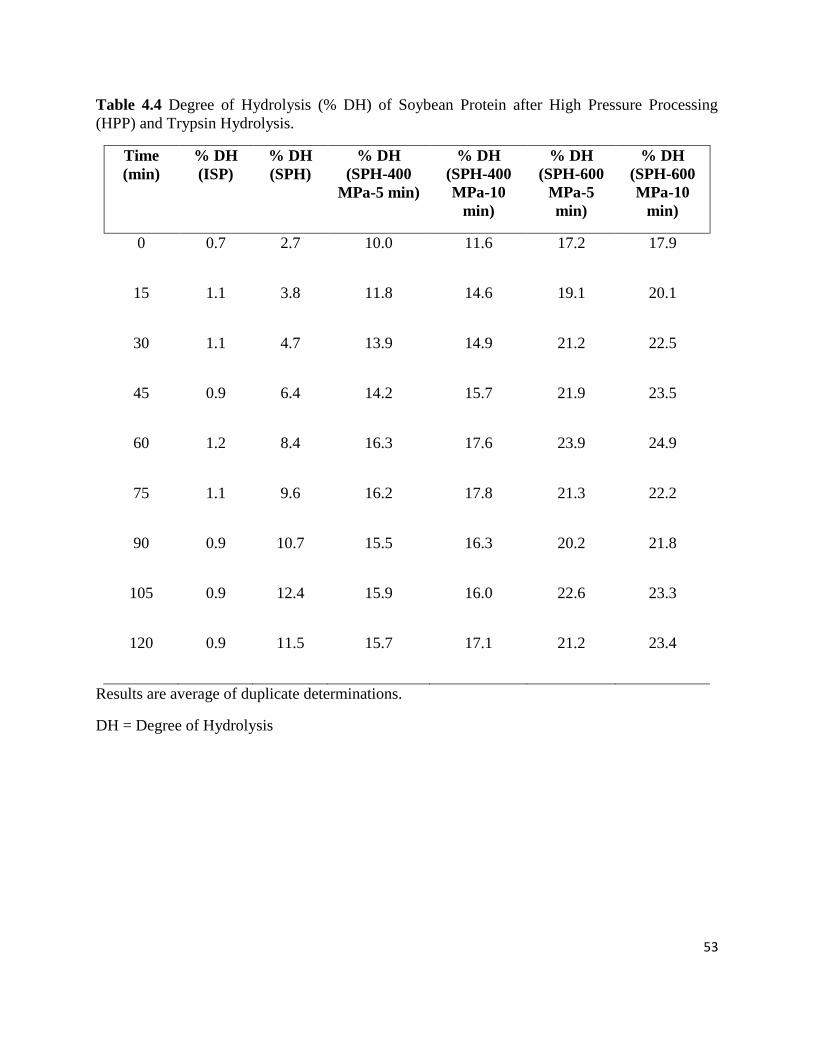
53
Table 4.4 Degree of Hydrolysis (% DH) of Soybean Protein after High Pressure Processing
(HPP) and Trypsin Hydrolysis.
Time
(min)
% DH
(ISP)
% DH
(SPH)
% DH
(SPH-400
MPa-5 min)
% DH
(SPH-400
MPa-10
min)
% DH
(SPH-600
MPa-5
min)
% DH
(SPH-600
MPa-10
min)
0 0.7 2.7 10.0 11.6 17.2 17.9
15 1.1 3.8 11.8 14.6 19.1 20.1
30 1.1 4.7 13.9 14.9 21.2 22.5
45 0.9 6.4 14.2 15.7 21.9 23.5
60 1.2 8.4 16.3 17.6 23.9 24.9
75 1.1 9.6 16.2 17.8 21.3 22.2
90 0.9 10.7 15.5 16.3 20.2 21.8
105 0.9 12.4 15.9 16.0 22.6 23.3
120 0.9 11.5 15.7 17.1 21.2 23.4
Results are average of duplicate determinations.
DH = Degree of Hydrolysis
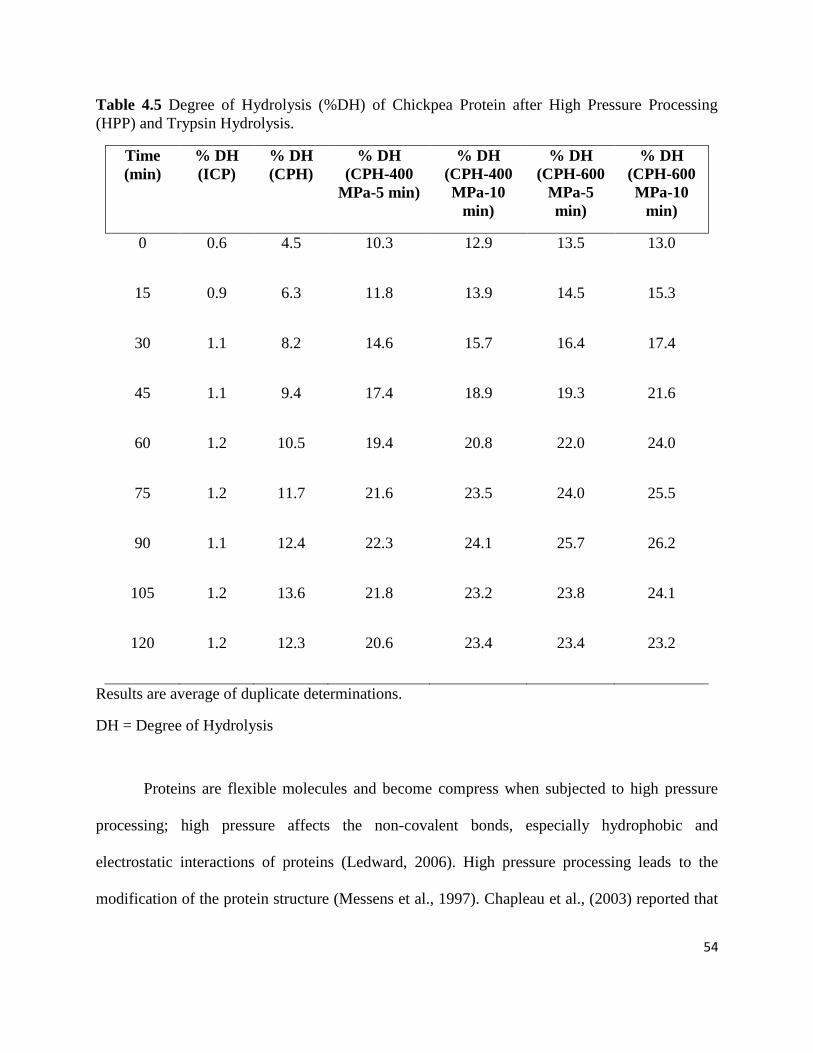
54
Table 4.5 Degree of Hydrolysis (%DH) of Chickpea Protein after High Pressure Processing
(HPP) and Trypsin Hydrolysis.
Time
(min)
% DH
(ICP)
% DH
(CPH)
% DH
(CPH-400
MPa-5 min)
% DH
(CPH-400
MPa-10
min)
% DH
(CPH-600
MPa-5
min)
% DH
(CPH-600
MPa-10
min)
0 0.6 4.5 10.3 12.9 13.5 13.0
15 0.9 6.3 11.8 13.9 14.5 15.3
30 1.1 8.2 14.6 15.7 16.4 17.4
45 1.1 9.4 17.4 18.9 19.3 21.6
60 1.2 10.5 19.4 20.8 22.0 24.0
75 1.2 11.7 21.6 23.5 24.0 25.5
90 1.1 12.4 22.3 24.1 25.7 26.2
105 1.2 13.6 21.8 23.2 23.8 24.1
120 1.2 12.3 20.6 23.4 23.4 23.2
Results are average of duplicate determinations.
DH = Degree of Hydrolysis
Proteins are flexible molecules and become compress when subjected to high pressure
processing; high pressure affects the non-covalent bonds, especially hydrophobic and
electrostatic interactions of proteins (Ledward, 2006). High pressure processing leads to the
modification of the protein structure (Messens et al., 1997). Chapleau et al., (2003) reported that
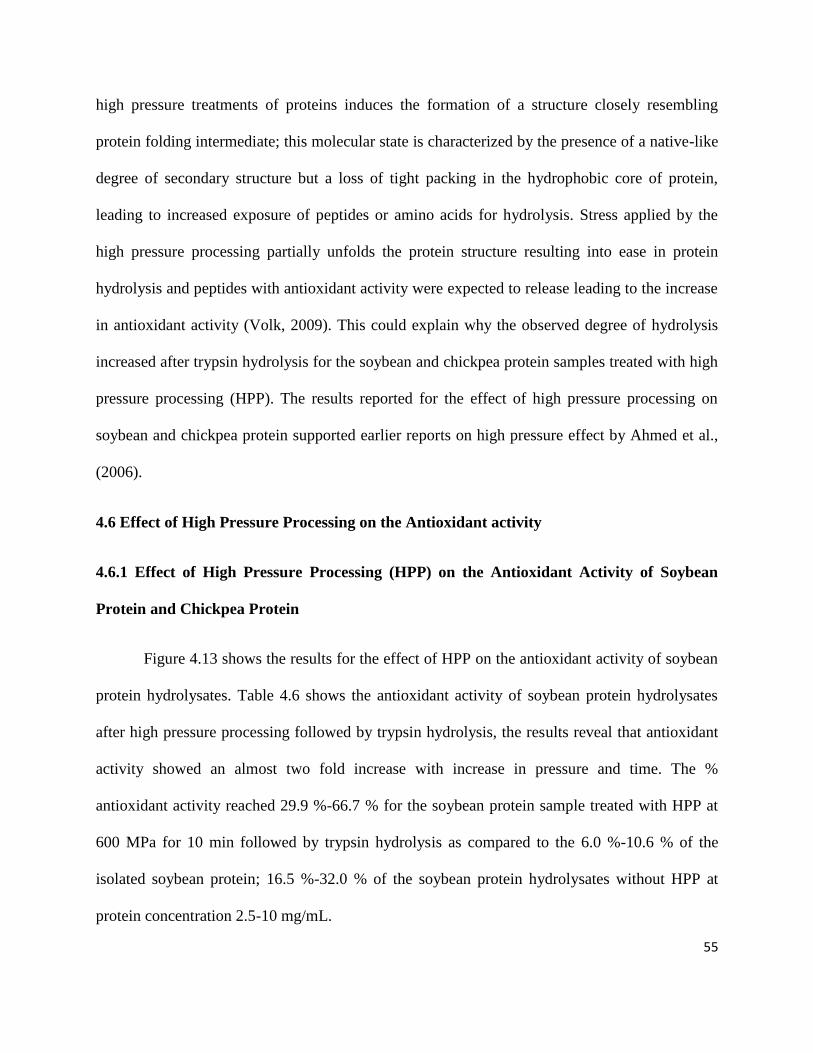
55
high pressure treatments of proteins induces the formation of a structure closely resembling
protein folding intermediate; this molecular state is characterized by the presence of a native-like
degree of secondary structure but a loss of tight packing in the hydrophobic core of protein,
leading to increased exposure of peptides or amino acids for hydrolysis. Stress applied by the
high pressure processing partially unfolds the protein structure resulting into ease in protein
hydrolysis and peptides with antioxidant activity were expected to release leading to the increase
in antioxidant activity (Volk, 2009). This could explain why the observed degree of hydrolysis
increased after trypsin hydrolysis for the soybean and chickpea protein samples treated with high
pressure processing (HPP). The results reported for the effect of high pressure processing on
soybean and chickpea protein supported earlier reports on high pressure effect by Ahmed et al.,
(2006).
4.6 Effect of High Pressure Processing on the Antioxidant activity
4.6.1 Effect of High Pressure Processing (HPP) on the Antioxidant Activity of Soybean
Protein and Chickpea Protein
Figure 4.13 shows the results for the effect of HPP on the antioxidant activity of soybean
protein hydrolysates. Table 4.6 shows the antioxidant activity of soybean protein hydrolysates
after high pressure processing followed by trypsin hydrolysis, the results reveal that antioxidant
activity showed an almost two fold increase with increase in pressure and time. The %
antioxidant activity reached 29.9 %-66.7 % for the soybean protein sample treated with HPP at
600 MPa for 10 min followed by trypsin hydrolysis as compared to the 6.0 %-10.6 % of the
isolated soybean protein; 16.5 %-32.0 % of the soybean protein hydrolysates without HPP at
protein concentration 2.5-10 mg/mL.
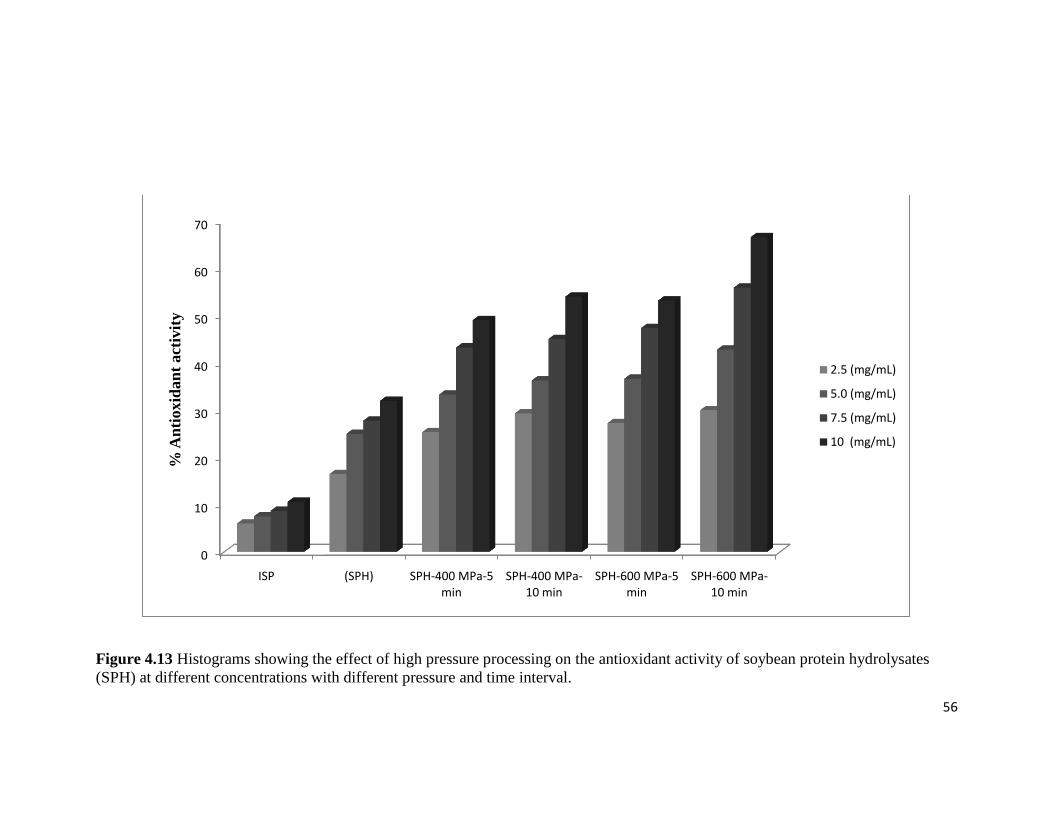
56
Figure 4.13 Histograms showing the effect of high pressure processing on the antioxidant activity of soybean protein hydrolysates
(SPH) at different concentrations with different pressure and time interval.
0
10
20
30
40
50
60
70
ISP (SPH) SPH-400 MPa-5 min
SPH-400 MPa-10 min
SPH-600 MPa-5 min
SPH-600 MPa-10 min
% A
nti
oxid
an
t act
ivit
y
2.5 (mg/mL)
5.0 (mg/mL)
7.5 (mg/mL)
10 (mg/mL)
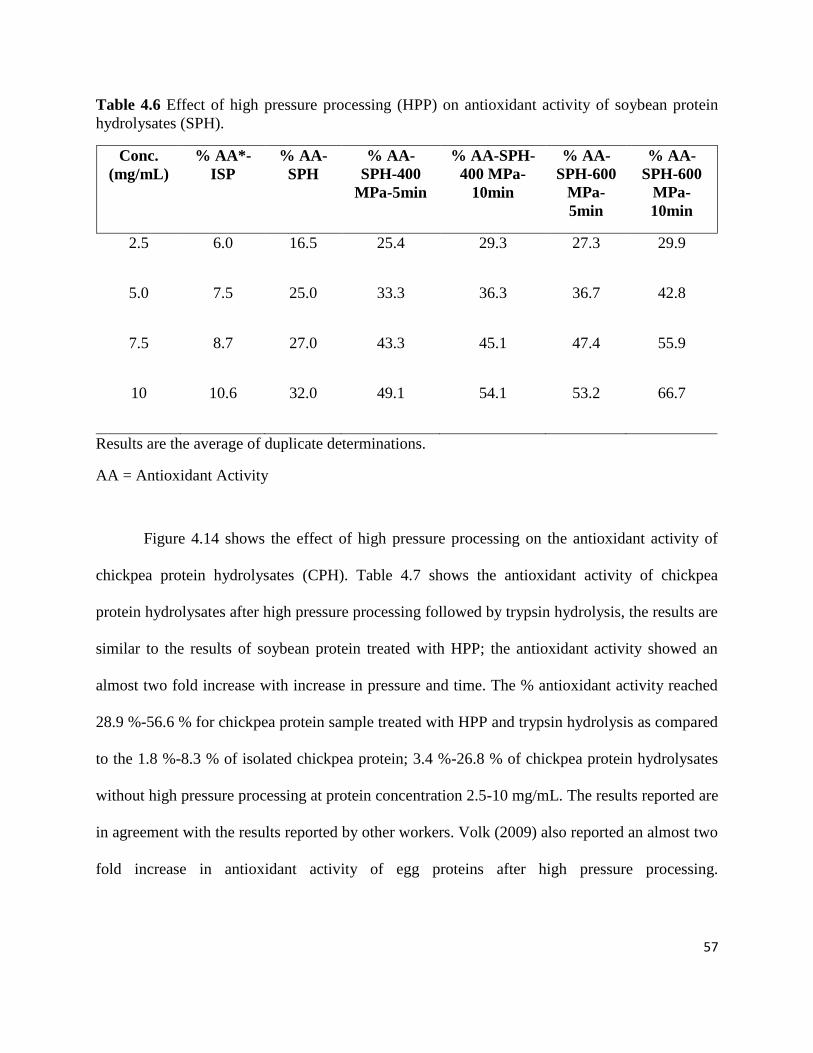
57
Table 4.6 Effect of high pressure processing (HPP) on antioxidant activity of soybean protein
hydrolysates (SPH).
Conc.
(mg/mL)
% AA*-
ISP
% AA-
SPH
% AA-
SPH-400
MPa-5min
% AA-SPH-
400 MPa-
10min
% AA-
SPH-600
MPa-
5min
% AA-
SPH-600
MPa-
10min
2.5 6.0 16.5 25.4 29.3 27.3 29.9
5.0 7.5 25.0 33.3 36.3 36.7 42.8
7.5 8.7 27.0 43.3 45.1 47.4 55.9
10 10.6 32.0 49.1 54.1 53.2 66.7
Results are the average of duplicate determinations.
AA = Antioxidant Activity
Figure 4.14 shows the effect of high pressure processing on the antioxidant activity of
chickpea protein hydrolysates (CPH). Table 4.7 shows the antioxidant activity of chickpea
protein hydrolysates after high pressure processing followed by trypsin hydrolysis, the results are
similar to the results of soybean protein treated with HPP; the antioxidant activity showed an
almost two fold increase with increase in pressure and time. The % antioxidant activity reached
28.9 %-56.6 % for chickpea protein sample treated with HPP and trypsin hydrolysis as compared
to the 1.8 %-8.3 % of isolated chickpea protein; 3.4 %-26.8 % of chickpea protein hydrolysates
without high pressure processing at protein concentration 2.5-10 mg/mL. The results reported are
in agreement with the results reported by other workers. Volk (2009) also reported an almost two
fold increase in antioxidant activity of egg proteins after high pressure processing.
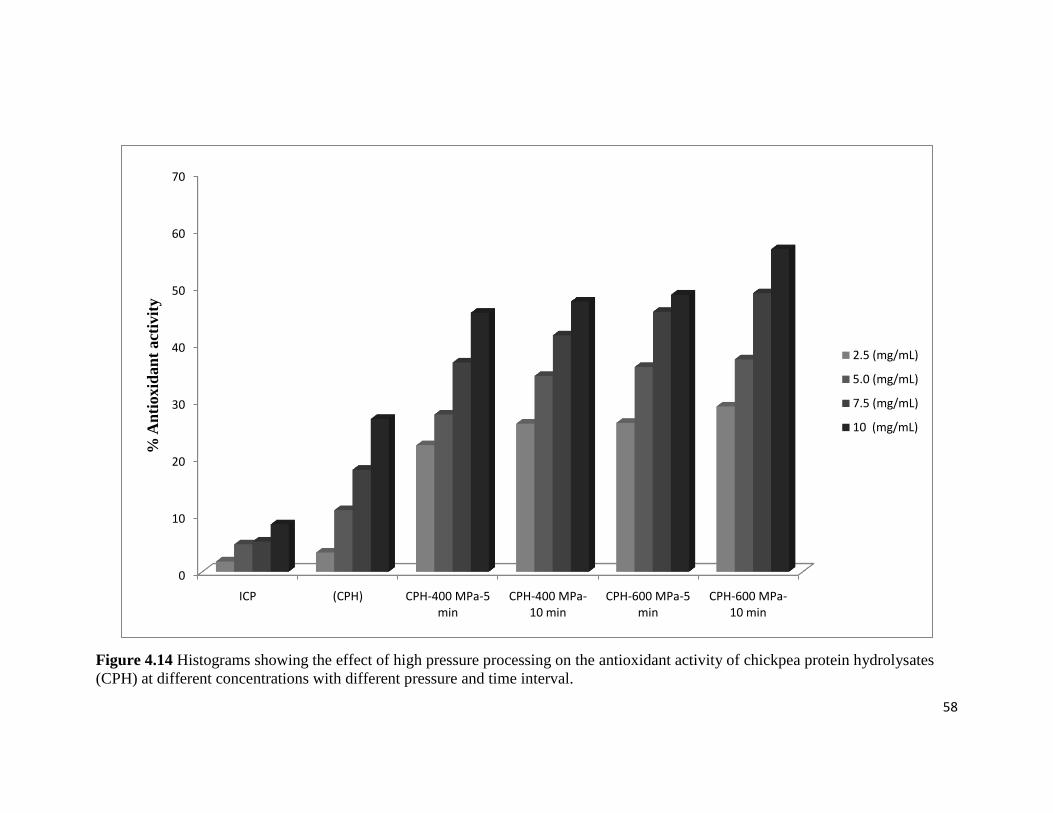
58
Figure 4.14 Histograms showing the effect of high pressure processing on the antioxidant activity of chickpea protein hydrolysates
(CPH) at different concentrations with different pressure and time interval.
0
10
20
30
40
50
60
70
ICP (CPH) CPH-400 MPa-5 min
CPH-400 MPa-10 min
CPH-600 MPa-5 min
CPH-600 MPa-10 min
% A
nti
oxid
an
t act
ivit
y
2.5 (mg/mL)
5.0 (mg/mL)
7.5 (mg/mL)
10 (mg/mL)
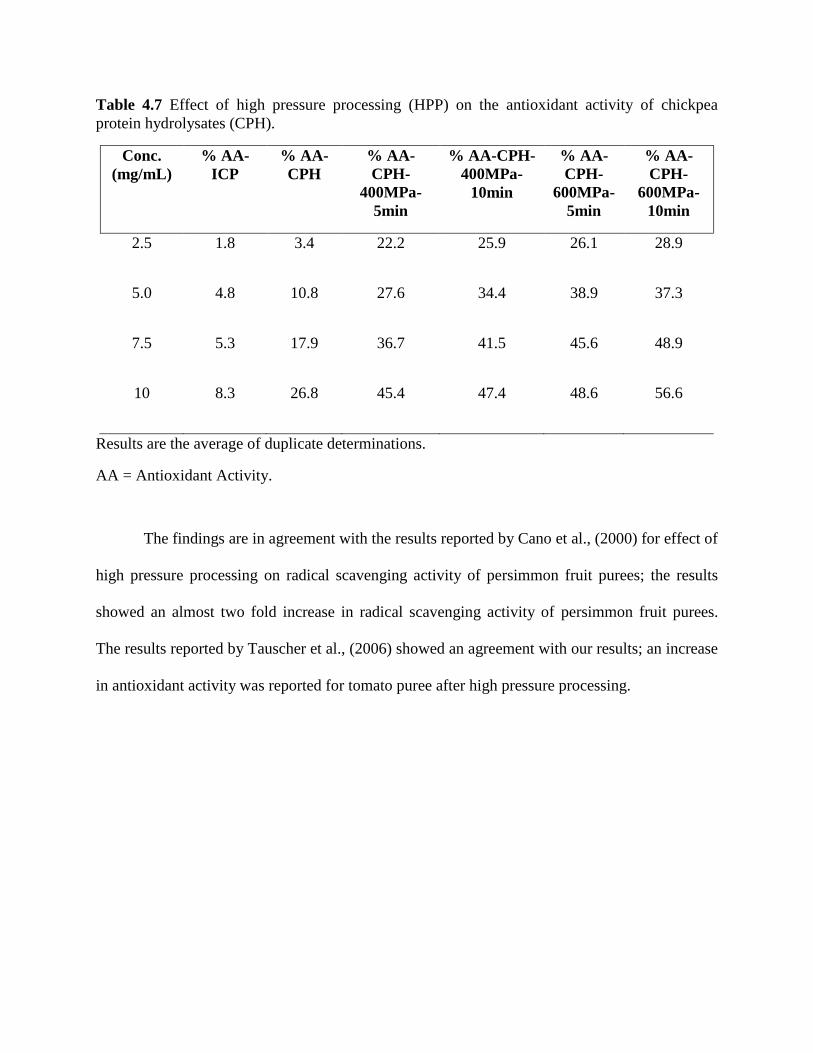
Table 4.7 Effect of high pressure processing (HPP) on the antioxidant activity of chickpea
protein hydrolysates (CPH).
Conc.
(mg/mL)
% AA-
ICP
% AA-
CPH
% AA-
CPH-
400MPa-
5min
% AA-CPH-
400MPa-
10min
% AA-
CPH-
600MPa-
5min
% AA-
CPH-
600MPa-
10min
2.5 1.8 3.4 22.2 25.9 26.1 28.9
5.0 4.8 10.8 27.6 34.4 38.9 37.3
7.5 5.3 17.9 36.7 41.5 45.6 48.9
10 8.3 26.8 45.4 47.4 48.6 56.6
Results are the average of duplicate determinations.
AA = Antioxidant Activity.
The findings are in agreement with the results reported by Cano et al., (2000) for effect of
high pressure processing on radical scavenging activity of persimmon fruit purees; the results
showed an almost two fold increase in radical scavenging activity of persimmon fruit purees.
The results reported by Tauscher et al., (2006) showed an agreement with our results; an increase
in antioxidant activity was reported for tomato puree after high pressure processing.
60
GENERAL CONCLUSION
Trypsin hydrolysis of the soybean and chickpea protein as measured by degree of
hydrolysis (% DH) showed a continuous increase with time of hydrolysis. Maximum degree of
hydrolysis for soybean and chickpea protein hydrolysates was reported to be 12.42 % and 13.6
%, respectively. Soybean and chickpea protein hydrolysates showed higher antioxidant activity
as compared to the isolated soybean and chickpea protein. Maximum antioxidant activity for
soybean and chickpea protein hydrolysates were 32 % and 26.8 % respectively at protein
concentration 10 mg/mL. SDS-PAGE confirmed the hydrolysis of soybean and chickpea protein,
four protein bands with different molecular weight were observed for isolated soybean and
chickpea protein. RP-HPLC analysis showed 30-35 peaks for soybean protein hydrolysates and
chickpea protein hydrolysates. Fractions with high antioxidant activity were identified from the
RP-HPLC analysis of soybean and chickpea protein hydrolysates. The fraction resulting from 25
to 30 min of soybean protein hydrolysates showed maximum antioxidant activity of 47.71 % and
the fraction resulting from 15 to 20 min of chickpea protein hydrolysates showed maximum
antioxidant activity of 27.96 % at protein concentration 1 mg/mL.
High Pressure Processing showed increase in degree of hydrolysis (% DH) and
antioxidant activity of soybean and chickpea protein with increase in pressure and time.
Maximum degree of hydrolysis was reported to be 24.91 % and 26.21 % for the soybean and
chickpea protein samples treated at 600 MPa for 10 min. Antioxidant activity increased by
approximately two folds after high pressure processing. Maximum antioxidant activity was 66.67
% and 56.59 % for the soybean and chickpea protein hydrolysates treated with 600 MPa for 10
min and with trypsin hydrolysis.
61
References:
Abdolgader, R.E. (2000). Isolation and characterization of a high gelling protein from soybean.
M.Sc. Thesis, Dept. of Food Science and Agricultural Chemistry, McGill University.
Abuja, P. and Albertini, R. (2001). Methods for monitoring oxidative stress, lipid peroxidation
and oxidation resistance of lipoproteins. Clinica Chimica Acta., 306, 1-17.
Adler-Nissen J. (1986). Enzymatic hydrolysis of food proteins. UK, Elsevier Applied Science
Publishers, pp 9-56, 110-169.
Adebiyi, A., Adebiyi, A., Ogawa, T. and Muramoto, K. (2008). Purification and characterization
of antioxidative peptides from unfractionated rice bran protein hydrolysates., J. Food Technol.,
43, 35-43.
Ahmed, J., Ayad, A., Ramaswamy, H., Alli I., and Shao, Y. (2007). Dynamic viscoelastic
behaviour of high pressure treated soybean protein isolate dispersions. Intl. J. Food Prop., 10,
397-411.
Allen, J.C. and Wrieden, W.L. (1981a). Influence of milk proteins on lipid oxidation in aqueous
emulsion I. Casein, whey protein and α-lactalbumin. J. Dairy Res., 49, 239-248.
Allen, J.C. and Wrieden, W.L. (1981b). Influence of milk proteins on lipid oxidation in aqueous
emulsion II. Lactoperoxidase, lactoferrin, superoxide dismutase and xanthine oxidase. J. Dairy
Res., 49, 249-263.
Aludatt., M. (2006). Phenolic compounds in oil-bearing plants and their interactions with oilseed
protein isolates. PhD Thesis, Department of Food Science and Agricultural Chemistry, McGill
University.
62
Aluko, R.E., Li, H. (2010). Identification and inhibitory properties of multifunctional peptides
from pea protein hydrolysate. J. Agric. Food Chem. 58, 11471-11476.
Aluko, R.E., Tsopmo, A., Diehl-Jones, B.W., Kitts, D., Elisia, I., and Friel, J.K. 2009.
Tryptophan released from mother’s milk has antioxidant properties. Pediatric Res. 66, 614-618.
Ayad, A.A. (2010). Characterization and properties of flaxseed protein fractions. PhD Thesis,
McGill University, Montreal, Canada.
Arosio, P. and Levi, S. (2002). Ferritin, iron homeostasis, and oxidative damage. Free Radic.
Biol. Med., 33, 457–463.
Bateman, L., Hughes, H. and Morris, A.L. (1953). Hydroperoxide decomposition in relation to
the initiation of radical chain reactions. Discuss Faraday Soc., 14, 190-199.
Block, G. and Langseth, L. (1994). Antioxidant vitamins and disease prevention. Food Technol.,
48, 80-84.
Bourdon, E., Loreau, N. and Blache, D. (1999). Glucose and free radicals impair the antioxidant
properties of serum albumin. Faseb. J., 13, 233–244.
Burks, A. W., Williams, L.W., Helm, R.M., Thresher, W., Brooks, J.R., and Sampson, H.A.
(1991). Identification of soy protein allergens in patients with atopic dermatitis and positive soy
challenges; determination of change in allergenicity after heating or enzyme digestion. Adv Exp
Med Biol. 289, 295-307.
Calvert, J.T. and Decker, E.A. (1992). Inhibition of Lipid Oxidation by combinations of
Carnosine and Various Antioxidants in Ground Turkey. J. Food Qual., 15, 423-433.
63
Cano, P.M., Gonzalez, E., and Ancos, B. (2000). Effect of High-Pressure Treatment on the
Carotenoid Composition and the Radical Scavenging Activity of Persimmon Fruit Purees. J.
Agric. Food Chem., 48(8), 3542-3548.
Carrondo, M. A. (2003). Ferritin iron uptake and storage from the bacterioferritin viewpoint.
Embo. J., 22, 1959–1968.
Chan, A.C., Tran, K., Raynor, T., Ganz, P.R. and Chan, C.L. (1991). Regeneration of vitamin E
in human platelets. J Biol Chem., 266, 17290-17295.
Chan, K.M., Decker, E.A., Lee, J.B. and Butterfield, D.A. (1994). EPR spin trapping studies of
the hydroxyl radical scavenging ability of carnosine and related dipeptides. J. Agric. Food
Chem., 42, 1407-1410.
Chang, Yu-Wei. (2010). Isolation and characterization of protein fractions from chickpea (Cicer
arietinum L.) and oat (Avena sativa L.) using proteomic techniques. PhD Thesis, McGill
University, Montreal, Canada.
Chanput, W., Theerakulkait, C. and Nakai, S. (2009). Antioxidative properties of partially
purified barley hordein, rice bran protein fractions and their hydrolysates.
Chapleau, N., Mangavel, C., Compoint, J., and Anton, M. (2003). Effect of high pressure
processing on myofibrillar protein structure. J. Sci Food Agric., 84, 66-74.
Chen, H.M., Muramoto, K., Yamauchi, F., and Kiyoshi, N. (1996). Antioxidant activity of
design peptides based on the antioxidant peptide isolated from digests of a soybean protein. J.
Agric. Food Chem., 44, 2619-2623.
64
Church, F.C., Swaisgood, H.E., Porter, D.H. and Catignani, G.L. (1983). Spectrophotometric
assay using o-Phthaldialdehyde for determination of proteosis in milk and isolated milk proteins.
J. Dairy Sci., 66, 1219-1227.
Coulter, R.B. (1988). Extending shelflife by using traditional phenolic antioxidants. Cereal
Foods World, 33, 207-210.
Coulter, R.B. (1988). Extending shelflife by using traditional phenolic antioxidants. Cereal
Foods World., 33, 207-210.
Dalgleish, D. G., Srinivasan, M., and Singh, M. (1995). Surface properties of oil-in-water
emulsion droplets containing casein and Tween-60. J. Agric. Food Chem., 43, 2351–2355.
Davies, M. J., and Hawkins, C. L. (2004). EPR spin trapping of protein radicals. Free Rad. Biol.
Med., 36, 1072–1086.
Decker, E. A. (2002). Antioxidant Mechanisms. 2nd Edition. In. Lipid Chem-istry. Ed. C.C.
Akoh and D.B. MinMarcel Dekker, Inc. New York, NY.
Decker, E.A. and Crum, A. (1991). Inhibition of oxidative rancidity in salted ground pork by
carnosine. J. Food Sci., 56, 1179-1181.
Diaz, M. and Decker, E.A. (2005). Antioxidant mechanisms of caseinophosphopeptides and
casein hydrolysates and their application in ground beef. J. Agric. Food Chem., 52, 8208-8213.
Diaz, M., Dunn, C.M., McClements, D.J. and Decker, E.A. (2003). Use of
caseinophosphopeptides as natural antioxidants in oil-in-water emulsions. J. Agric. Food Chem.,
51, 2365-2370.
65
Donnelly, J.L., Decker, E.A. and McClements, D.J. (1998). Iron-catalyzed oxidation of
Menhaden oil as affected by emulsifiers. J. Food Sci., 63, 997-1000.
Elias, R. J., Bridgewater, J. D., Vachet, R. W., Waraho, T., McClements, D. J., and Decker, E. A.
(2006). Antioxidant mechanisms of enzymatic hydrolysates of β -lactoglobulin in food lipid
dispersions. J. Agric. Food Chem., 54, 9565– 9572.
Elias, R.J., McClements, D.J. and Decker, E.A. (2005). Antioxidant activity of cysteine,
tryptophan, and methionine residues in continuous phase beta-lactoglobulin in oil-in-water
emulsions. J. Agric. Food Chem., 53, 10248-10253.
El-Ramahi, R.S. (2003). Isolation and characterization of proteins from defatted flaxseed meal.
M.Sc Thesis, McGill University, Montreal, Canada.
Eriksson, C.E. (1987). Oxidation of lipids in food systems. In: Chan HWS (ed), Autooxidation of
unsaturated lipids. Academic Press, London pp 207-231.
Faraji, H., Decker, E.A. and Aaron, D.K. (1991). Suppression of lipid oxidation in
phosphatidylcholine liposomes and ground pork by spray dried porcine plasma. J. Agric. Food
Chem., 39, 1288-1290.
Faraji, H., McClements, D. J. and Decker, E. A. (2004). Role of continuous phase protein on the
oxidative stability of fish oil-in-water emulsions. J. Agric Food Chem., 52, 4558–4564.
Fennema, O. R. (1996). Food Chemistry. New York: Marcel Dekker.
Garner, B., Waldeck, A. R., Witting, P. K., Rye, K. A., and Stocker, R. (1998a). Oxidation of
high density lipoproteins. II. Evidence for direct reduction of lipid hydroperoxides by methionine
residues of apolipoproteins AI and AII. J. Biol. Chem., 273, 6088–6095.
66
Garner, B., Witting, P. K., Waldeck, A. R., Christison, J. K., Raftery, M., and Stocker, R.
(1998b). Oxidation of high density lipoproteins. I. Formation of methionine sulfoxide in
apolipoproteins AI and AII is an early event that accompanies lipid peroxidation and can be
enhanced by alpha-tocopherol. J. Biol. Chem., 273, 6080–6087.
Ge, Y., Sun, A., Ni, Y. and Cai, T. (2000). Some nutritional and functional properties of defatted
wheat germ protein. J. Agric. Food Chem., 48, 6215-6218.
Gueguen, J. (1991). Pea and fafabean proteins. In: B.J.F. Hudson, Developments in food
proteins. 7, 35-78. London: Elsevier applied science.
Halliwell, B. (2000). Lipid peroxidation, antioxidants and cardiovascular disease: How should
we move forward? Cardiovascular Research, 47, 410-418.
Halliwell, B. and Gutteridge JMC. (1999). Free radicals in Biology and Medicine 3rd
Ed. New
York: Oxford Univ. Press Inc. P 27-28.
Halliwell, B. and Whiteman, M. (2004). Measuring reactive species and oxidative damage in
vivo and in cell culture: How should you do it and what do the results mean. Br J Pharmacol.,
142, 231-255.
Halliwell, B., and Gutteridge, J. M. (1990). Role of free radicals and catalytic metal ions in
human disease: An overview, Meth. Enzymol., 186, 1–85.
Helm, R.M., Cockrell, G., Connaughton, C., Sampson, H.A., Bannon, G.A., Beilinson, V.,
Livingstone, D., Nielsen, N.C., and Burks, A.W. (2000). A Soybean G2 Glycinin Allergen. Int
Arch Allergy Immunol. 123, 205-212.
67
Hernandez-Ledesma, B., Davalos, A., Bartolome, B., and Amigo, L. (2005). Preparation of
antioxidant enzymatic hydrolysates from α-lactalbumin and β -lactoglobulin. Identification of
active peptides by HPLC-MS/MS. J. Agric. Food Chem., 53, 588–593.
Hoelzl, C., Bichler, J., Ferk, F., Simic, T., Nersesyan, A. and Elbling, L. (2005). Methods for the
detection of antioxidants which prevent age related diseases: A critical review with particular
emphasis on human intervention studies. J. Physiol. Pharmacol., 56, 49-64.
Hu, M., McClements, D. J. and Decker, E. A. (2003a). Impact of whey pro-tein emulsifiers on
the oxidative stability of salmon oil-in-water emulsions. J. Agric. Food Chem., 51, 1435–1439.
Hu, M., McClements, D. J. and Decker, E. A. (2003b). Lipid oxidation in corn oil-in-water
emulsions stabilized by casein, whey protein isolate, and soy protein isolate. J. Agric. Food
Chem., 51, 1696–1700.
Jadhav, S.J., Nimbalkar, Kulkarni, A.D. and Madhavi, D.L. (1996). Lipid oxidation in biological
and food systems. In: Madhavi, D.L., Desphande, S.S. and Salunkhe, D.K. (eds), Food
Antioxidants, Marcel Dekker Inc, New York pp 5-63.
Joyner, N.T. and McIntyre, J.E. (1938). The oven test as an index of keeping quality. Soap 15,
184-186.
Kim, S.K., Kim, Y.T., Byun, H.G., Nam, K.S., Joo, D.S. and Shahidi, F. (2001). Isolation and
characterization of antioxidative peptides from gelatin hydrolysate of Alaska Pollack Skin. J.
Agric. Food Chem., 49, 1984-1989.
Kong, B. and Xiong, Y. L. (2006). Antioxidant activity of zein hydrolysates in a liposome
system and the possible mode of action. J. Agric. Food Chem., 54, 6059-6068.
68
Korhonen, H. and Pihlanto, A. (2003). Food derived bioactive peptides opportunities for
designing future foods. Curr. Pharm. Design., 9, 1297-1308.
Kunio, S., Hiroyuki, U. and Hirotomo, O. (2000). Isolation and Characterization of free radical-
scavenging activities peptides derived from casein. J. Nutr. Biochem., 11, 128-131.
Labuza, T.P. (1971). Kinetics of Lipid Oxidation in foods. CRC Crit Rev Food Technol., 2, 355-
405.
Laemmli, U.K. (1970). Cleavage of structural proteins during the assembly of the head of
bacteriophage T4. Nature, 227(5259), 680-685.
Lasztity, R. (1996). Oat Proteins. The Chemistry of cereal proteins (pp. 275-292). Boca Raton,
Fla.: CRC Press.
Ledward, Dave.A., Galazka, Vanda.B. and Lagley, Keith.R (2006). High Pressure Effects on
Emulsifying Behaviour of Whey Protein Concentrate. J. Food. Sci., 60(6), 1341-1343.
Liu, J., Mu, W., Zhang, T., Jiang, B., and Li, Y. (2007). Antioxidant and free radical-scavenging
activities of chickpea protein hydrolysates. J. Food Chem., 106(2), 444-450.
Madhavi, D.L., Singhal, R.S. and Kulkarni, P.R. (1996). Technological aspects of food
antioxidants. In: Madhavi, D.L., Deshpande, S.S. and Salunkhe, D.K. (eds) Food Antioxidants,
Technological Toxicological and Health Prospects, Marcel Dekker Inc, New York pp 159-265.
Marco, C.J. (1968). A rapid method for evaluation of antioxidants. J Am Oil Chem Soc., 45, 594-
598.
69
Marklund, S. and Marklund, G. (1974). Involvement of the superoxide anion radical in the
autoxidation of pyrogallal and a convenient assay for superoxide dismutase. Eur. J. Biochem.,
47, 469-474.
McClements, D. J., And Decker, E. A. (2000). Lipid oxidation in oil-in-water emulsions: Impact
of molecular environment on chemical reactions in heterogeneous food systems. J. Food Sci., 65,
1270–1282.
Messens, W., Van Camp, J., & Huyghebaert, A. (1997). use of high pressure to modify the
functionality of food proteins. Trends in Food Science and Technology, 8, 107–112.
Mitsuta, H., Yasumoto, K. and Iwami, K. (1996). Antioxidative action of indole compounds
during the autoxidation of linoleic acid. Eiyo to Shohkuryo., 19, 210-214.
Moure, A., Dominguez, H. and Parajo, J.C. (2006). Antioxidant properties of ultrafiltration-
recovered soy protein fractions from industrial effluents and their hydrolysates. Process
Biochem., 41, 447-456.
Mukai, K., Kikuchi, S. and Urano, S. (1990). Stopped-flow kinetic study of regeneration reaction
of tocopheroxy radical by reduced ubiquinone-10 in solution. Biochem Biophys Acta., 1035, 77-
82.
Nielsen, N. S., Petersen, A., Meyer, A. S., Timm-Heinrich, M. and Jacobsen, C. (2004). Effects
of lactoferrin, phytic acid and EDTA on oxidation in two food emulsions enriched with long-
chain polyunsaturated fatty acids. J. Agric. Food Chem., 52, 7690–7699.
Osawa, T., and Namiki, M. (1985). Natural antioxidant isolated from eucalyptus leaf waxes. J.
Agric. Food Chem., 33, 777-780.
70
Ostdal, H., Andersen, H. J., and Davies, M. J. (1999). Formation of long-lived radicals on
proteins by radical transfer from heme enzymes–a common pro-cess? Arch. Biochem. Biophys.,
362, 105–112.
Panzenbock, U., and Stocker, R. (2005). Formation of methionine sulfoxide-containing specific
forms of oxidized high-density lipoproteins. Biochim. Biophys. Acta, 1703, 171–181.
Park, E.Y., Murakami, H., Mori, T. and Matsumura, Y. (2005). Effects of protein and peptide
addition on lipid oxidation in power model system. J. Agric. Food Chem., 53, 137-144.
Pazos, M., Andersen, M. L., and Skibsted, L. H. (2006). Amino acids and pro-tein scavenging of
radicals generated by iron/hydroperoxide system: An elec-tron spin resonance spin trapping
study. J. Agric. Food Chem., 54, 10215– 10221.
Pena-Ramos, E.A. and Xiong, X.L. (2003). Whey and Soy protein hydrolysates inhibit lipid
oxidation in cook pork patties. Meat Sci., 64, 259-263.
Pryor, W. A., and Squadrito, G. L. (1995). The chemistry of peroxynitrite: a product from the
reaction of nitric oxide with superoxide. Am. J. Physiol., 268, 699–722.
Pryor, W. A., Jin, X., and Squadrito, G. L. (1994). One- and two-electron oxida-tions of
methionine by peroxynitrite. Proc. Natl. Acad. Sci. USA, 91, 11173– 11177.
Rajalakshmi, D. and Narasimhan, S. (1996). Food antioxidants: Sources and methods of
evaluation. In: Madhavi, D.L., Deshpande, S.S. and Salunkhe, D.K. (eds). Food antioxidants:
Technological Toxicological and Health Perspectives. Marcel Dekker Inc, New York pp 65-157.
Rival, S. G., Fornaroli, S., Boeriu, C. G., and Wichers, H. J. (2001). Caseins and casein
hydrolysates. 1. Lipoxygenase inhibitory properties. J. Agric. Food Chem., 49, 287–294.
71
Roberto, L.S. (2008). Organic acids influence on DPPH° scavenging by ascorbic acid. Food
Chem., 107, 40-43.
Sakanaka, S. and Tachibana, Y. (2006). Active oxygen scavenging activity of egg-yolk protein
hydrolysates and their effects on lipid oxidation in beef and tuna homogenates. Food Chem., 95,
243-249.
Sakanaka, S., Tachibana, Y., Ishihara, N. and Juneja, L.R. (2005). Antioxidant properties of
casein calcium peptides and their effects on lipid oxidation in beef homogenates. J. Agric. Food
Chem., 53, 464-468.
Satue-Gracia, M. T., Frankel, E. N., Rangavajhyala, N. and German, J. B. (2000). Lactoferrin in
infant formulas: Effect on oxidation. J. Agric. Food Chem., 48, 4984–4990.
Schnitzer, E., Pinchuk, I., Bor, A., Fainaru, M. and Lichtenberg, D. (1997). The effect of
albumin on copper-induced LDL oxidation. Biochim. Biophys. Acta, 1344, 300–311.
Shahidi, F., Liyana-Pathirana, C.M. and Wall, D.S. (2006). Antioxidant activity of white and
black sesame seeds and their hull fractions. Food Chem., 99, 478-483.
Shantha, N.C., Crum, A.D. and Decker, E.A. (1995). Conjugated linoleic acid concentrations in
cooked beef containing antioxidants and hydrogen donors. J. Food Lipids., 2, 57-64.
Shimada, K., Fujikawa, K., Yahara, K. and Nakamura, T. (1992). Antioxidative properties of
Xanthan on the antioxidation of soybean oil in cyclodextrin emulsion. J. Agric. Food Chem., 40,
945-948.
Symons, M. C. R., and J. M. C. Gutteridge (1998). Free radicals and iron: Chemistry, biology,
and medicine. Oxford; New York, Oxford University Press.
72
Tauscher, B., Butz, P., and Garcia, A. (2006). Effects of High-pressure Processing on Carotenoid
Extractability, Antioxidant Activity, Glucose Diffusion, and Water Binding of Tomato Puree
(Lycopersicon esculentum Mill.). J. Food Sci., 66, 1033-1038.
Taylor, M.J. and Richardson, T. (1980). Antioxidant activity of skim milk-Effect of heat and
resultant sulfhdryl-groups. J. Dairy Sci., 63, 1783-1795.
Thakur, B.R., and Nelson, P.E. 1998. High-pressure processing and preservation of food. Food
Review International. 14: 427-447.
Tong, L.M., Sasaki, S., McClements, D.J. and Decker, E.A. (2000). Mechanisms of the
antioxidant activity of a high molecular weight fraction of whey. J. Agric. Food Chem., 48,
1473-1478.
Villiere, A., Viau, M., Bronnec, I., Moreau, N. and Genot, C. (2005). Oxidative stability of
bovine serum albumin- and sodium caseinate stabilized emulsions depends on metal availability.
J. Agric. Food Chem., 53, 1514–1520.
Wang, J. S., Zhao, M. M., Zhao, Q. Z. and Jiang, Y. M. (2007). Antioxidant properties of papain
hydrolysates of wheat gluten in different oxidation systems. Food Chem., 101, 1658-1663.
Wang, L.L. and Xiong, X.L. (2005). Inhibition of lipid oxidation in cook beef patties by
hydrolyzed potato protein is related to its reducing and radical scavenging ability. J. Agric. Food
Chem., 53, 9186-9192.
Weinberg, E. D. (1990). Cellular iron-metabolism in health and disease. Drug Met. Rev., 22,
531–579.
73
Wu, H.C., Chen, H.M. and Shiau, C.Y. (2011). Free amino acids and peptides as related to
antioxidant properties in protein hydrolysates of mackerel (Scomber austriasicus). Food
Research International., 36, 949-957.
Zhang J., Zhang H., Wang L., Guo X., Wang X. and Yao H. (2009). Antioxidant activities of the
rice endosperm protein hydrolysate: identification of the active peptide. Eur. Food Res Technol.,
229, 709-719.
Zhu K., Zhou H. and Qian H. (2006). Antioxidant and free radical-scavenging activities of wheat
germ protein hydrolysates prepared with alcalase. J. Process Biochem., 41, 1296-1302.
Zielinski, H. and Kozlowska, H. 2000. Antioxidant activity and total phenolics in selected cereal
grains and their different morphological fractions. J Agric Food Chem., 48, 2008-2016.