Embed Size (px)
Citation preview
6 Measuring performance and evaluating antimicrobial stewardship programs
Antimicrobial Stewardship in Australian Health Care2018
This chapter is part of Antimicrobial Stewardship in Australian Health Care 2018, Australian Commiand Quality in Health Care, 2018.
The publication summarises current evidence about AMS strategies and interventions, and their iChapters 1–7 provide strategies for implementing and sustaining AMS, and Chapters 8–12 examidifferent clinicians in AMS.
The publication will continue to evolve with additional chapters over time that address AMS in spsuch as primary care.
As new resources become available, they will be added as hyperlinks to the resources section in eathe appendices.
ssion on Safety
mplementation. ne the roles of the
ecific settings,
ch chapter or to
Chapter contents
Acronyms and abbreviations 150
6.1 Introduction 151
6.2 Key elements of antimicrobial stewardship measurement 152
6.2.1 What should be measured? 152
6.2.2 Measurement approaches 152
6.3 Structure measures 152
6.3.1 Hospitals 152
6.3.2 Community 154
6.4 Process measures 154
6.5 Outcome measures 155
6.5.1 Improved patient outcomes 156
6.5.2 Improved patient safety 156
6.5.3 Reduced resistance 156
6.5.4 Reduced costs 157
6.5.5 Qualitative and other related measures of program activity 157
6.6 Balancing measures 157
6.7 Surveillance of antimicrobial use 158
6.7.1 Measuring the volume of antimicrobial use in hospitals 158
6.7.2 Measuring the volume of antimicrobial use in the community 160
6.7.3 Reporting and monitoring use data at the local level 161
6.8 Auditing the quality of antimicrobial prescribing 164
6.8.1 Auditing prescribing in hospitals 164
6.8.2 Auditing prescribing in the community 166
6.8.3 Quality improvement audits 167
6.9 Reporting, feedback and use of data 168
6.9.1 Health service organisation reports 168
6.9.2 State and territory reports 168
6.9.3 National reports 168
6.9.4 Use of data for benchmarking 169
Resources 171
References 172
150 Chapter 6: Measuring performance and evaluating antimicrobial stewardship programs
Acronyms and abbreviations
Abbreviation Definition
acNAPS Aged Care National Antimicrobial Prescribing Survey
AMR antimicrobial resistance
AMS antimicrobial stewardship
AURA Antimicrobial Use and Resistance in Australia
DDD defined daily dose
DOT days of therapy
LOT length of therapy
NAPS National Antimicrobial Prescribing Survey
NAUSP National Antimicrobial Utilisation Surveillance Program
NSQHS National Safety and Quality Health Service
OBD occupied bed day
PBS Pharmaceutical Benefits Scheme
QI quality improvement
RPBS Repatriation Pharmaceutical Benefits Scheme
SNAPS Surgical National Antimicrobial Prescribing Survey
Chapter 6: Measuring performance and evaluating antimicrobial stewardship programs 151
Key points
• Antimicrobial stewardship (AMS) measurement and assessment systems should be part of existing monitoring systems and linked to the measurement of performance in the health service organisation.
• Measuring the effectiveness of AMS program activities in health service organisations is a requirement for meeting the National Safety and Quality Health Service Preventing and Controlling Healthcare-Associated Infection Standard.
• AMS measurement should be embedded into the AMS program and should include structure, process, outcome and balancing measures that are sustainable and appropriate to the healthcare setting.
– Structure measures assess whether the essential elements of an AMS program are established and maintained.
– Process measures determine whether policies and processes are being followed correctly; they can be used to evaluate initiatives to improve the quality of prescribing.
– Outcome measures aim to assess the effect of AMS in terms of whether patient outcomes have improved, adverse events have decreased, and infections caused by resistant pathogens have decreased.
– Balancing measures relate to whether changes might cause new problems.
• Ongoing surveillance of antimicrobial use is essential to measure the effect of stewardship interventions.
• Regular, small quality improvement audits can help to drive changes in prescribing.
• The measurement and evaluation of AMS initiatives is facilitated by the use of standardised formats for collecting and reporting data, and information technology systems to collect, analyse and report data.
• Timely feedback and reporting to clinicians and health service managers is a key component of effective AMS.
6.1 Introduction
Tracking and reporting antimicrobial use and outcomes are recognised as key components of antimicrobial stewardship (AMS) programs.1-4
Measurement is considered to be critical to identify opportunities for improvement and assess the effect of improvement efforts.5
Measurement for improvement is not focused on judging whether data meet a compliance threshold or target, but as a means to determine whether the changes made to improve practice are effective and to what degree.6
Measurement includes:• Collecting and monitoring of data for quality
indicators, encompassing structure, process, outcome and balancing measures
• Surveillance of antimicrobial use • Auditing of the quality of prescribing.
This information should be used to provide feedback to prescribers to influence prescribing behaviour; inform those accountable for the AMS program of the effect of AMS initiatives on patient outcomes, antimicrobial use and resistance patterns; and assist in better targeting initiatives to improve prescribing.
A range of tools and resources are available in Australia to measure antimicrobial use, and to audit the appropriateness and quality of use in hospital and community settings. It is important that the routine measurement of antimicrobial use, regular assessments of quality and appropriateness of use, and reporting of process and outcome measures are built into the design, development and implementation of AMS programs. Effective measurement and assessment systems are an integral part of existing monitoring systems and linked to the measurement of performance in health systems overall.
152 Chapter 6: Measuring performance and evaluating antimicrobial stewardship programs
Issues that are especially relevant for certain settings – rural and remote hospitals, private hospitals and aged care – are tagged as R, P and AC, respectively, throughout the text.
6.2 Key elements of antimicrobial stewardship measurement
Determining what to measure and how to measure it is a key step in developing a suitable performance measurement plan.
6.2.1 What should be measured?
Data collection for key measures, or indicators, of the performance of the AMS program should be planned as an integral component of the AMS program from the outset. In the acute care setting, the measures can be built into general reporting in the health service organisation’s performance framework, against the AMS criterion in the National Safety and Quality Health Service (NSQHS) Preventing and Controlling Healthcare-Associated Infection Standard. A range of measures is recommended, including1,6:• Structure measures• Process measures• Outcome measures• Balancing measures.
Examples of these measures are summarised in Table 6.1 and discussed in this chapter. The measures should be selected according to the specific context of the AMS program.
Collecting qualitative data is also important for evaluating program performance (see Qualitative and other related measures of program activity).
6.2.2 Measurement approaches
The AMS team may be able to use existing measurement systems, or it may have to develop operational definitions for AMS measures. Similarly, data collection and feedback processes
may already exist or may need to be developed. Many existing resources can be used to design and use measurement for clinical practice improvement, including the New South Wales (NSW) Health publication Easy Guide to Clinical Practice Improvement7 and online resources from the Institute for Healthcare Improvement.
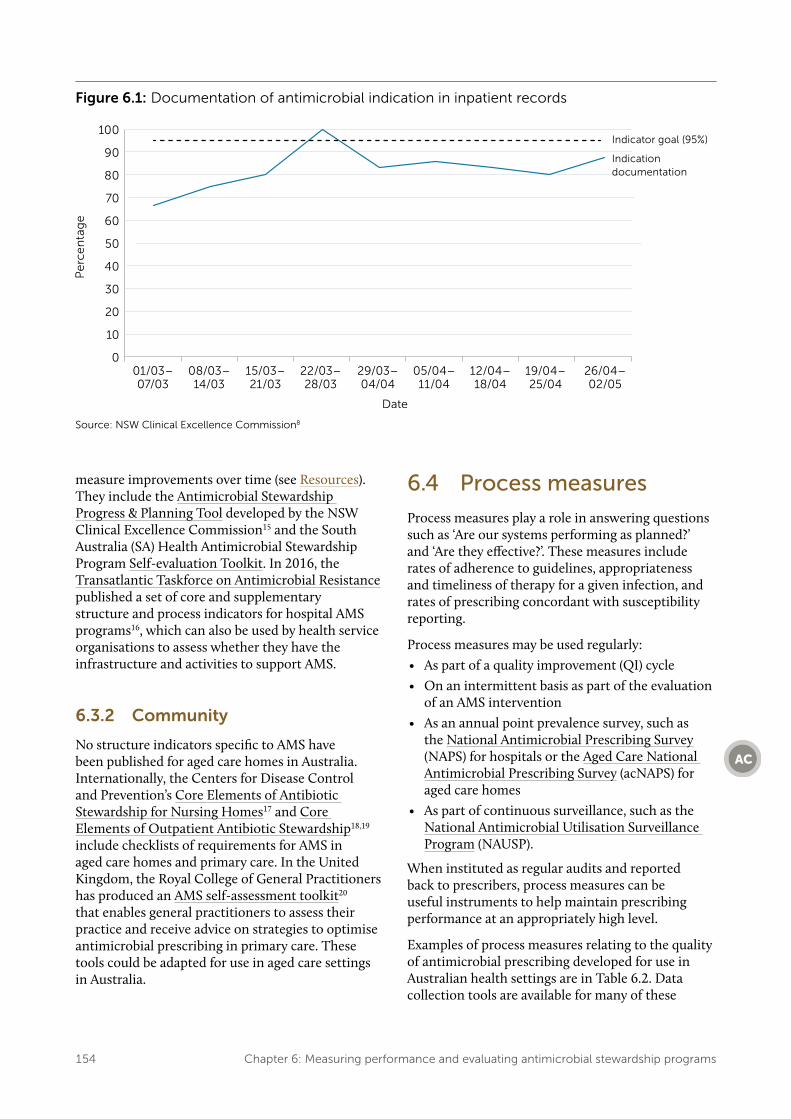
Measurement to support process improvement (in this case, antimicrobial prescribing practice) differs from measurement to evaluate performance or measurement for research purposes. Improvement measures aim to bring new knowledge into daily practice. Therefore, frequent, small samples during the process of testing and implementation will be more useful than infrequent, large surveys. These will allow the team to see whether changes are resulting in improvement. For example, Figure 6.1 shows the results of weekly audits of five hospitals’ inpatient records for documentation of the indication for the antimicrobials prescribed.
Any measurement also needs to be sustainable (Box 6.1) to ensure that assessments can be conducted and compared across time. When indicators are used for public reporting, their validity, reliability, impact and costs should be assessed within 1–2 years of implementing quality measurements and reporting programs.9
6.3 Structure measures
Structure measures for AMS programs ask ‘Are the right elements in place?’ and ‘Are the resources, lines of reporting and policies available?’
6.3.1 Hospitals
The NSQHS Standards require hospitals to provide evidence of developing, implementing and regularly reviewing the effectiveness of their AMS systems. However, the NSQHS Standards do not prescribe how this is to be done.11
Structure measures for AMS can support health service organisations to determine whether the appropriate governance, workforce and processes, such as formularies and guidelines, are in place.12,13 These measures have been used to measure progress in AMS development in Scotland6,14 and the United States.2
A number of resources are available to help organisations assess the elements of their AMS program, identify areas for improvement and
Chapter 6: Measuring performance and evaluating antimicrobial stewardship programs 153
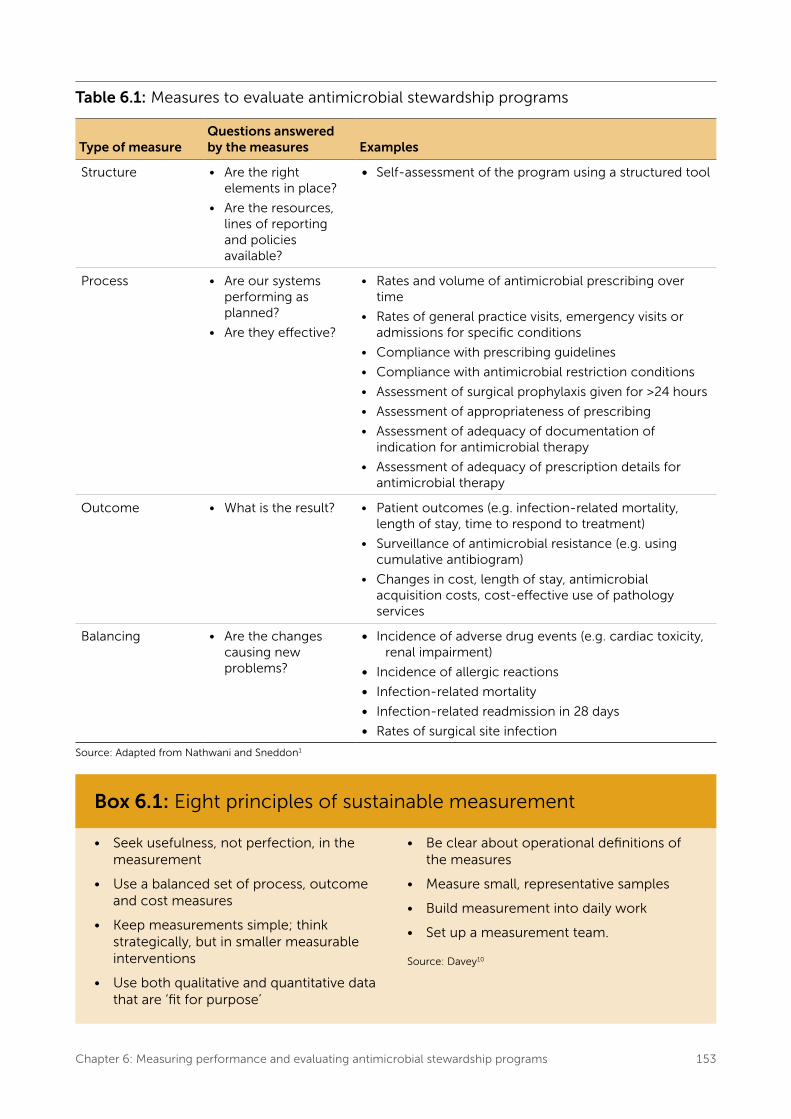
Table 6.1: Measures to evaluate antimicrobial stewardship programs
Type of measureQuestions answered by the measures Examples
Structure • Are the right elements in place?
• Are the resources, lines of reporting and policies available?
• Self-assessment of the program using a structured tool
Process • Are our systems performing as planned?
• Are they effective?
• Rates and volume of antimicrobial prescribing over time
• Rates of general practice visits, emergency visits or admissions for specific conditions
• Compliance with prescribing guidelines
• Compliance with antimicrobial restriction conditions
• Assessment of surgical prophylaxis given for >24 hours
• Assessment of appropriateness of prescribing
• Assessment of adequacy of documentation of indication for antimicrobial therapy
• Assessment of adequacy of prescription details for antimicrobial therapy
Outcome • What is the result? • Patient outcomes (e.g. infection-related mortality, length of stay, time to respond to treatment)
• Surveillance of antimicrobial resistance (e.g. using cumulative antibiogram)
• Changes in cost, length of stay, antimicrobial acquisition costs, cost-effective use of pathology services
Balancing • Are the changes causing new problems?
• Incidence of adverse drug events (e.g. cardiac toxicity, renal impairment)
• Incidence of allergic reactions
• Infection-related mortality
• Infection-related readmission in 28 days
• Rates of surgical site infection
Source: Adapted from Nathwani and Sneddon1
Box 6.1: Eight principles of sustainable measurement
• Seek usefulness, not perfection, in the measurement
• Use a balanced set of process, outcome and cost measures
• Keep measurements simple; think strategically, but in smaller measurable interventions
• Use both qualitative and quantitative data that are ‘fit for purpose’
• Be clear about operational definitions of the measures
• Measure small, representative samples
• Build measurement into daily work
• Set up a measurement team.
Source: Davey10
154 Chapter 6: Measuring performance and evaluating antimicrobial stewardship programs
Figure 6.1: Documentation of antimicrobial indication in inpatient records
Source: NSW Clinical Excellence Commission8
measure improvements over time (see Resources). They include the Antimicrobial Stewardship Progress & Planning Tool developed by the NSW Clinical Excellence Commission15 and the South Australia (SA) Health Antimicrobial Stewardship Program Self-evaluation Toolkit. In 2016, the Transatlantic Taskforce on Antimicrobial Resistance published a set of core and supplementary structure and process indicators for hospital AMS programs16, which can also be used by health service organisations to assess whether they have the infrastructure and activities to support AMS.
6.3.2 Community
No structure indicators specific to AMS have been published for aged care homes in Australia. Internationally, the Centers for Disease Control and Prevention’s Core Elements of Antibiotic Stewardship for Nursing Homes17 and Core Elements of Outpatient Antibiotic Stewardship18,19 include checklists of requirements for AMS in aged care homes and primary care. In the United Kingdom, the Royal College of General Practitioners has produced an AMS self-assessment toolkit20 that enables general practitioners to assess their practice and receive advice on strategies to optimise antimicrobial prescribing in primary care. These tools could be adapted for use in aged care settings in Australia.
6.4 Process measures
Process measures play a role in answering questions such as ‘Are our systems performing as planned?’ and ‘Are they effective?’. These measures include rates of adherence to guidelines, appropriateness and timeliness of therapy for a given infection, and rates of prescribing concordant with susceptibility reporting.
Process measures may be used regularly:• As part of a quality improvement (QI) cycle• On an intermittent basis as part of the evaluation
of an AMS intervention• As an annual point prevalence survey, such as
the National Antimicrobial Prescribing Survey (NAPS) for hospitals or the Aged Care National Antimicrobial Prescribing Survey (acNAPS) for aged care homes
• As part of continuous surveillance, such as the National Antimicrobial Utilisation Surveillance Program (NAUSP).
When instituted as regular audits and reported back to prescribers, process measures can be useful instruments to help maintain prescribing performance at an appropriately high level.
Examples of process measures relating to the quality of antimicrobial prescribing developed for use in Australian health settings are in Table 6.2. Data collection tools are available for many of these
Chapter 6: Measuring performance and evaluating antimicrobial stewardship programs 155
Table 6.2: Examples of process measures relating to quality of antimicrobial use developed for Australian healthcare settings
Setting Source Description of specific process measure
Hospital National Quality Use of Medicines Indicators for Australian hospitals25
• Percentage of patients undergoing specified surgical procedures who receive an appropriate prophylactic antimicrobial regimen
• Percentage of prescriptions for restricted antimicrobials that are concordant with drug and therapeutics committee–approved criteria
• Percentage of patients in whom doses of empirical aminoglycoside therapy are continued beyond 48 hours
• Percentage of adult patients with community-acquired pneumonia who are assessed using an appropriate validated objective measurement of pneumonia severity
• Percentage of patients presenting with community-acquired pneumonia who are prescribed guideline-concordant antimicrobial therapy
National Antimicrobial Prescribing Survey26
• Indication documented in medical notes (best practice >95%)
• Surgical prophylaxis given for >24 hours (best practice <5%)
• Compliance with guidelines
• Appropriateness
All healthcare settings
Antimicrobial Stewardship Clinical Care Standard27,28
• Median time to first dose of antibiotics for patients with suspected bacterial meningitis, or for actual or suspected severe sepsis
• Antibiotic prescribing in accordance with current and peer-reviewed clinical guidelines
• Antibiotic allergy mismatch in prescribing
• Documentation of reason for prescribing antibiotics
• Review of patients prescribed broad-spectrum antibiotics
• Surgical antimicrobial prophylaxis in accordance with guidelines
• Timely administration of prophylactic antibiotics before surgery
• Cessation of prophylactic antibiotics after surgery
process measures (see Resources). Internationally, quality indicators for antimicrobial use in primary care and disease-specific indicators to assess the quality of antimicrobial prescribing have been developed by the European Surveillance of Antimicrobial Consumption Network.21 The latter indicators have been adapted and used to determine acceptable rates of prescribing in general practices participating in the NPS MedicineWise MedicineInsight program.22,23
The development of process measures should involve multidisciplinary teams to ensure ownership by relevant clinical groups.24 Reporting and feedback on process measures should be in a format that can be readily interpreted and used by clinicians for QI.10 Results should be presented dynamically in the form of control charts (with control limits) to allow
clinicians and the AMS team to see whether the process is responsive and to identify improvement over time.25
6.5 Outcome measures
Outcome measures ask ‘What is the result?’
Although reduction in antimicrobial use is usually the most easily measured outcome, by itself it may not indicate improvements in patient outcomes – a range of safety and quality outcome measures also need to be monitored. It is also important to measure economic outcomes, to ensure continued support for AMS initiatives from the organisation’s executive.29,30 McGowan proposes using the four
156 Chapter 6: Measuring performance and evaluating antimicrobial stewardship programs
main goals of AMS as a basis for categorising outcomes for AMS programs29:• Improved patient outcomes• Improved patient safety• Reduced antimicrobial resistance (AMR)• Reduced costs.
Table 6.1 provides examples of outcome measures.
6.5.1 Improved patient outcomes
Improvements in patient care are implicit in the goals of an AMS program. Indicators of clinical success associated with AMS programs include reduced infection-related mortality, length of stay and time to respond to treatment. Until recently, little has been reported in the literature to indicate that the introduction of AMS programs has led to improvements in these parameters. However, three recent systematic reviews and meta-analyses of hospital-based AMS programs have demonstrated that AMS activities can reduce mortality and length of stay.31-33 Programs that have shown improvement in clinical outcomes are those that aim to optimise treatment, not just reduce antimicrobial use.33
Given that there are a number of factors that can contribute to patient outcomes, it is not possible to ascribe changes in these parameters solely to AMS programs. However, process measures that can reliably be related to improvements in outcomes may be more readily measured by health service organisations and may be used as surrogates for outcome measures.
6.5.2 Improved patient safety
Improvements in safety can be measured by surveillance of adverse events associated with antimicrobial use. For example, a reduction in Clostridium difficile infection has been a notable outcome of some AMS programs in hospitals because this infection is directly related to overall antimicrobial use and the use of certain broad-spectrum agents (such as third-generation cephalosporins, amoxicillin–clavulanate, clindamycin and fluoroquinolones).34 C. difficile infection rates can also be reduced by implementing stricter infection control strategies; a number of studies have demonstrated that a combination of improving infection control precautions and reducing overall antimicrobial use can reduce the incidence of nosocomial C. difficile infections.35,36 Qualitative analysis of individual cases of
C. difficile can be used for feedback to clinicians on antimicrobial prescribing that may have contributed to the development of these infections.
Other indicators of improved patient safety are lower mortality associated with appropriate administration of empirical antimicrobial therapy and fewer antimicrobial adverse events.29,32 An example of the latter may be fewer cases of vancomycin-induced nephrotoxicity if appropriate dosing and therapeutic drug monitoring are used within an AMS program. Similarly, fewer episodes of hypersensitivity reactions to penicillin given to patients with documented penicillin allergies may be expected if the workforce is appropriately educated to recognise those antimicrobials that are classified as penicillins.
6.5.3 Reduced resistance
AMS programs aim to improve antimicrobial prescribing and address the increase in AMR in health care and the community. Improvements in resistance rates have been difficult to measure and ascribe directly to an AMS program because the causes of resistance are complex and often outside the control of hospital or community programs. However, there is increasing evidence indicating that AMS activities can contribute to a decrease in AMR.30-33,37
The NSQHS Preventing and Controlling Healthcare-Associated Infection Standard requires health service organisations to monitor AMR as an outcome of the AMS program. Monitoring changes through an annual cumulative antibiogram is a useful mechanism for this (see Section 9.6.2 in Chapter 9: ‘Role of the clinical microbiology service in antimicrobial stewardship’). Participation in the national passive Antimicrobial Use and Resistance in Australia (AURA) Surveillance System offers the opportunity for ready access to data reports and antibiograms. As antibiograms can be difficult to interpret, the involvement of clinical microbiologists and infectious diseases physicians in the analysis and use of these data is recommended.
At the national level, the AURA Surveillance System has been established to provide a comprehensive and integrated picture of patterns and trends in AMR, and to improve the understanding of AMR across Australia. AURA 2016 and AURA 2017 have reported on antimicrobial use and AMR in human health in Australia, and provided clinicians and health service organisations with detailed national information on AMR rates and antimicrobial use to
Chapter 6: Measuring performance and evaluating antimicrobial stewardship programs 157
guide improvements in infection control, AMS and antimicrobial prescribing practices.22,23
6.5.4 Reduced costs
Economic outcomes are also important to measure. A baseline measurement at the outset of a new program will allow changes to be monitored over time. If reduced system costs can be demonstrated following the introduction of an AMS program, managers are able to see the tangible benefits of investment and may be prepared to resource further improvements. Comparability of data on the costs of antimicrobials will be affected by factors such as changes in procurement contracts, formulary changes and variations in ordering patterns. These factors need to be considered when determining antimicrobial expenditure. Despite this limitation, this information can be helpful to identify where dollars are being spent38 and to track any savings from AMS activities.
The simplest measure is a reduction in medicine acquisition costs as a result of reduced antimicrobial use or a switch from an expensive agent to a cheaper one. This may be a useful argument in favour of an AMS program with regard to the use of expensive agents such as antifungal therapies, but is often a difficult argument to mount for common antimicrobials because they are generally relatively inexpensive.
Demonstrating the cost-effectiveness of an AMS program may be challenging. Savings may be demonstrated through measures such as early intravenous-to-oral switching, reduced length of stay and reduced adverse events. Those savings can sometimes be extrapolated to the costs of related downstream events, such as reduced resistance among local bacterial pathogens, better cure rates for patients with infections, and fewer infections as a result of more appropriate prophylactic antimicrobial use. Measuring cost-effectiveness requires health economic analyses, and reports in the literature are mixed in terms of finding consistent cost savings from AMS program implementation.39-41
6.5.5 Qualitative and other related measures of program activity
A qualitative evaluation of the AMS program can be used to inform the AMS team about how well the program is operating and to identify further areas for improvement. User acceptance can be measured directly through surveys or questionnaires for clinicians; questions might cover awareness of the program, effectiveness of the interface with the AMS team and the degree to which the AMS team’s advice was considered useful. Surveys and questionnaires can also provide opportunities for the AMS team to get feedback that can be used to improve the program. This feedback can also be helpful to assess the perceptions and attitudes of prescribers to AMR in order to assess changes in local culture that may have been influenced by the AMS program.42,43
In conjunction with this feedback, activity of the AMS program can also be reviewed by assessing the number of guidelines written or reviewed, the number of education sessions delivered, the number of patients reviewed by the AMS team, the rate of acceptance of advice within 24 hours, and the number of audits conducted under the AMS program each year.
6.6 Balancing measures
As well as measuring improvements in patient safety, AMS teams should be alert to potential unintended consequences of AMS interventions. Balancing measures provide insight into the question of whether changes might cause new problems. For example, an implicit goal of AMS programs is an overall reduction in the volume of prescribed antimicrobials, because overprescribing is the most common form of inappropriate use. However, there may be some concern that this may result in under-treatment of infection and poorer clinical outcomes.
Changes in prescribing guidelines can have unexpected outcomes. For example, Bell et al. described an increase in the rate of acute kidney injury following a change in prophylactic guidelines from cephalosporins to gentamicin in orthopaedic surgery.44 Additionally, changes in prescribing as a result of an AMS intervention may create new selective pressures on microbial flora, causing potential new clinical problems, such as the emergence of new multidrug-resistant strains or the re-emergence of infections that were previously
158 Chapter 6: Measuring performance and evaluating antimicrobial stewardship programs
uncommon.6 When one antimicrobial is restricted and replaced with another, the reduction in resistance to the first class of antimicrobial may be ‘balanced out’ by increasing resistance to the second class (known as the ‘squeezing the balloon’ effect).45,46
Therefore, it is important to ensure that AMS interventions do not cause unintended consequences such as increased mortality and morbidity – for example, higher complication rates, adverse drug events and higher rates of infection-related readmission. This can be monitored by collecting data on balancing measures such as those listed in Table 6.1.6
6.7 Surveillance of antimicrobial use
Research indicates that antimicrobial overuse (that is, antimicrobials being prescribed when not indicated or being used for longer durations than required) is common when AMS programs are absent. Reductions in the volume of prescribing may be the most immediate effect of an AMS program.35 Conversely, there are situations in which an increase in the use of specific antimicrobials may indicate an improvement in the appropriateness of prescribing and may be linked to improved patient outcomes. An example of this is fewer surgical site infections associated with appropriate prescribing of surgical prophylaxis.
Ongoing monitoring of antimicrobial use across a facility, practice, Local Hospital Network or Local Health District will provide the AMS team with data to identify issues and effect changes in prescribing. Surveillance needs to be carried out consistently, using standard definitions and data-gathering methods, and ideally analysed in a statistically valid manner to ensure integrity of the results and their interpretation. Any significant change should be investigated to ensure that it is not a result of inappropriate prescribing. Participation in NAUSP provides hospitals with information on antimicrobials prescribed and changes in use over time.
6.7.1 Measuring the volume of antimicrobial use in hospitals
To standardise the quantification of antimicrobial use and allow comparisons over time within and between units and hospitals, it is recommended that medicine-use data are expressed as a standard unit
of measure. In Australia, defined daily doses per 1,000 occupied bed days (DDD/1,000 OBDs) is used. The DDD represents the average daily maintenance dose of an antimicrobial for its main indication in adults.47 DDD/1,000 OBDs is the measure used by NAUSP48, which is part of the AURA Surveillance System. By participating in NAUSP, public and private hospitals contribute data on inpatient use of antimicrobials and receive valuable analyses of these data in response. NAUSP provides comparative data by hospital peer group and enables business reports for local use.
The DDD/1,000 OBDs measure does not account for patient variability, actual dose administered or individual patient exposure. And, because DDDs are based on adult dosing, these measures are not suitable for determining antimicrobial use in paediatric units. Other limitations to DDDs are that they do not take into account the casemix or infection rates for OBDs in hospitals, and World Health Organization–defined DDDs often differ from doses used in Australian clinical practice.
Hospitals choosing to calculate their total or ward-level antimicrobial consumption figures can use the AMC Tool: the antimicrobial consumption tool, which converts numbers of packages or vials into numbers of DDDs.
National Antimicrobial Utilisation Surveillance Program
Participation in NAUSP is voluntary. In 2015, 159 acute care hospitals participated (138 public and 21 private hospitals), representing 100% of Principal Referral Hospitals, 86% of Public Acute Group A and B Hospitals and 8% of Public Acute Group C Hospitals.48 In Private Acute Hospitals, 28% of Group A and B Hospitals, and 10% of Group C Hospitals contributed data.
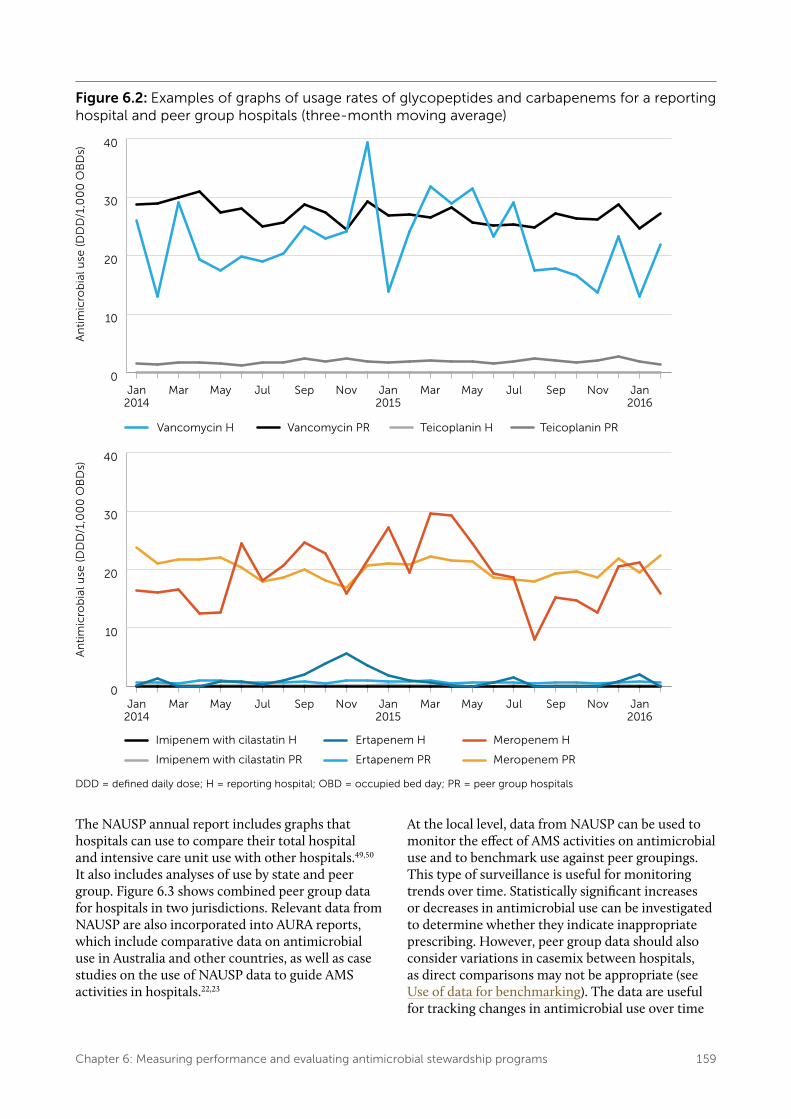
NAUSP reports on the volume of antimicrobial use in hospitals as DDD/1,000 OBDs in the form of time-series graphs, including usage rates for specific antimicrobial classes (using the World Health Organization Anatomical Therapeutic Chemical classification system).48 Contributing hospitals receive bimonthly reports of their antimicrobial use and comparisons with the average use in hospitals in the same peer group (Figure 6.2). For some contributors, usage rates are also reported for intensive care units. Individual contributors are able to generate their own reports at any time. Specialty unit reporting capacity commenced in 2016 for haematology/oncology and respiratory units.
Chapter 6: Measuring performance and evaluating antimicrobial stewardship programs 159
Figure 6.2: Examples of graphs of usage rates of glycopeptides and carbapenems for a reporting hospital and peer group hospitals (three-month moving average)
0
10
20
30
40
Jan2016
NovSepJulMayMarJan2015
NovSepJulMayMarJan2014
0
10
20
30
40
Jan2016
NovSepJulMayMarJan2015
NovSepJulMayMarJan2014
DDD = defined daily dose; H = reporting hospital; OBD = occupied bed day; PR = peer group hospitals
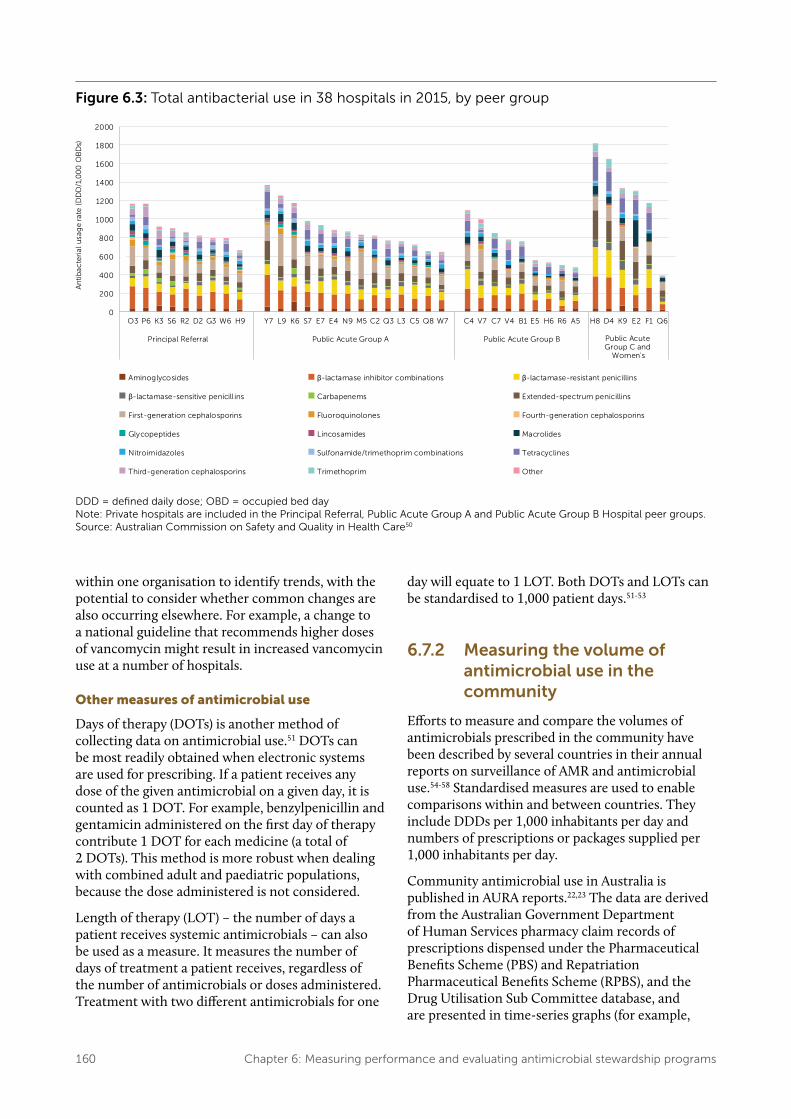
The NAUSP annual report includes graphs that hospitals can use to compare their total hospital and intensive care unit use with other hospitals.49,50 It also includes analyses of use by state and peer group. Figure 6.3 shows combined peer group data for hospitals in two jurisdictions. Relevant data from NAUSP are also incorporated into AURA reports, which include comparative data on antimicrobial use in Australia and other countries, as well as case studies on the use of NAUSP data to guide AMS activities in hospitals.22,23
At the local level, data from NAUSP can be used to monitor the effect of AMS activities on antimicrobial use and to benchmark use against peer groupings. This type of surveillance is useful for monitoring trends over time. Statistically significant increases or decreases in antimicrobial use can be investigated to determine whether they indicate inappropriate prescribing. However, peer group data should also consider variations in casemix between hospitals, as direct comparisons may not be appropriate (see Use of data for benchmarking). The data are useful for tracking changes in antimicrobial use over time
160 Chapter 6: Measuring performance and evaluating antimicrobial stewardship programs
Figure 6.3: Total antibacterial use in 38 hospitals in 2015, by peer group
DDD = defined daily dose; OBD = occupied bed day Note: Private hospitals are included in the Principal Referral, Public Acute Group A and Public Acute Group B Hospital peer groups. Source: Australian Commission on Safety and Quality in Health Care50
within one organisation to identify trends, with the potential to consider whether common changes are also occurring elsewhere. For example, a change to a national guideline that recommends higher doses of vancomycin might result in increased vancomycin use at a number of hospitals.
Other measures of antimicrobial use
Days of therapy (DOTs) is another method of collecting data on antimicrobial use.51 DOTs can be most readily obtained when electronic systems are used for prescribing. If a patient receives any dose of the given antimicrobial on a given day, it is counted as 1 DOT. For example, benzylpenicillin and gentamicin administered on the first day of therapy contribute 1 DOT for each medicine (a total of 2 DOTs). This method is more robust when dealing with combined adult and paediatric populations, because the dose administered is not considered.
Length of therapy (LOT) – the number of days a patient receives systemic antimicrobials – can also be used as a measure. It measures the number of days of treatment a patient receives, regardless of the number of antimicrobials or doses administered. Treatment with two different antimicrobials for one
day will equate to 1 LOT. Both DOTs and LOTs can be standardised to 1,000 patient days.51-53
6.7.2 Measuring the volume of antimicrobial use in the community
Efforts to measure and compare the volumes of antimicrobials prescribed in the community have been described by several countries in their annual reports on surveillance of AMR and antimicrobial use.54-58 Standardised measures are used to enable comparisons within and between countries. They include DDDs per 1,000 inhabitants per day and numbers of prescriptions or packages supplied per 1,000 inhabitants per day.
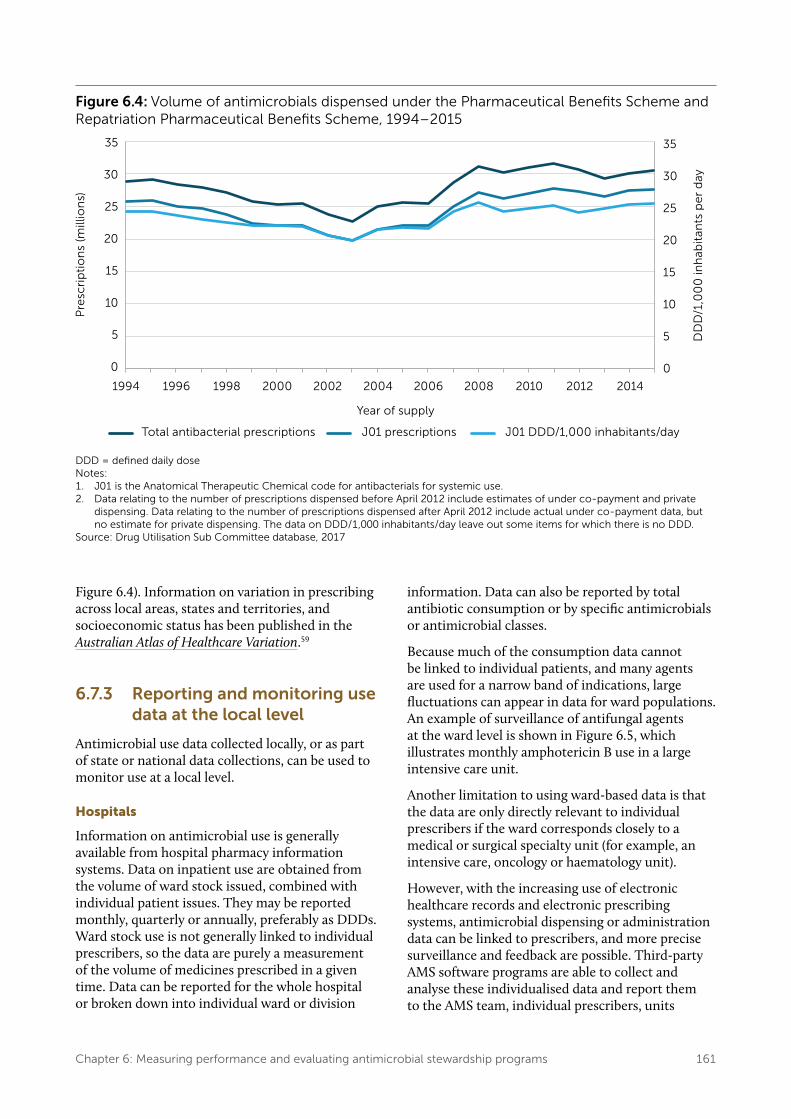
Community antimicrobial use in Australia is published in AURA reports.22,23 The data are derived from the Australian Government Department of Human Services pharmacy claim records of prescriptions dispensed under the Pharmaceutical Benefits Scheme (PBS) and Repatriation Pharmaceutical Benefits Scheme (RPBS), and the Drug Utilisation Sub Committee database, and are presented in time-series graphs (for example,
Chapter 6: Measuring performance and evaluating antimicrobial stewardship programs 161
Figure 6.4: Volume of antimicrobials dispensed under the Pharmaceutical Benefits Scheme and Repatriation Pharmaceutical Benefits Scheme, 1994–2015
DDD = defined daily doseNotes: 1. J01 is the Anatomical Therapeutic Chemical code for antibacterials for systemic use.2. Data relating to the number of prescriptions dispensed before April 2012 include estimates of under co-payment and private
dispensing. Data relating to the number of prescriptions dispensed after April 2012 include actual under co-payment data, but no estimate for private dispensing. The data on DDD/1,000 inhabitants/day leave out some items for which there is no DDD.
Source: Drug Utilisation Sub Committee database, 2017
Figure 6.4). Information on variation in prescribing across local areas, states and territories, and socioeconomic status has been published in the Australian Atlas of Healthcare Variation.59
6.7.3 Reporting and monitoring use data at the local level
Antimicrobial use data collected locally, or as part of state or national data collections, can be used to monitor use at a local level.
Hospitals
Information on antimicrobial use is generally available from hospital pharmacy information systems. Data on inpatient use are obtained from the volume of ward stock issued, combined with individual patient issues. They may be reported monthly, quarterly or annually, preferably as DDDs. Ward stock use is not generally linked to individual prescribers, so the data are purely a measurement of the volume of medicines prescribed in a given time. Data can be reported for the whole hospital or broken down into individual ward or division
information. Data can also be reported by total antibiotic consumption or by specific antimicrobials or antimicrobial classes.
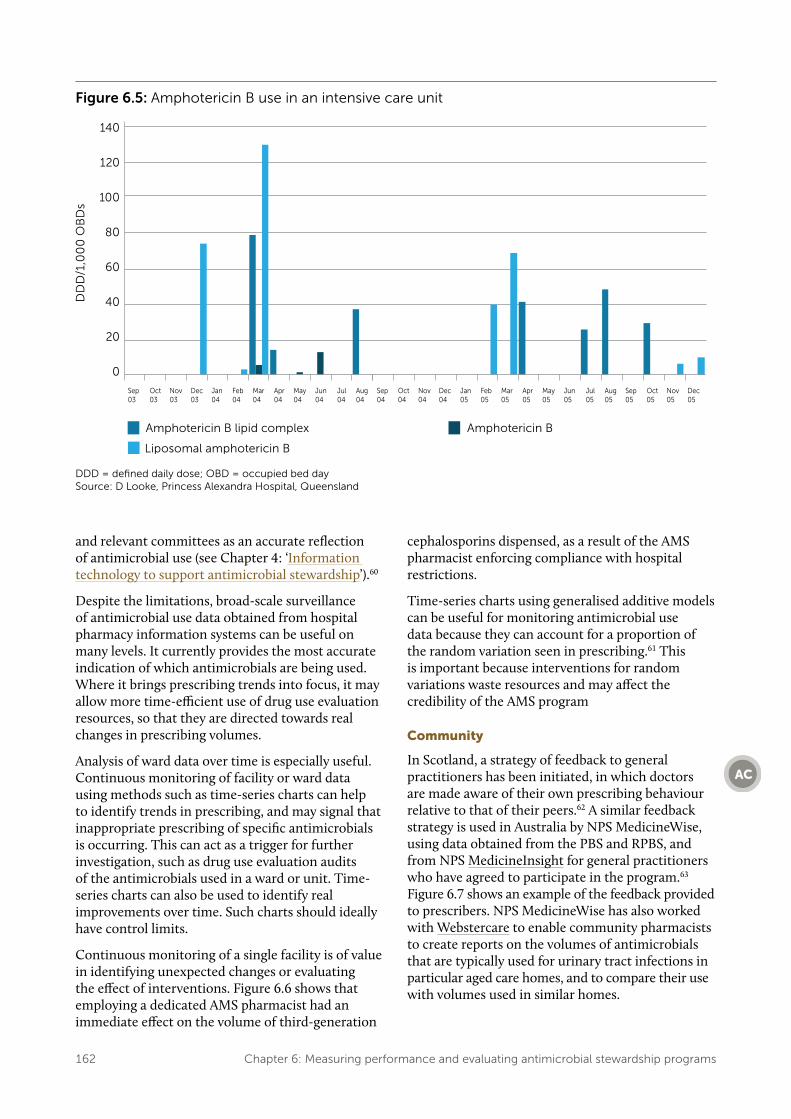
Because much of the consumption data cannot be linked to individual patients, and many agents are used for a narrow band of indications, large fluctuations can appear in data for ward populations. An example of surveillance of antifungal agents at the ward level is shown in Figure 6.5, which illustrates monthly amphotericin B use in a large intensive care unit.
Another limitation to using ward-based data is that the data are only directly relevant to individual prescribers if the ward corresponds closely to a medical or surgical specialty unit (for example, an intensive care, oncology or haematology unit).
However, with the increasing use of electronic healthcare records and electronic prescribing systems, antimicrobial dispensing or administration data can be linked to prescribers, and more precise surveillance and feedback are possible. Third-party AMS software programs are able to collect and analyse these individualised data and report them to the AMS team, individual prescribers, units
162 Chapter 6: Measuring performance and evaluating antimicrobial stewardship programs
Figure 6.5: Amphotericin B use in an intensive care unit
DDD = defined daily dose; OBD = occupied bed day Source: D Looke, Princess Alexandra Hospital, Queensland
and relevant committees as an accurate reflection of antimicrobial use (see Chapter 4: ‘Information technology to support antimicrobial stewardship’).60
Despite the limitations, broad-scale surveillance of antimicrobial use data obtained from hospital pharmacy information systems can be useful on many levels. It currently provides the most accurate indication of which antimicrobials are being used. Where it brings prescribing trends into focus, it may allow more time-efficient use of drug use evaluation resources, so that they are directed towards real changes in prescribing volumes.
Analysis of ward data over time is especially useful. Continuous monitoring of facility or ward data using methods such as time-series charts can help to identify trends in prescribing, and may signal that inappropriate prescribing of specific antimicrobials is occurring. This can act as a trigger for further investigation, such as drug use evaluation audits of the antimicrobials used in a ward or unit. Time-series charts can also be used to identify real improvements over time. Such charts should ideally have control limits.
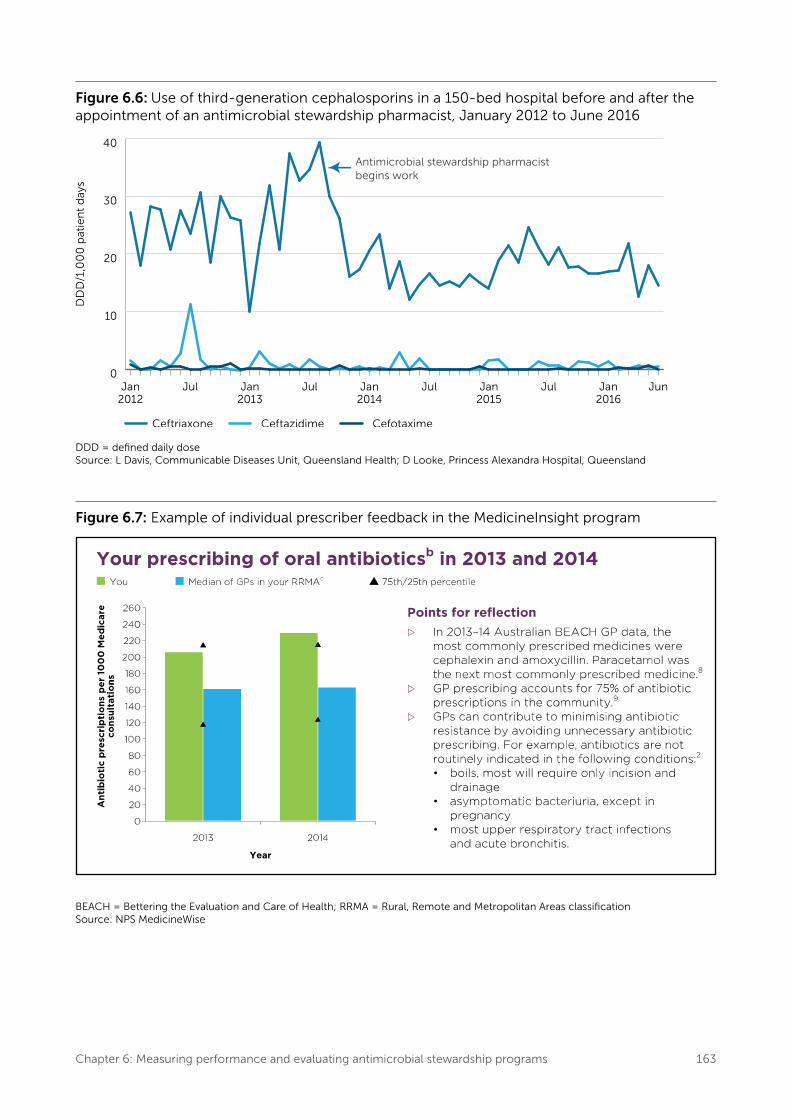
Continuous monitoring of a single facility is of value in identifying unexpected changes or evaluating the effect of interventions. Figure 6.6 shows that employing a dedicated AMS pharmacist had an immediate effect on the volume of third-generation
cephalosporins dispensed, as a result of the AMS pharmacist enforcing compliance with hospital restrictions.
Time-series charts using generalised additive models can be useful for monitoring antimicrobial use data because they can account for a proportion of the random variation seen in prescribing.61 This is important because interventions for random variations waste resources and may affect the credibility of the AMS program
Community
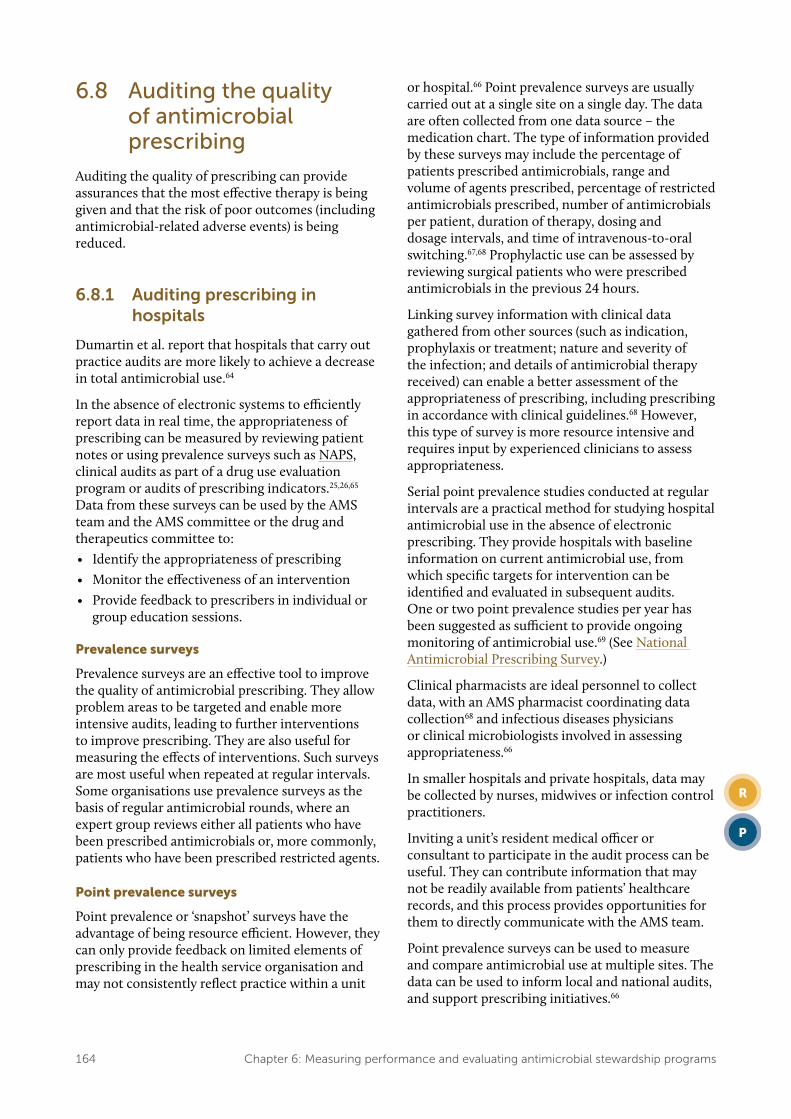
In Scotland, a strategy of feedback to general practitioners has been initiated, in which doctors are made aware of their own prescribing behaviour relative to that of their peers.62 A similar feedback strategy is used in Australia by NPS MedicineWise, using data obtained from the PBS and RPBS, and from NPS MedicineInsight for general practitioners who have agreed to participate in the program.63 Figure 6.7 shows an example of the feedback provided to prescribers. NPS MedicineWise has also worked with Webstercare to enable community pharmacists to create reports on the volumes of antimicrobials that are typically used for urinary tract infections in particular aged care homes, and to compare their use with volumes used in similar homes.
Chapter 6: Measuring performance and evaluating antimicrobial stewardship programs 163
Figure 6.6: Use of third-generation cephalosporins in a 150-bed hospital before and after the appointment of an antimicrobial stewardship pharmacist, January 2012 to June 2016
0
10
20
30
40
JunJan2016
JulJan2015
JulJan2014
JulJan2013
JulJan2012
DDD = defined daily doseSource: L Davis, Communicable Diseases Unit, Queensland Health; D Looke, Princess Alexandra Hospital, Queensland
Figure 6.7: Example of individual prescriber feedback in the MedicineInsight program
BEACH = Bettering the Evaluation and Care of Health; RRMA = Rural, Remote and Metropolitan Areas classification Source: NPS MedicineWise
164 Chapter 6: Measuring performance and evaluating antimicrobial stewardship programs
6.8 Auditing the quality of antimicrobial prescribing
Auditing the quality of prescribing can provide assurances that the most effective therapy is being given and that the risk of poor outcomes (including antimicrobial-related adverse events) is being reduced.
6.8.1 Auditing prescribing in hospitals
Dumartin et al. report that hospitals that carry out practice audits are more likely to achieve a decrease in total antimicrobial use.64
In the absence of electronic systems to efficiently report data in real time, the appropriateness of prescribing can be measured by reviewing patient notes or using prevalence surveys such as NAPS, clinical audits as part of a drug use evaluation program or audits of prescribing indicators.25,26,65 Data from these surveys can be used by the AMS team and the AMS committee or the drug and therapeutics committee to:• Identify the appropriateness of prescribing• Monitor the effectiveness of an intervention• Provide feedback to prescribers in individual or
group education sessions.
Prevalence surveys
Prevalence surveys are an effective tool to improve the quality of antimicrobial prescribing. They allow problem areas to be targeted and enable more intensive audits, leading to further interventions to improve prescribing. They are also useful for measuring the effects of interventions. Such surveys are most useful when repeated at regular intervals. Some organisations use prevalence surveys as the basis of regular antimicrobial rounds, where an expert group reviews either all patients who have been prescribed antimicrobials or, more commonly, patients who have been prescribed restricted agents.
Point prevalence surveys
Point prevalence or ‘snapshot’ surveys have the advantage of being resource efficient. However, they can only provide feedback on limited elements of prescribing in the health service organisation and may not consistently reflect practice within a unit
or hospital.66 Point prevalence surveys are usually carried out at a single site on a single day. The data are often collected from one data source – the medication chart. The type of information provided by these surveys may include the percentage of patients prescribed antimicrobials, range and volume of agents prescribed, percentage of restricted antimicrobials prescribed, number of antimicrobials per patient, duration of therapy, dosing and dosage intervals, and time of intravenous-to-oral switching.67,68 Prophylactic use can be assessed by reviewing surgical patients who were prescribed antimicrobials in the previous 24 hours.
Linking survey information with clinical data gathered from other sources (such as indication, prophylaxis or treatment; nature and severity of the infection; and details of antimicrobial therapy received) can enable a better assessment of the appropriateness of prescribing, including prescribing in accordance with clinical guidelines.68 However, this type of survey is more resource intensive and requires input by experienced clinicians to assess appropriateness.
Serial point prevalence studies conducted at regular intervals are a practical method for studying hospital antimicrobial use in the absence of electronic prescribing. They provide hospitals with baseline information on current antimicrobial use, from which specific targets for intervention can be identified and evaluated in subsequent audits. One or two point prevalence studies per year has been suggested as sufficient to provide ongoing monitoring of antimicrobial use.69 (See National Antimicrobial Prescribing Survey.)
Clinical pharmacists are ideal personnel to collect data, with an AMS pharmacist coordinating data collection68 and infectious diseases physicians or clinical microbiologists involved in assessing appropriateness.66
In smaller hospitals and private hospitals, data may be collected by nurses, midwives or infection control practitioners.
Inviting a unit’s resident medical officer or consultant to participate in the audit process can be useful. They can contribute information that may not be readily available from patients’ healthcare records, and this process provides opportunities for them to directly communicate with the AMS team.
Point prevalence surveys can be used to measure and compare antimicrobial use at multiple sites. The data can be used to inform local and national audits, and support prescribing initiatives.66
Chapter 6: Measuring performance and evaluating antimicrobial stewardship programs 165
National Antimicrobial Prescribing Survey
The Hospital NAPS is part of the AURA Surveillance System. The Hospital NAPS involves a nationwide point prevalence study that is conducted each year during the spring months; the results are published each year.70-72
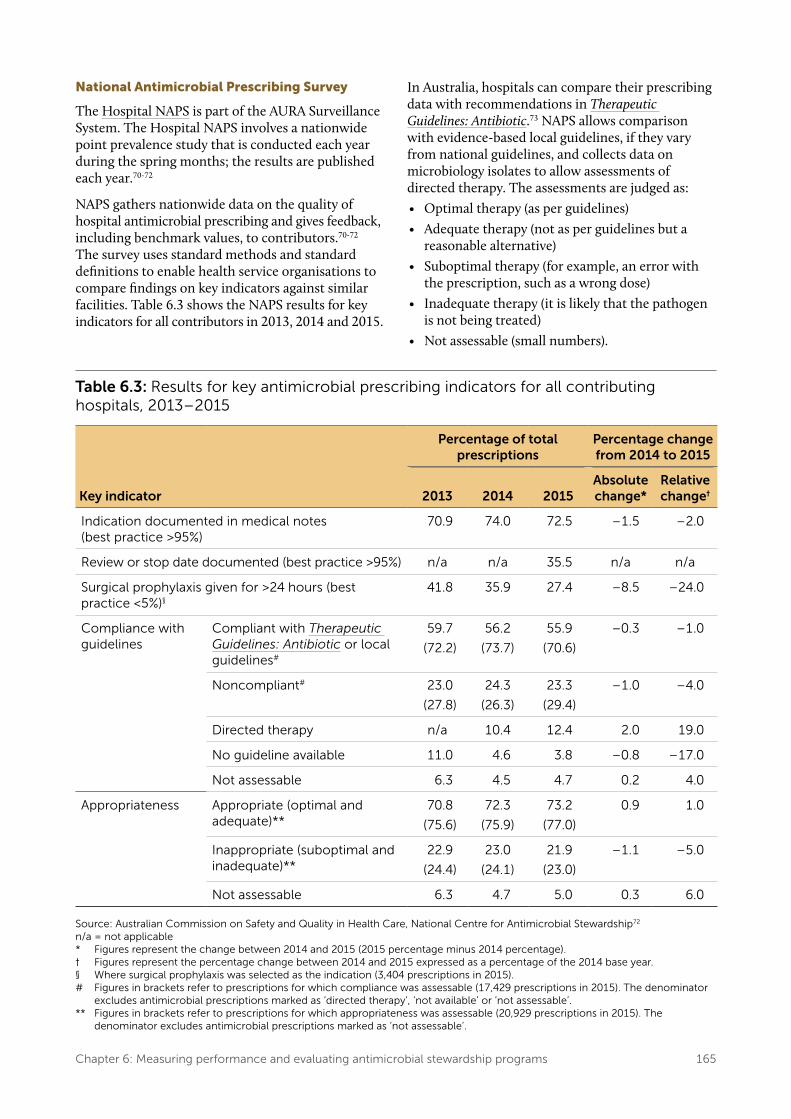
NAPS gathers nationwide data on the quality of hospital antimicrobial prescribing and gives feedback, including benchmark values, to contributors.70-72 The survey uses standard methods and standard definitions to enable health service organisations to compare findings on key indicators against similar facilities. Table 6.3 shows the NAPS results for key indicators for all contributors in 2013, 2014 and 2015.
In Australia, hospitals can compare their prescribing data with recommendations in Therapeutic Guidelines: Antibiotic.73 NAPS allows comparison with evidence-based local guidelines, if they vary from national guidelines, and collects data on microbiology isolates to allow assessments of directed therapy. The assessments are judged as:• Optimal therapy (as per guidelines)• Adequate therapy (not as per guidelines but a
reasonable alternative)• Suboptimal therapy (for example, an error with
the prescription, such as a wrong dose)• Inadequate therapy (it is likely that the pathogen
is not being treated)• Not assessable (small numbers).
Table 6.3: Results for key antimicrobial prescribing indicators for all contributing hospitals, 2013–2015
Key indicator
Percentage of total prescriptions
Percentage change from 2014 to 2015
2013 2014 2015Absolute change*
Relative change†
Indication documented in medical notes (best practice >95%)
70.9 74.0 72.5 –1.5 –2.0
Review or stop date documented (best practice >95%) n/a n/a 35.5 n/a n/a
Surgical prophylaxis given for >24 hours (best practice <5%)§
41.8 35.9 27.4 –8.5 –24.0
Compliance with guidelines
Compliant with Therapeutic Guidelines: Antibiotic or local guidelines#
59.7
(72.2)
56.2
(73.7)
55.9
(70.6)
–0.3 –1.0
Noncompliant# 23.0
(27.8)
24.3
(26.3)
23.3
(29.4)
–1.0 –4.0
Directed therapy n/a 10.4 12.4 2.0 19.0
No guideline available 11.0 4.6 3.8 –0.8 –17.0
Not assessable 6.3 4.5 4.7 0.2 4.0
Appropriateness Appropriate (optimal and adequate)**
70.8
(75.6)
72.3
(75.9)
73.2
(77.0)
0.9 1.0
Inappropriate (suboptimal and inadequate)**
22.9
(24.4)
23.0
(24.1)
21.9
(23.0)
–1.1 –5.0
Not assessable 6.3 4.7 5.0 0.3 6.0
Source: Australian Commission on Safety and Quality in Health Care, National Centre for Antimicrobial Stewardship72
n/a = not applicable* Figures represent the change between 2014 and 2015 (2015 percentage minus 2014 percentage).† Figures represent the percentage change between 2014 and 2015 expressed as a percentage of the 2014 base year.§ Where surgical prophylaxis was selected as the indication (3,404 prescriptions in 2015).# Figures in brackets refer to prescriptions for which compliance was assessable (17,429 prescriptions in 2015). The denominator
excludes antimicrobial prescriptions marked as ‘directed therapy’, ‘not available’ or ‘not assessable’.** Figures in brackets refer to prescriptions for which appropriateness was assessable (20,929 prescriptions in 2015). The
denominator excludes antimicrobial prescriptions marked as ‘not assessable’.
166 Chapter 6: Measuring performance and evaluating antimicrobial stewardship programs
NAPS is designed as a comprehensive point prevalence study that can be used to gauge the broad patterns of prescribing within a health service organisation. This may help identify prescribing practices that warrant a more in-depth audit. A carefully considered analysis of the data submitted to NAPS is presented to participating organisations in a manner that highlights major issues that are immediately actionable for that site. A critical role of NAPS is to focus on useful indicators to help AMS teams interpret the large volumes of data generated.
In 2015, data were submitted to NAPS by 281 hospitals (213 public, 68 private).72 Data from the NAPS reports are also published in AURA reports, providing national data on the appropriateness of antimicrobial prescribing and compliance with guidelines in hospitals.22,23
6.8.2 Auditing prescribing in the community
Community organisations can also collect data on the quality of antimicrobial prescribing. Two programs have been specifically developed for use in general practices and aged care homes.
MedicineInsight program
The MedicineInsight program, developed by NPS MedicineWise, collects detailed patient-level data on antimicrobial prescribing behaviour from more than 400 general practices across Australia. The program automatically extracts antimicrobial prescribing and clinical data from electronic healthcare records and prescribing software in volunteer practices recruited to the program. MedicineInsight links prescriptions
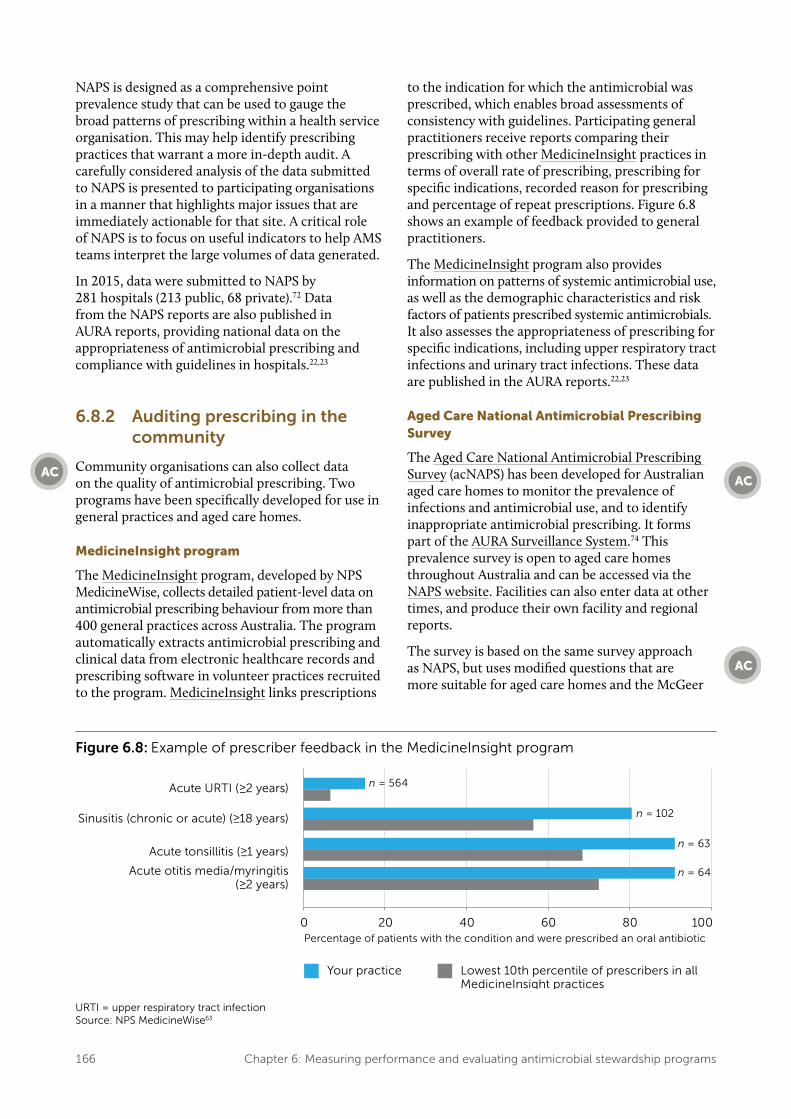
to the indication for which the antimicrobial was prescribed, which enables broad assessments of consistency with guidelines. Participating general practitioners receive reports comparing their prescribing with other MedicineInsight practices in terms of overall rate of prescribing, prescribing for specific indications, recorded reason for prescribing and percentage of repeat prescriptions. Figure 6.8 shows an example of feedback provided to general practitioners.
The MedicineInsight program also provides information on patterns of systemic antimicrobial use, as well as the demographic characteristics and risk factors of patients prescribed systemic antimicrobials. It also assesses the appropriateness of prescribing for specific indications, including upper respiratory tract infections and urinary tract infections. These data are published in the AURA reports.22,23
Aged Care National Antimicrobial Prescribing Survey
The Aged Care National Antimicrobial Prescribing Survey (acNAPS) has been developed for Australian aged care homes to monitor the prevalence of infections and antimicrobial use, and to identify inappropriate antimicrobial prescribing. It forms part of the AURA Surveillance System.74 This prevalence survey is open to aged care homes throughout Australia and can be accessed via the NAPS website. Facilities can also enter data at other times, and produce their own facility and regional reports.
The survey is based on the same survey approach as NAPS, but uses modified questions that are more suitable for aged care homes and the McGeer
Figure 6.8: Example of prescriber feedback in the MedicineInsight program
URTI = upper respiratory tract infectionSource: NPS MedicineWise63
Chapter 6: Measuring performance and evaluating antimicrobial stewardship programs 167
infection criteria as a measure of appropriateness of prescribing. acNAPS was piloted in 2015 with 186 multi-purpose services and aged care homes participating.74 In 2016, participation had increased to 251 facilities.75
6.8.3 Quality improvement audits
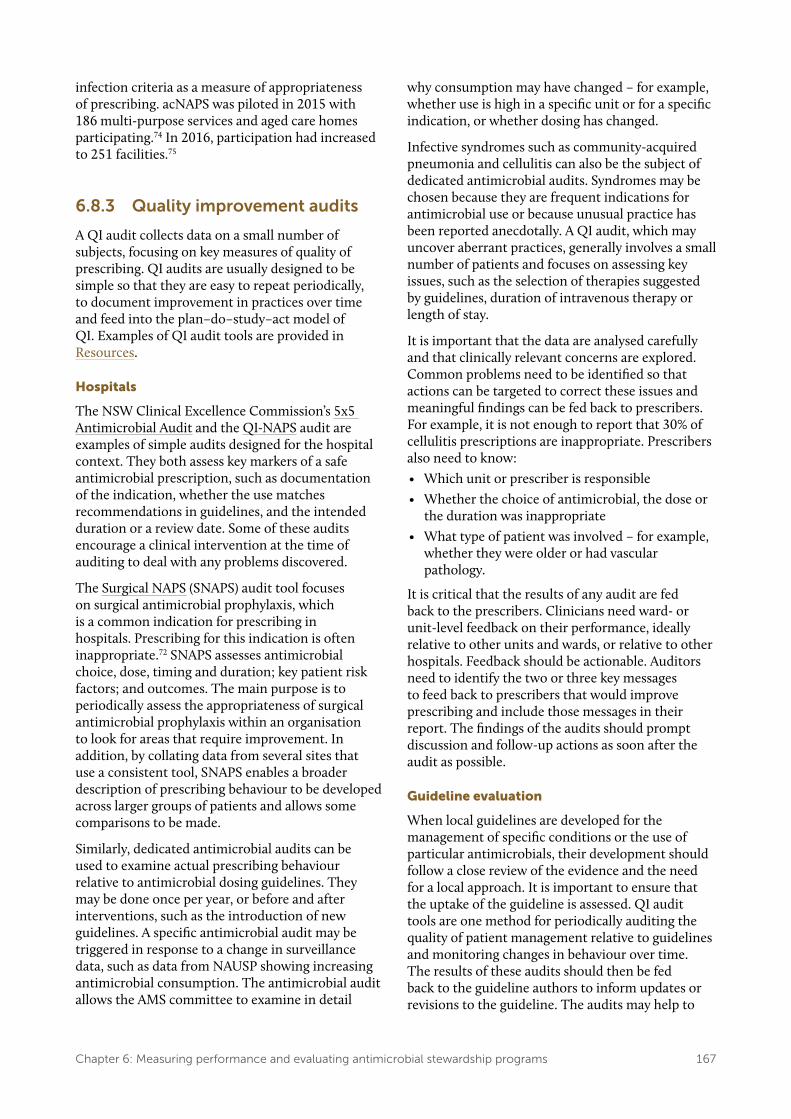
A QI audit collects data on a small number of subjects, focusing on key measures of quality of prescribing. QI audits are usually designed to be simple so that they are easy to repeat periodically, to document improvement in practices over time and feed into the plan–do–study–act model of QI. Examples of QI audit tools are provided in Resources.
Hospitals
The NSW Clinical Excellence Commission’s 5x5 Antimicrobial Audit and the QI-NAPS audit are examples of simple audits designed for the hospital context. They both assess key markers of a safe antimicrobial prescription, such as documentation of the indication, whether the use matches recommendations in guidelines, and the intended duration or a review date. Some of these audits encourage a clinical intervention at the time of auditing to deal with any problems discovered.
The Surgical NAPS (SNAPS) audit tool focuses on surgical antimicrobial prophylaxis, which is a common indication for prescribing in hospitals. Prescribing for this indication is often inappropriate.72 SNAPS assesses antimicrobial choice, dose, timing and duration; key patient risk factors; and outcomes. The main purpose is to periodically assess the appropriateness of surgical antimicrobial prophylaxis within an organisation to look for areas that require improvement. In addition, by collating data from several sites that use a consistent tool, SNAPS enables a broader description of prescribing behaviour to be developed across larger groups of patients and allows some comparisons to be made.
Similarly, dedicated antimicrobial audits can be used to examine actual prescribing behaviour relative to antimicrobial dosing guidelines. They may be done once per year, or before and after interventions, such as the introduction of new guidelines. A specific antimicrobial audit may be triggered in response to a change in surveillance data, such as data from NAUSP showing increasing antimicrobial consumption. The antimicrobial audit allows the AMS committee to examine in detail
why consumption may have changed – for example, whether use is high in a specific unit or for a specific indication, or whether dosing has changed.
Infective syndromes such as community-acquired pneumonia and cellulitis can also be the subject of dedicated antimicrobial audits. Syndromes may be chosen because they are frequent indications for antimicrobial use or because unusual practice has been reported anecdotally. A QI audit, which may uncover aberrant practices, generally involves a small number of patients and focuses on assessing key issues, such as the selection of therapies suggested by guidelines, duration of intravenous therapy or length of stay.
It is important that the data are analysed carefully and that clinically relevant concerns are explored. Common problems need to be identified so that actions can be targeted to correct these issues and meaningful findings can be fed back to prescribers. For example, it is not enough to report that 30% of cellulitis prescriptions are inappropriate. Prescribers also need to know:• Which unit or prescriber is responsible• Whether the choice of antimicrobial, the dose or
the duration was inappropriate• What type of patient was involved – for example,
whether they were older or had vascular pathology.
It is critical that the results of any audit are fed back to the prescribers. Clinicians need ward- or unit-level feedback on their performance, ideally relative to other units and wards, or relative to other hospitals. Feedback should be actionable. Auditors need to identify the two or three key messages to feed back to prescribers that would improve prescribing and include those messages in their report. The findings of the audits should prompt discussion and follow-up actions as soon after the audit as possible.
Guideline evaluation
When local guidelines are developed for the management of specific conditions or the use of particular antimicrobials, their development should follow a close review of the evidence and the need for a local approach. It is important to ensure that the uptake of the guideline is assessed. QI audit tools are one method for periodically auditing the quality of patient management relative to guidelines and monitoring changes in behaviour over time. The results of these audits should then be fed back to the guideline authors to inform updates or revisions to the guideline. The audits may help to
168 Chapter 6: Measuring performance and evaluating antimicrobial stewardship programs
identify situations that are not being addressed by the guideline, or possible misinterpretations where clarity is needed. Audits may also help to identify situations in which practice does not match the guideline, and a review of the evidence and broader discussion is required, including identifying the reasons that the guideline is not being followed. This feedback helps to ‘close the loop’ between writing guidelines and finding out what is actually happening to patients.
Community
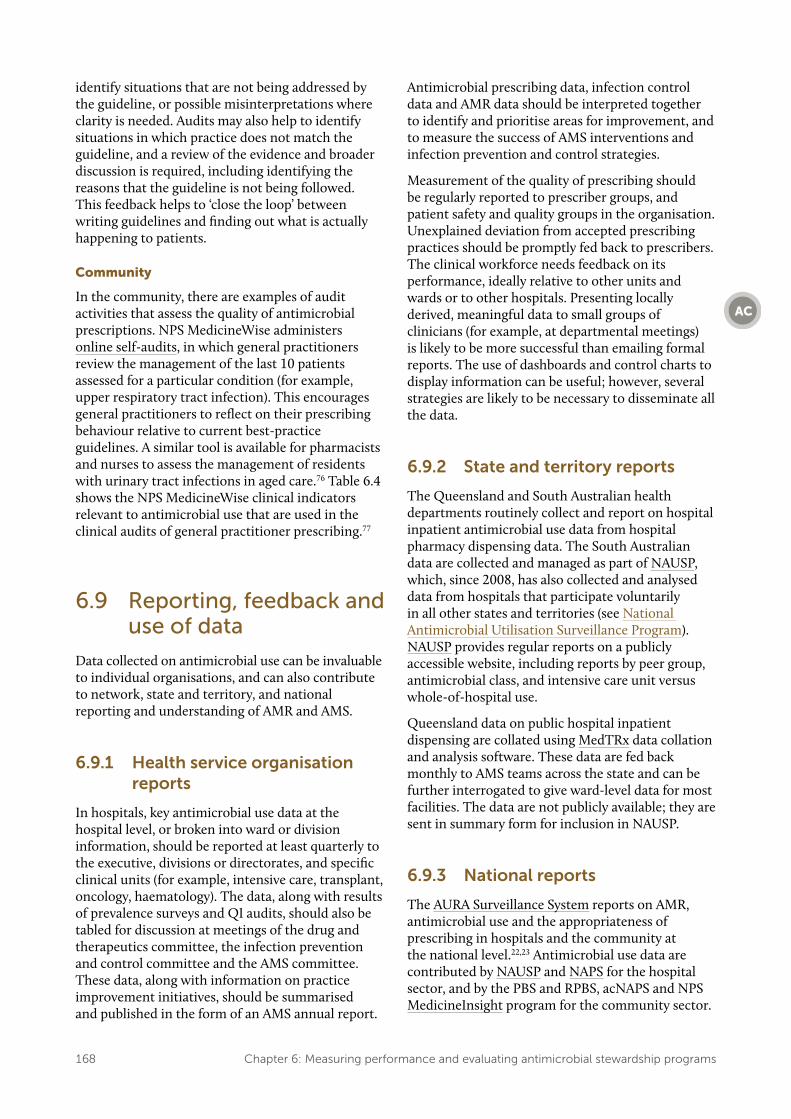
In the community, there are examples of audit activities that assess the quality of antimicrobial prescriptions. NPS MedicineWise administers online self-audits, in which general practitioners review the management of the last 10 patients assessed for a particular condition (for example, upper respiratory tract infection). This encourages general practitioners to reflect on their prescribing behaviour relative to current best-practice guidelines. A similar tool is available for pharmacists and nurses to assess the management of residents with urinary tract infections in aged care.76 Table 6.4 shows the NPS MedicineWise clinical indicators relevant to antimicrobial use that are used in the clinical audits of general practitioner prescribing.77
6.9 Reporting, feedback and use of data
Data collected on antimicrobial use can be invaluable to individual organisations, and can also contribute to network, state and territory, and national reporting and understanding of AMR and AMS.
6.9.1 Health service organisation reports
In hospitals, key antimicrobial use data at the hospital level, or broken into ward or division information, should be reported at least quarterly to the executive, divisions or directorates, and specific clinical units (for example, intensive care, transplant, oncology, haematology). The data, along with results of prevalence surveys and QI audits, should also be tabled for discussion at meetings of the drug and therapeutics committee, the infection prevention and control committee and the AMS committee. These data, along with information on practice improvement initiatives, should be summarised and published in the form of an AMS annual report.
Antimicrobial prescribing data, infection control data and AMR data should be interpreted together to identify and prioritise areas for improvement, and to measure the success of AMS interventions and infection prevention and control strategies.
Measurement of the quality of prescribing should be regularly reported to prescriber groups, and patient safety and quality groups in the organisation. Unexplained deviation from accepted prescribing practices should be promptly fed back to prescribers. The clinical workforce needs feedback on its performance, ideally relative to other units and wards or to other hospitals. Presenting locally derived, meaningful data to small groups of clinicians (for example, at departmental meetings) is likely to be more successful than emailing formal reports. The use of dashboards and control charts to display information can be useful; however, several strategies are likely to be necessary to disseminate all the data.
6.9.2 State and territory reports
The Queensland and South Australian health departments routinely collect and report on hospital inpatient antimicrobial use data from hospital pharmacy dispensing data. The South Australian data are collected and managed as part of NAUSP, which, since 2008, has also collected and analysed data from hospitals that participate voluntarily in all other states and territories (see National Antimicrobial Utilisation Surveillance Program). NAUSP provides regular reports on a publicly accessible website, including reports by peer group, antimicrobial class, and intensive care unit versus whole-of-hospital use.
Queensland data on public hospital inpatient dispensing are collated using MedTRx data collation and analysis software. These data are fed back monthly to AMS teams across the state and can be further interrogated to give ward-level data for most facilities. The data are not publicly available; they are sent in summary form for inclusion in NAUSP.
6.9.3 National reports
The AURA Surveillance System reports on AMR, antimicrobial use and the appropriateness of prescribing in hospitals and the community at the national level.22,23 Antimicrobial use data are contributed by NAUSP and NAPS for the hospital sector, and by the PBS and RPBS, acNAPS and NPS MedicineInsight program for the community sector.
Chapter 6: Measuring performance and evaluating antimicrobial stewardship programs 169
Table 6.4: NPS MedicineWise clinical indicators used in clinical audits of general practitioner prescribing
Area of care Indicator
Patient education • Discussion of beliefs and expectations regarding treatment
• Provision of advice on symptomatic management
Antimicrobial use • Use of a recommended antimicrobial, dose, frequency and duration where antimicrobial therapy is recommended
• Use of an antimicrobial where there is no recommendation for antimicrobial therapy
Common cold / acute viral rhinitis (non-specific upper respiratory tract infection)
• Use of an antimicrobial (not recommended)
Acute bronchitis • Use of an antimicrobial (not recommended)
Acute bacterial rhinosinusitis
• Use of a recommended antimicrobial where an antimicrobial is recommended
• Use of a recommended dose and frequency where a recommended antimicrobial is prescribed
• Use of the recommended duration of therapy where a recommended antimicrobial is prescribed
• Use of an antimicrobial where there is no recommendation for antimicrobial use
Acute sore throat / pharyngitis / tonsillitis
• Use of a recommended antimicrobial where an antimicrobial is recommended
• Use of a recommended dose and frequency where a recommended antimicrobial is prescribed
• Use of the recommended duration of therapy where a recommended antimicrobial is prescribed
• Use of an antimicrobial where there is no recommendation for antimicrobial use
Acute otitis media • Use of a recommended antimicrobial where an antimicrobial is recommended
• Use of a recommended dose and frequency where a recommended antimicrobial is prescribed
• Use of the recommended duration of therapy where a recommended antimicrobial is prescribed
• Use of an antimicrobial where there is no recommendation for antimicrobial use
Imaging in acute bacterial rhinosinusitis
• Recommendation for a sinus CT scan when a CT scan is ordered
CT = computed tomographySource: Australian Commission on Safety and Quality in Health Care77
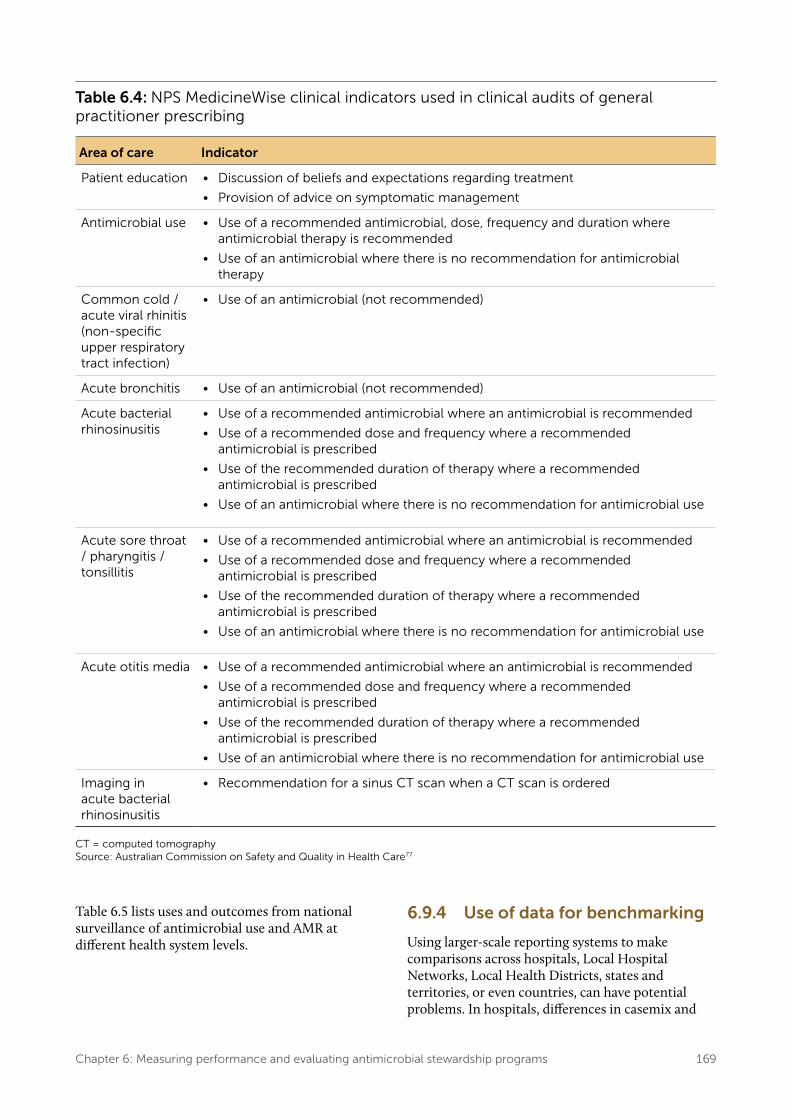
Table 6.5 lists uses and outcomes from national surveillance of antimicrobial use and AMR at different health system levels.
6.9.4 Use of data for benchmarking
Using larger-scale reporting systems to make comparisons across hospitals, Local Hospital Networks, Local Health Districts, states and territories, or even countries, can have potential problems. In hospitals, differences in casemix and
170 Chapter 6: Measuring performance and evaluating antimicrobial stewardship programs
Table 6.5: Uses and outcomes of national surveillance of antimicrobial use and resistance at different health system levels
Level Use of surveillance data Impact or outcome
Global • Inform strategies to prevent and contain antimicrobial resistance, including the response to the Global Action Plan on Antimicrobial Resistance78
• Coordinated efforts internationally: avoidance of duplication of effort and inefficient use of resources
National • Inform policy and program development
• Develop and revise guidelines
• Inform public health priorities
• Inform regulatory decisions
• Coordinate, where necessary, the response to critical antimicrobial resistances
• Coordinated and integrated efforts across Australia
• Increased awareness of antimicrobial resistance and the One Health approach*
State and territory
• Inform policy and program development
• Develop and revise guidelines
• Inform public health priorities
• Inform regulatory decisions
• Detect and respond to critical antimicrobial resistances and outbreaks
• Improved knowledge of local antimicrobial resistance profiles
• Timely response to emerging resistance
• Appropriate and effective use of antimicrobials
Healthcare services
• Inform clinical practice
• Inform policy development
• Develop local strategies to improve antimicrobial stewardship
• Detect and respond to outbreaks of resistant organisms
• Appropriate and effective use of antimicrobials
• Improved capacity for timely response to emerging resistance
Individual • Raise awareness of appropriate use in the community
• Appropriate use of antimicrobials as prescribed
• Decreased complications from unnecessary or inappropriate antimicrobial therapy
* The One Health approach encourages collaboration between clinicians, veterinarians, farmers, food safety specialists and other experts.
regional variations in the incidence of particular infectious diseases or AMRs can confound the results. Ideally, for antimicrobial use data to be valid for benchmarking purposes, they should be risk adjusted for casemix, severity of illness and other relevant variables.79 Kuster et al. attempted to correlate antimicrobial consumption with a casemix index across a group of hospitals in Switzerland.80 They found a significant correlation and suggested that casemix distribution should be considered when analysing large antimicrobial use datasets. Kritsotakis and Gikas attempted the stratification of surveillance data by ward type to reduce confounding by casemix.81 Although this
was useful to the individual facility in indicating trends, there were major problems with comparisons between facilities. Ibrahim and Polk describe the use of indirect standardisation to risk adjust antimicrobial use data. They also describe the use of the ratio of observed to expected use in DOTs and LOTs to reflect use, and as a potential measure for benchmarking across teaching hospitals.79 This method identifies hospitals where use deviates from the predicted use, and the clinical services responsible. However, it relies on hospitals having electronic systems that link individual patient antimicrobial use data with the patient’s diagnosis.
Chapter 6: Measuring performance and evaluating antimicrobial stewardship programs 171
Resources
Measurement for improvement
• Australian Commission on Safety and Quality in Health Care: Measurement for Improvement Toolkit 2006
• Using measurement to improve clinical practice – NSW Health: Easy Guide to Clinical Practice
Improvement – Institute for Healthcare Improvement: online
resources • AMS measurement frameworks
– Centers for Disease Control and Prevention: Antimicrobial Stewardship Measurement Framework
– Be SMART with Resistance: Practical Guide to Antimicrobial Stewardship in Hospitals
– National Quality Forum: National Quality Partners Playbook: Antibiotic stewardship in acute care
Structure measures
• Tools and checklists to help health service organisations to assess the structure of their AMS programs
– NSW Clinical Excellence Commission: Antimicrobial Stewardship Progress & Planning Tool
– SA Health: Antimicrobial Stewardship Program Self-evaluation Toolkit
– Transatlantic Taskforce on Antimicrobial Resistance: core and supplementary structure indicators for hospital AMS programs
– Centers for Disease Control and Prevention: Checklist for Core Elements of Hospital Antimicrobial Stewardship Programs
– Ontario Public Health: AMS Gap Analysis Checklist
– National Institute for Health and Care Excellence: baseline assessment tool for antimicrobial stewardship
• Checklists of requirements for AMS in residential aged care settings and primary care
– Centers for Disease Control and Prevention: Core Elements of Antibiotic Stewardship for Nursing Homes
– Centers for Disease Control and Prevention: Core Elements of Outpatient Antibiotic Stewardship
– Royal College of General Practitioners: TARGET Antibiotic Toolkit
Process measures
• Quality indicators – National Quality Use of Medicines Indicators
for Australian Hospitals – Indicator specification – Antimicrobial
Stewardship Clinical Care Standard
Surveillance tools
• Antimicrobial consumption tool to convert numbers of packages or vials into numbers of DDDs: AMC Tool: the antimicrobial consumption tool
• National Antimicrobial Utilisation Surveillance Program
Audits of quality of prescribing
• NAPS – Hospital NAPS – acNAPS – SNAPS – QI NAPS
• NPS MedicineWise – MedicineInsight program – Clinical e-Audits – RACF/Webstercare report on antibiotics for
urinary tract infections• QI audit tools
– NSW Clinical Excellence Commission: The 5x5 Antimicrobial Audit
– NPS MedicineWise: Clinical e-Audits for general practitioners
– Public Health England: Dental antimicrobial stewardship: toolkit
– Royal College of General Practitioners, TARGET Antibiotic Toolkit: audit toolkits and action planning
172 Chapter 6: Measuring performance and evaluating antimicrobial stewardship programs
References
1. Nathwani D, Sneddon J. A practical guide to antimicrobial stewardship in hospitals. Marcy l’Etoile: BioMérieux SA; 2013.
2. Centers for Disease Control and Prevention (US). Core elements of hospital antibiotic stewardship programs. Atlanta (GA): CDC; 2017 [updated 2017 Feb 23; cited 2017 Sep 26].
3. National Institute for Health and Care Excellence. Antimicrobial stewardship: systems and processes for effective antimicrobial medicine use. London: NICE; 2015.
4. National Quality Forum, National Quality Partners, Antibiotic Stewardship Action Team. National quality partners playbook: antibiotic stewardship in acute care. Washington, DC: National Quality Forum; 2016.
5. Institute for Healthcare Improvement. Science of improvement: setting aims. Cambridge (MA): IHI; 2017 [cited 2017 Sep 26].
6. Nathwani D, Sneddon J, Malcolm W, Wiuff C, Patton A, Hurding S, et al. Scottish Antimicrobial Prescribing Group (SAPG): development and impact of the Scottish National Antimicrobial Stewardship Programme. Int J Antimicrob Agents 2011;38(1):16–26.
7. NSW Department of Health. Easy guide to clinical practice improvement: a guide for healthcare professionals. Sydney: NSW Department of Health; 2002.
8. NSW Clinical Excellence Commission. The 5x5 antimicrobial audit resource package: data entry and review system (with sample data). Sydney: CEC; 2016 [cited 2017 Sep 26].
9. Wachter RM, Flanders SA, Fee C, Pronovost PJ. Public reporting of antibiotic timing in patients with pneumonia: lessons from a flawed performance measure. Ann Intern Med 2008;149(1):29–32.
10. Davey P. The 2015 Garrod Lecture: why is improvement difficult? J Antimicrob Chemother 2015;70(11):2931–44.
11. Australian Commission on Safety and Quality in Health Care. National Safety and Quality Health Service Standards. 2nd ed. Sydney: ACSQHC; 2017.
12. Morris AM, Brener S, Dresser L, Daneman N, Dellit TH, Avdic E, et al. Use of a structured panel process to define quality metrics for antimicrobial stewardship programs. Infect Control Hosp Epidemiol 2012;33(5):500–6.
13. Buyle FM, Metz-Gercek S, Mechtler R, Kern WV, Robays H, Vogelaers D, et al. Development and validation of potential structure indicators for evaluating antimicrobial stewardship programmes in European hospitals. Eur J Clin Microbiol Infect Dis 2013;32(9):1161–70.
14. Colligan C, Sneddon J, Bayne G, Malcolm W, Walker G, Nathwani D. Six years of a national antimicrobial stewardship programme in Scotland: where are we now? Antimicrob Resist Infect Control 2015;4:28.
15. NSW Clinical Excellence Commission. Antimicrobial stewardship progress and planning tool. Sydney: CEC; 2014.
16. Pollack LA, Plachouras D, Sinkowitz-Cochran R, Gruhler H, Monnet DL, Weber JT. A concise set of structure and process indicators to assess and compare antimicrobial stewardship programs among EU and US hospitals: results from a multinational expert panel. Infect Control Hosp Epidemiol 2016;37(10):1201-11.
17. Centers for Disease Control and Prevention (US). Core elements of antibiotic stewardship for nursing homes. Atlanta (GA): CDC; 2015 [updated 2017 Feb 28; cited 2017 Sep 26].
18. Centers for Disease Control and Prevention (US). The core elements of outpatient antibiotic stewardship. Atlanta (GA) CDC; 2017.
19. Sanchez GV, Fleming-Dutra KE, Roberts RM, Hicks LA. Core elements of outpatient antibiotic stewardship. MMWR Recomm Rep 2016;65(RR-6):1-12.
20. Royal College of General Practitioners (UK). TARGET antibiotic toolkit. London: RCGP; 2017 [cited 2017 Sep 26].
21. Adriaenssens N, Coenen S, Tonkin-Crine S, Verheij TJM, Little P, Goossens H, et al. European Surveillance of Antimicrobial Consumption (ESAC): disease-specific quality indicators for outpatient antibiotic prescribing. BMJ Qual Saf 2011;20(9):764–72.
22. Australian Commission on Safety and Quality in Health Care. AURA 2016: first Australian report on antimicrobial use and resistance in human health. Sydney: ACSQHC; 2016.
Chapter 6: Measuring performance and evaluating antimicrobial stewardship programs 173
23. Australian Commission on Safety and Quality in Health Care. AURA 2017: second Australian report on antimicrobial use and resistance in human health. Sydney: ACSQHC; 2017.
24. Nathwani D, Gray K, Borland H. Quality indicators for antibiotic control programmes. J Hosp Infect 2002;50(3):165–9.
25. Australian Commission on Safety and Quality in Health Care, NSW Therapeutic Advisory Group Inc. National quality use of medicines indicators for Australian hospitals. Sydney: ACSQHC; 2014.
26. Guidance Group, National Centre for Antimicrobial Stewardship. NAPS: National Antimicrobial Prescribing Survey. Melbourne: NCAS; 2016 [cited 2017 Sep 26].
27. Australian Institute of Health and Welfare, Meta Data Online Registry (METeOR). Clinical care standard indicators: antimicrobial stewardship. Canberra: METeOR; 2016 [updated 2016 Sep 12; cited 2018 Jan 10].
28. Australian Commission on Safety and Quality in Health Care. Antimicrobial Stewardship Clinical Care Standard. Sydney: ACSQHC; 2014.
29. McGowan JE. Antimicrobial stewardship: the state of the art in 2011 – focus on outcome and methods. Infect Control Hosp Epidemiol 2012;33(4):331–7.
30. Slain D, Sarwari AR, Petros KO, McKnight RL, Sager RB, Mullett CJ, et al. Impact of a multimodal antimicrobial stewardship program on Pseudomonas aeruginosa susceptibility and antimicrobial use in the intensive care unit setting. Crit Care Res and Prac 2011;2011:416–26.
31. Karanika S, Paudel S, Grigoras C, Kalbasi A, Mylonakis E. Systematic review and meta-analysis of clinical and economic outcomes from the implementation of hospital-based antimicrobial stewardship programs. Antimicrob Agents Chemother 2016;60(8):4840–52.
32. Schuts EC, Hulscher MEJL, Mouton JW, Verduin CM, Stuart JWTC, Overdiek HWPM, et al. Current evidence on hospital antimicrobial stewardship objectives: a systematic review and meta-analysis. Lancet Infect Dis 2016;16(7):847–56.
33. Ohl CA, Dodds Ashley ES. Antimicrobial stewardship programs in community hospitals: the evidence base and case studies. Clin Infect Dis 2011;53(Suppl 1):23–8.
34. Nathwani D, Sneddon J, Patton A, Malcolm W. Antimicrobial stewardship in Scotland: impact of a national programme. Antimicrob Resist Infect Control 2012;1(1):7.
35. Davey P, Marwick CA, Scott CL, Charani E, McNeil K, Brown E, et al. Interventions to improve antibiotic prescribing practices for hospital inpatients. Cochrane Database Syst Rev 2017;(2):CD003543.
36. Valiquette L, Cossette B, Garant MP, Diab H, Pepin J. Impact of a reduction in the use of high-risk antibiotics on the course of an epidemic of Clostridium difficile–associated disease caused by the hypervirulent NAP1/027 strain. Clin Infect Dis 2007;45(Suppl 2):112–21.
37. Baur D, Gladstone BP, Burkert F, Carrara E, Foschi F, Dobele S, et al. Effect of antibiotic stewardship on the incidence of infection and colonisation with antibiotic-resistant bacteria and Clostridium difficile infection: a systematic review and meta-analysis. Lancet Infect Dis 2017;17(9):990–1001.
38. Owens RC. Antimicrobial stewardship: concepts and strategies in the 21st century. Diagn Microbiol Infect Dis 2008;61:110–28.
39. Dik J-WH, Vemer P, Friedrich AW, Hendrix R, Lo-Ten-Foe JR, Sinha B, et al. Financial evaluations of antibiotic stewardship programs: a systematic review. Front Microbiol 2015;6:317.
40. Coulter S, Merollini K, Roberts JA, Graves N, Halton K. The need for cost-effectiveness analyses of antimicrobial stewardship programmes: a structured review. Int J Antimicrob Agents 2015;46(2):140–9.
41. You J. Antimicrobial stewardship programs: cost-minimizing or cost-effective? Expert Opin Pharmacother 2015;16(2):155–7.
42. Chaves NJ, Cheng AC, Runnegar N, Kirschner J, Lee T, Buising K. Analysis of knowledge and attitude surveys to identify barriers and enablers of appropriate antimicrobial prescribing in three Australian tertiary hospitals. Intern Med J 2014;44(6):568–74.
43. Cotta MO, Chen C, Tacey M, James RS, Buising KL, Marshall C, et al. What are the similarities and differences in antimicrobial prescribing between Australian public and private hospitals? Intern Med J 2016;46(10):1182–8.
44. Bell S, Davey P, Nathwani D, Marwick C, Vadiveloo T, Sneddon J, et al. Risk of AKI with gentamicin as surgical prophylaxis. J Am Soc Nephrol 2014;25(11):2625–32.
45. Goff DA. Antimicrobial stewardship: bridging the gap between quality care and cost. Curr Opin Infect Dis 2011;24(Suppl 1):11–20.
46. Burke JP, Pestotnik SL. Antibiotic resistance: the combat zone. Curr Opin Infect Dis 1998;11(4):441–3.
174 Chapter 6: Measuring performance and evaluating antimicrobial stewardship programs
47. WHO Collaborating Centre for Drug Statistics Methodology. Definition and general considerations. Oslo: WHO Collaborating Centre for Drug Statistics Methodology; 2016 [updated 2016 Dec 20; cited 2017 Sep 26].
48. Australian Commission on Safety and Quality in Health Care. Antimicrobial use in Australian hospitals (NAUSP). Sydney: ACSQHC; 2017 [cited 2018 Feb 9].
49. Australian Commission on Safety and Quality in Health Care. Antimicrobial use in Australian hospitals: 2014 report of the National Antimicrobial Utilisation Surveillance Program. Sydney: ACSQHC; 2015.
50. Australian Commission on Safety and Quality in Health Care. Antimicrobial use in Australian hospitals: 2015 annual report of the National Antimicrobial Utilisation Surveillance Program. Sydney: ACSQHC; 2017.
51. Schechner V, Temkin E, Harbarth S, Carmeli Y, Schwaber MJ. Epidemiological interpretation of studies examining the effect of antibiotic use on resistance. Clin Microbiol Rev 2013;26(2):289–307.
52. Public Health Ontario. Metrics and evaluation. Toronto: Ontario Agency for Health Protection and Promotion; 2011.
53. Polk RE, Hohmann SF, Medvedev S, Ibrahim O. Benchmarking risk-adjusted adult antibacterial drug use in 70 US academic medical center hospitals. Clin Infect Dis 2011;53(11):1100–10.
54. Statens Serum Institut, DTU Vet National Veterinary Institute, DTU Food National Food Institute. DANMAP. Denmark: Statens Serum Institut, DTU Vet National Veterinary Institute, DTU Food National Food Institute; 2016.
55. de Greeff SC, Mouton JW, Schoffelen AF. NethMap 2016: consumption of antimicrobial agents and antimicrobial resistance among medically important bacteria in the Netherlands / MARAN 2016: monitoring of antimicrobial resistance and antibiotic usage in animals in the Netherlands in 2015. Bilthoven, The Netherlands: National Institute for Public Health and the Environment; 2016. (RIVM Report 2016-0060.)
56. Public Health England. English surveillance programme for antimicrobial utilisation and resistance (ESPAUR) report 2016. London: PHE; 2016.
57. ISD Scotland. Annual report on antimicrobial use and resistance. Edinburgh: ISD Scotland; 2010 [updated 2016 Aug; cited 2017 Sep 26].
58. Public Health Agency of Canada. Canadian antimicrobial resistance surveillance system report 2016. Ottawa: Public Health Agency of Canada; 2016 [updated 2016 Sep 12; cited 2017 Sep 26].
59. Australian Commission on Safety and Quality in Health Care. Australian atlas of healthcare variation. Sydney: ACSQHC; 2015 [updated 2017; cited 2017 Sep 26].
60. Kullar R, Goff DA. Transformation of antimicrobial stewardship programs through technology and informatics. Infect Dis Clin North Am 2014;28(2):291–300.
61. Morton A, Looke D. Monitoring antibiotic usage: an update. Australian Infection Control 2007;12(4):127–9.
62. NHS Scotland, Scottish Medicines Consortium. Local surveillance framework for antimicrobial use 2015. Edinburgh: NHS Scotland; 2015.
63. NPS MedicineWise. MedicineInsight. Sydney: NPS MedicineWise; 2016 [updated 2017 Apr 13; cited 2017 Sep 26].
64. Dumartin C, Rogues AM, Amadeo B, Pefau M, Venier AG, Parneix P, et al. Antibiotic usage in south-western French hospitals: trends and association with antibiotic stewardship measures. J Antimicrob Chemother 2011;66(7):1631–7.
65. Drew RH, White R, MacDougall C, Hermsen ED, Owens RC. Insights from the Society of Infectious Diseases Pharmacists on antimicrobial stewardship guidelines from the Infectious Diseases Society of America and the Society for Healthcare Epidemiology of America. Pharmacotherapy 2009;29(5):593–607.
66. Seaton RA, Nathwani D, Burton P, McLaughlin C, MacKenzie AR, Dundas S, et al. Point prevalence survey of antibiotic use in Scottish hospitals utilising the Glasgow Antimicrobial Audit Tool (GAAT). Int J Antimicrob Agents 2007;29(6):693–9.
67. Willemsen I, Groenhuijzen A, Boagoars D, Stuurman A, van Keulen P, Kluytmans J. Appropriateness of antimicrobial therapy measured by repeated prevalance surveys. Antimicrob Agents Chemother 2007;51:864–7.
68. Seaton RA. Prevalence surveys of antimicrobial use in hospitals: purpose, practicalities and pitfalls. In: Gould IM, Van der Meer JMW, editors. Antibiotic policies: fighting resistance. New York: Springer Science + Business Media LLC; 2008:69–81.
69. Dean B, Lawson W, Jacklin A, Rogers T, Azadin B, Holmes A. The use of serial point-prevalence studies to investigate hospitals anti-infective prescribing. Int J Pharm Pract 2001;10:121–5.
Chapter 6: Measuring performance and evaluating antimicrobial stewardship programs 175
70. Australian Commission on Safety and Quality in Health Care. Antimicrobial prescribing practice in Australian hospitals: results of the 2013 National Antimicrobial Prescribing Survey. Sydney: ACSQHC; 2014.
71. Australian Commission on Safety and Quality in Health Care. National Antimicrobial Prescribing Survey. Sydney: ACSQHC; 2014 [cited 2016 Nov 15].
72. Australian Commission on Safety and Quality in Health Care, National Centre for Antimicrobial Stewardship. Antimicrobial prescribing practice in Australian hospitals: results of the 2015 National Antimicrobial Prescribing Survey. Sydney: ACSQHC; 2016.
73. Writing group for Therapeutic Guidelines: Antibiotic. Therapeutic guidelines: antibiotic. Version 15. Melbourne: Therapeutic Guidelines; 2014.
74. National Centre for Antimicrobial Stewardship, Australian Commission on Safety and Quality in Health Care. Antimicrobial prescribing and infections in Australian residential aged care facilities: results of the 2015 Aged Care National Antimicrobial Prescribing Survey pilot. Sydney: ACSQHC; 2016.
75. National Centre for Antimicrobial Stewardship, Australian Commission on Safety and Quality in Health Care. 2016 Aged Care National Antimicrobial Prescribing Survey report. Sydney: ACSQHC; 2017.
76. NPS MedicineWise. Antibiotics in urinary tract infections: ensuring appropriate use. Sydney: NPS MedicineWise; 2016 [cited 2017 Sep 26].
77. Australian Commission on Safety and Quality in Health Care. Indicator specification: Antimicrobial Stewardship Clinical Care Standard. Sydney: ACSQHC; 2015.
78. World Health Organization. Global action plan on antimicrobial resistance. Geneva: WHO; 2015.
79. Ibrahim OM, Polk RE. Antimicrobial use metrics and benchmarking to improve stewardship outcomes: methodology, opportunities, and challenges. Infect Dis Clin North Am 2014;28(2):195–214.
80. Kuster SP, Ruef C, Bollinger AK, Ledergerber B, Hintermann A, Deplazes C, et al. Correlation between case mix index and antibiotic use in hospitals. J Antimicrob Chemother 2008;62(4):837–42.
81. Kritsotakis E, Gikas A. Surveillance of antibiotic use in hospitals: methods, trends and targets. Clin Microbiol Infect 2006;12(8):701–4.