Embed Size (px)
Citation preview
1
Electronic Supplementary Information
Anticancer Drug Impact on DNA – A Study by Neutron Spectroscopy coupled to Synchrotron-based FTIR and EXAFS Ana L.M. Batista de Carvalhoa, Adriana P. Mamedea, Asha Dopplapudib, Victoria Garcia Sakaib, James Dohertyc,d, Mark Frogleyc, Gianfelice Cinquec, Peter Gardnerd, Diego Gianolioc, Luís A.E. Batista de Carvalhoa* and Maria P.M. Marquesa,e
a“Química-Física Molecular”, Department of Chemistry, University of Coimbra, 3004-535 Coimbra, Portugal bISIS Facility, STFC Rutherford Appleton Laboratory, Chilton, Didcot, Oxfordshire OX11 0QX, UK cDiamond Light Source, Harwell Science and Innovation Campus, Chilton, Didcot, Oxfordshire OX11 0DE, UK dManchester Institute of Biotechnology, University of Manchester, Manchester, M1 7DN, UK eDepartment of Life Sciences, University of Coimbra, 3000-456 Coimbra, Portugal
Table of Contents
Experimental
Chemicals
Synthesis and Characterisation of the Complexes
Preparation of Drug Solutions
Synthesis and Characterisation of the Drug–Purine Adducts
Cell Culture
DNA Extraction
QENS Fundamentals and Measurements
Synchrotron-based FTIR-ATR Measurements
EXAFS Experiments
Data Pre-processing and Analysis
Figures
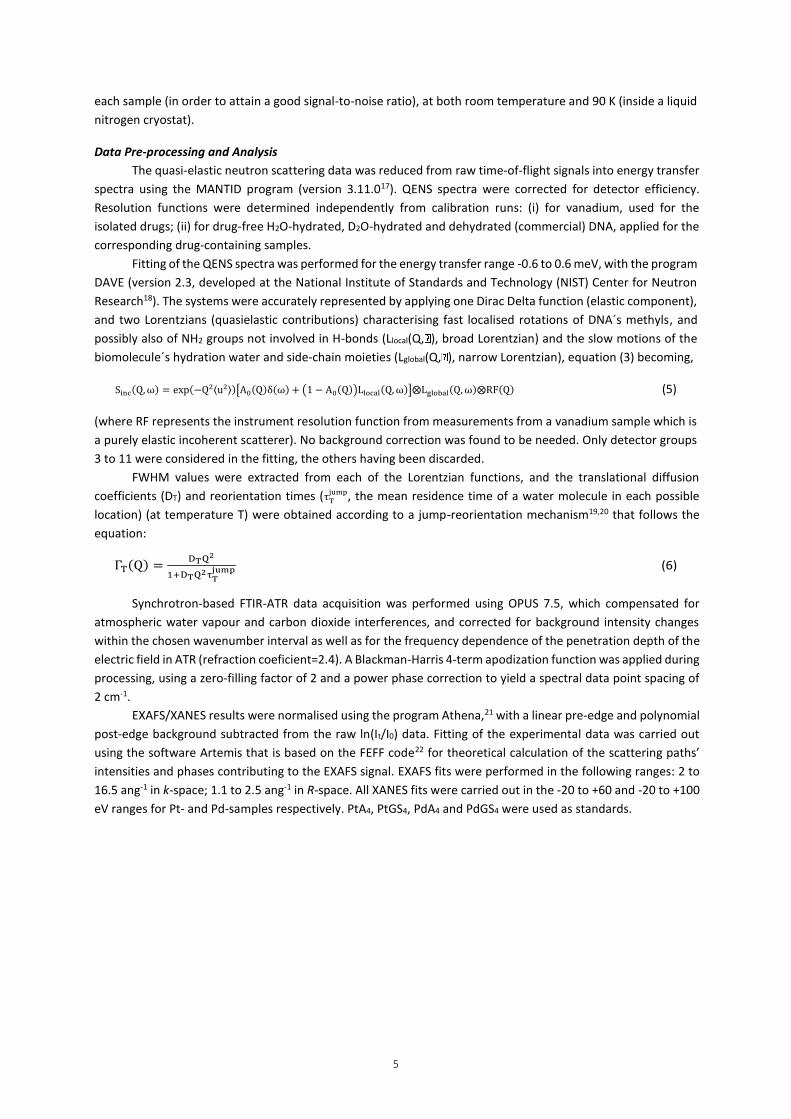
Figure S1 – EXAFS fits for Fourier Transform of k3-weighted χ(k) data (both magnitude and imaginary
parts) – (A) Pd K-edge; (B) Pt L3-edge.
The experimental data is represented in black; the metal-ligand contributions to the EXAFS
signal are shown in different colours: M–N red, M–S blue, M–Cl green.
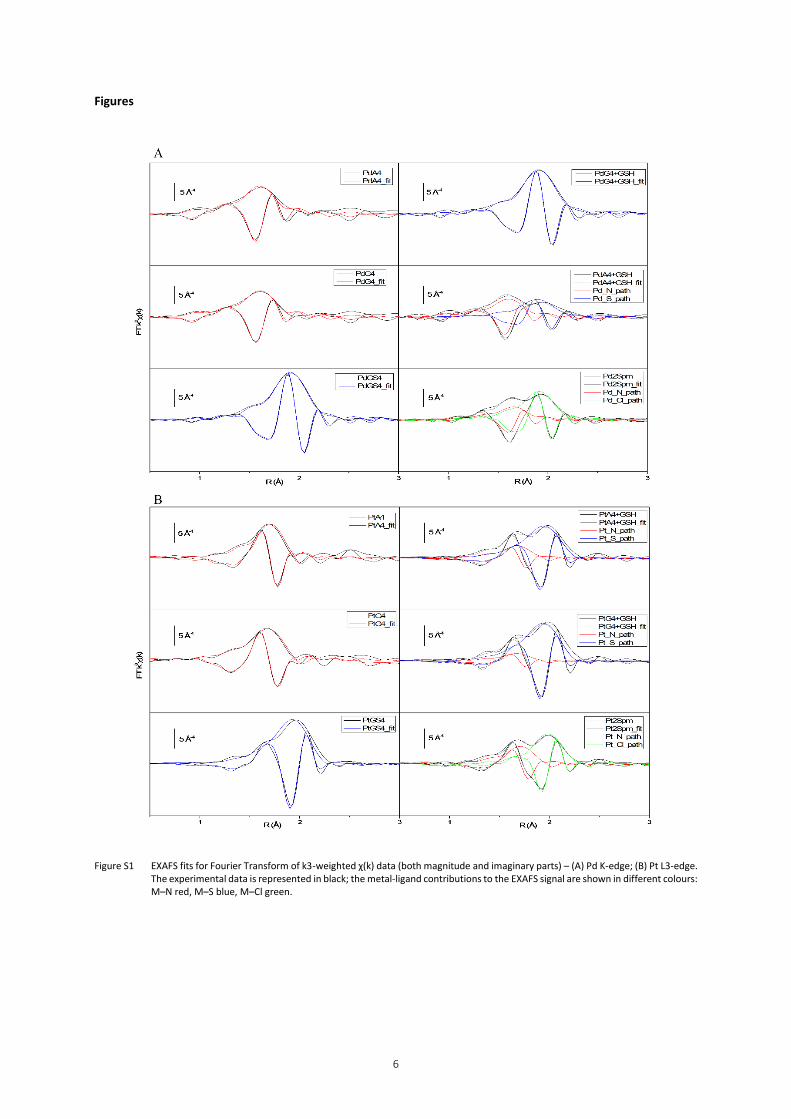
Figure S2 – Normalized XANES data for MA4+GSH and MG4+GSH, with the corresponding linear
combination fits (LCF, grey dashed lines) and standards used for the fit (MA4, MGS4) – (A)
Pd K-edge; (B) Pt L3-edge.
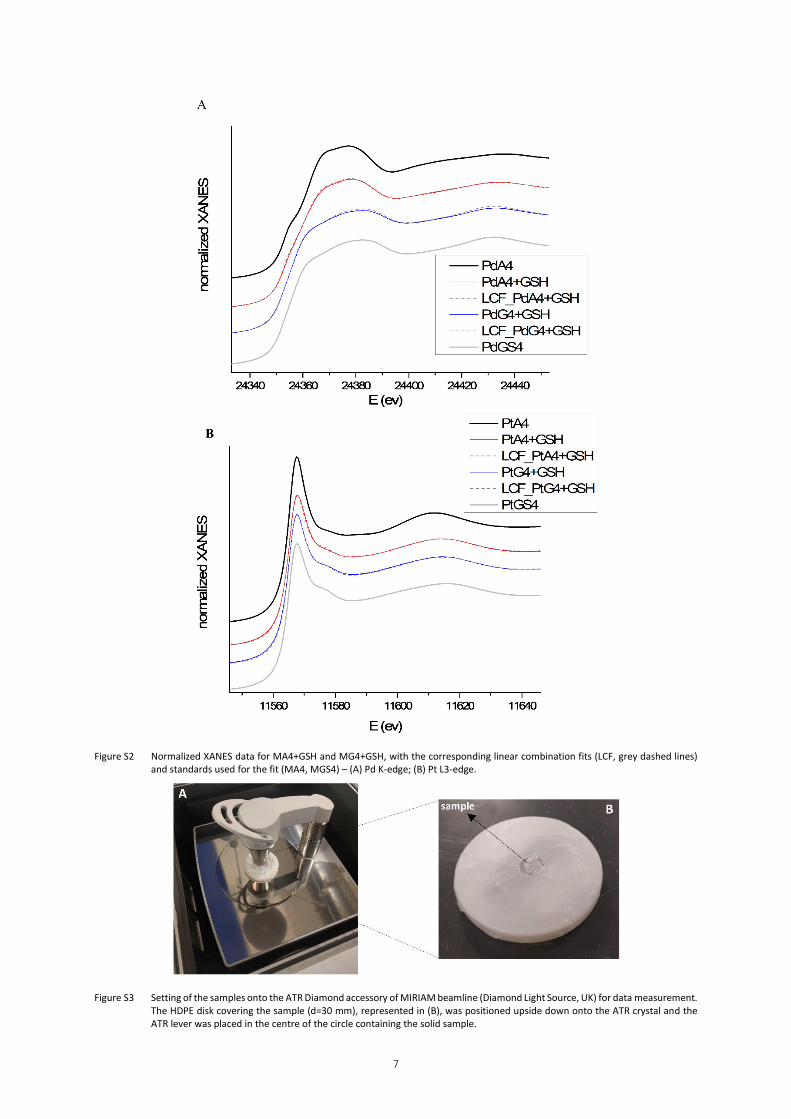
Figure S3 – Setting of the samples onto the ATR Diamond accessory of MIRIAM beamline (Diamond Light
Source, UK) for data measurement.
The HDPE disk covering the sample (d=30 mm), represented in (B), was positioned upside
down onto the ATR crystal and the ATR lever was placed in the centre of the circle containing
the solid sample.
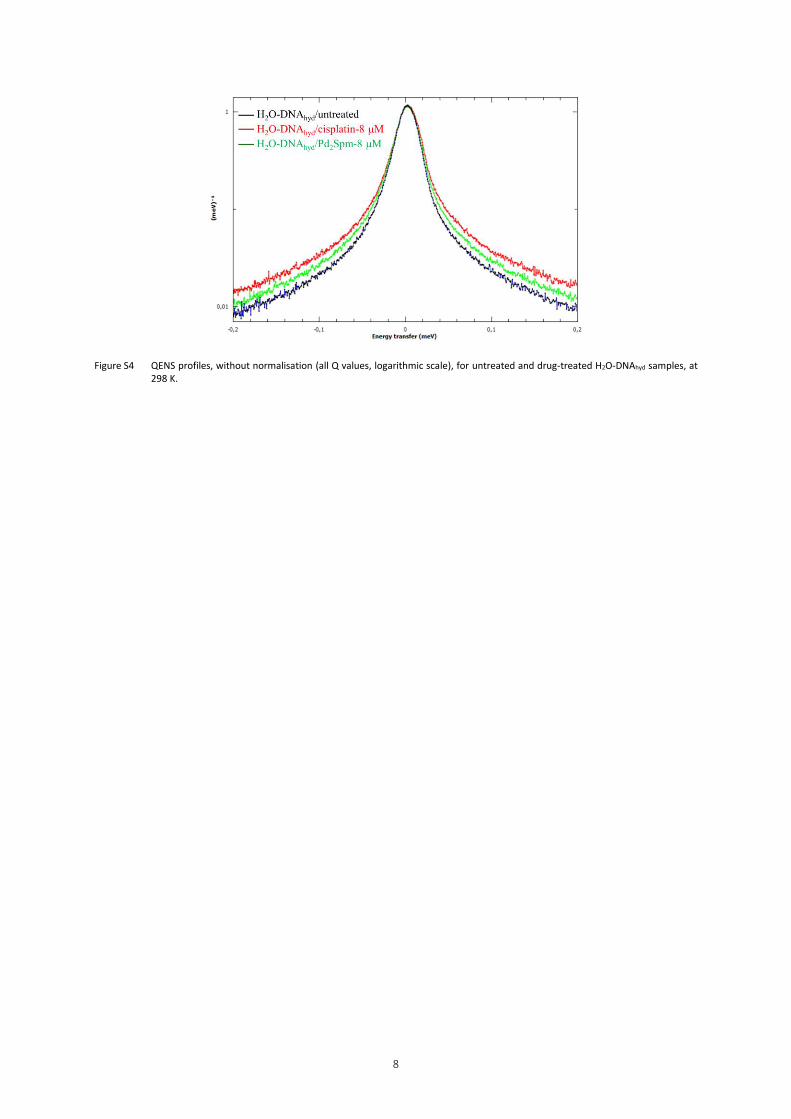
Figure S4 – QENS profiles, without normalisation (all Q values, logarithmic scale), for untreated and
drug-treated H2O-DNAhyd samples, at 298 K.
References
Electronic Supplementary Material (ESI) for Physical Chemistry Chemical Physics.This journal is © the Owner Societies 2019
2
Experimental Section
Chemicals
Adenine (>99%), antibiotics (penicillin-streptomycin 100× solution), Dulbecco´s Modified Eagle′s Medium
– high glucose (DMEM-HG, 4500 mg/L glucose), cis-dichlorodiammine platinum(II) (cisplatin, >98%),
deoxyribonucleic acid (sodium salt from calf thymus, type I, fibers), ethylenediaminetetraacetic acid (EDTA,
disodium salt, dihydrate), formalin (10% neutral-buffered formalin, ca. 4% formaldehyde), guanine (98%), L-
glutathione reduced (>98%), isopropyl alcohol, phosphate buffered saline (PBS), potassium
tetrachloropalladate(II) (K2PdCl4, >99.9%), potassium tetrachloroplatinate(II) (K2PtCl4, >99.9%), N,N´-bis(3-
aminopropyl)-1,4-diaminobutane (spermine, free base), silver nitrate (>99%), tetraammineplatinum(II) nitrate
(99.99%), Trypan blue (0.4% w/v), trypsin-EDTA (1×), as well as solvents, inorganic salts and acids (of analytical
grade) were purchased from Sigma-Aldrich Chemical S.A. (Sintra, Portugal). Fetal bovine serum (FBS) was
obtained from Gibco-Life Technologies (Porto, Portugal), and the TRIzol® reagent was acquired from Invitrogen
(Porto, Portugal).
Synthesis and Characterisation of the Complexes
The Pt2Spm and Pd2Spm complexes were synthesised according to published procedures1 optimised by
the authors 2: 2 mmol of K2PtCl4 or K2PdCl4, respectively, were dissolved in a minimal amount of water and an
aqueous solution containing 1 mmol of spermine was added dropwise under continuous stirring. After 24 h, the
resulting yellow/orange powder (for the Pt(II) and Pd(II) complexes, respectively) was filtered off and washed
with acetone, yellow-orange needle-shaped crystals having been obtained by recrystallization from water. The
newly synthesised compounds were fully characterised (and tested as to their purity) by elemental analysis and
vibrational spectroscopy – FTIR, Raman and inelastic neutron scattering (INS), which were compared with the
previously calculated vibrational profiles (by ab initio methods 2,3).
Pt2Spm (yield 60%) – Elemental analysis, Found (for Pt2(C10N4H26)Cl4): C: 16.2%; H: 3.5%; N: 7.6%, Cl: 19.1%;
Calculated – C: 16.4%; H: 3.6%; N: 7.5%, Cl: 19.3%. Pd2Spm (yield 68%) – Elemental analysis, Found (for
Pd2(C10N4H26)Cl4): C: 21.2%; H: 4.7%; N: 9.6%, Cl: 25.9%; Calculated – C: 21.5%; H: 4.6%; N: 9.9%, Cl: 25.6%.
The FTIR spectra of the solid Pt2Spm and Pd2Spm complexes were obtained (at room temperature, in KBr
disks ca. 0.5% (w/w)) in a Bruker Optics Vertex 70 FTIR spectrometer, coupled to a KBr beamsplitter and a liquid
nitrogen cooled Mercury Cadmium Telluride (MCT) detector. Each spectrum was the sum of 50 scans, at a 2 cm-
1 resolution, the error in wavenumbers being less than 1 cm-1. The Raman data were acquired (at room
temperature) in a Bruker RFS-100 Fourier transform Raman spectrometer, equipped with an InGaAs detector,
with near-infrared excitation (in order to overcome fluorescence) provided by the 1064 nm line of a Nd:YAG laser
(Coherent, model Compass-1064/500N), yielding ca. 150 mW at the sample position. A 180° geometry was
employed and each spectrum was the average of three repeated measurements of 50 scans each, resolution
being set to 2 cm-1. The INS measurements were performed (at 5 K) at the ISIS Pulsed Neutron and Muon Source
of the Rutherford Appleton Laboratory (United Kingdom), using the indirect geometry time-of-flight, high
resolution ((ΔE/E) ca. 1.25 %), broad range TOSCA spectrometer.4,5
Preparation of Drug Solutions
Stock solutions were prepared in PBS – cisplatin-1 mM, Pt2Spm-250 µM and Pd2Spm-500 µM – sterile-
filtered and stored at -20 °C. Further dilutions to the final desired concentrations were made in PBS, immediately
before administration to the cells. Preparation of the samples in isotonic media (PBS) avoided early chloride
hydrolysis of the complexes (drug activation), that only took place within the cell, after administration.
Synthesis and Characterisation of the Drug–Purine Adducts
Drug-adenine and drug-guanine adducts (MA4 and MG4, M=Pt(II) or Pd(II)) were synthesised in (1:4) molar
ratios, following an optimised synthetic route based on reported methods.6,7 Pd2Spm and Pt2Spm aqueous
solutions, 0.45 mM and 0.25 mM respectively, were prepared. In an initial step, hydrolysis of the chloride ligands
was induced by adding 1.9 molar equivalents of AgNO3 while stirring at 40 ºC, in the dark, for approximately 1 h.
The activated drug solutions were then vacuum filtered through a 0.22 μm filter (to remove AgCl) and 4 molar
equivalents of purine base (either A or G) were added to yield (1:4) adducts (hereafter denominated Mbase4,
M=Pt or Pd, base=A or G). These solutions were stirred for ca. 40 h at 30 ºC, in the dark, and then filtered (0.22
3
μm filter) to discard traces of unreacted purines. The pH was adjusted to 3.9 for drug-guanine and to 5.1 for drug-
adenine solutions. Finally, concentration by rotary evaporation under vacuum and lyophilisation were performed,
the resulting solid products being stored at room temperature, in the dark.
Cell Culture
The epithelial human breast cancer cell line MDA-MB-231 (human Caucasian triple-negative, claudin-low,
breast carcinoma) was purchased from the Leibniz-Institut DSMZ GmbH (Germany).8 The cells were cultured as
monolayers, at 37 °C, in a humidified atmosphere of 5% CO2. The cultures were maintained in DMEM-HG medium
supplemented with 10% (v/v) heat-inactivated FBS, 1% (v/v) penicillin (100 U/mL)/streptomycin (100 mg/mL) and
sodium bicarbonate-20 mM (pH 7.4). Cells were subcultured at 80% confluence, using trypsin-EDTA (1×). Under
these conditions, the population doubling time was 26 h.
DNA Extraction
DNA was extracted from MDA-MB-231 cells (henceforth denominated DNApellet), both untreated and
treated with either cisplatin or Pd2Spm: a pellet of 2×10⁷ cells was homogenised in 1 mL of TRIzol® reagent9 and
incubated for 5 min, after which 200 µL of chloroform were added and the solution was centrifuged for 15 min
at 12000×g (4º C). The aqueous phase was discarded, DNA was precipitated from the interphase with 300 µL of
ethanol (≥99.8%) and centrifuged for 5 min at 2000×g (4º C). The resulting pellet was then resuspended in 1 mL
of sodium citrate solution (0.1 M in 10% ethanol, pH 8.5) and centrifuged for 5 min at 2000×g (4º C). This pellet
was resuspended in 1.5 mL of 75% ethanol and stored at 4º C. All samples were prepared in triplicate. DNA yield
and purity was assessed by measuring its absorbance at 260 and 280 nm (in an aqueous solution).
The DNA hydration level was confirmed by FTIR-ATR10 in a Bruker Optics Vertex 70 spectrometer with a
Platinum ATR single reflection diamond accessory, using a silicon solid state beamsplitter and a Deuterated L-
alanine doped TriGlycine Sulphate (DLaTGS) detector with a polyethylene window. Spectra were the sum of 64
scans, at a 2 cm-1 resolution (accuracy in wavenumbers <1 cm-1) and the 3-term Blackman–Harris apodization
function was applied.
QENS Fundamentals and Measurements
Exploiting the high sensitivity of neutrons to hydrogen (with a much larger incoherent scattering cross
section compared to that of other elements), QENS typically analyses the incoherent scattering signal resulting
from a variety of atomic motions ranging from fast vibrational and rotational localised modes, to slower
diffusional modes, motions taking place at pico- to nanosecond timescales. The signal, the so-called dynamic
structure factor, S(Q,ω), arises from energy (ħ) and momentum (Q) exchanges between the neutrons and the
atoms within a given spectrometer resolution, and is detected as a broadening about an elastic line of energy
exchange ≈0. The measured signal can be mathematically expressed as:
Smeasured(Q,ω)=exp (−ℏω
2𝑘𝑇)R(Q,ω)⨂S(Q,ω) (1)
where the exponential term is a detailed balance parameter, and R(Q,ω) is the instrument´s resolution function
(experimentally obtained) which is convoluted with the scattering model (S(Q,ω)) that describes the dynamical
behaviour of the sample. In biological samples, S(Q,ω) is dominated by the incoherent scattering of the
hydrogens which are distributed throught the atomic structures, and are approximated as the convolution of
vibrational, rotational and translational components (assumed as independent motions),
Sinc(Q,ω)=Svib(Q,ω)⨂Srot(Q,ω)⨂Strans(Q,ω) (2)
Strictly in the elastic and quasielastic regions,
Sinc(Q,ω) = exp(−Q2⟨u2⟩)[A0(Q)δ(ω) + (1 − A0(Q))L(Q,ω)] (3)
where the exponential term is the Debye-Waller factor, A0(Q)δ(ω) is the elastic contribution due to motions
slower than the longest observable time as defined by the energy resolution of the spectrometer, and the second
term in the equation corresponds to the quasielastic component. Sinc(Q,ω) provides time/space information on
the system probed, on the timescale of the dynamical processes (through the neutron energy transfer, ω), and
4
on the spatial extent of these processes (from the momentum scattering transfer, Q). Once the QENS data in the
time-domain is represented by an exponential, it can be approximated in the energy domain by Lorentzian
functions of different widths,
L(x) =1
π
Γ
Γ2+ω2 (4)
Γ being the full width at half-maximum (FWHM=2xHWHM (half-width at half-maximum)). These
Lorentzian functions describe motions occurring on different timescales, detailed information on each dynamic
component being retrieved from the Q-dependency of Γ.
QENS data were acquired at the ISIS Pulsed Neutron and Muon Source of the Rutherford Appleton
Laboratory (United Kingdom),11 on the low-energy OSIRIS high-flux indirect-geometry time-of-flight
spectrometer,12 equipped with a newly installed beryllium filter13 and using the 002 reflection of the cooled
pyrolytic graphite analyser bank (PG002 50Hz configuration) with a 25.4 µeV energy resolution (FWHM). The
data was recorded in the Q range 0.18 to 1.60 Å-1 (covering a 11⁰ to 155⁰ angular interval, for a total of 42
detectors grouped into 14 sets), within the energy transfer window -0.6 to 0.6 meV.
Synchrotron-based FTIR-ATR Measurements
FTIR-ATR spectra were recorded at the Multimode InfraRed Imaging And Microspectroscopy (MIRIAM)
beamline B22 from the Diamond Light Source (United Kingdom),14,15 in a Bruker Vertex 80v Fourier Transform IR
interferometer, using a single reflection diamond accessory with two distinct set ups: (i) in the far-IR (FIR), a 40-
700 cm-1 spectral interval was measured using a liquid He-cooled 4.2 K bolometer (in regular mode) and a 6
micron Mylar beamsplitter; (ii) in the mid-IR (MIR), a 400-8000 cm-1 range was probed using a liquid N2-cooled
broadband Mercury Cadmium Telluride (MCT) detector and a broadband KBr beamsplitter. For each
measurement, 1024 (FIR) or 512 (MIR) co-added interferograms were collected at a 2 cm-1 resolution (for both
the sample and the background), at a scanner velocity of 80 kHz (FIR) or 40 kHz (MIR) (relative to the 15797 cm-1
laser reference). 10 spectra were collected per sample, a background being taken before and after each
measurement. Under these conditions, the final spectra sampling was better 1 cm-1. Two replicates were acquired
for each sample, at each experimental condition (FIR and MIR).
The samples (ca. 100-150 μl) were placed onto the diamond ATR accessory in the sample compartment
(kept under vacuum), covered by a high-density polyethylene (HDPE) disk (ca. 1×30 mm), which was sealed with
parafilm to avoid sample leakage (Figure S1). The ATR crystal was cleaned with ethanol (77%) followed by
isopropanol (99%), and carefully wiped between measurements.
EXAFS Experiments
X-ray absorption experiments (simultaneous EXAFS and XANES) were performed at the B18 beamline of
the Diamond Light Source.16 All the samples were analysed in both the solid state and in solution. The former
were measured as self-supported pellets (d=8 mm) using cellulose powder as blank, its thickness having been
optimised to obtain an edge jump close to one. The solutions were measured in Eppendorf vials (2 ml) centered
in order to maximize the beam path through the sample.
The experiments were performed using a Cr-coated branch of collimating and focusing mirrors and a
Si(111) double-crystal monochromator for the Pt-compounds, and a Pt-coated branch with a Si(311)
monochromator for the Pd-compounds. The size of the beam at the sample position was approximately 1 mm
(h)×0.5 mm (v). For the solid samples, data were acquired in transmission mode, with ion chambers before and
after the sample filled with appropriate mixtures of inert gases to optimise sensitivity: I0 – 80 mbar of Ar and 920
mbar of He, resulting in an overall efficiency of 15%; It – 250 mbar of Kr and 750 mbar of He, with a 60% efficiency.
Regarding the solutions, data were acquired in fluorescence mode by means of a 36-elements Ge detector at 90°
with respect to incident beam.
The XAS data were collected in quick EXAFS mode, by scanning the monochromator continuously. The
EXAFS spectra at the Pt L3-edge (11564 eV, for the Pt compounds) and at the Pd K edge (24350 eV, for the Pd
samples) were obtained from 200 eV before the edge to 1200 eV after the edge (corresponding to 18 Å -1 in k-
space), with a constant step size equivalent to 1 eV. An average of 10 scans (ca. 3 min each) were acquired for
5
each sample (in order to attain a good signal-to-noise ratio), at both room temperature and 90 K (inside a liquid
nitrogen cryostat).
Data Pre-processing and Analysis
The quasi-elastic neutron scattering data was reduced from raw time-of-flight signals into energy transfer
spectra using the MANTID program (version 3.11.017). QENS spectra were corrected for detector efficiency.
Resolution functions were determined independently from calibration runs: (i) for vanadium, used for the
isolated drugs; (ii) for drug-free H2O-hydrated, D2O-hydrated and dehydrated (commercial) DNA, applied for the
corresponding drug-containing samples.
Fitting of the QENS spectra was performed for the energy transfer range -0.6 to 0.6 meV, with the program
DAVE (version 2.3, developed at the National Institute of Standards and Technology (NIST) Center for Neutron
Research18). The systems were accurately represented by applying one Dirac Delta function (elastic component),
and two Lorentzians (quasielastic contributions) characterising fast localised rotations of DNA´s methyls, and
possibly also of NH2 groups not involved in H-bonds (Llocal(Q, ), broad Lorentzian) and the slow motions of the
biomolecule´s hydration water and side-chain moieties (Lglobal(Q, ), narrow Lorentzian), equation (3) becoming,
Sinc(Q,ω) = exp(−Q2⟨u2⟩)[A0(Q)δ(ω) + (1 − A0(Q))Llocal(Q,ω)]⨂Lglobal(Q,ω)⨂RF(Q) (5)
(where RF represents the instrument resolution function from measurements from a vanadium sample which is
a purely elastic incoherent scatterer). No background correction was found to be needed. Only detector groups
3 to 11 were considered in the fitting, the others having been discarded.
FWHM values were extracted from each of the Lorentzian functions, and the translational diffusion
coefficients (DT) and reorientation times (τTjump, the mean residence time of a water molecule in each possible
location) (at temperature T) were obtained according to a jump-reorientation mechanism19,20 that follows the
equation:
ΓT(Q) =DTQ
2
1+DTQ2τT
jump (6)
Synchrotron-based FTIR-ATR data acquisition was performed using OPUS 7.5, which compensated for
atmospheric water vapour and carbon dioxide interferences, and corrected for background intensity changes
within the chosen wavenumber interval as well as for the frequency dependence of the penetration depth of the
electric field in ATR (refraction coeficient=2.4). A Blackman-Harris 4-term apodization function was applied during
processing, using a zero-filling factor of 2 and a power phase correction to yield a spectral data point spacing of
2 cm-1.
EXAFS/XANES results were normalised using the program Athena,21 with a linear pre-edge and polynomial
post-edge background subtracted from the raw ln(It/I0) data. Fitting of the experimental data was carried out
using the software Artemis that is based on the FEFF code22 for theoretical calculation of the scattering paths’
intensities and phases contributing to the EXAFS signal. EXAFS fits were performed in the following ranges: 2 to
16.5 ang-1 in k-space; 1.1 to 2.5 ang-1 in R-space. All XANES fits were carried out in the -20 to +60 and -20 to +100
eV ranges for Pt- and Pd-samples respectively. PtA4, PtGS4, PdA4 and PdGS4 were used as standards.
6
Figures
Figure S1 EXAFS fits for Fourier Transform of k3-weighted χ(k) data (both magnitude and imaginary parts) – (A) Pd K-edge; (B) Pt L3-edge. The experimental data is represented in black; the metal-ligand contributions to the EXAFS signal are shown in different colours:
M–N red, M–S blue, M–Cl green.
7
Figure S2 Normalized XANES data for MA4+GSH and MG4+GSH, with the corresponding linear combination fits (LCF, grey dashed lines) and standards used for the fit (MA4, MGS4) – (A) Pd K-edge; (B) Pt L3-edge.
Figure S3 Setting of the samples onto the ATR Diamond accessory of MIRIAM beamline (Diamond Light Source, UK) for data measurement. The HDPE disk covering the sample (d=30 mm), represented in (B), was positioned upside down onto the ATR crystal and the
ATR lever was placed in the centre of the circle containing the solid sample.
8
Figure S4 QENS profiles, without normalisation (all Q values, logarithmic scale), for untreated and drug-treated H2O-DNAhyd samples, at 298 K.

9
References
1. G. Codina, A. Caubet, C. Lopez, V. Moreno and E. Molins, Helv Chim Acta, 1999, 82, 1025.
2. S. M. Fiuza, A. M. Amado, S. F. Parker, M. P. M. Marques and L. A. E. Batista de Carvalho, New J Chem, 2015, 39,
6274.
3. L. A. E. Batista de Carvalho, M. P. M. Marques, C. Martin, S. F. Parker and J. Tomkinson, ChemPhysChem, 2011, 12,
1334.
4. ISIS - STFC - TOSCA, http://www.isis.stfc.ac.uk/instruments/tosca/, Accessed 21/01/2018.
5. S. F. Parker, F. Fernandez-Alonso, A. J. Ramirez-Cuesta, J. Tomkinson, S. Rudic, R. S. Pinna, G. Gorini and J. F.
Castanon, Dynamics of Molecules and Materials-Ii, 2014, 554, 012003.
6. B. Lippert, G. Raudaschl, C. J. L. Lock and P. Pilon, Inorg Chim Acta, 1984, 93, 43.
7. H. Schoellhorn, G. Raudaschl-Sieber, G. Mueller, U. Thewalt and B. Lippert, J Am Chem Soc, 1985, 107, 5932.
8. ECACC, http://bit.ly/1OgAjDi, Accessed 18/09/2015.
9. P. Chomczynski, BioTechniques, 1993, 15, 532.
10. B. R. Wood, Chem Soc Rev, 2016, 45, 1980.
11. ISIS - STFC - OSIRIS, http://www.isis.stfc.ac.uk/instruments/osiris/, Accessed 21/01/2018.
12. M. T. F. Telling and K. H. Andersen, Phys Chem Chem Phys, 2005, 7, 1255.
13. F. Demmel, D. McPhail, J. Crawford, D. Maxwell, K. Pokhilchuk, V. Garcia-Sakai, S. Mukhopadyay, M. T. F. Telling, F.
J. Bermejo, N. T. Skipper and F. Fernandez-Alonso, Epj Web Conf, 2015, 83, 03003.
14. G. Cinque, M. Frogley, K. Wehbe, J. Filik and J. Pijanka, Synchrotron Radiation News, 2011, 24, 24.
15. Diamond Light Source, http://www.diamond.ac.uk/, Accessed 18/05/2018.
16. A. J. Dent, G. Cibin, S. Ramos, A. D. Smith, S. M. Scott, L. Varandas, M. R. Pearson, N. A. Krumpa, C. P. Jones and P.
E. Robbins, 14th International Conference on X-Ray Absorption Fine Structure (XAFS14), Proceedings, 2009, 190.
17. O. Arnold, J. C. Bilheux, J. M. Borreguero, A. Buts, S. I. Campbell, L. Chapon, M. Doucet, N. Draper, R. F. Leal, M. A.
Gigg, V. E. Lynch, A. Markyardsen, D. J. Mikkelson, R. L. Mikkelson, R. Miller, K. Palmen, P. Parker, G. Passos, T. G.
Perring, P. F. Peterson, S. Ren, M. A. Reuter, A. T. Savici, J. W. Taylor, R. J. Taylor, R. Tolchenoy, W. Zhou and J.
Zikoysky, Nuc. Instrum Methods Phys Res, 2014, 764, 156.
18. R. T. Azuah, L. R. Kneller, Y. M. Qiu, P. L. W. Tregenna-Piggott, C. M. Brown, J. R. D. Copley and R. M. Dimeo, J Res
Natl Inst Stand Technol, 2009, 114, 341.
19. D. Laage and J. T. Hynes, Science, 2006, 311, 832.
20. D. Laage, J Phys Chem B, 2009, 113, 2684.
21. B. Ravel and M. Newville, Journal of Synchrotron Radiation, 2005, 12, 537.
22. J. J. Rehr, R. C. Albers and S. I. Zabinsky, Phys Rev Lett, 1992, 69, 3397.