Embed Size (px)
Citation preview
TVE- MILI 19042
Master’s Thesis 15 credits
October 2019
Global Antibiotics Supply Sector,
Structure and Main Strategies
Ahmed Elajez
Master Programme in Industrial Management and Innovation
Masterprogram i industriell ledning och innovation

i
Abstract
Global Antibiotics Supply Sector, Structure and Main Strategies
Ahmed Elajez
The discovery of antibiotics in the early 1900s saved millions of lives;
nevertheless, in recent years there has been an antibiotics shortage in the European market. In the effort to solve this problem, and as part of the
PLATINEA project, this research focuses on understanding the global antibiotics market structure and the main strategies used by companies within the market.
Through archival studies, including online reports, company websites, and
companies' annual reports, an exploratory study has been conducted.
The antibiotics supply chain progresses through several stages including
delivering raw materials, manufacturing APIs, manufacturing the product and ultimately distributing the drug through market authorization holders.
This research identifies the main company strategies, including cost leadership, differentiation, internationalization, product range breadth, and acquisition.
Four main strategic groups are identified, in which companies tend to apply the same strategies in the antibiotics supply market.
Supervisor: Enrico Baraldi Subject reader: Ines Khadri
Examiner: Sofia Wagrell TVE- MILI 19042 Printed by: Uppsala Universitet
Faculty of Science and Technology
Visiting address: Ångströmlaboratoriet Lägerhyddsvägen 1 House 4, Level 0
Postal address: Box 536 751 21 Uppsala
Telephone: +46 (0)18 – 471 30 03 Telefax: +46 (0)18 – 471 30 00
Web page: http://www.teknik.uu.se/student-en/

ii
Acknowledgments
First, I would like to thank my wife Sahar for taking care of us, me and my kids Natalie and
Adam, as I was most of the time away during this year, without her support I would not make it.
Second, I would like to thank Uppsala University and specially Indtek Department for this
wonderful year where I got to meet great teachers and students at MILI 2018. This opportunity
helped me to gain more knowledge and wisdom.
Finally, I would like to thank my supervisor Enrico Baraldi for his support and wisdom. Many
thanks for my subject reader Ines Khadri and my examiner Sofia Wagrell for their ultimate efforts
during writing this thesis.

iii
Table of Contents
Abstract................................................................................................................................ i
Acknowledgments................................................................................................................ ii
Abbreviations ......................................................................................................................iv
List of Figures ..................................................................................................................... v
List of Tables.......................................................................................................................vi
1. Introduction................................................................................................................. 1 1.1 Background .................................................................................................................................................... 1
1.2 Purpose and research questions ...................................................................................................................... 1
1.2.1 Research Questions ................................................................................................................................... 2
1.2.2 Study outline.............................................................................................................................................. 2
2. Literature Review ......................................................................................................... 3 2.1 Supply Sector Analysis Structure................................................................................................................... 3
2.2 Business Strategies ......................................................................................................................................... 4
2.3 Strategic Grouping ......................................................................................................................................... 6
3. Theoretical Framework ................................................................................................ 8 3.1 Factors for broad mapping of the structure of supply sector ......................................................................... 8
3.2 Strategies to be investigated ......................................................................................................................... 10
3.3 Strategic Groups formulation ....................................................................................................................... 11
4. Method ...................................................................................................................... 12 4.1 Research Structure ....................................................................................................................................... 12
4.2 Research approach and Strategy .................................................................................................................. 12
4.3 Research Choices ......................................................................................................................................... 13
4.4 Techniques and procedures .......................................................................................................................... 13
4.5 Research Constraints .................................................................................................................................... 15
4.6 Ethics ............................................................................................................................................................ 16
5. Empirical Study ......................................................................................................... 17 5.1 Introduction .................................................................................................................................................. 17
5.2 The Antibiotics Supply Sector ..................................................................................................................... 19
5.3 Companies’ Strategies .................................................................................................................................. 25
6. Analysis ..................................................................................................................... 26 6.1 Antibiotics Supply Sector structure ............................................................................................................. 26
6.2 Main strategies ............................................................................................................................................. 27
6.3 Main Strategic Groups ................................................................................................................................. 30
7. Discussion ................................................................................................................. 33
8. Conclusion ................................................................................................................ 34
9. References ................................................................................................................. 35
10. Appendices ............................................................................................................. 38 10.1 Appendix 1 .............................................................................................................................................. 38

iv
Abbreviations
AMR Antimicrobial Resistance
API Active Pharmaceutical Ingredients
CD Capability Development
CL Cost Leadership
CMDO Contract Manufacturing and Development Organization
CMO Contract Manufacturing Organization
CSR Corporate Social Responsibility
DDD Defined Daily Dose
Df Differentiation
GSK GlaxoSmithKline
Inter Internationalization
ITC International Trade Centre
MAH Market Authorization Holder
PD Product Distribution
PLATINEA Platform for Innovation of Existing Antibiotics
PM Product Manufacturing
PRD Product Range Breadth
R&D Research and Development
Rx Medical prescriptions
SG Strategic Group
USD United States Dollar
WHO World Health Organization

v
List of Figures FIGURE 1 THE SMA-FRAMEWORK DESIGNED BY LOBERMEYER AND KOTZAB (2010) ...................................................................... 4 FIGURE 2 PORTER’S FIVE FORCES ADAPTED TO THE SUPPLY MARKET DEVELOPED BY THE STATE OF QUEENSLAND (2017) ...................... 4 FIGURE 3 EVOLUTION OF STRATEGIC MANAGEMENT: DOMINANT THEMES .................................................................................... 6 FIGURE 4 MARKET STRUCTURE ADAPTED FROM THE STATE OF QUEENSLAND’S (2017) FRAMEWORK ................................................ 8 FIGURE 5 ADAPTED RESEARCH ONION FOR THIS STUDY............................................................................................................ 12 FIGURE 6 PHARMACEUTICALS SUPPLY CHAIN STRUCTURE, ADAPTED FROM (HUQ ET AL, 2016) ...................................................... 17 FIGURE 7 BIG PHARMA IN THE WORLD 2018 ...................................................................................................................... 18 FIGURE 8 ANTIBIOTICS SUPPLY CHAIN STRUCTURE .................................................................................................................. 19 FIGURE 9 ANTIBIOTICS MANUFACTURING ............................................................................................................................. 20 FIGURE 10 ANTIBIOTICS EXPORTERS .................................................................................................................................... 20 FIGURE 11 ANTIBIOTICS IMPORTERS ................................................................................................................................... 21 FIGURE 12 GLOBAL ANTIBIOTIC CONSUMPTION BY COUNTRY INCOME CLASSIFICATION: 2000–2015. ............................................. 22

vi
List of Tables TABLE 1: DEFINITIONS OF DIFFERENT TERMS OF SUPPLY MARKET ANALYSIS. .................................................................................. 3 TABLE 2 A SELECTION OF DEFINITIONS OF STRATEGY BY DIFFERENT AUTHORS ................................................................................ 5 TABLE 3 LEVELS OF MARKET CONCENTRATION ......................................................................................................................... 9 TABLE 4 7 STRATEGIES TO BE INVESTIGATED .......................................................................................................................... 11 TABLE 5 TOP 30 MANUFACTURING PHARMACEUTICALS COMPANIES ......................................................................................... 19 TABLE 6 A) TOP 10 CORPORATIONS BY UNBRANDED GENERIC, B) TOP 10 CORPORATIONS BY UNBRANDED GENERIC DISPENSED RX ... 22 TABLE 7 TOP 10 UNBRANDED GENERIC PRODUCTS BY DISPENSED RX BY CORPORATION .............................................................. 23 TABLE 8 TOP 25 ANTIBIOTICS MANUFACTURE ....................................................................................................................... 24 TABLE 9 THE 20 SELECTED ANTIBIOTICS COMPANIES .................................................................................................... 24 TABLE 10 THE STRATEGIES OF THE 20 SELECTED COMPANIES ................................................................................................... 25 TABLE 11 ANTIBIOTICS SECTOR’S LEVEL OF MARKET CONCENTRATION ....................................................................................... 27 TABLE 12 SG1 STRATEGIES ............................................................................................................................................... 31 TABLE 13 SG2 STRATEGIES ............................................................................................................................................... 31 TABLE 14 SG3 STRATEGIES .............................................................................................................................................. 32 TABLE 15 SG4 STRATEGIES .............................................................................................................................................. 32

1
1. Introduction This chapter starts with a background description of the antibiotics market followed by the
research purpose and research questions. Finally, a short description of the outline of this thesis.
1.1 Background
"Since the discovery of antibiotics in the early 20th century, these have been an essential tool in
treating the massive burden of infectious diseases worldwide" (Cogan, Karrar et al, 2018, p.6).
These diseases, which are considered easy to cure today, were deadly before the discovery of
antibiotics (Davies and Davies, 2010).
As antibiotics are considered vital to combatting deadly bacterial diseases, it may be assumed that
antibiotics are widely available in most healthcare systems. Unfortunately, that is not necessarily
true; in reality, one of the main issues facing the antibiotics industry, especially healthcare and
patients is shortages in supply, where "shortages lead to empty shelves in hospitals, pharmacies,
and community health centers. Shortages of generic antibiotic products have been reported on a
global and national scale ….and many formulations of antibiotics for specific populations,
including children, have limited availability." (Cogan, Karrar et al, 2018, P.7).
Shortages may occur due to many reasons, such as failures in manufacturing, scarcity of active
pharmaceutical ingredients (APIs), or simply the monopoly structure created by API producers.
For example, an explosion at a Chinese API producer, caused a global shortage of a key antibiotic
(Ibid), pointing to the fragility of the antibiotics supply chain. Moreover, the same report describes
the current situation of the global supply chain of antibiotics as "patchy, complex and at risk of
collapsing" (Ibid).
The same report also describes the global antibiotic supply chains as “highly fragmented,
consisting of many players at some stages of the chain, and very few at other vital stages"(Ibid).
Therefore, identifying the main players involved in those vital stages could help to better
understand the current situation of constant shortages of essential antibiotics. In the case of the
antibiotics supply sector, the three main stages involved in the chain are Active Pharmaceutical
Ingredients (APIs) producers, manufacturers, and market authorization holders at the local level.
1.2 Purpose and research questions
The purpose of this thesis is to contribute to solve the problem of the Swedish antibiotic’s shortage
as part of PLATINEA (Platform for Innovation of Existing Antibiotics). This thesis focus on
investigating the global supply sector of antibiotics from a general perspective, hence “a
helicopter view”. This study will hereby identify some of the main MAHs, manufacturers and
API producers, with the aim to identify the main strategies used by these actors.
Identifying some major market players, in addition to the main strategies in the antibiotics market
can shed light on the bottlenecks of the chain, and may explain why a problem with an API
producer in Asia can cause a global shortage of a certain antibiotic.

2
1.2.1 Research Questions To address the purpose of this thesis the following research questions are posed:
1. How can the structure of the global antibiotics supply sector be described?
2. What are the main strategies used by the main players in the antibiotics supply sector
globally? And what are the main strategic groups within this industrial sector?
The first research question will be answered with a literature review on the antibiotics supply
sector and also a brief review on more general supply sector theories that will formulate a
framework to be investigated by the empirical study.
A literature study on defining the pharmaceutical industry and other industries’ main
strategies and an empirical analysis on the subject will answer the second research question.
1.2.2 Study outline
This section presents the outline of the thesis, providing a short description of each chapter.
Chapter 2 – Literature Review
This chapter presents the theoretical background of the thesis, about the supply sector structure,
strategies and strategic grouping theories.
Chapter 3 – Theoretical Framework
This chapter addresses the theoretical framework of the thesis applied to analyze the supply
sector structure and highlight main strategies conducted in the antibiotic field.
Chapter 3 - Method
This chapter discusses how the research has been conducted, what methods have been used to
collect the data from different resources and how the data have been analyzed. The chapter
concludes with the research constraints and ethics.
Chapter 4 – Empirical Study
This chapter addresses the data collected from companies' websites, annual reports, and other
organizations. And also presents one email correspondence with Dr. Bo Lassen from ri.se.
Selected companies are presented in table 6 whereas table 10 showcases the strategies which have
been investigated.
Chapter 5 - Analysis
This chapter analyzes the empirical data in relation to the theory and gives an answer to the
research questions, about the antibiotics supply sector structure and the main strategies of the
different players.
Chapter 6 - Discussion
This chapter reflects further on the findings.
Chapter 7 - Conclusion
This last chapter concludes the thesis by answering the two
research questions and discussing future needs of research and questions, stemming from this
thesis.

3
2. Literature Review This chapter presents the theoretical background of the thesis based on the three key concepts of
supply sector structure, strategies and strategic grouping and related theories.
These concepts are chosen for a literature review as they are the key to answer the research
questions of this thesis. Understanding what scholars have said about them in previous studies
helps better formulate answers of the scope of this research in the antibiotics field.
2.1 Supply Sector Analysis Structure
In the literature, there are many definitions associated with supply sector or market analysis. Some
of these definitions were summarized by Brannestam & Josefsson (2018), in Table 1 below.
Term Definition
“Supply market analysis
The State of Queensland
(2017), p. 40.”
“Supply market analysis is a technique used to identify market
characteristics for specific goods or services. It provides
information that is critical to develop effective procurement
strategies, in the context of planning for significant
procurement.”
“Supply market research
Van Weele (2010), p.131.”
“Supply market research can be defined as the systematic
gathering, classification and analysis of data considering all
relevant factors that influence the procurement of goods and
services for the purpose of meeting present and future company
requirements.”
“Supply market intelligence
Jones and Barner (2015),
Chapter 1.”
“Supply market intelligence is created when external
information is collected and analyzed to form actionable
conclusions that affect a company’s ability to strategically
locate, secure, and manage sources of supply.
“Supply market scanning
Zsidisin et al. (2015), p.
550.”
“Supply market scanning includes the supply managers’ efforts
to learn from benchmarking, suppliers, analyzing market trends
and experimenting with new technology.”
Table 1: Definitions of different terms of supply market analysis.
Source: Brannestam & Josefsson( 2018, p.8)
As Brannestam & Josefsson (2018) described in their research, there are two main characteristics
of different frameworks in the supply market analysis literature. One is a process-oriented quality
as in Jones & Barner (2015) and Van Weele (2010) and the other characteristic is factor-oriented
as in Lobermeyer & Kotzab (2010) and The State of Queensland (2017). The process-oriented
frameworks are applied when analyzing the process conducted in the market (Brannestam &
Josefsson, 2018).
To focus on the factor-oriented frameworks, two frameworks were identified; the first one in the
Supply Market Analysis (SMA)-framework (Lobermeyer & Kotzab, 2010), that consists of four
groups of factors to analyze the supply market: ‘Existing supplier markets’, ‘Product’, ‘New
markets’ and ‘Buyer markets’, as shown in Figure 1.

4
The other framework is Porter’s Five Forces (adapted by The State of Queensland, 2017)
which consists of six different groups of factors: ‘Market structure’, ‘Competition’, ‘Supply
chains’, ‘Substitute of goods and services’, ‘Value as a customer’, in addition to ‘Supply context’
factors. As shown in Figure 2.
Figure 1 The SMA-framework designed by Lobermeyer and Kotzab (2010)
Source: (Brannestam & Josefsson, 2018,p.9)
Figure 2 Porter’s five forces adapted to the supply market developed by The State of
Queensland (2017)
Source: (Brannestam & Josefsson, 2018,p.9)
2.2 Business Strategies In the literature, there are different definitions of strategy as noted by Table 3, showing various
definitions of the term “strategy.”
Term Definition
Sun Tzu
The Art of War 500BC “Strategy is the main task of organizations. In situations of life and
death, it is the path toward survival or extinction. Its study cannot be
dismissed.”

5
Ohmae (1983) “The sole purpose of strategic planning is to enable the enterprise to
achieve a sustainable advantage over its competitors as efficiently
as possible.”
Mintzberg (1987) “strategy is deliberate and determined in advance of the actions that follow, with five possible perspectives of strategy (Ps): strategy as
plan, ploy, pattern, position, and perspective.”
Drucker (1993)
“Strategic planning is the science of making good decisions about
the future.”
Porter (1980, 1996, 2001) “Strategy involves defining a firm’s long-term position in the
marketplace, making difficult trade-offs about what the firm will and
will not do to provide value to customers, and forging hard-to-
replicate fit among parts of the systems the firm constructs to deliver
value to customers, all with a view to making a superior return on
investment.”
Grant (2005) “A strategy is a process, a guideline that gives coherence to the
decisions of an organization in order to achieve objectives.”
Table 2 A selection of definitions of strategy by different authors
Source (Gavinelli 2016, P.2, P.3)
According to Porter (1980), there are three generic strategies to achieve a competitive advantage
in the market. These strategies are reducing overall cost (cost leadership), differentiating the
product a firm offers so that it is unique, and by focusing on a specific buyer group, geographic
market, or segment of the product lines.
In his book, contemporary strategy analysis, Robert Grant (Grant, 2010), presents the historical
evolution of corporate strategies during the last 70 years. Grant emphasizes that the business
strategy has evolved due to practical needs, rather than development in theory.
• Senior managers experienced increasing trouble in coordinating choices and keeping control in
businesses that grew in size and complexity during the 1950s and 1960s. Financial budgeting
presented short-term control and project choice in the shape of an annual financial planning and
investment estimation, yet did almost nothing to steer the company's long-term growth. To fulfill
this goal, corporate planning (also known as long-term planning) was created in the early 1950s.
• Trust in corporate planning by scientific management methods were heavily damaged during the
1970s and early 1980s. Multiple factors include the oil crisis and the rise of international
competition, especially from Japan. The strategic management term appeared to take over
corporate planning, as the strategic tool for a firm. Strategic management focuses on maximizing
the profit-potential by the company’s position in the market in relation to the rivals. (External environment)
• During the 1990s, the focus of strategy analysis shifted from external environment sources of
profit to the internal sources of profit.
• In the first decade of the twenty centuries, companies faced the TMT (Technology, media,
Telecommunications) bubble, where the classical principle of strategy has to be rewritten.
Strategic alliances appeared as a solution in the new era to allow firms to acquire resources and
capabilities that would allow it to sustain competitive advantage and to counter the new way of
doing business.

6
• In the recent years, as a counter strategy to the delusion (such as the American housing bubble that
caused the global recession in 2008 and 2009), the focus of corporate strategy shifted towards
ethics, corporate social responsibility to gain and retain trust in business as part of the society.
Figure 3 illustrates the evolution of main themes of business strategies that dominated different
decades from the 1950s till 2009 (Grant, 2010).
Figure 3 Evolution of strategic management: dominant themes
Source (Grant 2010, p.17)
2.3 Strategic Grouping
Hunt (1972) defined the phenomena when different groups of firms were performing different
strategies in an industry as a strategic group in his study of the home appliance industry.
Meanwhile, another definition introduced by Porter (1979) stating that "an industry can
thus be viewed as composed of clusters or groups of firms, where each group consists of firms
following similar strategies in terms of the key decision variables. Such a group could consist of
a single firm or could encompass all the firms in the industry. I define such groups as strategic
groups."
According to Shah (2007), the concept of strategic groups has been empirically examined by
different authors in different industries, such:
The chemical goods industry: Different strategic groups form based on the degree of vertical
integration, product differentiation, and product diversification.
The consumer goods industry: Different strategic groups form based mainly on the relative size
of the firms.

7
The brewing industry: Different strategic groups form based on manufacturing, marketing,
financial, and structural variables.
On the other hand, different factors are used by different authors to identify strategic
groups, including market position, resource commitments, and assets, technological skills, brand
name reputation (Shah, 2007).

8
3. Theoretical Framework
This chapter addresses the theoretical framework that are being used to analyze and map the
structure of supply sector of antibiotics and to present strategies that are being investigated.
The main purpose of this theoretical framework it to lay down the theoretical foundation of
answering the two research questions.
3.1 Factors for broad mapping of the structure of supply sector For the purpose of addressing the first research question on broadly mapping the supply sector
structure; the research shall only focus on one element of the framework suggested by the State
of Queensland (2017), which is the market structure as highlighted in Figure 4.
Figure 4 Market structure adapted from the state of Queensland’s (2017) framework
According to the Queensland state framework, to analyze the supply market structure, 5 steps
should be conducted: “defining the market”, “market size and market shares”, “market
concentration”, “ownership” and “profitability”.
Defining the market
There are many considerations when defining the key characteristics of the market, the type of
portfolio (product or service), market segment divisions (ex. technical, geographical or
commercial) (The State of Queensland, 2017).
Another definition of the market as “a means by which the exchange of goods and services takes
place as a result of buyers and sellers being in contact with one another, either directly or through
mediating agents or institutions.” (Market, 2019).
Markets differ from each other and, according to Kotler and Keller (2012), there are four types
of key markets companies can operate in:
Consumer Markets: Mass amount of goods and services are sold such as juices, cosmetics,
athletic shoes, etc.

9
Business Markets: Business goods and services are targeting professional skilled buyers.
In business markets, actors buy goods to resell or produce products.
Global Markets: At the global level, companies need to evaluate which and how to enter
a country as an exporter, …, joint venture partner, or as a contract manufacturer); and it have to
take into consideration many variables, for example, culture, language, legal, political, etc.
Nonprofit and Governmental Markets: the customers here are like religious institutions
and universities with limited purchasing power, and government authorities, where they need to
price carefully and the selling process is usually done through a tendering system.
Market size and market shares
The market size is calculated by sales and turnover; then market size for a specific product can
then be looked upon in different geographical levels. Market shares of the key suppliers (key
players) can be determined once the market size is known (The State of Queensland, 2017).
Market concentration
There are four generic levels of market concentration, as shown in Table 2. “The degree of market
concentration can be calculated as a ratio by dividing the total market share of the largest four
firms by the total size of the market. The closer the outcome is to 1.0, the higher the concentration
of the market and the likelihood that the market is an oligopoly, duopoly or monopoly. If the
outcome is less than 0.25 the concentration is low and the market most likely competitive.”(The
State of Queensland 2017,p.13 ).
Perfect
competition
Monopolistic
competition
Oligopoly Monopoly
Number of suppliers Many Many Typically, 2 to
10
One
Product
differentiation
Homogenous
(identical)
Some product
differentiation
Substantial
product
differentiation
No close
substitutes
Barriers to entry None None or very
limited
Substantial scale
and scope
economies
Substantial
Concentration of
market power
Zero
concentration
Low Medium to high Maximum
(perfect
concentration)
Price determinants Purely by
supply and
demand
No individual
buyer or seller
can influence
market price
Price as function
of supply and
demand, and the
ability of a firm to
change more due
to product
differentiation
Ability to
influence market
prices by
restricting
output
Ability to set
price by
restricting
output
Table 3 Levels of market concentration
Source (The state of Queensland, 2017, p.13)
From Lobermeyer & Kotzab (2010) framework, this research shall focus on the term "existing
supplier markets'. To be better understand the existing supply market, the researchers suggested
focusing on the key suppliers, as they can be determined in regards to their role in the market,
their strength, and weakness in regards to performance, financial situation, and technological
capabilities.

10
3.2 Strategies to be investigated
The second question has initiated a literature review to formulate a framework for analysis of
the different business strategies of the main players in the supply sectors under investigation.
As seen in the literature there have been different definition of strategy; however, this research
shall adopt the definition of Grant (2010) for business strategy as:” it is concerned with how the
firm competes within a particular industry or market.”
Many strategies have been conducted over the years, as seen in Figure 3, and many themes
and trends have driven the industries throughout different eras. However, it can be seen clearly in
the recent years that the global trend of strategies tends to focus more on internationalization,
more addressing corporate social responsibility in relation to the business ethics as part of the
globalization era (Grant, 2010); therefore from this part, this research selects to investigate three
strategies: CSR, internationalization and capability development through acquisition. Choosing
acquisition in particular to be investigated a capability development strategy, is thought to be easy
to track and to be noticed, as companies tend to be open about these activities via their websites,
and public records.
From the three generic strategies of Porter (1980), this research selects two to
investigate overall cost leadership and differentiation and excludes focus, as focus is going to be
either on cost leadership or focus on differentiation. However, investigating focus is thought to
be outside the scope of this research and less relevant.
According to Shah (2007), in the chemical goods industry, companies use different
strategies based on the degree of vertical integration, product differentiation and product range
breadth (product diversification). Hence, this research selects to study the vertical integration and
product range breadth, as the antibiotics market is maybe similar to the chemical goods industry.
Following table 4 for the seven strategies to be examined in the antibiotics supply sector
Strategy Description by the researchers (why is it used)
Overall Cost
Leadership
(Porter, 1980)
Cost leadership needs hard development of effective facilities, forceful
quest for cost cuts, overhead control, prevention of marginal client
accounts, and cost reduction in fields such as sales team, marketing,
R&D, etc.
Differentiation
(Porter, 1980)
Differentiation is the second generic strategy based on creating a
product/service which is considered as special throughout the market.
Differentiation methods can take different shapes: image or design of a
brand, functions, technology, customer service, suppliers, or other
forms.
Vertical Integration
(Mpoyi, 2003)
The strategy of vertical integration is included within the collaborative
strategy, which is when an organization acquires other companies in
the supply chain downstream or upstream. The more the organization
merges with or takes over other firms, the higher its vertical
integration, the higher the economic value it generates concerning the
overall production value.

11
Capability
Development
(Grant,2010)
Maintaining and renewing competitive advantage needs the constant
development and expansion of current resources and capabilities, as
well as fostering new ones. There are several way of acquiring
capabilities: mergers, acquisitions, and alliances, or internal
development.
Internationalization
(Gavinelli, 2016)
Another strategy for expansion is internationalization — that is,
diversification of geographical location. Companies are considered to
be internationalized if they are engaged in continuous production
and/or business activities in two or more countries. Positive effects
could be commercial, manufacturing, tax and public financing related,
or associated with reduced power costs and lower production costs,
access to raw materials or inputs, or more favorable regulations.
Product Range
Breadth
Breadth of the product range can be described as the product variety
that an organization can deliver. Many empirical findings in different
industries such as Kekre & Srinivasan 1990, Bayus & Putsis 1999, and
Moreno & Terwiesch 2017 have shown that a broad product range
improves an organization's market share.
Corporate Social
Responsibility (CSR)
(Porter and Kramer,
2006)
Three reasons were identified as to why CSR might be in the interests
of a company:
• Mutual interest between the company and society to have a
healthy ecosystem.
• CSR enhances the reputation among customers and other
parties.
• Support from constituencies when companies conduct
business.
Table 4 7 strategies to be investigated
3.3 Strategic Groups formulation In regards to the second part of the second research question, about the strategic groups that exist
in the antibiotics supply sector, this research adopts Porter’s (1979) vision of strategic groups.
When the companies conduct a similar strategy in a market, they are considered to form a
particular strategic group.

12
4. Method
This chapter presents how the research has been conducted, what methods were used to collect
the data from different sources and how the data was analyzed. The chapter concludes with the
research constraints and ethics.
4.1 Research Structure
Saunders, Lewis, and Thornhill (2009) proposed a framework on how to conduct a research, this
framework was illustrated as what they refer to as “the research onion,” where the research
starts from the outer layer narrowing downward. The research onion consists of six different
layers covering different areas (Saunders et al, 2009).
However, this research adapted a customized version of the research onion as in figure 5.
Further explanation on these choices follows in the upcoming sections.
Figure 5 Adapted research onion for this study
Source (Saunders et al., 2009)
4.2 Research approach and Strategy In academia there are different research approaches, either inductive, deductive or combined
(Saunders et al., 2009). The difference between the two main approaches is stated as: “your
research should use the deductive approach, in which you develop a theory and hypothesis (or
hypotheses) and design a research strategy to test the hypothesis, or the inductive approach, in
which you would collect data and develop theory as a result of your data” (Saunders et al. 2009,
p.124 ). As this research aims to formulate a theory about the antibiotics supply sector structure,
and what main strategies are conducted in this sector, based on collecting data, which will then
be used to develop the theory, this research is using the inductive approach.
F.
Secondary data
Primary data
and data analysis
Mixed
methods
Archival
Research
Inductive
research Approach
Strategy
Choices
Techniques and
procedures

13
Research strategy is about the way that allows answering the research questions, and choosing
any strategy depended on time and other recourses availability (Saunders et al., 2009). Among
the seven strategies presented by Saunders, Lewis, and Thornhill (2009) this research adopts an
archival research strategy because this was seen best suited to answer the research questions.
Archival research strategy “makes use of administrative records and documents as the principal
source of data. Although the term archival has historical connotations, it can refer to recent as
well as historical documents” (Saunders et al. 2009, p.150).
This research is focusing on secondary data as a key source of data due to many constraints, such
as lack of accessibility to direct online database, very limited willingness of companies to provide
primary data, and limited time for research. An archival research strategy allows a scientific
approach to data such as companies’ websites, annual reports, business websites, online
databases, and other reports.
4.3 Research Choices A researcher can choose between either qualitative, or quantitative techniques and procedures or
a combination of both (Saunders et al., 2009).
Before choosing, it is essential to define these choices properly. “Quantitative is
predominantly used as a synonym for any data collection technique (such as a questionnaire) or
data analysis procedure (such as graphs or statistics) that generates or uses numerical data. In
contrast, qualitative is used predominantly as a synonym for any data collection technique (such
as an interview) or data analysis procedure (such as categorizing data) that generates or use
non-numerical data. Qualitative therefore can refer to data other than words, such as pictures
and video clips.” (Saunders et al. 2009, p.151).
The data collected for this research has a mixed nature, meaning the data is both qualitative and
quantitative, for example, the market shares, market size, and the calculation of concentration are
of quantitative nature whereas data about strategies is qualitative.
On the other hand, the data analysis method is only qualitative as there was no use of quantitative
analysis such as statistics, computer-based simulation. So, even the data collected are both
quantitative and qualitative, this research still analyzed in a qualitative matter, using mostly
costumed-designed interpretation by this research and not a famous quantitative procedure such
as “clustering techniques.
The next section will go through the techniques and procedures used for both data collection and
data analysis.
4.4 Techniques and procedures In this section, the focus shall be on the last layer of the research onion, techniques and
procedures, in how research data has been collected and analyzed. (Saunders et al. 2009)
Data Collection If data is collected for the main purpose of the research, then it is primary data, whereas if it is
collected for other purposes it is defined as secondary data (Bryman & Bell, 2015).

14
There are advantages and disadvantages in using secondary data in a research (Saunders et al.,
2009). Some advantages include being feasible for longitudinal studies, being available in
permanent form. Moreover, secondary data can be collected according to clear procedures that
enable high quality. On the other hand, there are some disadvantages such as difficulty of access,
no control over the details in the data, and potential lack of specification (Saunders et al., 2009).
Taking into consideration both the above advantages and disadvantages, this research is adopting
secondary data as the main source of data, which was collected from archival records, company
records and databases. In addition, email correspondence served as one primary source of data.
To better identify strategies and define strategic groups, this research adopts certain criteria to
focus on while investigating companies. Below are the criteria for each strategy, followed by
criteria for each strategic group.
Criteria for each strategy:
Overall cost leadership: This strategy is considered to be followed if the company has
manufacturing sites in countries considered to be emerging markets, especially India and China,
because production costs are cheaper in emerging markets compared to developed countries (Hill
et at, 2018), China and India are among the main exporters from these markets (ITC Market
analysis, 2018).
Differentiation: If the company focuses on generics unbranded antibiotics it is considered as not
following a differentiation strategy, whereas if it focuses on entirely new patented or branded
antibiotics it is considered as following a differentiation strategy.
Vertical integration: four levels in the supply chain are considered in order to assess the vertical
integration strategy of an antibiotic supplier: API manufacturing, product manufacturing (PM),
contract manufacturing (with companies focusing only on such activities termed CMO, contract
manufacturing organization) and market authorization holders (MAH). The criteria for vertical
integration are that the greater the number of levels controlled by a firm, the greater its degree of
vertical integration. To identify the levels covered by each company (i.e. API Manufacturing,
contract manufacturing, etc. ), a search in the company website was made for the respective
operation.
Capability Development: This strategy was mapped by search on the company website about the
acquisitions or merges history made by the company. If the company made such activity, it would
be considered as having capability development strategy, if not, then it won’t be considered
having this strategy even though it may have other activities related to this strategy.
Internationalization: The level of internationalization was defined by searching on the company
website the number of countries where it has sales and manufacturing sites.
Product Range Breadth: This aspect of strategy was identified by check on websites if the
portfolio of companies included also any products produced than the antibiotics.
Corporate Social Responsibility (CSR): To understand this kind of strategy, a search was made
on the website to whether companies promote social responsibility, or if they have assigned
budget for CSR.

15
Tackling Antimicrobial Resistance (AMR): This criterion was noticed while collecting data in
regards to other strategies. Therefore, consideration of this particular type of strategy was
included. As AMR is such a major a global problem now, many companies have joined the effort
to tackle it (Access to Medicine Foundation, 2018). A website for the members of the “AMR
Industry Alliance”, (AMR Industry Alliance, 2019), has been checked, and if a company was not
found in the that website, its website and annual report were checked for information about its
strategy in relation to AMR.
Criteria for strategic groups:
All investigated strategies above are being considered as strategic dimensions that can be analyzed
and form strategic groups. As the formulation of these strategic grouping depends heavily on the
results of the first part of the second research question, this thesis considered no predetermination
of specific dimensions to be considered (i.e., considering both product breadth and vertical
integration, with four possible strategic groups: high Vert integration & broad product range; low
vertical integration & narrow product range; high vertical integration & narrow product range;
low vertical integration and broad product range) in advance.
In this research, a strategic group can form if four or more companies conduct the same strategies.
One strategic group can be formed if companies conduct all the 7 strategies investigated above,
another one can be formed if another group of companies deploy 6 similar strategies, a third group
may appear using 6 or 5 other strategies.
Data Analysis This is a qualitative and descriptive research that was applied also on quantitative data such as
numbers of sales / market share/market size. For this qualitative analysis coding was used as
analysis technique.
A table of both the 20 selected companies and the 7 investigated strategies is going to be drawn.
If a company meets the criteria mentioned above in regards to a specific strategy, then X is added
in the related box, if not then NO is added, finally if there is no information available then NA is
added.
When looking at the table vertically, the most strategy that has Xs is the main strategy deployed,
and the less strategy has Xs, the less significant it is, and by that the first part of the second
question can be answered. And when looking at the table horizontally, companies (4 or more)
that have exact Xs, NOs and NAs, form a strategic group, and by that the second part of the second
research question can be answered.
4.5 Research Constraints
Research Limitation
The main limitation for this research is that the data collected is secondary data, with assistance
from an expert in antibiotics supply chain. In addition, this research is a general analysis of the
global antibiotic supply sector, which did not allow to conduct detailed interviews from actual
companies representing the antibiotics supply market in different countries, given the time and
resource constraints for this magister thesis.

16
Research Delimitations
The main databases for market research for antibiotics are
• IQVI MIDAS database (MIDAS, 2019), which is the main database were companies and
other organizations build their reports from, such as Sun pharma annual report.
• The second database is ITC analysis (ITC Market analysis, 2018), which is used to
create for instance several WHO reports.
However, these databases were not fully accessible due to their costly access, which limited the
possible analyses.
Through analyzing the data collected, it was concluded that there were some gaps that this
research could not shed lights on, such as the actual market size and market share of specific
antibiotics producers, and the concentration of the market.
4.6 Ethics
According to Bryman (2014), there are for four different aspects that should be regarded in
research ethics: (1) risk of harm to participant, (2) lack of informed consent, (3) invasion of
privacy and (4) deception, when gathering primary data. As this research has not conducted
interviews, only email correspondence, these ethical aspects did not represent a major issue.
To cover the second and forth aspects, lack of informed consent and deception, the expert has
been informed about the purpose of the research, how his contribution will be used. To cover the
third aspect, invasion of privacy, the expect have been asked whether it was possible to use his
name in the research or not, which he agreed on.

17
5. Empirical Study
This chapter addresses the data collected from companies' websites, annual reports, and other
organizations, as well as email correspondent with Dr. Bo Lassen from Rise Research Institutes
of Sweden.
This chapter is divided into three sections. The first section introduces the pharmaceuticals
industry supply chain structure and major companies. These are the companies with the highest
reported revenues worldwide in a given year.
The second section presents the findings of the structure of the antibiotics supply sector,
and the third section focuses on the strategies of the selected players on the antibiotics supply
sector.
5.1 Introduction
As mentioned previously, the pharmaceutical industry as a whole is a highly complex industry,
and as part of this industry, the antibiotics market is assumed to be complex as well.
Before narrowing the research focus on the antibiotics supply sector, the research would
have a look at the pharmaceuticals supply chain structure holistically, which Figure 6 illustrates.
This research adopts the pharmaceuticals supply chain structure from Huq et al (2016).
The supply chain starts from the research and development (R&D) after the drug has been tested
and granted the approval, the process starts preparing raw materials, then the manufacturing stage
which consists of two steps, manufacturing the Active Pharmaceutical Ingredients (API) and then
the formulation stage, followed by the packaging stage and the distribution to intended customers.
Figure 6 Pharmaceuticals supply chain structure, adapted from (Huq et al, 2016)
To build the big picture of the global structure of the antibiotics supply sector, and for better
analysis, and as big revenue equals big market share (The State of Queensland, 2017). This
research highlights big pharmaceutical companies that generated above 20 Billion 2018 USD as
illustrated in figure 7.
Additionally, one can focus on the big manufacturers of the pharmaceutical industry. No revenue
information could be found, though one report as in table 5 has listed the top 30 manufacturing
pharmaceutical companies.

18
Figure 7 Big Pharma in the World 2018
Source (World’s Top 10 Pharmaceutical Companies by Revenue, 2019)
Number Company Number Company
1 Catalent 17 Siegfried
2 Patheon 18 Corden
3 Baxter 19 Recipharm
4 AbbVie 20 Aesica
5 Lonza 21 Nipro
6 Pfizer 22 Daito
7 Lonza 23 Teva API
8 Evonik
Degussa
24 Esteve Quimica
9 Royal
DSM
25 Euticals
10 Boehringer
Ingelheim
26 Zhejiang Hisun
Pharmaceuticals
11 Fareva 27 Zhejiang
Huahai
Pharmaceuticals
12 Aenova 28 Shandong
Xinhua
Pharmaceuticals
13 Famar 29 Aurobindo
Pharma
14 Vetter 30 Divis
Laboratories
15 Almac 31 Dr. Reddy’s
Laboratories
0.000
10.000
20.000
30.000
40.000
50.000
60.000
Revenue - USD Billion
19
16 Delpharm
Table 5 Top 30 manufacturing pharmaceuticals Companies
Source (Top 30 pharmaceutical contract manufacturing organizations, 2017)
The essential notice here between figure 7 and table 5, is that the biggest revenue generating
companies in pharma industry are not necessarily the biggest manufacturers: hence a lot of
outsourcing occurs in the industry.
5.2 The Antibiotics Supply Sector
The market size of antibiotics is estimated to around 42 billion USD (Antibiotics market, 2019;
Antibiotics Market – Growth, 2019; Business Wire, 2019).
Due to lack of empirical data about the detailed antibiotics sales, revenues and market shares by
single companies, this research considers other five different available data (dimensions) to help
define the structure of the antibiotics supply sector.
Following, the five dimensions considered to gather information about the antibiotics market:
The structure of the supply chain for the antibiotics market,
The global trade of antibiotics (exporting and importing nations)
The consumption of antibiotics,
The sales for branded and unbranded pharmaceuticals
Websites reports identifying the major players in the antibiotics supply sector
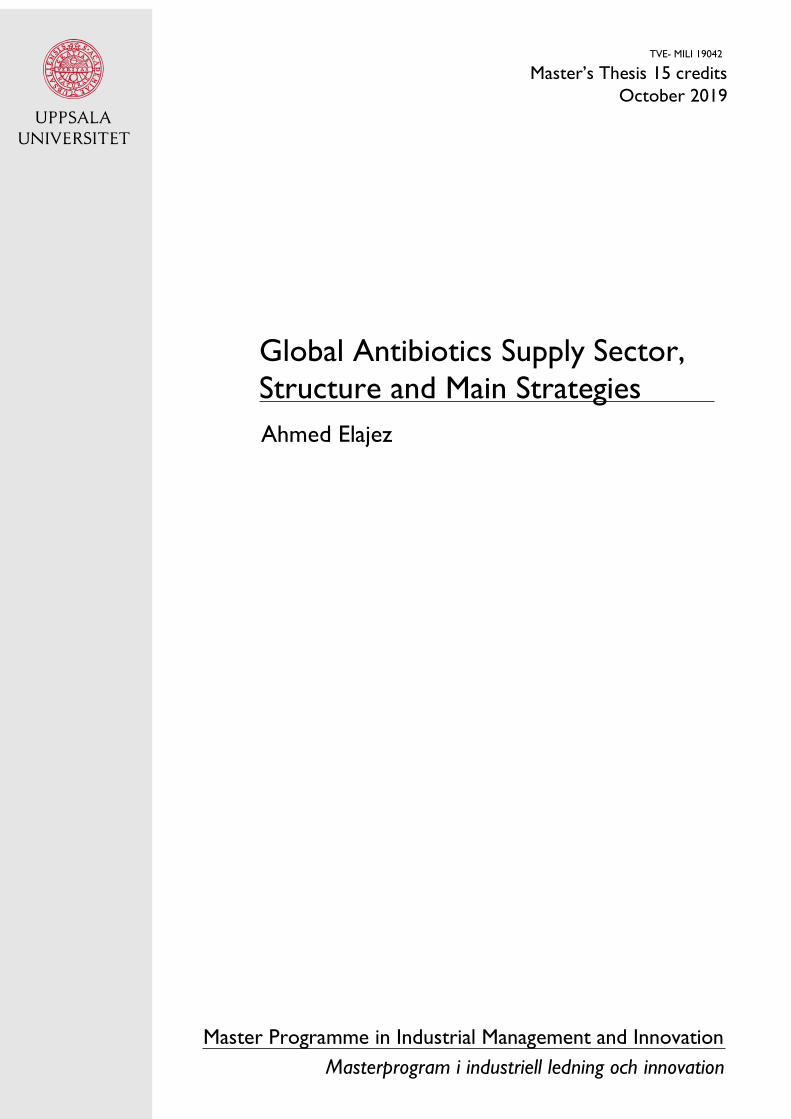
Antibiotics Supply Chain Structure
According to Dr. Bo Lassen from the Swedish research institute in RISE (interview, 2019), the
supply chain for antibiotics is as showcased in figure 8. The stages are from raw materials to API
manufacturing, then drug product manufacturing, and the distribution to both wholesalers and
pharmacies.
Figure 8 Antibiotics supply chain structure
Source Dr. Bo Lassen
Another perspective of the supply chain can be seen in the illustration by Francisco Blanco
(WHO Meeting report 2018, p.6) as in figure 9.
Based on the WHO Meeting report (2018), antibiotics can be manufactured by different
manufacturing setups, fully integrated companies controlling the whole production line from raw
materials to end customers, including being the market authorization holder (MAH). Other

20
companies can be part of the chain as only MAH or only contract manufacturing and development
organization (CMDO).
Figure 9 Antibiotics manufacturing
Source (Meeting report 2018, p.6)
Antibiotics Global Trade View
The second dimension is to look at the global trade for the antibiotics for both exports as in
figure 10 and imports as in Figure 11.
Figure 10 Antibiotics exporters
Source (ITC Market analysis, 2018)

21
As shown in figure 10, the biggest exporter of antibiotics is China with 31% of total world exports,
then Switzerland 12.9%, then Italy with 8.5 %, India 7.7 %, Netherlands 6.2%, and the USA is
5.1%.
These numbers can give an idea of how big that country is in also producing, i.e., not only
exporting, antibiotics. Even if there will be some countries that produce mostly for domestic use,
i.e., do not export, can be connected to the biggest antibiotic producing companies which are also
from China and Switzerland.
Figure 11 Antibiotics Importers
Source (ITC Market analysis, 2018)
As shown in figure 11, the biggest importers of antibiotics is India with 11.1% of total world
imports, then Italy 11%, then Germany with 7.1 %, USA 6.8 %, France 6.2%, and the
Netherlands is 5.7%.
From figure 10 and 11, it can be noticed that Italy is also a big import country, next to
being also a big export country, yet Italy population is not so big to motivate them being number
two importers in the world. Hence, a lot of antibiotics going to Italy also go out (are re-exported),
maybe there were API used to produce new antibiotics or simply rebranded and checked for the
European markets. The same can be also noticed for the Netherlands.
Antibiotics Global Consumption
The third dimension focuses on global antibiotics consumption, which can be illustrated as in
figure 12. Each bar reflects the total consumption in the specified year for that country or group
of countries. The biggest consuming country is India followed by China and the US.

22
Figure 12 Global antibiotic consumption by country income classification: 2000–2015.
Source (Klein et al 2018, p.4)
When bringing together the three previous figures (figure 10, 11, and 12) global antibiotics
exports, imports and consumption, China appears as a big global exporter and consumer, but not
importer: it means that a big part of its production is going to the local market as finished products.
Therefore, overall China can be considered as the major antibiotics’ producer, for both finished
antibiotics and APIs.
Sales Numbers of Pharmaceuticals
The fourth dimension concerns antibiotics sales by single companies, which was found only for
unbranded generics. Table 6A shows the top ten companies with unbranded generics. TEVA,
MYLAN, and NOVARTIS are the top three in regards to the market share with 13.3%, 10.7%,
and 7.8% respectively. It was also found data about the top ten companies by unbranded generics
dispensed Rx (prescription) as in table 6 B), where TEVA, MYLAN, and NOVARTIS are the top
three in regards to the market share with 14.5%, 8.1%, and 6.1% respectively.
From these two tables (6A and 6B), it’s clear that Teva, Mylan, and NOVARTIS are the top
companies for both prescribed and unprescribed unbranded generics.
Table 6 A) Top 10 Corporations by Unbranded Generic, B) Top 10 Corporations by Unbranded Generic Dispensed Rx
Source (Long, 2018, p.30,33)
A B

23
It’s important also to note that these mentioned unbranded generics products here are not only
antibiotics, and that among the sales of the companies in the lists above, only two of the largest
selling products are antibiotics: (see table 7 AZITHROMYCIN, and AMOXICILLIN), which are
both in the generic version sold by TEVA.
Linking together the tables (6A,6B and 7), Teva appears as a major market authorization holder
in the unbranded generic antibiotics.
Table 7 Top 10 Unbranded Generic Products by Dispensed Rx by Corporation
Source (Long, 2018, p.36)
Antibiotics Players
The fifth and final dimension to build the structure of the antibiotics supply sector is described
through reports about the top players from a revenue point of view. Some reports identify the
players but do not provide sufficient data on the exact numbers of sales nor revenue (e.g., Top
API Manufacturers, 2019). In particular, the top API manufacturers are in order TEVA API, Dr.
Reddy's Laboratories Ltd, Aurobindo, Cipla, Novartis-Sandoz, Ranbaxy, and Sun Pharma.
Another report (Top 25 Antibiotic Drugs Manufacturers 2018) mentions the top 25 antibiotics
manufacturers as noted in table 8.
Region Company
USA Pfizer
Merck & Co
Johnson & Johnson
Cubist Pharmaceuticals:
Abbott Laboratories:
Eli Lilly & Co.:
Melinta Therapeutics
In Europe, Novartis
GlaxoSmithKline
Bayer
Allergan
Roche
Sanofi

24
STADA Arzneimittel
In Japan Shionogi & Co., Ltd
Taisho Pharmaceutical Holdings
Daiichi Sankyo
Meiji Holdings Company, Ltd.
Astellas Pharma
other
countries
Sun Pharmaceutical Industries
Cipla
Lupin
Shanghai Pharmaceuticals Holding
TaiGen Biotechnology
Table 8 Top 25 antibiotics manufacture
Source (Top 25 Antibiotic Drugs Manufacturers 2018, 2018)
Selected Companies
To narrow down the scope of analysis, this research focuses on the following 20 pharmaceutical
companies representing the antibiotics supply sector. The selection criteria to single out these 20
companies are the following: they all are large revenue companies (Figure 6 and Tables 6 and 7),
the nature of their operations in the antibiotics supply sector (Tables 5 and 6) and their
geographical regions (Figures 10, 11, 12 and Table 8). Please see Table 9 for the complete list,
the companies are listed in an alphabetical order.
No. Company
1. AbbVie
2. Aenova
3. Almac
4. Cipla
5. Delpharm
6. Dr. Reddy’s Laboratories Ltd
7. GSK
8. Lonza
9. Merck and Co
10. Mylan
11. Novartis-Sandoz
12. Pfizer
13. Recipharm
14. Roche
15. Sanofi
16. Sun Pharma
17. Teva
18. Zhejiang guobang pharmaceutical co., ltd
19. Zhejiang Hisun Pharmaceuticals Co. Ltd.
20. Zhejiang Huahai Pharmaceuticals
Table 9 The 20 selected antibiotics companies

25
Company
5.3 Companies’ Strategies
The data collected about the strategies for the selected companies focused on two data sources:
the company website and their annual report. Please see Appendix 1, for the selected companies
with their respected websites and annual reports. The criteria for identifying these strategies have
been discussed previously in the methods section. The strategies identified for each company can
be illustrated in table 10.
Table 10 The strategies of the 20 selected companies (X: applied strategy, NO: Not applied strategy, NA: no information available)
Str
ateg
y
Over
all
Cost
lea
der
ship
Dif
fere
nti
ati
on
Ver
tica
l
Inte
gra
tion
Cap
ab
ilit
y D
evel
op
men
t
Inte
rnati
on
ali
zati
on
Prod
uct
Ran
ge
Bread
th
Corp
orate
Socia
l R
esp
on
sib
ilit
y
(CS
R)
Tack
lin
g A
MR
Bra
nded
Gen
eric
s
AP
I
PM
CM
O
MA
H
Dr. Reddy’s
Laboratories Ltd
X X X X X X X X X X N
Cipla X X X X NO X X X X X X
Sun Pharma X X X X NO X X X X X NO
Zhejiang guobang
pharmaceutical co., ltd
X X X X NO X NA X X X NO
Zhejiang Hisun
Pharmaceuticals Co.
Ltd.
X X X X NO X X X X X NO
Zhejiang Huahai
Pharmaceuticals
X X X X NO X NA X X X NO
Teva X X X X NO X X X X X X
Novartis-Sandoz X X X X NO X X X X X X
Mylan X X X X NO X X X X X X
Recipharm X X X X NO X X X X NO
Delpharm X X X X NO X X X X NO
Roche X X X X X X X X X X X X
Sanofi X X X X X X X X X X X X
Pfizer X X X X X X X X X X X X
Merck and Co X X X X X X X X X X X X
AbbVie NO NA X X X NO X X X X X
GSK X X X X X X X X X X X X
Almac X X X X NO X X X X NO
Lonza X X X X X X X X X X NO
Aenova X X X X NO X X X X NO

26
6. Analysis
This chapter aims to analyze the empirical data in relation to the theory, and to answer the research
questions, regarding the antibiotics supply sector structure and different players’ main strategies.
6.1 Antibiotics Supply Sector structure With reference to the empirical study and the adapted framework from the State of Queensland
(2017), this section attempts to answer the first research question.
Defining the market
In the antibiotics supply sector, both branded and unbranded antibiotics are available (ITC Market
analysis, 2018). As the need for antibiotics is crucial for saving human lives and this need is
present in all countries, here we consider the global market for antibiotics.
It is instead beyond the scope of this study to dive deep into every country’s antibiotics market,
which is characterized by the fact that certain antibiotics are used in one country or region but not
in another, due to many conditions such as regulations, level of antimicrobial resistance and
culture.
When comparing the antibiotics supply chain from Dr. Lassen (figure 8) with the generic model
of the supply chain for the pharmaceutical industry (figure 6), some similarities can be seen, such
as the first stage in the antibiotic supply sector is manufacturing of API, followed by
manufacturing of the Drug Product, and then distribution, as described in the WHO Meeting
Report (2018).
Market size and market shares
The estimated market size for antibiotics is around 42 billion USD (Antibiotics market, 2019;
Antibiotics Market – Growth, 2019; Business Wire, 2019).
The empirical data available did not allow to identify the specific different players’ market
shares. On the other hand, a few reports such as the Top API Manufacturers (2019), and others
presented the main API producers and main antibiotics manufacturers (Top 25 Antibiotic Drugs
Manufacturers 2018). From these findings, it was possible to select a sample of 20 players in the
antibiotics market, shown in table 10 previously.
Sector structure and market concentration
Since lack of detailed supplier’s sales data did not make it possible to calculate the specific ratios
of the framework in the State of Queensland report (2017), the structure of the antibiotics sector
and its market concentration level was assessed through a more qualitative approach. More
precisely, a broad set of characteristics of the antibiotics market were identified as shown in table
11 in order to select which among the four classical sector types (perfect competition,
monopolistic competition, oligopoly or monopoly) apply to the antibiotics supply sector. For each
sector structure, there are specific characteristics such as, number of suppliers, and product
differentiation.

27
Table 11 Antibiotics sector’s level of market concentration
As represented in table 11, the antibiotics sector has many suppliers (Top API Manufacturers,
2019), who provide products with either some product differentiation or substantial product
differentiation (see table 10). In addition, the price determinants are estimated to be either price
as function of supply and demand, which should apply to antibiotics which present many generics
variants and can be viewed as commodities or ability to influence market prices for generics with
view producers available or patented products with unique features
The outcome from table 11, suggests that the sector structure that best describes the antibiotics
market is Monopolistic competition, or possibly an Oligopoly when it comes to unique patented
antibiotics.
When analyzing the location of the 20 main antibiotics suppliers selected, as many as 19 of them
have manufacturing activities in China or India. This is not surprising considering that, that China
exports 31% of the whole world of antibiotics (see Figure 10), and that China and India are the
two main consumers of antibiotics (see Figure 12).
This statistic puts China as the main hub of the antibiotics supply sector globally. Therefore, this
research suggests that in order to better understand the structure of the antibiotics supply sector
globally, it would be crucial to conduct a separate research on the antibiotics supply sector in
China.
6.2 Main strategies
This section attempts to answer the first part of the second research question by presenting the
strategies that were most adopted by the selected companies in the antibiotics supply sector.
Internationalization:
The most frequently identified strategy used by all companies in the antibiotics supply
sector is internationalization. All companies operate in several countries in terms of sales and
operations. This finding confirms the ideas of many authors such as Gavinelli (2016) and Grant
Antibiotics sector Perfect
competition
Monopolistic
competition
Oligopoly Monopoly
Number of
suppliers
Many Many Typically, 2 to 10 One
Product
differentiation
Homogenous
(identical)
Some product
differentiation
Substantial
product
differentiation
No close
substitutes
Price
determinants
Purely by supply
and demand
No individual
buyer or seller
can influence
market price
Price as function
of supply and
demand, and the
ability of a firm
to change more
due to product
differentiation
Ability to
influence market
prices by
restricting output
Ability to
set price
by
restricting
output

28
(2010) that companies achieve competitive advantage by spreading their operations in various
countries.
Internationalization can also be explained by that fact that infections to be treated by
antibiotics appear in several countries so that the needs on the various markets are similar.
Moreover, the pharmaceutical companies try always to add a new market to cover their high fixed
costs (e.g., for R&D if they are working with branded/patented products, whereas generics
companies they also have an advantage in selling the same product in several markets because
they also have some fixed costs for developing and launching their generic products).
Product Range Breadth:
All selected companies in this research on the antibiotics supply sector of antibiotics have
wider range of products, which includes other products than antibiotics: in this way these
companies can spread risk on several therapeutic areas so to achieve a competitive advantage to
increase or maintain their profits. This finding make sense as companies sometimes strive to
acquire more market shares, and according to the authors such as Kekre and Srinivasan (1990),
Bayus and Putsis (1999), and Moreno and Terwiesch (2017), a company’s market share increases
with wider product range.
This strategy enables to widen the probability of success by addressing several markets or market
segments: the more products a firm offers, the more customer segments it can cover, and the
higher the probability that the firm sells at the end of the day. Broader product ranges are also a
current trend in several industries such household appliances, where major players such as
General Electrics or Electrolux market several products such as washing machines, vacuum
cleaners, microwaves.
Capability Development:
Another main strategy is that the selected companies use acquisitions for capability
development. This allows to acquire continuously the resources necessary to keep a competitive
advantage. This finding aligns with Grant’s (2010) conclusion that for companies to maintain or
renew competitive advantage, continuous development of current resources and capabilities is
required as well as acquiring new ones. Acquiring new capabilities can be done throughout
mergers, acquisitions, alliances or simply fostering them internally.
Noticeably, the companies studied in this research, adapt acquisition as a widely used strategy in
order to develop or and acquire capabilities. Acquisitions have been identified at one stage or
another in all the selected company’s life cycle, except for two Chinese companies (Zhejiang
guobang pharmaceutical Co., Ltd and Zhejiang Huahai Pharmaceuticals), were no data could be
found.
Some companies tend to acquire new companies to enter new geographical markets and
expand their operations there, while others acquire new companies to widen their products
portfolio, acquisition may also occur when companies strive for cheaper production costs
locations. Acquisition also happens if governments force foreign companies to have a local
operation so that companies are forced to start a new local company or buy a it. The latter is the
first option the studied antibiotics companies tend to do.
Finally, acquisitions allow companies to move fast and hence enter new markets with
already existing clients, reduce bureaucratic burdens for starting their business and they also
enable companies to acquire technologies that otherwise need a lot of time and effort to develop.
These are among the key reasons why companies in the antibiotics market tend to use this strategy
to develop their capabilities.
29
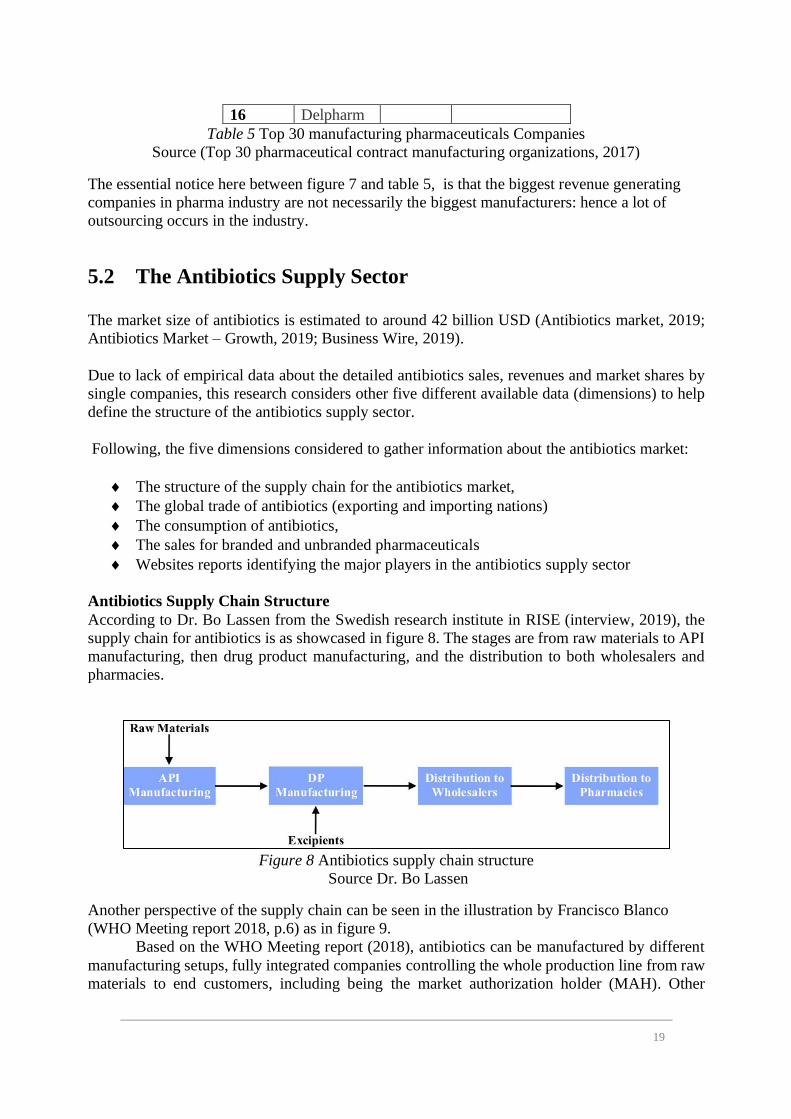
Corporate Social Responsibility (CSR):
All the analyzed companies claim that CSR is an important part of their strategy and that
they look at society as part of their responsibility. This finding aligns with Grant’s (2010) idea
that CSR is a trend for corporations in different industries in recent decades, driven by not only a
genuine search for solution to environmental and social problems but also possibly for a good
image and reputation, and for support from their constituencies in democratic states. However,
this thesis did not analyze the details of the analyzed companies’ CSR programs nor the allocated
budgets for such activities.
Overall Cost Leadership:
It was found that most of studied companies use this strategy, as they almost all have at
least one of their manufacturing locations in low-cost production countries, such as China or
India. This finding aligns with Porter’s competitive advantage idea of cost leadership. (Porter,
1980)
It is not surprising that 19 companies out of the 20 included in this study have
manufacturing activities in China or India, as companies want to keep down costs, which is easier
to achieve with factors such as lower labor costs, less stringent environmental regulations and
safety controls, next to closeness to raw materials and very large home markets for antibiotics.
Differentiation :
Differentiation is used by companies in several industries as a strategy to achieve
competitive advantage, Porter (1980). This strategy is also observed in the antibiotics supply
sector, were some companies focus on a specific segment of antibiotics: branded vs. generics.
Some companies, like Teva and Dr. Reddy’s Laboratories Ltd., produce only generic antibiotics,
while other companies, for example Pfizer and Sanofi, focus only branded and often unique
antibiotics.
Some companies, especially the established ones such as Pfizer produce both generics and
branded antibiotics, that is, they continue producing their original products also when they are no
longer covered by patent protection and have accordingly become generics
Other strategies The following strategies were applied by some companies only.
Vertical Integration:
Some companies operate using full integration, such as Teva, Mylan and Cipla. These
companies manufacture APIs, they do product manufacturing, and they hold market
authorizations. Some other companies take a step forward, as they are fully integrated and conduct
contract manufacturing for others by themselves or through their subsidiaries such as Pfizer,
Sanofi, Roche, and GSK.
Another type of companies focuses only on contract manufacturing operations such as
Recipharm, Almac, and Lonza.
This finding indicates an interesting variation in the antibiotic sector, which some companies
generating high economic value from specializing on a specific level of activities in the supply
chain and others following Mpoyi’s (2003) idea that higher levels of vertical integration allow
achieving higher the economic value.
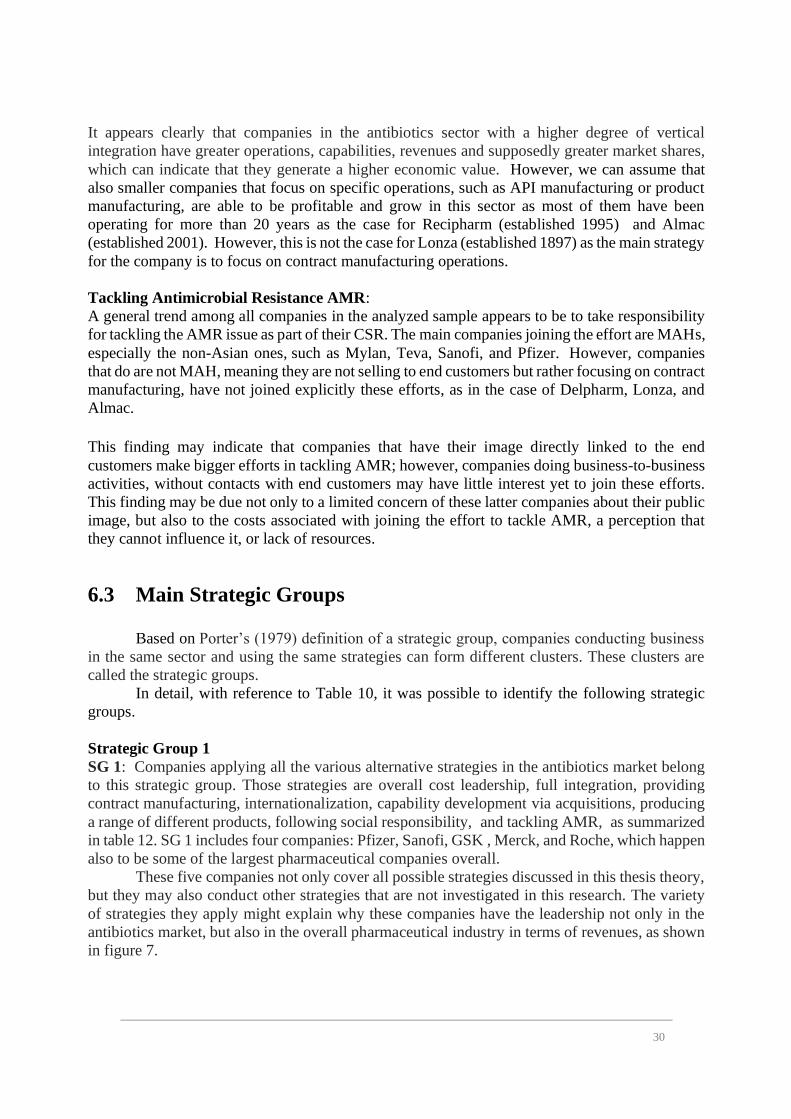
30
It appears clearly that companies in the antibiotics sector with a higher degree of vertical
integration have greater operations, capabilities, revenues and supposedly greater market shares,
which can indicate that they generate a higher economic value. However, we can assume that
also smaller companies that focus on specific operations, such as API manufacturing or product
manufacturing, are able to be profitable and grow in this sector as most of them have been
operating for more than 20 years as the case for Recipharm (established 1995) and Almac
(established 2001). However, this is not the case for Lonza (established 1897) as the main strategy
for the company is to focus on contract manufacturing operations.
Tackling Antimicrobial Resistance AMR:
A general trend among all companies in the analyzed sample appears to be to take responsibility
for tackling the AMR issue as part of their CSR. The main companies joining the effort are MAHs,
especially the non-Asian ones, such as Mylan, Teva, Sanofi, and Pfizer. However, companies
that do are not MAH, meaning they are not selling to end customers but rather focusing on contract
manufacturing, have not joined explicitly these efforts, as in the case of Delpharm, Lonza, and
Almac.
This finding may indicate that companies that have their image directly linked to the end
customers make bigger efforts in tackling AMR; however, companies doing business-to-business
activities, without contacts with end customers may have little interest yet to join these efforts.
This finding may be due not only to a limited concern of these latter companies about their public
image, but also to the costs associated with joining the effort to tackle AMR, a perception that
they cannot influence it, or lack of resources.
6.3 Main Strategic Groups
Based on Porter’s (1979) definition of a strategic group, companies conducting business
in the same sector and using the same strategies can form different clusters. These clusters are
called the strategic groups.
In detail, with reference to Table 10, it was possible to identify the following strategic
groups.
Strategic Group 1
SG 1: Companies applying all the various alternative strategies in the antibiotics market belong
to this strategic group. Those strategies are overall cost leadership, full integration, providing
contract manufacturing, internationalization, capability development via acquisitions, producing
a range of different products, following social responsibility, and tackling AMR, as summarized
in table 12. SG 1 includes four companies: Pfizer, Sanofi, GSK , Merck, and Roche, which happen
also to be some of the largest pharmaceutical companies overall.
These five companies not only cover all possible strategies discussed in this thesis theory,
but they may also conduct other strategies that are not investigated in this research. The variety
of strategies they apply might explain why these companies have the leadership not only in the
antibiotics market, but also in the overall pharmaceutical industry in terms of revenues, as shown
in figure 7.
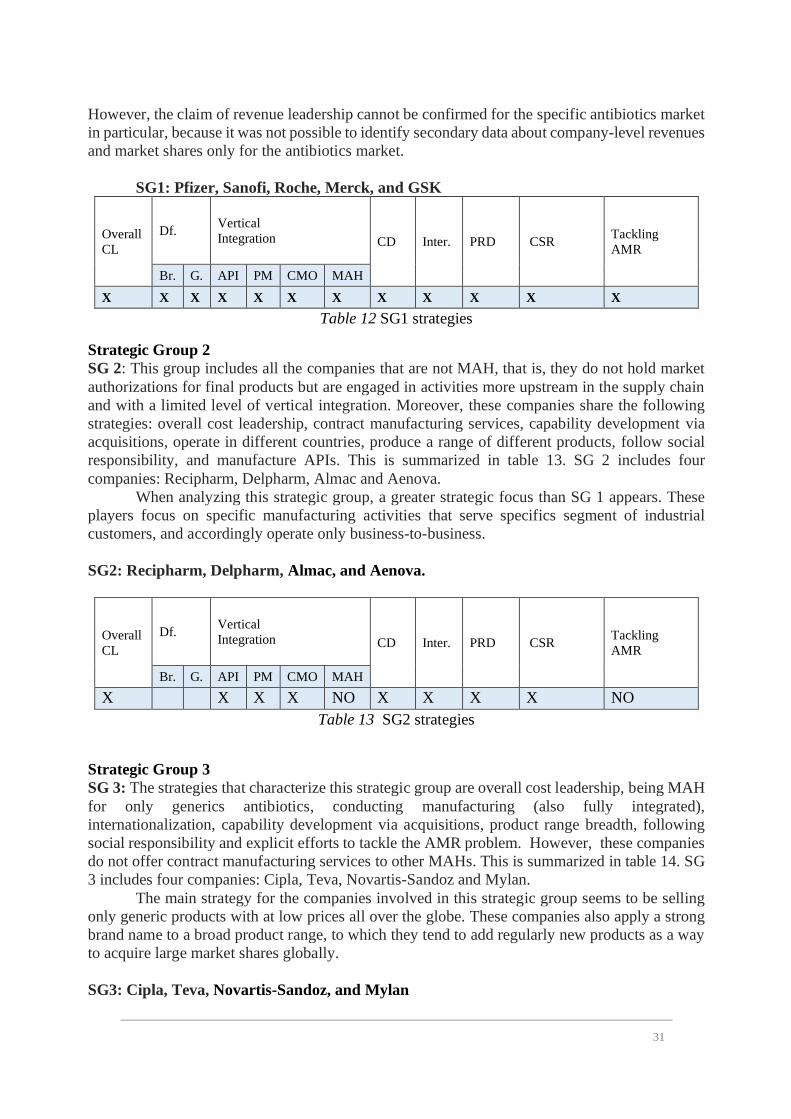
31
However, the claim of revenue leadership cannot be confirmed for the specific antibiotics market
in particular, because it was not possible to identify secondary data about company-level revenues
and market shares only for the antibiotics market.
SG1: Pfizer, Sanofi, Roche, Merck, and GSK
Overall
CL
Df. Vertical
Integration CD Inter. PRD CSR Tackling
AMR
Br. G. API PM CMO MAH
X X X X X X X X X X X X
Table 12 SG1 strategies
Strategic Group 2
SG 2: This group includes all the companies that are not MAH, that is, they do not hold market
authorizations for final products but are engaged in activities more upstream in the supply chain
and with a limited level of vertical integration. Moreover, these companies share the following
strategies: overall cost leadership, contract manufacturing services, capability development via
acquisitions, operate in different countries, produce a range of different products, follow social
responsibility, and manufacture APIs. This is summarized in table 13. SG 2 includes four
companies: Recipharm, Delpharm, Almac and Aenova.
When analyzing this strategic group, a greater strategic focus than SG 1 appears. These
players focus on specific manufacturing activities that serve specifics segment of industrial
customers, and accordingly operate only business-to-business.
SG2: Recipharm, Delpharm, Almac, and Aenova.
Overall
CL
Df. Vertical
Integration CD Inter. PRD CSR Tackling
AMR
Br. G. API PM CMO MAH
X
X X X NO X X X X NO
Table 13 SG2 strategies
Strategic Group 3
SG 3: The strategies that characterize this strategic group are overall cost leadership, being MAH
for only generics antibiotics, conducting manufacturing (also fully integrated),
internationalization, capability development via acquisitions, product range breadth, following
social responsibility and explicit efforts to tackle the AMR problem. However, these companies
do not offer contract manufacturing services to other MAHs. This is summarized in table 14. SG
3 includes four companies: Cipla, Teva, Novartis-Sandoz and Mylan.
The main strategy for the companies involved in this strategic group seems to be selling
only generic products with at low prices all over the globe. These companies also apply a strong
brand name to a broad product range, to which they tend to add regularly new products as a way
to acquire large market shares globally.
SG3: Cipla, Teva, Novartis-Sandoz, and Mylan

32
Overall
CL
Df. Vertical
Integration CD Inter. PRD CSR Tackling
AMR
Br. G. API PM CMO MAH
X
X X X NO X X X X X X
Table 14 SG3 Strategies
Strategic Group 4
SG 4: Companies in this group apply the following strategies: generics antibiotics manufacturing
(fully integrated from APIs to MAH), overall cost leadership, capability development via
acquisitions, internationalization, a wide range of products, and follow corporate social
responsibility. However, despite being MAH these companies do not produce branded antibiotics
and especially, which distinguishes them from SG 3, they do not explicitly tackle the issue of
AMR yet. These strategies are summarized in table 15.
SG4: Sun Pharma, Zhejiang Guobang pharmaceutical co., ltd, Zhejiang Hisun
Pharmaceuticals Co. Ltd. and Zhejiang Huahai Pharmaceuticals.
Overall
CL
Df. Vertical
Integration CD Inter. PRD CSR Tackling
AMR
Br. G. API PM CMO MAH
X
X X X NO X X X X X NO
Table 15 SG4 Strategies
All five companies in this strategic group are Asian companies (from China and India), and they
use the same strategies as companies in strategic group 3, but the only difference is that they do
not tackle AMR issue yet. Companies may not tackle AMR yet, due to lack of knowledge, lack
of regulations, or simply because they do not consider it a relevant issue for them. As tackling
AMR requires more investment on research and it adds costs to the operations, this can be a
further reason for not doing it for companies which are not exposed to any pressures to do it.
Dr. Reddy can belong to this strategic group, as it deploys all strategies mentioned,
however Dr. Reddy uses one more strategy by doing CMO to other MAHs.
One can stress that companies in strategic groups 2, 3 and 4 apply a wide range of strategies. All
of them apply at least five strategies. Many of these strategies applied are complementary (e.g.,
internationalization enables to increase the scope of operations, which can help further reduce
costs to attain cost leadership). Maybe relying on a set of connected strategies explains why they
maintain a competitive advantage in the market. However, as explained previously, we do not
have detailed data to determine if the companies in SG 2, 3 and 4 have reached leadership in the
antibiotics market.
These findings about the antibiotics supply sector can be related back to theory which states that
strategic groups usually form based on the degree of vertical integration, product differentiation,
and product diversification in the chemical goods industry (Shah, 2007). A similar pattern
emerges in this thesis’ research findings, as strategic groups form in the antibiotics sector based
on the degree of vertical integration and differentiation.

33
7. Discussion
The structure of the supply sector of antibiotics is complex and involves many companies
performing different kinds of operations in different regions covering the entire globe. There is a
clear lack of academic literature on the specific subject of antibiotics supply and this thesis is an
attempt to contribute to this gap and add to that missing knowledge, with a specific focus on
companies’ strategies.
This research has analyzed the structure of the antibiotics supply sector and found that it is closest
to what can be defined as “monopolistic competition” in its nature. Yet, when looking at
geographical concentration of supplies, China is certainly the main player in this market.
Many authors have stated the importance of having different strategies to achieve a competitive
advantage. In this regard, many big companies in the antibiotics sector tend to use all strategies
investigated (and potentially some other ones) to sustain competitive advantage and acquire
market leadership.
Some players focus on generics to acquire market share, while others focus on branded unique
products for which they hold patents. Yet another group of companies are contract manufacturers.
These different niches highlight that companies use a narrowed focus as a strategy to achieve
competitive advantage in the market, which can be connected to Porter’s (1980) competitive
strategies, whereby firms tend to do that to have a competitive advantage by narrowing down on
specific product segments or product lines, or indeed specific activities in the value chain.
A relevant finding is that no one of the Chinese companies included in this study and two of the
Indian companies are not involved in the global effort fighting AMR. A lack of focus on AMR
issues characterizes also of some of the companies in strategic group 2 (CMOs). This might be
due to different reasons, from lack of knowledge to not being exposed to the pressure of end
customers, or the additional costs of tackling AMR.

34
8. Conclusion
This study analyzed the structure of the antibiotics supply sector, which is part of the
pharmaceutical industry. In order to that, this research tried to answer the following questions:
1. How can the structure of the global antibiotics supply sector be described?
2. What are the main strategies used by the main players in the antibiotics supply sector
globally? And what are the main strategic groups within this sector?
This research’s results indicate that the antibiotics supply sector has a monopolistic competition
market structure, which answers the first question.
Internalization, differentiation, overall cost leadership, embracing corporate social responsibility,
capability development by acquisitions, and product range breadth were found to be the main
strategies used in the antibiotics supply sector, which answers the first part of the second question.
Finally, it was possible to observe four main strategic groups for the selected companies as an
answer for the second part of the second question. One group applies all the investigated
strategies. Another group focuses on generics as the only product they produce and/or market. An
additional group focuses on contract manufacturing services, and a final group focuses on both
generics and contract manufacturing services. Tackling AMR seems to be an important trend
among the main players in this sector; however not all companies are joining this effort yet.
An important limitation to remember about this study is that the 20 selected companies are a
chosen sample of all companies in the sector, based on specific criteria such as revenues (across
all product lines), location and nature of operations. Therefore, these 20 companies may not fully
represent the entirety of the antibiotics supply sector.
For future research, it is recommended to use the structure-conduct-performance approach
developed by Bain (1968), to better understand the antibiotics supply sector. With this paradigm
the performance of the various companies is analyzed depending on both the industrial structure
and their strategies. Another suggestion is to conduct a validation study of the research findings
obtained here once revenue data specific to the antibiotics market can be acquired. Such data
would enable to calculate exact market shares and market concertation indices.

35
9. References
Access to Medicine Foundation (2018). Antimicrobial Resistance Benchmark 2018.
retrieved from
https://accesstomedicinefoundation.org/media/uploads/downloads/5bc5edd8367eb_Antimicrobi
al-Resistance-Benchmark-2018.pdf
Antibiotics market (2019). retrieved from
https://www.alliedmarketresearch.com/antibiotics-market
Antibiotics Market – Growth (2019). retrieved from
https://www.mordorintelligence.com/industry-reports/antibiotics-market
AMR industry alliance (2019). retrieved from
https://www.amrindustryalliance.org/our-members/
Bain, J. S. (1968). Industrial organization (2.th ed.). New York
Bayus, B. L., & Putsis, W. P. (1999). Product Proliferation: An Empirical Analysis of Product
Line Determinants and Market Outcomes. Marketing Science ,18(2), 137-153.
doi:10.1287/mksc.18.2.137
Brannestam, O., & Josefsson, G. (2018). A Supply Market Analysis Framework for Test
Equipment of New Technologies.
Bryman, A. (2012). Social Research Methods 4e. Oxford, UK: Oxford University Press.
Business wire. (2019). retrieved from
https://www.businesswire.com/news/home/20190401005363/en
Cogan, D., K. Karrar and J. k. Iyer. (2018). Shortages, stockouts and scarcity: the issues
facing the security of antibiotic supply and the role for pharmaceutical companies. Access to
medicine foundation.
Davies, J., & Davies, D. (2010). Origins and Evolution of Antibiotic Resistance. Microbiology
and Molecular Biology Reviews, 74(3), 417-433. doi:10.1128/mmbr.00016-10
Long, D. (2018). Global Generic and Biosimilars Trends and Insights. Association for
Accessible Medicines. retrieved from
https://accessiblemeds.org/sites/default/files/2018-02/Doug%20Long.pdf
Huq, F., Pawar, K., & Rogers, H. (2016). Supply Chain Configuration Conundrum: How does
the Pharmaceutical Industry Mitigate Disturbance Factors?Production Planning and
Control, 27(14), 1206-1220. https://doi.org/10.1080/09537287.2016.1193911
Gavinelli, L. (2016). Business Strategies and Competitiveness in Times of Crisis A Survey on
Italian SMEs. Palgrave Macmillan UK.

36
Grant, R. M. (2010). Contemporary strategy analysis (7th ed.). Chichester: John Wiley & Sons
Ltd.
Harrigan, K. (1984). Formulating Vertical Integration Strategies. The Academy of Management
Review, 9(4), 638-652. Retrieved from http://www.jstor.org.ezproxy.its.uu.se/stable/258487
Hill AM, Barber MJ, and Gotham D. (2018). Estimated costs of production and potential prices
for the WHO Essential Medicines List BMJ Global Health ;3: e000571. Retrieved from
https://gh.bmj.com/content/3/1/e000571
Hunt, M. S. . (1972). Competition in the Major Home Appliance Industry 1960- 1970. Doctoral
dissertation, Harvard University.
ITC Market analysis (2018). Retrieved from
https://www.trademap.org/Country_SelProduct_Map.aspx?nvpm=1%7c%7c%7c%7c%7c2941
%7c%7c%7c4%7c1%7c1%7c1%7c1%7c1%7c2%7c1%7c
Klein, E. Y., Boeckel, T. P. V., Martinez, E. M., Pant, S., Gandra, S., Levin, S. A., Goossens,
H., et al. (2018, April 10). Global increase and geographic convergence in antibiotic
consumption between 2000 and 2015. Retrieved from
https://www.pnas.org/content/115/15/E3463
Kotler, P. & Keller, K. L. (2012). Marketing Management
Lancaster K. (1990). The economics of product variety: A survey. Marketing Sci. 9(3):189–206.
Lobermeyer, M., & Kotzab, H. (2010). SMA –the supply market analysis-framework
for analysing supply markets within the strategic sourcing process. Supply management
Research, 247–262.
Market (2019). In Encyclopædia Britannica. Retrieved from https://academic-eb-
com.ezproxy.its.uu.se/levels/collegiate/article/market/109822
MIDAS (2019). Retrieved from
https://www.iqvia.com/solutions/commercialization/geographies/midas
Mintzberg, H. (1987). The strategy concept I: Five Ps for strategy. California Management
Review, 30 (Fall), 11–20.
Moreno, A., & Terwiesch, C. (2017). The Effects of Product Line Breadth: Evidence from the
Automotive Industry. Marketing Science,36(2), 254-271. doi:10.1287/mksc.2016.0979
Mpoyi, R. T. (2003). Vertical integration: Strategic characteristics and competitive implications.
Competitiveness Review, 13 (1), 44–55.
O'Gorman, K. D. P., & MacIntosh, R. P. (2015). Research methods for business and
management : A guide to writing your dissertation. Retrieved from
https://ebookcentral.proquest.com

37
Porter, M. (1979). The Structure within Industries and Companies' Performance. The Review of
Economics and Statistics, 61(2), 214-227. doi:10.2307/1924589
Porter, M. E. (1980). Competitive strategy. Techniques for analyzing industries and
competitors. New York: Free Press.
Porter, M. E. (1985). Competitive advantage: Creating and sustaining superior performance.
New York: Free Press.
Porter, M. E., & Kramer, M. R. (2006). Strategy & Society: The Link Between Competitive
Advantage and Corporate Social Responsibility. Harvard Business Review, 84(12), 78–92.
Retrieved from https://search-ebscohost-
com.ezproxy.its.uu.se/login.aspx?direct=true&db=bth&AN=23081414&site=ehost-live
Shah, A. (2007). Strategic Groups in Retailing Based on Porter’s Generic Market Based
Strategies. Marketing Management Journal, 17(1), 151–170. Retrieved from
http://search.ebscohost.com/login.aspx?direct=true&db=buh&AN=25657484&site=eds-
live&scope=site
Saunders, M., Lewis, P., & Thornhill, A. (2009). Research methods for business students (5th
ed.). Harlow: Financial Times Prentice Hall.
The State of Queensland (2017). Procurement guide: Supply market analysis. Retrieved from
http://www.hpw.qld.gov.au/SiteCollectionDocuments/ProcurementGuideSupplyMarketAnalysis
Top API Manufacturers (2019). Retrieved from
http://www.mdtvalliance.org/top-api-manufacturers/
Top 25 Antibiotic Drugs Manufacturers 2018 ( 2018). Retrieved from
https://www.reportlinker.com/p05482466/Top-25-Antibiotic-Drugs-Manufacturers.html
Top 30 pharmaceutical contract manufacturing organizations (2017). Retrieved from
https://gmpnews.net/2017/02/top-30-pharmaceutical-contract-manufacturing-organisations/
Van Weele, A. J. (2010). Purchasing and supply chain management: Analysis, strategy,
planning and practice (5th ed.). Cengage Learning EMEA.
WHO Meeting Report (2018). Antibiotic Shortages: Magnitude, Causes and Possible Solutions.
Norwegian Directorate of Health, Oslo, Norway 10-11 December 2018. Geneva, World Health
Organization; 2019. WHO/MVP/EMP/IAU/2019.02
World’s Top 10 Pharmaceutical Companies by Revenue (2019). Retrieved from
https://www.marketresearchreports.com/blog/2019/01/30/world’s-top-10-pharmaceutical-
companies-revenue
Zsidisin, G. A., Hartley, J. L., Bernardes, E. S., & Saunders, L. W. (2015). Examining supply
market scanning and internal communication climate as facilitators of supply chain integration.
Supply Chain Management: An International Journal, 20 (5), 549–560.

38
10. Appendices
10.1 Appendix 1 A) Selected companies’ websites. (All accessed 29 may 2019)
No. Company Website
1. Dr. Reddy’s Laboratories Ltd https://www.drreddys.com
2. Cipla https://www.cipla.com
3. Sun Pharma https://www.sunpharma.com
4. Zhejiang guobang
pharmaceutical co., ltd
http://www.gbpharm.com/about_en/id/13.html
5. Zhejiang Hisun
Pharmaceuticals Co. Ltd.
http://www.hisunpharm.com/en/about.html#about_
hz
6. Zhejiang Huahai
Pharmaceuticals
http://en.huahaipharm.com/dsj/index.aspx
7. TEVA https://www.Tevapharm.com/about/history/
8. Novartis-Sandoz https://www.sandoz.com/our-work/disease-
areas/anti-infectives
9. MYLAN https://www.Mylan.com/en/about-Mylan
10. Recipharm https://www.recipharm.com
11. Delpharm http://www.delpharm.com/en/production/geograph
ical-coverage/
12. Roche https://www.roche.com/investors/rofis.htm
13. Sanofi https://www.activeingredientsolutions-
sanofi.com/en/api-sales
14. Pfizer https://www.pfizer.com/files/investors/financial_re
ports/annual_reports/2016/our-business/global-
businesses/pfizer-essential-health/index.html
15. Merck and Co http://www.msd.com/about/home.html
http://www.merckmillipore.com/SE/en/products/iv
d-oem-materials-reagents/contract-manufacturing-
services/MKWb.qB.GdIAAAE_Mhd3.Lxj,nav
16. AbbVie https://www.abbviecontractmfg.com/services/phar
maceutical-ingredients/bulk-api-contract-
manufacturing.html
17. GSK https://www.gsk.com
18. Almac https://www.almacgroup.com/about/
19. Lonza https://www.lonza.com
20. Aenova https://www.aenova-group.com/en/global-
presence-made-europe-0

39
B) Selected companies’ annual reports links. (All accessed 31 may 2019)
No. Company Annual reports
1. Dr. Reddy’s Laboratories Ltd https://www.drreddys.com/media/648012/annual-
report-fy2018-for-website.pdf
2. Cipla https://www.cipla.com/uploads/investor/15000332
15_Annual%20Report%202016-17.pdf
3. Sun Pharma https://www.sunpharma.com/sites/default/files/ann
ual/Sun-Pharma-Annual-Report-FY18.pdf
4. Zhejiang guobang
pharmaceutical co., ltd
NA
5. Zhejiang Hisun
Pharmaceuticals Co. Ltd.
NA
6. Zhejiang Huahai
Pharmaceuticals
NA
7. Teva https://www.Tevapharm.com/files/Teva__Form_1
0-K_2017.pdf
8. Novartis-Sandoz https://www.novartis.com/sites/www.novartis.com/
files/novartis-annual-review-2018-low-res-en.pdf
9. Mylan http://investor.Mylan.com/news-releases/news-
release-details/Mylan-reports-fourth-quarter-and-
full-year-2018-results-and
10. Recipharm https://www.recipharm.com/sites/default/files/medi
a/Recipharm_Annual_report_2017.pdf
11. Delpharm NA
12. Roche https://www.roche.com/dam/jcr:af865dfd-50fb-
458b-9cac-34097db9d3ec/en/ar18e.pdf
13. Sanofi https://www.sanofi.com/-/media/Project/One-
Sanofi-Web/Websites/Global/Sanofi-
COM/Home/en/investors/docs/Sanofi-RI2018-EN-
PDF-e-
accessible_02.pdf?la=en&hash=C34A3B2E94788
2F0D7790AE33612674D9B832670
14. Pfizer https://s21.q4cdn.com/317678438/files/doc_financi
als/Annual/2018/2018-Financial-Report.pdf
15. Merck and Co http://www.annualreports.com/HostedData/Annual
Reports/PDF/NYSE_MRK_2017.pdf
16. AbbVie https://investors.abbvie.com/static-files/47b78f29-
de86-46fd-ae82-83878c1a72f1
17. GSK https://www.gsk.com/media/5349/annual-report-
2018.pdf
18. Almac NA
19. Lonza https://annualreport.lonza.com/2018/servicepages/
downloads/files/entire_lonza_ar18.pdf
20. Aenova NA
NA: Not Available