Embed Size (px)
Citation preview

RESEARCH ARTICLE Open Access
Anthropometric, physiologicalcharacteristics and rugby-specific gameskills of schoolboy players of different agecategories and playing standardsMatthew Chiwaridzo1,2* , Gillian D. Ferguson1 and Bouwien C. M. Smits-Engelsman1
Abstract
Background: Rugby is increasingly gaining popularity among school-aged male junior players in countries hardlyknown for dominating international rugby, such as Zimbabwe. Given rugby combativeness, participatingadolescents should possess qualities or skills commensurate with the physical demands of the sport for effectiveparticipation. This study investigated the independent and interactive effects of age category and playing standardon anthropometric, physiological characteristics and rugby-specific game skills among Zimbabwean athletes.
Methods: Two hundred and eight elite, sub-elite and non-rugby players competing at Under 16 and Under 19 agecategories were assessed using the School Clinical Rugby Measure (SCRuM) test battery. Participants underwentheight, sitting height, mass, skinfolds, speed, agility, upper-and-lower muscular strength and power, prolongedhigh-intensity intermittent running ability, tackling, passing and catching assessments in a cross-sectionalexperimental design.
Results: Age categories had significant main effect on all SCRuM test items except sum of seven skinfolds (p = 0.45,η2p = 0.003). Playing standard had significant main effects for all variables except height (p = 0.40, η2p = 0.01) andsum of seven skinfolds (p = 0.11, η2p = 0.02). Specifically, upper-and-lower muscular strength and power, prolongedhigh-intensity intermittent running ability, tackling, passing and catching improved with increasing playingstandards. However, two-way analysis of variance only demonstrated significant interactions between the effects ofage category and playing standards for vertical jump height (VJ) test, 2-kg medicine ball chest throw (2-kg MBCT)test, Yo-Yo intermittent recovery test level 1 (Yo-Yo IRT L1), and tackling and catching tests. Yo-Yo IRT L1, VJ,tackling and catching tests demonstrated greater discriminative ability among Under 16 s, whereas the 2-kg MBCTtest showed better ability in Under 19 s.
Conclusion: All SCRuM variables except skinfolds improved with age, highlighting relative sensitivity indifferentiating older from younger athletes. However, the discriminative ability by playing standards for VJ, 2-kgMBCT, Yo-Yo IRT L1, tackling and catching ability tests was age-dependent. These findings informs on generalattribute development in junior rugby players with age and on specific players attributes in need of monitoring forattainment of elite status at U16 or U19 level.
Keywords: Adolescents, Rugby union, Anthropometric, Physiological, Rugby-specific game skills
© The Author(s). 2020 Open Access This article is distributed under the terms of the Creative Commons Attribution 4.0International License (http://creativecommons.org/licenses/by/4.0/), which permits unrestricted use, distribution, andreproduction in any medium, provided you give appropriate credit to the original author(s) and the source, provide a link tothe Creative Commons license, and indicate if changes were made. The Creative Commons Public Domain Dedication waiver(http://creativecommons.org/publicdomain/zero/1.0/) applies to the data made available in this article, unless otherwise stated.
* Correspondence: [email protected] of Health Sciences, Department of Health and RehabilitationSciences, Physiotherapy Division, Observatory, University of Cape Town, CapeTown, South Africa2College of Health Sciences, Rehabilitation Department, University ofZimbabwe, P.O Box A178, Avondale, Harare, Zimbabwe
Chiwaridzo et al. BMC Sports Science, Medicine and Rehabilitation (2020) 12:3 https://doi.org/10.1186/s13102-019-0155-3

BackgroundWorldwide, burgeoning talent identification (TID) andlong-term player development programmes have seen anincreased number of male adolescents playing rugbyunion (rugby, RU) [1, 2]. Regardless of playing standardand age category, adolescent RU is a highly demandingphysical and skill-based sport characterised by intermit-tent execution of high-intensity activities such as sprint-ing and tackling [3–7]. As such, adolescents playingcompetitive rugby require well-developed physical orphysiological qualities and game skills for effective par-ticipation. Accordingly, RU coaches are constantly seek-ing knowledge on junior players’ attributes linked toelite performance and how these attributes evolve withage for the maintenance of team success.A plethora of studies have investigated the independ-
ent effects of age category or playing standard on testperformances of junior rugby players. However, withjunior athletes’ performances likely to be determined bythe complex interaction of a number of factors such asage and training-related factors, there seems to be lim-ited understanding of the interactive effect of age cat-egory and playing standard on development of juniorrugby players’ attributes. This knowledge providesinsight into the combined effect of age and training ef-forts on performance differences for rugby players of dif-ferent playing standards, information which has specificimplications on training and player development acrossvarious age categories and competitive levels.Variably, anthropometric, physiological characteristics
and game skills have been shown to improve across an-nual age categories [1, 8–11]. For example, Darrall-Joneset al., [11] showed that body mass and height, but notskinfolds, of elite RU players increased significantlyacross Under 16 (U16), U18 and U21 age categories.Durandt et al., [8] showed that elite U18 RU players hadbetter scores for upper-body muscular strength and aer-obic fitness compared to elite U16 s, but not for speedand agility. Catching and passing-for-accuracy abilitieswere shown to increase from U16 s to U18 s for eliteadolescent RU players [9]. Collectively, most of thesestudies provide vital information on performance differ-ences of elite RU players across age categories, highlight-ing the primary influence of age or maturity-relatedfactors in attribute development. The age category dif-ferences may allow coaches to monitor development ofphysical and technical attributes and adopt effectivetraining strategies and programmes that minimise per-formance gaps between players of different age categor-ies assisting with smooth developmental transition [10].However, given the possibility that performance differ-ences between younger and older athletes are likely tobe related to growth and development-related processregardless of playing standard or sport, the common
limitation with these studies has been the lack of a con-trol group possibly including sub-elite rugby players orage-matched male adolescents playing a different sport.Possibly, this would allow for a comparative understand-ing of the relative effect of age category on performancedifferences across varying playing standards or sports.Previous studies investigating the influence of playing
standard on RU players attributes have established thatanthropometric, physiological characteristics and gameskills improve with increasing playing standards [12–16].Body mass was greater in elite U16 RU athletes from acountry known to have higher rugby playing standardscompared to elite U16 players derived from a countryknown to have relatively lesser rugby standards [16].Jones et al., [12] showed that upper-body muscularstrength, 40-m speed, and aerobic fitness contribute tohigher playing standard of U18 academy players whencompared to lower-level U18 schoolboy rugby players.However, conflicting results have been reported for sumof skinfold thickness measurements [16–20]. In relatedintermittent sports, lower-body muscular power andagility discriminated U16 elite from sub-elite soccerplayers [21], whilst elite U16 rugby league (RL) playershad better speed, agility, and aerobic capacity comparedto sub-elite players [22]. The influence of differing play-ing standards on player performances may facilitate un-derstanding of specific attributes important for theattainment of elite status, creating a strong foundationfor launching targeted training interventions and TIDinitiatives in junior rugby. Although providing helpfulinformation in identifying important characteristics forelite performance at a distinct age category, the above-cited studies largely assume that junior rugby players’performances are mainly influenced by differing playingstandards or training-related exposures [23], and ignorebiological maturation effects, age-related changes andpossible interaction effects between age category andplaying standards on performance outcomes.With longitudinal studies hinting on different rates of
attribute improvement for players depending on playingabilities and age category [24, 25], it is plausible to hy-pothesise for significant interactions between age cat-egory and playing standard on test performances forathletes. However, it is unclear from previous cross-sectional studies whether age-category differences aresimilar or different across playing standards and howthese differences would compare if competitive rugbyplayers are compared to age-matched non-rugby playersplaying a different competitive sport. Therefore, compar-ing anthropometric, physiological characteristics andgame skills, the current study examined the independentinfluence of age category (U19 s vs. U16 s), playingstandard (elite vs. sub-elite vs. non-rugby) and the inter-action effects (age-category × playing standard) on test
Chiwaridzo et al. BMC Sports Science, Medicine and Rehabilitation (2020) 12:3 Page 2 of 15

performances for young schoolboy athletes. Basedmainly on the review findings of Till et al. [19] andspecific literature findings on rugby-specific game skills[1, 9], it was hypothesised that:
(i) Anthropometric (except for sum of skinfolds whichwould remain stable), physiological characteristicsand skill ratings would improve with increasing agecategory.
(ii) Anthropometric, physiological characteristics andrugby-specific game skills would improve with in-creasing playing standard.
(iii)There would be significant interactions between theeffects of age-category and playing standards on testperformances.
MethodsStudy design, research setting and participantsTo test study hypotheses, a cross-sectional design wasemployed to compare participant performances basedon the School Clinical Rugby Measure (SCRuM) testbattery. The processes involved in developing the testbattery have been explained elsewhere [26–30]. Twohundred and eight (208) schoolboys participated in thisstudy and were derived from three different schools.Elite U16 (n = 41) and U19 (n = 41) rugby players wererecruited from one state school based in Harare,Zimbabwe playing competitive rugby in the SESRL. TheSESRL is the most competitive schoolboy rugby leaguein the country [26]. The school was purposively-selectedsince they were the defending champions and had wonthe SESRL thrice in the last five seasons. All sub-eliteparticipants (U16 = 41, U19 = 46) were recruited from aHarare-based private school playing rugby in the CESRL.The CESRL represents a second-tier schoolboy rugbyleague in Zimbabwe [26]. Cricket players (U16 s = 29,U19 s = 21) represented the non-rugby playing groupand were recruited from one of the “top” cricket-playingstate high schools based on 2018 provincial inter-scholastic competitions. The justification for includingcricket players involved incorporating a second com-parative, convenient group of schoolboy athletes playinga competitive sport known to have different physical andtechnical demands than rugby [31]. All invited playerswere informed on the study purpose, test procedures,risks and benefits for participating. Ethical approval wassought and granted by the Human Research EthicsCommittee (HREC) from the University of Cape Town.Written informed consent and assent were obtainedfrom parents and players, respectively.
ProcedureAll tests were conducted in the order described inAdditional file 1, in line with training-related activities.
Prior to testing, all eligible participants were familiarisedto the test battery items on two consecutive days.Participants either with self-reported injuries precludingphysical activity [32] or who partook in multiple sportswere excluded. However, injured participants competedin tests they were physically capable of performing.Participants also completed a brief questionnaire solicit-ing demographic and sport-related information. Datasought included age, sport played, school team, playingexperience (number of years since starting training andplaying rugby or cricket), number of hours of trainingper week, regular and alternative positions played, andplaying status in the team. All this information had to becorroborated by the head coaches.A full description of SCRuM test battery is included as
Additional file 2. Briefly, the SCRuM had (i) anthropo-metric (height, sitting height, body mass, seven-site skin-fold measurements), (ii) physiological (speed, agility,upper-and-lower muscular strength and power, pro-longed high-intensity intermittent running ability, andrepeated high-intensity exercise performance ability) and(iii) rugby-specific game skills (tackling, passing, andcatching). Only U19 rugby players performed one- repe-tition maximum bench press (1-RM BP) and back squat(1-RM BS) tests because of regular exposure to resist-ance training compared to U16 s and cricketers. Instead,60-s push-up and wall sit leg strength (WSLS) tests wereincorporated into the SCRuM for group comparisons onupper-and-lower limb muscular strength, respectively.Inclusion of 60-s push-up test was based on recent find-ings of a systematic review highlighting common usageof the test for assessment of upper-body muscularstrength in junior RU players [27]. The WSLS test iscommonly used in training for estimating lower-extremity muscular strength or endurance for adolescentathletes in the local context [26]. Cricket players did notperform repeated high-intensity exercise (RHIE) andrugby-specific game skills due to high-school cricketcoaches’ reservations on performing rugby-orientedtechnical and physical skills.Since reliability coefficients are population specific
[32, 33], elite U16 and U19 rugby players weretested twice in a preliminary study to estimate theabsolute and relative reliability of each SCRuM testitem. Intraclass correlation coefficients and coeffi-cient of variation for each test item have been pre-sented in previous studies [29, 30]. Baseline data forthese players was then compared to data obtainedfor U16 and U19 sub-elite and non-rugby players.Testing occurred in training during the rugby com-petitive season (May–August, 2018) for rugby playersand cricket competitive season (September–Novem-ber, 2018) for non-rugby athletes. This timing en-sured that participants had gained match-related
Chiwaridzo et al. BMC Sports Science, Medicine and Rehabilitation (2020) 12:3 Page 3 of 15

physical fitness [34, 35]. For each test, participantscompleted standardised warm-up procedures andwere allowed three sub-maximal practice trials fol-lowing test demonstration by the research assistants.Two trained research assistants conducted all theSCRuM tests, except for skinfolds and game-specificskills which were conducted by subject experts. Test-ing occurred on natural grass pitch for field testsand the gymnasium was used for strength-and-powerbased tests. Participants were requested to continuewith their normal diet and refrain from caffeine andperformance enhancers during the testing period.
Statistical analysesThe Shapiro Wilk test assessed normality and Levene’stest evaluated equality of error variances for dependentvariables (p < 0.05). The mean and standard deviation(Mean ± SD) described parametric data. The chi-squaretest checked for significant differences in proportion forplayer compositions between elite and sub-elite rugbygroups and age categories. Two-way univariate analysisof variance (ANOVA) examined for significant main ef-fect for fixed factors of age category (U16 vs. U19), play-ing standard (elite vs. sub-elite vs. non-rugby) andwhether a significant age category×playing standardinteraction existed. In case of significant main effect forplaying standards, pairwise comparisons were assessedusing Scheffé post-hoc test to locate mean differences.Additionally, identified significant interactions werefollowed with simple main effect analysis with Bonfer-roni correction adjusted for multiple comparison tests.Partial eta squared (η2p) measured effect size and wasinterpreted as 0.01 = small, 0.06 =medium and 0.14 =large [36–38]. All analysis were conducted using SPSSversion 25.0 with statistical significance accepted whenp < 0.05.
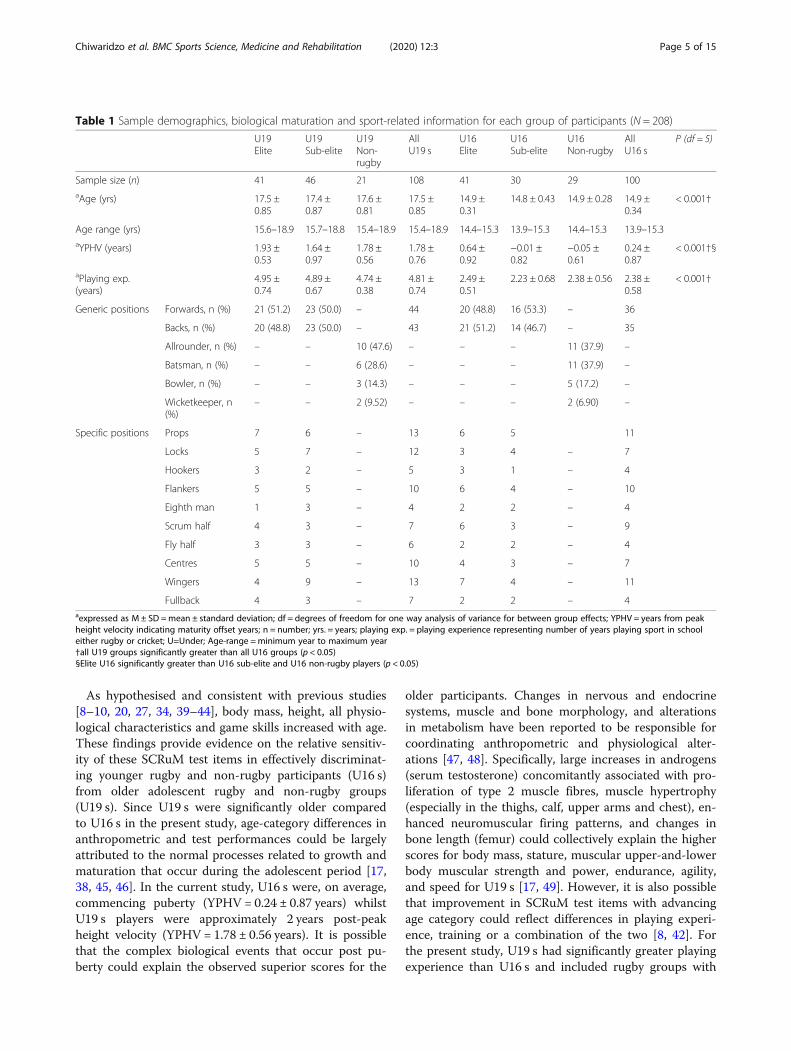
ResultsDescriptive data on age, playing experience and bio-logical maturation are shown in Table 1. Significant dif-ferences between U16 s and U19 s were identified forchronological age, years from peak height velocity(YPHV) and playing experience. There were no signifi-cant differences within U16 age category across the play-ing standard for chronological age and playingexperience. However, elite U16 rugby players reachedbiological maturity significantly earlier compared thansub-elite and non-rugby players. Within U19 age cat-egory, no significant differences were observed acrossplaying standards for chronological age, playing experi-ence and YPHV. With regards to player composition, allrugby groups had an equal proportion of forward andback players irrespective of age category [X2 (df = 1) =0.00, p = 0.99] and playing standards [X2 (df = 1) =0.03,
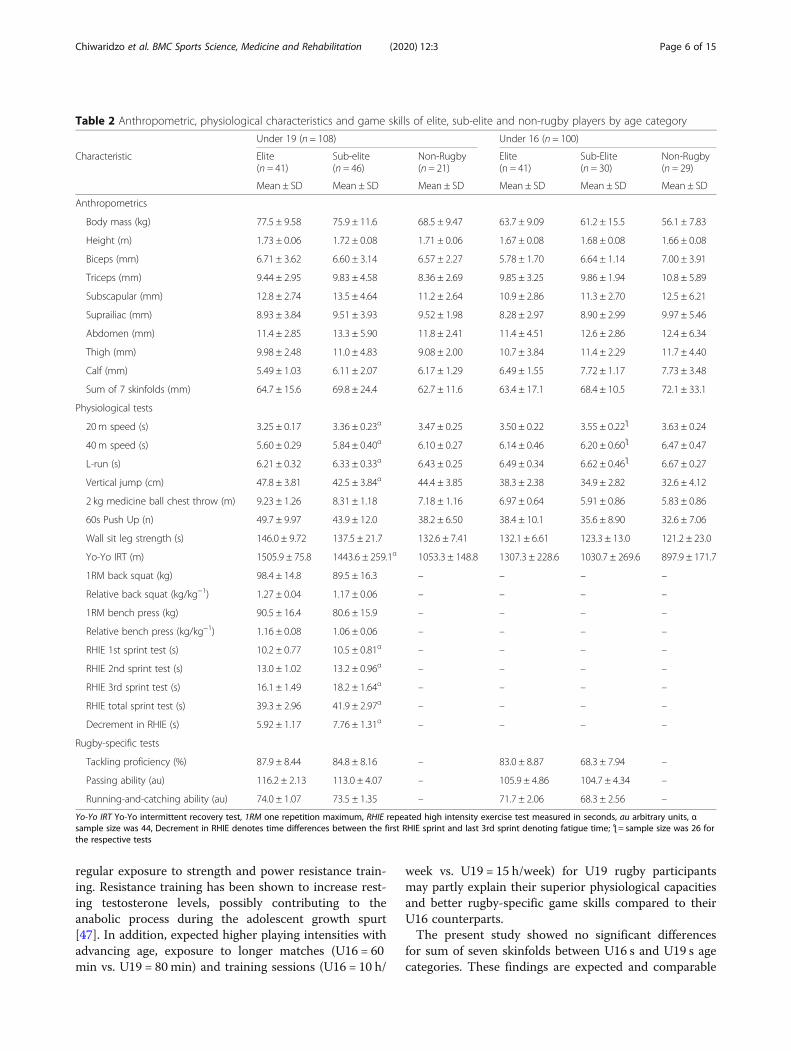
p = 0.87]. The props and wingers were the majority inboth U19 and U16 age categories.Table 2 depicts mean and standard deviation (M ± SD)
scores for anthropometric variables, physiological char-acteristics and rugby-specific game skills at each age cat-egory according to playing standards.Table 3 shows univariate test results for two-way
ANOVA. Age category had a significant effect on alldependent variables except sum of seven skinfolds (p =0.45, η2p = 0.003). For playing standard, there weresignificant main effects for all variables except forchronological age (p = 0.61, η2p = 0.01), height (p = 0.40,η2p = 0.01) and sum of seven skinfolds (p = 0.11, η2p =0.02). Post-hoc analysis revealed that elite and sub-eliterugby groups were significantly better compared to non-rugby players for 20-m speed (p < 0.001, η2p = 0.09), 40-m speed (p < 0.001, η2p = 0.14), 60-s push-up (p < 0.001,η2p = 0.11) and WSLS (p < 0.001, η2p = 0.13). However,L-run agility scores were significantly better in eliterugby players when compared to non-rugby players (p =0.004, η2p = 0.06). Vertical jump (VJ), 2-kg medicine ballchest throw (2-kg MBCT), Yo-Yo IRT L1, tackling profi-ciency, passing and running-and-catching ability testsimproved significantly with increasing playing standards.However, there were significant interactions between agecategory and playing standard only for: VJ (p = 0.01,η2p = 0.05), 2-kg MBCT (p = 0.01, η2p = 0.04), Yo-YoIRT L1 (p = 0.001, η2p = 0.07), tackling proficiency (p <0.001, η2p = 0.11) and running-and-catching ability (p <0.001, η2p = 0.14).Table 4 displays results for simple main effect analysis
indicating mean differences between age-categoriesacross each level of playing standard for dependent vari-ables which showed significant interactions. Between agecategories, the largest mean differences in 2-kg MBCTscores (η2p = 0.34) (Fig. 1), Yo-Yo IRT L1 (η2p = 0.26)(Fig. 2), running-and-catching ability (η2p = 0.50) (Fig. 3)and tackling proficiency (η2p = 0.31) (Fig. 4) were forsub-elite rugby players. However, non-rugby playersshowed the largest mean difference for VJ height (η2p =0.43) (Fig. 5).
DiscussionThis current study showed that age-category had asignificant main effect on all SCRuM test items ex-cept sum of seven skinfolds. An additional findingwas the significant main effect of playing standardwithout interaction for body mass, 20-m and 40-mspeed, L-run, 60-s push-up, WSLS and passing abilityskill tests. However, significant interaction effects be-tween age category and playing standard were ob-served only for VJ, 2-kg MBCT, Yo-Yo IRT L1,tackling proficiency and running-and-catching ability.
Chiwaridzo et al. BMC Sports Science, Medicine and Rehabilitation (2020) 12:3 Page 4 of 15
As hypothesised and consistent with previous studies[8–10, 20, 27, 34, 39–44], body mass, height, all physio-logical characteristics and game skills increased with age.These findings provide evidence on the relative sensitiv-ity of these SCRuM test items in effectively discriminat-ing younger rugby and non-rugby participants (U16 s)from older adolescent rugby and non-rugby groups(U19 s). Since U19 s were significantly older comparedto U16 s in the present study, age-category differences inanthropometric and test performances could be largelyattributed to the normal processes related to growth andmaturation that occur during the adolescent period [17,38, 45, 46]. In the current study, U16 s were, on average,commencing puberty (YPHV = 0.24 ± 0.87 years) whilstU19 s players were approximately 2 years post-peakheight velocity (YPHV = 1.78 ± 0.56 years). It is possiblethat the complex biological events that occur post pu-berty could explain the observed superior scores for the
older participants. Changes in nervous and endocrinesystems, muscle and bone morphology, and alterationsin metabolism have been reported to be responsible forcoordinating anthropometric and physiological alter-ations [47, 48]. Specifically, large increases in androgens(serum testosterone) concomitantly associated with pro-liferation of type 2 muscle fibres, muscle hypertrophy(especially in the thighs, calf, upper arms and chest), en-hanced neuromuscular firing patterns, and changes inbone length (femur) could collectively explain the higherscores for body mass, stature, muscular upper-and-lowerbody muscular strength and power, endurance, agility,and speed for U19 s [17, 49]. However, it is also possiblethat improvement in SCRuM test items with advancingage category could reflect differences in playing experi-ence, training or a combination of the two [8, 42]. Forthe present study, U19 s had significantly greater playingexperience than U16 s and included rugby groups with
Table 1 Sample demographics, biological maturation and sport-related information for each group of participants (N = 208)
U19Elite
U19Sub-elite
U19Non-rugby
AllU19 s
U16Elite
U16Sub-elite
U16Non-rugby
AllU16 s
P (df = 5)
Sample size (n) 41 46 21 108 41 30 29 100aAge (yrs) 17.5 ±
0.8517.4 ±0.87
17.6 ±0.81
17.5 ±0.85
14.9 ±0.31
14.8 ± 0.43 14.9 ± 0.28 14.9 ±0.34
< 0.001†
Age range (yrs) 15.6–18.9 15.7–18.8 15.4–18.9 15.4–18.9 14.4–15.3 13.9–15.3 14.4–15.3 13.9–15.3aYPHV (years) 1.93 ±
0.531.64 ±0.97
1.78 ±0.56
1.78 ±0.76
0.64 ±0.92
−0.01 ±0.82
−0.05 ±0.61
0.24 ±0.87
< 0.001†§
aPlaying exp.(years)
4.95 ±0.74
4.89 ±0.67
4.74 ±0.38
4.81 ±0.74
2.49 ±0.51
2.23 ± 0.68 2.38 ± 0.56 2.38 ±0.58
< 0.001†
Generic positions Forwards, n (%) 21 (51.2) 23 (50.0) – 44 20 (48.8) 16 (53.3) – 36
Backs, n (%) 20 (48.8) 23 (50.0) – 43 21 (51.2) 14 (46.7) – 35
Allrounder, n (%) – – 10 (47.6) – – – 11 (37.9) –
Batsman, n (%) – – 6 (28.6) – – – 11 (37.9) –
Bowler, n (%) – – 3 (14.3) – – – 5 (17.2) –
Wicketkeeper, n(%)
– – 2 (9.52) – – – 2 (6.90) –
Specific positions Props 7 6 – 13 6 5 11
Locks 5 7 – 12 3 4 – 7
Hookers 3 2 – 5 3 1 – 4
Flankers 5 5 – 10 6 4 – 10
Eighth man 1 3 – 4 2 2 – 4
Scrum half 4 3 – 7 6 3 – 9
Fly half 3 3 – 6 2 2 – 4
Centres 5 5 – 10 4 3 – 7
Wingers 4 9 – 13 7 4 – 11
Fullback 4 3 – 7 2 2 – 4aexpressed as M ± SD =mean ± standard deviation; df = degrees of freedom for one way analysis of variance for between group effects; YPHV = years from peakheight velocity indicating maturity offset years; n = number; yrs. = years; playing exp. = playing experience representing number of years playing sport in schooleither rugby or cricket; U=Under; Age-range =minimum year to maximum year†all U19 groups significantly greater than all U16 groups (p < 0.05)§Elite U16 significantly greater than U16 sub-elite and U16 non-rugby players (p < 0.05)
Chiwaridzo et al. BMC Sports Science, Medicine and Rehabilitation (2020) 12:3 Page 5 of 15
regular exposure to strength and power resistance train-ing. Resistance training has been shown to increase rest-ing testosterone levels, possibly contributing to theanabolic process during the adolescent growth spurt[47]. In addition, expected higher playing intensities withadvancing age, exposure to longer matches (U16 = 60min vs. U19 = 80 min) and training sessions (U16 = 10 h/
week vs. U19 = 15 h/week) for U19 rugby participantsmay partly explain their superior physiological capacitiesand better rugby-specific game skills compared to theirU16 counterparts.The present study showed no significant differences
for sum of seven skinfolds between U16 s and U19 s agecategories. These findings are expected and comparable
Table 2 Anthropometric, physiological characteristics and game skills of elite, sub-elite and non-rugby players by age category
Under 19 (n = 108) Under 16 (n = 100)
Characteristic Elite(n = 41)
Sub-elite(n = 46)
Non-Rugby(n = 21)
Elite(n = 41)
Sub-Elite(n = 30)
Non-Rugby(n = 29)
Mean ± SD Mean ± SD Mean ± SD Mean ± SD Mean ± SD Mean ± SD
Anthropometrics
Body mass (kg) 77.5 ± 9.58 75.9 ± 11.6 68.5 ± 9.47 63.7 ± 9.09 61.2 ± 15.5 56.1 ± 7.83
Height (m) 1.73 ± 0.06 1.72 ± 0.08 1.71 ± 0.06 1.67 ± 0.08 1.68 ± 0.08 1.66 ± 0.08
Biceps (mm) 6.71 ± 3.62 6.60 ± 3.14 6.57 ± 2.27 5.78 ± 1.70 6.64 ± 1.14 7.00 ± 3.91
Triceps (mm) 9.44 ± 2.95 9.83 ± 4.58 8.36 ± 2.69 9.85 ± 3.25 9.86 ± 1.94 10.8 ± 5.89
Subscapular (mm) 12.8 ± 2.74 13.5 ± 4.64 11.2 ± 2.64 10.9 ± 2.86 11.3 ± 2.70 12.5 ± 6.21
Suprailiac (mm) 8.93 ± 3.84 9.51 ± 3.93 9.52 ± 1.98 8.28 ± 2.97 8.90 ± 2.99 9.97 ± 5.46
Abdomen (mm) 11.4 ± 2.85 13.3 ± 5.90 11.8 ± 2.41 11.4 ± 4.51 12.6 ± 2.86 12.4 ± 6.34
Thigh (mm) 9.98 ± 2.48 11.0 ± 4.83 9.08 ± 2.00 10.7 ± 3.84 11.4 ± 2.29 11.7 ± 4.40
Calf (mm) 5.49 ± 1.03 6.11 ± 2.07 6.17 ± 1.29 6.49 ± 1.55 7.72 ± 1.17 7.73 ± 3.48
Sum of 7 skinfolds (mm) 64.7 ± 15.6 69.8 ± 24.4 62.7 ± 11.6 63.4 ± 17.1 68.4 ± 10.5 72.1 ± 33.1
Physiological tests
20 m speed (s) 3.25 ± 0.17 3.36 ± 0.23α 3.47 ± 0.25 3.50 ± 0.22 3.55 ± 0.22ƪ 3.63 ± 0.24
40m speed (s) 5.60 ± 0.29 5.84 ± 0.40α 6.10 ± 0.27 6.14 ± 0.46 6.20 ± 0.60ƪ 6.47 ± 0.47
L-run (s) 6.21 ± 0.32 6.33 ± 0.33α 6.43 ± 0.25 6.49 ± 0.34 6.62 ± 0.46ƪ 6.67 ± 0.27
Vertical jump (cm) 47.8 ± 3.81 42.5 ± 3.84α 44.4 ± 3.85 38.3 ± 2.38 34.9 ± 2.82 32.6 ± 4.12
2 kg medicine ball chest throw (m) 9.23 ± 1.26 8.31 ± 1.18 7.18 ± 1.16 6.97 ± 0.64 5.91 ± 0.86 5.83 ± 0.86
60s Push Up (n) 49.7 ± 9.97 43.9 ± 12.0 38.2 ± 6.50 38.4 ± 10.1 35.6 ± 8.90 32.6 ± 7.06
Wall sit leg strength (s) 146.0 ± 9.72 137.5 ± 21.7 132.6 ± 7.41 132.1 ± 6.61 123.3 ± 13.0 121.2 ± 23.0
Yo-Yo IRT (m) 1505.9 ± 75.8 1443.6 ± 259.1α 1053.3 ± 148.8 1307.3 ± 228.6 1030.7 ± 269.6 897.9 ± 171.7
1RM back squat (kg) 98.4 ± 14.8 89.5 ± 16.3 – – – –
Relative back squat (kg/kg−1) 1.27 ± 0.04 1.17 ± 0.06 – – – –
1RM bench press (kg) 90.5 ± 16.4 80.6 ± 15.9 – – – –
Relative bench press (kg/kg−1) 1.16 ± 0.08 1.06 ± 0.06 – – – –
RHIE 1st sprint test (s) 10.2 ± 0.77 10.5 ± 0.81α – – – –
RHIE 2nd sprint test (s) 13.0 ± 1.02 13.2 ± 0.96α – – – –
RHIE 3rd sprint test (s) 16.1 ± 1.49 18.2 ± 1.64α – – – –
RHIE total sprint test (s) 39.3 ± 2.96 41.9 ± 2.97α – – – –
Decrement in RHIE (s) 5.92 ± 1.17 7.76 ± 1.31α – – – –
Rugby-specific tests
Tackling proficiency (%) 87.9 ± 8.44 84.8 ± 8.16 – 83.0 ± 8.87 68.3 ± 7.94 –
Passing ability (au) 116.2 ± 2.13 113.0 ± 4.07 – 105.9 ± 4.86 104.7 ± 4.34 –
Running-and-catching ability (au) 74.0 ± 1.07 73.5 ± 1.35 – 71.7 ± 2.06 68.3 ± 2.56 –
Yo-Yo IRT Yo-Yo intermittent recovery test, 1RM one repetition maximum, RHIE repeated high intensity exercise test measured in seconds, au arbitrary units, αsample size was 44, Decrement in RHIE denotes time differences between the first RHIE sprint and last 3rd sprint denoting fatigue time; ƪ = sample size was 26 forthe respective tests
Chiwaridzo et al. BMC Sports Science, Medicine and Rehabilitation (2020) 12:3 Page 6 of 15

Table 3 Two-way ANOVA results examining annual age category, playing standards and interaction effects on anthropometrics,physiological and rugby-specific game skills
Characteristic Age-category Playing standard Age-category × playing standard
F P η2p Comparisons F P η2p Pairwise F p η2p
Chronological age (years) 752.2 < 0.001 0.79 U19 s > U16 s 0.50 0.61 0.01 – 0.08 0.92 0.00
Playing experience (years) 642.8 < 0.001 0.76 U19 s > U16 s 4.20 0.02 0.04 E, SE > NR 3.77 0.03 0.04
YPHV (years) 201.2 < 0.001 0.50 U19 s > U16 s 8.08 < 0.001 0.07 E > NR 2.12 0.12 0.02
Anthropometrics
Body mass (kg) 77.3 < 0.001 0.28 U19 s > U16 s 9.23 < 0.001 0.08 E, SE > NR 0.18 0.84 0.00
Height (m) 26.4 < 0.001 0.12 U19 s > U16 s 0.92 0.40 0.01 – 0.26 0.77 0.00
Sum of skinfolds (mm) 0.56 0.45 0.00 – 2.26 0.11 0.02 – 0.45 0.63 0.00
Physiological tests
20 m speed test (s) 36.0 < 0.001 0.16 U19 s < U16 s 9.61 < 0.001 0.09 E, SE < NR 0.72 0.49 0.01
40m speed test (s) 51.1 < 0.001 0.21 U19 s < U16 s 16.1 < 0.001 0.14 E, SE < NR 1.02 0.36 0.01
L-run agility test (s) 31.0 < 0.001 0.14 U19 s < U16 s 5.77 0.004 0.06 E < NR 0.10 0.91 0.00
Vertical jump test (cm) 369.3 < 0.001 0.65 U19 s > U16 s 39.8 < 0.001 0.28 E > SE > NR 5.13 0.01 0.05
2 kg MBCT test (m) 185.4 < 0.001 0.48 U19 s > U16 s 40.2 < 0.001 0.29 E > SE > NR 4.39 0.01 0.04
60s Push Up test (n) 35.7 < 0.001 0.15 U19 s > U16 s 12.4 < 0.001 0.11 E, SE > NR 1.34 0.27 0.01
Wall sit length strength (s) 35.9 < 0.001 0.15 U19 s > U16 s 11.3 < 0.001 0.10 E, SE > NR 0.14 0.87 0.00
Yo-Yo IRT L1 (m) 73.4 < 0.001 0.27 U19 s > U16 s 66.2 < 0.001 0.40 E > SE > NR 7.31 < 0.001 0.07
Game skills
Tackling proficiency (%) † 62.0 < 0.001 0.29 U19 s > U16 s 43.5 < 0.001 0.22 E > SE 18.3 < 0.001 0.11
Passing ability (au)† 210.4 < 0.001 0.58 U19 s > U16 s 12.5 < 0.001 0.08 E > SE 2.58 0.12 0.02
Running-and-catching ability (au)† 166.9 < 0.001 0.52 U19 s > U16 s 46.7 < 0.001 0.23 E > SE 25.1 < 0.001 0.14
×Interaction; η2p = partial eta squared; E = elite rugby players; SE = sub-elite rugby players; NR = non-rugby players; 2 kg MBCT = 2 kg medicine ball chest throw;Yo-Yo IRT L1 = Yo-Yo intermittent recovery test level 1; YPHV = years from peak height velocity representing maturity offset years; U19 s = Under 19 s; U16 s =Under 16 s; au = arbitrary units; † = 2*2 factorial ANOVA was conducted (age category = U19 vs. U16; Playing standard = elite vs. sub-elite); Pairwise = posthoc testresults; One repetition maximum bench press and back squat tests, and repeated high intensity exercise performance ability test are removed from this analysisas there were performed only by U19 rugby athletes and can only be compared between U19 elite and U19 sub-elite
Table 4 Univariate test results for simple main effect analyses of age category on selected dependent variables which showedsignificant interactions for each level of playing standard
SCRuM test variable aMean diff (95% CI) Playing standard Df MS F Pb η2p
Running-and-Catching Ability Skill Test (au) 2.27 (1.49–3.05) Elite group 1 105.476 33.272 < 0.000 0.18
5.15 (4.32–5.97) Sub-elite group 1 480.645 151.619 < 0.000 0.50
Tackling Proficiency Test (%) 4.89 (1.22–8.54) Elite group 1 487.8 6.94 < 0.009 0.04
16.5 (12.6–20.4) Sub-elite group 1 4846.4 68.9 < 0.000 0.31
Yo-Yo Intermittent Recovery Test Level 1 (m) 198.5 (168.3–288.7) Elite group 1 808,043.9 18.8 < 0.000 0.09
413.0 (316.3–509.7) Sub-elite group 1 3,042,135.7 70.9 < 0.000 0.26
155.4 (38.4–272.4) Non-Rugby group 1 294,145.5 6.86 0.01 0.03
2-kg Medicine Ball Chest Throw Test (m) 2.26 (1.81–2.71) Elite group 1 104.7 99.6 < 0.000 0.33
2.41 (1.93–2.88) Sub-elite group 1 105.1 100.4 < 0.000 0.34
1.34 (0.77–1.92) Non-Rugby group 1 22.0 21.0 < 0.000 0.09
Vertical Jump test (cm) 9.52 (7.99–11.0) Elite group 1 1708.5 140.0 < 0.000 0.41
7.69 (6.05–9.32) Sub-elite group 1 1053.9 86.2 < 0.000 0.30
11.8 (9.87–13.8) Non-Rugby group 1 1857.7 152.0 < 0.000 0.43aMean diff = mean differences in the dependent variable between U19 and 16 (Under 19-Under 16) based on estimated marginal means; MS =Mean square; df =degree of freedom; badjusted for multiple comparisons using Bonferroni correction; η2p = partial eta squared; F = each F tests the simple effects of Age categorywithin each level combination of playing standard. These tests are based on the linearly independent pairwise comparisons among the estimated marginalmeans; 95% CI = 95% confidence interval for the mean difference
Chiwaridzo et al. BMC Sports Science, Medicine and Rehabilitation (2020) 12:3 Page 7 of 15

Fig. 1 Comparison of 2 kg medicine ball chest throws across playing standards for each age category. There were significant mean differences(p < 0.05) in test scores between the U19 s and U16 for elite, sub-elite and non-rugby. For U16 s, 2 kg MBCT test showed good discriminativevalidity in differentiating elite from both sub-elite and non-rugby players but failed to distinguish sub-elite from non-rugby players. At U19 level,elite rugby players were significantly better than both sub-elite and non-rugby players, and sub-elite were also significantly better from non-rugby players. The largest mean differences between age categories were among the elite and sub-elite
Fig. 2 Comparison for Yo-Yo intermittent recovery test across playing standards for the two age-categories. The Yo-Yo IRT L1 test scoressignificantly improved with increasing playing standard among U16 s but failed to distinguish elite from sub-elite rugby players at U19 level. Thesub-elite rugby players showed the largest mean differences between U19 and U16 athletes (p < 0.05; η2p = 0.26)
Chiwaridzo et al. BMC Sports Science, Medicine and Rehabilitation (2020) 12:3 Page 8 of 15
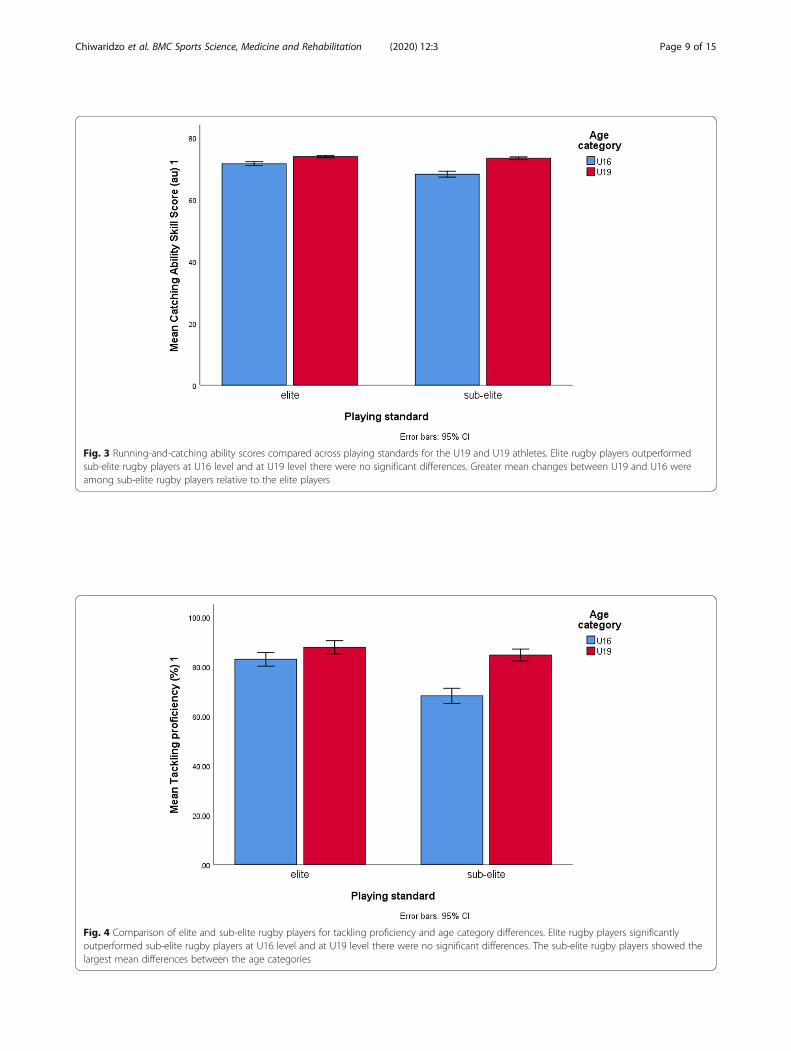
Fig. 3 Running-and-catching ability scores compared across playing standards for the U19 and U19 athletes. Elite rugby players outperformedsub-elite rugby players at U16 level and at U19 level there were no significant differences. Greater mean changes between U19 and U16 wereamong sub-elite rugby players relative to the elite players
Fig. 4 Comparison of elite and sub-elite rugby players for tackling proficiency and age category differences. Elite rugby players significantlyoutperformed sub-elite rugby players at U16 level and at U19 level there were no significant differences. The sub-elite rugby players showed thelargest mean differences between the age categories
Chiwaridzo et al. BMC Sports Science, Medicine and Rehabilitation (2020) 12:3 Page 9 of 15

to related studies [8, 9, 11, 17, 45]. These results wereobserved despite the significant and large practical dif-ferences observed in chronological age, playing experi-ence, biological maturity, body mass and height betweenU16 s and U19 s. This outcome probably suggestsgreater stability of skinfolds for schoolboy athletes withincreasing age [19] thus dismissing the possible influenceof age and the impact of growth processes on skinfolddevelopment after U16 age category. In contrast to thestudy hypothesis that elite rugby players would have areduced sum of seven skinfolds by virtue of exposure tohigher playing intensities, playing standard had no sig-nificant main effect on skinfolds. However, in support ofthese findings, Gabbett et al. [18] also found no signifi-cant difference in the sum of seven skinfold thicknessbetween elite and sub-elite players involved in competi-tive U16 RL. Till et al. [37] also showed no differencesamong amateur, academy and professional junior RLplayers albeit at U13 level. A lack of difference in sum ofskinfolds has previously been attributed to large interin-dividual variation within team squads of adolescentgroups especially rugby [11], mainly due to the accom-modative nature of the sport to all interested schoolchildren of various body sizes and shapes.Although rugby players performed better than non-
rugby players, possibly reflecting different speed require-ments between rugby and cricket, the present studyshowed no significant difference in 20-m and 40-mspeed tests between elite and sub-elite rugby players.
These findings are consistent with previous studies [12]but also contradict others [43]. Speed is regularly listedas an important physiological characteristic in rugby,allowing for players to move fast in attack and defenceand has been linked to match success and effective per-formance of game skills such as tackling [19, 27]. Lackof speed differences between rugby playing standardsprobably dismisses 20-m and 40-m sprinting abilities asimportant determinants of higher playing standards inZimbabwe schoolboy rugby or shows its equal import-ance in both competitive leagues and the need for con-tinued training. In addition, possible similar exposure tosprinting activities during training [12] and equal pro-portion of forward and back players in the rugby groupsshown in this present study could also account for thelack of difference.The L-run test failed to discriminate between elite and
sub-elite rugby players, and also between sub-elite andnon-rugby players. These findings were also shared byprevious studies. Gabbett et al. [50] showed that firstand second senior grade rugby league players had similarL-run agility scores. Among U16 rugby league players,Gabbett et al. [18] also showed no significant differencein agility scores using the 5–0-5 test between elite andsub-elite rugby league players. The 5–0-5 test utilised inthe study by Gabbett et al. [18] involved players per-forming a speed and agility shuttle run through timinggates. Till et al. [37] also showed similar 5–0-5 agilitytest scores between academy and professional rugby
Fig. 5 Vertical jump (VJ) test scores. VJ effectively discriminated elite from both sub-elite and non-rugby players and concomitantly sub-elite fromnon-rugby players at U16 level. At U19 level, non-rugby players showed similar test scores to sub-elite rugby players. The largest mean differencesbetween age categories were among the non-rugby players (p < 0.05; η2p = 0.43)
Chiwaridzo et al. BMC Sports Science, Medicine and Rehabilitation (2020) 12:3 Page 10 of 15

league players for U13 s, U14 s, and U15 s. Given the re-ported strong correlation between speed and agility [50],the lack of differences between elite and sub-elite insprinting shown in the present study could account forthe similar agility scores. The significant main effect ofplaying standard on agility shown in this study emanatedfrom the test validity in differentiating elite players fromnon-rugby players. Similarly, Till et al. [37] showed that“professional” rugby league players had superior agilitytest scores compared to the amateurs, however thiscomparison was for the U14 players. A possible explan-ation for our finding could be observed differences inspeed, playing experience and biological maturity be-tween elite rugby players and non-rugby players.Greater strength scores were observed for rugby players
when compared to non-rugby players. However, therewere no significant differences between elite and sub-eliterugby players for the 60-s push-up and WSLS strengthtests. There are no studies to the authors’ knowledge thathave compared strength performances according to play-ing standard in junior RU using these tests. However, lackof differences in player composition, maturation, chrono-logical age and playing experience probably explains simi-lar findings for the upper-and-lower muscular strengthbetween elite and sub-elite rugby players. An alternativeexplanation for the finding could be that these characteris-tics are equally important for all junior rugby players, irre-spective of playing standards. However, when U19 rugbyplayers were assessed for upper-and lower body muscularstrength using 1RM BP and 1RM BS, respectively, the re-sults showed a significant difference between the elite andsub-elite players for absolute and relative strength(Table 2). Consistently, Jones et al. [12] showed that pro-fessional regional academy U18 RU players representinghigher playing standard had superior bench press scoresfor upper body muscular strength than school-levelplayers. Till et al. [51] also showed that future professionalplayers aged between U17 and U19 had heavier back squatscores when compared with the academy players. How-ever, with the cross-sectional nature of the present study,it is not clear whether our results indicate that strongerU19 schoolboy rugby players are preferentially selected forthe elite team resulting in higher measures, or there is in-creased volume of training muscle strength prevalent inthe elite league facilitating greater development of thecharacteristic when compared to the sub-elite players. It isalso possible that both factors could have contributed tothis effect. Overall, the present study results expose thepoor discriminative validity of both the 60-s push-up andWSLS in differentiating elite and sub-elite rugby players atthe U19 level when compared to the 1RM BS and 1RMBP. It suffices, however, to recommend the use of 60-spush-up and WSLS when comparing rugby versus non-rugby players.
Few studies have compared junior rugby players acrossannual age-categories and playing at different competi-tive levels for passing ability technical proficiencies. In-vestigating the relationship between physical fitness andplaying ability in rugby league players, Gabbett et al. [23]assessed basic passing based on a skill criteria applied byexpert rugby coaches. Similarly, this present study, witha modified passing ability test with eight technical ele-ments for participant evaluation, showed that elite rugbyplayers had superior passing skills compared to sub-eliterugby players. These findings are consistent with previ-ous studies and reflect the importance of passing abilityfor the attainment of elite status in schoolboy rugby.Gabbett et al. [23] showed that first grade rugby leagueplayer had better basic passing skills when compared tothird grade players. These differences were attributed tothe differences in age (23.7 ± 4.3 years vs. 17.8 ± 1.5years), and playing experience (16.3 ± 6.7 years vs. 9.4 ±4.3 years) between the first and third grade players. Thepresent study showed no differences in age, maturityand playing experience between the elite and sub-eliterugby players negating the possible influence of thesefactors in accounting for the differences observed in thecohort of Zimbabwean schoolboy rugby players. How-ever, with the higher level of proficiency expected inelite rugby and the important role of passing in rugby, itis possible to speculate that enhanced training of passexecution in elite competition is emphasised more thanin sub-elite resulting in better passing ability. However,as a limitation, this study did not capture specific detailswith regards to the actual training content for gameskills for rugby players. Future studies may investigatedifferences in training content by playing standards andsee how that influences player performances on gameskills such as passing.The Yo-Yo IRT L1 test scores improved with increas-
ing playing standard among U16 s but failed to distin-guish elite from sub-elite rugby players at U19 level.These findings seem to suggest that endurance qualitieshave a greater impact in determining higher playingstandards in U16 RU than in U19 RU. Possibly, increas-ing playing intensity at U19 level warrants rugby playersregardless of playing standard to possess highly devel-oped endurance qualities to cope with the intermittenthigh-intensity running episodes. However, simple maineffect analysis showed greater cross-sectional differencesbetween the age categories for Yo-Yo IRT L1 test scoresamong sub-elite rugby players. Cognisant of study limi-tations, these findings possibly indicate heightened en-durance training or greater adherence to endurancetraining activities among U19 sub-elite players comparedto U16 sub-elite players resulting in large performancedifferences between them. On the other hand, relativelysmall mean difference between U16 s and U19 s was
Chiwaridzo et al. BMC Sports Science, Medicine and Rehabilitation (2020) 12:3 Page 11 of 15

observed for the elite group possibly suggesting robustearly onset training of endurance in U16 elite players.Interestingly, young elite U16 s (1307.3 ± 228.6 m)showed similar test performances with sub-elite U19players (1443.6 ± 259.1 m). These findings suggest thatyoung elite rugby players are reaching older adolescentlevels for prolonged high-intensity intermittent runningability relatively faster than either sub-elite or non-rugbyplayers.At the U16 level, 2-kg MBCT test showed good discrim-
inative validity in differentiating elite from both sub-eliteand non-rugby players but failed to distinguish sub-elitefrom non-rugby players. However, at U19 level, the test ef-fectively discriminated elite rugby players from both sub-elite and non-rugby players, and sub-elite from non-rugbyplayers. With all groups having similar YPHV, age andplaying experience, observed differences at U19 levelcould possibly be accounted for by differences in trainingstrategies across playing standards. Collectively, thesefindings highlight increasing sensitivity of the 2 kg MBCTtest with advancing age in discriminating rugby players byplaying standards. Simple main effect analysis showed thatlarger cross-sectional performance changes in 2-kg MBCTscores between age-categories among rugby players com-pared to non-rugby players (Table 4). These findings allowfor speculation of the importance of upper-body muscularpower in rugby relative to cricket, especially among olderU19 rugby participants and also hint at the likelihood ofgreater development with training in rugby regardless ofcompetitive level. Muscular power is essential in rugby foreffective tackles and to push opponents when needed [52].VJ effectively discriminated elite from both sub-elite
and non-rugby players and concomitantly sub-elite fromnon-rugby players at U16 level. However, this changedat U19 level with non-rugby players showing similar testscores to sub-elite rugby players. This happened becausethere were larger differences in VJ performances with in-creasing age category for the non-rugby players at U19level relative to performance differences of other groups.Although the reasons for this are unclear given thecross-sectional design, it is possible to speculate that lowphysical fitness affect lower body muscular power pro-duction among late maturing U16 non-rugby players asevidenced by the low initial test scores relative to othergroups. Given similar playing experiences across levelsof playing standards at U16 age category, the possibilityof specialist training of lower-body muscular power orpreferential recruitment of powerful U16 players in theelite and sub-elite rugby groups could explain the rela-tively higher VJ scores for the rugby players. However,training probably emphasising motor activities such assprinting and jumping activities that required the pro-duction of significant lower-body muscular power couldaccount for the larger performance changes shown by
older non-rugby players. These findings may also suggestthat elite cricket players may overcome maturational,playing experience and physical fitness disadvantages atU16 level, and develop lower-body muscular powerneeded for running and jumping for aerial balls to thepoint of matching sub-elite rugby players with advancingage [37]. Previous longitudinal studies have hinted onrelatively weaker athletes having a greater capacity forimprovement with advancing age than highly trainedathletes [24].The present study showed a significant interaction be-
tween the effects of age-category and playing standardon tackling proficiency and running-and-catching ability.For both tackling and catching, elite rugby players out-performed sub-elite rugby players at U16 level probablysuggesting increased sensitivity of these game specificskills in discriminating younger rugby players by playingstandards at that level. However, this changed at U19level with both groups showing no significant differencesfor both performances, findings which dismiss the use-fulness of these skills in differentiating older adolescentrugby players by playing standards. Therefore, betweenU16 s and U19 s, large differences in the performancesof these tests were in sub-elite rugby players comparedto the elite rugby players and were shown more for thetackling proficiency test. The reasons for these findingsare unclear given the observational nature of the presentstudy and require further testing in future studies. Thelow initial performances of sub-elite U16 rugby playersrelative to elite U16 rugby players possibly reflectingpoor training or less proficiency in skill execution espe-cially for tackling could account for the large perform-ance gaps between U16 s and U19 s for the sub-elitegroup. Alternatively, greater adaptation to training oftackling and catching with increasing age, maturity, play-ing experience and playing intensity among sub-eliteplayers could also explain the seemingly better perfor-mances at U19 level. For tackling, it seems that elite U16rugby players reach top level scores early as evidencedby relatively small mean differences with the elite U19rugby group. These findings probably indicate thatyoung elite U16 rugby players reach mature level scoresfor tackling early than sub-elite rugby players suggestingeither greater proficiency or less adaption to training inelite players than in sub-elite rugby players.
Critical assessment of the studyNovelty in the current study was highlighted by com-paring elite, sub-elite and non-rugby players at U16and U19 age-categories from a country hardly knownfor dominating international rugby events. However,this study has limitations and the results should beinterpreted cautiously in light of these limitations.
Chiwaridzo et al. BMC Sports Science, Medicine and Rehabilitation (2020) 12:3 Page 12 of 15
� The study involved purposive selection of singleschools to represent each playing standard andincluded only U16 s and U19 s to represent youngand older adolescent athletes. This sample may nothave been representative of all age-categories andthe multiple schools competing in the SESRL,CESRL and cricket interscholastic competitions inthe country. The anthropometric, physiological andgame skills are likely to differ with chronologicalage, schools, training strategies, player selection cri-teria, and player motivation and coaching philoso-phies possibly over-or under-estimating the fitness,body composition or skills of junior elite and sub-elite players [53]. This limits the external validity ofstudy results to other schools not involved in thestudy and also to other age-categories not assessedin this study.
� Given the complexity and multifaceted nature of thesport of rugby, only examining the anthropometric,physiological and game specific skills is a possiblelimitation and a more holistic protocol includingtactical, perceptual-cognitive skills and psychologicalmeasures would have been ideal to comprehensivelyunderstand and identify qualities or skills discrimin-ating players of different ages and playing standards[37]. A recent study showed that psychological attri-butes such as players’ attitudes and personality traits,mental strength and emotional stability are key qual-ities that coaches consider in good adolescent rugbyplayers and in player recruitment for TID initiatives[54]. Further studies objectively assessing these qual-ities and how they differ with age and playing stan-dards in junior rugby are warranted.
� The cross-sectional nature of the study lacked ana-lysis over an extended period of time [38]. This de-sign ignores the dynamic nature of playerdevelopment possibly narrowing the usefulness ofthe data for TID [55]. However, the data are crucialfor hypothesis generation which could be furthertested in future prospective cohort studies. Also, thesample size was limited to allow for the categorisa-tion of participants by player positions.
ConclusionThis is the first Zimbabwean study to compareanthropometric, physiological characteristics andrugby-specific game skills of schoolboy rugby players(including non-rugby players as a comparative group)of different age categories and playing standards. Allanthropometric, physiological characteristics and gameskills progressively increased with age except for sumof seven skinfolds suggesting large influence of ageand maturity-related factors on attribute developmentamong schoolboy athletes. With regards to playing
standards, upper-and-lower-body muscular power,prolonged high intensity intermittent running ability,tackling, passing, running-and-catching ability im-proved with increasing playing standards. However,there were significant interactions between the effectsof age category and playing standard for upper-and-lower-body muscular power, prolonged high intensityintermittent running ability, tackling and catching.These findings suggest that, for these variables, thediscriminative ability for playing standard isdependent on age category. Yo-Yo IRT L1, VJ, tack-ling and catching tests demonstrated greater discrim-inative ability among Under 16 s than in Under 19 swhilst the 2-kg MBCT test showed the converse.From a practical perspective, Yo-Yo IRT L1, VJ, tack-ling and catching tests could be used as screeningtests for talent search in young rugby players whilstthe 2-kg MBCT test is sensitive in differentiatingolder male adolescent players by playing standards.
Supplementary informationSupplementary information accompanies this paper at https://doi.org/10.1186/s13102-019-0155-3.
Additional file 1. Order of the SCRuM tests performed during reliabilitystudy and subsequent testing of the participants.
Additional file 2. The SCRuM test battery.
Abbreviations1RM BP: One repetition maximum bench press; 1RM BS: One repetitionmaximum back squat; 2-kg MBCT: 2-kg Medicine Ball Chest Throw;ANOVA: analysis of variance; CESRL: Co-educational School Rugby League;HREC: Human Research Ethics Committee; RL: Rugby League; RU: RugbyUnion; SCRuM: School Clinical Rugby Measure; SESRL: Super Eight SchoolRugby League; TID: Talent identification; U: Under; VJ: Vertical Jump;WSLS: Wall Sit Leg Strength; Yo-Yo IRT L1: Yo-yo Intermittent Recovery TestLevel 1; YPHV: Years from peak height velocity
AcknowledgmentsThe authors would like to acknowledge all rugby and cricket players whoparticipated in the study. Part of the training of the research assistantsinvolved University of Zimbabwe, College of Health Sciences, Physiotherapystudents. We are grateful for their support and support extended to us bythe chairman of the Rehabilitation Department to use departmentalpremises for the training. The lead author would like to thank all theresearch assistants who collected part or whole data on this projectincluding Mr. Sander Oorschot, Mr. Takura Matare, Miss Sharmaine Chizanga,Mr. Intelligent Ndlovu, Mr. Malan Chitevuka, and Mr. Mike Chiwaridzo. TheMinistry of Primary and Secondary Education, the headmasters, school sportsdirectors, and rugby coaches provided permissions to access schools.Further, we would like extend our gratitude to the parents and guardianswho gave informed consents for their child to participate in the study. Also,the authors would like to thank rugby expert coaches who rated theparticipants on game-specific skills, anthropometrist, former U19 adolescentrugby players used as “dummy” players for the assessment of game specificskills, and content experts for validating the data collection instruments.
Authors’ contributionsMC, BCM and GF originally developed the concept and design of the study.MC is a doctoral student at UCT and this manuscript is part of his doctoralthesis. MC acted as the lead investigator under the guidance, mentorshipand supervision of BCM and GF. MC conducted the literature review,recruited and trained research assistants and participants with variable
Chiwaridzo et al. BMC Sports Science, Medicine and Rehabilitation (2020) 12:3 Page 13 of 15

assistance coming from other people who were acknowledged in theacknowledgment section. MC supervised the data collection. MC drafted themanuscript for publication and acted as the corresponding author. BCM andGF performed critical revision of the manuscript, statistical input, andprovided extensive revisions prior to submission to the journal for review. Allthe authors read and approved the final version of the manuscript.
FundingAlthough this study did not have funding, the first author acknowledges thementoring and research training received from University of ZimbabweCollege of Health Sciences PERFECT (Promoting Excellence in Research andFaculty Enhanced Career Training) program. The PERFECT program issupported by the Fogarty International Center of the National Institutes ofHealth under Award Number D43TW010137.
Availability of data and materialsThe datasets generated and/or analysed during the current study are notpublicly available due to the fact that the data is part of ongoing research.However, the data are available from the corresponding author onreasonable request.
Ethics approval and consent to participateThis study adhered to ethical principles under the Declaration of Helsinki.Institutional access and permission to conduct the study at the schoolhosting the Dairiboard Zimbabwe Schools Rugby Festival was obtained fromMinistry of Primary and Secondary Education (ref C/426/3), Harare ProvinceEducation Director Office, and from the respective school headmaster.Ethical approval was sought and granted by the Human Research EthicsCommittee (HREC) of the University of Cape Town (ref: 016/2016) and, locallyfrom Medical Research Council of Zimbabwe (ref: MRCZ/A/2070). Participantsprovided written informed assent prior to participation following a verbalexplanation and reading an information letter explaining the rationale andall procedural issues regarding the study. Parents were informed andprovided written informed consent on behalf of all participants unable tolegally consent for themselves.
Consent for publicationNot applicable as the manuscript does not contain any data from anyindividual person.
Competing interestsThe authors declare that they have no competing interests.
Received: 21 August 2019 Accepted: 24 December 2019
References1. Van Gent MM, Spamer EJ. Comparisons of positional groups in terms of
anthropometric, rugby-specific skills, physical and motor components amongU13, U 16, U 18 and U 19 elite rugby players. Kinesiology. 2005;37(1):50–63.
2. Wood DJ, Coughlan GF, Delahunt E. Fitness profiles of elite adolescent Irishrugby union players. J Strength Cond Res. 2018;32(1):105–12.
3. Hartwig TB, Gabbett TJ, Naughton G, Duncan C, Harries S, Perry N. Trainingand match volume and injury in adolescents playing multiple contact teamsports: a prospective cohort study. Scand J Med Sci Sports. 2019;29:469–75.
4. Venter RE, Opperman E, Opperman S. The use of global positioning system (GPS)tracking devices to assess movement demands and impacts in Under-19 rugbyunion match play. Afr J Phys Health Educ Recreation Dance. 2011;17(1):1–8.
5. Vaz L, Figueira B, Goncalves B. Classifying youth rugby union players bytraining performances. Int J Perform Anal Sport. 2015;15(1):159–71.
6. Portillo J, Abiah P, Navia JA, Sanchez M, Abien-Vicen J. Movement patternsin Under-19 rugby union players: evaluation of physical demands byplaying position. Int J Perform Anal Sport. 2014;14:934–45.
7. Read DB, Jones B, Phibbs PJ, Roe GAB, Darrall-Jones JD, Weakley JJS, et al.Physical demands of representative match-play in adolescent rugby union. JStrength Cond Res. 2016;31(5):1290–6.
8. Durandt J, Green M, Masimla H, Lambert M. Changes in body mass, statureand BMI in South Africa elite U18 Rugby players from different racial groupsfrom 2002-2012. J Sports Sci. 2018;36(5):477–84.
9. Spamer EJ, la Port D. Anthropometric, physical, motor, and game-specificprofiles of elite U-16 and U-18 year-old south African schoolboy rugbyplayers. Kinesiology. 2006;38(2):176–84.
10. Kobal, et al. Physical performance of Brazilian rugby players from different agecategories and competitive levels. J Strength Cond Res. 2016;30(9):2433–9.
11. Darrall-Jones JD, Jones B, Till K. Anthropometric and physical profiles of Englishacademy rugby union players. J Strength Cond Res. 2015;29(8):2086–96.
12. Jones B, Weaving D, Tee J, Darrall-Jones J, Weakley J, Phibbs P. Bigger,stronger, faster, fitter: the differences in physical qualities of school andacademy rugby union players. J Sports Sci. 2018;36(21):2399–404.
13. Pienaar AE, Spamer MJ, Steyn HS. Identifying and developing rugby talentamong 10-year-old boys: a practical model. J Sports Sci. 1998;16(8):691–9.
14. Spamer EJ, Winsley RJ. A comparative study of British and south African12yr old rugby players, in relation to game-specific, physical, motor andanthropometric variables. J Hum Mov Stud. 2003;44(1):37–45.
15. Spamer EJ, Winsley RJ. Comparative characteristics of elite English and southAfrican 18-year-old rugby-players with reference to game-specific skills,physical abilities and anthropometric data. J Hum Mov Stud. 2003;45(3):187–96.
16. Spamer EJ, du Plessis D, Kruger EH. Comparative characteristics of elite NewZealand and south African U/16 rugby players with reference to gamespecific skills, physical abilities and anthropometric data. South Afr J SportsMed. 2009;21(2):53–7.
17. Waldron M, Worsfold P, Twist C, Lamb K. Changes in anthropometry andperformance and their interrelationships across three seasons in elite youthrugby league players. J Strength Cond Res. 2014;28(11):3128–36.
18. Gabbett TJ, Jenkins DG, Abernethy B. Physiological and anthropometriccorrelates of tackling ability in junior elite and subelite rugby league players.J Strength Cond Res. 2010;24(11):2989–95.
19. Till K, Scantlebury S, Jones B. Anthropometric and physical qualities of elitemale youth rugby league players. Sports Med. 2017;47:2171–86.
20. Gabbett. Physiological and anthropometric characteristics of starters andnon-starters in junior rugby league players, 13–17 years. J Sports Med PhysFitness. 2009;49(3):233–9.
21. Trecroci A, Longo S, Perri E, Laia FM, Alberti G. Field-based physicalperformance of elite and sub-elite middle-adolescent soccer players. ResSports Med. 2019;27(1):60–71.
22. Gabbett T, Kelly J, Ralph S, Driscoll D. Physiological and anthropometriccharacteristics of junior elite and sub-elite rugby league players, with specialreference to starters and non-starters. J Sci Med Sport. 2009;12(1):215–22.
23. Gabbett T, Kelly J, Pezet T. Relationship between physical fitness and playingability in rugby league players. J Strength Cond Res. 2007;21(4):1126–33.
24. Appleby B, Newton RU, Corme P. Changes in strength over a 2-year period inprofessional rugby union players. J Strength Cond Res. 2012;26(9):2538–46.
25. Till K, Jones B, Emmonds S, Tester E, Fahey J, Cooke C. Seasonal changes inanthropometric and physical characteristics within English academy leagueplayers. J Strength Cond Res. 2014;28(9):2689–96.
26. Chiwaridzo M, Chandahwa D, Oorschot S, Tadyanemhandu C, Dambi JM,Ferguson G, et al. Logical validation and evaluation of practical feasibility forthe SCRuM (school clinical Rugby measure) test battery developed foryoung adolescent rugby players in a resource-constrained environment.PLoS One. 2018;13(11):e0207307.
27. Chiwaridzo M, Oorschot S, Dambi JM, Ferguson GD, Booney E, MudawarimaT, Tadyanemhandu C, Smits-Engelsman BCM. A systematic reviewinvestigating measurement properties of physiological tests in rugby. BMCsports science, medicine and. Rehabilitation. 2017;9:24.
28. Oorschot S, Chiwaridzo M, Smits-Engelsman BCM. Psychometric evaluation ofcommonly used game-specific skills tests in rugby: a systematic review. BMJ OpenSport Exerc Med. 2017;3:e000281. https://doi.org/10.1136/bmjsem-2017-000281.
29. Chiwaridzo M, Ferguson GD, Smits-Engelsman BCM. Anthropometric,physiological characteristics and rugby-specific game skills discriminatingZimbabwean under-16 male adolescent rugby players by level ofcompetition. BMJ Open Sport Exerc Med 2019; 0:e000576. doi: https://doi.org/10.1136/bmjsem-2019-000576.
30. Chiwaridzo M, Ferguson G, Smits-Engelsman BCM. Qualities or skillsdiscriminating under 19 rugby players by playing standards: a comparativeanalysis of elite, sub-elite and non-rugby players (the SCRuM project). BMCRes Notes. 2019;12(1):536.
31. Noakes TD, Durandt JJ. Physiological requirements of cricket. J Sports Sci.2000;18(12):919–29.
32. Green BS, Blake C, Caulfield BM. A valid field test protocol of linear speedand agility in rugby union. J Strength Cond Res. 2011;25(5):1256–62.
Chiwaridzo et al. BMC Sports Science, Medicine and Rehabilitation (2020) 12:3 Page 14 of 15

33. de Vet HCW, Terwee CB, Knol DL, Bouter LM. When to use agreementversus reliability measures. J Clin Epidemiol. 2006;59:1033–9.
34. Gabbett TJ. Physiological characteristics of junior and senior rugby leagueplayers. Br J Sports Med. 2002;36:334–9.
35. Gabbett TJ. Physiological and anthropometric correlates of tackling ability inrugby league players. J Strength Cond Res. 2009;23(2):540–8.
36. Hopkins W, Marshall SW, Batterham AM, Hanin J. Progressive statistics for studiesin sports medicine and exercise science. Med Sci Sports Exerc. 2009;41:1–3.
37. Till K, Cobley S, Morley D, O’Hara J, Chapman C, Cooke C. The influence ofage, playing position, anthropometry and fitness on career attainmentoutcomes in rugby league. J Sports Sci. 2016;34(13):1240–5.
38. Tribolet R, Bennett KJM, Watsford ML, Fransen J. A multidimensionalapproach to talent identification and selection in high-level youthAustralian football players. J Sports Sci. 2018;36(22):2537–43.
39. Argus CK, Gill ND, Keogh JWL. Characterization of the differences instrength and power between different levels of competition in rugby unionathletes. J Strength Cond Res. 2012;26(10):2698–704.
40. Krause LM, Naughton GA, Denny G, Patton D, Hartwig T, Gabbett TJ.Understanding mismatches in body size, speed and power amongadolescent rugby union players. J Sci Med Sport. 2015;18:358–63.
41. Pienaar C, Coetzee B. Changes in selected physical, motor performance andanthropometric components of university-level rugby players after onemicrocycle of a combined rugby conditioning and plyometric trainingprogram. J Strength Cond Res. 2013;27(2):398–415.
42. Lombard WP, Durandt JJ, Masimla H, Green M, Lambert M. Changes in bodysize and physical characteristics of south African under-20 rugby unionplayers over a 13-year period. J Strength Cond Res. 2015;29(4):980–8.
43. Gabbett TJ, Herzig PJ. Physiological characteristics of junior elite and sub-elite rugby league players. Strength Cond Coach. 2004;12(2):1–7.
44. Till K, Cobley S, O’Hara J, et al. Anthropometric, physiological and selectioncharacteristics in high performance UK junior rugby league players. TalentDev Excell. 2010;2:193–207.
45. Till K, Tester E, Jones B, Emmonds S, Fahey J, Cooke C. Anthropometric andphysical characteristics of English academy rugby league players. J StrengthCond Res. 2014;28(2):319–27.
46. Till K, Jones B. Monitoring anthropometry and fitness using maturity groupswithin youth rugby league. J Strength Cond Res. 2015;29(3):730–6.
47. Smart DJ, Gill ND. Effects of an off-season conditioning program on thephysical characteristics of adolescent rugby union players. J Strength CondRes. 2013;27(3):708–17.
48. Waldron M. A longitudinal analysis of performance, growth and maturation inyouth rugby league players: Implications for talent identification anddevelopment. Phd Thesis. University of Chester. 2013. https://chesterrep.openrepository.com/handle/10034/311265. Last accessed on 20 August 2019.
49. Till K, Jones B, Darrall-Jones J, Emmonds S, Cooke C. Longitudinaldevelopment of anthropometric and physical characteristics withinacademy rugby league players. J Strength Cond Res. 2015;29(6):1713–22.
50. Gabbett TJ, Kelly JN, Sheppard JM. Speed, change of direction speed, andreactive agility of rugby league players. J Strength Cond Res. 2008;22(1):174–81.
51. Till K, Jones B, Geeson-Brown T. Do physical qualities influence theattainment of professional status within elite 16-19 year old rugby leagueplayers? J Sci Med Sport. 2016;19:585–9.
52. Tredrea M, Descombe B, Sanctuary CE, Scanlan AT. The role ofanthropometric, performance and psychological attributes in predictingselection into an elite development programme in older adolescent rugbyleague players. J Sports Sci. 2017;35(19):1897–903.
53. Gabbett TJ. A comparison of physiological and anthropometriccharacteristics among playing positions in junior rugby league players. Br JSports Med. 2005;39:675–80.
54. Chiwaridzo M, Munambah N, Oorschot S, Magume D, Dambi JM, FergusonG, et al. Coaches perceptions on qualities defining good adolescent rugbyplayers and are important for player recruitment in talent identificationprograms: the SCRuM project. BMC Res Notes. 2019;12:132.
55. Till K, Morley D, O’Hara, Jones BL, Chapman C, Beggs CB, et al. Aretrospective longitudinal analysis of anthropometric and physical qualitiesthat associate with adult career attainment in junior rugby league players. JSci Med Sport. 2017;20:1029–33.
Publisher’s NoteSpringer Nature remains neutral with regard to jurisdictional claims inpublished maps and institutional affiliations.
Chiwaridzo et al. BMC Sports Science, Medicine and Rehabilitation (2020) 12:3 Page 15 of 15