Embed Size (px)
Citation preview
TUESDAY, APRIL 14:PHARMACY RESIDENTS LEADING
PRACTICE CHANGE

Anthony Pudlo, PharmD, MBA, BCACPVice President, Professional Affairs
Iowa Pharmacy Association
WELCOME
Outline of Today’s 2/2/2 PRESENTERS
Brittany Bruch, PharmD
PGY1 Ambulatory Care Pharmacy Resident
University of Iowa Health Care
ANALYSIS OF MEDICATION DISCREPANCIES IDENTIFIED BY CLINICAL PHARMACISTS IN AN OUTPATIENT CARDIOLOGY CLINIC
Analysis of Medication Discrepancies Identified by Clinical Pharmacists in an Outpatient Cardiology Clinic
Brittany A. Bruch, PharmDPGY1 Pharmacy Resident with an Ambulatory Care FocusUniversity of Iowa Hospitals and Clinics, Iowa City, IA
Disclaimer
• Brittany A. Bruch reports that she has no actual or potential conflict of interest in relation to this presentation.
• Off-label use of medication will not be discussed during this presentation.
Acknowledgements
• Residency project advisors:– Ryan B. Jacobsen, PharmD, BCPS
– Milena A. Gebska, MD, PhD

About UI Hospitals and Clinics
• 730-bed tertiary care hospital in Iowa City, IA
• US News “Best Hospital” for 24 consecutive years
• By the numbers (2014):• 30,762 admissions
• 56,418 ER visits
• 811,173 clinic visits
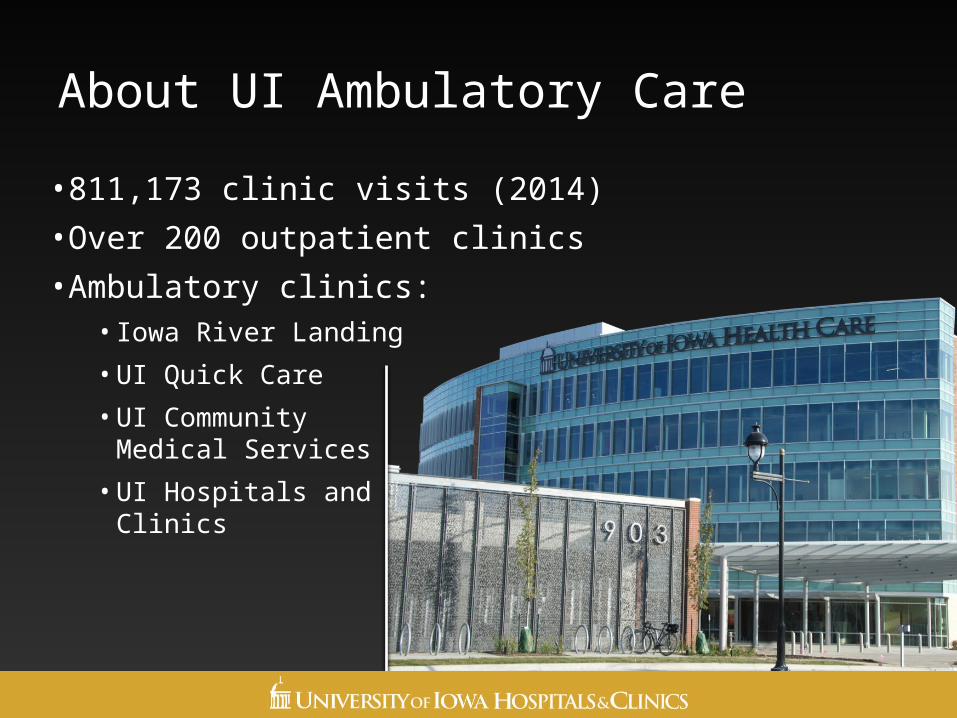
About UI Ambulatory Care
• 811,173 clinic visits (2014)
• Over 200 outpatient clinics
• Ambulatory clinics:• Iowa River Landing
• UI Quick Care
• UI Community Medical Services
• UI Hospitals and Clinics
Medication Discrepancies
• In 2013, the cost from avoidable medication errors in the United States was approximately $20 billion
– At least 25% were considered preventable
• As many as 60% of errors occur during care transitions
• In 2005, the Joint Commission named medication reconciliation as one of its National Patient Safety Goals (NPSG 8)
– NPSG 8 was suspended in 2009 and reintroduced in 20111. Avoidable costs in U.S. healthcare. 2013 IMS: Institute for Healthcare Informatics: Parsippany, NJ.2. Kirwin, J. et al., Process indicators of quality clinical pharmacy services during transitions of care. Pharmacotherapy 2012. 32(11):338-47.3. ASHP statement on the pharmacist's role in medication reconciliation. Am J Health Syst Pharm 2013. 70:453-6.
Objectives
• Identify the number and type of clinically important medication discrepancies among medication lists using a Physician-Pharmacist Collaborative Model in an outpatient cardiology clinic
• Analyze potential predictors of medication discrepancies
Study Designs and Methods
• Retrospective review
• Inclusion criteria:– Current use of ≥3 chronic medications
– Completion of a comprehensive medication review by a clinical pharmacist during the study period (09/15/14-01/31/15)
• Exclusion criteria:– Subsequent visits were excluded if a patient was seen more
than once during the study period
Medication List Comparison
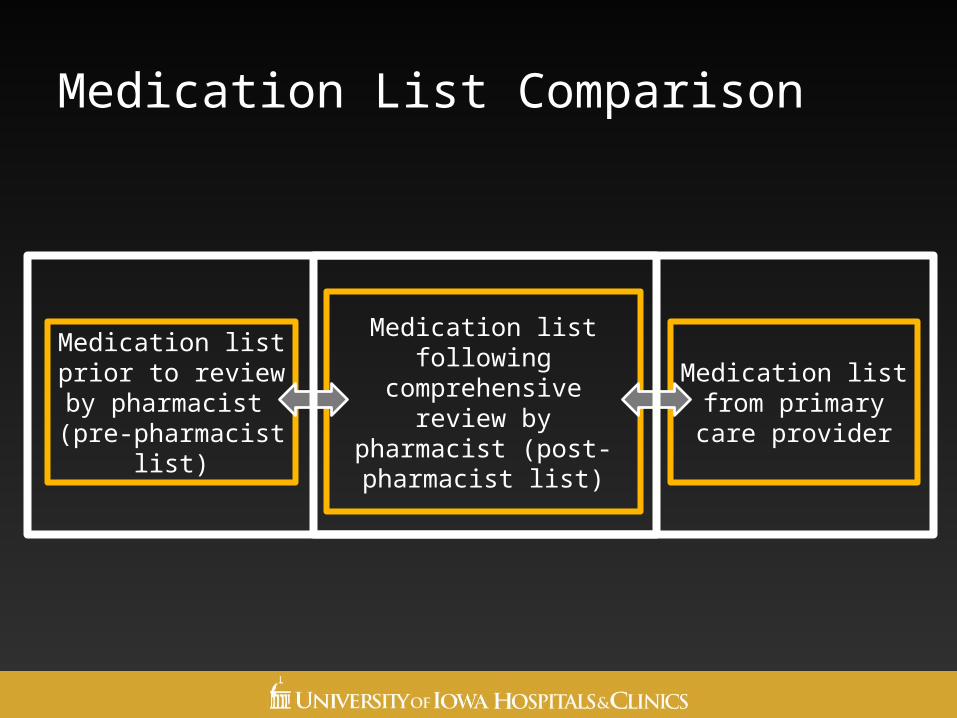
Medication list prior to review by pharmacist
(pre-pharmacist list)
Medication list following comprehensive
review by pharmacist (post-pharmacist list)
Medication list from primary
care provider
Outcomes
• Primary– Number and type of medication discrepancies between the pre-
pharmacist and post-pharmacist medication lists
– Number of medication discrepancies involving cardiovascular medications
• Secondary– Potential predictors of medication discrepancies
• Age
• Number of prescribers
• Hospitalization within the past 30 days
• Number of medications
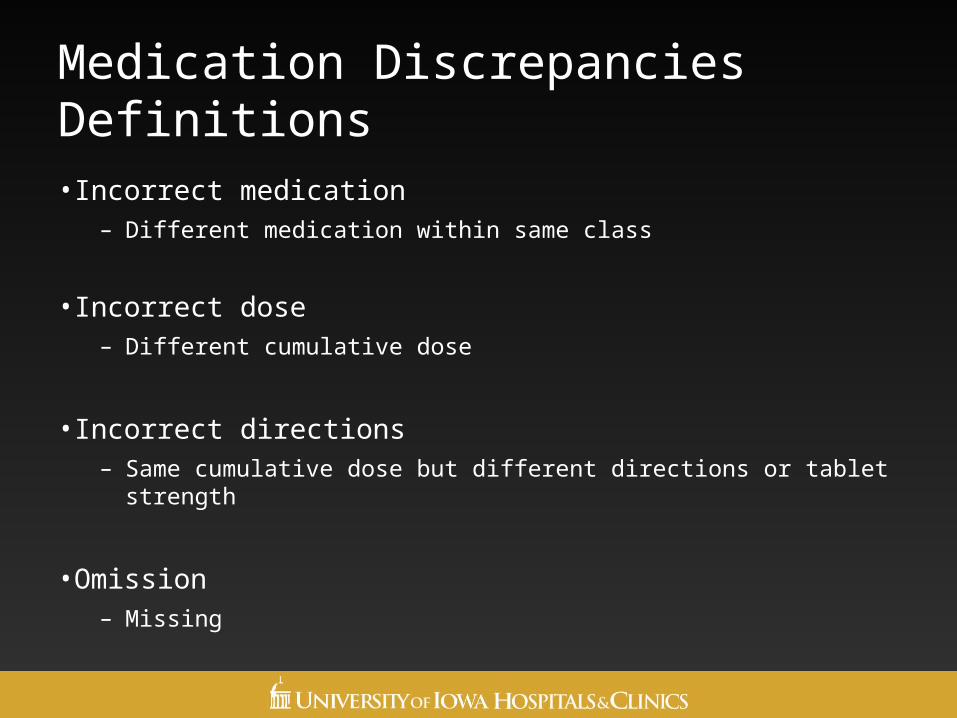
Medication Discrepancies Definitions
• Incorrect medication– Different medication within same class
• Incorrect dose– Different cumulative dose
• Incorrect directions– Same cumulative dose but different directions or tablet strength
• Omission– Missing
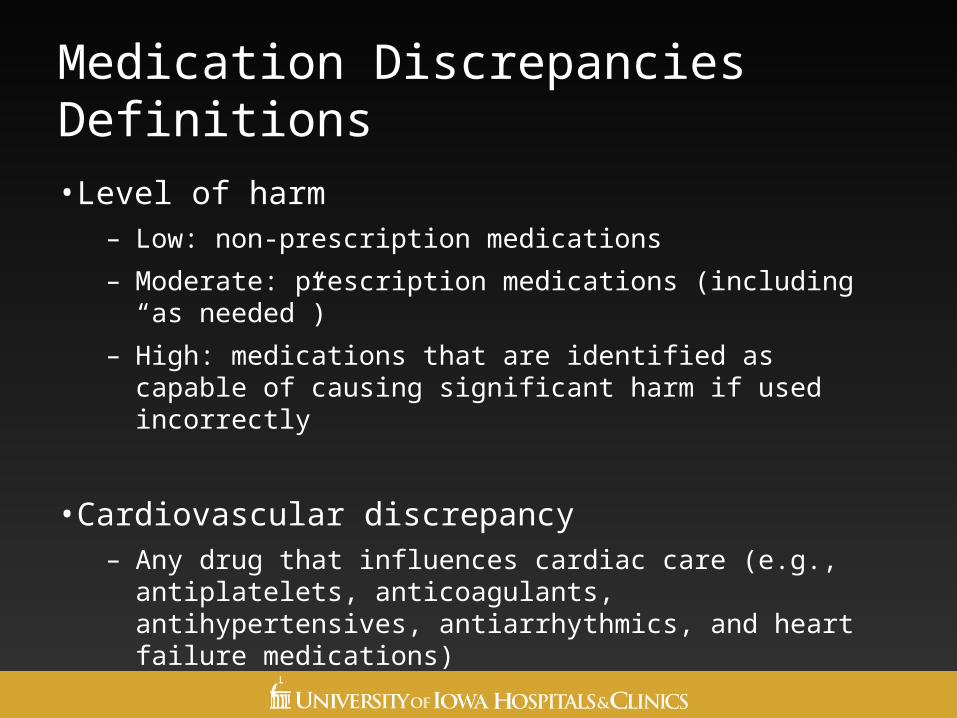
Medication Discrepancies Definitions
• Level of harm– Low: non-prescription medications
– Moderate: prescription medications (including “as needed”)
– High: medications that are identified as capable of causing significant harm if used incorrectly
• Cardiovascular discrepancy– Any drug that influences cardiac care (e.g., antiplatelets,
anticoagulants, antihypertensives, antiarrhythmics, and heart failure medications)
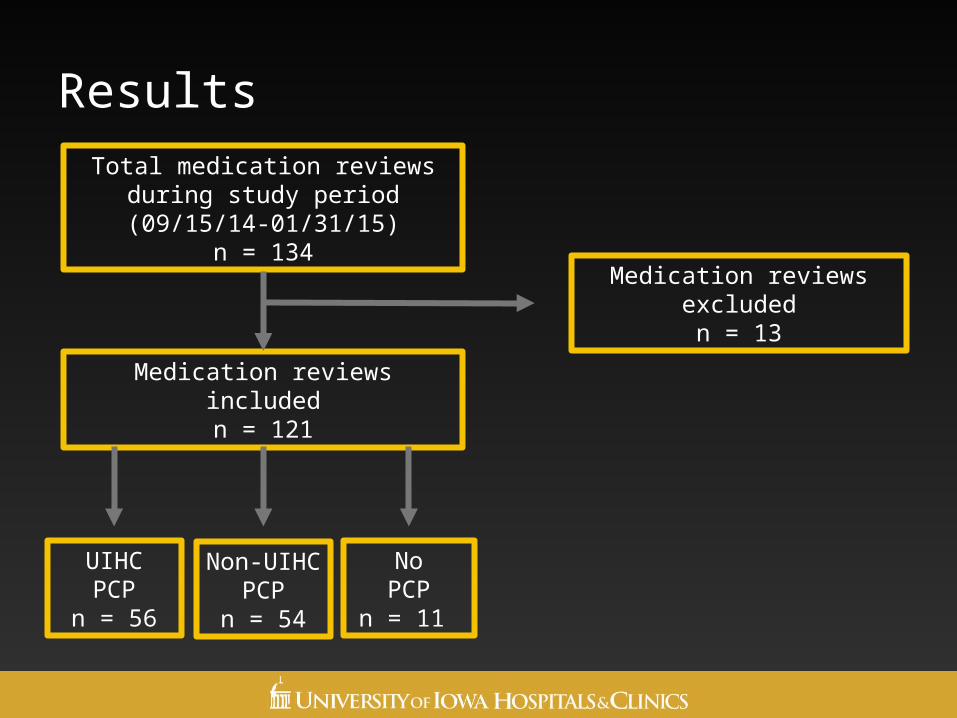
Results
Total medication reviews during study period (09/15/14-01/31/15)
n = 134
Medication reviews includedn = 121
Medication reviews excludedn = 13
UIHCPCP
n = 56
Non-UIHC PCP
n = 54
NoPCP
n = 11
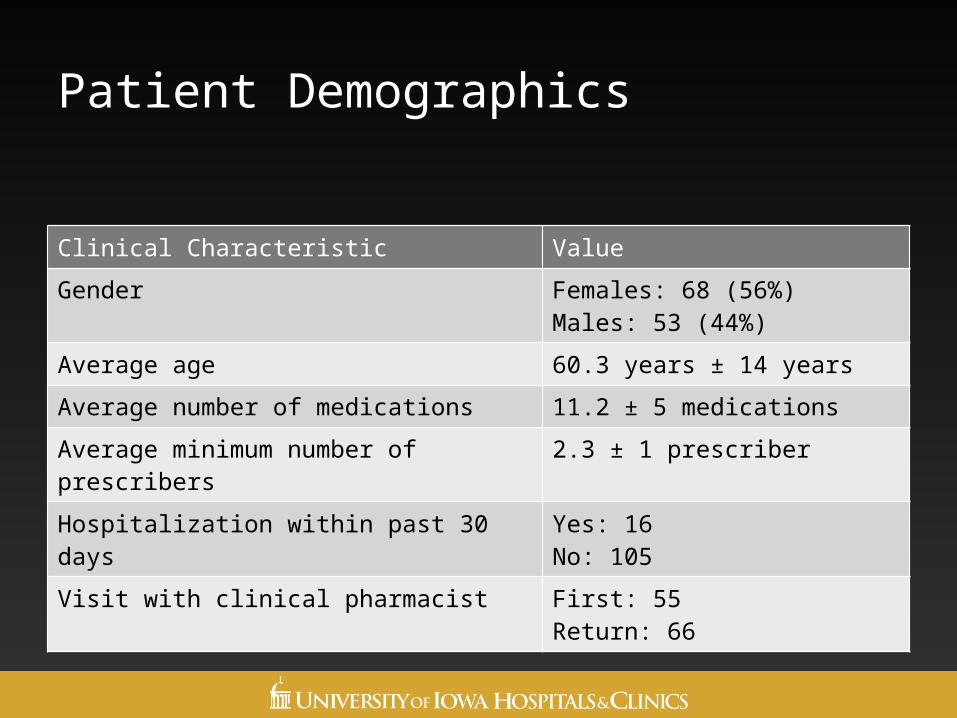
Patient Demographics
Clinical Characteristic Value
Gender Females: 68 (56%)Males: 53 (44%)
Average age 60.3 years ± 14 years
Average number of medications 11.2 ± 5 medications
Average minimum number of prescribers 2.3 ± 1 prescriber
Hospitalization within past 30 days Yes: 16No: 105
Visit with clinical pharmacist First: 55Return: 66
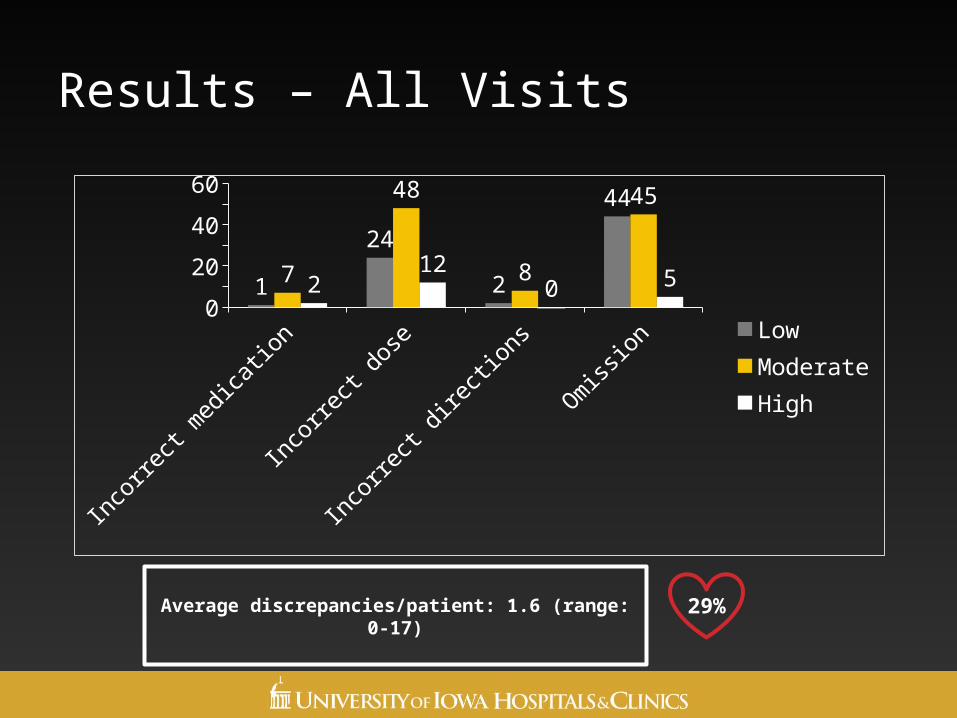
Results – All Visits
Inco
rrect
med
icatio
n
Inco
rrect
dos
e
Inco
rrect
dire
ction
s
Om
ission
0102030405060
1
24
2
44
7
48
8
45
212
05 Low
ModerateHigh
29%Average discrepancies/patient: 1.6 (range: 0-17)
Preliminary Conclusions
• Majority of identified discrepancies were considered moderate harm (55%)
• Many discrepancies were classified as medication omission (47%)
• Large percentage of medication discrepancies related to cardiac care (29%)
• Further data analysis is currently in progress
Outline of Today’s 2/2/2 PRESENTERSEVALUATION OF IRON DEFICIENCY ANEMIA IN A HEMATOLOGY-
ONCOLOGY POPULATION AT A LARGE ACADEMIC MEDICAL CENTER
Tracy Harlan, PharmD
PGY1 Ambulatory Care Pharmacy Resident
University of Iowa Health Care
Evaluation of Iron Deficiency Anemia in a Hematology-Oncology Population at a Large Academic Medical Center
Tracy Harlan, Pharm.D.
PGY1 Pharmacy Resident with an Ambulatory Care Focus
University of Iowa Hospitals and Clinics (UIHC), Iowa City, IA
Disclaimer
• Tracy Harlan reports that she has no actual or potential conflict of interest in relation to this presentation.
• Off-label use of medication will not be discussed during this presentation.
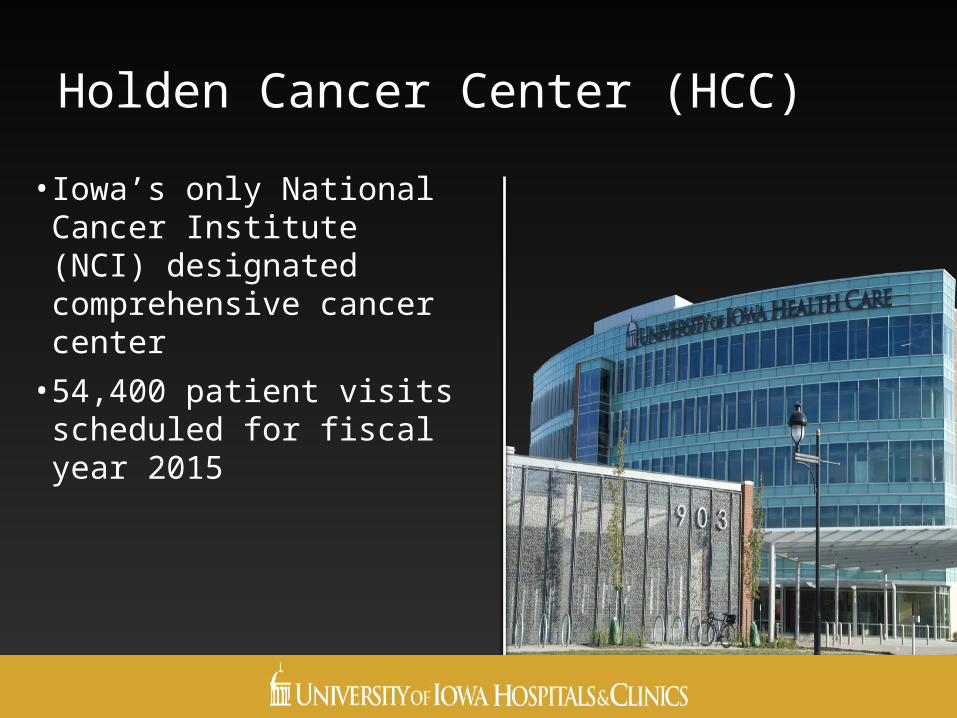
Holden Cancer Center (HCC)
• Iowa’s only National Cancer Institute (NCI) designated comprehensive cancer center
• 54,400 patient visits scheduled for fiscal year 2015
Objectives
• Explain the benefit of ensuring the proper evaluation and treatment of iron deficiency anemia in patients with cancer
• Recognize laboratory values warranting further workup of iron deficiency anemia
• Interpret laboratory values indicative of iron deficiency anemia
Cancer-Related Anemia (CRA)
• Anemia is a common complication found in many patients with cancer
• Occurrence of anemia in this population is ~40%
• Presence of anemia is associated with overall decreased quality of life
• Pathophysiology of CRA is often multifactorial
Ann Oncol. Oct 2010; 21 Suppl 7:vii 167-172.Cancer. Nov 2003; 98(9): 1786-1801.
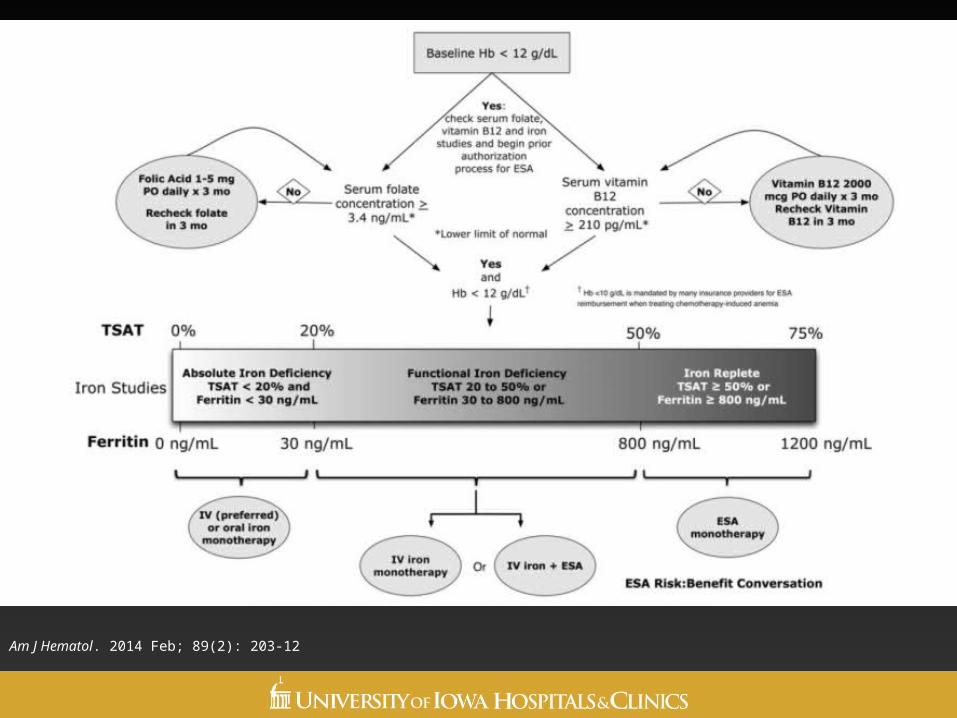
Am J Hematol. 2014 Feb; 89(2): 203-12
Study Objectives
• Examine the percentage of patients who appropriately received iron studies
• Determine if opportunities for improvement exist in evaluation of iron deficiency anemia
Study Design
• Retrospective analysis of patients with Hb ≤ 11 g/dL and MCV ≤ 80 fL between 4/1/14 and 9/30/14
• Approved by the UIHC Institutional Review Board
• Patients identified through UIHC electronic medical records
• Statistical tests– Descriptive statistics were used to analyze data
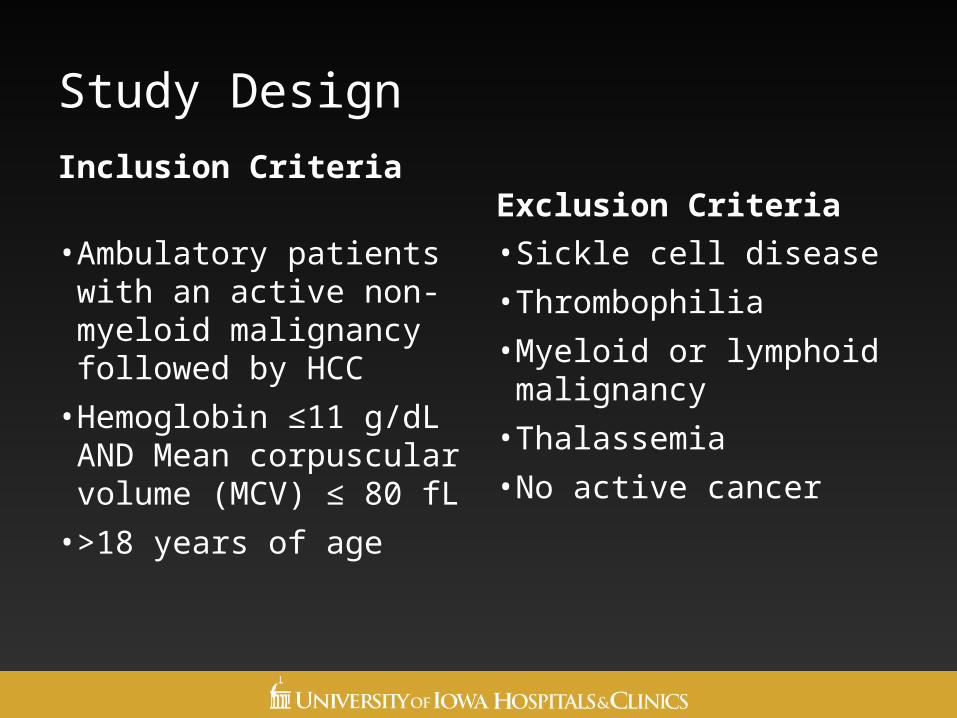
Study Design
Inclusion Criteria
• Ambulatory patients with an active non-myeloid malignancy followed by HCC
• Hemoglobin ≤11 g/dL AND Mean corpuscular volume (MCV) ≤ 80 fL
• >18 years of age
Exclusion Criteria
• Sickle cell disease
• Thrombophilia
• Myeloid or lymphoid malignancy
• Thalassemia
• No active cancer
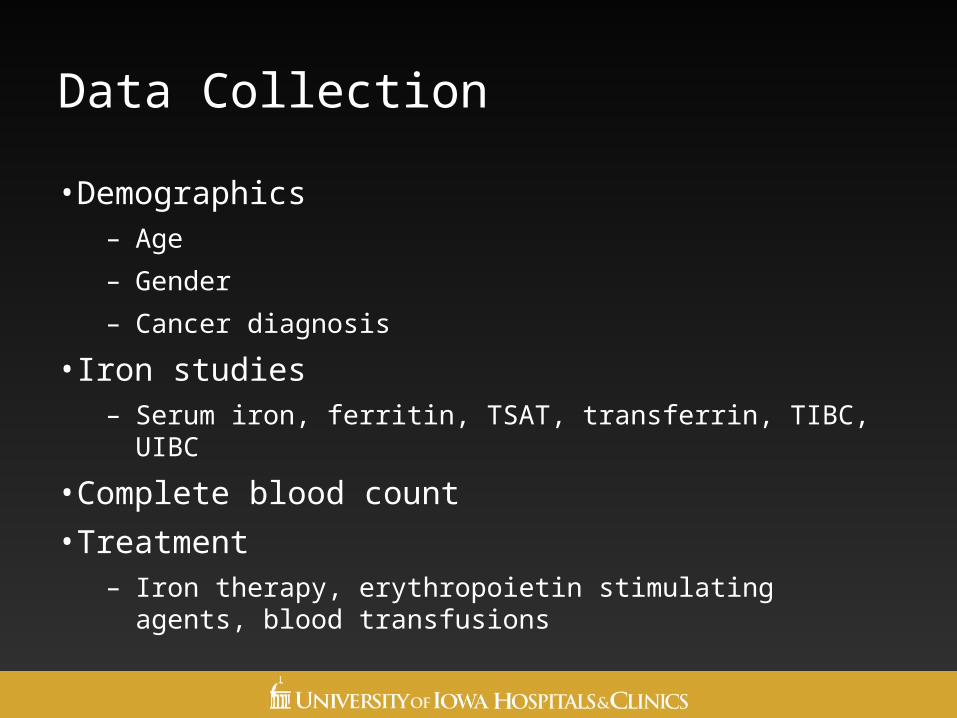
Data Collection
• Demographics– Age
– Gender
– Cancer diagnosis
• Iron studies– Serum iron, ferritin, TSAT, transferrin, TIBC, UIBC
• Complete blood count
• Treatment– Iron therapy, erythropoietin stimulating agents, blood
transfusions
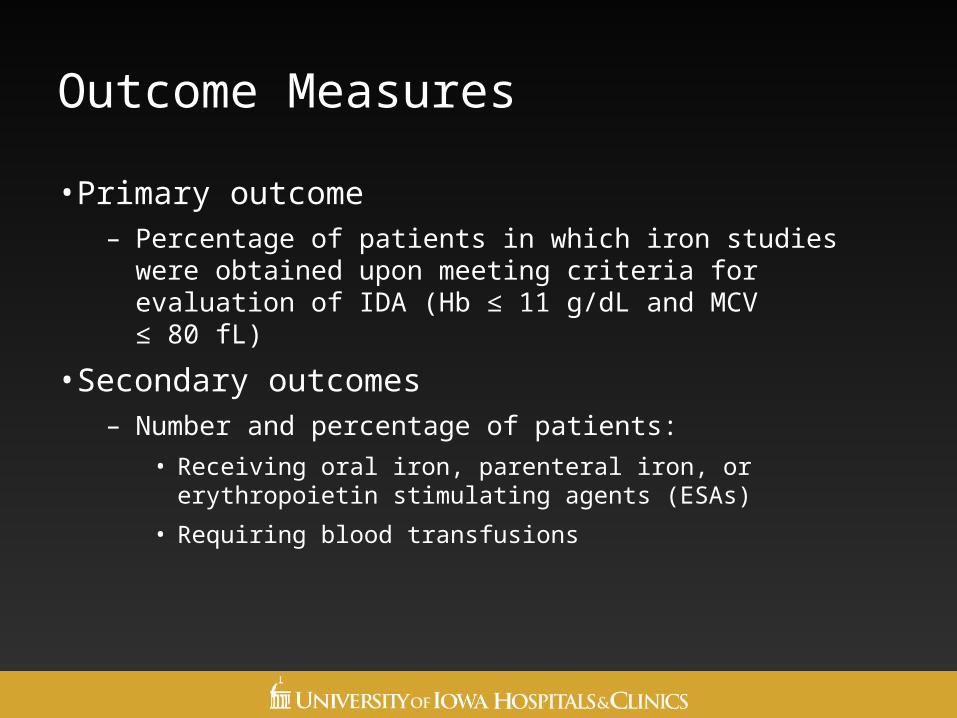
Outcome Measures
• Primary outcome– Percentage of patients in which iron studies were obtained upon
meeting criteria for evaluation of IDA (Hb ≤ 11 g/dL and MCV ≤ 80 fL)
• Secondary outcomes– Number and percentage of patients:
• Receiving oral iron, parenteral iron, or erythropoietin stimulating agents (ESAs)
• Requiring blood transfusions

Results
260 patients were screened
140 patients excluded
120 patients included
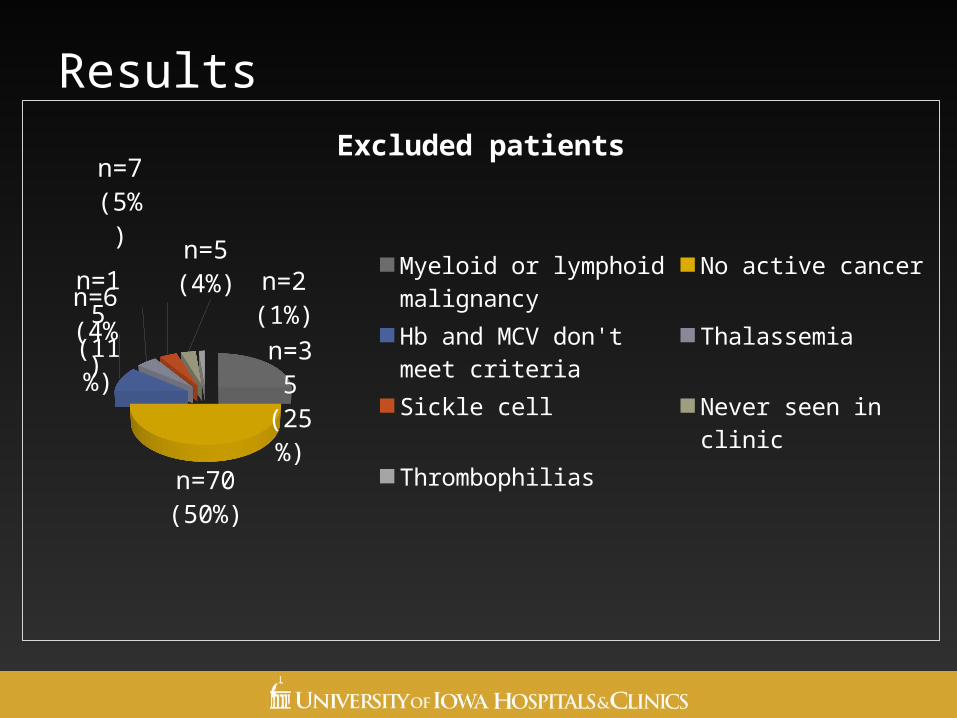
Results
n=35 (25%)
n=70 (50%)
n=15 (11%
)
n=7 (5%)
n=6 (4%) n=5 (4%)
n=2 (1%)
Excluded patients
Myeloid or lymphoid ma-lignancyNo active cancerHb and MCV don't meet criteriaThalassemiaSickle cellNever seen in clinicThrombophilias
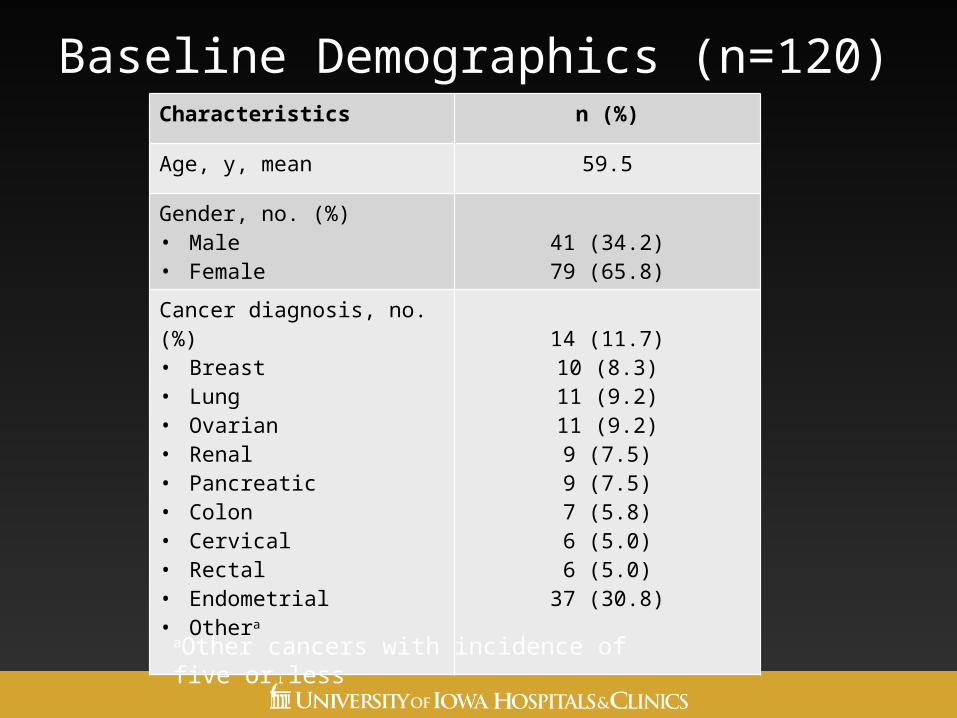
Baseline Demographics (n=120)Characteristics n (%)
Age, y, mean 59.5
Gender, no. (%)• Male• Female
41 (34.2)79 (65.8)
Cancer diagnosis, no. (%)• Breast• Lung• Ovarian• Renal• Pancreatic• Colon• Cervical• Rectal• Endometrial• Othera
14 (11.7)10 (8.3)11 (9.2)11 (9.2)9 (7.5)9 (7.5)7 (5.8)6 (5.0)6 (5.0)
37 (30.8)
aOther cancers with incidence of five or less
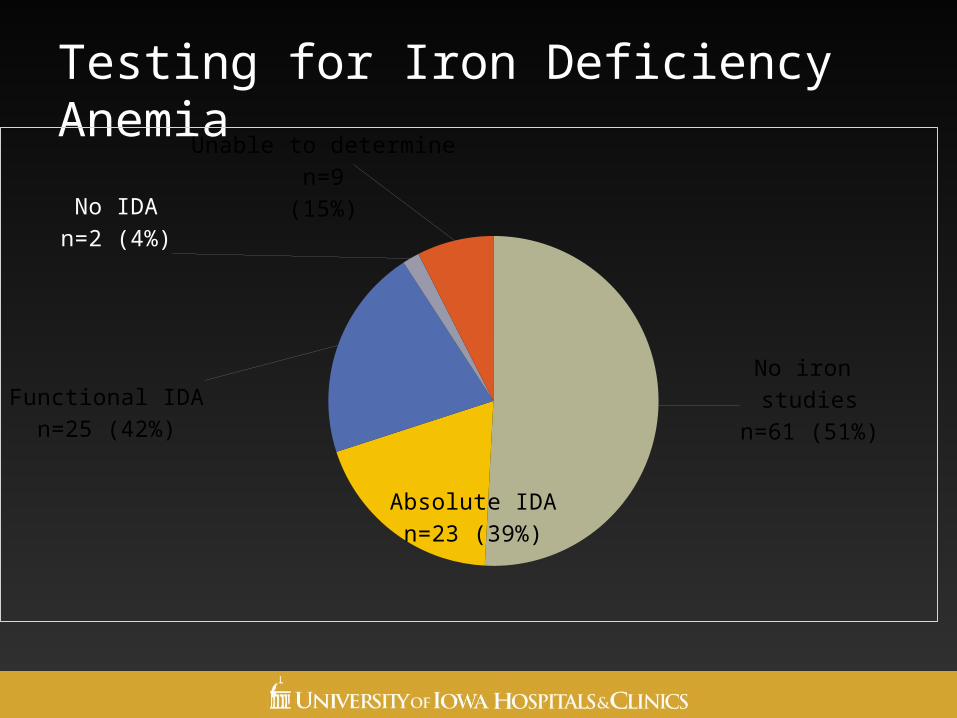
Testing for Iron Deficiency Anemia
No iron studies
n=61 (51%)
Absolute IDAn=23 (39%)
Functional IDAn=25 (42%)
No IDAn=2 (4%)
Unable to determinen=9
(15%)
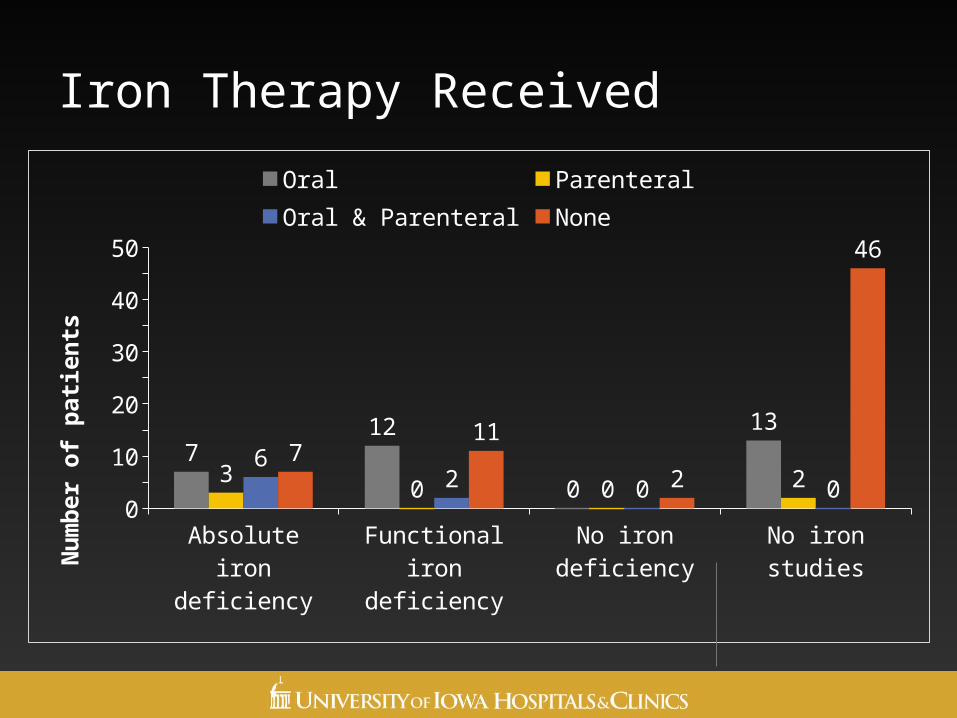
Iron Therapy Received
Absolu
te ir
on d
efici
ency
Funct
ional
iron
defic
iency
No iro
n de
ficien
cy
No iro
n st
udies
0
10
20
30
40
50
712
0
13
3 0 0 26
2 0 07
11
2
46
Oral Parenteral Oral & Parenteral None
Nu
mb
er o
f p
atie
nts
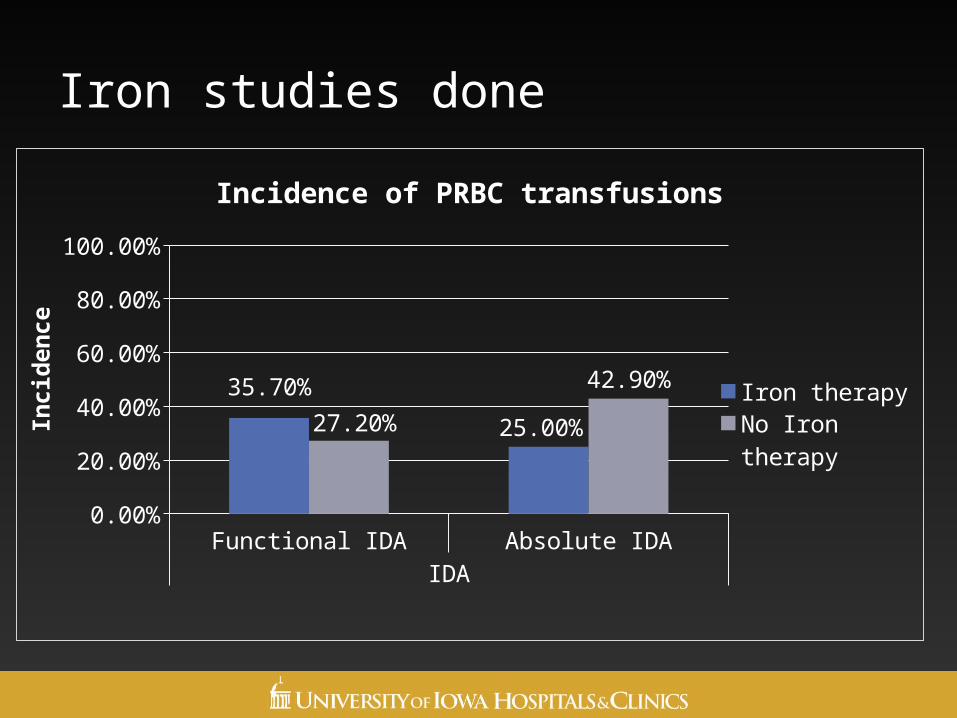
Iron studies done
Functional IDA Absolute IDAIDA
0.00%
20.00%
40.00%
60.00%
80.00%
100.00%
35.70%
25.00%27.20%
42.90%
Incidence of PRBC transfusions
Iron therapy
No Iron therapy
Inci
den
ce
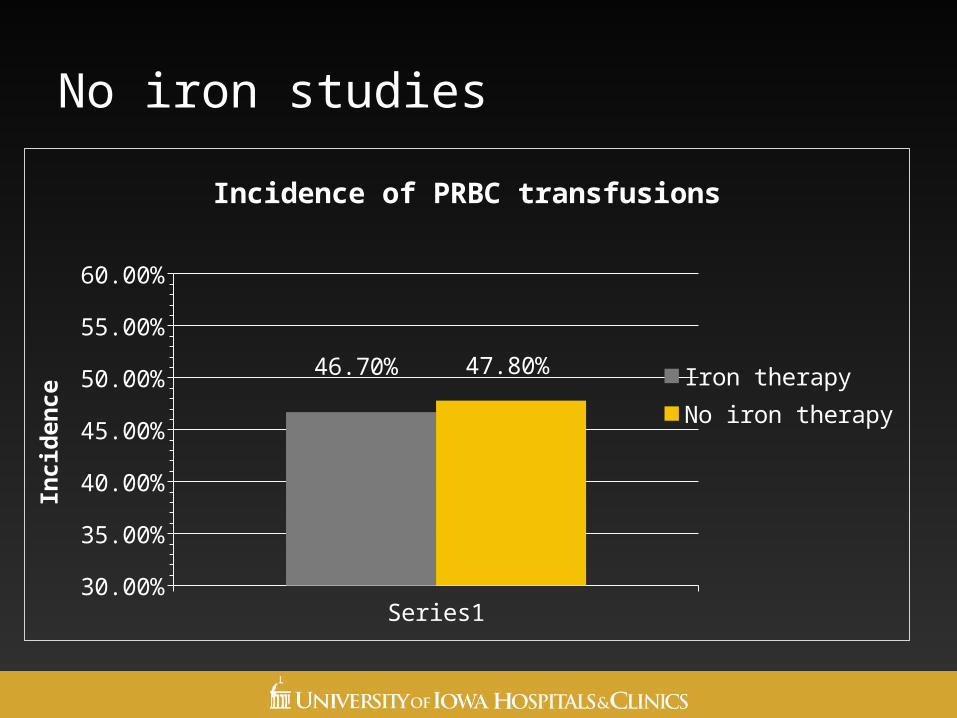
No iron studies
Series130.00%
35.00%
40.00%
45.00%
50.00%
55.00%
60.00%
46.70% 47.80%
Incidence of PRBC transfusions
Iron therapyNo iron therapy
Inci
den
ce
Conclusions
• Nearly half of the study population met criteria for iron studies, but did not receive them
• Of patients who had iron studies performed, 81% met criteria for IDA
• Incidence of blood transfusions was greater in absolute IDA group who did not receive iron therapy
• Opportunities exist for improvement in further evaluation of IDA
Acknowledgements
• Residency project advisors:• Jill E. Stein, Pharm.D., BCOP
• Susan Fajardo, Pharm.D.
• Susan Sorenson, RPh, BCOP
• Deanna McDanel, Pharm.D., BCPS, BCACP
• Student research assistant• Katharyn Stange, Pharm.D. Candidate

Evaluation of Iron Deficiency Anemia in a Hematology-Oncology Population at a Large Academic Medical Center
Tracy Harlan, Pharm.D.
PGY1 Pharmacy Resident with an Ambulatory Care Focus
University of Iowa Hospitals and Clinics (UIHC), Iowa City, IA
Outline of Today’s 2/2/2 PRESENTERSPHARMACY COORDINATED PROCALCITONIN LEVEL TO DIRECT
ANTIMICROBIAL THERAPY DURATION
Emily I-Chau Liang, PharmD
PGY1 Pharmacy Practice Resident
UnityPoint Health/Allen Memorial
Pharmacy Coordinated Procalcitonin Level to Direct Antimicrobial Therapy
Duration
Emily I-Chau Liang, Pharm.D.
PGY1 Pharmacy ResidentAllen Hospital
1731 W Ridgeway Ave, Waterloo, IA
44

Disclosure StatementDisclosure statement: these individuals have the
following to disclose concerning possible financial or personal relationships with commercial entities (or their competitors) that may be referenced in this presentation.
◦ Resident: Emily I-Chau Liang has nothing to disclose.
◦ Project Director and Advisor: Jeff Martin and Lisa Veit have nothing to disclose.
45
ObjectivesObjective #1)
◦ Identify procalcitonin as a biomarker for detecting the severity of bacterial infection.
Objective #2) ◦ Recognize procalcitonin to be a safe and effective
biomarker for early discontinuation of antimicrobial therapy in patients with sepsis and/or pneumonia.
46
Background: Procalcitonin 7,9
Precursor hormone of calcitonin◦ Procalcitonin (PCT) ↑ in response to severe systemic
inflammation by bacterium.Generation: Activation of monocytic cells.
◦ Occurs during sepsis and other conditions such as tissue trauma, pancreatitis…etc.
Sensitivity: 67% to 80% Specificity: 70% to 91%Peak: Between 24 to 48 hours after onset of infection.After reaching peak level
◦ PCT ↓ by 50% at 1 to 1 ½ days.
47
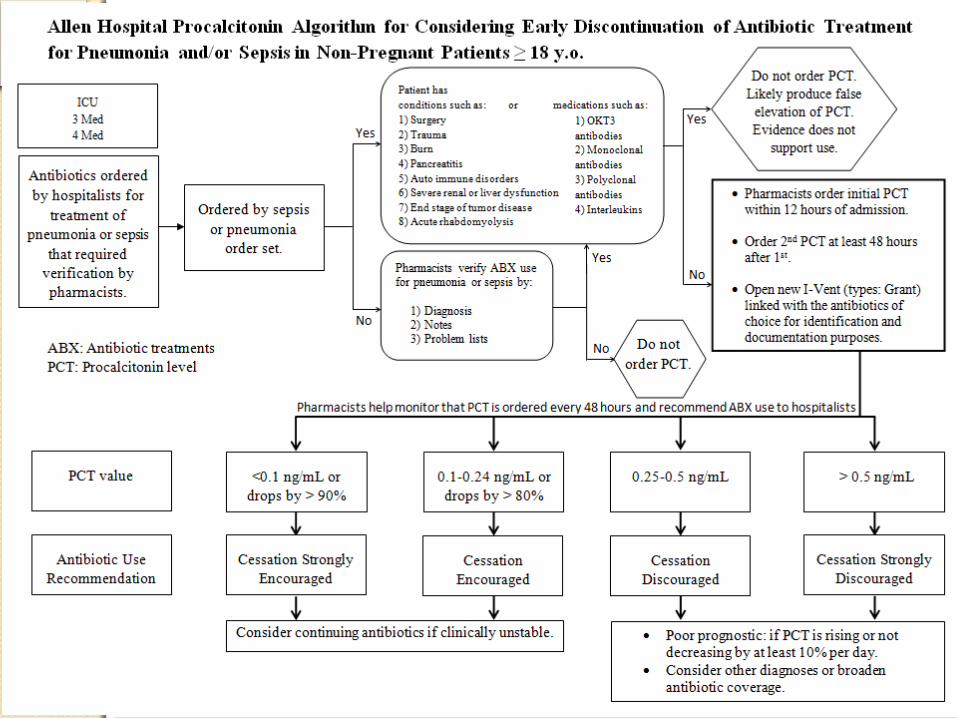
Background: Level Indication 7
PCT levels◦ Healthy individual:<0.1 ng/mL
◦ Severe bacterial infection:≥ 0.5 ng/mL
◦ High levels of PCT • Increased mortality risk• Poor prognosis
False Elevation◦ Conditions
◦ MedicationsElimination
◦ Kidney
48
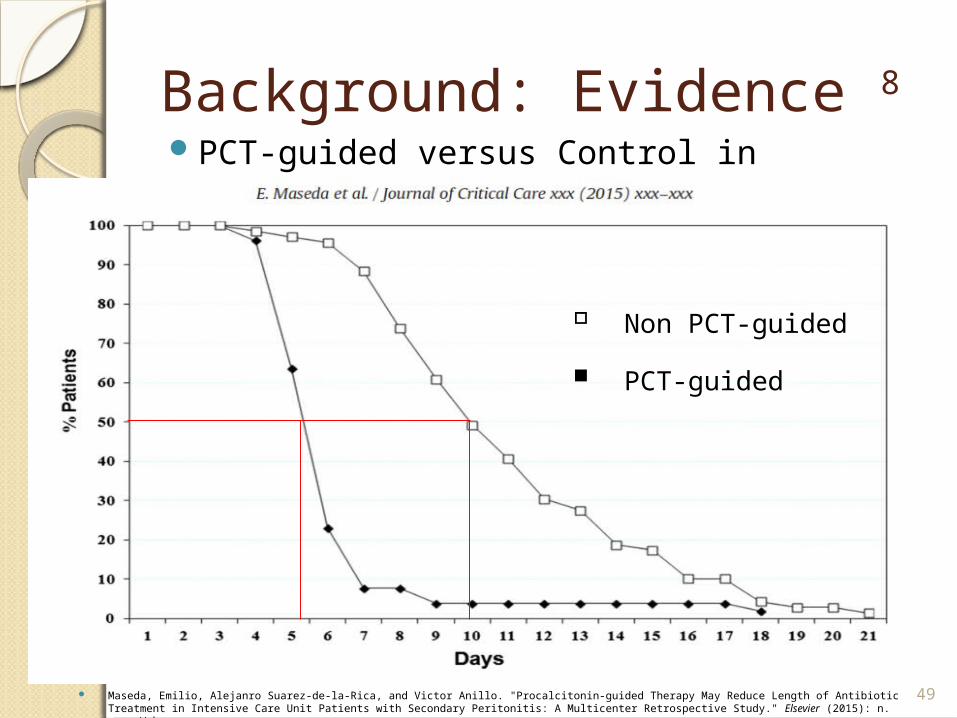
Background: Evidence 8
PCT-guided versus Control in Antibiotic Duration
49 Maseda, Emilio, Alejanro Suarez-de-la-Rica, and Victor Anillo. "Procalcitonin-guided Therapy May Reduce Length of Antibiotic Treatment in Intensive Care Unit Patients with Secondary Peritonitis: A Multicenter Retrospective Study." Elsevier (2015): n. pag. Web.
▫ Non PCT-guided
▪ PCT-guided
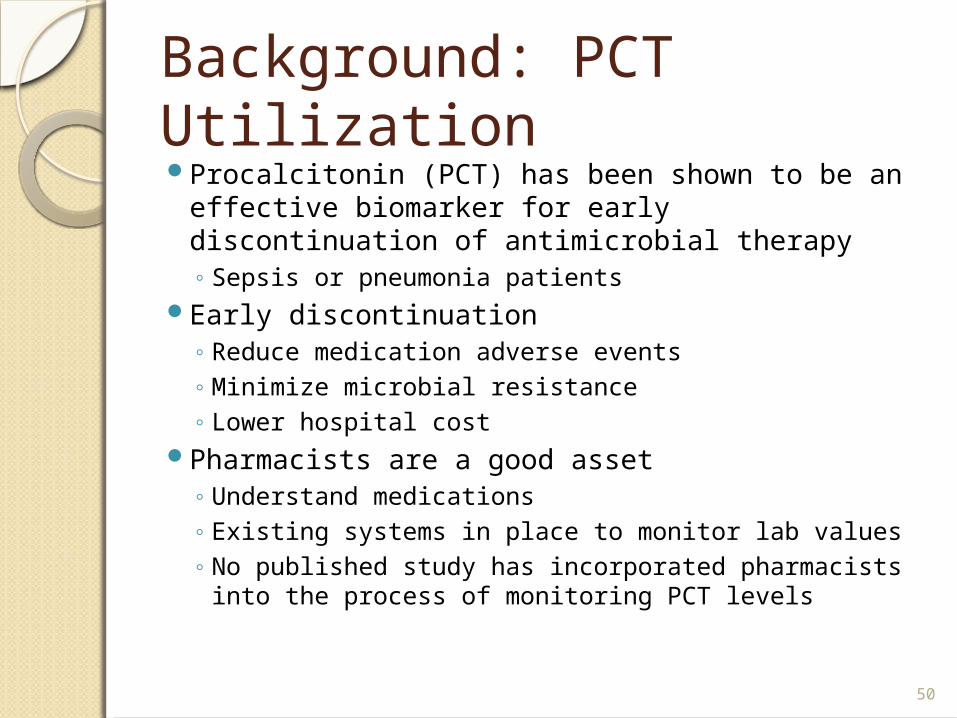
Background: PCT UtilizationProcalcitonin (PCT) has been shown to be an effective
biomarker for early discontinuation of antimicrobial therapy ◦ Sepsis or pneumonia patients
Early discontinuation◦ Reduce medication adverse events◦ Minimize microbial resistance◦ Lower hospital cost
Pharmacists are a good asset ◦ Understand medications ◦ Existing systems in place to monitor lab values◦ No published study has incorporated pharmacists into the
process of monitoring PCT levels
50
PurposeExplore the effect of implementing a pharmacist
coordinated PCT level monitoring protocol to assist in the decision making process for antimicrobial therapy
51
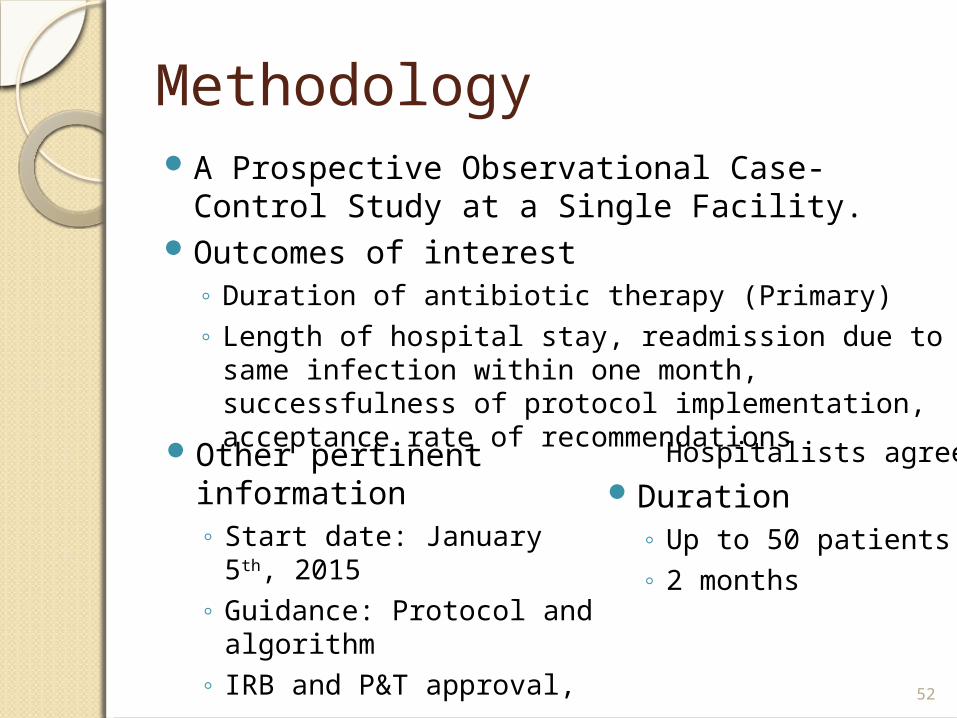
MethodologyA Prospective Observational Case-Control Study at a
Single Facility.Outcomes of interest
◦ Duration of antibiotic therapy (Primary)
◦ Length of hospital stay, readmission due to same infection within one month, successfulness of protocol implementation, acceptance rate of recommendations
52
Other pertinent information◦ Start date: January 5th, 2015
◦ Guidance: Protocol and algorithm
◦ IRB and P&T approval, Hospitalists agreed
Duration◦ Up to 50 patients
◦ 2 months
53
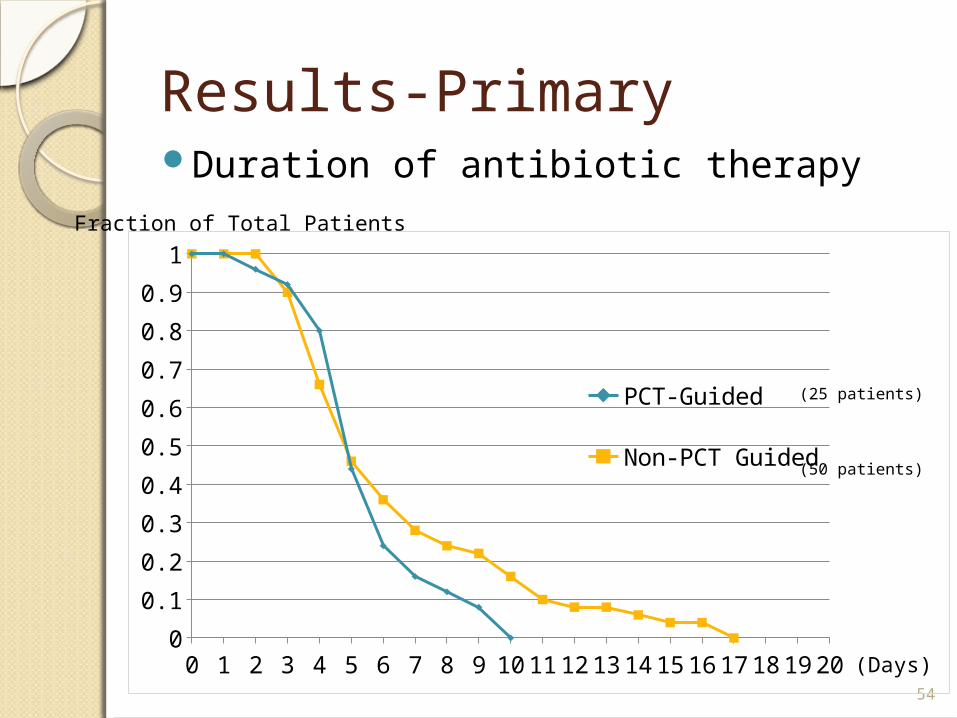
Results-PrimaryDuration of antibiotic therapy
54
0 1 2 3 4 5 6 7 8 9 10111213141516171819200
0.1
0.2
0.3
0.4
0.5
0.6
0.7
0.8
0.9
1
PCT-Guided
Non-PCT Guided
(Days)
Fraction of Total Patients
(25 patients)
(50 patients)
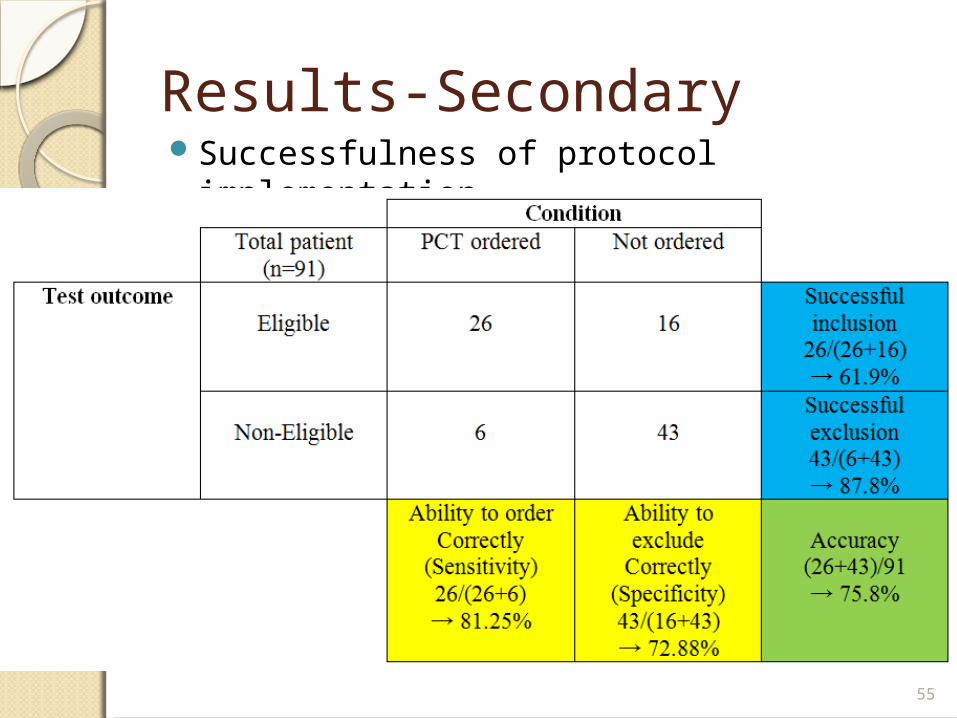
Results-SecondarySuccessfulness of protocol implementation
55
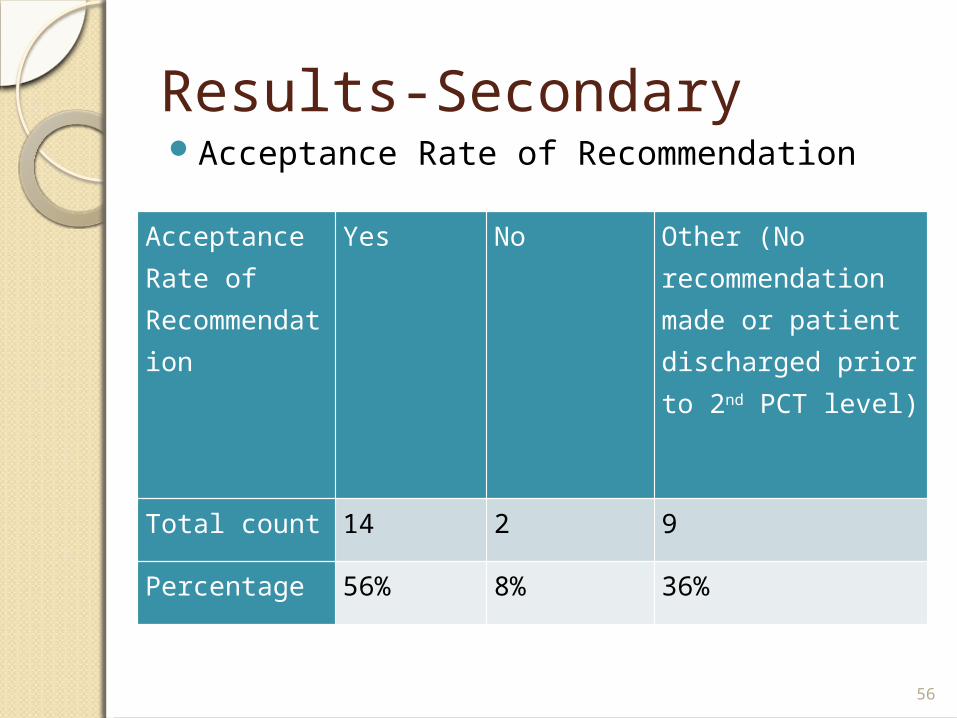
Results-SecondaryAcceptance Rate of Recommendation
56
Acceptance Rate of Recommendation
Yes No Other (No recommendation made or patient discharged prior to 2nd PCT level)
Total count 14 2 9
Percentage 56% 8% 36%
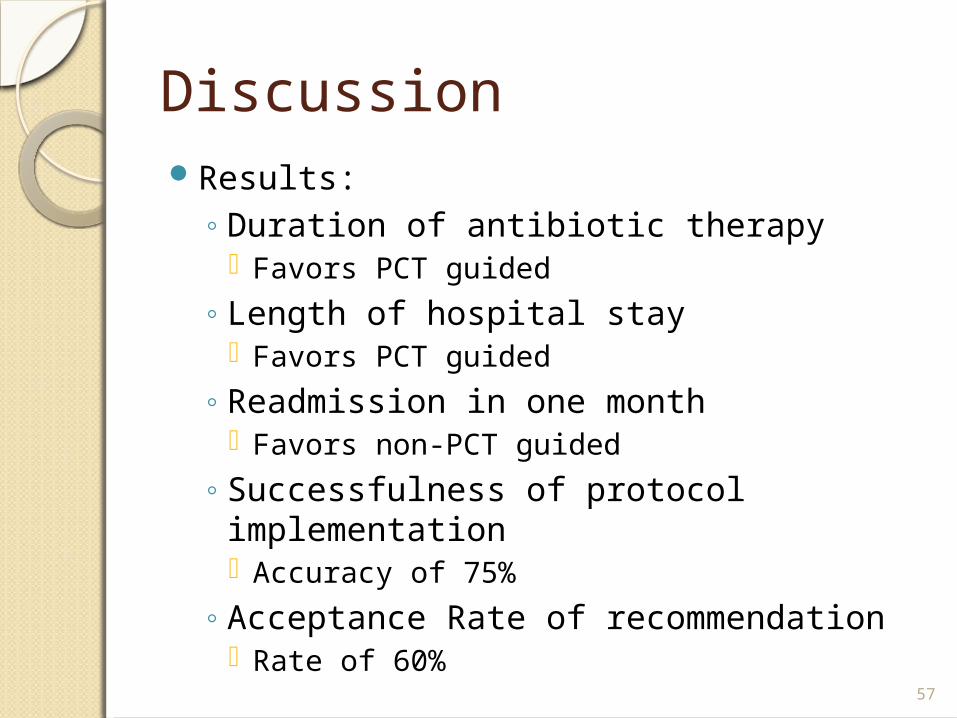
DiscussionResults:
◦ Duration of antibiotic therapy Favors PCT guided
◦ Length of hospital stay Favors PCT guided
◦ Readmission in one month Favors non-PCT guided
◦ Successfulness of protocol implementation Accuracy of 75%
◦ Acceptance Rate of recommendation Rate of 60%
57
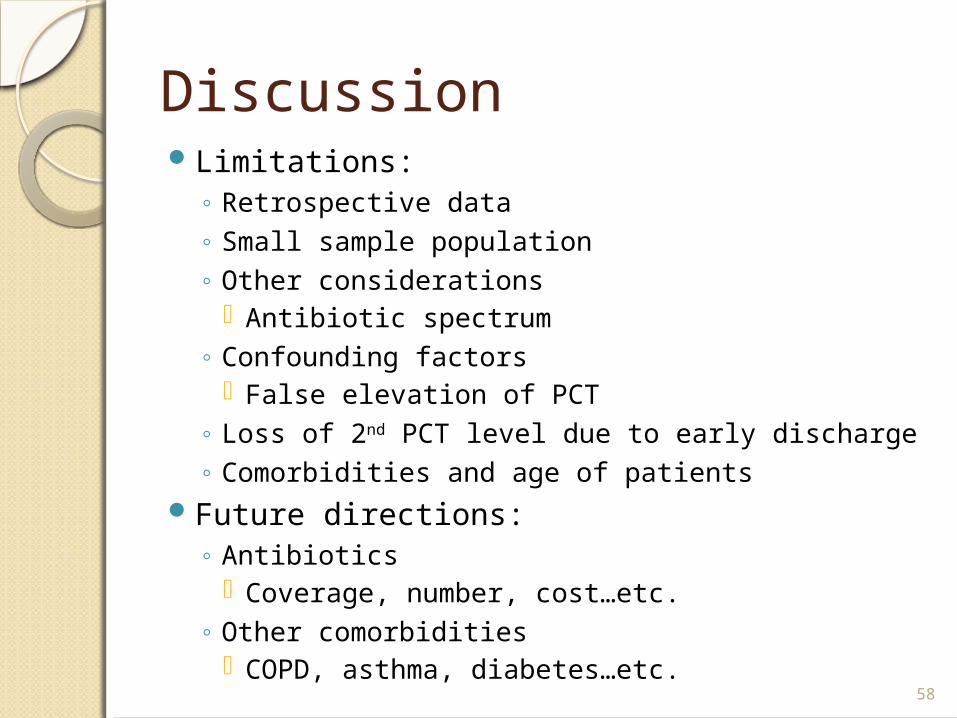
Discussion Limitations:
◦ Retrospective data
◦ Small sample population
◦ Other considerations Antibiotic spectrum
◦ Confounding factors False elevation of PCT
◦ Loss of 2nd PCT level due to early discharge
◦ Comorbidities and age of patients Future directions:
◦ Antibiotics Coverage, number, cost…etc.
◦ Other comorbidities COPD, asthma, diabetes…etc. 58
ConclusionClinical judgment is always the key!
◦ Other labs, cultures, and patient’s disease progression have to be considered as well.
PCT provides another piece of evidence for clinical decision of early discontinuation of antibiotics.
Positive clinical finding trumps PCT.
PCT is proven effective for early discontinuation of antibiotic in sepsis/pneumonia.
59
References1. Bishop, Bryan M., John J. Bon, and Tamara L. Trienski, et al. "Effect of Introducing Procalcitonin on
Antimicrobial Therapy Duration in Patients With Sepsis and/or Pneumonia in the Intensive Care Unit." Annals of Pharmacotherapy 48.5 (2014): 577-83.
2. Christ-Crain, Mirjam, Daiana Jaccard-Stolz, and Roland Bingisser. "Effect of Procalcitonin-guided Treatment on Antibiotic Use and Outcome In Lower Respiratory Tract Infections: Cluster-randomised, Single-blinded Intervention Trial." The Lancet 363 (2004): 600-07. Web.
3. Deliberato, Rodrigo O., Alexandre R. Marra, and Paula R. Sanches, et al. "Clinical and Economic Impact of Procalcitonin to Shorten Antimicrobial Therapy in Septic Patients with Proven Bacterial Infection in an Intensive Care Setting." ELSEVIER 76 (2013): 266-71.
4. Harbarth S, Holeckova K, Froidevaux C, et al. “Diagnostic value of procalcitonin, interleukin-6, and interleukin-8 in critically ill patients admitted with suspected sepsis. Am J Respir Crit Care Med. 2001;164:396-402.
5. Heyland, Daren K., Ana P. Johnson, Steven C. Reynolds, and John Muscedere. "Procalcitonin for Reduced Antibiotic Exposure in the Critical Care Setting: A Systematic Review and an Economic Evaluation*." Critical Care Medicine 39.7 (2011): 1792-799. Web.
6. Jensen, Jens U., Lars Hein, and Bettina Lundgren. "Procalcitonin-guided Interventions against Infections to Increase Early Appropriate Antibiotics and Improve Survival in the Intensive Carea Unit: A Randomized Trial." Crit Care Med 39.9 (2011): 2048-058. Web.
7. Layios, Nathalie, and Bernard Lambermont. "Procalcitonin for Antibiotic Treatment in Intensive Care Unit Patients." Curr Infect Dis Rep 15 (2013): 394-99.
8. Maseda, Emilio, Alejanro Suarez-de-la-Rica, and Victor Anillo. "Procalcitonin-guided Therapy May Reduce Length of Antibiotic Treatment in Intensive Care Unit Patients with Secondary Peritonitis: A Multicenter Retrospective Study." Elsevier (2015): n. pag. Web.
9. Meisner, Michael. "Update on Procalcitonin Measurements." Annals of Laboratory Medicine 34 (2014): 263-73.
10. Stefan, Riedel. "Procalcitonin and the Role of Biomarkers in the Diagnosis and Management of Sepsis." ELSEVIER 73 (2012): 221-27.
11. Soni, Nilam J., David J. Samson, and Jodi L. Galaydick. "Procalcitonin-Guided Antibiotic Therapy: A Systematic Review and Meta-analysis." Journal of Hospital Medicine 8 (2013): 530-40. 60
Outline of Today’s 2/2/2 PRESENTERS EVALUATING PHARMACIST INTERVENTIONS PERFORMED DURING IMPLEMENTATION OF A NEW-PAYER MODEL USING PROFESSIONAL
SERVICE FEES
Rani Raju, PharmD
PGY1 Community Pharmacy Resident
University of Iowa/Towncrest Pharmacy
Evaluating Pharmacist Interventions Performed During Implementation of
a New-Payer Model using Professional Fees
Rani Raju, Pharm.D.PGY1 Community Practice ResidentUniversity of Iowa College of PharmacyIowa City, IA

Disclosure StatementDisclosure statement: these individuals have the following to disclose concerning possible financial or personal relationships with commercial entities (or their competitors) that may be referenced in this presentation.▫ Resident: Rani Raju has nothing to disclose.▫ Project Director, Advisors, & Co-Investigators:
Randy McDonough, Michael Deninger, William Doucette, and Stevie Veach have nothing to disclose
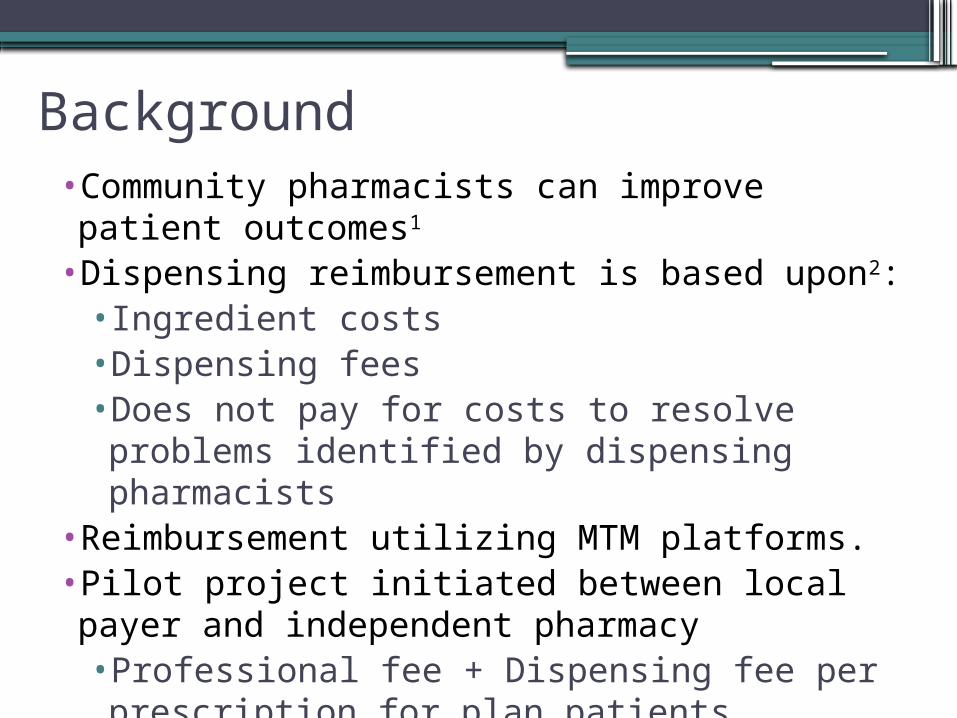
Background • Community pharmacists can improve patient outcomes1
• Dispensing reimbursement is based upon2:• Ingredient costs • Dispensing fees• Does not pay for costs to resolve problems identified by
dispensing pharmacists• Reimbursement utilizing MTM platforms. • Pilot project initiated between local payer and
independent pharmacy • Professional fee + Dispensing fee per prescription for
plan patients
Objectives
•To quantify, classify and evaluate the types of interventions documented by pharmacists when paid a professional fee in addition to a dispensing fee
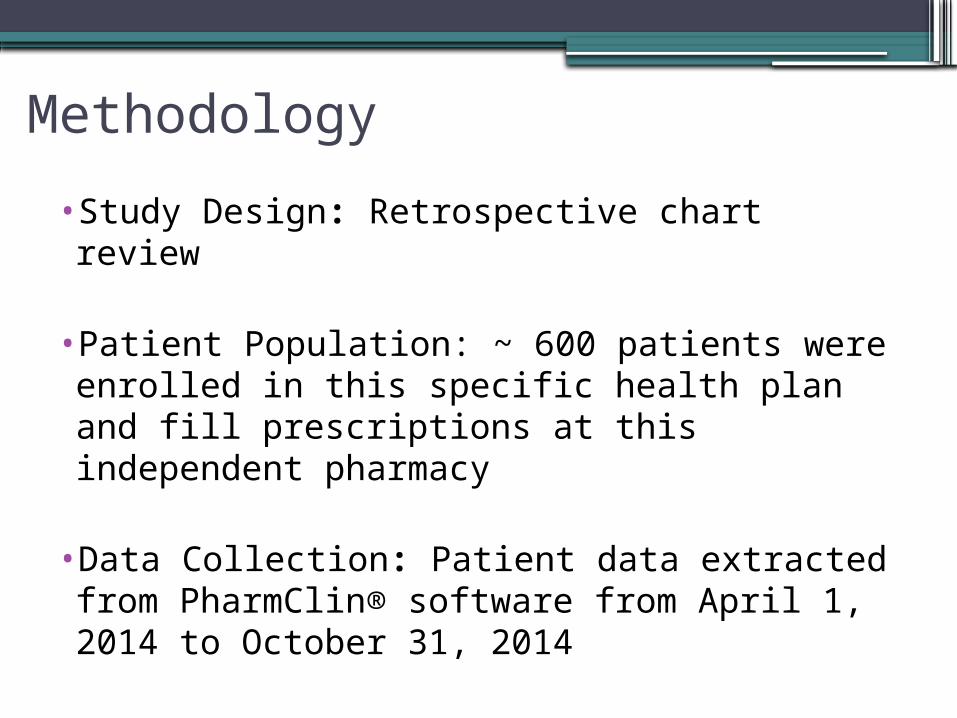
Methodology
• Study Design: Retrospective chart review
• Patient Population: ~ 600 patients were enrolled in this specific health plan and fill prescriptions at this independent pharmacy
• Data Collection: Patient data extracted from PharmClin® software from April 1, 2014 to October 31, 2014
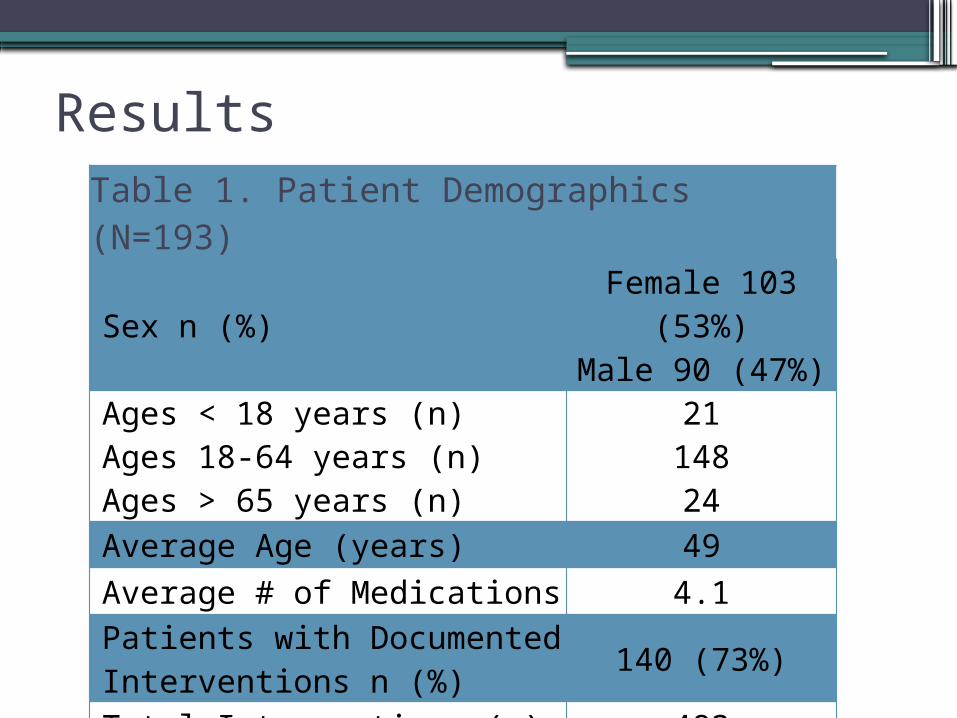
Results Table 1. Patient Demographics (N=193)
Sex n (%) Female 103 (53%)Male 90 (47%)
Ages < 18 years (n)Ages 18-64 years (n)Ages > 65 years (n)
2114824
Average Age (years) 49Average # of Medications 4.1
Patients with Documented Interventions n (%) 140 (73%)
Total Interventions (n) 483
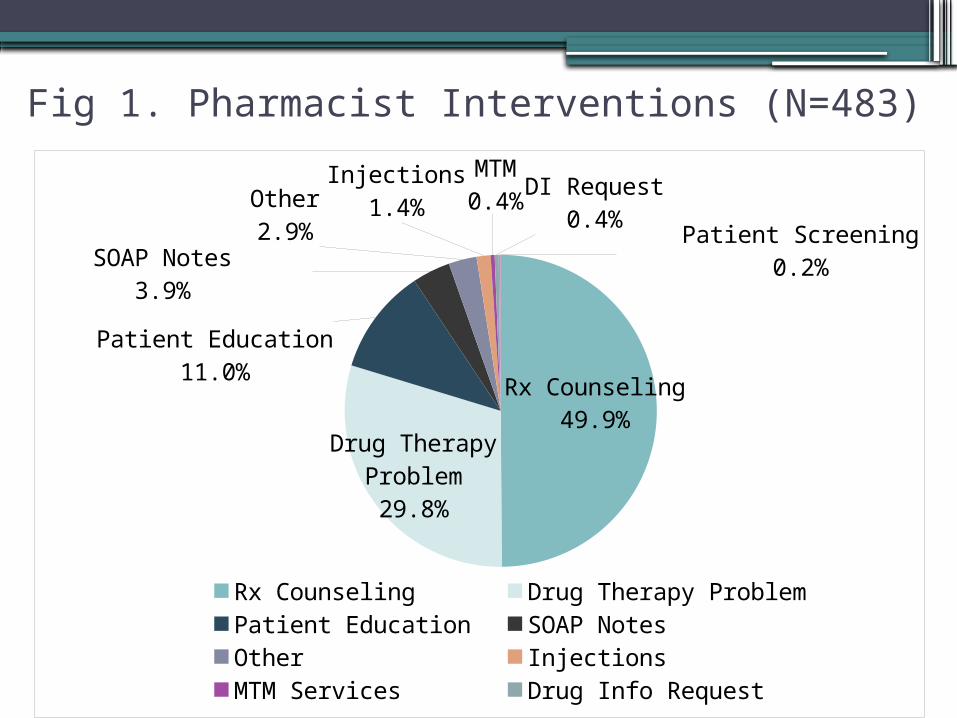
Fig 1. Pharmacist Interventions (N=483)
Rx Counseling49.9%
Drug Therapy Problem29.8%
Patient Education11.0%
SOAP Notes3.9%
Other2.9%
Injections1.4%
MTM0.4% DI Request
0.4%Patient Screening
0.2%
Rx Counseling Drug Therapy Problem Patient Education
SOAP Notes Other Injections
MTM Services Drug Info Request Patient Screening
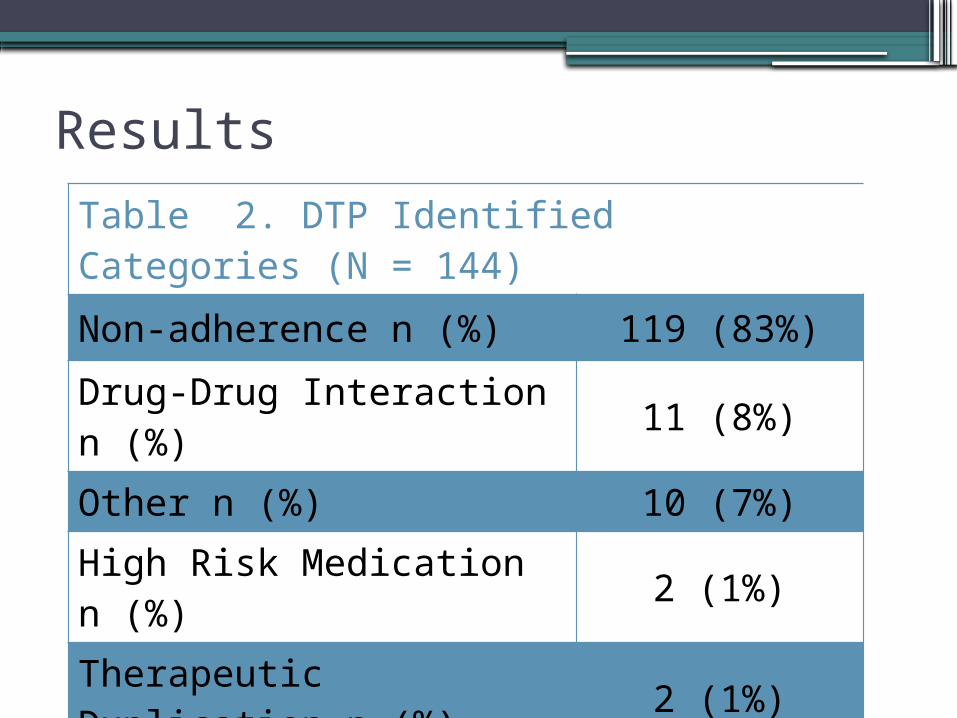
Results
Table 2. DTP Identified Categories (N = 144)
Non-adherence n (%) 119 (83%)
Drug-Drug Interaction n (%) 11 (8%)
Other n (%) 10 (7%)
High Risk Medication n (%) 2 (1%)
Therapeutic Duplication n (%) 2 (1%)
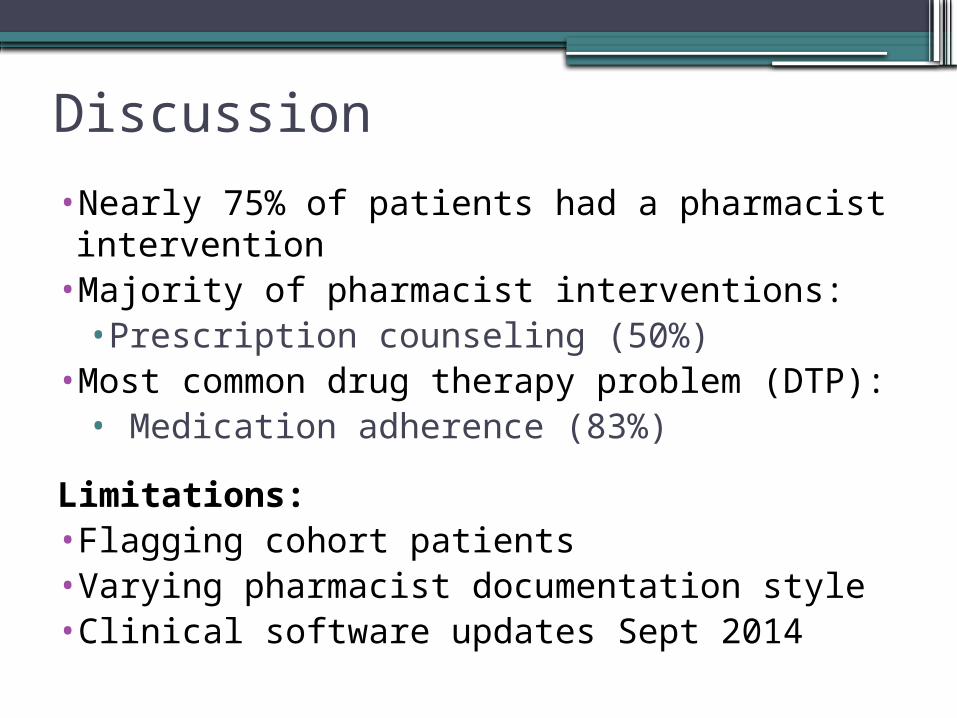
Discussion
• Nearly 75% of patients had a pharmacist intervention• Majority of pharmacist interventions:
• Prescription counseling (50%)• Most common drug therapy problem (DTP):
• Medication adherence (83%)
Limitations: • Flagging cohort patients • Varying pharmacist documentation style• Clinical software updates Sept 2014
Conclusion• Pharmacists can make critical clinical interventions during
dispensing process.• Better clinical documentation of interventions can:
• Shift pharmacy practice to focus more on delivering quality health care
• Show pharmacists’ value as health care providers• Research is in progress to determine:
• Total health care spend• Pharmacy performance measures.
References
1. Hawksworth GM, et al. Clinical pharmacy interventions by community pharmacists during the dispensing process. Br J Clinical Pharmacology. 1999;47:695-70.
2. Mattingly J. Understanding Drug Pricing. US Pharmacist. 2012. Accessed Aug 30, 2014. Last Updated 6/20/2012. http://www.uspharmacist.com/content/s/216/c/34894/

Questions
Outline of Today’s 2/2/2 PRESENTERSASSESSING ATTITUDES AND KNOWLEDGE OF PATIENTS AND
PROVIDERS ABOUT ROLES AND SERVICES FOR DIABETES CARE
Valerie Wersching, PharmD
PGY1 Community Pharmacy Resident
University of Iowa/Osterhaus Pharmacy
ASSESSING ATTITUDES AND KNOWLEDGE OF PATIENTS AND PROVIDERS ABOUT
ROLES AND SERVICES FOR DIABETES CARE
Valerie Wersching, PharmDUniversity of Iowa College of Pharmacy
PGY-1 Community Pharmacy Practice Resident
Osterhaus Pharmacy
Working Together to Manage Diabetes: A CDC Toolkit for Pharmacy, Podiatry, Optometry, and
Dentistry
Disclosure• No conflict of interest to
disclose• Did not receive funding from
any source
Background of Study• Three main questions
– How much do patients know about their diabetes care and the various providers that play a role?
– How much do providers know about what each other can offer in the care of patients with diabetes?
– Does better coordination of care amongst various providers lead to better outcomes for our mutual patients with diabetes?
What is PPOD?• A toolkit developed by the CDC to
encourage providers (in particular pharmacists, podiatrists, optometrists, and dentists) to take a multidisciplinary approach in caring for patients with diabetes
• It recommends evaluating the whole patient, not just individual specialties
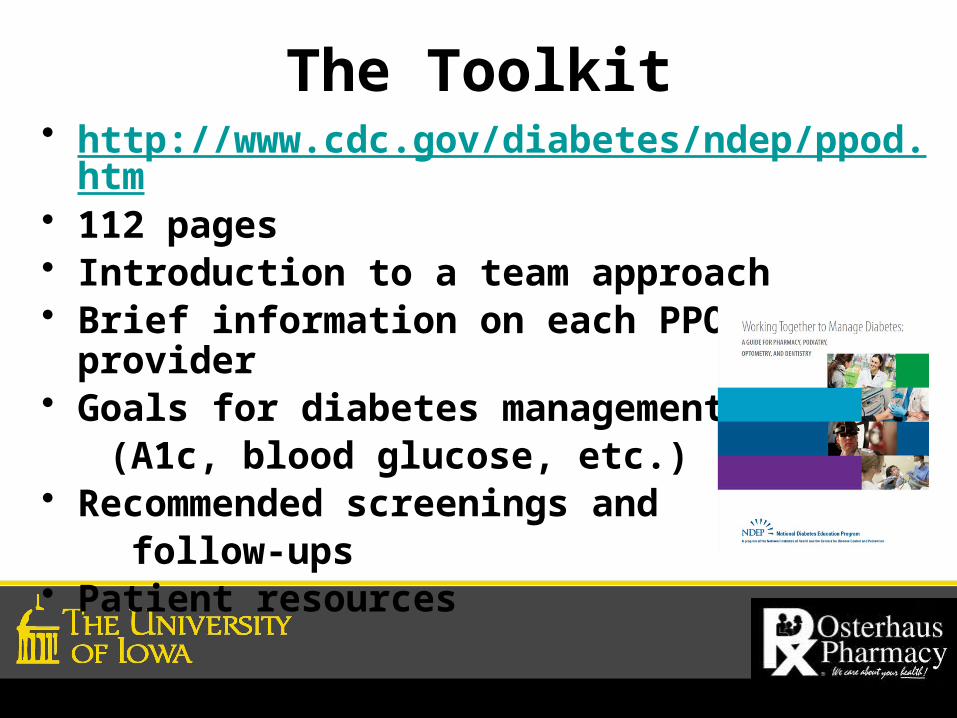
The Toolkit• http://www.cdc.gov/diabetes/ndep/ppod.
htm• 112 pages• Introduction to a team approach• Brief information on each PPOD provider• Goals for diabetes management (A1c, blood glucose, etc.)• Recommended screenings and follow-ups• Patient resources
PPOD Providers:• Reinforce consistent messages to patients
across different disciplines• Encourage patients to complete annual
recommended screenings and follow-ups• Provide patients with education about
diabetes and how to self-manage their condition
• Identify potential diabetes complications and refer patient to physician or other PPOD provider for follow-up
• Monitor diabetes clinical markers and progression of disease
The Importance of Coordinating Care in
Diabetes• Minimize disease-related complications
– Periodontal disease– Neuropathy– Blindness– Cardiovascular disease– Renal insufficiency
• Reduce healthcare costs– Constitutes 27% of national healthcare medication
costs• Optimize outcomes• Improve patient education and self-
management
Study Objectives• To assess:
– Patients’ knowledge of the recommendations for diabetes care and the role of PPOD providers in their care
– The effect of introducing the CDC’s PPOD toolkit on providers’ knowledge of each others’ services offered in managing diabetes and attitudes toward collaborating
Study Methods• Phase 1: Patient portion
– Patient population: Age 18 that filled any diabetes medication from 01/01/14 to 12/31/14. Exclusion criteria: cognitive deficits and metformin use for Polycystic Ovary Syndrome
• Phase 2: Provider portion– PPOD providers practicing in
Maquoketa, IA
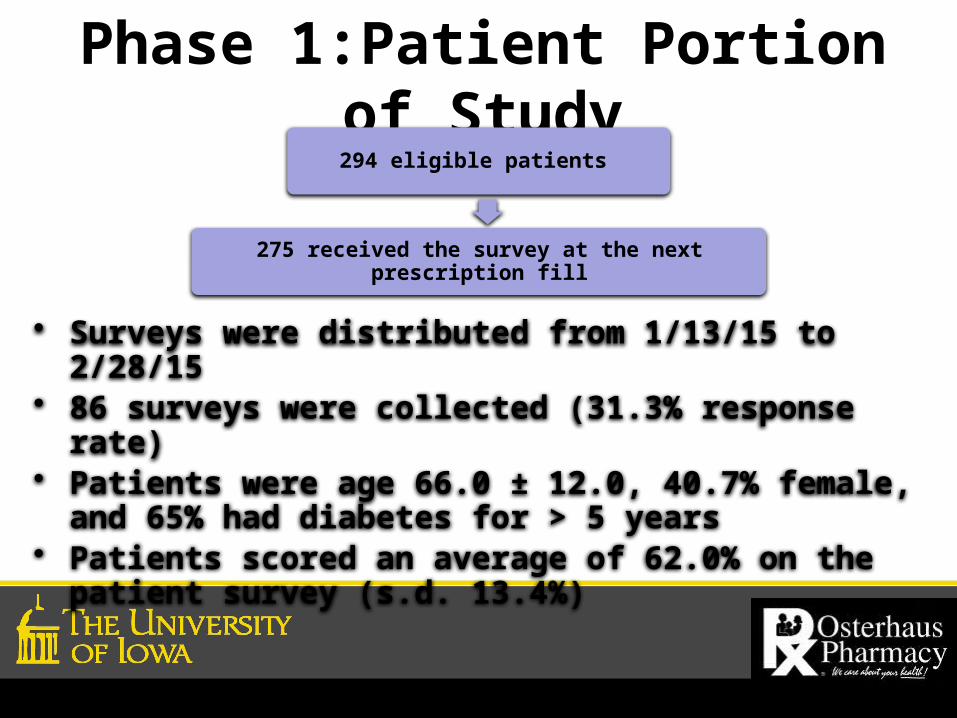
Phase 1:Patient Portion of Study
294 eligible patients
275 received the survey at the next prescription fill
• Surveys were distributed from 1/13/15 to 2/28/15
• 86 surveys were collected (31.3% response rate)
• Patients were age 66.0 ± 12.0, 40.7% female, and 65% had diabetes for > 5 years
• Patients scored an average of 62.0% on the patient survey (s.d. 13.4%)
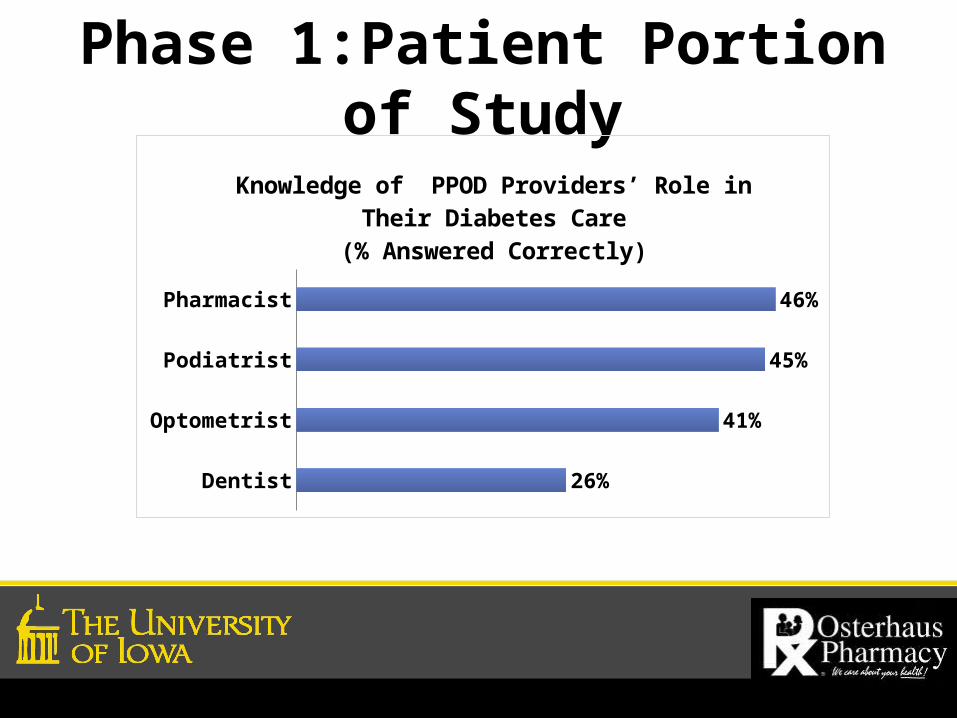
Phase 1:Patient Portion of Study
Dentist
Optometrist
Podiatrist
Pharmacist
26%
41%
45%
46%
Knowledge of PPOD Providers’ Role in Their Diabetes Care
(% Answered Correctly)
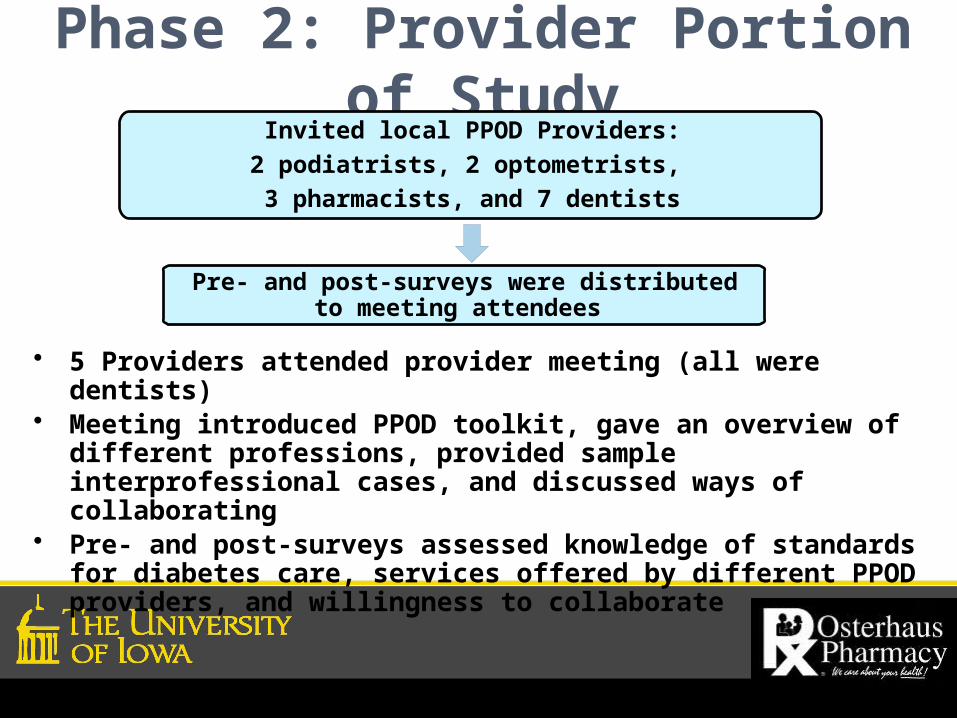
Phase 2: Provider Portion of Study
Invited local PPOD Providers:2 podiatrists, 2 optometrists, 3 pharmacists, and 7 dentists
Pre- and post-surveys were distributed to meeting attendees
• 5 Providers attended provider meeting (all were dentists)
• Meeting introduced PPOD toolkit, gave an overview of different professions, provided sample interprofessional cases, and discussed ways of collaborating
• Pre- and post-surveys assessed knowledge of standards for diabetes care, services offered by different PPOD providers, and willingness to collaborate
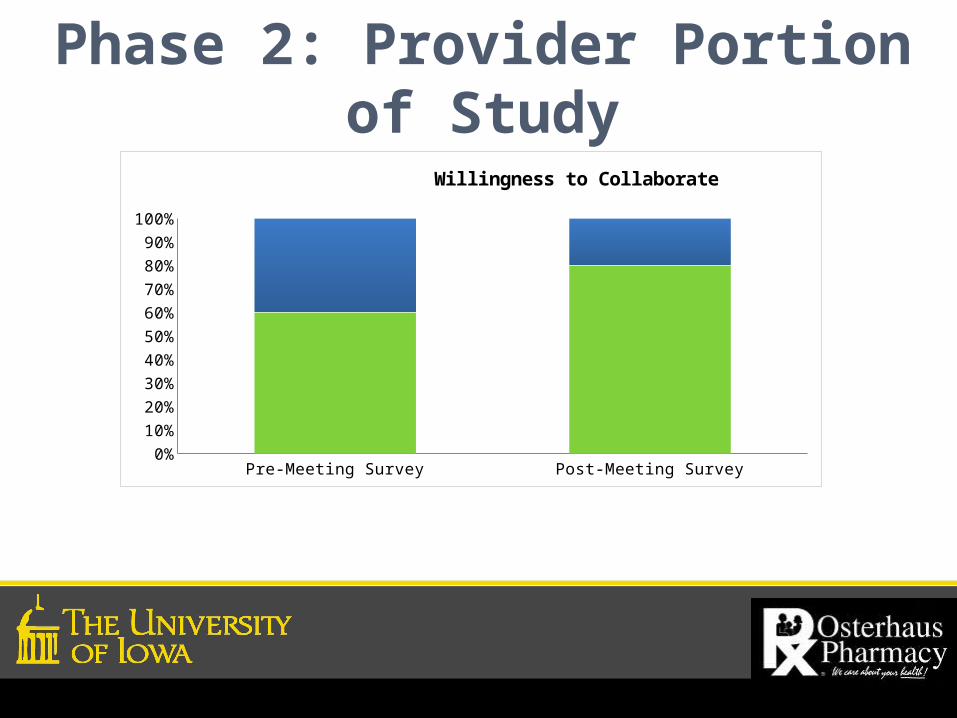
Phase 2: Provider Portion of Study
Pre-Meeting Survey Post-Meeting Survey
Strongly Agree 0.6 0.8
Agree 0.4 0.2
5%15%25%35%45%55%65%75%85%95%
Willingness to Collaborate
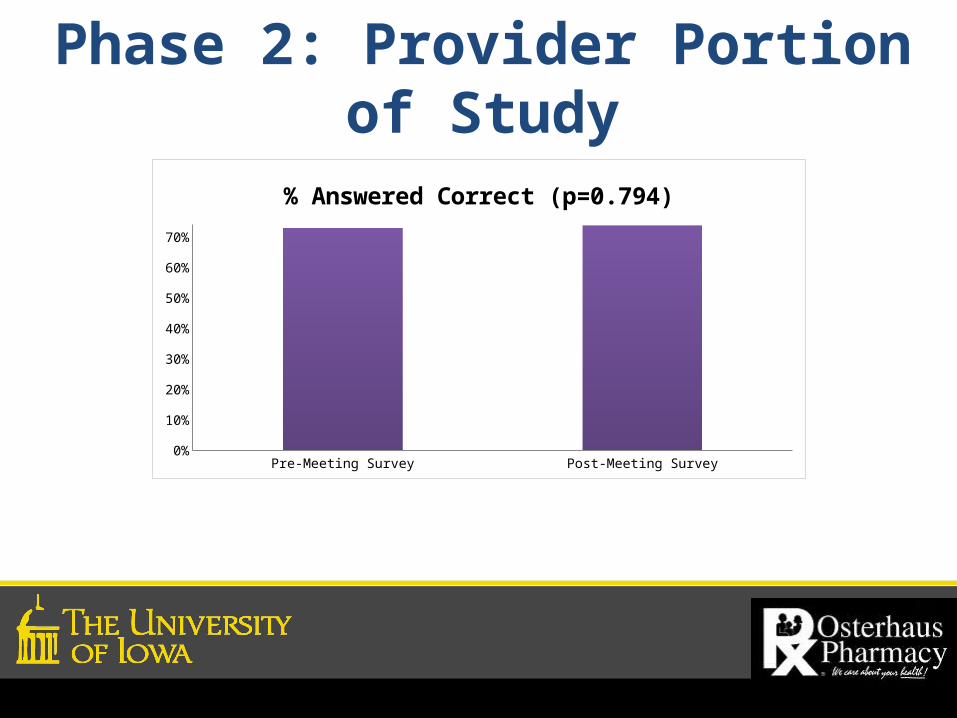
Phase 2: Provider Portion of Study
Pre-Meeting Survey Post-Meeting Survey
% 0.73 0.738
5%
15%
25%
35%
45%
55%
65%
% Answered Correct (p=0.794)
Discussion• Patient survey responses suggested gaps in
knowledge of PPOD providers’ role in their diabetes care
• Of the 4 PPOD providers, patients more frequently identified roles of pharmacists and podiatrists in their diabetes care
• Providers’ knowledge of each others’ services remained constant between pre- and post-meeting survey
• PPOD providers were willing to collaborate both pre- and post-provider meeting
• Ideas were shared at the local PPOD provider meeting on the process of communication and coordination of care with each other
Limitations and Conclusions• Limitations:
• Distribution period for patient surveys was limited to a 9 week period
• No intervention or post-survey was given to patients
• Only dentists attended the PPOD meeting• Conclusions:
• Patients’ knowledge of their diabetes and the PPOD providers’ roles were low
• Pharmacists will provide education to patients on the roles of PPOD providers and appropriate follow-up
• Plans for formal collaboration with local PPOD providers are in process
References1. "Statistics About Diabetes." American Diabetes
Association, 10 June 2014. Web. <http://www.diabetes.org/diabetes-basics/statistics/>.
2. American Diabetes Association. Standards of medical care in diabetes—2014. Diabetes Care. 2014;37(suppl 1):S14-S80.
3. "Working Together to Manage Diabetes: A Toolkit for Pharmacy, Podiatry, Optometry, and Dentistry (PPOD)." Centers for Disease Control and Prevention, 16 July 2014.

Thank You!!!Feel free to contact me!
Valerie Wersching, [email protected](563) 652-5611 (Osterhaus #)
(847) 903-8763 (cell)
JOIN US TUESDAY, MAY 12:OPEN FORUM ON
PROPOSED IPA POLICIESQuestions? Contact Laura Miller at [email protected] or 515-270-0713