Embed Size (px)
Citation preview
International Journal of Scientific & Engineering Research, Volume 6, Issue 4, April-2015 ISSN 2229-5518
IJSER © 2015
http://www.ijser.org
Anthocyanin Pigment Identification of Batu Local Rose Flower as A Natural Colorant to Replace
Harmful Rhodamin B Colorant Elfi Anis Saati
Abstract— This study aimed at identifying anthocyanin pigment in local rose petal from Batu. Extraction processes were conducted in four-
level solvents (aquades-citric acid, aquades-lactic acid, methanol-HCl and Aquades-sulfuric acid). In order to measure the potential amount
of anthocyanin pigment, isolation procedure was done with its twice further developers, concentrated HCl: H2O=3:97 and BuOH-HCl (n
BuOH: HCl 2N=1:1) resulting in isolate and powdered pigment. The identification of anthocyanin was further conducted by using UV Vis
spectrophotometry and FTIR analysis (by malvidin chloride standard). The study result showed that the use of aquades-citric acid and
aquades-lactic acid triggered the most apparent anthocyanin pigment identification, as observed by their peak absorbency scale of 0.408
and 0.679 at 513.5-514 nm. The anthocyanin types identified by utilizing spectrophotometry and FTIR analyzes were malvidin glycoside,
sianidin glucoside, and pelargonidin glycoside
Index Terms— Key words: anthocyanin, Batu local rose flower, natural colorant, Rhodamin B
—————————— ——————————
1 INTRODUCTION
A nthocyanin pigment is a water-soluble pigment that fre-
quently exists in biological diversity in Indonesian nature. It is
commonly represented by red, pink, purple, and bluish colors
[1,2,3]. These colors are also likely to be chosen for food and
beverage outlook in Indonesian society, including some cos-
metic products [4]. However, some news has reported the high
frequency of people using non-food colorant such as Rhoda-
min B which is in fact harmful for human consumption. This
issue has become a major concern especially in higher educa-
tion level that holds broad responsibility to develop safe and
healthy food technology. Therefore, an exploration of local
natural product to replace the dangerous non-food colorant is
of urgency. One of which is by extracting the potential of a
particular pigment as natural colorant [5].
Rose flower is the most preferred flower and acts as a symbol
of love or likeliness; in addition, it is massively grown for dec-
orative flower supply both in formal and informal events [6].
Rose is majorly cultivated in Batu city, East Java, where the
local rose is crossbred with various roses from different re-
gions such as West Java, and Netherland hybrids. Anthocya-
nin pigment can be easily tapped in some parts of a plant as in
the leaves, fruit [7], root, as well as flower [8,9,10]. The result
of the preliminary test conducted on red kana flower [11]
which resembles rose at some points revealed that kana flower
petals contain anthocyanin pigment. However, very little re-
search has been conducted to observe local rose petal sub-
stance from Batu; neither did the function of the pigment as a
natural colorant which possibly replace harmful non-food col-
orant, Rhodamin B [12]. This study aimed at identifying an-
thocyanin pigment in local rose petals from Batu and its po-
tential use as natural colorant.
2 RESEARCH METHOD
This study was an experimental study by using simple
random sampling. Pigment extraction was conducted by uti-
lizing four-level solvents (aquades-citric acid, aquades-lactic
acid, methanol-HCl and Aquades-sulfuric acid). The red rose
petals (local Batu) as sample were extracted by using: 0.02M of
lactic acid, 45gram/300ml solvent, and before being concen-
trated by rotary evaporator vacuum (50-60oC) and isolated by
twice extraction developers BAA (thick or concentrated
HCl:H2O=3:97) and BuOH-HCl (n BuOH:HCl 2N=1:1). The
next step was to put small amount of the extract on a thin
plague in order to obtain anthocyanin pigment isolates, which
led to the further step to thoroughly identify more pigment by
UV Vis spectrophotometry [13, 3]. The process was verified by
functional group frequency observation by FTIR analysis [14]
with its anthocyanin standard of malvidin chloride type.
3 RESULT AND DISCUSSION
The findings proved that all four solvents used in the ex-
traction process could generate anthocyanin pigment resem-
bling that of character in band I and II; each represented
glikon and aglikon [15]. From Table 1 and Picture 1, it was
identified that UV Vis spectrophotometry observation towards
maximum absorbance peak in both bands was relevant with
the existence of anthocyanin pigment character decisive point,
with its maximum absorbance level around 235-244 nm and its
aglikon/anthocyanidin around 513.5-518 nm. This study find-
ing was in line with Markham [13] asserting that both glikon
and aglikon served their functions as glikon flavonoid and
327
IJSER
International Journal of Scientific & Engineering Research Volume 6, Issue 4, April-2015 ISSN 2229-5518
IJSER © 2015
http://www.ijser.org
aglikon [3, 16].
Table 1. Peak absorbance band I and II on pigment filtrate of Batu
local rose flower Extraction result with various solvents
Solvents Glikon
Peak
maxi-
mum
absorb-
ance
(dilu-
tion
100x)
Band I
at
λ
(nm)
Aglikon
Peak
maxi-
mum
absorb-
ance
(dilution
10x)
Band
II
at
λ
(nm)
Notes
Aq-sitrat
Aq-laktat
MetHCl
Aq-H2SO4
0.3263
0.2737
0.2458
0.0024
235
240
244
239.5
0.408
0.679
0.157
0.087
514
513.5
518
517.5
The highest
Glikon
The highest
Aglikon
Notes;
Band I = glikon, Band II = aglikon/ antosianidin
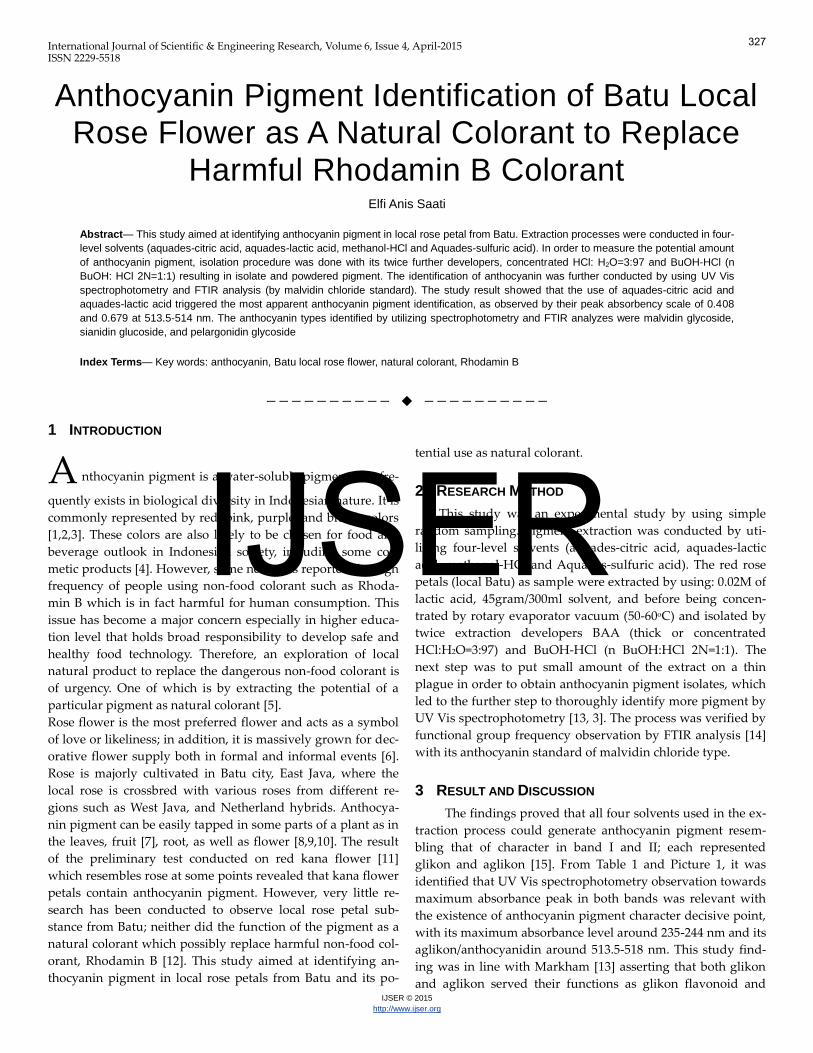
Picture 1. The Distribution Graphic of Glikon (P1) and Aglikon (P2) Peak
Absorbance Value of rose flower in various extraction sol-
vents.
Aquades solvent and lactic acid produced the highest an-
thocyanin pigment peak band II at 0.679 A, whereas aquades
solvent and citric acid managed to reach the peak band II at
3.263 A (Table 1). These results asserted that the pigment with
aquades and citric acid extract solvents contained higher level
of glikon (glucosides); while the highest level of antochyanidin
(aglikon) appeared when aquades and lactic acid were put on.
These results support the previous studies uncovering that
anthocyanin pigment is more stable when it is extracted by
moderate polar solvent and with acidic character [17, 8, 15].
The first step of pigment identification was pigment ex-
traction (by using lactic acid solvent 0.002M) from the raw
local rose petal material as much as 45 gram/300 ml solvent,
which had been concentrated by rotary evaporator vacuum
(50-60oC). The next step was to observe the pigment by using
UV Vis spectrophotometry, especially to identify the maxi-
mum absorbance value at 514-518 nm wavelength, based on
the nature of anthocyanin pigment (490-540 nm) [18] and 510-
550 nm [19].
According to its obtained spectrum peak distribution, the
identification of functional groups resembling adsorption
character was performed to generate a picture of functional
group component from the Batu local rose flower petals.
Based on the FTIR analysis, both pigment fractions were
expected to have similar molecular structures. It was in line
with the previous identification result by thin layer chromato-
graphic analysis (KLT) showing that anthocyianidin substanc-
es that exist in local red rose petals are sianidin (contain high
level of C-OH), malvidin (relatively high level of -O-CH3) and
pelargonidin; they serve functional groups at the tip point of
ring B which contain hydroxyl and methyl.
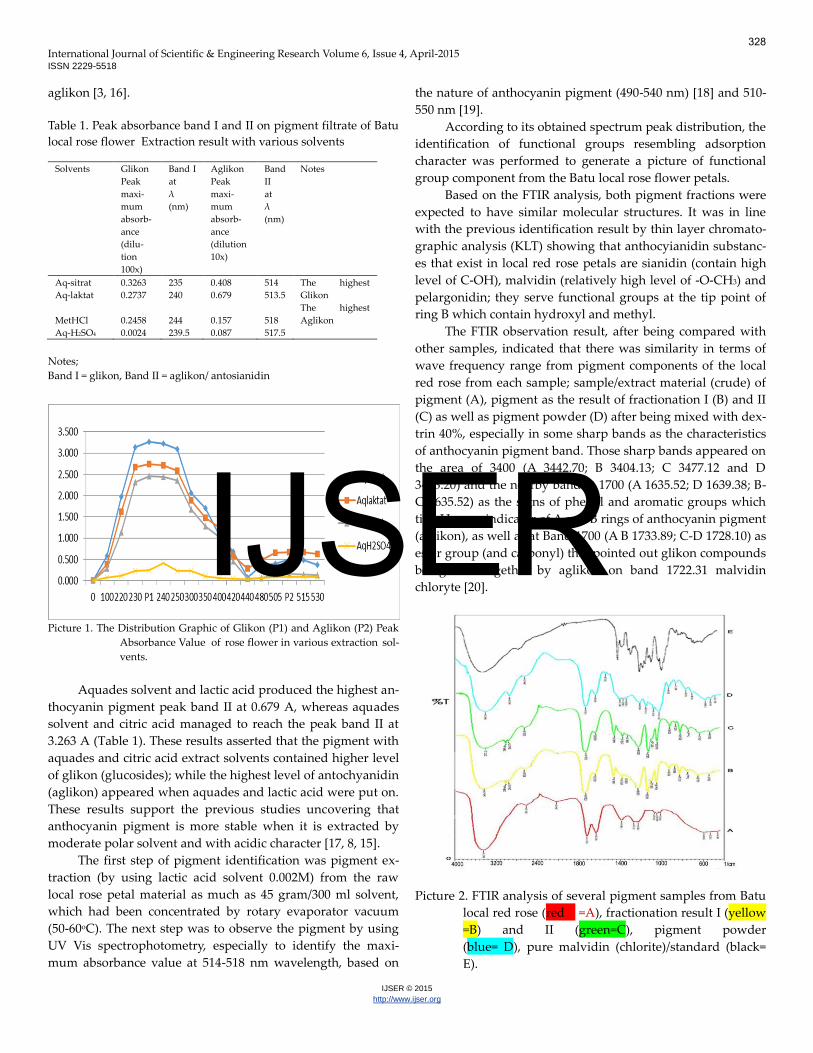
The FTIR observation result, after being compared with
other samples, indicated that there was similarity in terms of
wave frequency range from pigment components of the local
red rose from each sample; sample/extract material (crude) of
pigment (A), pigment as the result of fractionation I (B) and II
(C) as well as pigment powder (D) after being mixed with dex-
trin 40%, especially in some sharp bands as the characteristics
of anthocyanin pigment band. Those sharp bands appeared on
the area of 3400 (A 3442.70; B 3404.13; C 3477.12 and D
3403.20) and the nearby band at 1700 (A 1635.52; D 1639.38; B-
C 1635.52) as the signs of phenol and aromatic groups which
tied H as an indicator of A and B rings of anthocyanin pigment
(aglikon), as well as at Band 1700 (A B 1733.89; C-D 1728.10) as
ester group (and carbonyl) that pointed out glikon compounds
being tied together by aglikon on band 1722.31 malvidin
chloryte [20].
Picture 2. FTIR analysis of several pigment samples from Batu
local red rose (red =A), fractionation result I (yellow
=B) and II (green=C), pigment powder
(blue= D), pure malvidin (chlorite)/standard (black=
E).
328
IJSER
International Journal of Scientific & Engineering Research Volume 6, Issue 4, April-2015 ISSN 2229-5518
IJSER © 2015
http://www.ijser.org
The band sharpness and the wave frequency spread
of local red rose petal pigment sample (fraction I-II/B-C)
were relatively close or similar to pure malvidin (as com-
parison of IR spectrum peak from maldivin chlorite anto-
chyanidin pigment type (Dimitri et.al., 2001), that was the
spectrum at 3388 cm–1 wave frequency and some other
peaks such as at 1600 or at approximately 1640 cm–1 be-
tween 1000- 1300 cm–1. In the first and second pigment
fractions, the peak spectrum appeared at 3477.12 cm–1
and 1635.52 cm–1 wave frequency as well as in the range
of 1000- 1300 cm–1. Therefore, all samples (4 samples: A,
B, C, and D) projected their aglikon/antochyanidin com-
ponents that were identified on sharp band at 3442.70
and 1635.52 as the characteristic of phenol and aromatic
groups to tie H in A and B rings as aglikon. These com-
ponents on the sharp band also represented the existence
of ester (carbonyl) group at 1722.31 as the form of glikon
compound that has been bounded by aglikon as the
standard (external) (D) which suited the result of Dimitri
et.al.’s research (2001). He mentioned that antochyanidin
pigments that were derived from the same type might
produce similar glycosides; Malvidin and Chyanidin. The
only difference was the band range which pointed out
the location of glikon group substance as an indicator of
pigment purity level, when the number of C-H groups
found in the band lower than 1000 nm was less than the
others. In the band area of 1900-2900, aldehyde com-
pounds (CHO and RCHO) were identified as indicators
of acylated sugar as the result of fractions I and II; quite
contrast with the absence of acylated sugar in malvidin
chloride pigment analysis [20].
4 CONCLUSION AND SUGGESTION
Anthocyanin pigment extraction from Batu local red rose
flower petals was proven to be more effective if it was con-
ducted by using aquades with citric acid or lactic acid sol-
vents, resulting the peak absorbance of 0.408-0.679Å at 513.5-
514 nm. Types of anthocyanin detected by spectrophotometric
and FTIR analyses were malvidin, sianidin, and pelaginidin
glycosides.
REFERENCES
[1] C.E. Lewis, , J.R.L. Walkerand J.E. Lancaster, “Anthocyanin as Natural Food
colours – Selected Aspects”, Food Chemistry. Vol. 58, pp 103 – 109.1997.
Bridle, P. and Timberlake, C.F., eds. (Book style and editor)
[2] G.A.F. Henry and J.D. Houghton,”Natural Food Colorants”. Two Edition.
Blackie Academic and Profesional. London. pp 112-120, 1996. (Book
style)
[3] Rein, Maarit, “Copigmentation reactions and color stability of berry antho-
cyanins. Food Chemistry Division”, Department of Applied Chemis-
try and Microbiology . University of Helsinki. Helsinki.Pp 87, 2005.
(Book style)
[4] Wu, Shaowen, C. Ford and G. Horn, “Stable Natural Color Process, Products
and Use Thereof”, Patent application number: 20090246343, 2009.(Patent
citation)
[5] F.J. Francis,”Analysis of Anthocyanins”, Markakis, P., (editor). Anthocyanin
as Food Colors. Academic Press. New York. pp. 181-207,1982. (Book style
and editor)
[6] Rukmana, R. Rose. Publisher Canisius. Yogyakarta. 1995. (Book style)
[7] G.A. Garz’on,K.M. Riedi, and S.J. Schwartz. “Determination of Anthocyanins,
Total Phenolic Content, and Antioxidant Activity in Andes Berry (Rubus
glaucus Benth)”, J. Food Sci. Vol. 74, Nr. 3 :227-232, 2009.(Journal citation)
[8] L.M.L. Nollet,”Hand Book of Food Analysis”, Two Edition. Marcel Dekker,
Inc. New York. Pp 1068, 1996. (Book style)
[9] B.W. Moss, “The Chemistry of Food Colour”, “Colour in Food: Improving
Quality”, D.B. MacDougall,eds, Washington: CRC Press, 2002.(Book style
with paper and editor)
[10] Kuwayama, Sachiko, S. Mori, M. Nakata, T. Godo, and M. Nakano. Anal-
yses of Anthocyanidins and Anthocyanins in Flower Petals of Lychnis senno
and Its Related Species (Caryophyllaceae). Bull.Facul.Agric.Niigata Univ.,
58(1):35-38, 2005. .(Journal citation)
[11] E.A. Saati, Mujianto, Susestyarini, R.E.. Function optimalization extract
flower of kana as natural colourant and antioxidant by method isolating and
characterizing the pigment. Proseding International Reserch Seminar and
Exhibition: 2008 Nov 7-8; Malang, Muhammadiyah Unoversitas of Malang.
pp 2–4, 2008. (Research Report)
[12] E.A. Saati,Moch. Wachid, “Identification and Characterization of Biologi-
cal Pigments Exploration Results Wealth Local as Substitute Color Danger-
ous Rodhamin B to Support Availability Food Healthy and Safe, 2012. (Re-
search Report)
[13] KR. Markham, “Techniques of flavonoid identification”, Treherne JE,Rubery
PH.,eds, Biological techniques series. New York, NY: Academic Press; pp. 1–
113. 1982. (Book style and editor)
[14] R.M. Silverstein and G.C. Bassaker, “Spectromtric identification of organic
coumpounds”, 2nd Ed. John Wiley & Sons, Inc.Pp 393. 1967. (Book style)
[15] J. Li, “Total anthocyanin content in blue corn cookies as affected by ingre-
dients and oven types”,Dept. of Grain Science and Industry College of Agri-
culture, Kansas University, Manhattan, Kansas, 2009.(Dissertation)
[16] J.J. Macheix, A. Fleuriet and J. Billot,’’Fruit phenolic”, CRC Press. Inc.
Boca Raton-Fla. P 149-237,1990. (Book style)
[17] P. Markakis, “Stability of anthocyanin in foods”, “Anthocyanin as food col-
or”,P Markakis,eds. New York: Academic Press. pp. 163-18) ,1982. (Book
style and editor)
[18] J.B. Harborne and C.A. Williams,”Advances in flavonoid research
since1992”,Phytochemistry 55: 481–504. 2000. (Book style)
[19] G.Mazza, J.E.Cacace, and CD.Kay,”Methods of analysis for anthocyanins in
plants and biological fluids. J. AOAC Internat. 87: 129-145, 2004.(Journal ci-
tation)
[20] J.M. Dimitri, U.B. Markovi,.Mio, J.Baranac, Z.P. Nedi, “A study of the IR
spectra of the copigments of malvin chloride with organic acids.
J.Serb.Chem.Soc. 66(7) : 451–462, . 2001. (.(Journal citation)
329
IJSER
![Genetic Dissection of a Major Anthocyanin QTL Contributing ... · anthocyanin (pink) pigment was estimated as [(R + B)/2] 2 G. QTL affecting anthocyanin concentration in the backcross](https://img.pdfslide.us/doc/110x75/5e6421962a91715ff42dfa60/genetic-dissection-of-a-major-anthocyanin-qtl-contributing-anthocyanin-pink.jpg)