Embed Size (px)
Citation preview
Graduate Theses and Dissertations Iowa State University Capstones, Theses andDissertations
2011
Antecedents of Review and RecommendationSystems AcceptanceYen-yao WangIowa State University
Follow this and additional works at: https://lib.dr.iastate.edu/etd
Part of the Business Commons
This Thesis is brought to you for free and open access by the Iowa State University Capstones, Theses and Dissertations at Iowa State University DigitalRepository. It has been accepted for inclusion in Graduate Theses and Dissertations by an authorized administrator of Iowa State University DigitalRepository. For more information, please contact [email protected].
Recommended CitationWang, Yen-yao, "Antecedents of Review and Recommendation Systems Acceptance" (2011). Graduate Theses and Dissertations. 11203.https://lib.dr.iastate.edu/etd/11203
Antecedents of review and recommendation systems acceptance
by
Yen-Yao Wang
A thesis submitted to the graduate faculty
in partial fulfillment of the requirements for the degree of
MASTER OF SCIENCE
Major: Information Systems
Program of Study Committee: Anthony Townsend, Major Professor
Brian Mennecke Russell Laczniak
Iowa State University
Ames, Iowa
2011
Copyright © Yen-Yao Wang, 2011. All rights reserved.
ii
TABLE OF CONTENTS
LIST OF FIGURES ................................................................................................ iv
LIST OF TABLES ..................................................................................................v
ABSTRACT.......................................................................................................... vii
CHAPTER 1. OVERVIEW ....................................................................................1 1.1 Background................................................................................................... 1 1.2 Research ....................................................................................................... 2
CHAPTER 2. REVIEW OF LITERATURE .............................................................5 2.1 Recommendation Systems ............................................................................. 5
2.1.1 An Overview of Recommendation Systems ............................................. 5 2.1.2 Collaborative filtering Recommendation System...................................... 8 2.1.3 Content-based Recommendation System ................................................12
2.2 Unified Theory of Acceptance and Use of Technology ..................................17 2.2.1 Underlying Concept of UTAUT .............................................................17 2.2.2 Framework of UTAUT ..........................................................................23
2.3 Trust ............................................................................................................26 2.4 Types of Products.........................................................................................28 2.5 Research Model............................................................................................28 2.6 Research Hypotheses ....................................................................................30 2.7 Definitions of Variables ................................................................................34
2.7.1 Performance Expectancy ........................................................................34 2.7.2 Effort Expectancy ..................................................................................34 2.7.3 Social Influence .....................................................................................34 2.7.4 Trust......................................................................................................35 2.7.5 Behavioral Intentions to Use Recommendation Systems ..........................35 2.7.6 Sex ........................................................................................................35 2.7.7 Experience.............................................................................................35 2.7.8 Types of Products ..................................................................................35
CHAPTER 3. METHODOLOGY AND PROCEDURES ....................................... 36 3.1 Pilot Test......................................................................................................36
3.1.1 Participants............................................................................................36 3.1.2 Procedure ..............................................................................................36
3.2 Final Study...................................................................................................36 3.2.1 Participants............................................................................................37 3.2.2 Procedure ..............................................................................................37
3.3 Measure .......................................................................................................38
CHAPTER 4. RESULTS ...................................................................................... 40 4.1 Pilot Test......................................................................................................40 4.2 Final Study...................................................................................................41
4.2.1 Data Characteristics ...............................................................................41 4.2.2 Instrument Quality Analysis ...................................................................48 4.2.3 Hypothesis Testing ................................................................................54 4.2.4 Hypothesis Results Summary .................................................................60
iii
CHAPTER 5. DISCUSSION AND CONCLUSIONS ............................................ 64 5.1 Overview .....................................................................................................64 5.2 Implications .................................................................................................65 5.3 Limitations and Future Research ...................................................................66
APPENDIX A. Product Manipulation P ilot Study.................................................. 68
APPENDIX B. Study Questions............................................................................ 70
REFERENCES...................................................................................................... 79
iv
LIST OF FIGURES
Figure 1. Model of the recommendation process, Terveen and Hill (2001) ........................... 7 Figure 2. Paradigm of collaborative filtering system, Zanker and Jannach (2010) ................. 9 Figure 3. Recommendations from collaborative filtering recommendation system ...............10 Figure 4. Paradigm of content-based system, Zanker and Jannach (2010) ............................13 Figure 5. User dialogue from of content-based recommendation system..............................14 Figure 6. Recommendations from content-based recommendation system ...........................15 Figure 7. Basic concept of UTAUT, Venkatesh et al. (2003) ...............................................18 Figure 8. Theory of Reasoned Action (TRA), Ajzen and Fishbein (1980) ............................19 Figure 9. Technology Acceptance Model (TAM), Davis et al. (1989) ..................................20 Figure 10. Theory of Planned Behavior (TPB), Ajzen (1992)..............................................21 Figure 11. Combined TAM and TPB (C-TAM-TPB), Taylor and Todd (1995a) ..................22 Figure 12. Social Cognitive Theory (SCT), Bandura (1986) ................................................23 Figure 13. UTAUT model, Venkatesh et al. (2003) ............................................................24 Figure 14. Proposed research model...................................................................................30
v
LIST OF TABLES
Table 1. Definitions of the recommendation system ............................................................ 6 Table 2. Descriptive statistics of the product manipulation study.........................................40 Table 3. Comparison of the means of MP3 player and printer .............................................41 Table 4. Sex information ...................................................................................................42 Table 5. Age information...................................................................................................42 Table 6. US citizen information .........................................................................................42 Table 7. Ethnicity information ...........................................................................................42 Table 8. Past experiences of purchasing printers online ......................................................43 Table 9. Past experiences of purchasing MP3 players online ...............................................43 Table 10. Future intent of purchasing printers online ..........................................................43 Table 11. Future intent of purchasing MP3 players online ..................................................44 Table 12. Descriptive statistics of pre self-efficacy .............................................................44 Table 13. Past experiences for the treatment 1 ....................................................................45 Table 14. Familiarity for the treatment 1 ............................................................................45 Table 15. Self-efficacy information in the treatment 1 ........................................................45 Table 16. Past experiences for the treatment 2 ....................................................................45 Table 17. Familiarity for the treatment 2 ............................................................................46 Table 18. Self-efficacy for the treatment 2 .........................................................................46 Table 19. Past experiences for the treatment 3 ....................................................................46 Table 20. Familiarity for the treatment 3 ............................................................................46 Table 21. Self-efficacy for the treatment 3 .........................................................................47 Table 22. Past experiences for the treatment 4 ....................................................................47 Table 23. Familiarity for the treatment 4 ............................................................................47 Table 24. Self-efficacy for the treatment 4 .........................................................................47 Table 25. Descriptive statistics for the treatment 1, PLS output ...........................................48 Table 26. Descriptive statistics for the treatment 2, PLS output ...........................................48 Table 27. Descriptive statistics for the treatment 3, PLS output ...........................................49 Table 28. Descriptive statistics for the treatment 4, PLS output ...........................................49 Table 29. Item loading for the treatment 1, PLS output .......................................................50 Table 30. Item loadings for the treatment 2, PLS output .....................................................51 Table 31. Item loadings for the treatment 3, PLS output .....................................................51 Table 32. Item loadings for the treatment 4, PLS output .....................................................52 Table 33. AVE for the treatment 1, PLS output ..................................................................52 Table 34. AVE for the treatment 2, PLS output ..................................................................52 Table 35. AVE for the treatment 3, PLS output ..................................................................52 Table 36. AVE for the treatment 4, PLS output ..................................................................53 Table 37. Correlation of constructs for the treatment 1, PLS output .....................................53 Table 38. Correlation of constructs for the treatment 2, PLS output .....................................53 Table 39. Correlation of constructs for the treatment 3, PLS output .....................................53 Table 40. Correlation of constructs for the treatment 4, PLS output .....................................53 Table 41. Reliability results for the treatment 1, PLS output ...............................................54 Table 42. Reliability results for the treatment 2, PLS output ...............................................54
vi
Table 43. Reliability results for the treatment 3, PLS output ...............................................54 Table 44. Reliability results for the treatment 4, PLS output ...............................................54 Table 45. Model testing without moderators for the treatment 1 ..........................................55 Table 46. Model testing without moderators for the treatment 2 ..........................................55 Table 47. Model testing without moderators for the treatment 3 ..........................................56 Table 48. Model testing without moderators for the treatment 4 ..........................................56 Table 49. Model testing with moderators for the treatment 1...............................................57 Table 50. Model testing with moderators for the treatment 2...............................................57 Table 51. Model testing with moderators for the treatment 3...............................................58 Table 52. Model testing with moderators for the treatment 4...............................................58 Table 53. Chow’s test for the pooled data...........................................................................59 Table 54. Model testing without moderators for the pooled case .........................................59 Table 55. Model testing with moderators for the pooled case ..............................................60 Table 56. Hypothesis testing results for the treatment 1 ......................................................60 Table 57. Hypothesis testing results for the treatment 2 ......................................................61 Table 58. Hypothesis testing results for the treatment 3 ......................................................62 Table 59. Hypothesis Testing Results for the treatment 4....................................................62 Table 60. Hypothesis testing results for the pooled case......................................................63
vii
ABSTRACT
Online recommendation systems, which are becoming increasingly prevalent on the
Web, help reduce information overload, support quality purchasing decisions, and increase
consumer confidence in the products they buy. Researchers of recommendation systems have
focused more on how to provide a better recommendation system in terms of algorithm and
mechanism. However, research which has empirically documented the link between
customers’ motivations and intentions to use recommendation systems is scant. Therefore,
the aim of this study attempts to explore how consumers assess the quality of two types of
recommendation systems, collaborative filtering and content-based by using a modified
Unified Theory of Acceptance and Use of Technology (UTAUT) model. Specifically, the
under-investigated concept of trust in technological artifacts is adapted to the UTAUT model.
In addition, this study considers hedonic and utilitarian product characteristics,
attempting to present a comprehensive range of recommendation systems. A total of 51
participants completed an online 2 (recommendation systems) x 2 (products) survey. The
quantitative analysis of the questionnaires was conducted through multiple regression and
path analysis in order to determine relationships across various dimensions.
Results of this study showed that types of recommendation systems and products did
have different effects on behavioral intention to use recommendation systems. To conclude,
this study may be of importance in explaining factors contributing to use recommendation
systems, as well as in providing designers of recommendation systems with a better
understanding of how to provide a more effective recommendation system.
1
CHAPTER 1. OVERVIEW
The recommendation system is an electronic aid that helps people make purchasing
decisions, solves the problem of information and choice overload, and finds the most
personalized products based on their browsing history, rating records, or purchasing records
in the world of E-Commerce. This system has been seen as an important marketing tool to
enhance E-Commerce (Schafer, Konstan, &Riedl, 2001). In the past two decades, many IS
researchers have studied the topic of technology acceptance (Gefen &Straub, 1997; Hsu
&Lin, 2008; Koufaris, 2002; Mathieson, 1991; Terveen &Hill, 2001; Venkatesh, 2000),
which was introduced first by Davis (1989). Based on Unified Theory of Acceptance and
Use of Technology proposed by Venkatesh et al. (2003), this study examines possible factors
influencing people’s intentions to accept recommendation systems in the realm of e-
commerce.
1.1 Background
With the rapid propagation of the Internet, the market of e-commerce has grown
globally at a tremendous pace in the past few years. According to the U.S. Department of
Commerce, the value of sales revenue from e-commerce in 2008 was US$22.4 billion. This
amount includes both business-to-business (B-to-B) and business-to-consumer (B-to-C).
Additionally, according to eMarketers’ annual report of 2006, the e-commerce market in
Europe has reached 106 billion EURO ($133 billion US dollars). Analysts say that this
situation will be stable for at least five years and the market will reach the point of 323
billion EURO ($407 billion US dollars) by 2011. However, this expansion has been
accompanied by consumer frustration due to information overload and the perception of too
many choices. Although e-commerce provides a virtually limitless shopping platform for
customers, sometimes people still feel frustrated because of information and choice overload.
They need to spend a lot of time comparing and evaluating the functionality and prices of
various items before making purchasing decisions. From the customer’s perspective,
purchasing is a time-consuming job. By screening out unsuitable choices, recommendation
2
systems have been seen as a support tool for customers during the process of making
purchasing decisions (Grenci &Todd, 2002; Keefe &Mceachern, 1998; Maes, Guttman,
&Moukas, 1999), helping them improve the quality of purchasing decisions and increase
their confidence in products they choose (Haubl &Trifts, 2000; Hostler, Y., &Guimaraes,
2005; Lee &Lee, 2004; Riecken, 1994).
In addition, from the perspective of the providers of recommendation systems,
recommendation systems play an important role to increase e-commerce sales. Schafer,
Konstan, and Riedl (2001) pointed out that the recommendation system enhances e-
commerce sales in three ways: (1) converting browsers into buyers (2) increasing cross-sell,
and (3) building loyalty. Prominent e-commerce Web sites (Amazon.com, ebay, Dell, iQVC,
onSale, Walmart, Circuit city, Guitar Center, Shopping.com, and so on) showed a wide
degree of implementation in recommendation systems. Overall, recommendation systems
have become a required factor in building a successful and profitable e-commerce Web site.
1.2 Research
Starting from Goldberg et al. (1992), scholars focused more on how to provide a
better recommendation systems in terms of algorithm and mechanism (Sarwar, Karypis,
Konstan, &Riedl, 2000; Wang, F.-H. &Shao, 2004; Yuan &Tsao, 2003). What remains to be
explored, however, are why people are willing to use recommendation system and what
factors influence their use of these systems. Specifically, two types of recommendation
systems, collaborative filtering and content-based, have been implemented largely to enhance
e-commerce sales. As the dependency on recommendation systems in e-commerce increases
rapidly, so does the need to realize factors associated with people to use recommendation
systems.
Seminal work on the Technology Acceptance Model (TAM) was carried out by Davis
(1989), still the reference point for virtually all discussions of technology acceptance and
related applications. With vigorous development in technology acceptance, Venkatesh et al.
(2003) used the concept of TAM, along with eight related theories, and developed the
Unified Theory of Acceptance and Use of Technology (UTAUT) to predict technology
acceptance decisions. Although there has been a dramatic proliferation of research concerned
3
with the reliability and validity of the UTAUT in recent years (Anderson, J. E. &Schwager,
2004; Hennington &Janz, 2007; Marchewka, Liu, &Kostiwa, 2007; Wills, El-Gayar,
&Bennett, 2008), we did not find any publications that examined factors associated with
using online recommendation systems by using the UTAUT. Hence, in order to help fill this
gap in our knowledge, this study investigates the acceptance of online recommendation
systems by using a modified UTAUT model.
In addition to UTAUT, trust is seen as an antidote to risk by inexperienced online
customers and a reducer of social uncertainty (Gefen, 2000; Gefen &Straub, 2003; Jarvenpaa,
Tractinsky, &Vitale, 2000). Trust is an important issue in the adoption of new technology
(Fukuyama, 1995), including e-commerce (Gefen &Straub, 2000). Thus, by combining the
concept of trust and UTAUT, we further our understanding of why people might accept
recommendation systems in e-commerce.
The type of product has been shown to affect customers’ use of personal information
source and their choices (Bearden &Etzel, 1982; Childers &Rao, 1992; King
&Balasubramanian, 1994). Specifically, there are two types of products, hedonic and
utilitarian (Dhar &Wertenbroch, 2000). These two types of products are used as moderating
influences to examine if they have different effects on the process of accepting
recommendation systems.
The major purpose of this study is to examine the relevance of UTAUT in accepting
two types of recommendation systems, collaborative filtering and content-based, in e-
commerce. The specific aims in this study are to combine the concept of trust with the
UTAUT model and to measure possible differences of two types of products in accepting two
types of recommendation systems.
To address the issues already outlined and to begin to fill the gaps in the previous
research, the present study is designed address the following research questions: (1) What
factors influence people’s intention to use the two types of recommendation systems,
collaborative filtering or content-based, by using a modified UTAUT? (2) Do these two types
of recommendation systems have different effects on people who use them? If yes, what
factors may explain these differences? (3) For two types of products, hedonic and utilitarian,
do they have different effects to influence people to adopt two types of recommendation
4
systems? (4) And finally, can the concept of trust integrate well with the UTAUT model to
explain the comprehensive picture of adopting recommendation systems?
This study concludes with implications for theory, research, and practice. For
academics, this study may be critically important in laying the groundwork for understanding
how suitable and reliability of the UTAUT is in accepting two types of recommendation
systems in e-commerce. It may also lead to a better understanding of trust in fitting with the
original UTAUT model. Additionally, this study may serve as a basis for those e-venders
who want to realize customer’s behaviors and implement recommendation systems to
increase market share. This study is done with hope that it may provide practitioners with
better knowledge needed to design a better recommendation system. With the result of this
study, hopefully, the system can be more effective, customized and hence will likely enhance
more e-commerce sales in the long term.
The next section of this thesis elaborates on the theoretical foundations of the study
and the hypotheses. The method and procedure are then described, followed by the results of
this study. The final section provides concluding summary and discussion.
5
CHAPTER 2. REVIEW OF LITERATURE
The purpose of this chapter is to organize related theory and then build a
comprehensive theoretical framework. This research aims to explore people’s intentions or
motivations to accept content-based and collaborative filtering recommendation systems.
One the one hand, by realizing the fundamental differences of these two systems, this
research examines people’s intentions in these two individual cases. On the another hand, by
combining the UTAUT and the concept of trust, this research hopes to integrate any potential
factor contributing to people’s intentions to accept the recommendation system.
2.1 Recommendation Systems
2.1.1 An Overview of Recommendation Systems
Imagine a real case in the bookstore where you have a personal preference for a
specific genre in your mind, but you have no idea which book is the best choice for you
especially when you face a bunch of similar books in the bookshelf. At this time, you
probably will ask the store assistance for further suggestion to find the most appropriate book.
In everyday life, it is often necessary to make decisions for many unknown situations without
adequate personal experiences. We seek recommendations from people who are very familiar
with the choices, or who are recognized as the expert to help us solve out this unclear
situation. Resnick and Varian (1997) has stated that “recommender systems assist and
augment this natural social process”. Recommendation system evolved in response to the
choice and information overload to consumer and combined with consumer frustrating at a
decreasing level of professional support for making these choices (Schafer et al., 2001). Thus,
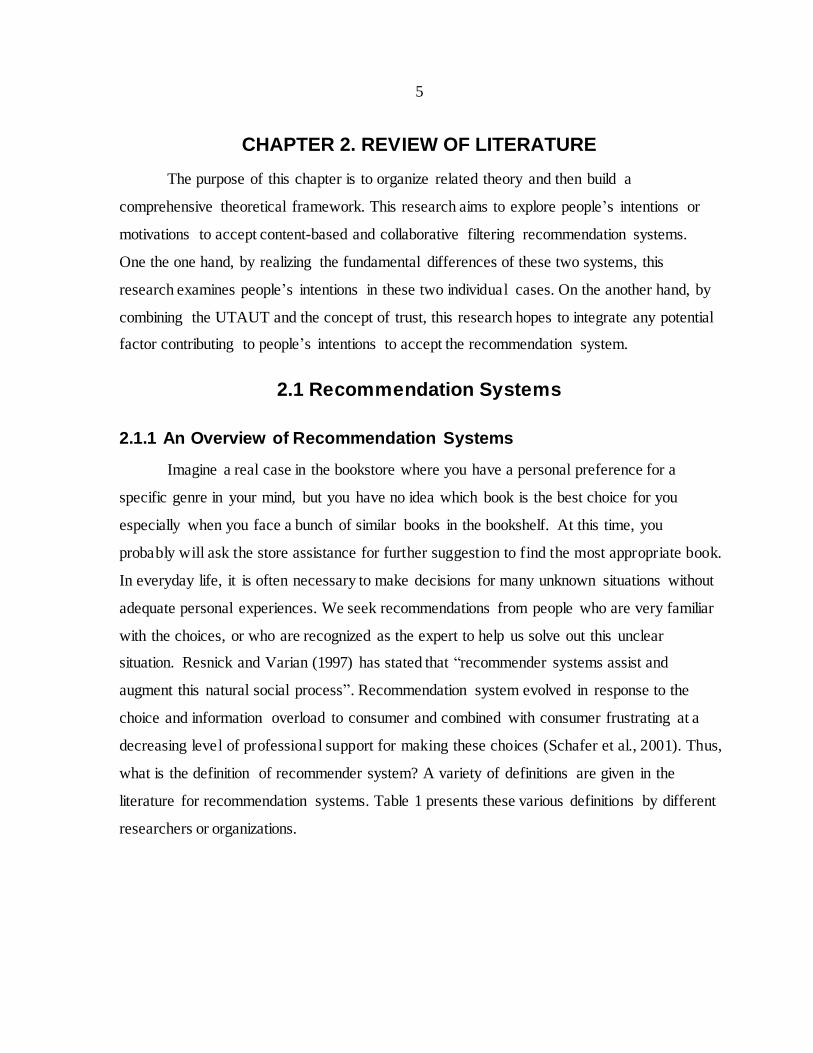
what is the definition of recommender system? A variety of definitions are given in the
literature for recommendation systems. Table 1 presents these various definitions by different
researchers or organizations.
6
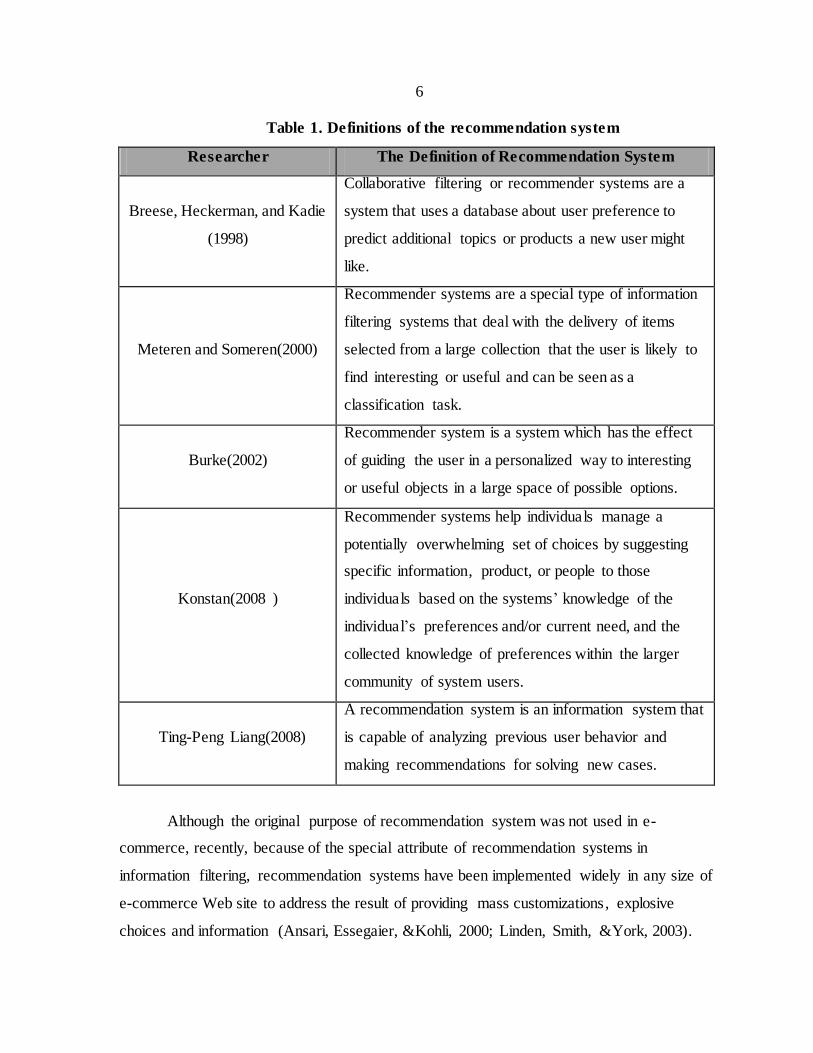
Table 1. Definitions of the recommendation system
Researcher The Definition of Recommendation System
Breese, Heckerman, and Kadie
(1998)
Collaborative filtering or recommender systems are a
system that uses a database about user preference to
predict additional topics or products a new user might
like.
Meteren and Someren(2000)
Recommender systems are a special type of information
filtering systems that deal with the delivery of items
selected from a large collection that the user is likely to
find interesting or useful and can be seen as a
classification task.
Burke(2002)
Recommender system is a system which has the effect
of guiding the user in a personalized way to interesting
or useful objects in a large space of possible options.
Konstan(2008 )
Recommender systems help individuals manage a
potentially overwhelming set of choices by suggesting
specific information, product, or people to those
individuals based on the systems’ knowledge of the
individual’s preferences and/or current need, and the
collected knowledge of preferences within the larger
community of system users.
Ting-Peng Liang(2008)
A recommendation system is an information system that
is capable of analyzing previous user behavior and
making recommendations for solving new cases.
Although the original purpose of recommendation system was not used in e-
commerce, recently, because of the special attribute of recommendation systems in
information filtering, recommendation systems have been implemented widely in any size of
e-commerce Web site to address the result of providing mass customizations, explosive
choices and information (Ansari, Essegaier, &Kohli, 2000; Linden, Smith, &York, 2003).
7
They can help businesses to decide whom to make an offer, achieving the goal of one-to-one
marketing strategy. For example, customers searching through the NBA section at Yahoo
may receive a banner advertisement for SportAuthority.com, while customers navigating to
the directory of education may receive an advertisement from University of Phoenix.
Basically, in a recommendation system setting, a recommendation seeker can ask for
recommendation or the system can provide the recommendation without prompting e.g.,
Bestsellers in Amazon.com. In order to get the personalized recommendation in the first case,
seekers may specify their preferences by rating some specific items provided by the system.
Recommendation systems will analyze these preferences to overcome the limitations of
segment-based mass marketing by presenting each customer with a personal set of
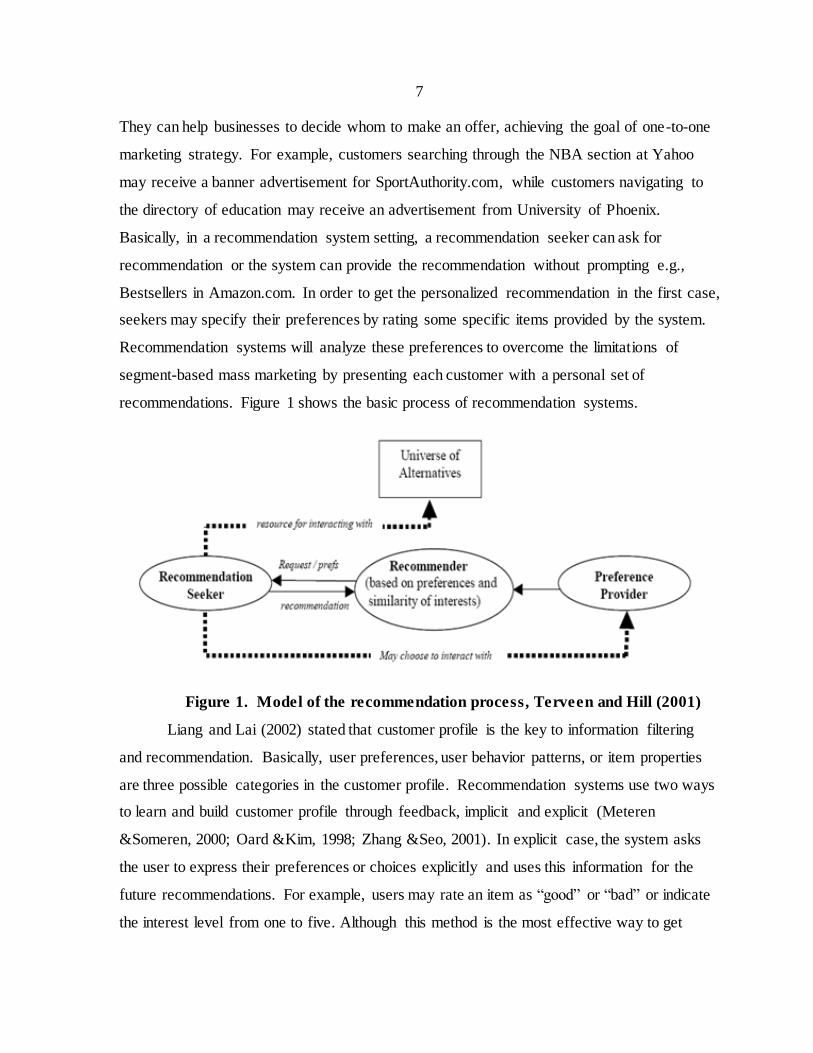
recommendations. Figure 1 shows the basic process of recommendation systems.
Figure 1. Model of the recommendation process, Terveen and Hill (2001)
Liang and Lai (2002) stated that customer profile is the key to information filtering
and recommendation. Basically, user preferences, user behavior patterns, or item properties
are three possible categories in the customer profile. Recommendation systems use two ways
to learn and build customer profile through feedback, implicit and explicit (Meteren
&Someren, 2000; Oard &Kim, 1998; Zhang &Seo, 2001). In explicit case, the system asks
the user to express their preferences or choices explicitly and uses this information for the
future recommendations. For example, users may rate an item as “good” or “bad” or indicate
the interest level from one to five. Although this method is the most effective way to get
8
customer’s preference, few drawbacks still exist in this strategy: (1) the user has to
participate in providing relevance feedback, creating more burdens for them, and (2) because
of privacy or other concerns, the user may refuse to provide the input (Liang, Lai, &Ku,
2007). In implicit case (or behavior-based), on the other hand, the system automatically
infers the user’s preferences passively by monitoring user’s behaviors such as analyzing the
hyperlinks followed by the customers (Liberman, 1995), the time spent on a particular web
page (Kobsa, Koenenmann, &Pohl, 2001; Konstan et al., 1997; Morita &Shinoda, 1994),
history of purchases (Krulwich, 1997), or the navigation history. Again, using implicit
method to draw preferences still has some disadvantages e.g., sometimes spending more time
browsing a page is not equal to having interests in this specific page. Prior studies have
proved empirically that the user the implicit method owns the same effect as the explicit
method does in taking customers’ preferences (Lai, Liang, &Ku, 2003; Zhang &Seo, 2001).
Thus, these two methods all have been used to cover their own disadvantages to get
customers’ preferences.
Recommendation mechanisms can be classified into two types by algorithms and
mechanisms used to determine recommended items: (1) collaborative filtering or social
filtering, and (2) content-based or attribute-based (Adomavicius &Tuzhilin, 2005; Cosley,
Lam, Albert, Konstan, &Riedl, 2003; Liang et al., 2007; Massa &Bhattacharjee, 2004; West
et al., 1999). These two mechanisms will be described briefly in the next two sections.
2.1.2 Collaborative filtering Recommendation System
Several collaborative filtering recommendation systems have been developed and
applied successfully in enabling the prediction of user preferences in the last two decades
(Goldberg et al., 1992; Resnick, Iacovou, Suchak, Bergstrom, &Riedl, 1994; Shardanand
&Maes, 1995). Schafer, Frankowski, Herlocker, and Sen (2007) declared that collaborative
filtering (or social filtering) is “the process of filtering or evaluating items using the opinion
of other people”. The major purpose of this mechanism is to aim at finding the relationships
among the new user and the existing data to determine the similarity and provide
recommendations (Ansari et al., 2000; Balabanovic, 1997; Schafer et al., 2001). For example,
if two customers bought similar DVDs and rated these DVDs similarly, the system would
9
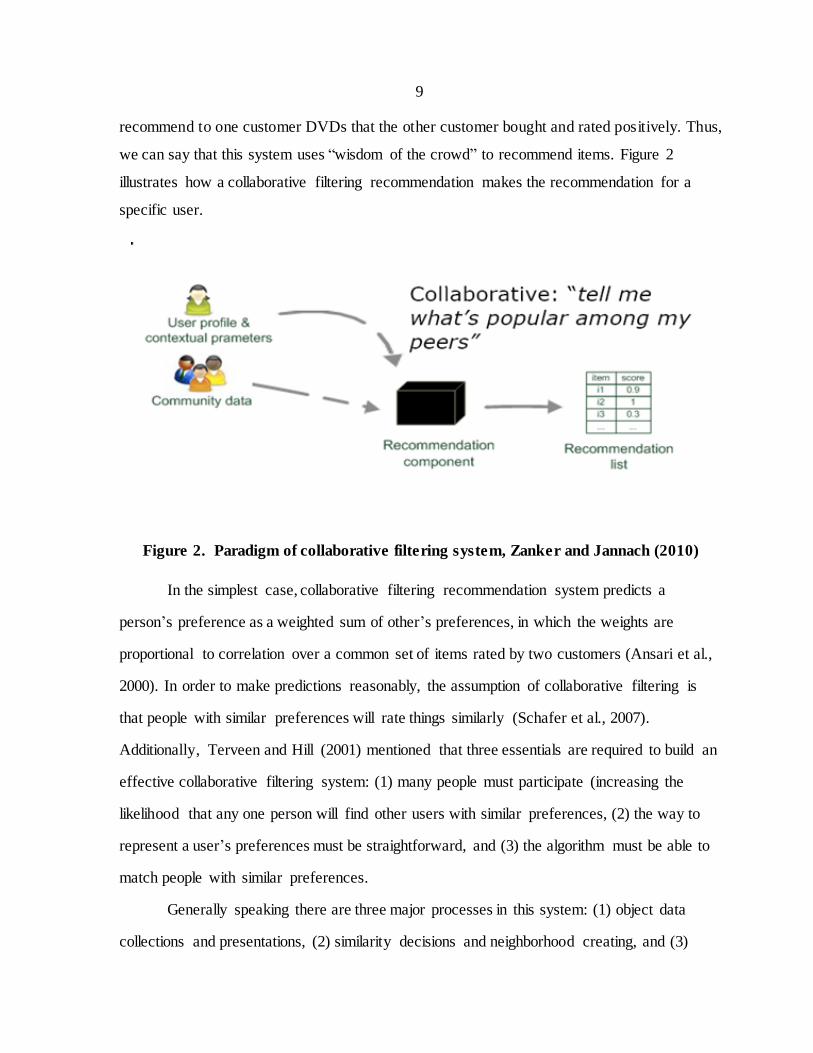
recommend to one customer DVDs that the other customer bought and rated positively. Thus,
we can say that this system uses “wisdom of the crowd” to recommend items. Figure 2
illustrates how a collaborative filtering recommendation makes the recommendation for a
specific user.
Figure 2. Paradigm of collaborative filtering system, Zanker and Jannach (2010)
In the simplest case, collaborative filtering recommendation system predicts a
person’s preference as a weighted sum of other’s preferences, in which the weights are
proportional to correlation over a common set of items rated by two customers (Ansari et al.,
2000). In order to make predictions reasonably, the assumption of collaborative filtering is
that people with similar preferences will rate things similarly (Schafer et al., 2007).
Additionally, Terveen and Hill (2001) mentioned that three essentials are required to build an
effective collaborative filtering system: (1) many people must participate (increasing the
likelihood that any one person will find other users with similar preferences, (2) the way to
represent a user’s preferences must be straightforward, and (3) the algorithm must be able to
match people with similar preferences.
Generally speaking there are three major processes in this system: (1) object data
collections and presentations, (2) similarity decisions and neighborhood creating, and (3)
10
recommendation computation. In the process one, the system can use either implicit or
explicit way to collect customers’ presences, which are ratings for individual item. In the
process two, the system uses different statistical techniques to find a set of customers known
as neighbors. These neighbors tend to rate different products similarly or buy similar set of
products (Sarwar et al., 2000). In the process three, once the neighbors have been identified,
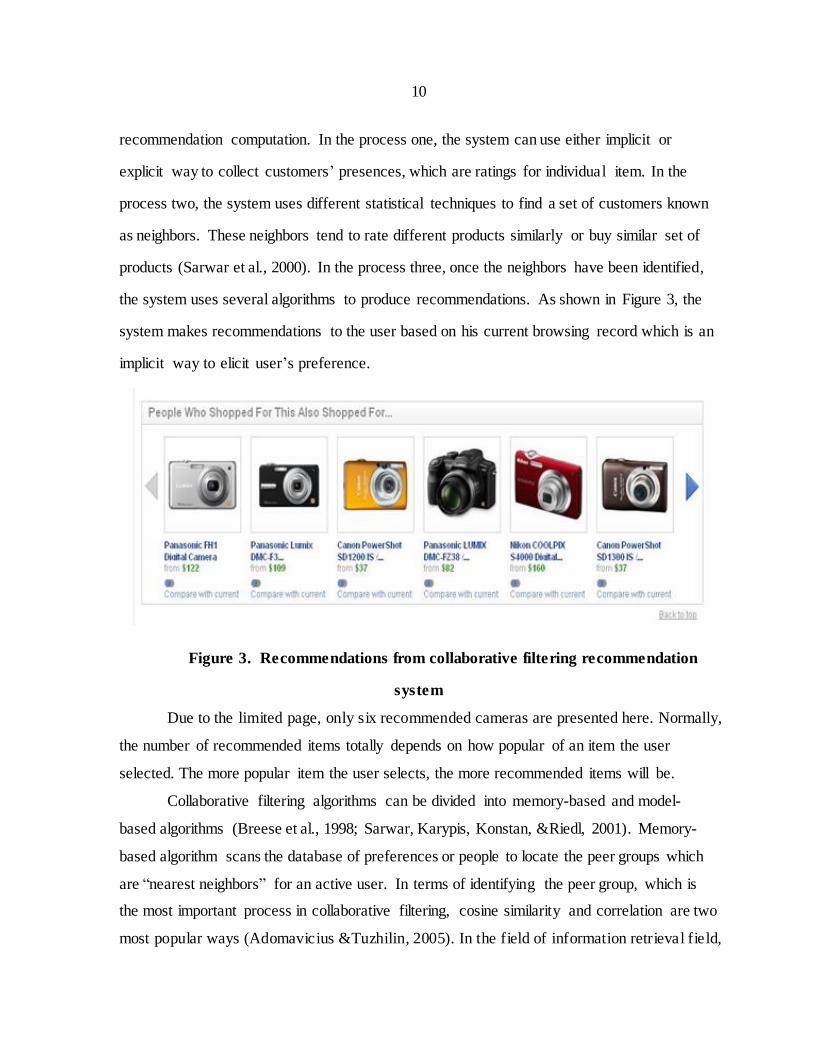
the system uses several algorithms to produce recommendations. As shown in Figure 3, the
system makes recommendations to the user based on his current browsing record which is an
implicit way to elicit user’s preference.
Figure 3. Recommendations from collaborative filtering recommendation
system
Due to the limited page, only six recommended cameras are presented here. Normally,
the number of recommended items totally depends on how popular of an item the user
selected. The more popular item the user selects, the more recommended items will be.
Collaborative filtering algorithms can be divided into memory-based and model-
based algorithms (Breese et al., 1998; Sarwar, Karypis, Konstan, &Riedl, 2001). Memory-
based algorithm scans the database of preferences or people to locate the peer groups which
are “nearest neighbors” for an active user. In terms of identifying the peer group, which is
the most important process in collaborative filtering, cosine similarity and correlation are two
most popular ways (Adomavicius &Tuzhilin, 2005). In the field of information retrieval field,
11
the similarity between two documents is measured by treating each document as a vector of
word frequencies and computing the cosine of the angle formed by these two frequency
vectors (Salton &McGill, 1986). In cosine similarity approach, users take the role of
documents, titles take the role of the words, and votes take the role of word frequencies
(Breese et al., 1998). Using the concept of this, cosine similarity approach calculates the
cosine of the angel to find out the similarity between two uses. In correlation approach,
Pearson correlation coefficient is used to measure the similarity (Resnick et al., 1994;
Shardanand &Maes, 1995). On the other hand, model-based algorithm generates a user
model from the database of rating histories first and then makes the recommendations
(Sarwar et al., 2001). The building model process is performed by different machine learning
algorithm such as neural network, latent semantic indexing (Foltz, 1990), and Bayesian
networks (Rich, 1979; Sarwar et al., 2001). Although model-based algorithm requires more
time to train, it can provide predictions in a shorter time in comparison to memory-based
algorithm.
2.1.2.1 Issues of Collaborative Filtering Recommendation System
There are still some technical issues associated with building an effective
collaborative filtering recommendation system. Three major issues are presented as the
follow.
(1) Cold-Start problem (Adomavicius &Tuzhilin, 2005; Ansari et al., 2000; Balabanovic
&Shoham, 1997; Good et al., 1999): A new item cannot be recommended to users if there
is no any rating information about the new item existed in the database. The situation is
the same for a new user. A new user cannot receive any recommendation until he
provides ratings for some items.
(2) Sparsity (Ansari et al., 2000; Terveen &Hill, 2001): If the number of people who have
rated items is relatively small compared to the number of items in the database, it is likely
that there is no significant similarity between users. The result is that nearest neighbors
cannot be identified very well, thus recommendations will be unreliable. According to
Adomanvicius (2005) and Terveen and Hill(2001) , the availability of critical mass of
user is the required component for the success of collaborative filtering. Without this
12
component, many items will be missing to be recommended. For example, in the book
section of Amzon.com, there may be many books that have rated positively or bought by
few customers and these books would be recommended rarely, even if these books had
very high ratings.
(3) Scalability (Sarwar et al., 2000; Schafer et al., 2001): Nearest neighbor algorithms require
computation that grow with the number of users and the number of products. With more
and more users and products appearing in e-commerce, collaborative filtering
recommendation system suffers a serious scalability problem.
2.1.3 Content-based Recommendation System
Content-based (attribute-based) filtering and collaborative filtering have been long
viewed as complementary (Adomavicius &Tuzhilin, 2005). Content-based systems analyze
item descriptions and user profiles to identity items that users may like (Ansari et al., 2000;
Balabanovic &Shoham, 1997; Pazzani &Billsus, 2007). Specifically, this system selects
items to recommend based on the correlation between the content of items and users’
preferences which are items users have liked in the past as opposed to collaborative filtering
that recommends item based on the opinion of others (Meteren &Someren, 2000). Thus, if
collaborative filtering recommendation system is a system that locates or recommends “users”
that are similar to the user preferences, content-based recommendation system is a system
that locates or recommends “items” that are similar to the user preferences. Because content-
based system makes the recommendations from only customers’ personal preferences,
customers may not feel surprising for the results of recommendation. Similar to collaborative
filtering system, content-based system also cannot provide recommendations to those who
don’t specify their preference information. Figure 4 shows the process of making the
recommendations in content-based system.
13
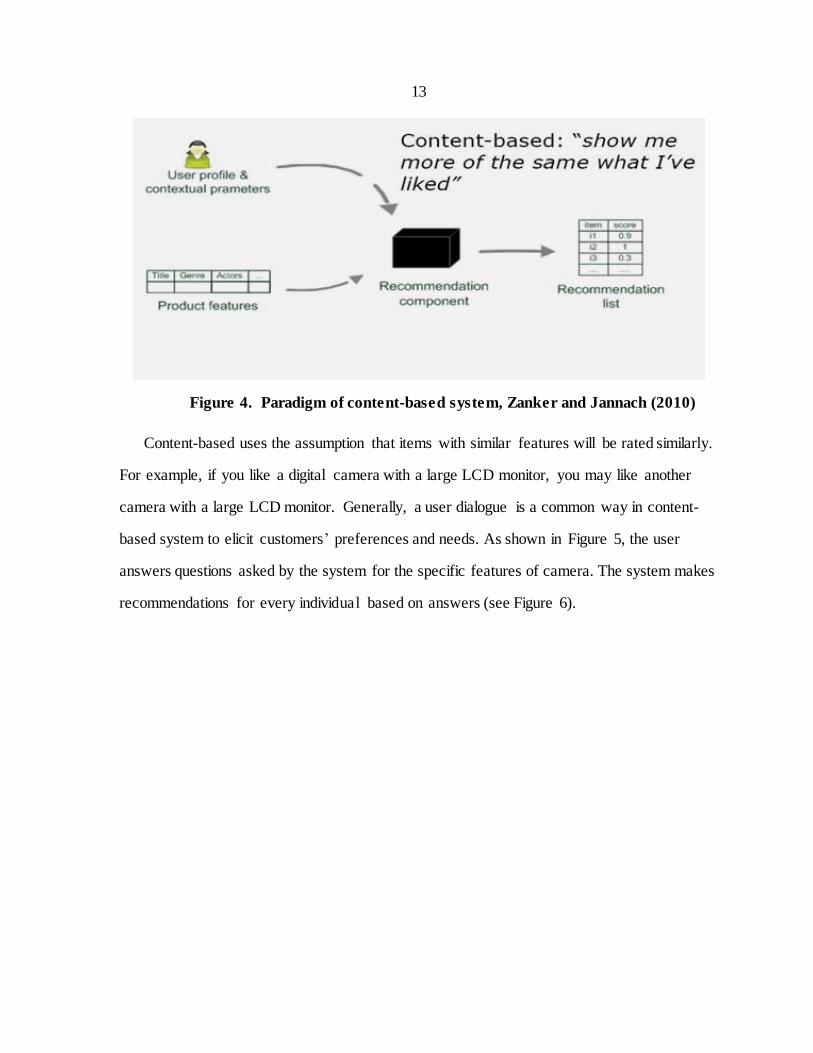
Figure 4. Paradigm of content-based system, Zanker and Jannach (2010)
Content-based uses the assumption that items with similar features will be rated similarly.
For example, if you like a digital camera with a large LCD monitor, you may like another
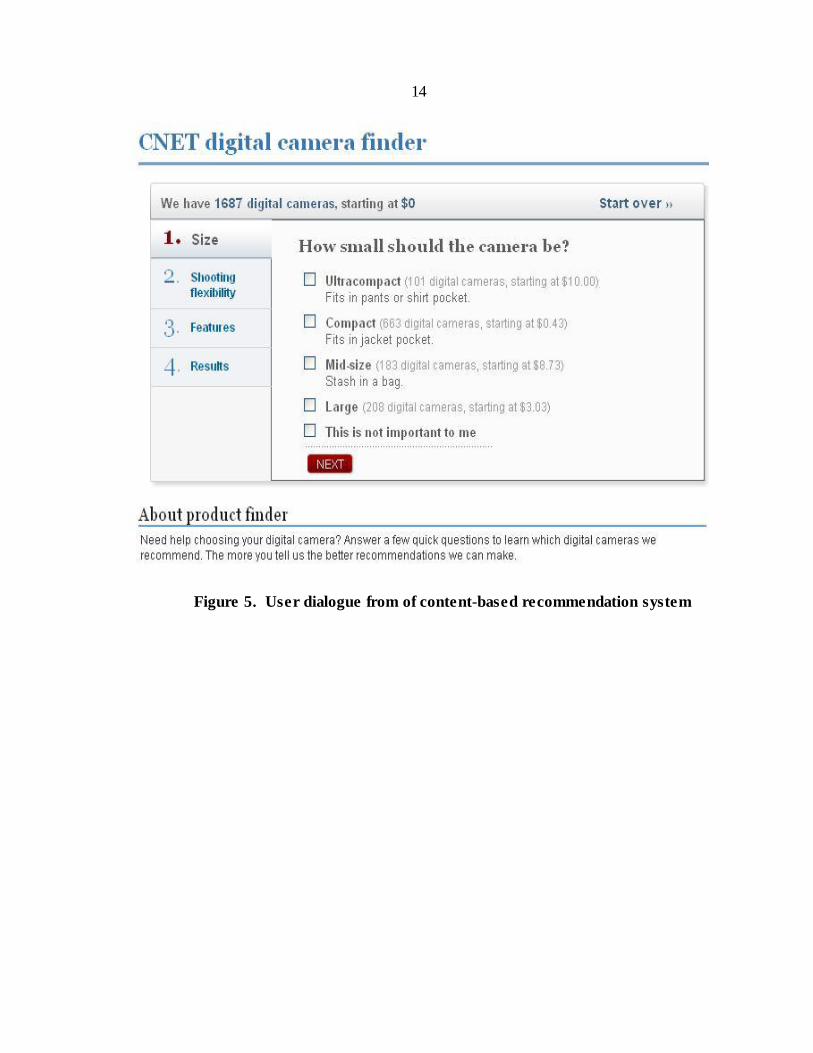
camera with a large LCD monitor. Generally, a user dialogue is a common way in content-
based system to elicit customers’ preferences and needs. As shown in Figure 5, the user
answers questions asked by the system for the specific features of camera. The system makes
recommendations for every individual based on answers (see Figure 6).
14
Figure 5. User dialogue from of content-based recommendation system
15
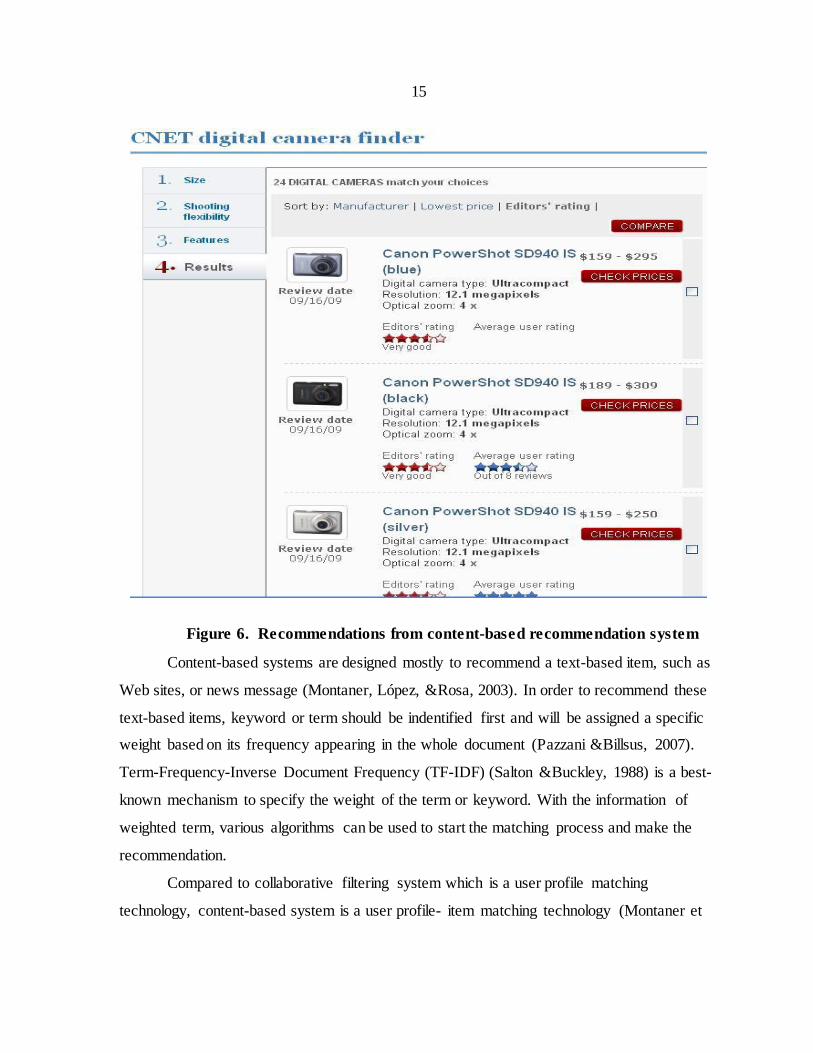
Figure 6. Recommendations from content-based recommendation system
Content-based systems are designed mostly to recommend a text-based item, such as
Web sites, or news message (Montaner, López, &Rosa, 2003). In order to recommend these
text-based items, keyword or term should be indentified first and will be assigned a specific
weight based on its frequency appearing in the whole document (Pazzani &Billsus, 2007).
Term-Frequency-Inverse Document Frequency (TF-IDF) (Salton &Buckley, 1988) is a best-
known mechanism to specify the weight of the term or keyword. With the information of
weighted term, various algorithms can be used to start the matching process and make the
recommendation.
Compared to collaborative filtering system which is a user profile matching
technology, content-based system is a user profile- item matching technology (Montaner et
16
al., 2003). There are various algorithms used by content-based system to create the
recommendation. Few widely used algorithms are presented as follows.
(1) Standard keyword matching: basically, this approach consists of the count of terms which
are present in the current description of the new item and in the user profile (Montaner et
al., 2003).
(2) Cosine similarity: Using vector space model, this approach is also widely used by
collaborative filtering system (Salton &Buckley, 1988). The major difference, however,
between collaborative filtering and content-based systems is that in content-based system,
cosine similarity approach calculates the cosine of the angel to find out the similarity
between item and user profile instead of between two users (Montaner et al., 2003).
(3) Nearest neighbor: This approach computes the distance from the interested item to either
the rest of items or the classes of items in user profile.
2.1.3.1 Issues of Content-based Recommendation System
Compared with collaborative filtering, content-based system makes recommendation
based on individual user’s profile rather than opinions of others. Thus, there is no cold-start
or sparsity problems existed in content-based system. However, there are still some
shortcomings for content-based system. Few challenges are summarized in the following.
(1) Overspecialization (Adomavicius &Tuzhilin, 2005; Schafer et al., 2007): Content-based
systems have no inherent methods for generating serendipitous finds. The system
recommends more of what the customer has already seen and indicated a liking for. As a
consequence, the user is only restricted to getting the items similar to those have been
rated positively.
(2) New user problem (Adomavicius &Tuzhilin, 2005; Pazzani &Billsus, 2007; Schafer et
al., 2007): Content-based filtering still has the issue of new user similar to collaborative
filtering system. A new user, having few sufficient ratings, cannot get applicable
recommendations. However, unlike collaborative filtering, content-based system can
provide relevance for items without ratings (e.g., new items).
17
2.2 Unified Theory of Acceptance and Use of Technology
One of continuing issues in the field of information system is to identify factors that
cause people accept and use of systems developed and implemented by others. Proposed by
Davis (1989), Technology Acceptance Model (TAM) is a well-validated model in predicting
and explaining users’ intention to accept technology. Specifically, TAM provides a
fundamental framework to explain and measure the impact of external variables on beliefs,
attitudes, and intentions (Davis, 1986; Davis, Bagozzi, &Warshaw, 1989). With the related
researches of TAM, researchers have resulted in several theoretical models that routinely
explain over 40 percent of variance in individual intention to use technology. Although these
different models do have their own effects in explaining individual acceptance case, mostly,
researchers need across multiple models to find the favorable constructs or the most
applicable model. From researcher’s standpoint, this process is a time-consuming job and
sometimes ignores the contribution from alternative models (Venkatesh et al., 2003). In order
to present a more comprehensive model, Venkatesh et al. (2003) integrated eight related
models and proposed the Unified Theory of Acceptance and Use of Technology (UTAUT).
In this section, the theoretical fundamentals of these eight models are described briefly.
2.2.1 Underlying Concept of UTAUT
In terms of how and why individuals accept new technologies, two streams have been
studied and all contributed a lot in the area of technology acceptance (Venkatesh et al., 2003).
One stream focused on individual acceptance of technology by using usage or intention as a
dependable variable (Davis, 1986; Davis et al., 1989). Another one concentrated on
implementation success at the organizational level and task technology fit. The concept of
UTAUT is to aim at using usage as the dependable variable and intention as a predicator of
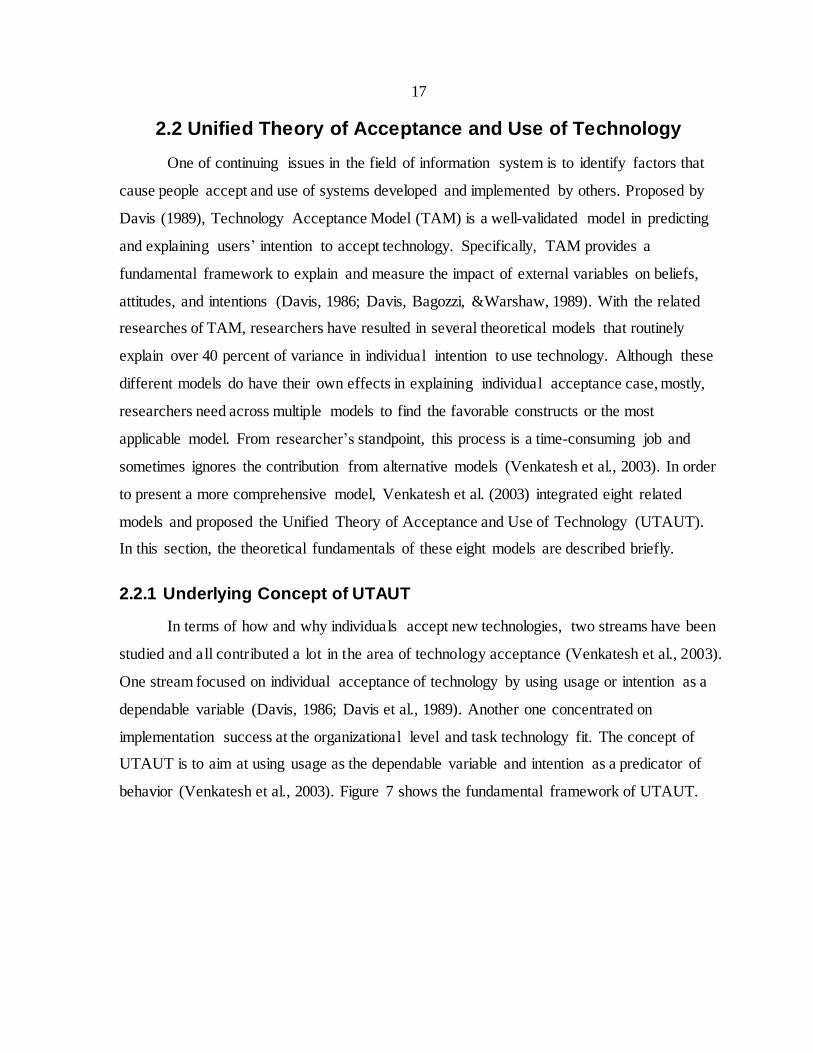
behavior (Venkatesh et al., 2003). Figure 7 shows the fundamental framework of UTAUT.
18
Figure 7. Basic concept of UTAUT, Venkatesh et al. (2003)
Combined with this concept, eight related models in UTAUT are presented as the
follow.
1. Theory of Reasoned Action (TRA)
2. Technology Acceptance Model (TAM)
3. Motivational Model (MM)
4. Theory of Planned Behavior (TPB)
5. Combined TAM and TPB (C-TAM-TPB)
6. Model of PC Utilization (MPCU)
7. Innovation Diffusion Theory (IDT)
8. Social Cognitive Theory (SCT)
Generally, the use of information technology is to finish a “job”. For example, by
using word processor, we can finish the thesis or dissertation in an easy way. In our study, we
identify the “job” as the process of shopping in the e-commence. By using the functionality
of recommendation systems, people can get more personalized shopping advice to finish the
“job” more efficiently and easily. Thus, based on UTAUT, this study attempts to analyze and
explain people’s motivation beyond using recommendation systems.
2.2.1.1 Theory of Reasoned Action (TRA)
Developed by Ajzen and Fishbein (1980; 1975), TRA was derived from the area of
social psychology used to predict and explain the process of making decisions. Attitude,
subjective norm, and behavioral intention are three major components of TRA. Attitude is
“an individual’s positive or negative feelings about performing the target behavior” (Fishbein
&Ajzen, 1975). According to Ajzen and Fishbein (1980), people’s behavior is determined by
19
behavior intention where behavior intention is influenced by individual’s attitude toward the
behavior and subjective norm. An individual’s positive or negative attitude toward the target
behavior will determine the strength of individual’s behavior intention. Subjective norm
refers to individual’s perception of whether people who are important to individual think the
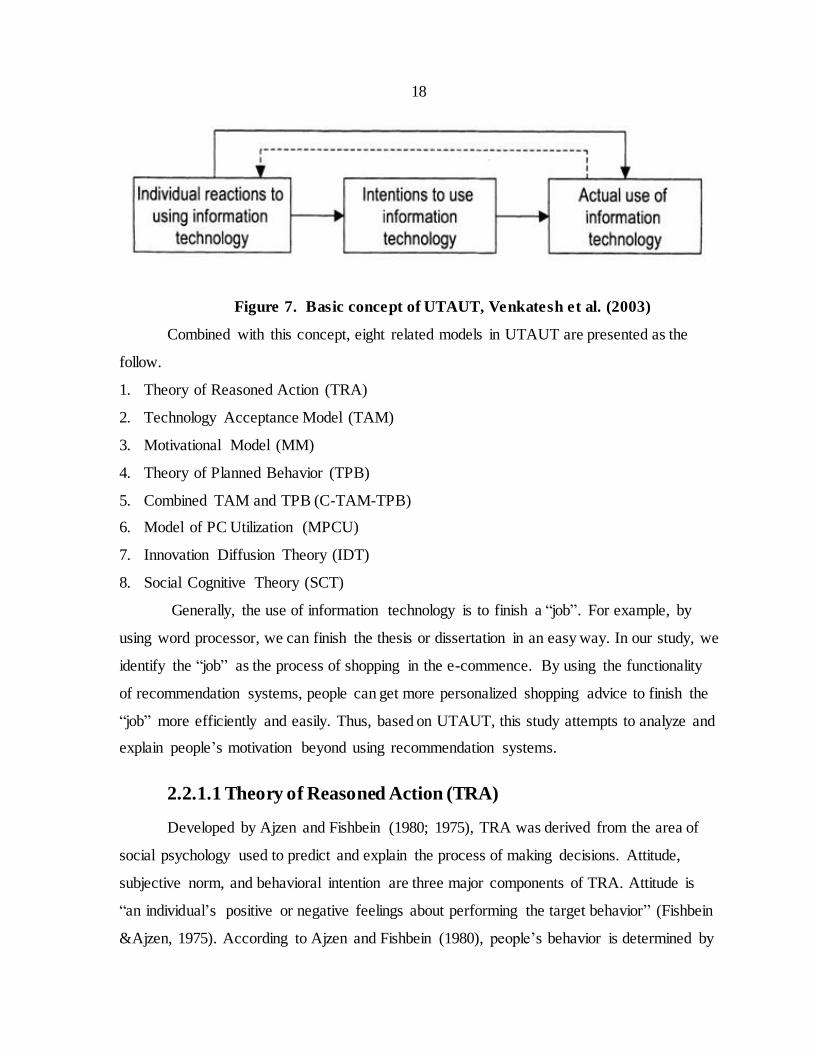
performance should be performed. Figure 8 shows the fundamental idea of TRA.
Figure 8. Theory of Reasoned Action (TRA), Ajzen and Fishbein (1980)
2.2.1.2 Technology Acceptance Model (TAM)
Davis (1989) proposed TAM to predict individual’s information technology
acceptance. As the adaption of TRA, TAM also views that the behavior is determined by
behavioral intention. However, attitude toward behavior and subjective norm are replaced by
perceived usefulness (PU) and perceived ease of use (PEU). Davis (1989) stated that
perceived usefulness (PU) is “the degree to which a person believes that using a particular
system would enhance his or her job performance” and perceived ease of use (PEU) is “the
degree to which a person believes that using a particular system would be free of effort”.
TAM has been reexamined and replicated largely and seen as a robust model in the study of
technology acceptance (Adams, Nelson, &Todd, 1992; Szajna, 1994; Wixom &Todd, 2005).
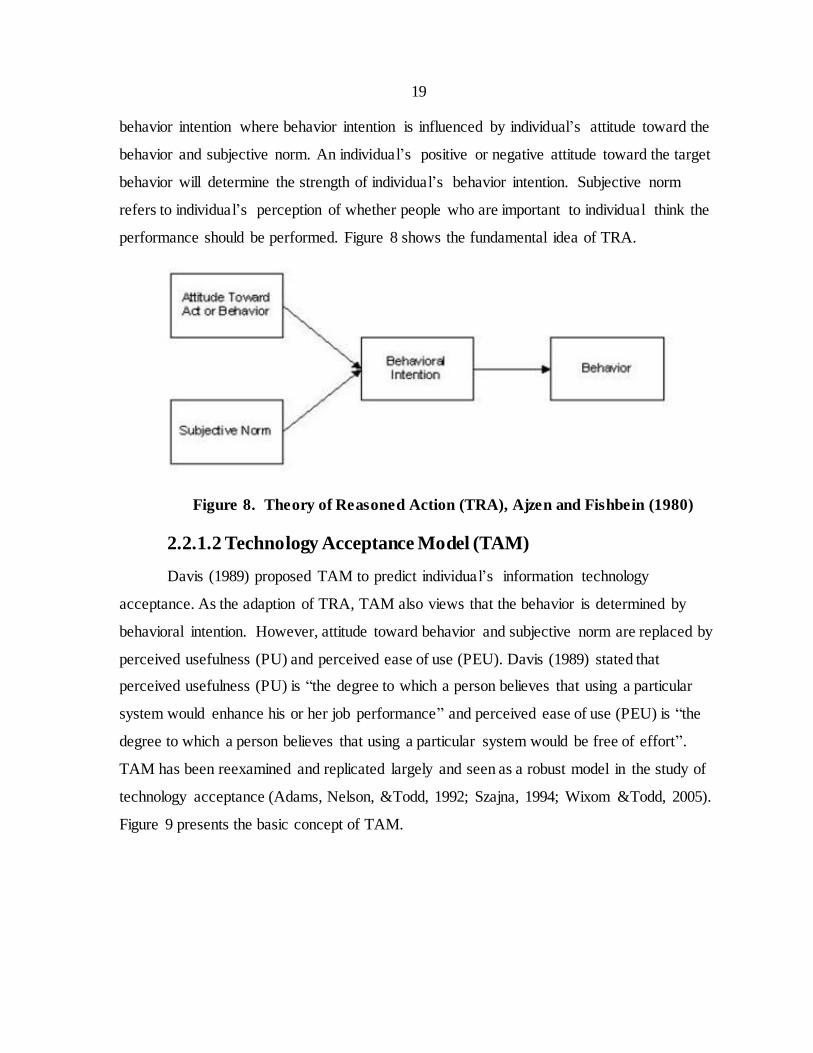
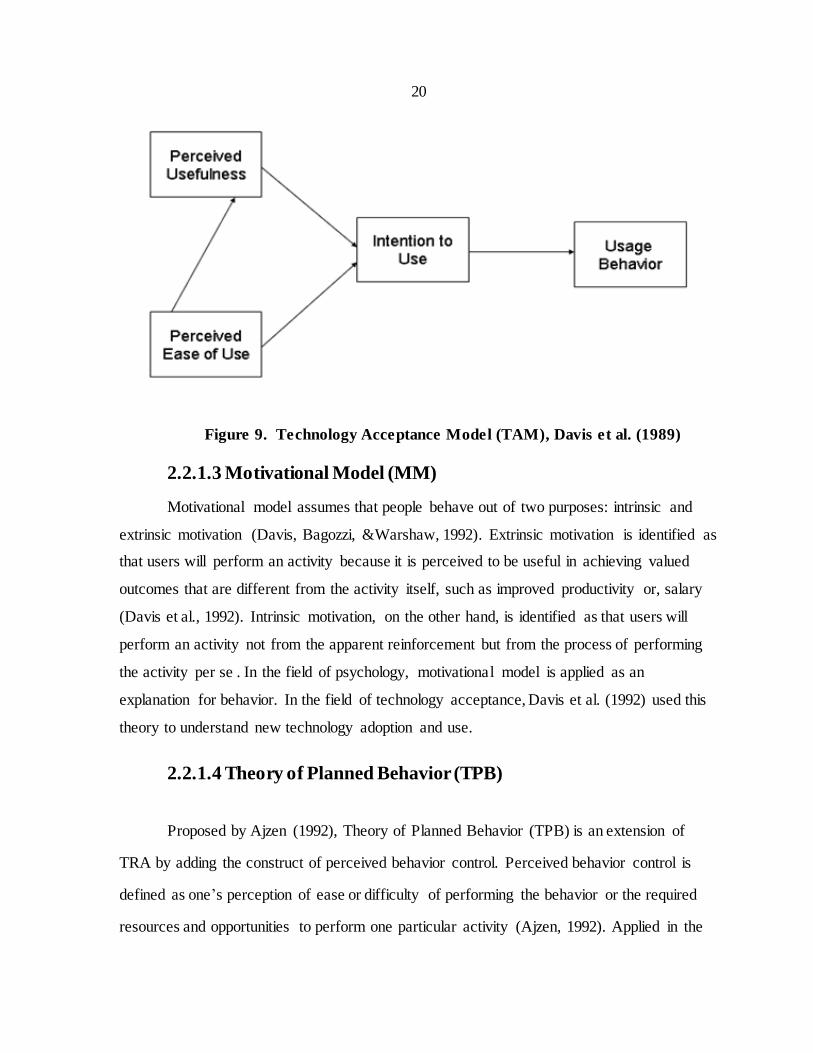
Figure 9 presents the basic concept of TAM.
20
Figure 9. Technology Acceptance Model (TAM), Davis et al. (1989)
2.2.1.3 Motivational Model (MM)
Motivational model assumes that people behave out of two purposes: intrinsic and
extrinsic motivation (Davis, Bagozzi, &Warshaw, 1992). Extrinsic motivation is identified as
that users will perform an activity because it is perceived to be useful in achieving valued
outcomes that are different from the activity itself, such as improved productivity or, salary
(Davis et al., 1992). Intrinsic motivation, on the other hand, is identified as that users will
perform an activity not from the apparent reinforcement but from the process of performing
the activity per se . In the field of psychology, motivational model is applied as an
explanation for behavior. In the field of technology acceptance, Davis et al. (1992) used this
theory to understand new technology adoption and use.
2.2.1.4 Theory of Planned Behavior (TPB)
Proposed by Ajzen (1992), Theory of Planned Behavior (TPB) is an extension of
TRA by adding the construct of perceived behavior control. Perceived behavior control is
defined as one’s perception of ease or difficulty of performing the behavior or the required
resources and opportunities to perform one particular activity (Ajzen, 1992). Applied in the
21
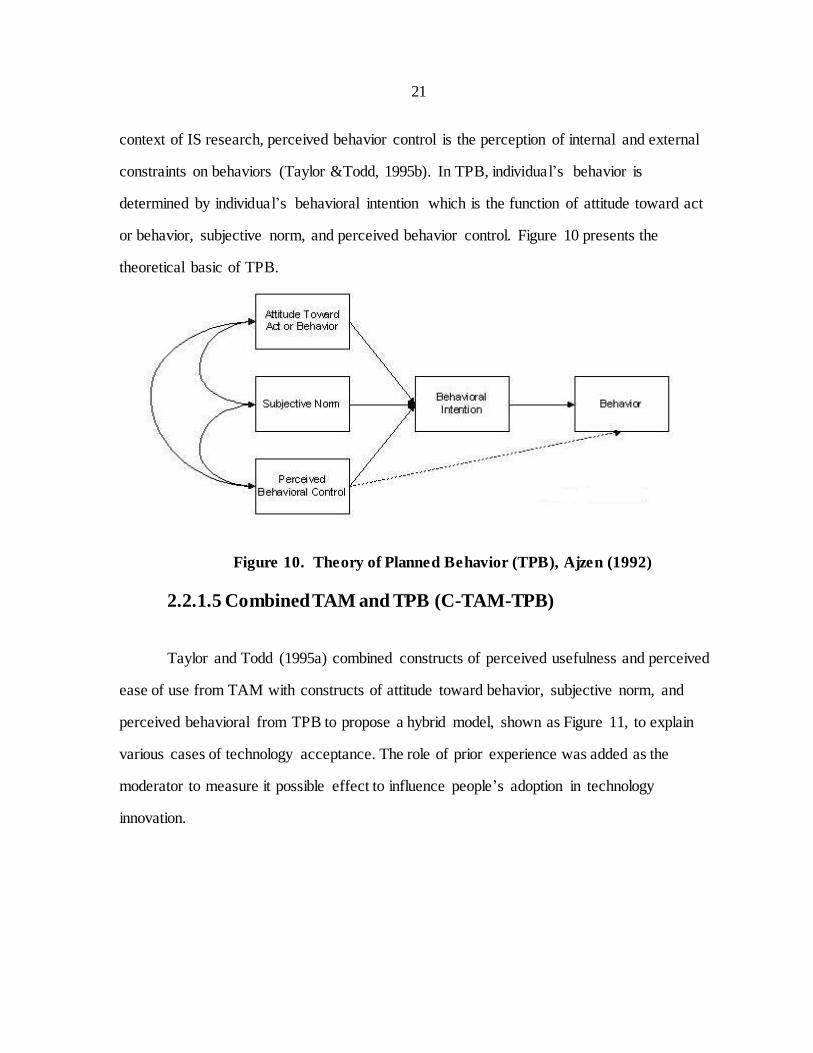
context of IS research, perceived behavior control is the perception of internal and external
constraints on behaviors (Taylor &Todd, 1995b). In TPB, individual’s behavior is
determined by individual’s behavioral intention which is the function of attitude toward act
or behavior, subjective norm, and perceived behavior control. Figure 10 presents the
theoretical basic of TPB.
Figure 10. Theory of Planned Behavior (TPB), Ajzen (1992)
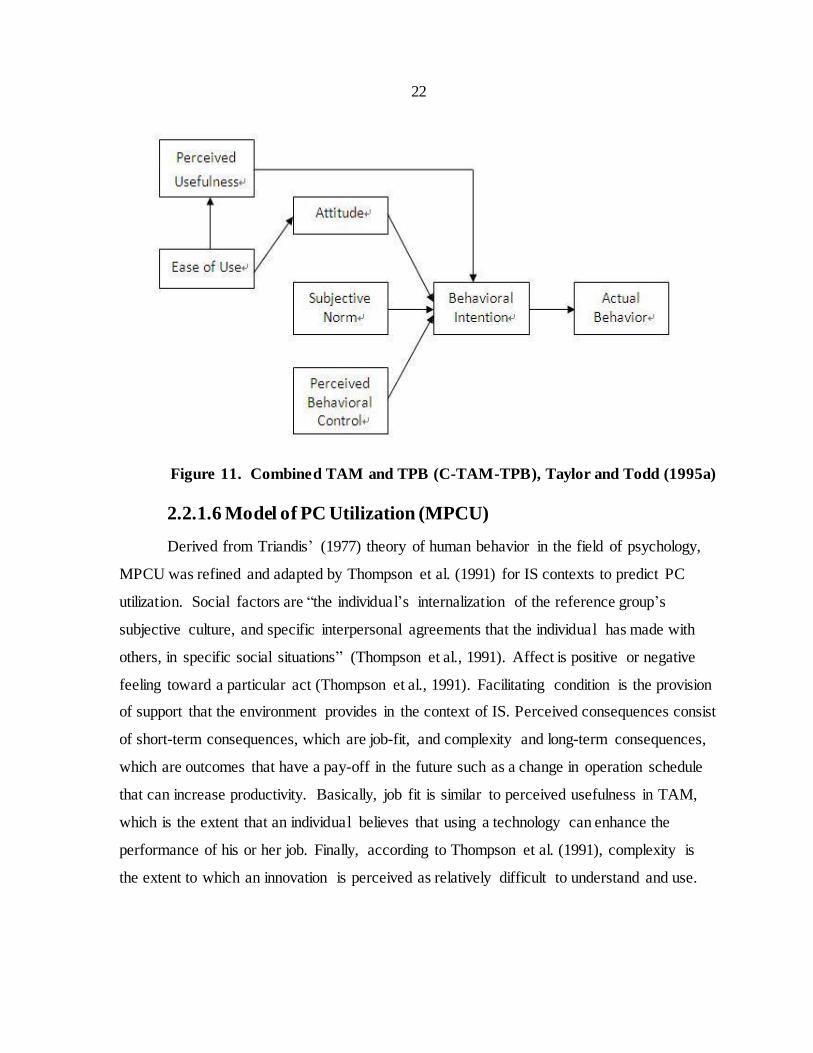
2.2.1.5 Combined TAM and TPB (C-TAM-TPB)
Taylor and Todd (1995a) combined constructs of perceived usefulness and perceived
ease of use from TAM with constructs of attitude toward behavior, subjective norm, and
perceived behavioral from TPB to propose a hybrid model, shown as Figure 11, to explain
various cases of technology acceptance. The role of prior experience was added as the
moderator to measure it possible effect to influence people’s adoption in technology
innovation.
22
Figure 11. Combined TAM and TPB (C-TAM-TPB), Taylor and Todd (1995a)
2.2.1.6 Model of PC Utilization (MPCU)
Derived from Triandis’ (1977) theory of human behavior in the field of psychology,
MPCU was refined and adapted by Thompson et al. (1991) for IS contexts to predict PC
utilization. Social factors are “the individual’s internalization of the reference group’s
subjective culture, and specific interpersonal agreements that the individual has made with
others, in specific social situations” (Thompson et al., 1991). Affect is positive or negative
feeling toward a particular act (Thompson et al., 1991). Facilitating condition is the provision
of support that the environment provides in the context of IS. Perceived consequences consist
of short-term consequences, which are job-fit, and complexity and long-term consequences,
which are outcomes that have a pay-off in the future such as a change in operation schedule
that can increase productivity. Basically, job fit is similar to perceived usefulness in TAM,
which is the extent that an individual believes that using a technology can enhance the
performance of his or her job. Finally, according to Thompson et al. (1991), complexity is
the extent to which an innovation is perceived as relatively difficult to understand and use.
23
2.2.1.7 Innovation Diffusion Theory (IDT)
IDT has been used since the 1960s to study a variety of innovations. In the field of IS,
Moore and Benbasat (1991) adapted the characteristics of innovations and proposed a set of
constructs and a series of instruments that could be applied to explain and measure individual
technology acceptance. Those characteristics of innovation included in Moore and Benbasat’
(1991) study are relative advantage, ease of use, image, visibility, compatibility, results
demonstrability, and voluntariness of use.
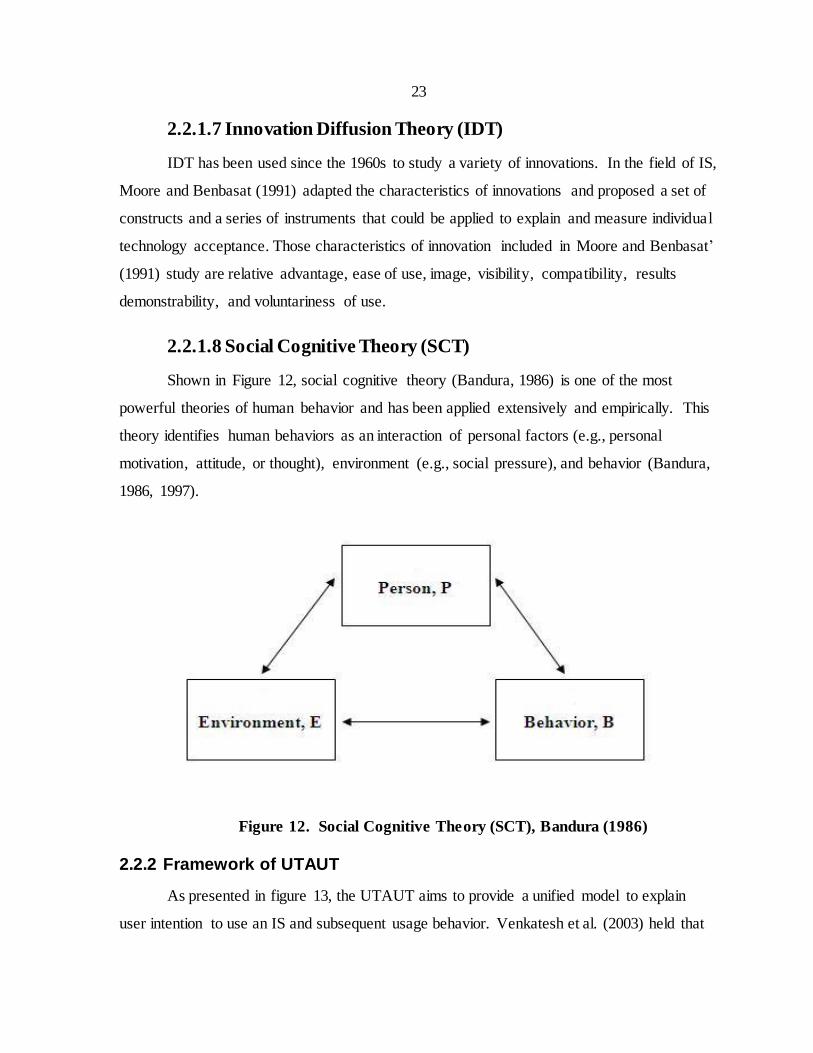
2.2.1.8 Social Cognitive Theory (SCT)
Shown in Figure 12, social cognitive theory (Bandura, 1986) is one of the most
powerful theories of human behavior and has been applied extensively and empirically. This
theory identifies human behaviors as an interaction of personal factors (e.g., personal
motivation, attitude, or thought), environment (e.g., social pressure), and behavior (Bandura,
1986, 1997).
Figure 12. Social Cognitive Theory (SCT), Bandura (1986)
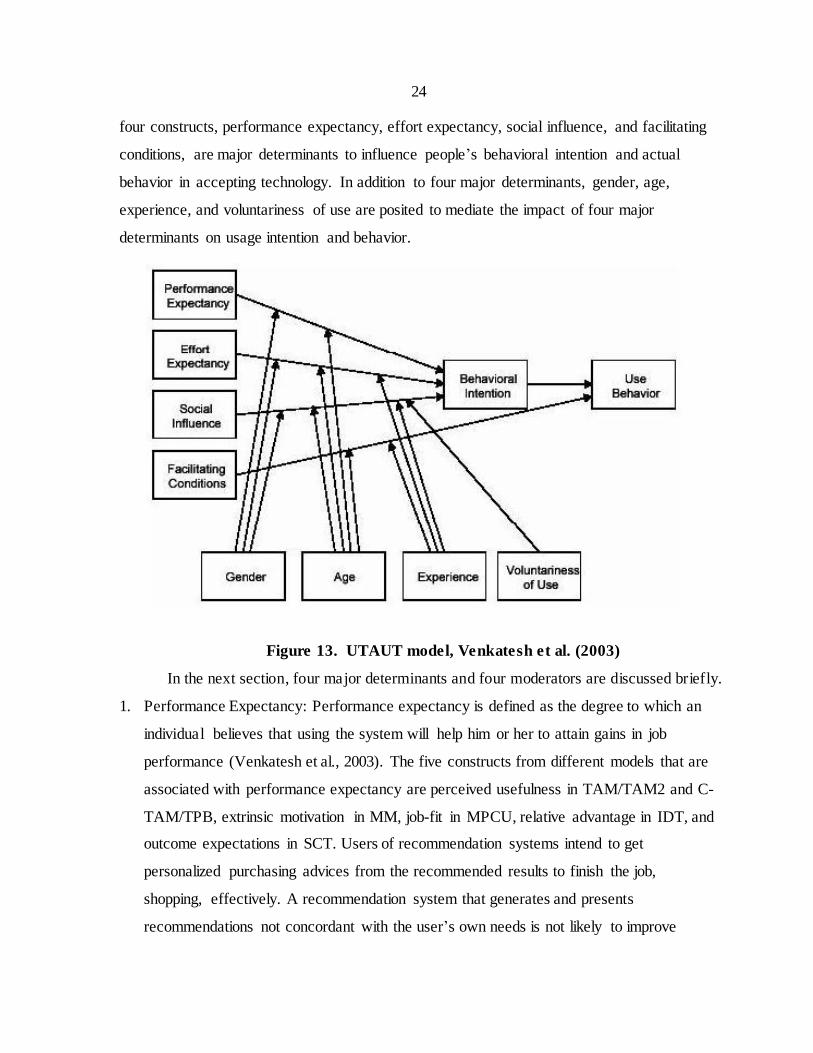
2.2.2 Framework of UTAUT
As presented in figure 13, the UTAUT aims to provide a unified model to explain
user intention to use an IS and subsequent usage behavior. Venkatesh et al. (2003) held that
24
four constructs, performance expectancy, effort expectancy, social influence, and facilitating
conditions, are major determinants to influence people’s behavioral intention and actual
behavior in accepting technology. In addition to four major determinants, gender, age,
experience, and voluntariness of use are posited to mediate the impact of four major
determinants on usage intention and behavior.
Figure 13. UTAUT model, Venkatesh et al. (2003)
In the next section, four major determinants and four moderators are discussed briefly.
1. Performance Expectancy: Performance expectancy is defined as the degree to which an
individual believes that using the system will help him or her to attain gains in job
performance (Venkatesh et al., 2003). The five constructs from different models that are
associated with performance expectancy are perceived usefulness in TAM/TAM2 and C-
TAM/TPB, extrinsic motivation in MM, job-fit in MPCU, relative advantage in IDT, and
outcome expectations in SCT. Users of recommendation systems intend to get
personalized purchasing advices from the recommended results to finish the job,
shopping, effectively. A recommendation system that generates and presents
recommendations not concordant with the user’s own needs is not likely to improve
25
decision quality. Thus, our study focuses on whether the recommended results have
positive effects on customers in terms of making purchasing decisions and, therefore,
influence their intentions to use recommendation systems.
2. Effort Expectancy: Effort expectancy is defined as the degree of ease associated with the
use of the system (Venkatesh et al., 2003). The three sub constructs of effort expectancy
captured from the existing models are perceived ease of use in TAM/TAM2, complexity
in MPCU, and ease of use in IDT. Basically, any type of recommendation system should
elicit customers’ preferences first and then makes the recommendations based on these
preferences. Therefore, the ease for users to generate new or additional recommendations
and the amount of control users have when interacting with recommendation systems’
preference interfaces influence users’ evaluations of recommendation systems. As a
consequence, our study seeks to understand whether the degree of the perceived ease of
use for a given recommendation system does influence customers’ intentions to use the
recommendation system.
3. Social Influence: Social influence is defined as the degree to which an individual
perceives that important others believe he or she should use the new system (Venkatesh
et al., 2003). The associated constructs of social influence captured from previous models
are subjective norm in TRA, TAM2, TPB, and C-TAM-TPB, social factors in MPCU,
and image in IDT. In our study, social influence is identified as the degree to which the
user of a recommendation system perceives that if his/her important peers, friends, or
families think he or she should use the recommendation systems.
4. Facilitating Conditions: Facilitating conditions are defined as the degree to which an
individual believes that an organization and technical infrastructure exists to support use
of the system (Venkatesh et al., 2003). Three major constructs from the previous models
define the construct of facilitating conditions: perceived behavioral control from TPB,
facilitating conditions from MPCU, and compatibility from IDT. Venkatesh et al. (2003)
mentioned that facilitating conditions are moderated by users’ experiences and age. In
our study, perceived behavioral control is defined as the degree to which an individual
perceives that he or she possesses enough knowledge or capacity to use the
recommendation system. Facilitating conditions is defined as if any online assistance or
26
support is available when customers have problems in using the functionalities of
recommendation system. For compatibility, this study identifies the use of a
recommendation system as a personal behavior that is unnecessary to inconsistent with
the existed values of the organization. Thus, the construct of compatibility is not
discussed in this study.
5. Moderators: Four moderators, gender, age, experience, and voluntariness of use, are put
into UTAUT to take account of every possible situation for accepting technology.
Previous research has considered the effects of these moderators and demonstrated their
effects in the case of adopting technology. Research indicates that men tend to be highly
job-oriented and, therefore, performance expectancies, which concentrate on job
accomplishment, are more likely to be noticeable to men (Minton &Schneider, 1980). In
addition to gender, age is also considered to play a moderating role. Researches on job-
related attitudes shows that younger workers are more responsive to extrinsic rewards
(Hall &Mansfield, 1975). In the context of adopting technology, Morris and Venkatesh
(2000) held that gender and age differences do influence people’s intentions to accept
technology. Additionally, Ventatesh et al. (2003) stated that the degree of effort
expectancy is moderated by users’ age and gender. For example, older females focus
more on the effort expectancy of system use. However, with more experience using the
system, the effect of effort expectancy will decrease gradually. In the social influence part,
women are more sensitive to other’s opinions (Miller, 1976; Venkatesh, Morris,
&Ackerman, 2000). Thus, social influence is likely to be more salient to women when
forming an intention to use technology. Furthermore, facilitating condition is also
moderated by age and experience. Prior research shows that supportive help or assistance
grabs more older workers’ attention (Hall &Mansfield, 1975).
2.3 Trust
Customers often hesitate to interact with Web-based vendors because of uncertainty
of performance engaged in by these vendors or the perceived risk of personal information
stolen by hackers (McKnight, Choudhury, &Kacmar, 2002). Human beings tend to reduce
their social uncertainty, that is, they seek ways to understand, predict, and occasionally
27
attempt to control the behavior of other people (Gefen &Straub, 2004). However, the
impossibilities of controlling actions of others or understanding others’ thoughts or
motivations make the situation so complicated that it reduces people’s intentions to perform a
particular action. When people cannot reduce social uncertainty through rules or customs,
they resort to trust, one of the most effective methods to reduce social uncertainty and
complexity, as a major method to reduce social uncertainty (Kelley, 1979; Luhmann, 1979;
Thibaut &Kelley, 1978). As a consequence, in the context of high social uncertainty, such as
e-commerce, trust plays a central role in reducing social uncertainty and helping customers
overcome the perceived risk of exposing personal information.
What is trust? A variety of definitions of trust are given by different disciplines.
Broadly, trust is the belief that other people will respond in an predictable way (Luhmann,
1979). In the discipline of management and marketing, trust is “a willingness to rely on an
exchange partner in whom one has confidence and is dependent on developing shared values
and effective communication” (Moorman, Deshpande, &Zaitnnan, 1993). Similarly,
Geyskens et al. (1996) defined trust as that people believe or expect that vendor’s promise or
behavior can be relied on and the vendors will not take advantage of the customers’
vulnerabilities. In the discipline of psychology, trust is defined as a tendency to trust others
(Rotter, 1971). In the discipline of social psychology, trust is defined as a cognition about the
trustee (Rempel, Holmes, &Zanna, 1985).
Previous research focused more on applying the concept of trust into the acceptance
of e-commerce, showing that trust does influence people’s intentions for shopping in the
realm of e-commerce (Gefen, 2000; Gefen, Karahanna, &Straub, 2003b; Gefen &Straub,
2003). The major reason behind this is that the buyers should trust first that e-vendors will
not take advantages of using their personal information (i.g., credit number) illegally or
inappropriately and then shop in the context of e-commerce. In other words, privacy concern,
which is the consequence of revealing personal information, is the top priority for customers
when transacting with e-vendors. The same situation can be applied in the setting of
recommendation systems. In order to get the most personalized recommendations, users
should express preferences or personal information more clearly. The clearer preferences or
personal information users express the more accurate and personalized recommendations
28
users will get. However, with providing more and clearer preferences, users are concerned
more about the risk of unwanted exposure of personal information (Lam, Frankowski,
&Riedl, 2006). Therefore, in order to initiate the whole process of generating the
recommendations, the users of recommendation system should trust the providers of
recommendation system first that they will not abuse their personal information. In addition
to the input part of the whole process, the users also need to trust the output of the whole
process, the recommended recommendations. If the users don’t trust the recommended
recommendations, they will not intend to use the recommendation system. Thus, the
definition of trust in this study is that the providers of a recommendation system will respond
to people’s needs, getting the most personalized recommendations, in a predictable way.
2.4 Types of Products
Previous research has demonstrated that hedonic and utilitarian products have
different effects on customer behaviors and attitudes (Heijden, 2004; Hirschman &Holbrook,
1982; King &Balasubramanian, 1994). Hedonic products provide more experiential
consumption, pleasure, fantasy, fun, and excitement, whereas utilitarian products are
instrumental, functional, and goal oriented (Dhar &Wertenbroch, 2000; Hirschman
&Holbrook, 1982). Additionally, Goetzinger and Park mentioned (2005) that hedonic
products are typically discretionary and utilitarian products are typically necessary.
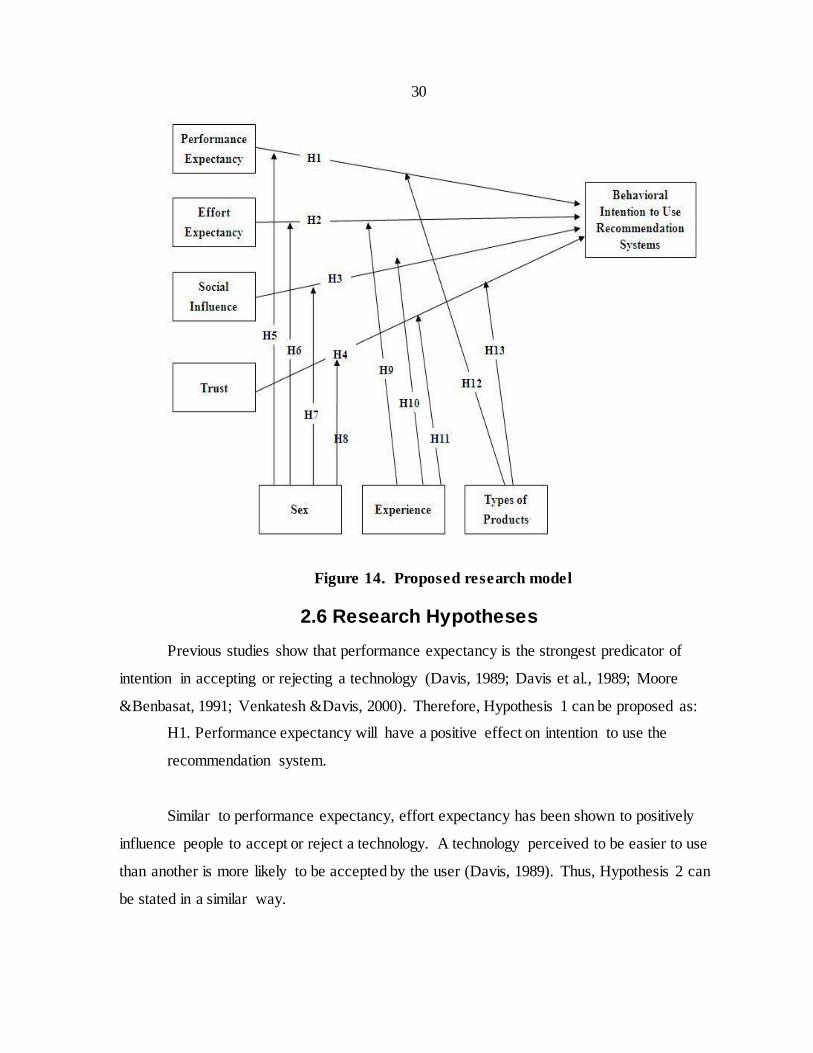
2.5 Research Model
Based on the discussions above, the research model of this study is schematized in
Figure 14. The major differences between this study and the original UTAUT study lies in
the temporal dimension and changes of external variables to fit the current study. For the
temporal dimension, Venkatesh et al. (2003) measured people’s actual usage behavior in
three time spans. Contrasted to the original UTAUT study, this study only focuses on one
time span to measure people’s intentions to use the recommendation system. For external
variables, this study only focuses on measuring people’s intentions to accept two types of
recommendation systems rather than measuring people’s actual behavior of using the
recommendation system. As a consequence, the construct of facilitating condition, which
29
only influences people’s actual usage behavior, is removed from the original model. The
construct of trust, an important concept in e-commerce, is added to the research model to
measure people’s intentions. Venkatesh et al. (2003) stated that people’s degree of familiarity
with the system will be changed with time. This difference of familiarity can be used to
measure the effect of experience in every construct. But this study only focuses on snapshot
of use of the recommendation system. Therefore, the original form of experience is not
appropriate in this study. The moderator of experience in this study is identified as an
individual’s habit of using recommendation system in the past (Venkatesh &Davis, 1996).
The major target of this study concentrates on ISU Business undergraduate students. Most of
them are younger age average. Thus, the moderator of age is removed from the original
model. For the moderator of voluntariness of use, the use of the recommendation system in
this study is identified as the personal use of getting purchasing advice. No difference in
voluntariness use can be considered in this study. Thus, the moderator of voluntariness use is
removed from the original model. Additionally, because utilitarian and hedonic products
have different effects to influence people’s attitudes and behaviors (Heijden, 2004;
Hirschman &Holbrook, 1982), these two types of products are used as a moderator to
measure people’s intentions.
30
Figure 14. Proposed research model
2.6 Research Hypotheses
Previous studies show that performance expectancy is the strongest predicator of
intention in accepting or rejecting a technology (Davis, 1989; Davis et al., 1989; Moore
&Benbasat, 1991; Venkatesh &Davis, 2000). Therefore, Hypothesis 1 can be proposed as:
H1. Performance expectancy will have a positive effect on intention to use the
recommendation system.
Similar to performance expectancy, effort expectancy has been shown to positively
influence people to accept or reject a technology. A technology perceived to be easier to use
than another is more likely to be accepted by the user (Davis, 1989). Thus, Hypothesis 2 can
be stated in a similar way.
31
H2. Effort expectancy will have a positive effect on intention to use the
recommendation system.
Prior studies have stated that social influence is a direct determinant of behavioral
intention; that is, people’s behavioral intention will be influenced by their peers, families, or
friends (Ajzen, 1992; Moore &Benbasat, 1991; Taylor &Todd, 1995b; Thompson et al. , 1991;
Venkatesh &Davis, 2000). As a result, Hypothesis 3 can be proposed as:
H3. Social influence will have a positive effect on intention to use the
recommendation system.
Trust has been empirically validated as one of the most important determinants to
purchase intention by online shoppers (Gefen, 2000; Gefen, Karahanna, &Straub, 2003a;
Gefen et al., 2003b; Gefen &Straub, 2003; Reichheld &Schefter, 2000). Customers’ trust in
an e-vendor can reduce their concerns in the risk of exposing privacy issue such as credit
card information or uncertainty when shopping on line (Gefen et al., 2003a, 2003b). The
same situation can be applied in the context of recommendation systems. In order to provide
the most customized recommendation to the user, recommendation agents involved in
inquiring customer’s personal information or preferences first to generate the
recommendation. Thus, if the users don’t have enough trust in a recommendation agent, they
are not likely to use it or may switch to another recommendation agent (Koufaris, 2002). To
summarize, Hypothesis 4 can be summarized as:
H4. Trust in the recommendation system will have a positive effect on intention to
use the recommendation system.
Research on sex difference indicates that men tend to be likely task-oriented (Minton
&Schneider, 1980). As a result, performance expectancy, which focuses on task
accomplishment, is salient to men (Venkatesh et al., 2003). Therefore, Hypothesis 5 can be
stated as:
H5. The effect of performance expectancy on intention to use the recommendation
system will be moderated by the sex of the user.
32
Previous studies have shown that effort expectancy is more salient to women than
men (Venkatesh &Morris, 2000; Venkatesh et al., 2000). Thus, Hypothesis 6 can be
proposed as:
H6. The effect of effort expectancy on intention to use the recommendation system
will be moderated by the sex of the user.
Theory suggests that women tend to be more sensitive to other’s opinions (Miller,
1976; Venkatesh et al., 2000). Therefore, Ventatesh et al. (2003) stated that the effect of
social influence will be more salient to women than men when forming the intentions to
accept a new technology. Thus, Hypothesis 7 can be proposed as:
H7. The effect of social influence on intention to use the recommendation system will
be moderated by the sex of the user.
Research has demonstrated that female customers have more trust concerns than men
and are less likely to purchase on line (Chaudhuri &Gangadharan, 2002; Sheehan, 1999).
Therefore, Hypothesis 8 can be presented as:
H8. The effect of trust on intention to use the recommendation system will be
moderated by the sex of the user.
The effect of effort expectancy is significant during the first time period of accepting
the technology; however, it becomes nonsignificant over an extended period and sustained
usage (Davis et al., 1989; Thompson et al., 1991; Venkatesh et al., 2003). Thus, Hypothesis 9
can be proposed as:
H9. The effect of effort expectancy on intention to use the recommendation system
will be moderated by experience.
The relative influence of social influence on intentions is expected to be stronger to
those who don’t have prior experiences because they rely on other’s reactions to form their
intentions (Burnkrant &Cousineau, 1975; Davis et al., 1989; Thompson et al., 1991;
33
Venkatesh et al., 2003). However, the influence of social influence will be attenuated over
time as people have more experiences in one specific event (Venkatesh et al., 2003). Thus,
Hypothesis 10 can be stated as:
H10. The effect of social influence on intention to use the recommendation system
will be moderated by experience.
The effect of trust changes over time with experiences (Gefen et al., 2003a). Trust is
particularly important for those who interact with recommendation agents for the first time
and have a limited understanding of agents’ behaviors (Wang, W. &Benbasat, 2005). They
should trust the recommendation agent first for not taking advantage of their vulnerabilities.
Otherwise, they are likely to shift to another recommendation agent or not to use it.
Therefore, Hypothesis 11 can be presented as:
H11. The effect of trust on intention to use the recommendation system will be
moderated by experience.
Hedonic and utilitarian products have different effects on customer purchasing
perceptions (Heijden, 2004; Hirschman &Holbrook, 1982). Hirschman and Holbrook (1982)
described customers as either a “problem solver” or seekers of “fun, fantasy, arousal, sensory
stimulation, and enjoyment.” Therefore, performance expectancy, which focuses on task
accomplishment, will be different based on the products customers want to purchase. More
specifically, the meaning of task accomplishment for those who buy a hedonic product is
likely to seek fun, arousal, and enjoyment. On the other hand, the meaning of task
accomplishment for those who buy utilitarian product is more likely to focus on task-oriented
or instrumental needs. Thus, Hypothesis 12 can be proposed as:
H12. The effect of performance expectancy on intention to use the recommendation
system will be moderated by product types.
Research in advertising suggests that the influence of an endorser or spokesperson is
likely to be judged on whether the product is viewed as hedonic or utilitarian purchase (Feick
&Higie, 1992; Stafford, Stafford, &Day, 2002). In utilitarian purchase situation, customers
34
consider more on the functional attributes of items (Heijden, 2004; Hirschman &Holbrook,
1982). In this situation, customers have found to prefer endorses who are experts or at least
experiences with this utilitarian product to help them evaluate the functional attributes of this
product (Feick &Higie, 1992; Stafford et al., 2002). In other words, customers who make
utilitarian purchases will trust experts or at least experiences with this utilitarian product
more to evaluate or provide some advice for this product. The recommendation system is
viewed as an online expert with experiences dealing with a specific product. Thus,
Hypothesis 13 can be presented as:
H13. The effect of trust on intention to use the recommendation system will be
moderated by product types.
2.7 Definitions of Variables
The constructs examined in this study are performance expectancy, effort
expectancy, social influence, trust, gender, experience, and types of products. The definitions
of these variables are identified in the following section.
2.7.1 Performance Expectancy
Performance expectancy for the recommendation system is defined as the degree to
which an individual believes that using the recommendation system will help him or her to
increase the efficiency of searching or finding items (e.g., improving the quality of
purchasing decisions, solving the problem of information overload) (Venkatesh et al., 2003).
2.7.2 Effort Expectancy
Effort expectancy for the recommendation systems is defined as the degree of ease
associated with the use of the recommendation system (e.g., easy to express personal
preference, easy to check or select the recommended results)
2.7.3 Social Influence
Social influence for the recommendation system is defined as the degree to which an
individual perceives that important others such as peers, families, friends, professors, or
colleagues believe he or she should use the recommendation system.
35
2.7.4 Trust
Trust in the recommendation system is defined as the degree to which an individual
believes that recommendation agents can be relied on and will not take advantages of the
customers’ vulnerabilities when users request the recommendation.
2.7.5 Behavioral Intentions to Use Recommendation Systems
Based on Theory of Planned Behavior (Fishbein &Ajzen, 1975), behavioral intentions
to use recommendation systems is defined as a person’s readiness to use the recommendation
system to receive purchasing advices.
2.7.6 Sex
Venkatesh et al. (2003) mentioned that gender difference results in the difference of
performance expectancy, effort expectancy, and social influence of accepting a technology.
Additionally, previous research shows that men exhibit greater of trust than women do
(Chaudhuri &Gangadharan, 2002; Sheehan, 1999). Thus, gender is used as moderator to
measure potential difference of influencing people’s intentions to accept the recommendation
system.
2.7.7 Experience
Prior experience of using a technology has been demonstrated to influence
performance expectancy, effort expectancy, social influence, and trust of accepting a new
technology (Gefen et al., 2003a; Venkatesh et al., 2003). Experience is defined as
participant’s previous experiences, knowledge, and familiarity with using the
recommendation system.
2.7.8 Types of Products
A hedonic product is defined as a product that can provide more experiential
consumption, pleasure, fantasy, fun, and excitement, whereas utilitarian product is
instrumental, functional, and goal oriented (Dhar &Wertenbroch, 2000; Hirschman
&Holbrook, 1982). Further details about the selected hedonic and utilitarian product will be
provided in the Methodology and Procedures and Result section.
36
CHAPTER 3. METHODOLOGY AND PROCEDURES
3.1 Pilot Test
3.1.1 Participants
For the product manipulation study, 27 participants were recruited from the
undergraduate course in Management Information Systems at a major Midwestern university.
These students were offered extra credit in the class they were recruited from for
participation in a study.
3.1.2 Procedure
An online survey was conducted to select the most diverse pair of items. Participants
were asked to evaluate a set of product classes: cell phones, laptop computers, desktop
computers, digital cameras, MP3 players, TVs, camcorders, printers, and GPSs. For each
product class, subjects were asked whether products could be considered to be closer to being
utilitarian or hedonic, exciting or dull, pleasant or unpleasant, and interesting or boring (see
Appendix B for the manipulation study). According to results, MP3 players represented the
most hedonic product class, and printers represented the most utilitarian. These two product
types were used to examine their effects on customer usage of two types of recommendation
systems. Please see the Results section for further details.
3.2 Final Study
A quasi experimental crossover design was conducted. Subjects were requested to
navigate and go through two types of recommendation systems before filling in the
experimental instrument. An online survey was conducted to identify factors that support or
impede the acceptance of online recommendation systems in e-commerce. Shopping.com
(http://www3.shopping.com/) was the research context of collaborative filtering
recommendation system and CNET Reviews (http://reviews.cnet.com/) was the research
context of content-based recommendation system. The MP3 player was the hedonic product
and the printer was the utilitarian one to measure potential differences of adopting two types
of recommendation systems.
37
3.2.1 Participants
The sample for this research consisted of 51 undergraduate students from the
undergraduate course in Marketing at a major Midwestern university. Please see the Results
section for detailed demographic information. Participation was voluntary and students were
rewarded extra credit for the course for taking part in the study. They were instructed to sign-
up for a time when they could go to a lab-type room. During the period of the study, they
were asked to individually engage in a series of tasks aimed at getting purchasing advice, and
then respond to survey questions. A web survey tool was used to present the material, and
then administer the measures.
3.2.2 Procedure
Stimuli presentation and questionnaire completion took place in a teaching laboratory
commonly used for a variety of computer-based business classes. There were three
experimental sessions, with a maximum number of 20 participants per session. Total
laboratory time was one hour. At the beginning of each session, students were asked to sit
quietly with their PC monitors turned off. They were told that a session leader would guide
them by illustrating two types of recommendation systems with the help of images projected
on a screen in the front of the room. In an attempt to prevent the primary recency effect
(Anderson, N. H. &Barrios, 1961), the order of illustration was completely randomized. The
presentation was divided into two parts. In the first part, the session leader gave participants
brief background about the purpose of the study and definitions of two types of
recommendation systems. After the first part of presentation, participants were asked to
respond with their personal information, pre self-efficacy of online recommendations, and
previous online experiences and future intentions of purchasing MP3 player and printers
online.
The session leader continued to the second part of presentation once all participants
finished the first part of survey. In the second part of the presentation, the session leader gave
participants clearer explanations of two types of recommendation systems and illustrated
these two online recommendation systems. Participants were encouraged to ask questions
about online recommendation systems as the initial demonstration proceeded. The purpose
38
was to orient and provide participants a baseline of familiarity across subjects related to the
basic capabilities of getting purchasing advice from two types of recommendation systems.
At the end of the 15 min pre-exposure demonstration, the session leader instructed
participants to access the second part of the survey. All participants were asked to navigate to
the Shopping.com and CNET Reviews to get personalized recommendations of MP3 player
and printer. Participants were requested to finish four tasks and respond to survey questions
regarding every individual task they just experienced respectively. The order of four tasks
was randomized to prevent the learning effect. The purpose of four tasks was to ensure that
subjects have enough real experiences of getting product recommendations. The instrument
of these four tasks was provided at the first beginning of each survey page. Subjects could
follow this instrument step by step to finish the task.
3.3 Measure
This study used existing validated scales. In the product manipulation study, the
measure of perceived enjoyment was adapted from van der Heijden (2004). The original first
item, enjoyment-disgusting, was used to measure the characteristics of hedonic information
systems. But this study is to measure the characteristics of product. Thus, the original first
item was replaced by hedonic - utilitarian to fit the content of this study. All items were set in
seven point semantic differentials. See Appendix A for the product manipulation pilot study.
For the first part of the final survey, participants provided self-reported sex (choice of
“Male” or “Female”), age (choice of “Under 19 years”, “20~25 years”, “26~30 years”,
“31~35 years”, “35~40 years”, or “Over 40 years”), U.S. citizens (choice of “Yes” or “No”),
ethnicity (choice of “Hispanic or Latino”, “American Indian/Alaskan Native”, “Asian”,
“Black or African American”, “Native Hawaiian or Other Pacific Islander”, “White”, or
“Other”), previous experiences of purchasing printers and MP3 player online (seven-point
Likert scale, ranging from strongly disagree to strongly agree), the intent to buy printers and
MP3 players online in the future (seven-point Likert scale, ranging from strongly disagree (1)
to strongly agree (7)), the list of brand of printer participants bought online before, the list of
brand of printer participants may like or buy online in the future, the list of brand of MP3
player participants bought online before, the list of brand of MP3 player participants may like
39
or buy online in the future. In addition to self-reported questionnaires, the survey instrument
contains the computer self-efficacy, in conformance with the computer self-efficacy
instrument developed by Marakas et al. (2007), to measure participants’ computer self-
efficacy of using recommendation systems. Computer self-efficacy refers to an individual’s
perception of efficacy in performing specific computer-related tasks and judgment of
capability to use a computer (Compeau &Higgins, 1995; Marakas, Yi, &Johnson, 1998).
The measure of computer self-efficacy (seven-point Likert scale, ranging from strongly
disagree to strongly agree) in this study was designed by researchers who are familiar with
the computer self-efficacy and online recommendation systems. Computer self-efficacy was
measured in two stages: pre computer self-efficacy was measured after the first part of
presentation and the computer self-efficacy was measured after the second part of
presentation.
For the second part of the final survey, participants provided self-reported use of
recommendation systems (four point semantic differentials, ranging from never use (1) to
often use (4)). In addition the self-reported use of recommendation systems, measurement of
PE, EE, SI, and BI were adapted from Venkatesh et al.’s (2003) UTAUT scales. The original
UTAUT model was conducted to measure the technology acceptance in the organization or
company. In the UTAUT model, SI-3 and SI-4 were performed to measure the reaction of
senior managers and the business in supporting the use of technology. Thus, SI-3 and SI-4
were removed and two new items were added in to fit the research content of this study.
Validated measures for familiarity and trust were adopted from Gefen (2000), who assessed
the importance of trust on book purchase at Amazon.com, and modified to suit the research
context. Familiarity refers to familiarity with two types of recommendation systems and uses
to probe subject’s past experiences or habits of using these two types of recommendation
systems. The measure of computer self-efficacy, in conformance with the computer self-
efficacy instrument developed by Marakas et al. (2007), was designed by researchers who are
familiar with the computer self-efficacy and online recommendation systems. All items were
assessed on a 7 point scale ranging from Strongly Disagree (1) to Strongly Agree (7).
See Appendix B for the final study.
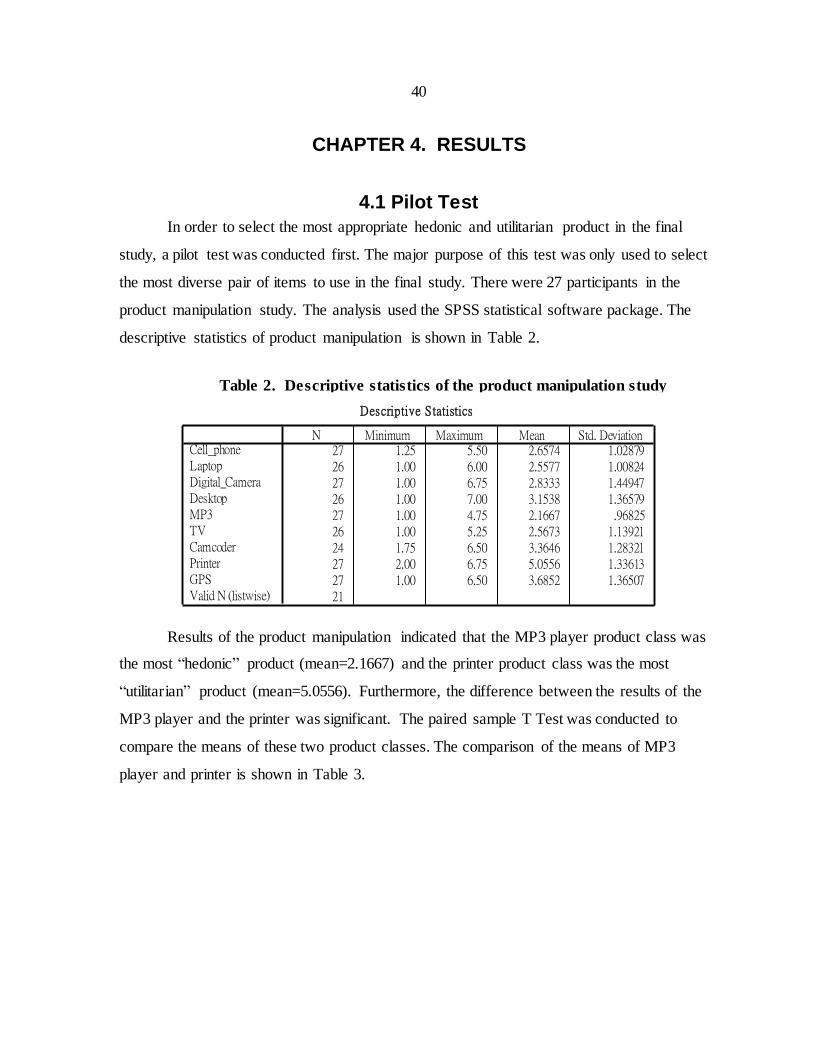
40
CHAPTER 4. RESULTS
4.1 Pilot Test
In order to select the most appropriate hedonic and utilitarian product in the final
study, a pilot test was conducted first. The major purpose of this test was only used to select
the most diverse pair of items to use in the final study. There were 27 participants in the
product manipulation study. The analysis used the SPSS statistical software package. The
descriptive statistics of product manipulation is shown in Table 2.
Table 2. Descriptive statistics of the product manipulation study
Results of the product manipulation indicated that the MP3 player product class was
the most “hedonic” product (mean=2.1667) and the printer product class was the most
“utilitarian” product (mean=5.0556). Furthermore, the difference between the results of the
MP3 player and the printer was significant. The paired sample T Test was conducted to
compare the means of these two product classes. The comparison of the means of MP3
player and printer is shown in Table 3.
Descriptive Statistics
27 1.25 5.50 2.6574 1.0287926 1.00 6.00 2.5577 1.0082427 1.00 6.75 2.8333 1.4494726 1.00 7.00 3.1538 1.3657927 1.00 4.75 2.1667 .9682526 1.00 5.25 2.5673 1.1392124 1.75 6.50 3.3646 1.2832127 2.00 6.75 5.0556 1.3361327 1.00 6.50 3.6852 1.3650721
Cell_phoneLaptopDigital_CameraDesktopMP3TVCamcoderPrinterGPSValid N (listwise)
N Minimum Maximum Mean Std. Deviation
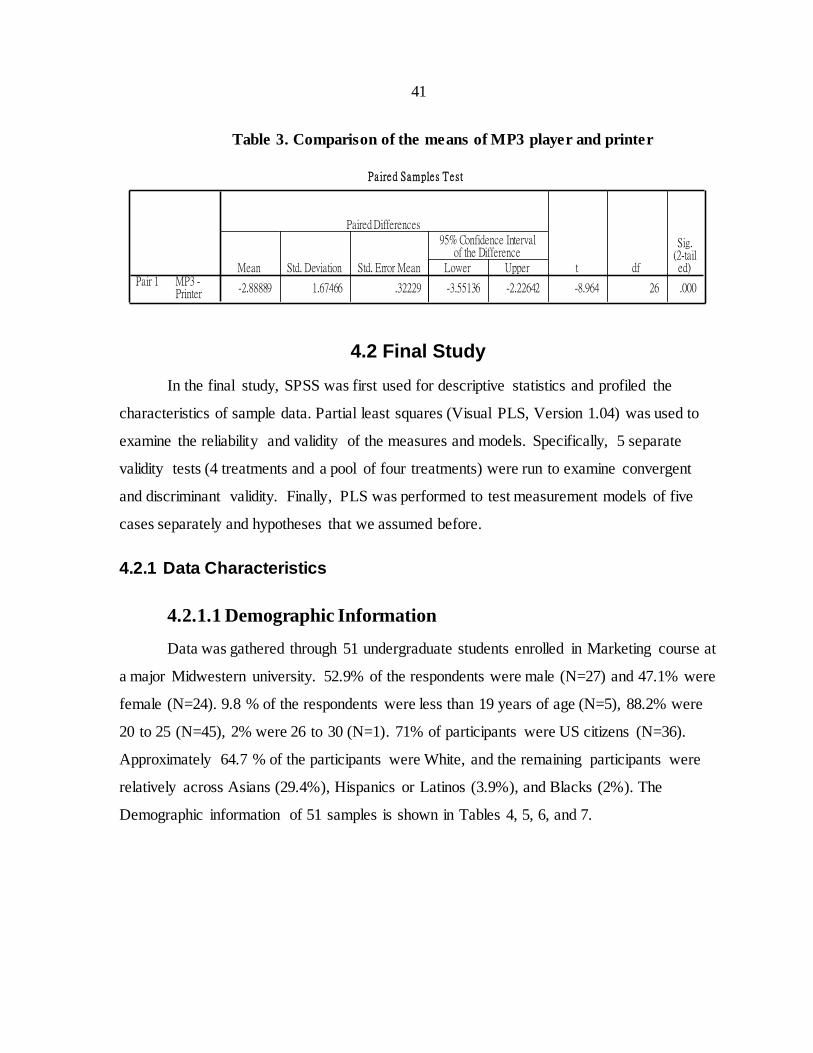
41
Table 3. Comparison of the means of MP3 player and printer
4.2 Final Study
In the final study, SPSS was first used for descriptive statistics and profiled the
characteristics of sample data. Partial least squares (Visual PLS, Version 1.04) was used to
examine the reliability and validity of the measures and models. Specifically, 5 separate
validity tests (4 treatments and a pool of four treatments) were run to examine convergent
and discriminant validity. Finally, PLS was performed to test measurement models of five
cases separately and hypotheses that we assumed before.
4.2.1 Data Characteristics
4.2.1.1 Demographic Information
Data was gathered through 51 undergraduate students enrolled in Marketing course at
a major Midwestern university. 52.9% of the respondents were male (N=27) and 47.1% were
female (N=24). 9.8 % of the respondents were less than 19 years of age (N=5), 88.2% were
20 to 25 (N=45), 2% were 26 to 30 (N=1). 71% of participants were US citizens (N=36).
Approximately 64.7 % of the participants were White, and the remaining participants were
relatively across Asians (29.4%), Hispanics or Latinos (3.9%), and Blacks (2%). The
Demographic information of 51 samples is shown in Tables 4, 5, 6, and 7.
Pa ired Sample s Test
-2.88889 1.67466 .32229 -3.55136 -2.22642 -8.964 26 .000MP3 -Printer
Pair 1Mean Std. Deviation Std. Error Mean Lower Upper
95% Confidence Intervalof the Difference
Paired Differences
t df
Sig.(2-tailed)
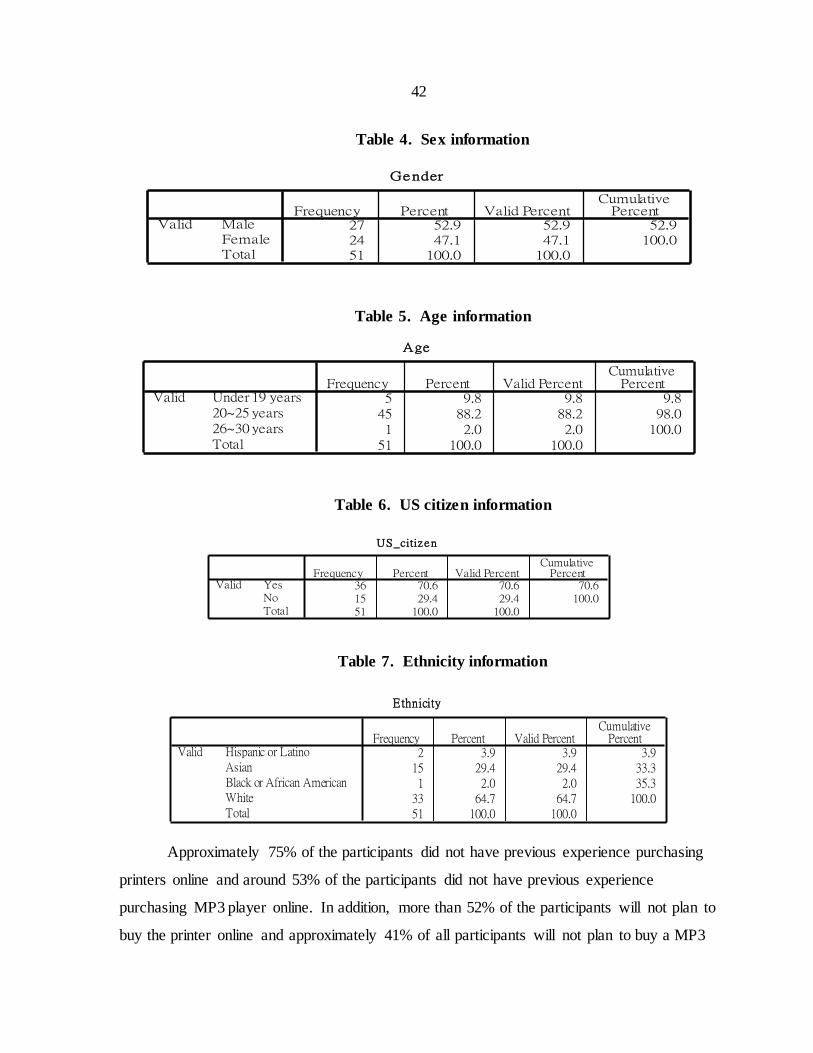
42
Table 4. Sex information
Table 5. Age information
Table 6. US citizen information
Table 7. Ethnicity information
Approximately 75% of the participants did not have previous experience purchasing
printers online and around 53% of the participants did not have previous experience
purchasing MP3 player online. In addition, more than 52% of the participants will not plan to
buy the printer online and approximately 41% of all participants will not plan to buy a MP3
Gender
27 52.9 52.9 52.924 47.1 47.1 100.051 100.0 100.0
MaleFemaleTotal
ValidFrequency Percent Valid Percent
CumulativePercent
Age
5 9.8 9.8 9.845 88.2 88.2 98.01 2.0 2.0 100.0
51 100.0 100.0
Under 19 years20~25 years26~30 yearsTotal
ValidFrequency Percent Valid Percent
CumulativePercent
US_citiz en
36 70.6 70.6 70.615 29.4 29.4 100.051 100.0 100.0
YesNoTotal
ValidFrequency Percent Valid Percent
CumulativePercent
Ethnicity
2 3.9 3.9 3.915 29.4 29.4 33.31 2.0 2.0 35.3
33 64.7 64.7 100.051 100.0 100.0
Hispanic or LatinoAsianBlack or African AmericanWhiteTotal
ValidFrequency Percent Valid Percent
CumulativePercent
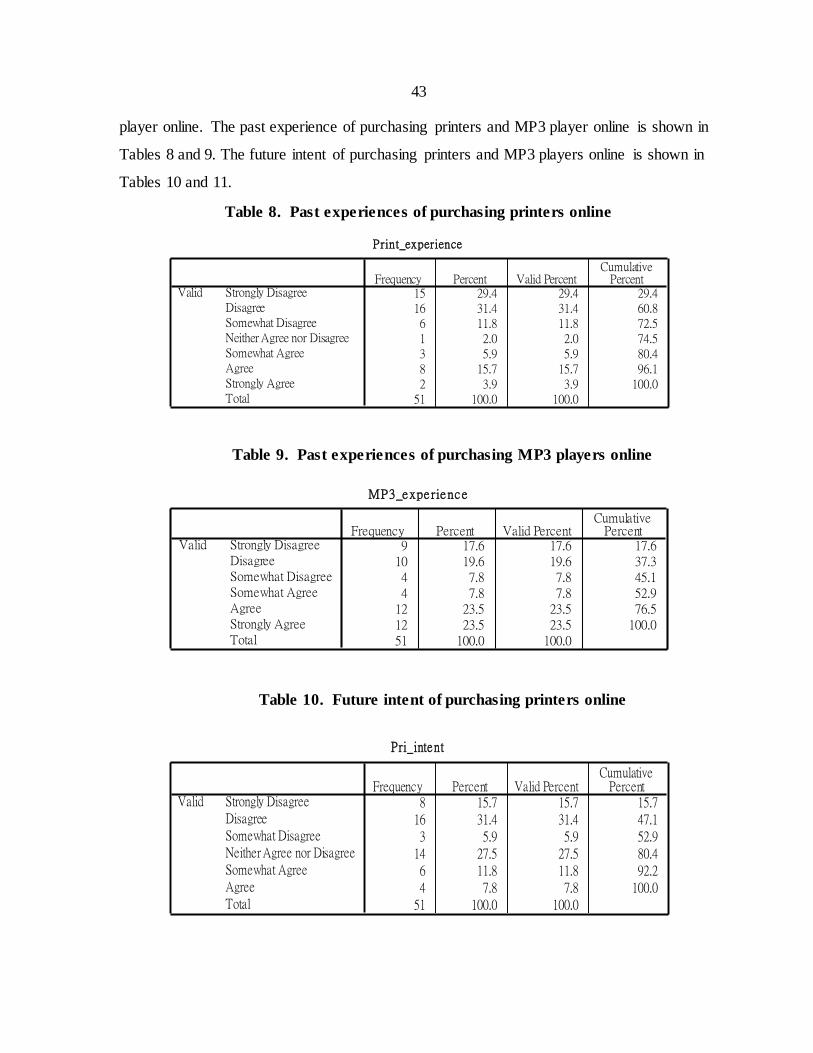
43
player online. The past experience of purchasing printers and MP3 player online is shown in
Tables 8 and 9. The future intent of purchasing printers and MP3 players online is shown in
Tables 10 and 11.
Table 8. Past experiences of purchasing printers online
Table 9. Past experiences of purchasing MP3 players online
Table 10. Future intent of purchasing printers online
Print_experience
15 29.4 29.4 29.416 31.4 31.4 60.86 11.8 11.8 72.51 2.0 2.0 74.53 5.9 5.9 80.48 15.7 15.7 96.12 3.9 3.9 100.0
51 100.0 100.0
Strongly DisagreeDisagreeSomewhat DisagreeNeither Agree nor DisagreeSomewhat AgreeAgreeStrongly AgreeTotal
ValidFrequency Percent Valid Percent
CumulativePercent
MP3_expe rience
9 17.6 17.6 17.610 19.6 19.6 37.34 7.8 7.8 45.14 7.8 7.8 52.9
12 23.5 23.5 76.512 23.5 23.5 100.051 100.0 100.0
Strongly DisagreeDisagreeSomewhat DisagreeSomewhat AgreeAgreeStrongly AgreeTotal
ValidFrequency Percent Valid Percent
CumulativePercent
Pri_intent
8 15.7 15.7 15.716 31.4 31.4 47.13 5.9 5.9 52.9
14 27.5 27.5 80.46 11.8 11.8 92.24 7.8 7.8 100.0
51 100.0 100.0
Strongly DisagreeDisagreeSomewhat DisagreeNeither Agree nor DisagreeSomewhat AgreeAgreeTotal
ValidFrequency Percent Valid Percent
CumulativePercent
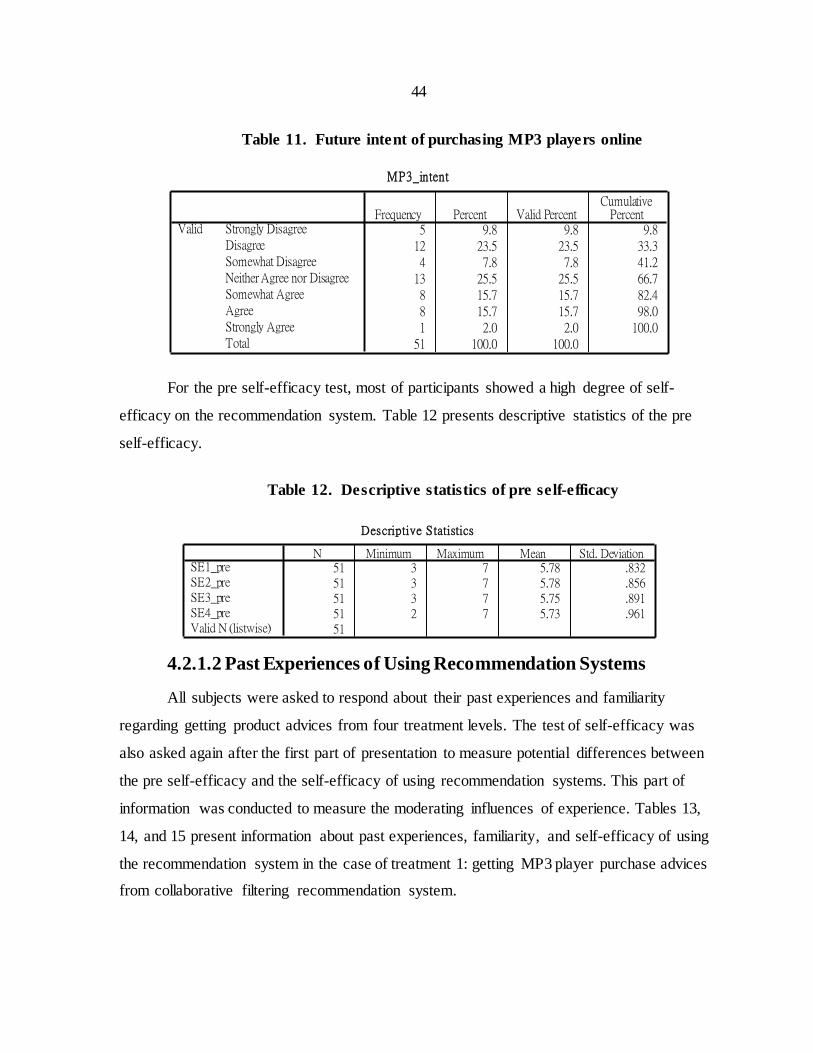
44
Table 11. Future intent of purchasing MP3 players online
For the pre self-efficacy test, most of participants showed a high degree of self-
efficacy on the recommendation system. Table 12 presents descriptive statistics of the pre
self-efficacy.
Table 12. Descriptive statistics of pre self-efficacy
4.2.1.2 Past Experiences of Using Recommendation Systems
All subjects were asked to respond about their past experiences and familiarity
regarding getting product advices from four treatment levels. The test of self-efficacy was
also asked again after the first part of presentation to measure potential differences between
the pre self-efficacy and the self-efficacy of using recommendation systems. This part of
information was conducted to measure the moderating influences of experience. Tables 13,
14, and 15 present information about past experiences, familiarity, and self-efficacy of using
the recommendation system in the case of treatment 1: getting MP3 player purchase advices
from collaborative filtering recommendation system.
MP3_intent
5 9.8 9.8 9.812 23.5 23.5 33.34 7.8 7.8 41.2
13 25.5 25.5 66.78 15.7 15.7 82.48 15.7 15.7 98.01 2.0 2.0 100.0
51 100.0 100.0
Strongly DisagreeDisagreeSomewhat DisagreeNeither Agree nor DisagreeSomewhat AgreeAgreeStrongly AgreeTotal
ValidFrequency Percent Valid Percent
CumulativePercent
Descriptive Statistics
51 3 7 5.78 .83251 3 7 5.78 .85651 3 7 5.75 .89151 2 7 5.73 .96151
SE1_preSE2_preSE3_preSE4_preValid N (listwise)
N Minimum Maximum Mean Std. Deviation
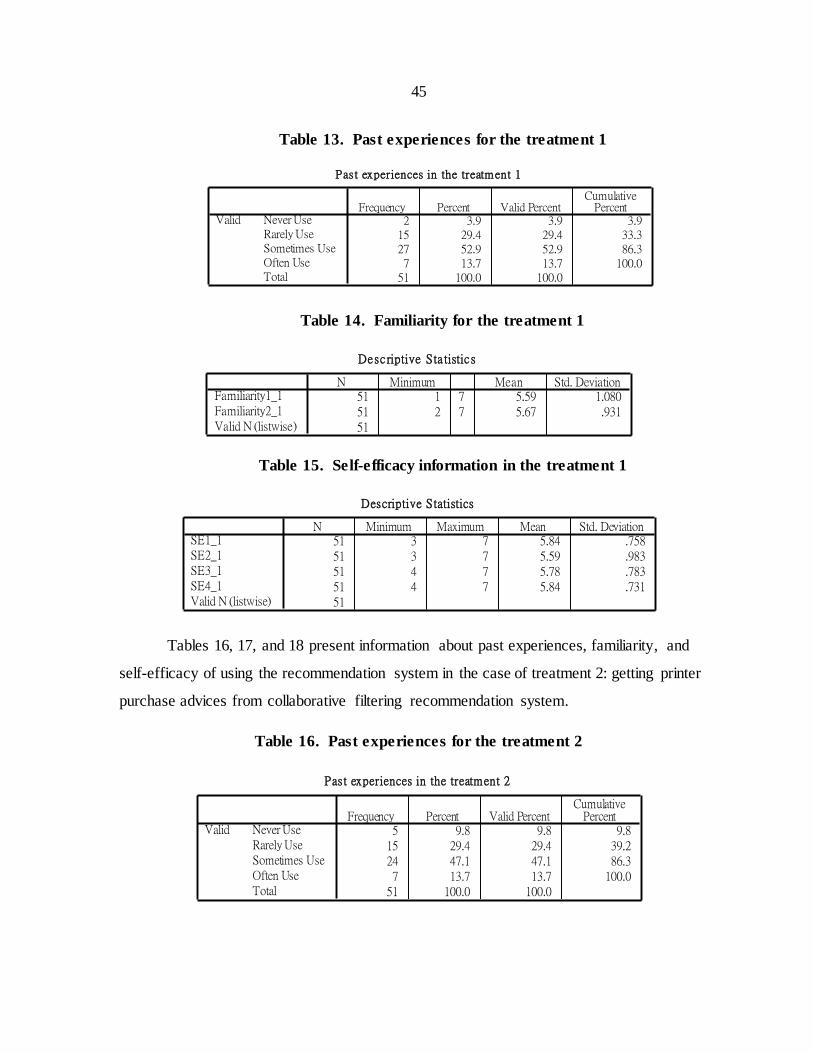
45
Table 13. Past experiences for the treatment 1
Table 14. Familiarity for the treatment 1
Table 15. Self-efficacy information in the treatment 1
Tables 16, 17, and 18 present information about past experiences, familiarity, and
self-efficacy of using the recommendation system in the case of treatment 2: getting printer
purchase advices from collaborative filtering recommendation system.
Table 16. Past experiences for the treatment 2
Past experiences in the treatment 1
2 3.9 3.9 3.915 29.4 29.4 33.327 52.9 52.9 86.37 13.7 13.7 100.0
51 100.0 100.0
Never UseRarely UseSometimes UseOften UseTotal
ValidFrequency Percent Valid Percent
CumulativePercent
Desc riptive Sta tistic s
51 1 7 5.59 1.08051 2 7 5.67 .93151
Familiarity1_1Familiarity2_1Valid N (listwise)
N Minimum Mean Std. Deviation
Descriptive Statistics
51 3 7 5.84 .75851 3 7 5.59 .98351 4 7 5.78 .78351 4 7 5.84 .73151
SE1_1SE2_1SE3_1SE4_1Valid N (listwise)
N Minimum Maximum Mean Std. Deviation
Desc riptive Sta tis tic s
51 2 7 5.55 1.15451 2 7 5.59 .94251
Familiarity1_2Familiarity2_2Valid N (listwise)
N Minimum Maximum Mean Std. Deviation
Past experiences in the treatment 2
5 9.8 9.8 9.815 29.4 29.4 39.224 47.1 47.1 86.37 13.7 13.7 100.0
51 100.0 100.0
Never UseRarely UseSometimes UseOften UseTotal
ValidFrequency Percent Valid Percent
CumulativePercent
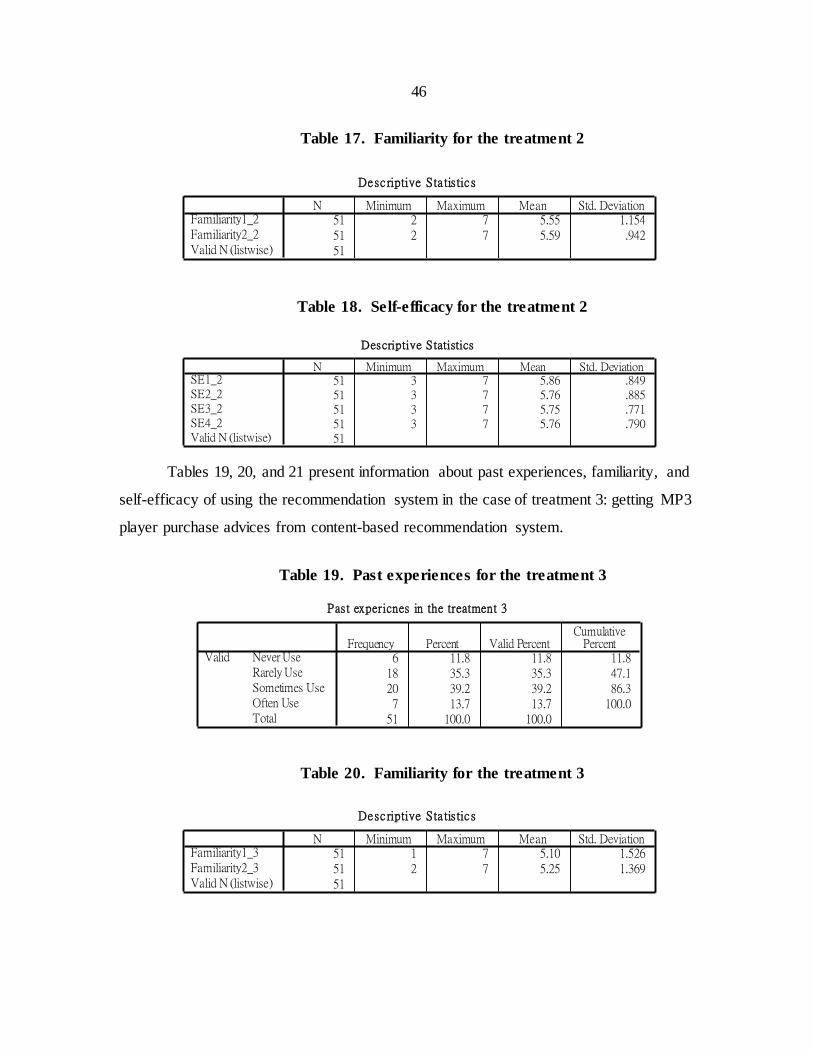
46
Table 17. Familiarity for the treatment 2
Table 18. Self-efficacy for the treatment 2
Tables 19, 20, and 21 present information about past experiences, familiarity, and
self-efficacy of using the recommendation system in the case of treatment 3: getting MP3
player purchase advices from content-based recommendation system.
Table 19. Past experiences for the treatment 3
Table 20. Familiarity for the treatment 3
Descriptive Statistics
51 3 7 5.86 .84951 3 7 5.76 .88551 3 7 5.75 .77151 3 7 5.76 .79051
SE1_2SE2_2SE3_2SE4_2Valid N (listwise)
N Minimum Maximum Mean Std. Deviation
Desc riptive Sta tis tic s
51 2 7 5.55 1.15451 2 7 5.59 .94251
Familiarity1_2Familiarity2_2Valid N (listwise)
N Minimum Maximum Mean Std. Deviation
Past expericnes in the treatment 3
6 11.8 11.8 11.818 35.3 35.3 47.120 39.2 39.2 86.37 13.7 13.7 100.0
51 100.0 100.0
Never UseRarely UseSometimes UseOften UseTotal
ValidFrequency Percent Valid Percent
CumulativePercent
Desc riptive Sta tis tic s
51 1 7 5.10 1.52651 2 7 5.25 1.36951
Familiarity1_3Familiarity2_3Valid N (listwise)
N Minimum Maximum Mean Std. Deviation
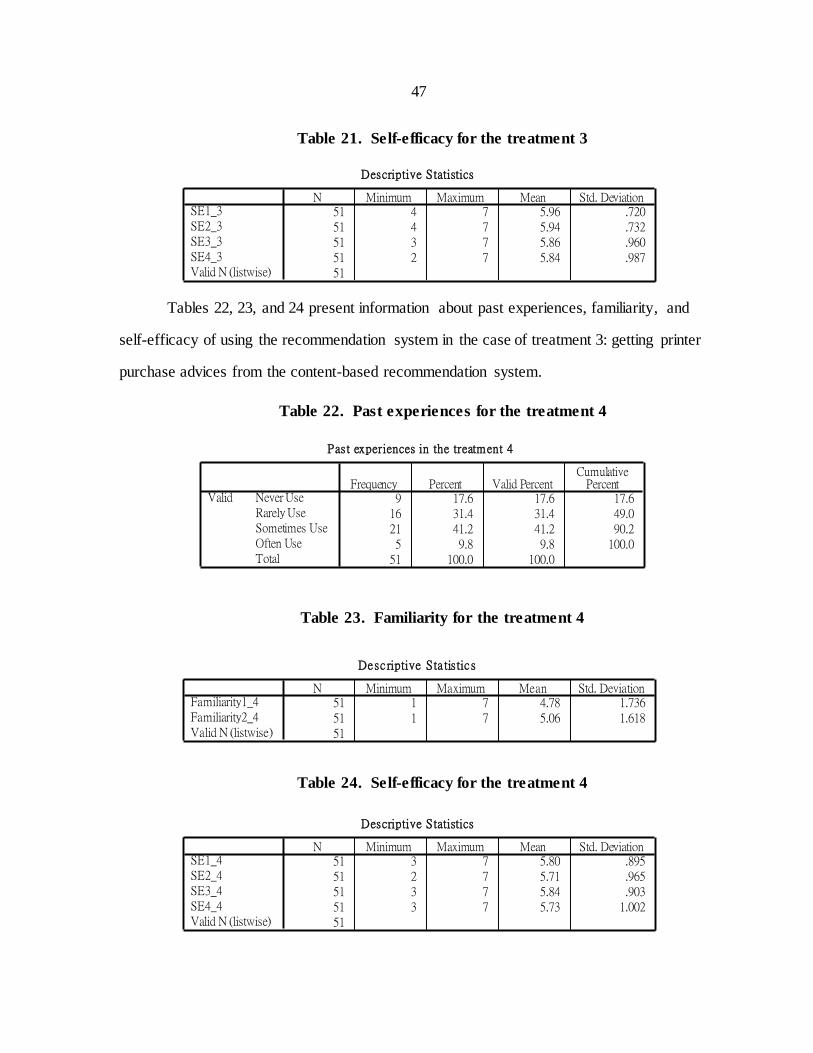
47
Table 21. Self-efficacy for the treatment 3
Tables 22, 23, and 24 present information about past experiences, familiarity, and
self-efficacy of using the recommendation system in the case of treatment 3: getting printer
purchase advices from the content-based recommendation system.
Table 22. Past experiences for the treatment 4
Table 23. Familiarity for the treatment 4
Table 24. Self-efficacy for the treatment 4
Descriptive Statistics
51 4 7 5.96 .72051 4 7 5.94 .73251 3 7 5.86 .96051 2 7 5.84 .98751
SE1_3SE2_3SE3_3SE4_3Valid N (listwise)
N Minimum Maximum Mean Std. Deviation
Past experiences in the treatment 4
9 17.6 17.6 17.616 31.4 31.4 49.021 41.2 41.2 90.25 9.8 9.8 100.0
51 100.0 100.0
Never UseRarely UseSometimes UseOften UseTotal
ValidFrequency Percent Valid Percent
CumulativePercent
Desc riptive Sta tis tic s
51 1 7 4.78 1.73651 1 7 5.06 1.61851
Familiarity1_4Familiarity2_4Valid N (listwise)
N Minimum Maximum Mean Std. Deviation
Descriptive Statistics
51 3 7 5.80 .89551 2 7 5.71 .96551 3 7 5.84 .90351 3 7 5.73 1.00251
SE1_4SE2_4SE3_4SE4_4Valid N (listwise)
N Minimum Maximum Mean Std. Deviation
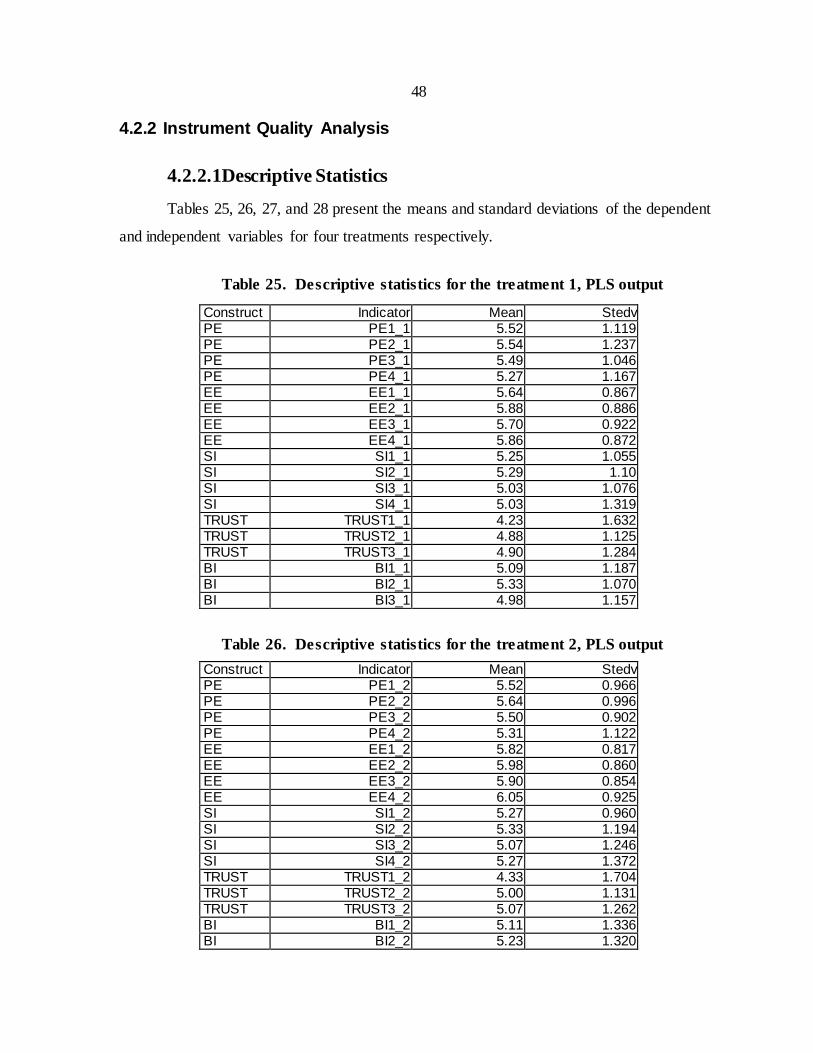
48
4.2.2 Instrument Quality Analysis
4.2.2.1Descriptive Statistics
Tables 25, 26, 27, and 28 present the means and standard deviations of the dependent
and independent variables for four treatments respectively.
Table 25. Descriptive statistics for the treatment 1, PLS output
Construct Indicator Mean Stedv PE PE1_1 5.52 1.119 PE PE2_1 5.54 1.237 PE PE3_1 5.49 1.046 PE PE4_1 5.27 1.167 EE EE1_1 5.64 0.867 EE EE2_1 5.88 0.886 EE EE3_1 5.70 0.922 EE EE4_1 5.86 0.872 SI SI1_1 5.25 1.055 SI SI2_1 5.29 1.10 SI SI3_1 5.03 1.076 SI SI4_1 5.03 1.319 TRUST TRUST1_1 4.23 1.632 TRUST TRUST2_1 4.88 1.125 TRUST TRUST3_1 4.90 1.284 BI BI1_1 5.09 1.187 BI BI2_1 5.33 1.070 BI BI3_1 4.98 1.157
Table 26. Descriptive statistics for the treatment 2, PLS output
Construct Indicator Mean Stedv PE PE1_2 5.52 0.966 PE PE2_2 5.64 0.996 PE PE3_2 5.50 0.902 PE PE4_2 5.31 1.122 EE EE1_2 5.82 0.817 EE EE2_2 5.98 0.860 EE EE3_2 5.90 0.854 EE EE4_2 6.05 0.925 SI SI1_2 5.27 0.960 SI SI2_2 5.33 1.194 SI SI3_2 5.07 1.246 SI SI4_2 5.27 1.372 TRUST TRUST1_2 4.33 1.704 TRUST TRUST2_2 5.00 1.131 TRUST TRUST3_2 5.07 1.262 BI BI1_2 5.11 1.336 BI BI2_2 5.23 1.320
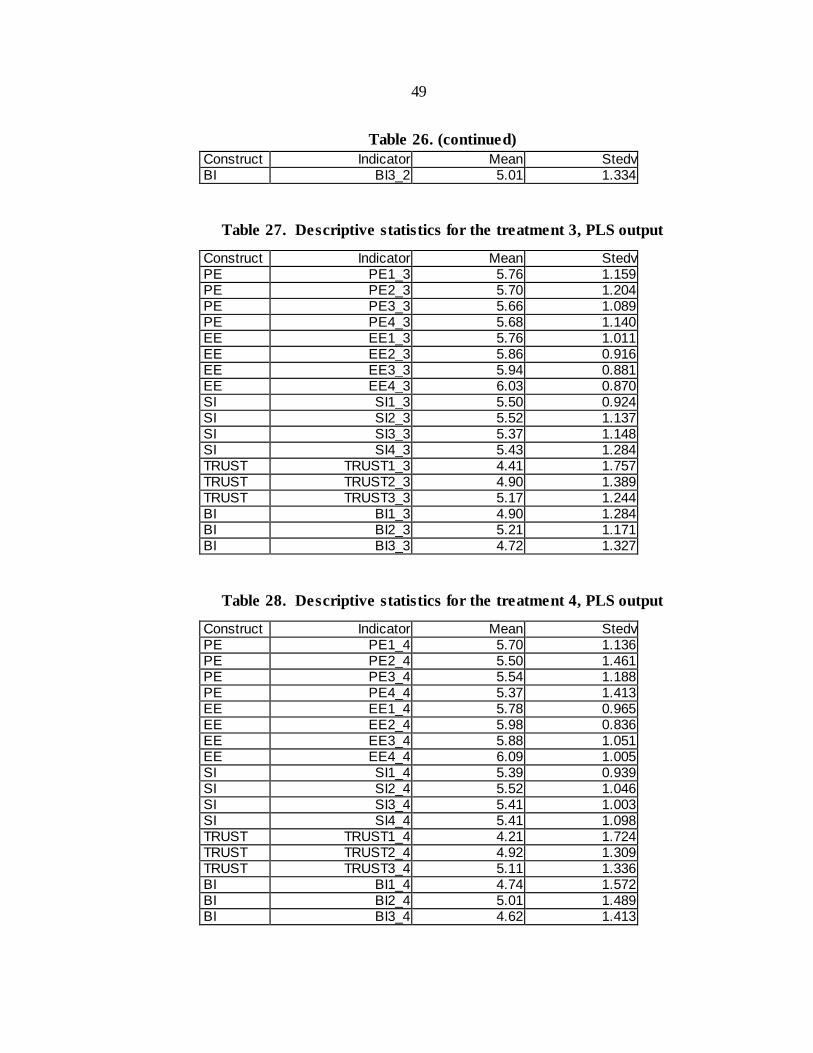
49
Table 26. (continued)
Construct Indicator Mean Stedv BI BI3_2 5.01 1.334
Table 27. Descriptive statistics for the treatment 3, PLS output
Construct Indicator Mean Stedv PE PE1_3 5.76 1.159 PE PE2_3 5.70 1.204 PE PE3_3 5.66 1.089 PE PE4_3 5.68 1.140 EE EE1_3 5.76 1.011 EE EE2_3 5.86 0.916 EE EE3_3 5.94 0.881 EE EE4_3 6.03 0.870 SI SI1_3 5.50 0.924 SI SI2_3 5.52 1.137 SI SI3_3 5.37 1.148 SI SI4_3 5.43 1.284 TRUST TRUST1_3 4.41 1.757 TRUST TRUST2_3 4.90 1.389 TRUST TRUST3_3 5.17 1.244 BI BI1_3 4.90 1.284 BI BI2_3 5.21 1.171 BI BI3_3 4.72 1.327
Table 28. Descriptive statistics for the treatment 4, PLS output
Construct Indicator Mean Stedv PE PE1_4 5.70 1.136 PE PE2_4 5.50 1.461 PE PE3_4 5.54 1.188 PE PE4_4 5.37 1.413 EE EE1_4 5.78 0.965 EE EE2_4 5.98 0.836 EE EE3_4 5.88 1.051 EE EE4_4 6.09 1.005 SI SI1_4 5.39 0.939 SI SI2_4 5.52 1.046 SI SI3_4 5.41 1.003 SI SI4_4 5.41 1.098 TRUST TRUST1_4 4.21 1.724 TRUST TRUST2_4 4.92 1.309 TRUST TRUST3_4 5.11 1.336 BI BI1_4 4.74 1.572 BI BI2_4 5.01 1.489 BI BI3_4 4.62 1.413
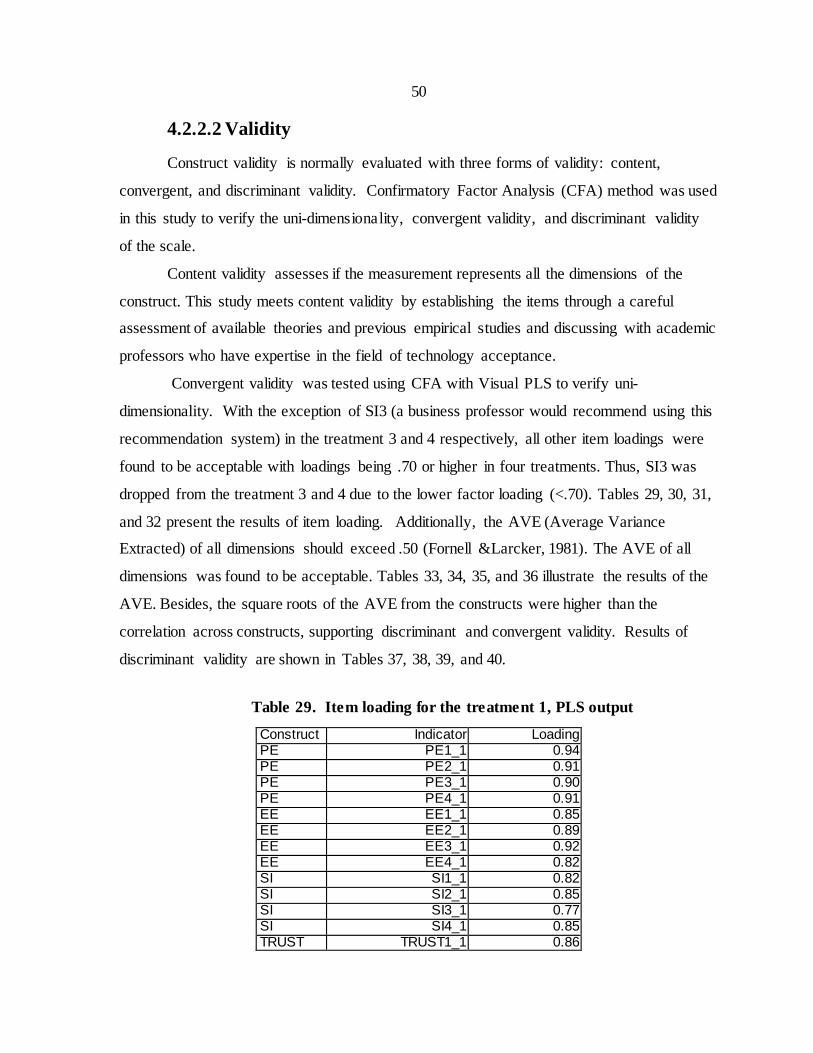
50
4.2.2.2 Validity
Construct validity is normally evaluated with three forms of validity: content,
convergent, and discriminant validity. Confirmatory Factor Analysis (CFA) method was used
in this study to verify the uni-dimensionality, convergent validity, and discriminant validity
of the scale.
Content validity assesses if the measurement represents all the dimensions of the
construct. This study meets content validity by establishing the items through a careful
assessment of available theories and previous empirical studies and discussing with academic
professors who have expertise in the field of technology acceptance.
Convergent validity was tested using CFA with Visual PLS to verify uni-
dimensionality. With the exception of SI3 (a business professor would recommend using this
recommendation system) in the treatment 3 and 4 respectively, all other item loadings were
found to be acceptable with loadings being .70 or higher in four treatments. Thus, SI3 was
dropped from the treatment 3 and 4 due to the lower factor loading (<.70). Tables 29, 30, 31,
and 32 present the results of item loading. Additionally, the AVE (Average Variance
Extracted) of all dimensions should exceed .50 (Fornell &Larcker, 1981). The AVE of all
dimensions was found to be acceptable. Tables 33, 34, 35, and 36 illustrate the results of the
AVE. Besides, the square roots of the AVE from the constructs were higher than the
correlation across constructs, supporting discriminant and convergent validity. Results of
discriminant validity are shown in Tables 37, 38, 39, and 40.
Table 29. Item loading for the treatment 1, PLS output
Construct Indicator Loading PE PE1_1 0.94 PE PE2_1 0.91 PE PE3_1 0.90 PE PE4_1 0.91 EE EE1_1 0.85 EE EE2_1 0.89 EE EE3_1 0.92 EE EE4_1 0.82 SI SI1_1 0.82 SI SI2_1 0.85 SI SI3_1 0.77 SI SI4_1 0.85 TRUST TRUST1_1 0.86
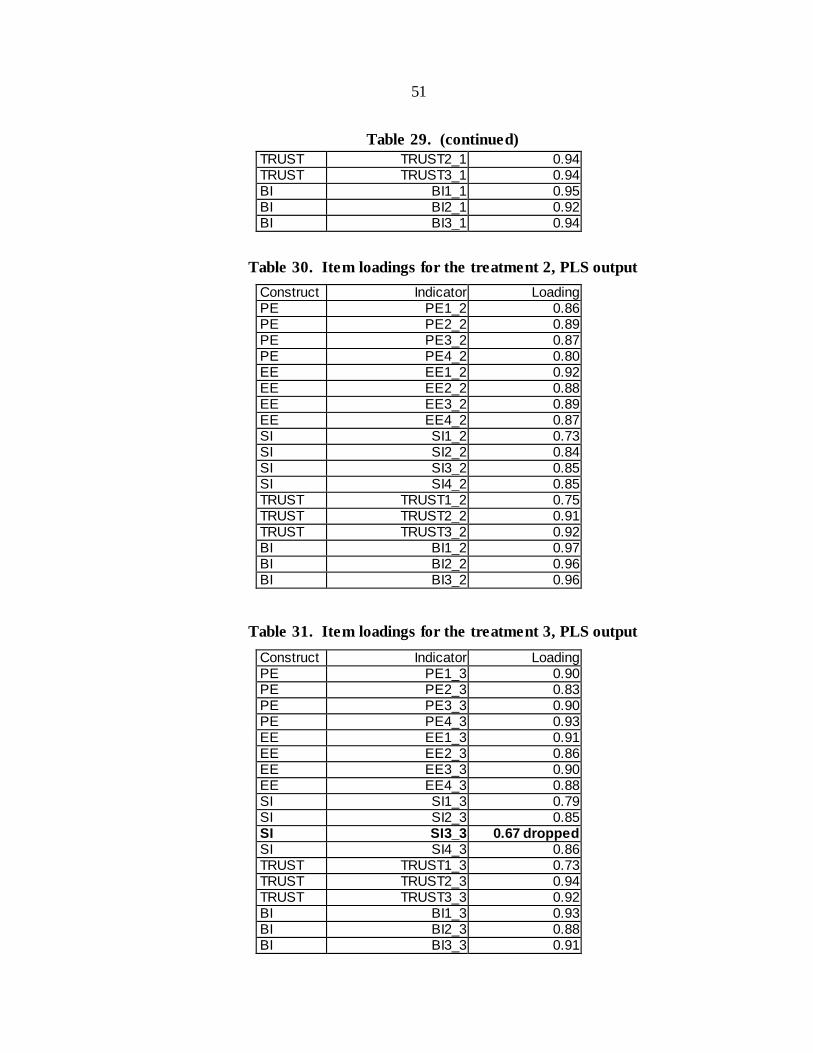
51
Table 29. (continued)
TRUST TRUST2_1 0.94 TRUST TRUST3_1 0.94 BI BI1_1 0.95 BI BI2_1 0.92 BI BI3_1 0.94
Table 30. Item loadings for the treatment 2, PLS output
Construct Indicator Loading PE PE1_2 0.86 PE PE2_2 0.89 PE PE3_2 0.87 PE PE4_2 0.80 EE EE1_2 0.92 EE EE2_2 0.88 EE EE3_2 0.89 EE EE4_2 0.87 SI SI1_2 0.73 SI SI2_2 0.84 SI SI3_2 0.85 SI SI4_2 0.85 TRUST TRUST1_2 0.75 TRUST TRUST2_2 0.91 TRUST TRUST3_2 0.92 BI BI1_2 0.97 BI BI2_2 0.96 BI BI3_2 0.96
Table 31. Item loadings for the treatment 3, PLS output
Construct Indicator Loading PE PE1_3 0.90 PE PE2_3 0.83 PE PE3_3 0.90 PE PE4_3 0.93 EE EE1_3 0.91 EE EE2_3 0.86 EE EE3_3 0.90 EE EE4_3 0.88 SI SI1_3 0.79 SI SI2_3 0.85 SI SI3_3 0.67 dropped SI SI4_3 0.86 TRUST TRUST1_3 0.73 TRUST TRUST2_3 0.94 TRUST TRUST3_3 0.92 BI BI1_3 0.93 BI BI2_3 0.88 BI BI3_3 0.91
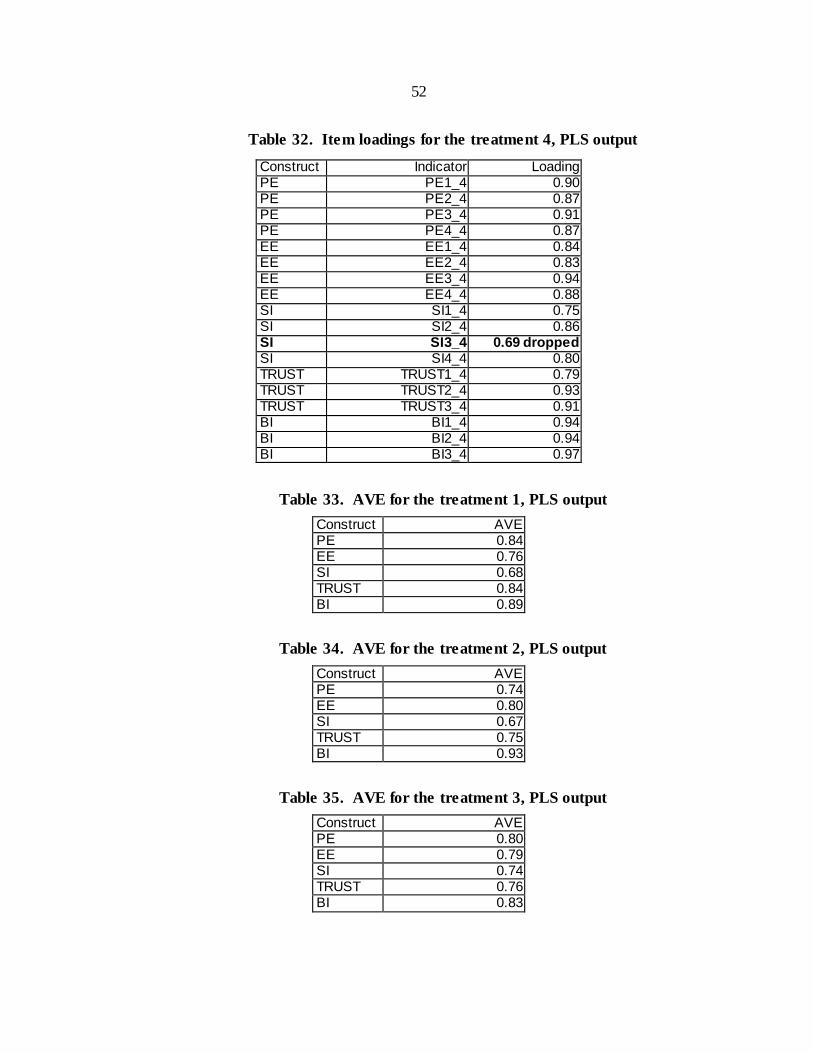
52
Table 32. Item loadings for the treatment 4, PLS output
Construct Indicator Loading PE PE1_4 0.90 PE PE2_4 0.87 PE PE3_4 0.91 PE PE4_4 0.87 EE EE1_4 0.84 EE EE2_4 0.83 EE EE3_4 0.94 EE EE4_4 0.88 SI SI1_4 0.75 SI SI2_4 0.86 SI SI3_4 0.69 dropped SI SI4_4 0.80 TRUST TRUST1_4 0.79 TRUST TRUST2_4 0.93 TRUST TRUST3_4 0.91 BI BI1_4 0.94 BI BI2_4 0.94 BI BI3_4 0.97
Table 33. AVE for the treatment 1, PLS output
Construct AVE PE 0.84 EE 0.76 SI 0.68 TRUST 0.84 BI 0.89
Table 34. AVE for the treatment 2, PLS output
Construct AVE PE 0.74 EE 0.80 SI 0.67 TRUST 0.75 BI 0.93
Table 35. AVE for the treatment 3, PLS output
Construct AVE PE 0.80 EE 0.79 SI 0.74 TRUST 0.76 BI 0.83
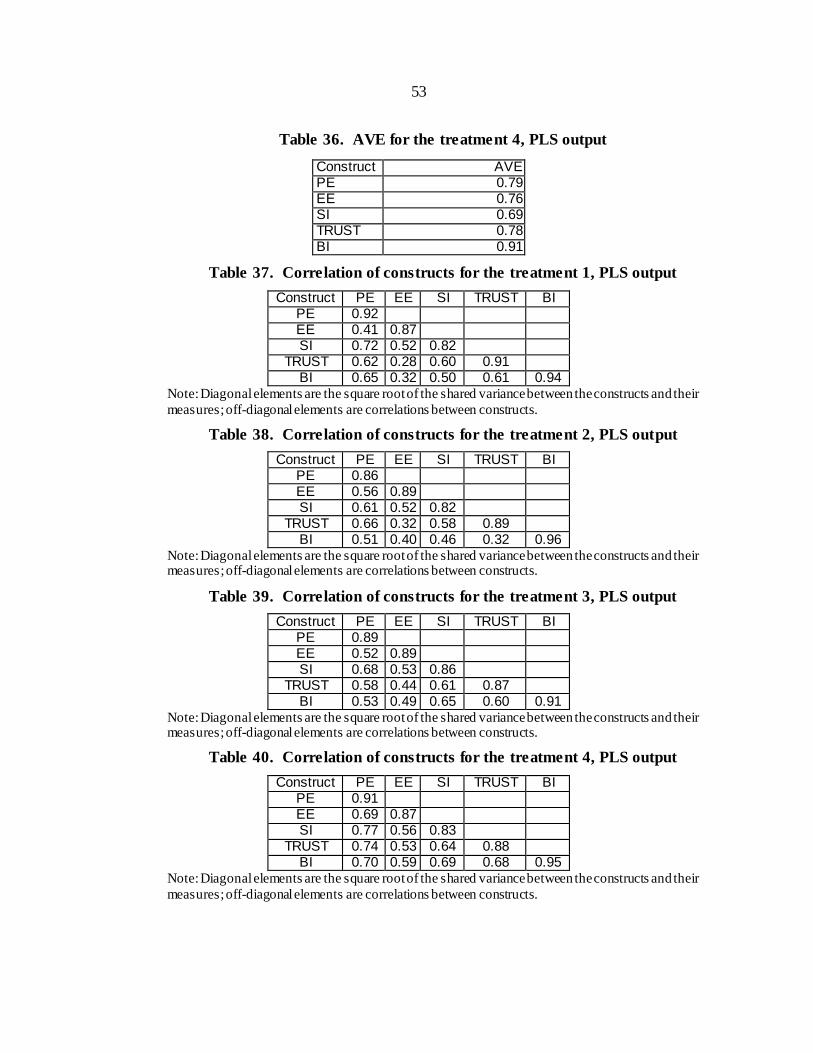
53
Table 36. AVE for the treatment 4, PLS output
Construct AVE PE 0.79 EE 0.76 SI 0.69 TRUST 0.78 BI 0.91
Table 37. Correlation of constructs for the treatment 1, PLS output
Construct PE EE SI TRUST BI PE 0.92 EE 0.41 0.87 SI 0.72 0.52 0.82
TRUST 0.62 0.28 0.60 0.91 BI 0.65 0.32 0.50 0.61 0.94
Note: Diagonal elements are the square root of the shared variance between the constructs and their
measures; off-diagonal elements are correlations between constructs.
Table 38. Correlation of constructs for the treatment 2, PLS output
Construct PE EE SI TRUST BI PE 0.86 EE 0.56 0.89 SI 0.61 0.52 0.82
TRUST 0.66 0.32 0.58 0.89 BI 0.51 0.40 0.46 0.32 0.96
Note: Diagonal elements are the square root of the shared variance between the constructs and their measures; off-diagonal elements are correlations between constructs.
Table 39. Correlation of constructs for the treatment 3, PLS output
Construct PE EE SI TRUST BI PE 0.89 EE 0.52 0.89 SI 0.68 0.53 0.86
TRUST 0.58 0.44 0.61 0.87 BI 0.53 0.49 0.65 0.60 0.91
Note: Diagonal elements are the square root of the shared variance between the constructs and their measures; off-diagonal elements are correlations between constructs.
Table 40. Correlation of constructs for the treatment 4, PLS output
Construct PE EE SI TRUST BI PE 0.91 EE 0.69 0.87 SI 0.77 0.56 0.83
TRUST 0.74 0.53 0.64 0.88 BI 0.70 0.59 0.69 0.68 0.95
Note: Diagonal elements are the square root of the shared variance between the constructs and their
measures; off-diagonal elements are correlations between constructs.
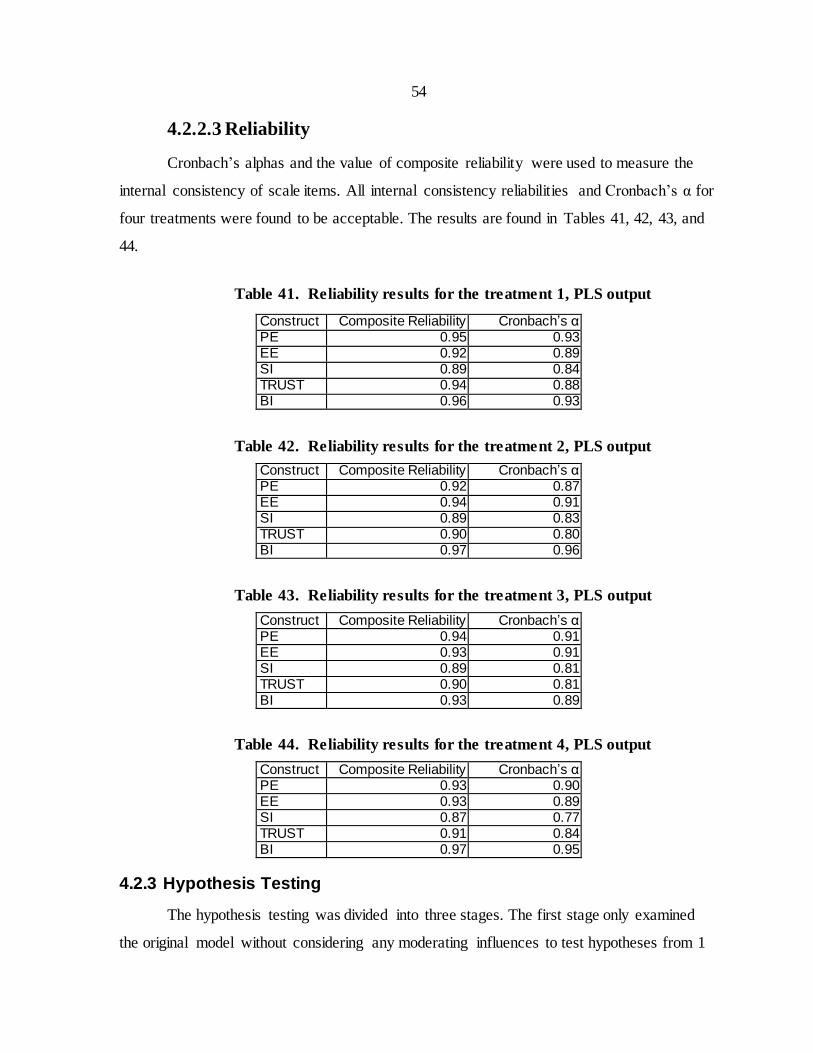
54
4.2.2.3 Reliability
Cronbach’s alphas and the value of composite reliability were used to measure the
internal consistency of scale items. All internal consistency reliabilities and Cronbach’s α for
four treatments were found to be acceptable. The results are found in Tables 41, 42, 43, and
44.
Table 41. Reliability results for the treatment 1, PLS output
Construct Composite Reliability Cronbach’s α PE 0.95 0.93 EE 0.92 0.89 SI 0.89 0.84 TRUST 0.94 0.88 BI 0.96 0.93
Table 42. Reliability results for the treatment 2, PLS output
Construct Composite Reliability Cronbach’s α PE 0.92 0.87 EE 0.94 0.91 SI 0.89 0.83 TRUST 0.90 0.80 BI 0.97 0.96
Table 43. Reliability results for the treatment 3, PLS output
Construct Composite Reliability Cronbach’s α PE 0.94 0.91 EE 0.93 0.91 SI 0.89 0.81 TRUST 0.90 0.81 BI 0.93 0.89
Table 44. Reliability results for the treatment 4, PLS output
Construct Composite Reliability Cronbach’s α PE 0.93 0.90 EE 0.93 0.89 SI 0.87 0.77 TRUST 0.91 0.84 BI 0.97 0.95
4.2.3 Hypothesis Testing
The hypothesis testing was divided into three stages. The first stage only examined
the original model without considering any moderating influences to test hypotheses from 1
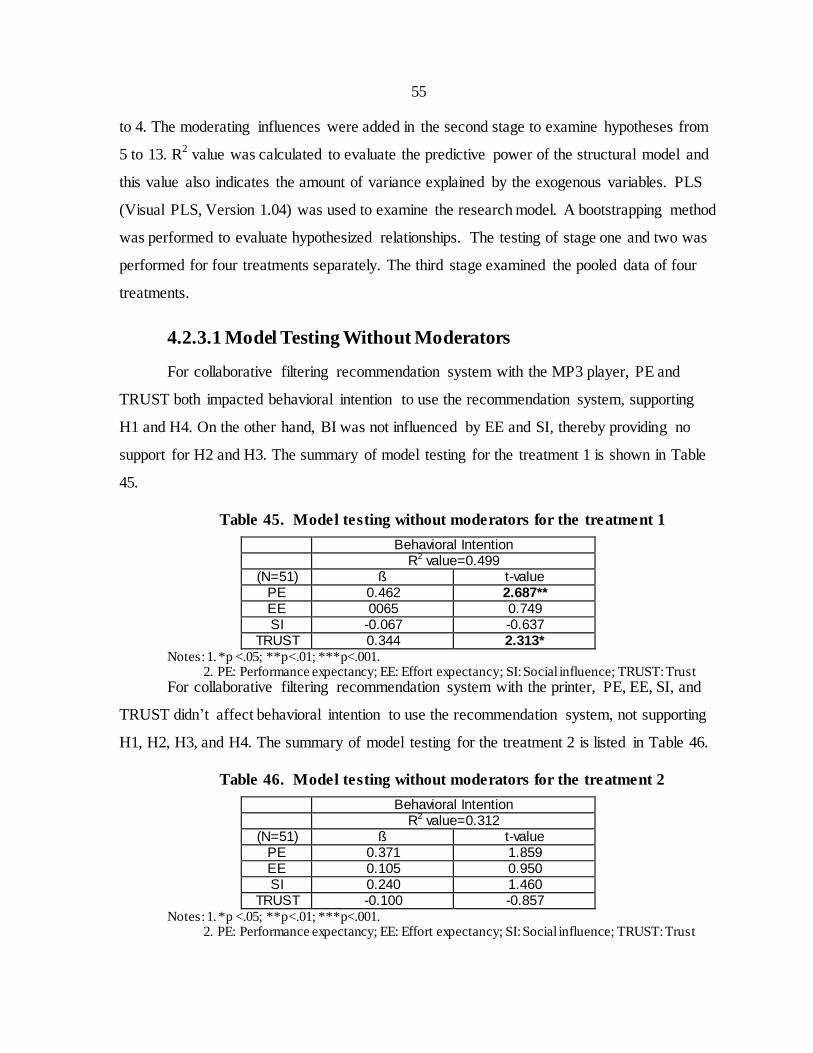
55
to 4. The moderating influences were added in the second stage to examine hypotheses from
5 to 13. R2 value was calculated to evaluate the predictive power of the structural model and
this value also indicates the amount of variance explained by the exogenous variables. PLS
(Visual PLS, Version 1.04) was used to examine the research model. A bootstrapping method
was performed to evaluate hypothesized relationships. The testing of stage one and two was
performed for four treatments separately. The third stage examined the pooled data of four
treatments.
4.2.3.1 Model Testing Without Moderators
For collaborative filtering recommendation system with the MP3 player, PE and
TRUST both impacted behavioral intention to use the recommendation system, supporting
H1 and H4. On the other hand, BI was not influenced by EE and SI, thereby providing no
support for H2 and H3. The summary of model testing for the treatment 1 is shown in Table
45.
Table 45. Model testing without moderators for the treatment 1
Behavioral Intention R2 value=0.499
(N=51) ß t-value PE 0.462 2.687** EE 0065 0.749 SI -0.067 -0.637
TRUST 0.344 2.313* Notes: 1. *p <.05; **p<.01; ***p<.001. 2. PE: Performance expectancy; EE: Effort expectancy; SI: Social influence; TRUST: Trust
For collaborative filtering recommendation system with the printer, PE, EE, SI, and
TRUST didn’t affect behavioral intention to use the recommendation system, not supporting
H1, H2, H3, and H4. The summary of model testing for the treatment 2 is listed in Table 46.
Table 46. Model testing without moderators for the treatment 2
Behavioral Intention R2 value=0.312
(N=51) ß t-value PE 0.371 1.859 EE 0.105 0.950 SI 0.240 1.460
TRUST -0.100 -0.857 Notes: 1. *p <.05; **p<.01; ***p<.001. 2. PE: Performance expectancy; EE: Effort expectancy; SI: Social influence; TRUST: Trust
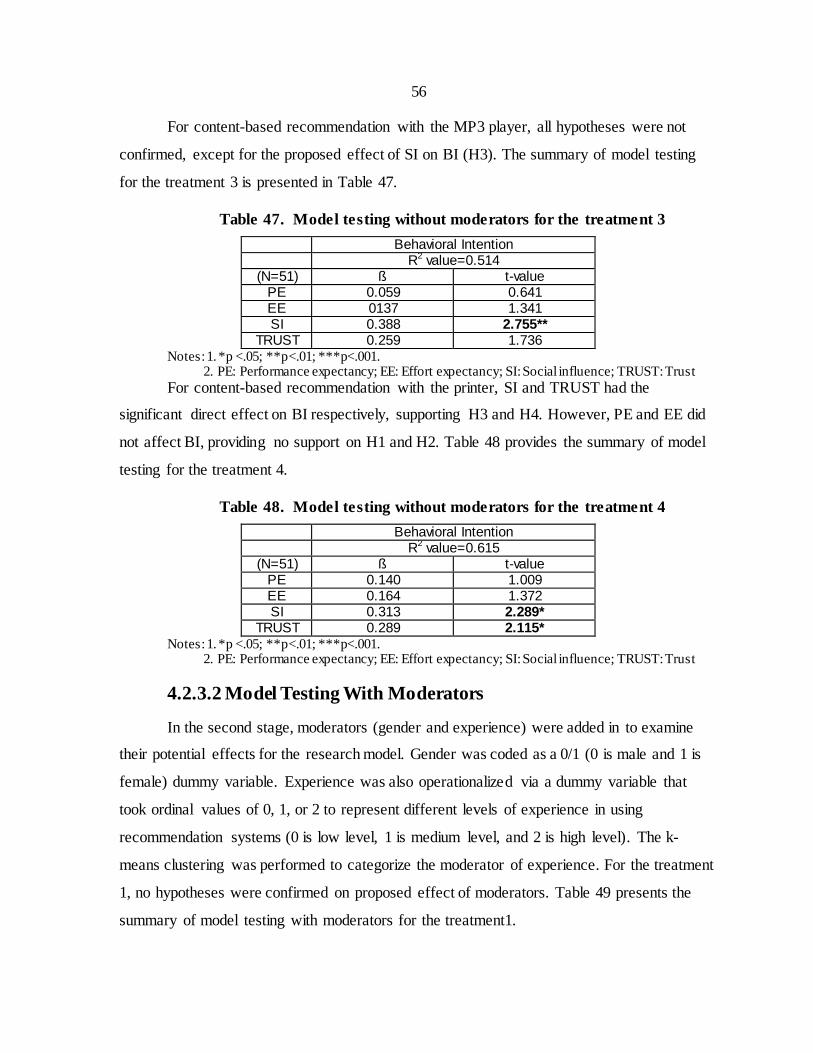
56
For content-based recommendation with the MP3 player, all hypotheses were not
confirmed, except for the proposed effect of SI on BI (H3). The summary of model testing
for the treatment 3 is presented in Table 47.
Table 47. Model testing without moderators for the treatment 3
Behavioral Intention R2 value=0.514
(N=51) ß t-value PE 0.059 0.641 EE 0137 1.341 SI 0.388 2.755**
TRUST 0.259 1.736 Notes: 1. *p <.05; **p<.01; ***p<.001. 2. PE: Performance expectancy; EE: Effort expectancy; SI: Social influence; TRUST: Trust
For content-based recommendation with the printer, SI and TRUST had the
significant direct effect on BI respectively, supporting H3 and H4. However, PE and EE did
not affect BI, providing no support on H1 and H2. Table 48 provides the summary of model
testing for the treatment 4.
Table 48. Model testing without moderators for the treatment 4
Behavioral Intention R2 value=0.615
(N=51) ß t-value PE 0.140 1.009 EE 0.164 1.372 SI 0.313 2.289*
TRUST 0.289 2.115* Notes: 1. *p <.05; **p<.01; ***p<.001. 2. PE: Performance expectancy; EE: Effort expectancy; SI: Social influence; TRUST: Trust
4.2.3.2 Model Testing With Moderators
In the second stage, moderators (gender and experience) were added in to examine
their potential effects for the research model. Gender was coded as a 0/1 (0 is male and 1 is
female) dummy variable. Experience was also operationalized via a dummy variable that
took ordinal values of 0, 1, or 2 to represent different levels of experience in using
recommendation systems (0 is low level, 1 is medium level, and 2 is high level). The k-
means clustering was performed to categorize the moderator of experience. For the treatment
1, no hypotheses were confirmed on proposed effect of moderators. Table 49 presents the
summary of model testing with moderators for the treatment1.
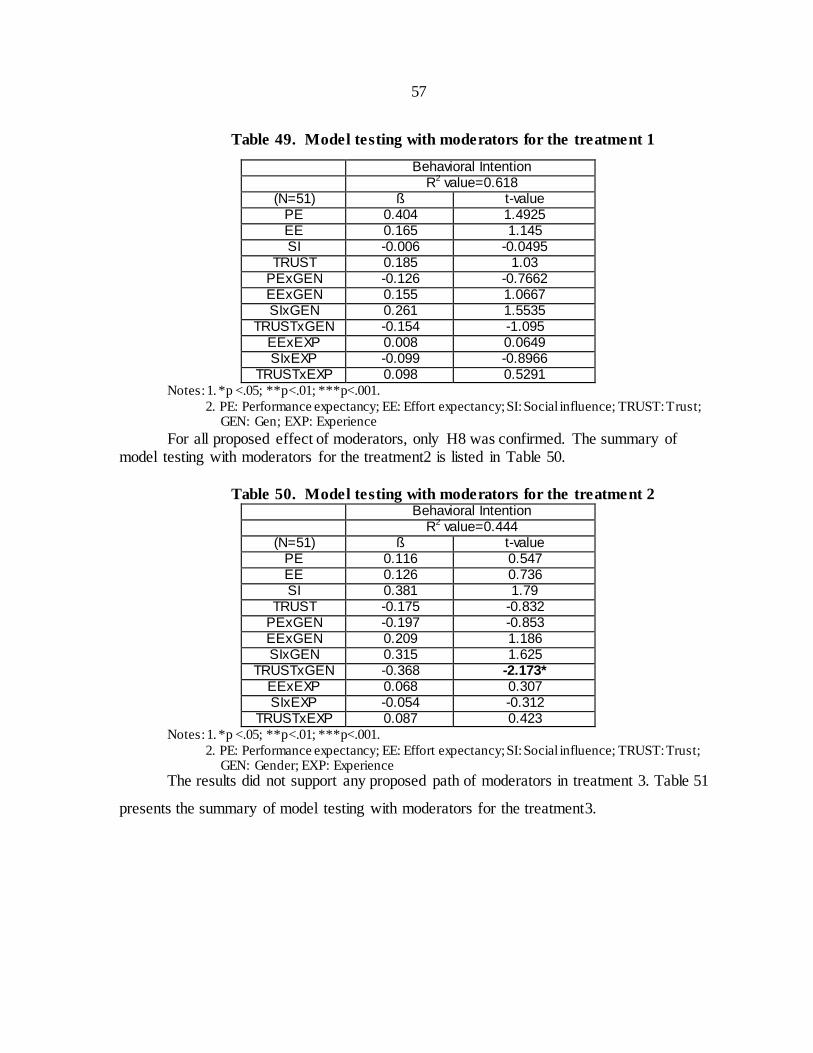
57
Table 49. Model testing with moderators for the treatment 1
Behavioral Intention R2 value=0.618
(N=51) ß t-value PE 0.404 1.4925 EE 0.165 1.145 SI -0.006 -0.0495
TRUST 0.185 1.03 PExGEN -0.126 -0.7662 EExGEN 0.155 1.0667 SIxGEN 0.261 1.5535
TRUSTxGEN -0.154 -1.095 EExEXP 0.008 0.0649 SIxEXP -0.099 -0.8966
TRUSTxEXP 0.098 0.5291 Notes: 1. *p <.05; **p<.01; ***p<.001.
2. PE: Performance expectancy; EE: Effort expectancy; SI: Social influence; TRUST: Trust; GEN: Gen; EXP: Experience
For all proposed effect of moderators, only H8 was confirmed. The summary of model testing with moderators for the treatment2 is listed in Table 50.
Table 50. Model testing with moderators for the treatment 2 Behavioral Intention
R2 value=0.444 (N=51) ß t-value
PE 0.116 0.547 EE 0.126 0.736 SI 0.381 1.79
TRUST -0.175 -0.832 PExGEN -0.197 -0.853 EExGEN 0.209 1.186 SIxGEN 0.315 1.625
TRUSTxGEN -0.368 -2.173* EExEXP 0.068 0.307 SIxEXP -0.054 -0.312
TRUSTxEXP 0.087 0.423 Notes: 1. *p <.05; **p<.01; ***p<.001.
2. PE: Performance expectancy; EE: Effort expectancy; SI: Social influence; TRUST: Trust; GEN: Gender; EXP: Experience
The results did not support any proposed path of moderators in treatment 3. Table 51
presents the summary of model testing with moderators for the treatment3.
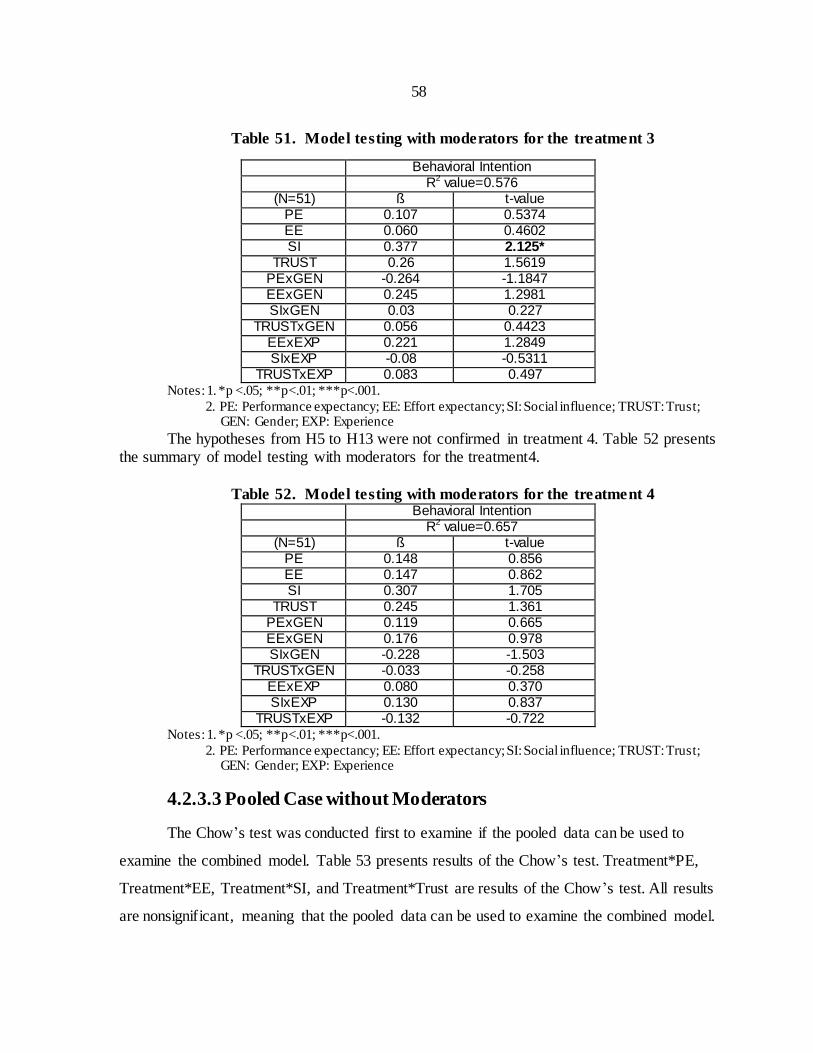
58
Table 51. Model testing with moderators for the treatment 3
Behavioral Intention R2 value=0.576
(N=51) ß t-value PE 0.107 0.5374 EE 0.060 0.4602 SI 0.377 2.125*
TRUST 0.26 1.5619 PExGEN -0.264 -1.1847 EExGEN 0.245 1.2981 SIxGEN 0.03 0.227
TRUSTxGEN 0.056 0.4423 EExEXP 0.221 1.2849 SIxEXP -0.08 -0.5311
TRUSTxEXP 0.083 0.497 Notes: 1. *p <.05; **p<.01; ***p<.001.
2. PE: Performance expectancy; EE: Effort expectancy; SI: Social influence; TRUST: Trust; GEN: Gender; EXP: Experience
The hypotheses from H5 to H13 were not confirmed in treatment 4. Table 52 presents the summary of model testing with moderators for the treatment4.
Table 52. Model testing with moderators for the treatment 4 Behavioral Intention
R2 value=0.657 (N=51) ß t-value
PE 0.148 0.856 EE 0.147 0.862 SI 0.307 1.705
TRUST 0.245 1.361 PExGEN 0.119 0.665 EExGEN 0.176 0.978 SIxGEN -0.228 -1.503
TRUSTxGEN -0.033 -0.258 EExEXP 0.080 0.370 SIxEXP 0.130 0.837
TRUSTxEXP -0.132 -0.722 Notes: 1. *p <.05; **p<.01; ***p<.001.
2. PE: Performance expectancy; EE: Effort expectancy; SI: Social influence; TRUST: Trust; GEN: Gender; EXP: Experience
4.2.3.3 Pooled Case without Moderators
The Chow’s test was conducted first to examine if the pooled data can be used to
examine the combined model. Table 53 presents results of the Chow’s test. Treatment*PE,
Treatment*EE, Treatment*SI, and Treatment*Trust are results of the Chow’s test. All results
are nonsignificant, meaning that the pooled data can be used to examine the combined model.
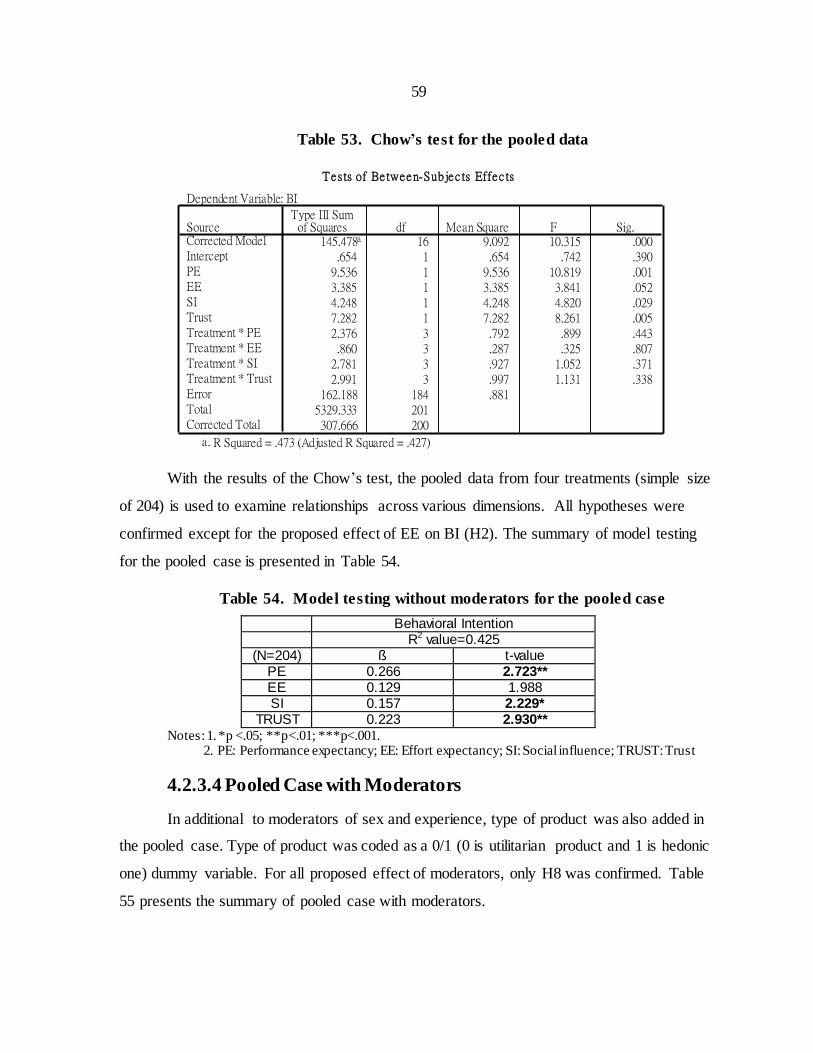
59
Table 53. Chow’s test for the pooled data
With the results of the Chow’s test, the pooled data from four treatments (simple size
of 204) is used to examine relationships across various dimensions. All hypotheses were
confirmed except for the proposed effect of EE on BI (H2). The summary of model testing
for the pooled case is presented in Table 54.
Table 54. Model testing without moderators for the pooled case
Behavioral Intention R2 value=0.425
(N=204) ß t-value PE 0.266 2.723** EE 0.129 1.988 SI 0.157 2.229*
TRUST 0.223 2.930** Notes: 1. *p <.05; **p<.01; ***p<.001. 2. PE: Performance expectancy; EE: Effort expectancy; SI: Social influence; TRUST: Trust
4.2.3.4 Pooled Case with Moderators
In additional to moderators of sex and experience, type of product was also added in
the pooled case. Type of product was coded as a 0/1 (0 is utilitarian product and 1 is hedonic
one) dummy variable. For all proposed effect of moderators, only H8 was confirmed. Table
55 presents the summary of pooled case with moderators.
Tests of Be tween-Subjec ts Effec ts
Dependent Variable: BI
145.478a 16 9.092 10.315 .000.654 1 .654 .742 .390
9.536 1 9.536 10.819 .0013.385 1 3.385 3.841 .0524.248 1 4.248 4.820 .0297.282 1 7.282 8.261 .0052.376 3 .792 .899 .443.860 3 .287 .325 .807
2.781 3 .927 1.052 .3712.991 3 .997 1.131 .338
162.188 184 .8815329.333 201307.666 200
SourceCorrected ModelInterceptPEEESITrustTreatment * PETreatment * EETreatment * SITreatment * TrustErrorTotalCorrected Total
Type III Sumof Squares df Mean Square F Sig.
R Squared = .473 (Adjusted R Squared = .427)a.
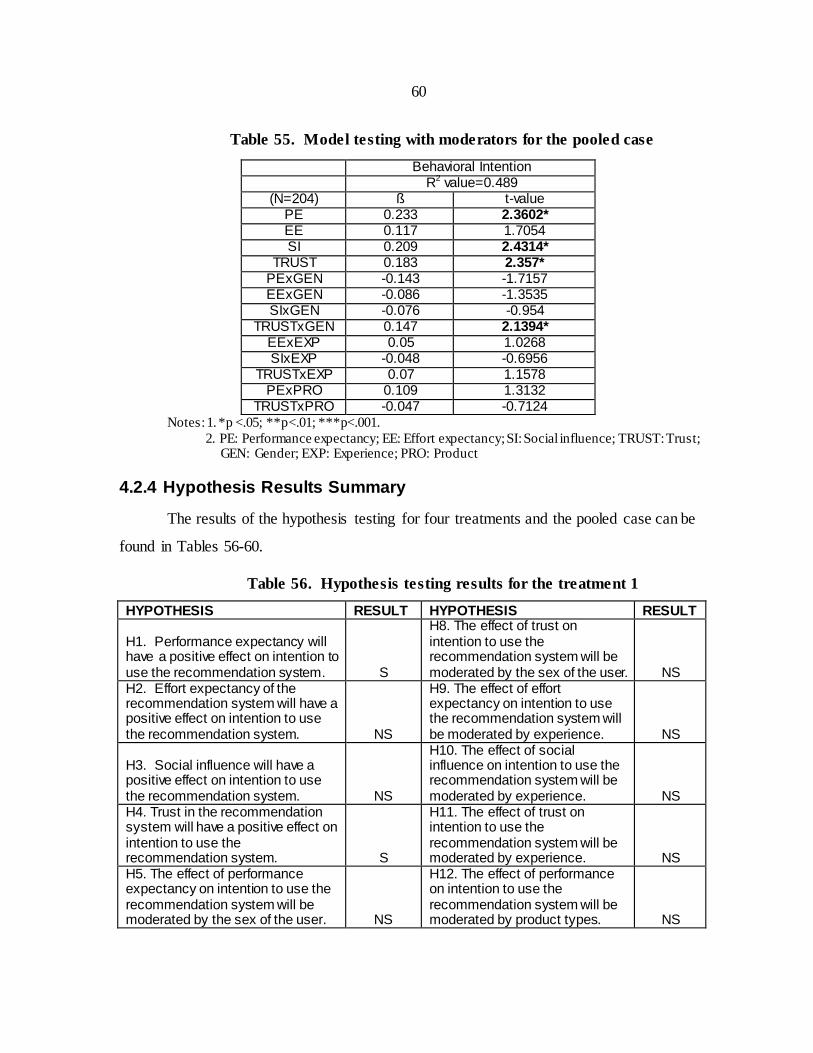
60
Table 55. Model testing with moderators for the pooled case
Behavioral Intention R2 value=0.489
(N=204) ß t-value PE 0.233 2.3602* EE 0.117 1.7054 SI 0.209 2.4314*
TRUST 0.183 2.357* PExGEN -0.143 -1.7157 EExGEN -0.086 -1.3535 SIxGEN -0.076 -0.954
TRUSTxGEN 0.147 2.1394* EExEXP 0.05 1.0268 SIxEXP -0.048 -0.6956
TRUSTxEXP 0.07 1.1578 PExPRO 0.109 1.3132
TRUSTxPRO -0.047 -0.7124 Notes: 1. *p <.05; **p<.01; ***p<.001.
2. PE: Performance expectancy; EE: Effort expectancy; SI: Social influence; TRUST: Trust; GEN: Gender; EXP: Experience; PRO: Product
4.2.4 Hypothesis Results Summary
The results of the hypothesis testing for four treatments and the pooled case can be
found in Tables 56-60.
Table 56. Hypothesis testing results for the treatment 1
HYPOTHESIS RESULT HYPOTHESIS RESULT
H1. Performance expectancy will have a positive effect on intention to use the recommendation system. S
H8. The effect of trust on intention to use the recommendation system will be moderated by the sex of the user. NS
H2. Effort expectancy of the recommendation system will have a positive effect on intention to use the recommendation system. NS
H9. The effect of effort expectancy on intention to use the recommendation system will be moderated by experience. NS
H3. Social influence will have a positive effect on intention to use the recommendation system. NS
H10. The effect of social influence on intention to use the recommendation system will be moderated by experience. NS
H4. Trust in the recommendation system will have a positive effect on intention to use the recommendation system. S
H11. The effect of trust on intention to use the recommendation system will be moderated by experience. NS
H5. The effect of performance expectancy on intention to use the recommendation system will be moderated by the sex of the user. NS
H12. The effect of performance on intention to use the recommendation system will be moderated by product types. NS
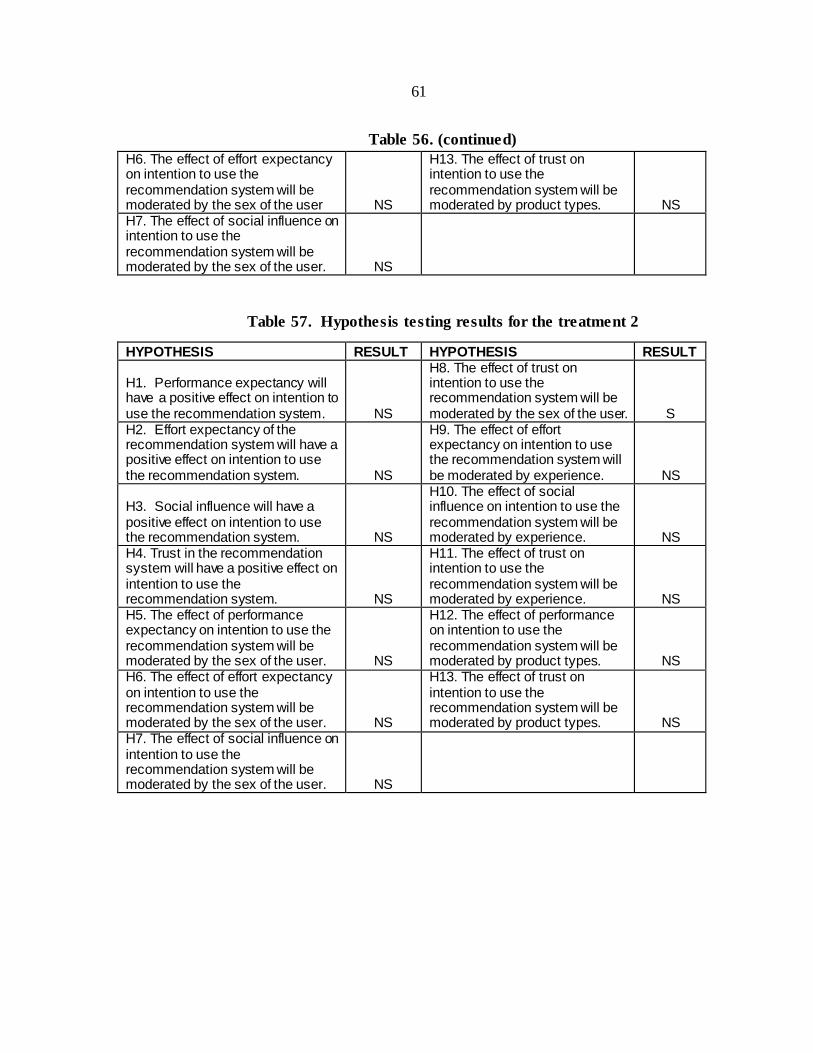
61
Table 56. (continued)
H6. The effect of effort expectancy on intention to use the recommendation system will be moderated by the sex of the user NS
H13. The effect of trust on intention to use the recommendation system will be moderated by product types. NS
H7. The effect of social influence on intention to use the recommendation system will be moderated by the sex of the user. NS
Table 57. Hypothesis testing results for the treatment 2
HYPOTHESIS RESULT HYPOTHESIS RESULT
H1. Performance expectancy will have a positive effect on intention to use the recommendation system. NS
H8. The effect of trust on intention to use the recommendation system will be moderated by the sex of the user. S
H2. Effort expectancy of the recommendation system will have a positive effect on intention to use the recommendation system. NS
H9. The effect of effort expectancy on intention to use the recommendation system will be moderated by experience. NS
H3. Social influence will have a positive effect on intention to use the recommendation system. NS
H10. The effect of social influence on intention to use the recommendation system will be moderated by experience. NS
H4. Trust in the recommendation system will have a positive effect on intention to use the recommendation system. NS
H11. The effect of trust on intention to use the recommendation system will be moderated by experience. NS
H5. The effect of performance expectancy on intention to use the recommendation system will be moderated by the sex of the user. NS
H12. The effect of performance on intention to use the recommendation system will be moderated by product types. NS
H6. The effect of effort expectancy on intention to use the recommendation system will be moderated by the sex of the user. NS
H13. The effect of trust on intention to use the recommendation system will be moderated by product types. NS
H7. The effect of social influence on intention to use the recommendation system will be moderated by the sex of the user. NS
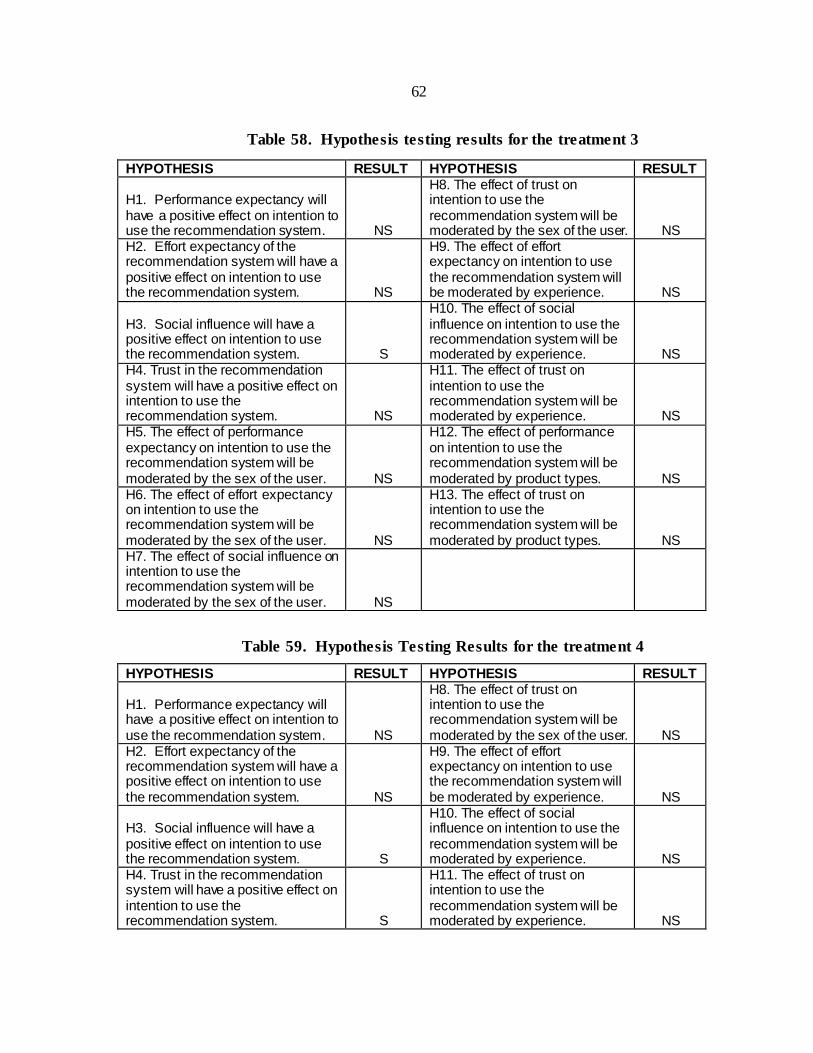
62
Table 58. Hypothesis testing results for the treatment 3
HYPOTHESIS RESULT HYPOTHESIS RESULT
H1. Performance expectancy will have a positive effect on intention to use the recommendation system. NS
H8. The effect of trust on intention to use the recommendation system will be moderated by the sex of the user. NS
H2. Effort expectancy of the recommendation system will have a positive effect on intention to use the recommendation system. NS
H9. The effect of effort expectancy on intention to use the recommendation system will be moderated by experience. NS
H3. Social influence will have a positive effect on intention to use the recommendation system. S
H10. The effect of social influence on intention to use the recommendation system will be moderated by experience. NS
H4. Trust in the recommendation system will have a positive effect on intention to use the recommendation system. NS
H11. The effect of trust on intention to use the recommendation system will be moderated by experience. NS
H5. The effect of performance expectancy on intention to use the recommendation system will be moderated by the sex of the user. NS
H12. The effect of performance on intention to use the recommendation system will be moderated by product types. NS
H6. The effect of effort expectancy on intention to use the recommendation system will be moderated by the sex of the user. NS
H13. The effect of trust on intention to use the recommendation system will be moderated by product types. NS
H7. The effect of social influence on intention to use the recommendation system will be moderated by the sex of the user. NS
Table 59. Hypothesis Testing Results for the treatment 4
HYPOTHESIS RESULT HYPOTHESIS RESULT
H1. Performance expectancy will have a positive effect on intention to use the recommendation system. NS
H8. The effect of trust on intention to use the recommendation system will be moderated by the sex of the user. NS
H2. Effort expectancy of the recommendation system will have a positive effect on intention to use the recommendation system. NS
H9. The effect of effort expectancy on intention to use the recommendation system will be moderated by experience. NS
H3. Social influence will have a positive effect on intention to use the recommendation system. S
H10. The effect of social influence on intention to use the recommendation system will be moderated by experience. NS
H4. Trust in the recommendation system will have a positive effect on intention to use the recommendation system. S
H11. The effect of trust on intention to use the recommendation system will be moderated by experience. NS
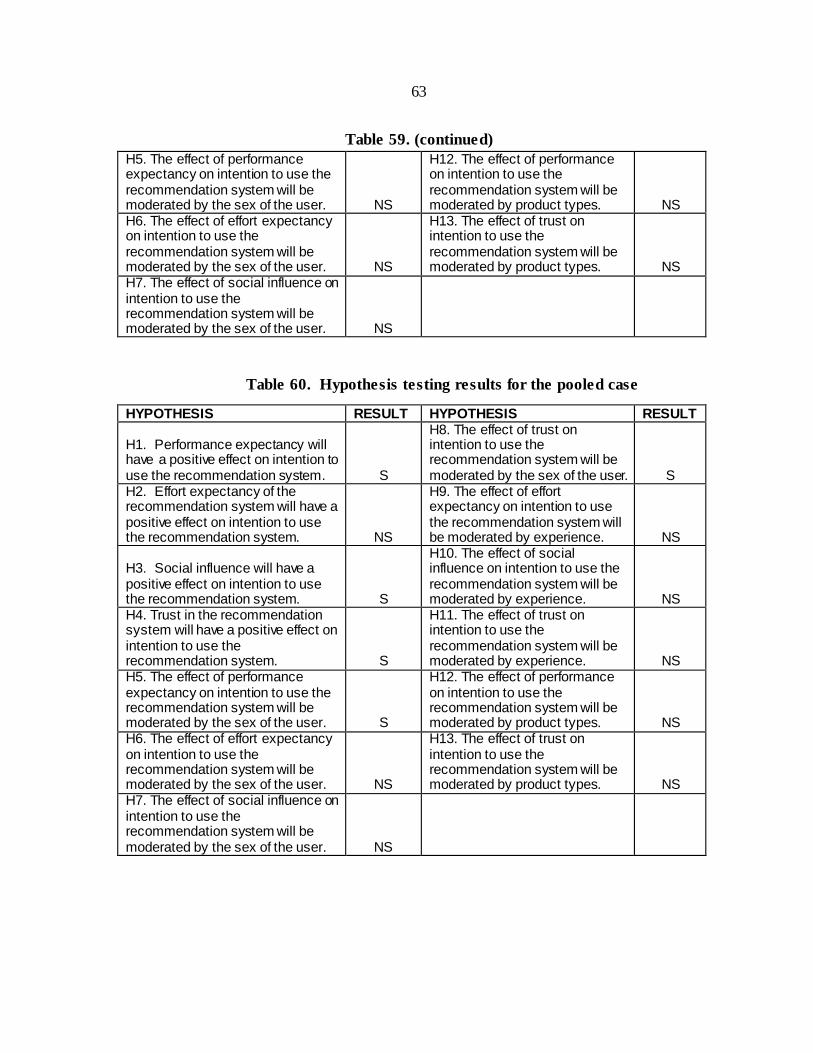
63
Table 59. (continued)
H5. The effect of performance expectancy on intention to use the recommendation system will be moderated by the sex of the user. NS
H12. The effect of performance on intention to use the recommendation system will be moderated by product types. NS
H6. The effect of effort expectancy on intention to use the recommendation system will be moderated by the sex of the user. NS
H13. The effect of trust on intention to use the recommendation system will be moderated by product types. NS
H7. The effect of social influence on intention to use the recommendation system will be moderated by the sex of the user. NS
Table 60. Hypothesis testing results for the pooled case
HYPOTHESIS RESULT HYPOTHESIS RESULT
H1. Performance expectancy will have a positive effect on intention to use the recommendation system. S
H8. The effect of trust on intention to use the recommendation system will be moderated by the sex of the user. S
H2. Effort expectancy of the recommendation system will have a positive effect on intention to use the recommendation system. NS
H9. The effect of effort expectancy on intention to use the recommendation system will be moderated by experience. NS
H3. Social influence will have a positive effect on intention to use the recommendation system. S
H10. The effect of social influence on intention to use the recommendation system will be moderated by experience. NS
H4. Trust in the recommendation system will have a positive effect on intention to use the recommendation system. S
H11. The effect of trust on intention to use the recommendation system will be moderated by experience. NS
H5. The effect of performance expectancy on intention to use the recommendation system will be moderated by the sex of the user. S
H12. The effect of performance on intention to use the recommendation system will be moderated by product types. NS
H6. The effect of effort expectancy on intention to use the recommendation system will be moderated by the sex of the user. NS
H13. The effect of trust on intention to use the recommendation system will be moderated by product types. NS
H7. The effect of social influence on intention to use the recommendation system will be moderated by the sex of the user. NS
64
CHAPTER 5. DISCUSSION AND CONCLUSIONS
5.1 Overview
The objective of the study was to present and validate a modified UTAUT model to
examine its relevance and the important role of trust on behavioral intention to use
recommendation systems in the context of e-commerce. Concerning different effects of
hedonic and utilitarian product, this study also took into account of hedonic and utilitarian
characteristics to determine their effects on customer use of recommendation systems. Based
on two types of products (hedonic and utilitarian) and two types of recommendation systems
(collaborative filtering and content-based), this study presented a 2 (recommendation systems)
x 2 (products) treatments. These four treatments, along with the pooled case of these four
treatments (simple size of 204), were investigated using a modified UTAUT model. With
empirical analysis, we may reasonably conclude that different types of recommendation
systems and products did have different effects on customer intention to use recommendation
systems.
Specifically, our findings are not in contradiction with those of technology acceptance
related studies discussed above. Like the original UTAUT model, the study showed statistical
significance on the proposed effect of PE on BI in the treatment 1 (collaborative filtering
with the MP3 player) and the pooled case. A general interpretation for there being no
statistical significance of PE on BI in the rest of treatments may lie in fundamental
differences of two types of recommendation systems and products.
For the proposed effect of EE on BI part, there was the lack of statistical significance
for the effect of EE on BI in any treatment, including the pooled one. One reason to account
for this may lie in the fact that most of participants showed a medium or high degree of
experience of using recommendation systems in any treatment. The effect of effort
expectancy is significant during the first time period of accepting the technology; however, it
becomes nonsignificant over period of extended and sustained usage (Davis et al., 1989;
Thompson et al., 1991; Venkatesh et al., 2003). Thus, the findings of the current study are in
line with the previous study.
65
The findings of our study provide interesting insights for the effect of SI on BI. Our
data suggest that SI do matter in the case of content-based recommendation system and the
pooled case. Therefore, it is apparent that a potential user of the content-based
recommendation system may use this system due to the reason, such as important others
believe he or she should use the new system. On the other hand, the same reason may not
impact on these who use the collaborative filtering recommendation system.
Trust is emerging as an important aspect of technology acceptance as an interesting
number of technologies engage in privacy issues over the web. However, trust has not been
examined very much in the widely used models explaining technology acceptance like the
UTAUT. Data from the study lead us to believe that providers of online recommendation
systems should notice the importance of trust. Trust appeared to play an important role in
both types of recommendation systems. Thus, this result implies that a customer’s intention
to use recommendation systems depends not only on the operational characteristics of the
recommendation system, its PE or EE, but also, and possibly to a greater degree, on customer
trust in the provider of the recommendation system. Providers of these systems need to take
into account their recommendation systems planning efforts.
5.2 Implications
From a theoretical perspective, this study contributes to the field’s understanding of
the various factors influencing people’s intentions to use recommendation systems as they
face the issue of information overload in the context of e-commerce by using a modified
UTAUT model. The results of this study prove the relevance of UTAUT in accepting online
recommendation systems.
This study also suggests a new perspective for the UTAUT model in general. In this
line of research, researchers focus more on expected outcome of operational characteristics,
such as performance expectancy or effort expectancy. The concept of trust did not show up in
this line of research. Due to highly competitive environment, more and more providers of
innovative technology try to provide the most customized services to maintain competitive
advantage in online environments. However, because of high uncertainty for providers of
technologies, users may not intend to use these technologies until they trust these providers
66
of technologies. With this in mind, the concept of trust should be taken into consideration
with the original UTAUT model. By integrating the concept of trust with the original
UTAUT model successfully, this study represents a step forward in the overall model
development.
From a practitioner point of view, this study has important practical implications for
designers of effective online recommendation systems. The findings of this study indicate
that participants had different perception for two types of recommendation systems. PE and
Trust are two major concerns for those who use the collaborative filtering system. On the
other hand, SI and Trust are another two major concerns for those who use the content-based
recommendation system. Thus, managers should realize fundamental differences of two
types of recommendation systems and make appropriate strategies when they try to invest on
building an effective recommendation system. Additionally, although effort expectancy (EE)
was lack of statistic significance in any treatment, managers cannot make light of the
importance of effort expectancy. Designers should consider and provide a friendly
environment for those first time users or users without so many experiences in using
recommendation systems. Managers or designers should treat this part of result
circumspectly. The ultimate goal of recommendation systems is to help customers find the
most appropriate products and then bring more profits to providers of recommendation
systems. Trust appears to an important role for both types of recommendation systems. Thus,
designers must design a recommendation system where customers believe that the provider
of this system will not take advantage of their weakness.
5.3 Limitations and Future Research
Even though this research has the undeniable merit of offering valuable insights into
the process of recommendation systems acceptance, it has some limitations. First, this study
only recruited 51 subjects to do the final study. While results presented desirable findings,
more subjects, if possible, should be recruited to be more representative.
Second, the study investigated participants who were working on undergraduate
degree. The generalization of the results to other populations with different educational
67
backgrounds may be limited. Thus, more replications to test our model in other population
are necessary to examine our findings.
Third, since the study analyzed recommendation systems from two well-known
websites, it is unclear whether the results can be generalized to less-known websites. A
replication of the study needs to take into consideration this issue.
This study only investigated people’s intention to use recommendation systems. No
actual behavior was measured in this study. Perhaps future research could examine the
interaction between behavioral intention and actual behavior. Additionally, as described
above, a future should also consider and analyze less-known websites to achieve the goal of
generalizability.
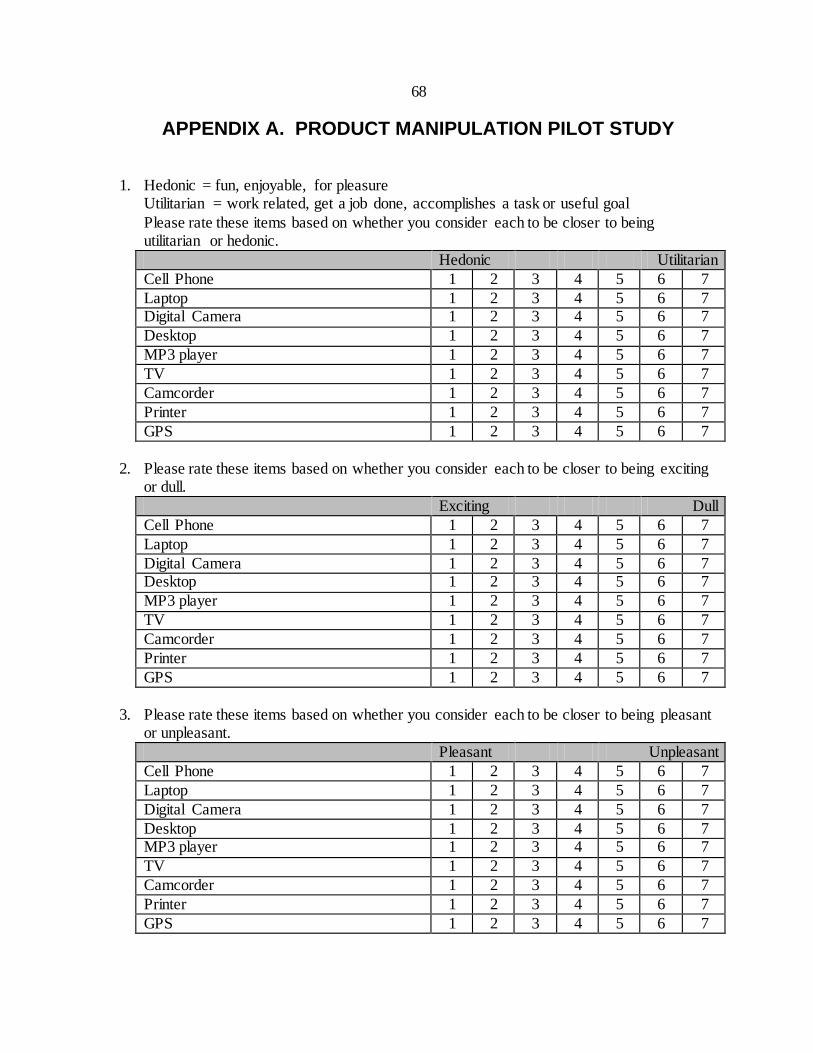
68
APPENDIX A. PRODUCT MANIPULATION PILOT STUDY
1. Hedonic = fun, enjoyable, for pleasure Utilitarian = work related, get a job done, accomplishes a task or useful goal
Please rate these items based on whether you consider each to be closer to being utilitarian or hedonic.
Hedonic Utilitarian
Cell Phone 1 2 3 4 5 6 7
Laptop 1 2 3 4 5 6 7 Digital Camera 1 2 3 4 5 6 7
Desktop 1 2 3 4 5 6 7
MP3 player 1 2 3 4 5 6 7
TV 1 2 3 4 5 6 7
Camcorder 1 2 3 4 5 6 7
Printer 1 2 3 4 5 6 7
GPS 1 2 3 4 5 6 7
2. Please rate these items based on whether you consider each to be closer to being exciting
or dull.
Exciting Dull
Cell Phone 1 2 3 4 5 6 7
Laptop 1 2 3 4 5 6 7
Digital Camera 1 2 3 4 5 6 7 Desktop 1 2 3 4 5 6 7
MP3 player 1 2 3 4 5 6 7
TV 1 2 3 4 5 6 7
Camcorder 1 2 3 4 5 6 7
Printer 1 2 3 4 5 6 7
GPS 1 2 3 4 5 6 7
3. Please rate these items based on whether you consider each to be closer to being pleasant
or unpleasant.
Pleasant Unpleasant
Cell Phone 1 2 3 4 5 6 7
Laptop 1 2 3 4 5 6 7
Digital Camera 1 2 3 4 5 6 7
Desktop 1 2 3 4 5 6 7 MP3 player 1 2 3 4 5 6 7
TV 1 2 3 4 5 6 7
Camcorder 1 2 3 4 5 6 7
Printer 1 2 3 4 5 6 7
GPS 1 2 3 4 5 6 7
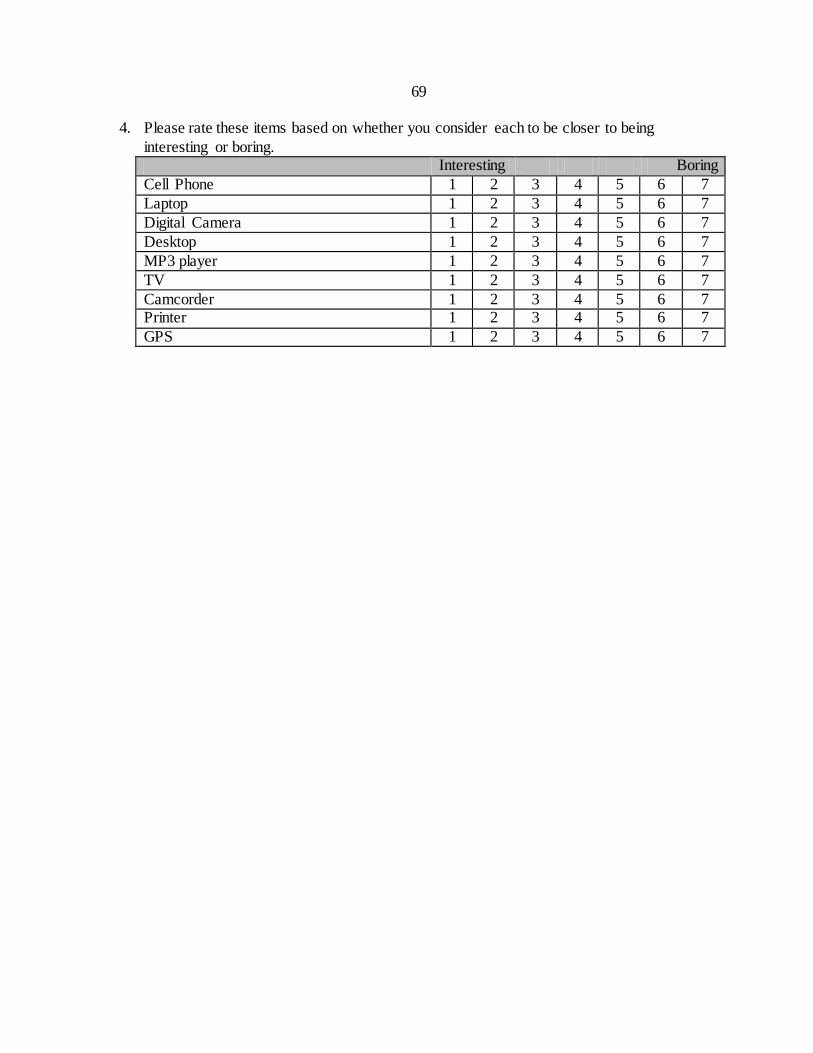
69
4. Please rate these items based on whether you consider each to be closer to being
interesting or boring. Interesting Boring
Cell Phone 1 2 3 4 5 6 7
Laptop 1 2 3 4 5 6 7
Digital Camera 1 2 3 4 5 6 7
Desktop 1 2 3 4 5 6 7
MP3 player 1 2 3 4 5 6 7
TV 1 2 3 4 5 6 7
Camcorder 1 2 3 4 5 6 7 Printer 1 2 3 4 5 6 7
GPS 1 2 3 4 5 6 7
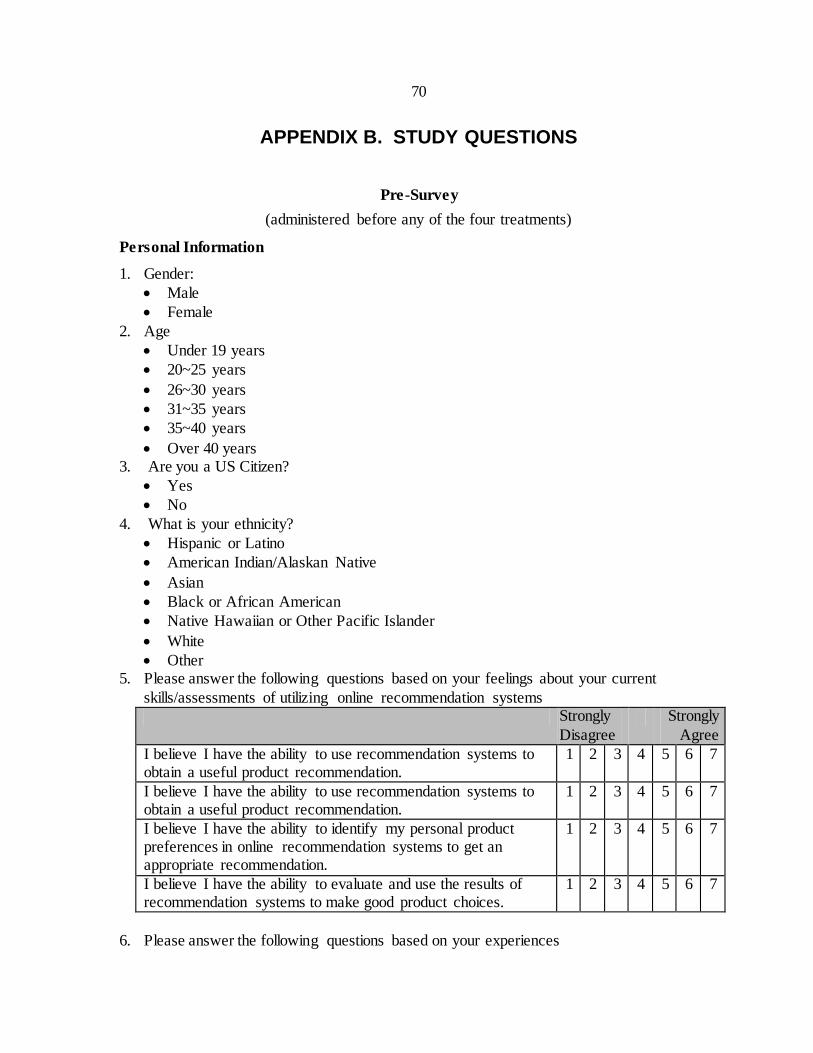
70
APPENDIX B. STUDY QUESTIONS
Pre-Survey
(administered before any of the four treatments)
Personal Information
1. Gender:
Male
Female
2. Age
Under 19 years
20~25 years
26~30 years
31~35 years
35~40 years
Over 40 years 3. Are you a US Citizen?
Yes
No
4. What is your ethnicity?
Hispanic or Latino
American Indian/Alaskan Native
Asian
Black or African American
Native Hawaiian or Other Pacific Islander
White
Other 5. Please answer the following questions based on your feelings about your current
skills/assessments of utilizing online recommendation systems Strongly
Disagree
Strongly
Agree
I believe I have the ability to use recommendation systems to obtain a useful product recommendation.
1 2 3 4 5 6 7
I believe I have the ability to use recommendation systems to obtain a useful product recommendation.
1 2 3 4 5 6 7
I believe I have the ability to identify my personal product preferences in online recommendation systems to get an appropriate recommendation.
1 2 3 4 5 6 7
I believe I have the ability to evaluate and use the results of recommendation systems to make good product choices.
1 2 3 4 5 6 7
6. Please answer the following questions based on your experiences
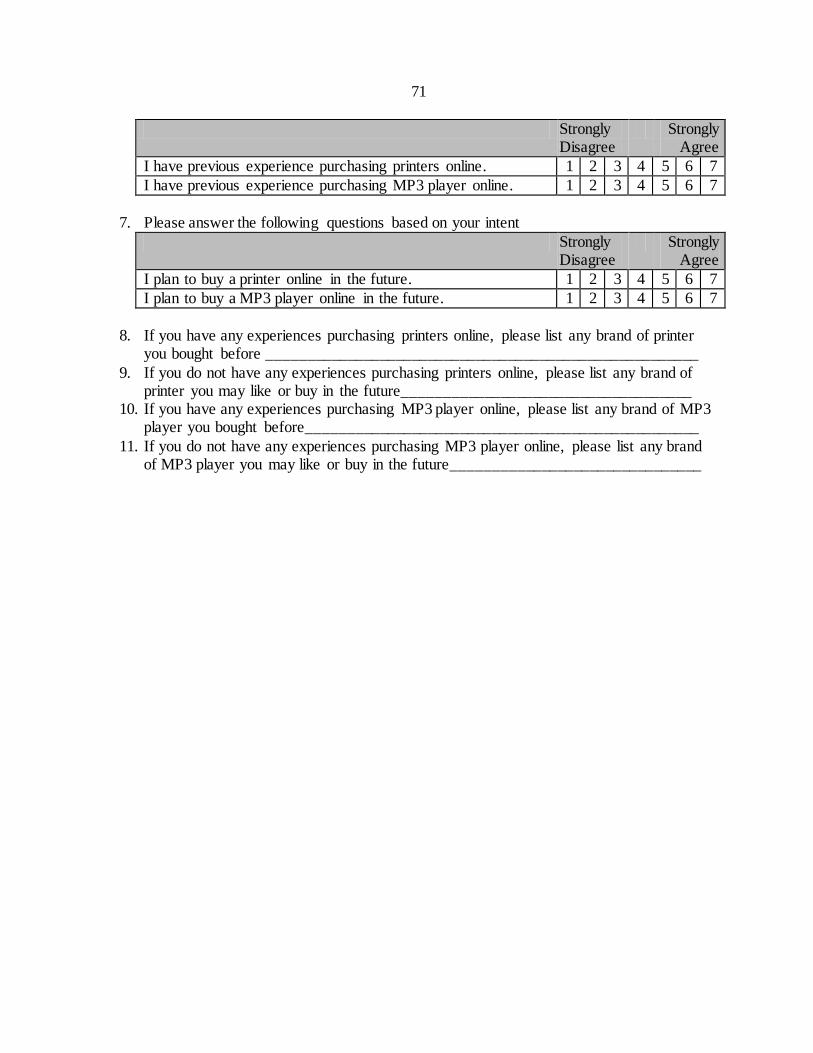
71
Strongly Disagree
Strongly Agree
I have previous experience purchasing printers online. 1 2 3 4 5 6 7
I have previous experience purchasing MP3 player online. 1 2 3 4 5 6 7
7. Please answer the following questions based on your intent
Strongly Disagree
Strongly Agree
I plan to buy a printer online in the future. 1 2 3 4 5 6 7
I plan to buy a MP3 player online in the future. 1 2 3 4 5 6 7
8. If you have any experiences purchasing printers online, please list any brand of printer
you bought before ______________________________________________________
9. If you do not have any experiences purchasing printers online, please list any brand of printer you may like or buy in the future____________________________________
10. If you have any experiences purchasing MP3 player online, please list any brand of MP3 player you bought before_________________________________________________
11. If you do not have any experiences purchasing MP3 player online, please list any brand of MP3 player you may like or buy in the future_______________________________
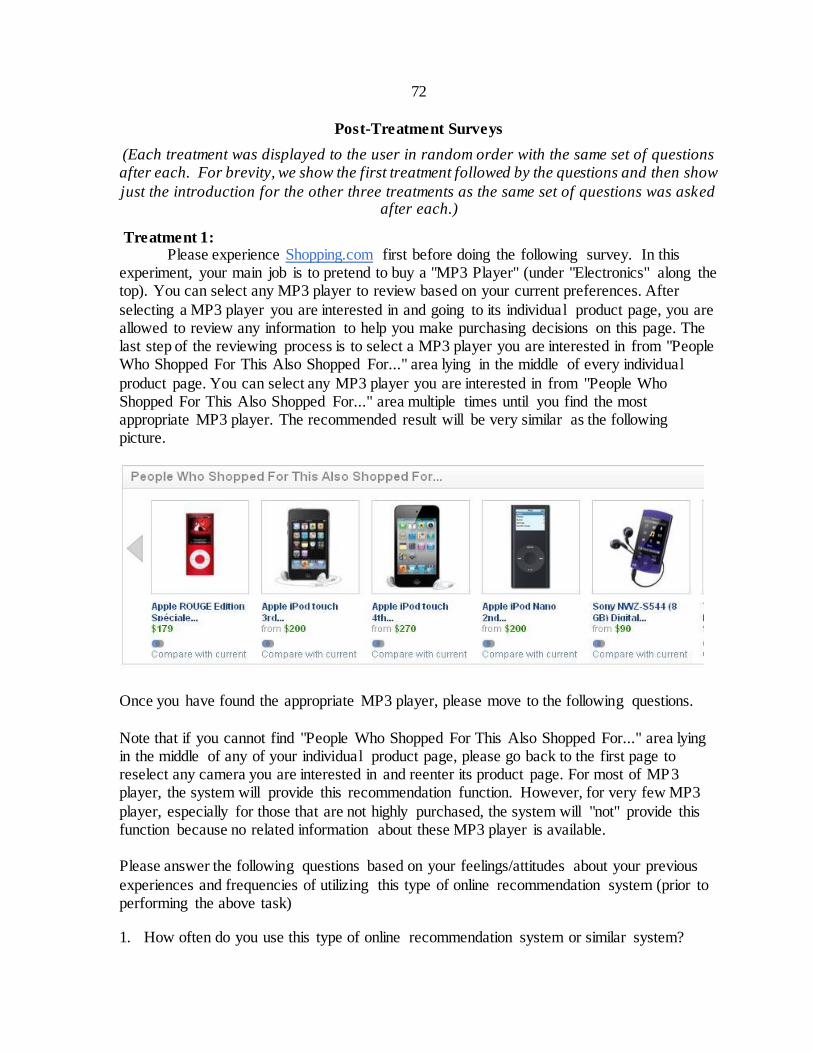
72
Post-Treatment Surveys
(Each treatment was displayed to the user in random order with the same set of questions after each. For brevity, we show the first treatment followed by the questions and then show
just the introduction for the other three treatments as the same set of questions was asked after each.)
Treatment 1: Please experience Shopping.com first before doing the following survey. In this
experiment, your main job is to pretend to buy a "MP3 Player" (under "Electronics" along the top). You can select any MP3 player to review based on your current preferences. After
selecting a MP3 player you are interested in and going to its individual product page, you are allowed to review any information to help you make purchasing decisions on this page. The last step of the reviewing process is to select a MP3 player you are interested in from "People Who Shopped For This Also Shopped For..." area lying in the middle of every individual
product page. You can select any MP3 player you are interested in from "People Who Shopped For This Also Shopped For..." area multiple times until you find the most appropriate MP3 player. The recommended result will be very similar as the following picture.
Once you have found the appropriate MP3 player, please move to the following questions.
Note that if you cannot find "People Who Shopped For This Also Shopped For..." area lying in the middle of any of your individual product page, please go back to the first page to reselect any camera you are interested in and reenter its product page. For most of MP3 player, the system will provide this recommendation function. However, for very few MP3
player, especially for those that are not highly purchased, the system will "not" provide this function because no related information about these MP3 player is available. Please answer the following questions based on your feelings/attitudes about your previous
experiences and frequencies of utilizing this type of online recommendation system (prior to performing the above task)
1. How often do you use this type of online recommendation system or similar system?
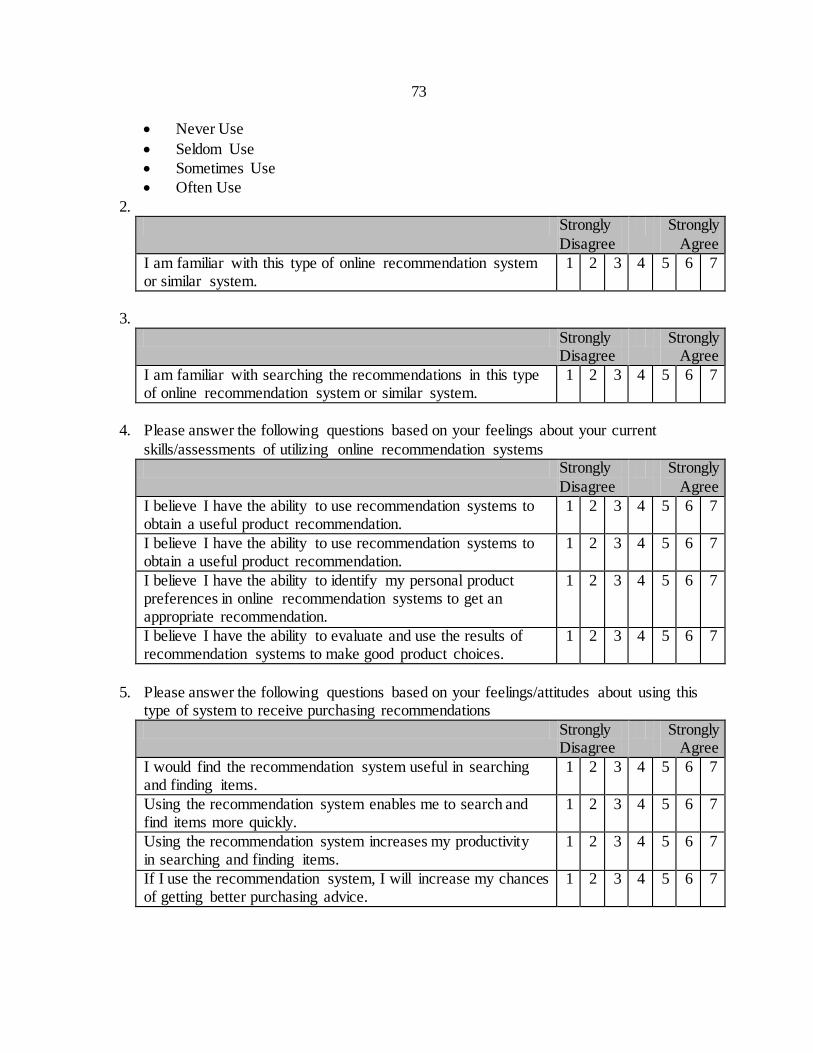
73
Never Use
Seldom Use
Sometimes Use
Often Use
2. Strongly
Disagree
Strongly
Agree
I am familiar with this type of online recommendation system or similar system.
1 2 3 4 5 6 7
3.
Strongly Disagree
Strongly Agree
I am familiar with searching the recommendations in this type of online recommendation system or similar system.
1 2 3 4 5 6 7
4. Please answer the following questions based on your feelings about your current
skills/assessments of utilizing online recommendation systems Strongly
Disagree
Strongly
Agree
I believe I have the ability to use recommendation systems to obtain a useful product recommendation.
1 2 3 4 5 6 7
I believe I have the ability to use recommendation systems to obtain a useful product recommendation.
1 2 3 4 5 6 7
I believe I have the ability to identify my personal product preferences in online recommendation systems to get an appropriate recommendation.
1 2 3 4 5 6 7
I believe I have the ability to evaluate and use the results of recommendation systems to make good product choices.
1 2 3 4 5 6 7
5. Please answer the following questions based on your feelings/attitudes about using this type of system to receive purchasing recommendations
Strongly Disagree
Strongly Agree
I would find the recommendation system useful in searching and finding items.
1 2 3 4 5 6 7
Using the recommendation system enables me to search and find items more quickly.
1 2 3 4 5 6 7
Using the recommendation system increases my productivity in searching and finding items.
1 2 3 4 5 6 7
If I use the recommendation system, I will increase my chances of getting better purchasing advice.
1 2 3 4 5 6 7
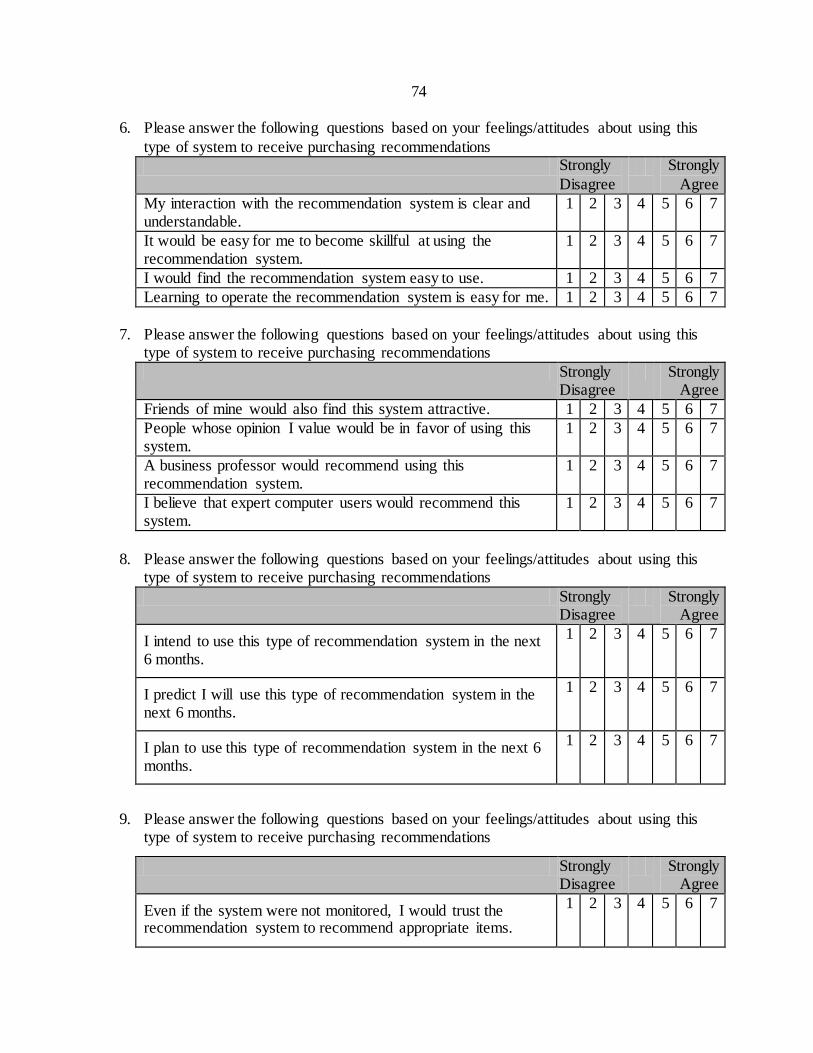
74
6. Please answer the following questions based on your feelings/attitudes about using this
type of system to receive purchasing recommendations Strongly
Disagree
Strongly
Agree
My interaction with the recommendation system is clear and understandable.
1 2 3 4 5 6 7
It would be easy for me to become skillful at using the recommendation system.
1 2 3 4 5 6 7
I would find the recommendation system easy to use. 1 2 3 4 5 6 7
Learning to operate the recommendation system is easy for me. 1 2 3 4 5 6 7
7. Please answer the following questions based on your feelings/attitudes about using this
type of system to receive purchasing recommendations
Strongly Disagree
Strongly Agree
Friends of mine would also find this system attractive. 1 2 3 4 5 6 7
People whose opinion I value would be in favor of using this system.
1 2 3 4 5 6 7
A business professor would recommend using this recommendation system.
1 2 3 4 5 6 7
I believe that expert computer users would recommend this system.
1 2 3 4 5 6 7
8. Please answer the following questions based on your feelings/attitudes about using this type of system to receive purchasing recommendations
Strongly Disagree
Strongly Agree
I intend to use this type of recommendation system in the next 6 months.
1 2 3 4 5 6 7
I predict I will use this type of recommendation system in the next 6 months.
1 2 3 4 5 6 7
I plan to use this type of recommendation system in the next 6 months.
1 2 3 4 5 6 7
9. Please answer the following questions based on your feelings/attitudes about using this type of system to receive purchasing recommendations
Strongly Disagree
Strongly Agree
Even if the system were not monitored, I would trust the recommendation system to recommend appropriate items.
1 2 3 4 5 6 7
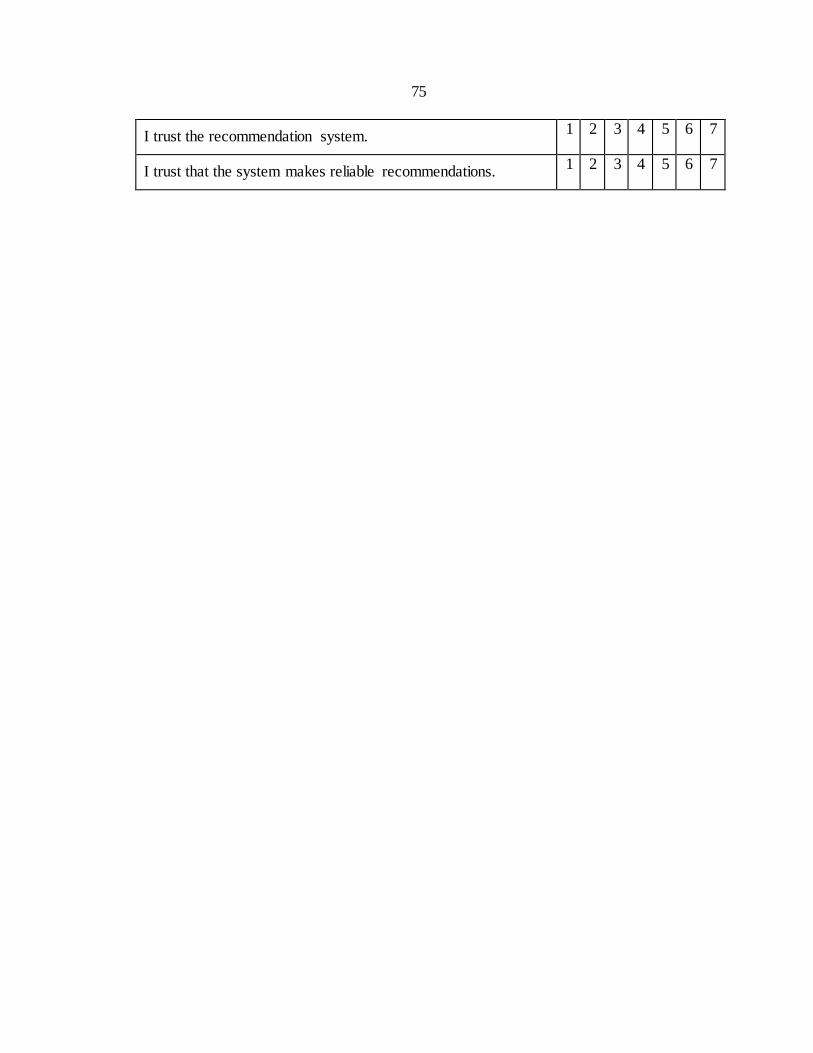
75
I trust the recommendation system. 1 2 3 4 5 6 7
I trust that the system makes reliable recommendations. 1 2 3 4 5 6 7
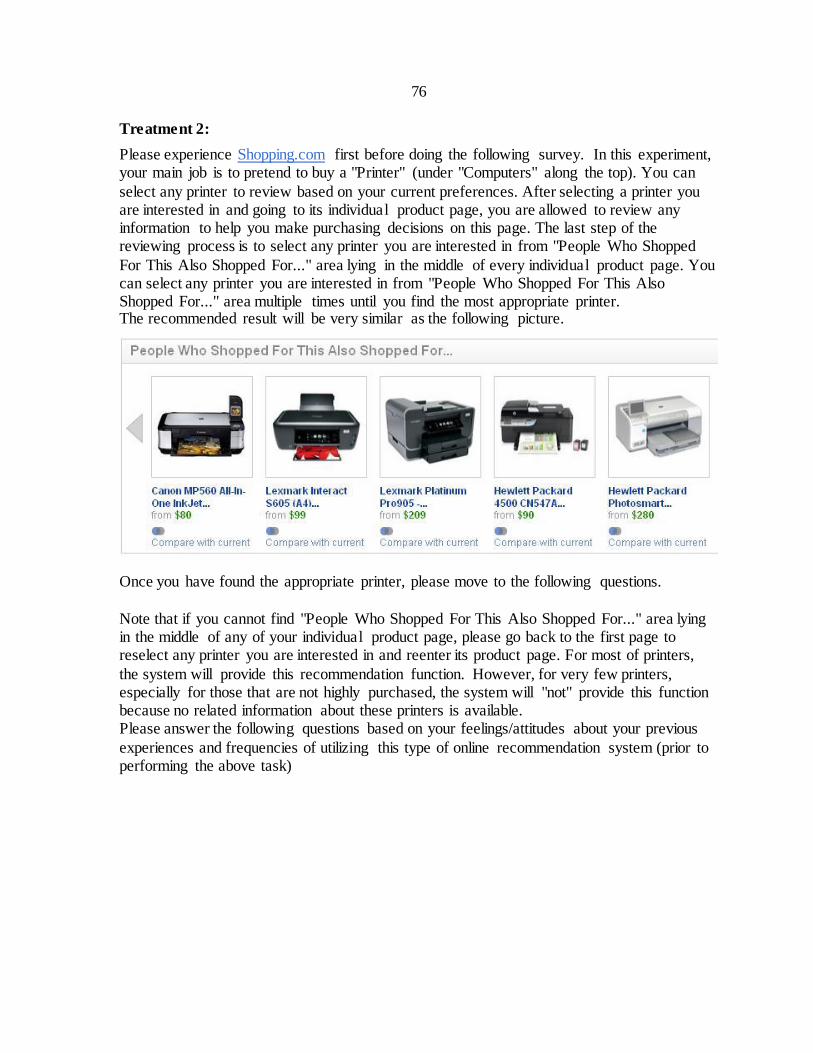
76
Treatment 2:
Please experience Shopping.com first before doing the following survey. In this experiment, your main job is to pretend to buy a "Printer" (under "Computers" along the top). You can
select any printer to review based on your current preferences. After selecting a printer you are interested in and going to its individual product page, you are allowed to review any information to help you make purchasing decisions on this page. The last step of the reviewing process is to select any printer you are interested in from "People Who Shopped
For This Also Shopped For..." area lying in the middle of every individual product page. You can select any printer you are interested in from "People Who Shopped For This Also Shopped For..." area multiple times until you find the most appropriate printer. The recommended result will be very similar as the following picture.
Once you have found the appropriate printer, please move to the following questions.
Note that if you cannot find "People Who Shopped For This Also Shopped For..." area lying in the middle of any of your individual product page, please go back to the first page to reselect any printer you are interested in and reenter its product page. For most of printers,
the system will provide this recommendation function. However, for very few printers, especially for those that are not highly purchased, the system will "not" provide this function because no related information about these printers is available. Please answer the following questions based on your feelings/attitudes about your previous
experiences and frequencies of utilizing this type of online recommendation system (prior to performing the above task)
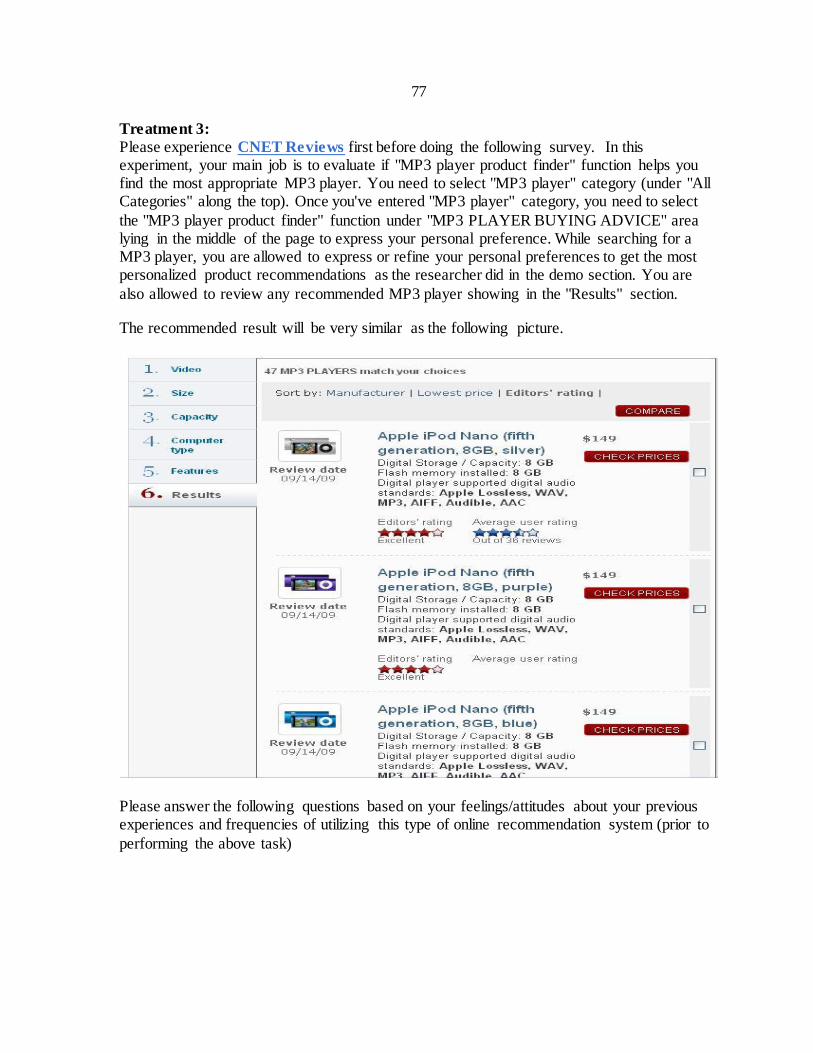
77
Treatment 3:
Please experience CNET Reviews first before doing the following survey. In this experiment, your main job is to evaluate if "MP3 player product finder" function helps you find the most appropriate MP3 player. You need to select "MP3 player" category (under "All Categories" along the top). Once you've entered "MP3 player" category, you need to select
the "MP3 player product finder" function under "MP3 PLAYER BUYING ADVICE" area lying in the middle of the page to express your personal preference. While searching for a MP3 player, you are allowed to express or refine your personal preferences to get the most personalized product recommendations as the researcher did in the demo section. You are
also allowed to review any recommended MP3 player showing in the "Results" section.
The recommended result will be very similar as the following picture.
Please answer the following questions based on your feelings/attitudes about your previous experiences and frequencies of utilizing this type of online recommendation system (prior to
performing the above task)
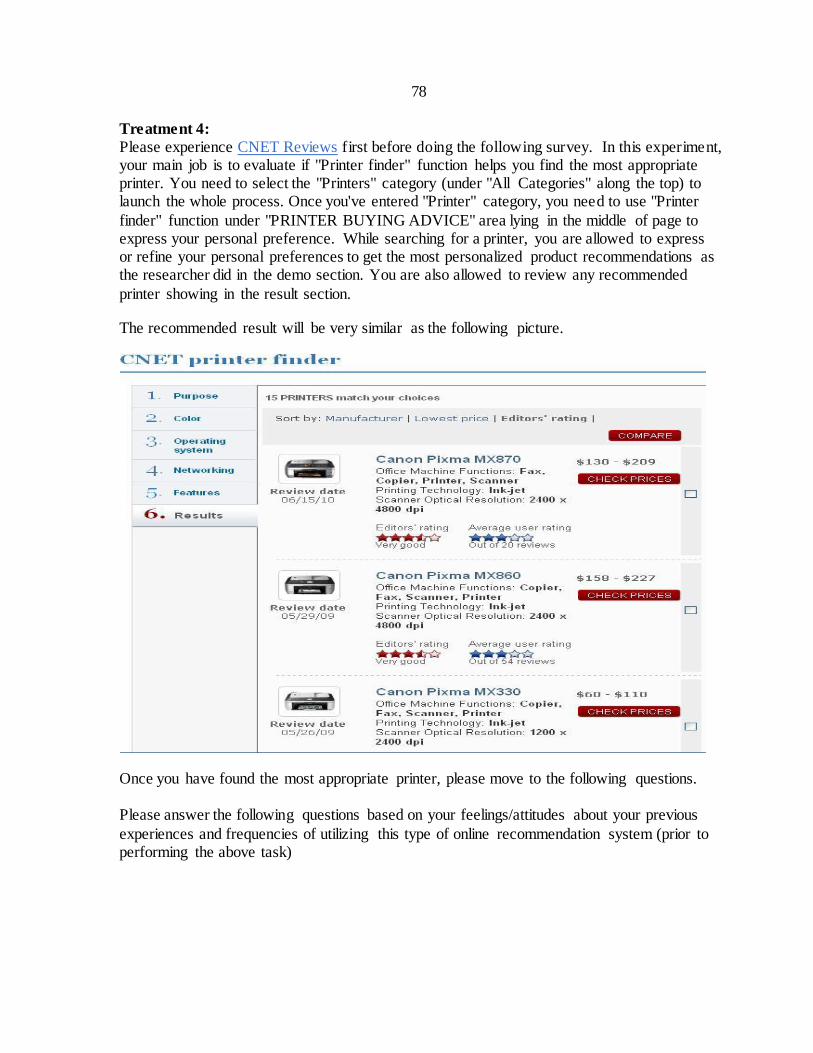
78
Treatment 4:
Please experience CNET Reviews first before doing the following survey. In this experiment, your main job is to evaluate if "Printer finder" function helps you find the most appropriate printer. You need to select the "Printers" category (under "All Categories" along the top) to launch the whole process. Once you've entered "Printer" category, you need to use "Printer
finder" function under "PRINTER BUYING ADVICE" area lying in the middle of page to express your personal preference. While searching for a printer, you are allowed to express or refine your personal preferences to get the most personalized product recommendations as the researcher did in the demo section. You are also allowed to review any recommended
printer showing in the result section.
The recommended result will be very similar as the following picture.
Once you have found the most appropriate printer, please move to the following questions. Please answer the following questions based on your feelings/attitudes about your previous
experiences and frequencies of utilizing this type of online recommendation system (prior to performing the above task)
79
REFERENCES
Adams, Nelson, & Todd. (1992). Perceived usefulness, ease of use, and usage of information technology: A replication. MIS Quarterly, 16, 227-247.
Adomavicius, & Tuzhilin. (2005). Towards the Next Generation of Recommender Systems: A Survey of the State-of-the-Art and Possible Extensions. IEEE Transactions on Knowledge and Data Engineering, 17(6), 734-749.
Ajzen. (1992). The Theory of Planned Behavior Organizational Behavior and Human
Decision Processes, 50(2), 179-211. Ajzen, & Fishbein. (1980). Understanding Attitudes and Predicting Social Behavior
Englewood Cliffs, NJ: Prentice-Hall. Anderson, & Barrios. (1961). Primacy-recency in impression formation. Journal of
Abnormal and Social Psychology, 63(2), 346-350. Anderson, & Schwager. (2004). SME ADOPTION OF WIRELESS LAN TECHNOLOGY:
APPLYING THE UTAUT MODEL. In (Ed.), (pp. 39-43). Ansari, Essegaier, & Kohli. (2000). Internet Recommendation Systems. Marketing Research,
37(3), 363-375. Balabanovic. (1997). An adaptive Web page recommendation service. In (Ed.), (pp. 378 -
385 ). Marina del Rey, California, United States. Balabanovic, & Shoham. (1997). Fab: content-based, collaborative recommendation.
Communications of the ACM 40(3), 66-72. Bandura. (1986). Social Foundations of Thought and Action: A Social Cognitive Theory
Englewood Cliffs, NJ: Prentice Hall. Bandura. (1997). Self-Efficacy: Toward a Unifying Theory of Behavioral Change.
Psychology Review, 84. Bearden, & Etzel. (1982). Reference group influence on product and brand purchase
decisions. Consumer Research, 9(2), 183–194. Breese, Heckerman, & Kadie. (1998). Empirical Analysis of Predictive Algorithms for
Collaborative Filtering. Paper presented at the Fourteenth Conference on Uncertainty in Artificial Intelligence.
Burke. (2002). Hybrid recommender systems: Survey and experiments. User Modeling and User-Adapted Interaction, 12(4), 331-370.
Burnkrant, & Cousineau. (1975). Informational and Normative Social Influence in Buyer Behavior. Journal of Consumer Research, 2(3), 206-215.
Chaudhuri, & Gangadharan. (2002). Gender Differences in Trust and Reciprocity. In (Ed.), (pp.). Atlanta, GA.
Childers, & Rao. (1992). The influence of familial and peer-based reference groups. Consumer Research, 19(2), 198-211.
Compeau, & Higgins. (1995). Computer Self-Efficacy: Development of a Measure and Initial Test. MIS Quarterly, 19(2), 189-211.
Cosley, Lam, Albert, Konstan, & Riedl. (2003). Is Seeing Believing? How Recommender Systems Influence Users' Opinions In (Ed.), (pp. 585-592). Fort Lauderdale, FL.
Davis. (1986). A technology acceptance model for empirically testing new end-user information systems: theory and results Massachusetts Institute of Technology.
80
Davis. (1989). Perceived Usefulness, Perceived Ease of Use, and User Acceptance of
Information Technology. MIS Quarterly, 13(3), 319-340. Davis, Bagozzi, & Warshaw. (1989). User Acceptance of Computer Technology: A
Comparison of Two Theoretical Models. Management Science, 37(1), 36-48. Davis, Bagozzi, & Warshaw. (1992). Extrinsic and Intrinsic Motivation to Use Computers in
the Workplace. Journal of Applied Social Psychlogy 22(14), 1111-1132. Dhar, & Wertenbroch. (2000). Consumer Choice Between Hedonic and Utilitarian Goods.
Journal of Marketing Research 37(1), 60-71. Feick, & Higie. (1992). The Effects of Preference Heterogeneity and Source Characteristics
on Ad Processing and Judgments about Endorsers. Journal of Advertising, 21, 9-24. Fishbein, & Ajzen. (1975). Belief, attitude, intention, and behavior: An introduction to theory
and research. Reading, MA: Addison-Wesley. Foltz. (1990). Using latent semantic indexing for information filtering. In (Ed.), (pp. 40-47).
Cambridge, Massachusetts, United States Fornell, & Larcker. (1981). Structural Equation Models with Unobservable Variables and
Measurement Error: Algebra and Statistics. Journal of Marketing Research, 18(3), 382-388.
Fukuyama. (1995). Trust: The Social Virtues & the Creation of Prosperity. New York, NY: The Free Press.
Gefen. (2000). E-Commerce: The Role of Familiarity and Trust. Omega, 28(6), 725-737. Gefen, Karahanna, & Straub. (2003a). Inexperience and ExperienceWith Online Stores: The
Importance of TAM and Trust. IEEE TRANSACTIONS ON ENGINEERING MANAGEMENT, 50(3), 307-321.
Gefen, Karahanna, & Straub. (2003b). Trust and TAM in Online Shopping: An Integrated Model. MIS Quarterly, 27(1), 51-90.
Gefen, & Straub. (1997). Gender Differences in the Perception and Use of E-Mail: An Extension to the Technology Acceptance Model
MIS Quarterly, 21(4), 389-400. Gefen, & Straub. (2000). The relative importance of perceived ease of use in IS adoption: A
study of e-commerce adoption. JAIS, 1(8), 1-30. Gefen, & Straub. (2003). Managing User Trust in B2C e-Services. e-Service 2(2). Gefen, & Straub. (2004). Consumer trust in B2C e-Commerce and the importance of social
presence: experiments in e-Products and e-Services. Omega, 32(407-424).
Geyskens, Steenkamp, Scheer, & Kumar. (1996). The effects of trust and interdependence on relationship commitment: A transatlantic study. International Journal of Research in Marketing, 13, 303-317.
Goetzinger, & Park. (2005). The role of hedonic and utilitarian products for e-consumer trust.
Journal of Academy of Business and Economics. Goldberg, Nichols, Oki, & Terry. (1992). Using collaborative filtering to weave an
information Tapestry. Communications of the ACM, 35(12), 61-70. Good, et al. (1999). Combining Collaborative Filtering with Personal Agents for Better
Recommendations. In (Ed.), (pp. 439-446). Grenci, & Todd. (2002). Solutions-driven marketing. Communications of the ACM, 45(3),
65-71.
81
Hall, & Mansfield. (1975). Relationships of Age and Seniority with Career Variables of
Engineers and Scientist. Journal of Applied Psychology, 60(2), 201-210. Haubl, & Trifts. (2000). Consumer decision making in online shopping environments: The
effects of interactive decision aids. Marketing Science, 19(1), 4-21. Heijden. (2004). User acceptance of hedonic information systems. MIS Quarterly, 28(4),
695-704. Hennington, & Janz. (2007). INFORMATION SYSTEMS AND HEALTHCARE XVI:
PHYSICIAN ADOPTION OF ELECTRONIC MEDICAL RECORDS: APPLYING THE UTAUT MODEL IN A HEALTHCARE CONTEXT. Communications of the
Association for Information Systems, 19 , 60-80. Hirschman, & Holbrook. (1982). Hedonic Consumption: Emerging Concepts, Methods and
Propositions. The Journal of Marketing, 46(3), 92-101. Hostler, Y., & Guimaraes. (2005). Assessing the impact of internet agent on end users'
performance Decision Support Systems 41(1), 313-323. Hsu, & Lin. (2008). Acceptance of blog usage: The roles of technology acceptance, social
influence and knowledge sharing motivation. Information & Management, 45, 65-74 Jarvenpaa, Tractinsky, & Vitale. (2000). Consumer trust in an Internet store. Information
Technology and Management, 1(1-2), 45-71. Keefe, & Mceachern. (1998). Web-based customer decision support systems.
Communications of the ACM, 41(3), 71-78. Kelley. (1979). Personal Relationships: Their Structures and Processes. Hillsdale, NJ:
Lawrence Erlbaum Associates. King, & Balasubramanian. (1994). The effects of expertise, end goal, and product type on
adoption of preference formation strategy. Academy of Marketing Science, 22(2), 146–159.
Kobsa, Koenenmann, & Pohl. (2001). Personalized Hypermedia Presentation Techniques for Improving Online Customer Relationships. The Knowledge Engineering Review, 16(2), 111-155
Konstan. (2008 ). Introduction to recommender systems. In (Ed.), (pp. 1373-1374 ).
Vancouver, Canada. Konstan, et al. (1997). Grouplens: Applying Collaborative Filtering to Usenet News.
Communications of the ACM, 40(3), 77-87. Koufaris. (2002). Applying the Technology Acceptance Model and Flow Theory to Online
Consumer Behavior. Information Systems Research, 13(2), 205-223. Krulwich. (1997). LifeStyle Finder: Intelligent User Profiling Using Large-Scale
Demographic Data. AI Magazine, 18(2), 37-54. Lai, Liang, & Ku. (2003). Customized Internet news services based on customer profiles.
Paper presented at the 5th international conference on Electronic commerce. Lam, Frankowski, & Riedl. (2006). Do You Trust Your Recommendations? An Exploration
of Security and Privacy Issues in Recommender Systems. In (Ed.), (pp.). Freiburg, Germany.
Lee, & Lee. (2004). The effect of information overload on consumer choice quality in an on-line environment. Psychology & Marketing, 21(3), 159-183.
Liang. (2008). Recommendation systems for decision support: An editorial introduction. Decision Support Systems, 45, 385-386.
82
Liang, & Lai. (2002). Discovering User Interests from Web Browsing Behavior: An
Application to Internet News Services. Paper presented at the 35th Hawaii International Conference on System Sciences.
Liang, Lai, & Ku. (2007). Personalized Content Recommendation and User Satisfaction: Theoretical Synthesis and Empirical Findings. Management Information Systems,
23(3), 45-70. Liberman. (1995). Letizia: An Agent That Assists Web Browsing . Paper presented at the
International Joint Conference on Artificial Intelligence Linden, Smith, & York. (2003). Amazon.com Recommendations: Item-to-Item Collaborative
Filtering. IEEE Internet Computing, 7(1), 76 - 80 Luhmann. (1979). Trust and Power London John Wiley & Sons Maes, Guttman, & Moukas. (1999). Agents that buy and sell. Communications of the ACM,
42(3), 81-91.
Marakas, Johnson, & Clay. (2007). The evolving nature of the computer self-efficacy construct: an empirical investigation of measurement construction, reliability, and stability over time. JAIS, 8(1), 16-46.
Marakas, Yi, & Johnson. (1998). The Multilevel and Multifaceted Character of Computer
Self-Efficacy: Toward Clarification of the Construct and an Integrative Framework for Research Information System Research, 9(2), 126-163.
Marchewka, Liu, & Kostiwa. (2007). An Application of the UTAUT Model for Understanding Student Perceptions Using Course Management Software.
Communications of the IIMA, 7(2). Massa, & Bhattacharjee. (2004). Using trust in recommender systems: an experimental
analysis. Paper presented at the 2nd International Conference on Trust Management. Mathieson. (1991). Predicting User Intentions: Comparing the Technology Acceptance
Model with the Theory of Planned Behavior. Information Systems Research, 2(3), 173-191.
McKnight, Choudhury, & Kacmar. (2002). Developing and Validating Trust Measures for e-Commerce: An Integrative Typology. Information Systems Research, 13(3), 334-359.
Meteren, & Someren. (2000). Using content-based filtering for recommendation. Paper presented at the MLnet/ECML2000 Workshop.
Miller. (1976). Toward a New Psychology of Women. Boston: Beacon Press. Minton, & Schneider. (1980). Differential Psychology. Prospect Heights, IL: Waveland Press.
Montaner, López, & Rosa. (2003). A Taxonomy of Recommender Agents on the Internet Artificial Intelligence Review, 19(4), 285-330.
Moore, & Benbasat. (1991). Development of an Instrument to Measure the Perceptions of Adopting an Information Technology Innovation. Information Systems Research, 2(3),
192-222. Moorman, Deshpande, & Zaitnnan. (1993). Factors affecting trust in market research
relationships. Journal of Marketing 51(January), 81-101. Morita, & Shinoda. (1994). Information Filtering Based on User Behaviour Analysis and
Best Match Text Retrieval. In (Ed.), (pp. 272 - 281 ). Dublin, Ireland. Morris, & Venkatesh. (2000). Age Differences in Technology Adoption Decisions:
Implications for a Changing Workforce. Personnel Psychology, 53(2), 375-403.
83
Oard, & Kim. (1998). Implicit Feedback for Recommender Systems. Paper presented at the
AAAI Technical Report WS-98-08. Pazzani, & Billsus. (2007). Content-based recommendation systems. In P. Brusilovsky, A.
Kobsa & W. Nejdl (Eds.), The adaptive web: methods and strategies of web personalization (Vol. Lecture Notes in Computer Science, pp. 325-341). Berlin,
Heidelberg: Springer-Verlag. Reichheld, & Schefter. (2000). E-Loyalty: Your Secret Weapon on the Web. HARVARD
BUSINESS REVIEW, 105-113. Rempel, Holmes, & Zanna. (1985). Trust in close relationships. Journal of Personality and
Social Psychology, 49(1), 95-112. Resnick, Iacovou, Suchak, Bergstrom, & Riedl. (1994). Grouplens: An open architecture for
collaborative filtering of netnews. In (Ed.), (pp. 175-186). Resnick, & Varian. (1997). Recommender Systems. COMMUNICATIONS OF THE ACM,
40(3), 56-58. Rich. (1979). User modeling via stereotypes. Cognitive Science, 3, 329-354. Riecken. (1994). Agents that reduce work and information overload. Communications of the
ACM, 37(7), 31-40.
Rotter. (1971). Generalized expectancies for interpersonal trust. American Psychologist, 26(5), 443-452.
Salton, & Buckley. (1988). Term-weighting approaches in automatic text retrieval. Information Processing & Management, 24(5), 513-523.
Salton, & McGill. (1986). Introduction to Modern Information Retrieval New York: McGraw-Hill.
Sarwar, Karypis, Konstan, & Riedl. (2000). Analysis of recommendation algorithms for e-commerce. Paper presented at the ACM conference on Electronic commerce.
Sarwar, Karypis, Konstan, & Riedl. (2001). Item-Based Collaborative Filtering Recommendation Algorithms. Paper presented at the 10th International WWW Conference.
Schafer, Frankowski, Herlocker, & Sen. (2007). Collaborative filtering recommender
systems. In P. Brusilovsky, A. Kobsa & W. Nejdl (Eds.), The Adaptive Web: Methods and Strategies of Web Personalization (Vol. Lecture Notes in Computer Science, pp. 291-324). Berlin, Heidelberg: Springer-Verlag.
Schafer, Konstan, & Riedl. (2001). Recommender systems in e-commerce. Data Mining and
Knowledge Discovery, 5, 115-153. Shardanand, & Maes. (1995). Social information filtering: Algorithms for automating “word
of mouth.”. In (Ed.), (pp. 210-217). Sheehan. (1999). An investigation of gender differences in on-line privacy concerns and
resultant behaviors. Journal of Interactive Marketing, 13, 24-38. Stafford, Stafford, & Day. (2002). A Contingency Approach: The Effects of Spokesperson
Type and Service Type on Service Advertising Perceptions. Journal of Advertising, 31, 17-35.
Szajna. (1994). Software evaluation and choice: predictive evaluation of the Technology Acceptance Instrument. MIS Quarterly, 18(3), 319-324.
Taylor, & Todd. (1995a). Assessing IT Usage: The Role of Prior Experience. MIS Quarterly, 19(4), 561-570.
84
Taylor, & Todd. (1995b). Understanding Information Technology Usage: A Test of
Competing Models. Information Systems Research, 144-176. Terveen, & Hill. (2001). Beyond recommender systems: Helping people help each other In J.
M. Carroll (Ed.), HCI In the New Millennium (Vol. 46, pp. 487-509). New York: Addison-Wesley.
Thibaut, & Kelley. (1978). Interpersonal Relations: A Theory of Interdependence . New York John Wiley & Sons Inc.
Thompson, Higgins, & Howell. (1991). Personal computing: toward a conceptual model of utilization. MIS Quarterly, 15(1), 124-143.
Triandis. (1977). Interpersonal Behavior: Brooke/ Cole Monterey. Venkatesh. (2000). Determinants of Perceived Ease of Use: Integrating Control, Intrinsic
Motivation, and Emotion into the Technology Acceptance Model. Information Systems Research, 11(4), 342-365.
Venkatesh, & Davis. (1996). A Model of the Antecedents of Perceived Ease of Use: Development and Test. Decision Sciences, 27(3), 451-481.
Venkatesh, & Davis. (2000). A Theoretical Extension of the Technology Acceptance Model: Four Longitudinal Field Studies. Management Science, 46(2), 186-204.
Venkatesh, & Morris. (2000). Why Don't Men Ever Stop to Ask For Directions? Gender, Social Influence, and Their Role in Technology Acceptance and Usage Behavior. MIS Quarterly, 24(1), 115-139.
Venkatesh, Morris, & Ackerman. (2000). A Longitudinal Field Investigation of Gender
Differences in Individual Technology Adoption Decision Making Processes. Organizational Behavior and Human Decision Processes, 83 (1), 33-60.
Venkatesh, Morris, Davis, & Davis. (2003). USER ACCEPTANCE OF INFORMATION TECHNOLOGY: TOWARD A UNIFIED VIEW. MIS Quarterly, 27(3), 425-478.
Wang, & Benbasat. (2005). Trust in and Adoption of Online Recommendation Agents. Journal of the Association for Information Systems, 6(3), 72-101.
Wang, & Shao. (2004). Effective personalized recommendation based on time-framed navigation clustering and association mining. Expert Systems with Applications, 27,
365-377. West, et al. (1999). Agents to the Rescue? Marketing Letters, 10(3), 285-300. Wills, El-Gayar, & Bennett. (2008). EXAMINING HEALTHCARE PROFESSIONALS’
ACCEPTANCE OF ELECTRONIC MEDICAL RECORDS USING UTAUT. Issues
in Information Systems, 9(2), 396-401. Wixom, & Todd. (2005). A theoretical integration of user satisfaction and technology
acceptance. Information Systems Research, 16(1). Yuan, & Tsao. (2003). A recommendation mechanism for contextualized mobile advertising.
Expert Systems with Applications, 24, 399–414. Zanker, & Jannach. (2010). Introduction to Recommender Systems. Paper presented at the
25th ACM Symposium on Applied Computing. Zhang, & Seo. (2001). Personalized Web-Document Filtering Using Reinforcement Learning.
Applied Artificial Intelligence, 15(7), 665 - 685.