Embed Size (px)
Citation preview
ORIGINAL PAPER
Ant community structure on a small Pacific island:only one native species living with the invaders
Xim Cerda • Elena Angulo • Stephane Caut •
Franck Courchamp
Received: 27 October 2010 /Accepted: 14 July 2011! Springer Science+Business Media B.V. 2011
Abstract In most studies about ant communities,
species are grouped into competitive hierarchies wheretop dominants drive the majority of other species away
from resources. Nevertheless, in some ecosystems high
ground temperatures may disrupt this hierarchicalorganization. Other changes in community structure
are caused by the arrival of invasive ant species, whichrapidly disassemble local communities.We studied the
effects of competition and temperature on ant commu-
nity organization on Surprise Island (New Caledonia).Four different habitats were distinguished: a central
plain, a sea shore Argusia shrubland, a dense Scaveolashrub, and an arboreal Pisonia strata. Eight ant specieswere identified from pitfall traps (seven introduced
and only one native species, Pheidole oceanica).Ant assemblages in each habitat had a different
ecologically dominant species, and a dominant species
in one habitat could be non-dominant and less abun-dant in another. From interactions at baits, we built a
competitive hierarchy where the top dominant species
was the native Ph. oceanica. Daily foraging activityrhythms of the different species mostly overlapped.
The relationship between bait occupation and groundtemperature followed a negative linear pattern at all
sites and for most species, except for the relatively
thermophilous Monomorium floricola. Indices ofco-occurrence in pitfall traps indicated that species
co-occurred randomly with respect to one another.
Conversely, species appeared to be segregated whenwe examined co-occurrence at baits at the sites where
Ph. oceanica was abundant. Oceanic islands are very
susceptible to alien species, but on Surprise Island itseems that the sole native species dominates in some
habitats when confronted by invasive species.
Keywords Exotic species ! Biotic resistance !C-score ! Formicidae ! Pheidole oceanica !Surprise Island
Introduction
Oceanic islands may be regarded both as open skylaboratories for studying biological attributes of
species (Brandao and Paiva 1994), and as model
systems for understanding how biological invasionsaffect community structure and ecosystem function
Elena Angulo and Stephane Caut have contributed equally.
Electronic supplementary material The online version ofthis article (doi:10.1007/s10530-011-0065-0) containssupplementary material, which is available to authorized users.
X. Cerda (&) ! E. Angulo ! S. CautEstacion Biologica de Donana, Consejo Superiorde Investigaciones Cientıficas, Avda Americo Vespucio,41092 Sevilla, Spaine-mail: [email protected]
F. CourchampLab. Ecologie, Systematique and Evolution(UMR CNRS 8074), Bat. 362, Universite Paris Sud 11,91405 Orsay Cedex, France
123
Biol Invasions
DOI 10.1007/s10530-011-0065-0
(O’Dowd et al. 2003). Many examples illustrate theimpact of alien arthropods on native arthropods on
oceanic islands (Gillespie and Roderick 2002); indeed,
the success of alien species on oceanic islands isconsidered one of the classic observed patterns in
ecology (Herben 2005 and references therein). Ants
are among the most studied animals from islandecosystems and have frequently beenmodel organisms
in developing current ecological theory (MacArthur
and Wilson 1967; Simberloff 1969, 1976; Herben2005). Before human intervention, ants were relatively
poor dispersers across oceanic islands, but they have
evidently been introduced by human travel from nativeranges scattered throughout the Old and New Worlds
(Suarez et al. 2005; Ingram et al. 2006). Because of
their great success and ecological dominance, ants arealso among the worst invasive species, being partic-
ularly harmful in the island ecosystems (see examples
in Kenis et al. 2009). Pacific archipelagoes aboundwith ants of many species, but most of them have
evidently been introduced by humans (Wilson and
Taylor 1967a; Lester et al. 2009; Rizali et al. 2010) andare tramp species according to Passera’s (1994)
criterion: i.e., they are invasive species with a world-
wide distribution, small worker size, polygyny, omni-vory, and unicoloniality. A potential factor that
facilitates the invasion of oceanic islands is that many
of these tramp species can survive in very marginal orhighly disturbed habitats, and so can exist on relatively
small islands (Morrison 1996a, b).
Invasive ant species pose serious threats to com-munity structure and ecosystem function worldwide,
not only because they reduce biodiversity but also
because they rapidly disassemble communities and, asa result, alter community organization among the
species that persist (Sanders et al. 2003). While many
recent studies focus on how biodiversity may influ-ence susceptibility to invasion, much less attention
has been given to the importance of abiotic suitability.
At small spatial scales, abiotic variability seldomreceives attention as a factor influencing the commu-
nity’s vulnerability to invasion (Holway et al. 2002a;Menke and Holway 2006). This seems surprising
given that abiotic heterogeneity and species-level
differences in environmental tolerances are oftenemphasized as factors promoting coexistence among
interspecific competitors (Cerda et al. 1997, 1998;
Chesson and Huntly 1997; Menke and Holway 2006;Wittman et al. 2010). Interspecific competition has
long occupied a pre-eminent position among factorsaffecting composition and diversity of natural ant
communities (Fellers 1987; Andersen 1992; Cerda
et al. 1997; but see Ribas and Schoereder 2002;Andersen 2008). In very dissimilar environmental
conditions throughout different regions of the world,
strongly competitive ants behave similarly by exclud-ing other potential competitors from their territory and
reducing the foraging success of subordinate species
(Savolainen et al. 1989; Andersen 1992; Bestelmeyer2000; Lester et al. 2010). Otherwise, communities in
different regions would vary in the extent to which
specific invasive species establish, because of dispar-ities in the competitive ability of their constituent
species (Thomas and Holway 2005). However, few
ecological studies have attempted to test how thecompetitive ability of the resident biota might interact
with abiotic suitability to affect invasion success (but
see Holway et al. 2002a; Thomas and Holway 2005;Menke and Holway 2006; Menke et al. 2007).
The main objective of this study was to understand
the patterns of community organization on a verysmall Pacific island (Surprise Island, New Caledonia)
and how this structure could be affected by compe-
tition or abiotic environment (temperature). Theprevious history of ant communities on Surprise
Island is unknown, and we aimed to capture an
ecological snapshot of these communities. SurpriseIsland is an ideal location for this work because all but
one of the species are exotic, and, owing to its small
size, we could complete sample both the ant assem-blages and the entire environmental spectrum. The
specific objectives of this study were (1) to identify
ant assemblages and to estimate the importance ofnative and exotic species in the different habitats; (2)
to analyze the effects of temperature on foraging
ecology of the different ant species in these environ-ments; (3) to test how temperature (abiotic factor) and
competition (biotic factor) affected the ant community
structure on Surprise Island, and whether temperatureinfluenced the outcome of interspecific interactions.
Materials and methods
Study area
Surprise Island is an uninhabited coral atoll of 24 ha(400 9 800 m) belonging to the archipelago of
X. Cerda et al.
123
Entrecasteaux reef. It is situated in the Pacific Ocean130 miles (230 km) off the northern part of New
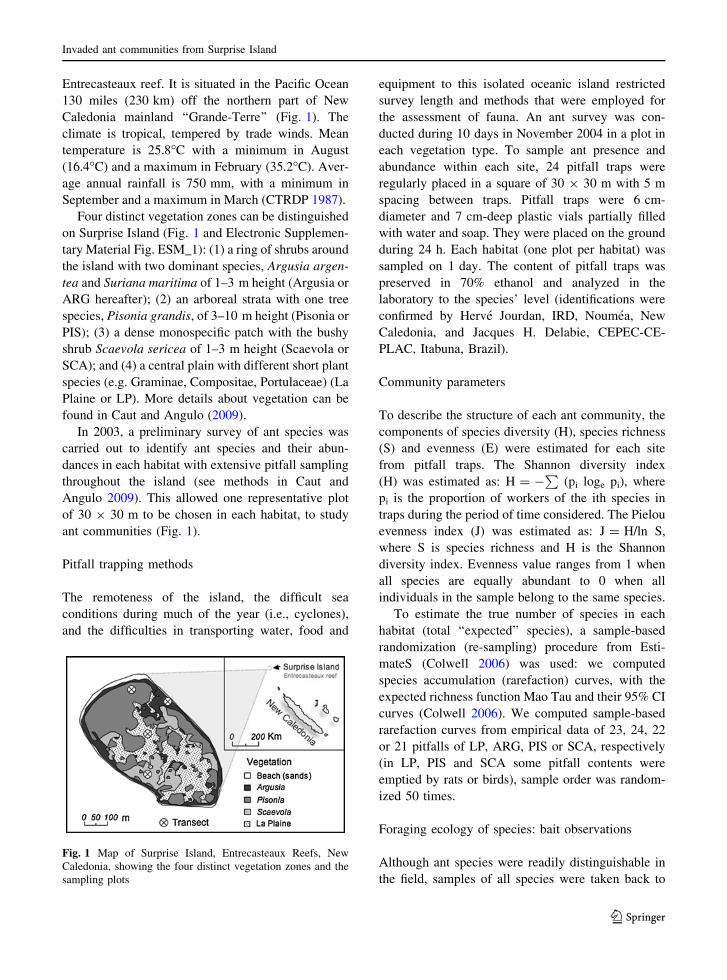
Caledonia mainland ‘‘Grande-Terre’’ (Fig. 1). The
climate is tropical, tempered by trade winds. Meantemperature is 25.8"C with a minimum in August
(16.4"C) and a maximum in February (35.2"C). Aver-age annual rainfall is 750 mm, with a minimum inSeptember and a maximum in March (CTRDP 1987).
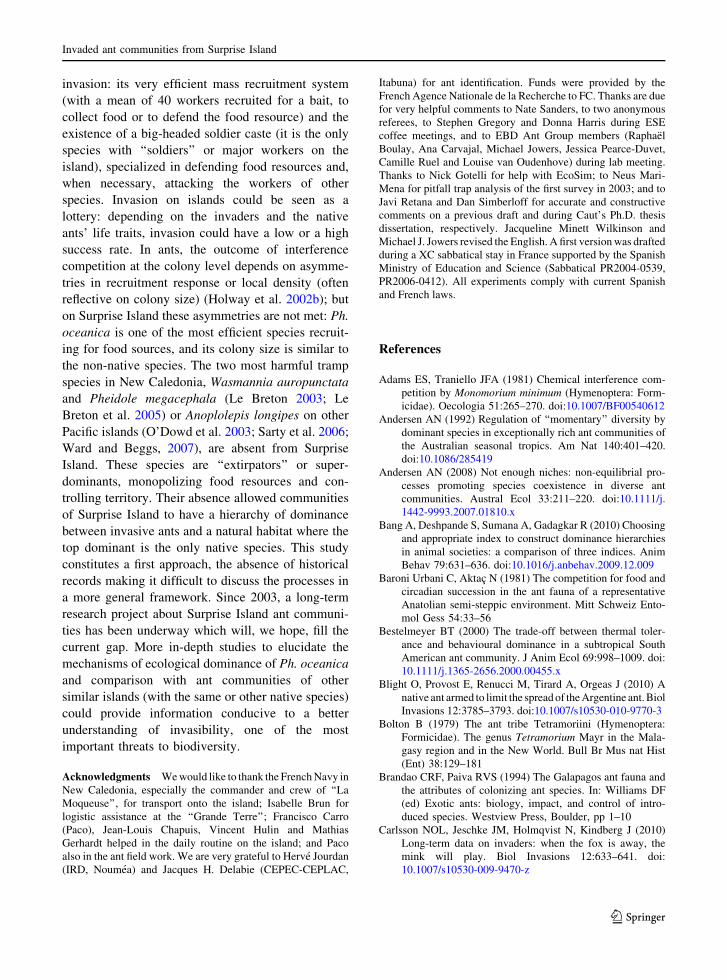
Four distinct vegetation zones can be distinguished
on Surprise Island (Fig. 1 and Electronic Supplemen-tary Material Fig. ESM_1): (1) a ring of shrubs around
the island with two dominant species, Argusia argen-tea and Suriana maritima of 1–3 m height (Argusia orARG hereafter); (2) an arboreal strata with one tree
species, Pisonia grandis, of 3–10 m height (Pisonia or
PIS); (3) a dense monospecific patch with the bushyshrub Scaevola sericea of 1–3 m height (Scaevola or
SCA); and (4) a central plain with different short plant
species (e.g. Graminae, Compositae, Portulaceae) (LaPlaine or LP). More details about vegetation can be
found in Caut and Angulo (2009).
In 2003, a preliminary survey of ant species wascarried out to identify ant species and their abun-
dances in each habitat with extensive pitfall sampling
throughout the island (see methods in Caut andAngulo 2009). This allowed one representative plot
of 30 9 30 m to be chosen in each habitat, to study
ant communities (Fig. 1).
Pitfall trapping methods
The remoteness of the island, the difficult sea
conditions during much of the year (i.e., cyclones),
and the difficulties in transporting water, food and
equipment to this isolated oceanic island restrictedsurvey length and methods that were employed for
the assessment of fauna. An ant survey was con-
ducted during 10 days in November 2004 in a plot ineach vegetation type. To sample ant presence and
abundance within each site, 24 pitfall traps were
regularly placed in a square of 30 9 30 m with 5 mspacing between traps. Pitfall traps were 6 cm-
diameter and 7 cm-deep plastic vials partially filled
with water and soap. They were placed on the groundduring 24 h. Each habitat (one plot per habitat) was
sampled on 1 day. The content of pitfall traps was
preserved in 70% ethanol and analyzed in thelaboratory to the species’ level (identifications were
confirmed by Herve Jourdan, IRD, Noumea, New
Caledonia, and Jacques H. Delabie, CEPEC-CE-PLAC, Itabuna, Brazil).
Community parameters
To describe the structure of each ant community, the
components of species diversity (H), species richness(S) and evenness (E) were estimated for each site
from pitfall traps. The Shannon diversity index
(H) was estimated as: H = -P
(pi loge pi), wherepi is the proportion of workers of the ith species in
traps during the period of time considered. The Pielou
evenness index (J) was estimated as: J = H/ln S,where S is species richness and H is the Shannon
diversity index. Evenness value ranges from 1 when
all species are equally abundant to 0 when allindividuals in the sample belong to the same species.
To estimate the true number of species in each
habitat (total ‘‘expected’’ species), a sample-basedrandomization (re-sampling) procedure from Esti-
mateS (Colwell 2006) was used: we computed
species accumulation (rarefaction) curves, with theexpected richness function Mao Tau and their 95% CI
curves (Colwell 2006). We computed sample-based
rarefaction curves from empirical data of 23, 24, 22or 21 pitfalls of LP, ARG, PIS or SCA, respectively
(in LP, PIS and SCA some pitfall contents wereemptied by rats or birds), sample order was random-
ized 50 times.
Foraging ecology of species: bait observations
Although ant species were readily distinguishable inthe field, samples of all species were taken back to
Fig. 1 Map of Surprise Island, Entrecasteaux Reefs, NewCaledonia, showing the four distinct vegetation zones and thesampling plots
Invaded ant communities from Surprise Island
123
the laboratory and sent to taxonomists to confirmidentification. Ant foraging activity was measured at
baits during the course of 1 day in each habitat. Baits
are an exceptionally rich food source useful toestablish the daily rhythms of species (Cros et al.
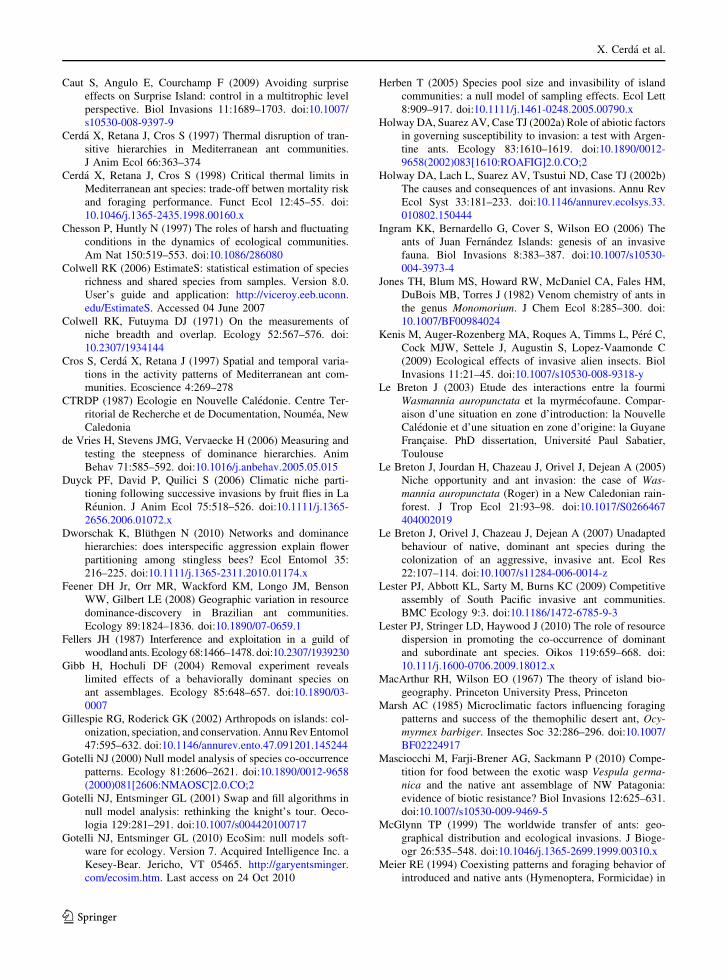
1997). Eighteen pairs of baits were laid regularly over
each study site. Baits were small plastic spoons withtwo different large food rewards (water-diluted honey
and peanut butter). Each pair of baits (honey and
peanut butter) was inside a box (transparent plasticcontainer, 19 9 15 9 7.5 cm) to prevent food con-
sumption by rats, which had four lateral holes to
allow ant access to food. The distance betweenspoons in the same box was 5-10 cm and the
distance between boxes was 1-10 m (Electronic
Supplementary Material, Fig. ESM_2). Baits wereinstalled at 05:00 a.m., and the first bait observation
was done at 06:00 a.m. (at least 30 min after bait
installation). Each hour from sunshine to sunset(06:00 a.m. until 18:00 p.m.), the number of workers
of each ant species feeding at each bait was recorded.
Nocturnal activity at baits was not studied to preventdisturbance to the chicks or fledglings of seabirds that
were in their nests (Surprise Island has an important
seabird population and our study was done during thebreeding season). The overall number of occupied
baits was used as a measurement of the external
activity of each species. Together with the hourlymeasurements of activity on baits, ground surface
temperatures near the baits were measured every
15 min with HOBO’s Data-Logger (two HOBO4-channel external logger with four external temper-
ature sensors were installed at each site). For each
bait record we assigned a temperature value from theclosest Data-Logger sensor and time. Distances
between bait and temperature sensor were between
0.3 and 5 m.To quantify patterns of species activity rhythms
similarity between each given pair of species, we
used a proportional similarity index (PSI) or Czeka-nowski’s index, based on Colwell and Futuyma
(1971) proportional overlap. It was calculatedbetween each species pair (species i and species j)
from hourly bait occupation (maximum bait occupa-
tion = 36, time: 13 different hours): PSIij =1-0.5
P|pik-phk| where pik is the number of baits
occupied by species i at the time k and phk is the bait
occupation of the species h at the same time k. ThePSI overlap measure takes its minimum value of 0
when both species do not overlap at all, and itsmaximum value of 1 when activity rhythms of the
two species are the same. To test whether foraging
activity rhythms were influenced by competitionwithin the habitats (i.e. whether species within the
habitats were segregating their activity rhythms) a
null model obtained from PSI values was applied foreach habitat; a second null model was done for the
whole island (with all habitats pooled). We calculated
the observed PSI average of each habitat (or of theisland) as the average of all PSI between the different
species pairs found in the habitat (or in the island).
Observed PSI average (PSIOBS) was compared to theaverage calculated from the randomized assemblages
(PSIEXP) using the RA2 randomization algorithm 2 of
the EcoSim niche overlap model (Gotelli andEntsminger 2010). We used the same procedure
described in Wittman et al. (2010) (1,000 iterations,
niche breadth = relaxed, zero states = retained),where details about randomization are given. In the
absence of interspecific competitive interactions, time
should be equally used by all species (RA2, resourcestate = equiprobable). A significantly smaller
observed PSI than randomized PSI implies interspe-
cific competition and resource (activity time in thiscase) partitioning, whereas a significantly larger
observed PSI might indicate shared resource utiliza-
tion and a lack of competition (Gotelli and Entsm-inger 2010).
To quantify patterns of species composition sim-
ilarity between each given pair of samples (bait vs.pitfall within sites, or between different pair of sites),
the Chao’s abundance-based Sørensen index (cor-
rected for unseen species) (ChSI hereafter) wascalculated by using the procedure from EstimateS
(Colwell 2006). The standard deviation of Chao’s
estimator for ChSI was calculated from 200 random-ized runs of data.
The position of each ant species in the dominance
hierarchy was determined by analyzing interspecificinteractions at baits, where species coexisting at the
same periods of the day interacted actively. Todetermine the relative dominance of a species, the
dominance index (DI) of each species was calculated
as the ratio of encounters won (i.e., it drove awayanother species) and total interspecific encounters
(Fellers 1987), there are many metrics for construct-
ing dominance hierarchies (see de Vries et al. 2006;Bang et al. 2010; Dworschak and Bluthgen 2010), but
X. Cerda et al.
123
this one is commonly used. To consider if the specieswon or lost, we analyzed which species was occupy-
ing the bait 1 h after the first encounter. All the
Surprise Island species are mass-recruiters that mayoccupy the baits during a long time period, which
excludes possible metrics biases due to different
foraging strategies. The cases in which the bait wasempty 1 h after the first encounter were not consid-
ered for calculations. If one or two species reappeared
2 h later (i.e. 1 h after the bait was ant free), it wasconsidered as a new bait occupation event.
Estimation of maximal activity temperatureand critical temperature
The maximal activity temperature (MAT) of eachspecies is the temperature at which the foraging
activity was greatest. It was estimated from field
observations on baits, MAT being the temperature atwhich the species occupied the maximum number of
baits across all habitats types. Bait data and temper-
ature records were analyzed to estimate the effect oftemperature on bait occupation for the most abundant
species in each habitat. Statistical models were fitted
with General Regression Models, GRM package fromStatistica 8.0 (StatSoft 2007).
The critical thermal maximum (CTM) was mea-
sured at the laboratory by means of an electricPlactronic Selecta hot plate with a 5–200"C temper-
ature range and 1"C accuracy. Following the Cerda
et al. (1998) protocol, only foragers of each species,i.e., workers collected outside the nest in the field,
were used in these experiments. Each ant was placed
on the surface of the hot plate in open containers withFluon-painted inner walls, which prevented ants
escaping. Each ant was exposed during 10 min to a
given temperature and its behaviour was noted. Afterthis test (thermal treatment), the individual was
discarded to avoid heat accumulation and a different
one was used. A total of twenty different individualsof each species were used for each temperature. For
each temperature, the number of ants that began tohave muscle spasms and died was noted. The
temperature of the hot plate was progressively raised
at intervals of 2"C, from 20 to 50"C (depending onthe thermal tolerance of each species) and new
individuals were used each time. The CTM of each
species was considered to be the temperature atwhich at least 50% of workers (10 individuals) died
or lost muscular coordination after 10 min of expo-sure (Cerda et al. 1998).
The difference between the CTM and MAT
temperatures (CTM–MAT) was calculated for eachspecies. This variable is an estimate of how close to
(low values) or far from (high values) risk temper-
atures (i.e., CTM) is the maximum foraging temper-ature of the species (i.e., MAT).
Native and invasive ant species: testingthe temperature effect on competition
The baits were checked every hour and the replace-ment of one species by another was noted. This
information was used to evaluate how each ant
species (native or introduced) interacted with theother species: in which situations each ant species
succeeded in replacing any other ant species (success)
and in which situations it was replaced by other antspecies (failure). We also analyzed whether the
success or failure of the native or introduced ants
was regulated by temperature. A generalised linearmodel per species (data from all habitats pooled) was
performed in which the success or failure was the
dependent variable and a binomial distribution and alogit link function were used. Two independent
variables were analyzed in separate analyses: tem-
perature during the hour of the replacement and thenumber of degrees temperature increased or
decreased during the hour when the replacement
occurred. Generalised Linear Models were performedwith the SAS package (GENMOD, v. 9.1.3., SAS
Institute Inc. 2004).
Quantifying species co-occurrence: testing
the competition hypothesis
The co-occurrence analysis tests whether the
observed pattern differs from the pattern expected
in the absence of the proposed mechanism, which inour case is interspecific competition. Separate matri-
ces at each sampled site were created to analyzespecies co-occurrence. Matrices were based on two
different sample lists of the species from each site
collected: (1) in 24 pitfall trap samples along 24 h;(2) in baits during 13 h. EcoSim software was used to
test for non-random patterns of species co-occurrence
in the original presence/absence matrix. This originalmatrix was randomized to create 5,000 random
Invaded ant communities from Surprise Island
123
matrices by reshuffling the elements of each row andcolumn of the matrix, with the option of fixed sums
for columns and rows (SIM9 simulation algorithm of
EcoSim; Gotelli 2000; Gotelli and Entsminger 2001,2010). A co-occurrence index, the Stone and Roberts’
(1990) C-score, was calculated from the original
matrix and compared to a frequency distributionproduced by the C-scores indices of the random
matrices. The C-score is an index negatively corre-
lated to species co-occurrence, and therefore in acompetitively structured community the C-score
should be significantly higher than that expected by
chance. If the C-score from the original matrix lieswithin the 95% frequency distribution of the ran-
domized matrices, there is no evidence for determin-
istic processes influencing species distribution,whereas, if the index is beyond the 95% confidence
limits of randomized matrices, there should be
biological mechanisms driving species co-occurrence(Ribas and Schoereder 2002). In the latter event,
original species co-occurrence may be higher or
lower than expected by random chance, and thebiological explanations for such results are that there
is less pairwise species co-occurrence (segregation)
or more species co-occurrence (aggregation) than
expected by chance, respectively (Sanders et al.2003). Tail probabilities (two-tailed test) of the
observed matrix were estimated by comparing it
with the histogram of simulated values.
Results
Species composition and community parameters
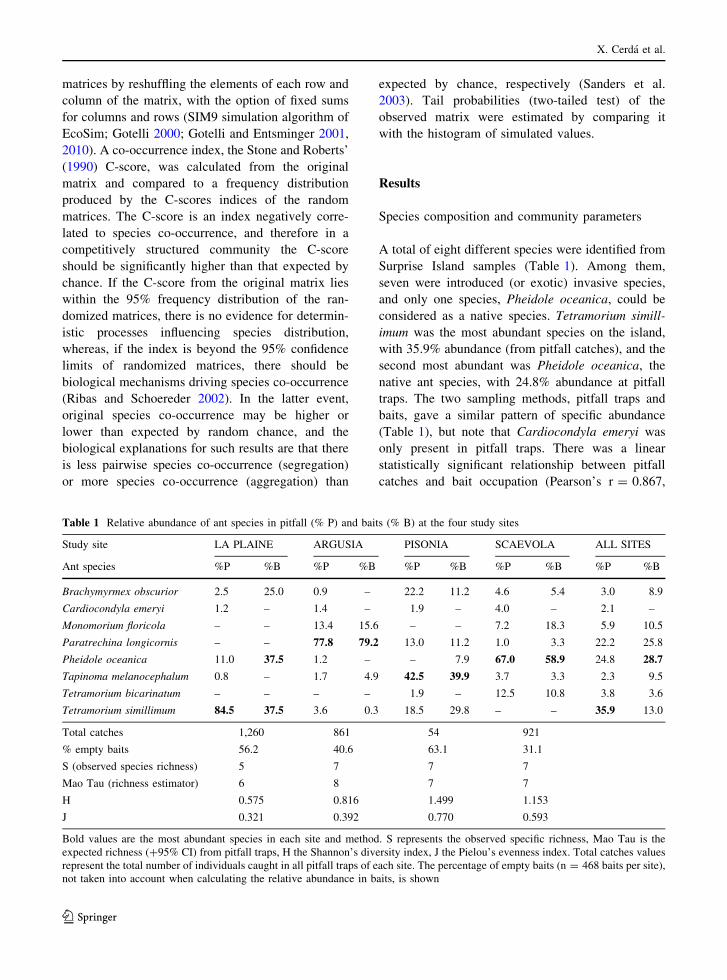
A total of eight different species were identified from
Surprise Island samples (Table 1). Among them,
seven were introduced (or exotic) invasive species,and only one species, Pheidole oceanica, could be
considered as a native species. Tetramorium simill-imum was the most abundant species on the island,with 35.9% abundance (from pitfall catches), and the
second most abundant was Pheidole oceanica, thenative ant species, with 24.8% abundance at pitfalltraps. The two sampling methods, pitfall traps and
baits, gave a similar pattern of specific abundance
(Table 1), but note that Cardiocondyla emeryi wasonly present in pitfall traps. There was a linear
statistically significant relationship between pitfall
catches and bait occupation (Pearson’s r = 0.867,
Table 1 Relative abundance of ant species in pitfall (% P) and baits (% B) at the four study sites
Study site LA PLAINE ARGUSIA PISONIA SCAEVOLA ALL SITES
Ant species %P %B %P %B %P %B %P %B %P %B
Brachymyrmex obscurior 2.5 25.0 0.9 – 22.2 11.2 4.6 5.4 3.0 8.9
Cardiocondyla emeryi 1.2 – 1.4 – 1.9 – 4.0 – 2.1 –
Monomorium floricola – – 13.4 15.6 – – 7.2 18.3 5.9 10.5
Paratrechina longicornis – – 77.8 79.2 13.0 11.2 1.0 3.3 22.2 25.8
Pheidole oceanica 11.0 37.5 1.2 – – 7.9 67.0 58.9 24.8 28.7
Tapinoma melanocephalum 0.8 – 1.7 4.9 42.5 39.9 3.7 3.3 2.3 9.5
Tetramorium bicarinatum – – – – 1.9 – 12.5 10.8 3.8 3.6
Tetramorium simillimum 84.5 37.5 3.6 0.3 18.5 29.8 – – 35.9 13.0
Total catches 1,260 861 54 921
% empty baits 56.2 40.6 63.1 31.1
S (observed species richness) 5 7 7 7
Mao Tau (richness estimator) 6 8 7 7
H 0.575 0.816 1.499 1.153
J 0.321 0.392 0.770 0.593
Bold values are the most abundant species in each site and method. S represents the observed specific richness, Mao Tau is theexpected richness (?95% CI) from pitfall traps, H the Shannon’s diversity index, J the Pielou’s evenness index. Total catches valuesrepresent the total number of individuals caught in all pitfall traps of each site. The percentage of empty baits (n = 468 baits per site),not taken into account when calculating the relative abundance in baits, is shown
X. Cerda et al.
123
P\ 0.001). Not all species were present at all sites;we did not find all eight species in every habitat: the
poorest habitat was LP, with only five species, while
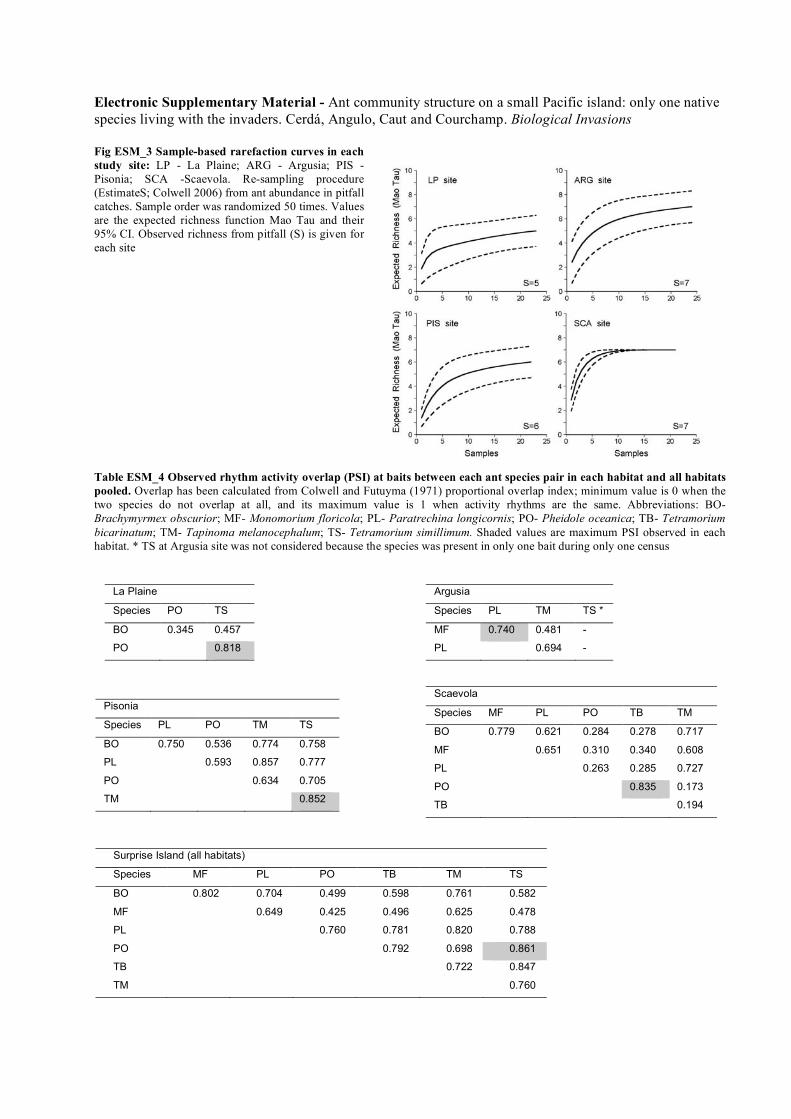
the other three habitats, PIS, SCA and ARG each hadseven species. However, Mao Tau expected richness
including the upper 95% CI showed higher values
than observed in all habitats (expected vs. observedspecies: LP, 6 vs. 5; ARG, 8 vs. 7; PIS, 7 vs. 6
species) except Scaevola (SCA, 7 vs. 7 species)
(Table 1 and Electronic Supplementary Material, Fig.ESM_3). Shannon Diversity (H) and Pielou Evenness
(J) indexes also showed great variability, PIS being
the most diverse habitat, and LP the least diversehabitat (Table 1). Total catches at pitfall traps gave
us an idea of ant abundances in each habitat: the
lowest value was in PIS, with only 54 individualscollected (after 24 h), while the highest was that of
LP, with 1,260 individuals for the same trap period.
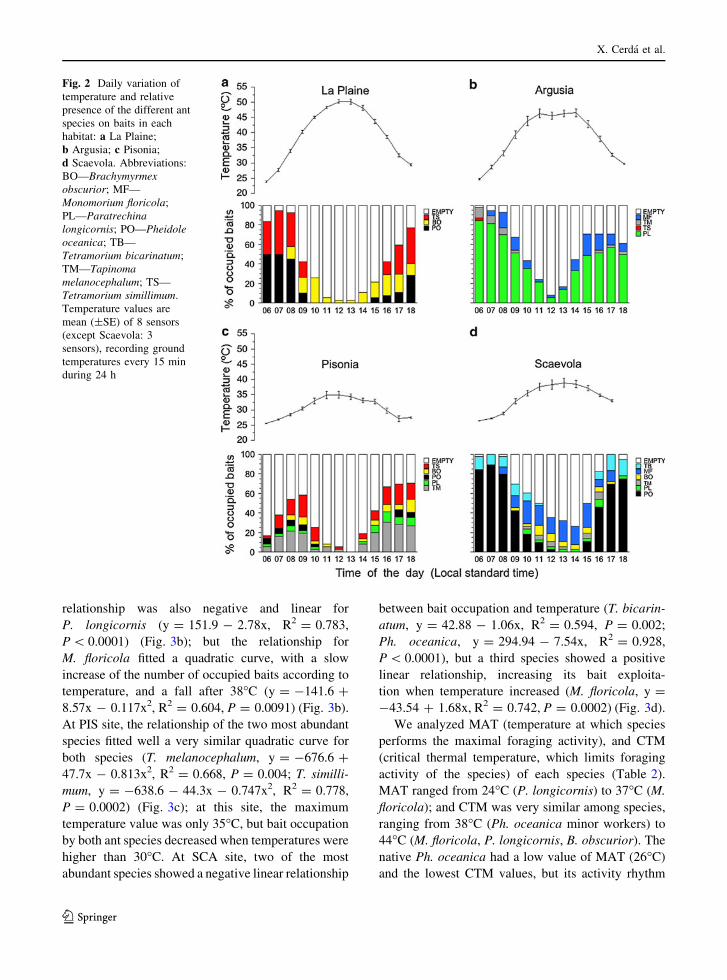
Daily activity patterns and foraging strategies
Foraging activity rhythms were measured to estimatethe foraging overlap between species. Notwithstand-
ing, daily activity patterns of all species studied were
very similar (Fig. 2): a bimodal curve with two peaks,one after sunrise and another during the afternoon, and
a stop or low activity level during the hottest central
hours of the day. The only exception was Monomo-rium floricola in the SCA site, which had the
maximum values of bait occupation between 10 and
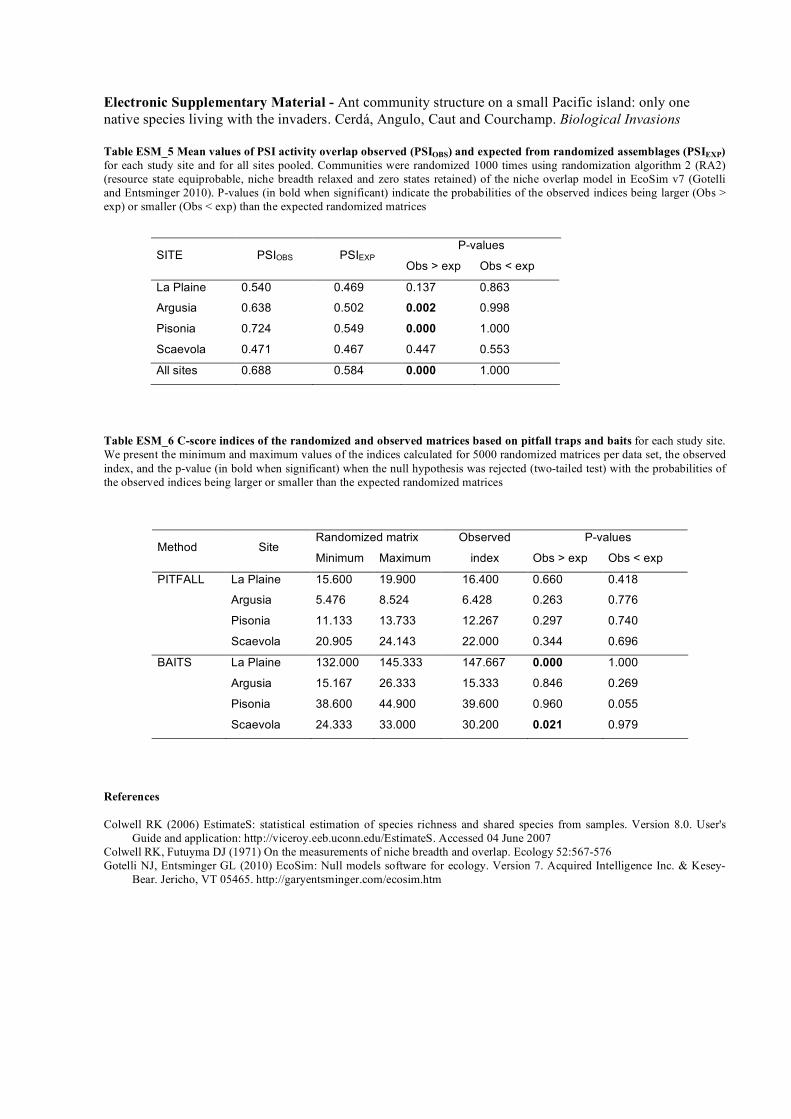
15 h, during the central hours of the day (Fig. 2d).Activity rhythm overlap between species pairs (PSI)
ranged between 0.86 (high similarity) and 0.17 (low
similarity), but 58% of values of the 31 species pairsconsidered had PSI values higher than 0.60, showing a
high degree of similarity between species activity
rhythms. The observed PSI averages were larger thanexpected by chance (than the PSI generated from the
null assemblages) in two sites, ARG and PIS (PSIOBS[ PSIEXP, P = 0.002 and P\ 0.0001, respectively),indicating that species shared the time of day in which
they were active; and were not significantly differentfrom randomness in the other two sites, LP and SCA
(additional details are given in Electronic Supple-
mentary Material, Tables ESM_4 and ESM_5). Whenrhythm overlap between species pairs was considered
at the island level (all habitats pooled), observed PSI
averages were larger than the PSI generated from thenull assemblages (PSIOBS[ PSIEXP, P\ 0.0001,
Electronic Supplementary Material, Table ESM_5),indicating that species were generally active at similar
times of day, considering the island as a whole.
Activity patterns were linked to daily temperaturevalues that varied according to vegetation (% of canopy
cover). Temperature showed great daily variability in
themore open habitats (between 22 and60"C inLP; and22 and 59"C in ARG), and less variability in the closed
habitats (between 25 and 45"C in PIS; and 26 and 46"CinSCA) (Fig. 2). Therewas a significant linear negativerelationship between bait occupation in each habitat
and temperature (LP: R2 = 0.904, P\ 0.0001; ARG:
R2 = 0.692, P = 0.0004; PIS: R2 = 0.388, P = 0.02;SCA: R2 = 0.809, P\ 0.0001). At higher tempera-
tures, there were more empty baits at all sites.
Baits also provided information about speciesforaging strategies during food collection. Concern-
ing bait occupation at the species-level, the highest
value of the mean number of workers per bait(Table 2) was that of T. simillimum (45.8 workers per
bait), followed by Ph. oceanica (40 workers per bait).
When the percentage of baits occupied by more than50 workers (as another measure of worker recruit-
ment efficiency) was considered, T. simillimum had
the highest value, with 28.9% of baits with more than50 workers, while Ph. oceanica was the second, with
27.1% of baits (Table 2). For both measures, both
species were the most efficient bait users; the third-ranked bait-user was P. longicornis, with a mean
value of 25 workers per bait and 7.7% of baits with
more than 50 workers. Although the other speciesrecruited fewer workers (mean values from 8 to 14
workers per bait), they were able to recruit 50
workers to the bait, but they did so only rarely(between 0.9 and 3.0% of baits). According to these
values, all species were mass-recruiters.
Temperature and bait exploitation
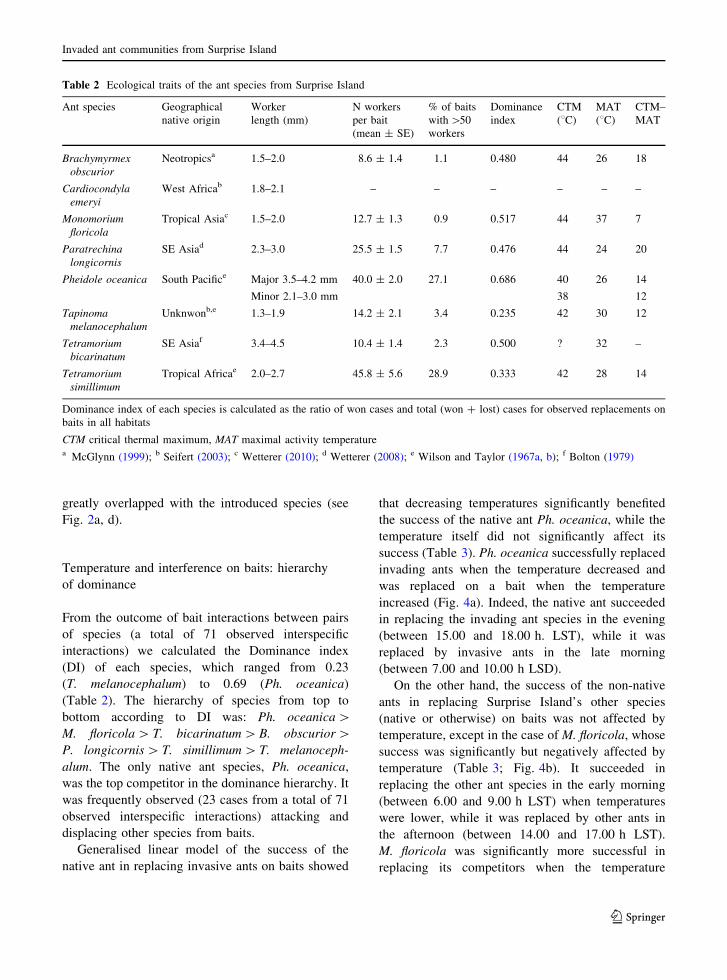
Differences in bait exploitation could be due todifferent specific thermal requirements. Firstly, we
analyzed the effect of temperature on bait occupationfor the most abundant species in each habitat. At LP
site, the relationship between ant presence on baits
and temperature of the two most abundant speciesfollowed a very similar negative linear pattern
(T. simillimum, y = 86.88 - 1.80x, R2 = 0.887,
P\ 0.0001; Ph. oceanica, y = 92.38 - 1.94x, R2 =0.779, P\ 0.0001) (Fig. 3a). At ARG site, the
Invaded ant communities from Surprise Island
123
relationship was also negative and linear for
P. longicornis (y = 151.9 - 2.78x, R2 = 0.783,P\ 0.0001) (Fig. 3b); but the relationship for
M. floricola fitted a quadratic curve, with a slow
increase of the number of occupied baits according totemperature, and a fall after 38"C (y = -141.6 ?
8.57x - 0.117x2, R2 = 0.604, P = 0.0091) (Fig. 3b).
At PIS site, the relationship of the two most abundantspecies fitted well a very similar quadratic curve for
both species (T. melanocephalum, y = -676.6 ?
47.7x - 0.813x2, R2 = 0.668, P = 0.004; T. similli-mum, y = -638.6 - 44.3x - 0.747x2, R2 = 0.778,
P = 0.0002) (Fig. 3c); at this site, the maximum
temperature value was only 35"C, but bait occupationby both ant species decreased when temperatures were
higher than 30"C. At SCA site, two of the most
abundant species showed a negative linear relationship
between bait occupation and temperature (T. bicarin-atum, y = 42.88 - 1.06x, R2 = 0.594, P = 0.002;Ph. oceanica, y = 294.94 - 7.54x, R2 = 0.928,
P\ 0.0001), but a third species showed a positive
linear relationship, increasing its bait exploita-tion when temperature increased (M. floricola, y =
-43.54 ? 1.68x, R2 = 0.742, P = 0.0002) (Fig. 3d).
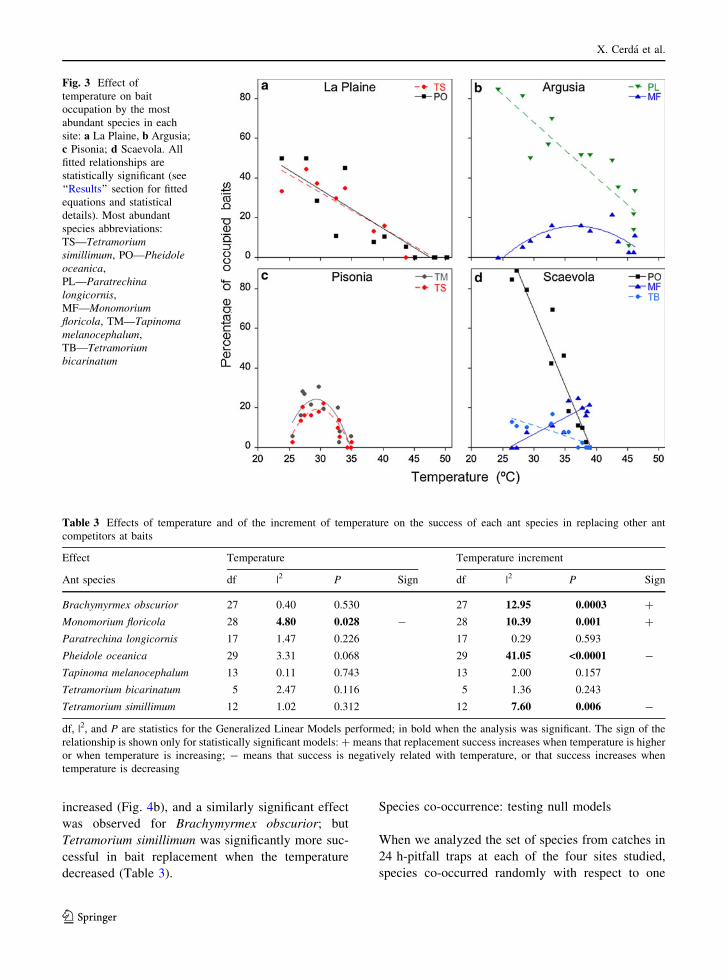
We analyzed MAT (temperature at which speciesperforms the maximal foraging activity), and CTM
(critical thermal temperature, which limits foraging
activity of the species) of each species (Table 2).MAT ranged from 24"C (P. longicornis) to 37"C (M.floricola); and CTM was very similar among species,
ranging from 38"C (Ph. oceanica minor workers) to44"C (M. floricola, P. longicornis, B. obscurior). Thenative Ph. oceanica had a low value of MAT (26"C)and the lowest CTM values, but its activity rhythm
Fig. 2 Daily variation oftemperature and relativepresence of the different antspecies on baits in eachhabitat: a La Plaine;b Argusia; c Pisonia;d Scaevola. Abbreviations:BO—Brachymyrmexobscurior; MF—Monomorium floricola;PL—Paratrechinalongicornis; PO—Pheidoleoceanica; TB—Tetramorium bicarinatum;TM—Tapinomamelanocephalum; TS—Tetramorium simillimum.Temperature values aremean (±SE) of 8 sensors(except Scaevola: 3sensors), recording groundtemperatures every 15 minduring 24 h
X. Cerda et al.
123
greatly overlapped with the introduced species (seeFig. 2a, d).
Temperature and interference on baits: hierarchyof dominance
From the outcome of bait interactions between pairsof species (a total of 71 observed interspecific
interactions) we calculated the Dominance index
(DI) of each species, which ranged from 0.23(T. melanocephalum) to 0.69 (Ph. oceanica)(Table 2). The hierarchy of species from top to
bottom according to DI was: Ph. oceanica[M. floricola[ T. bicarinatum[B. obscurior[P. longicornis[T. simillimum[ T. melanoceph-alum. The only native ant species, Ph. oceanica,was the top competitor in the dominance hierarchy. It
was frequently observed (23 cases from a total of 71
observed interspecific interactions) attacking anddisplacing other species from baits.
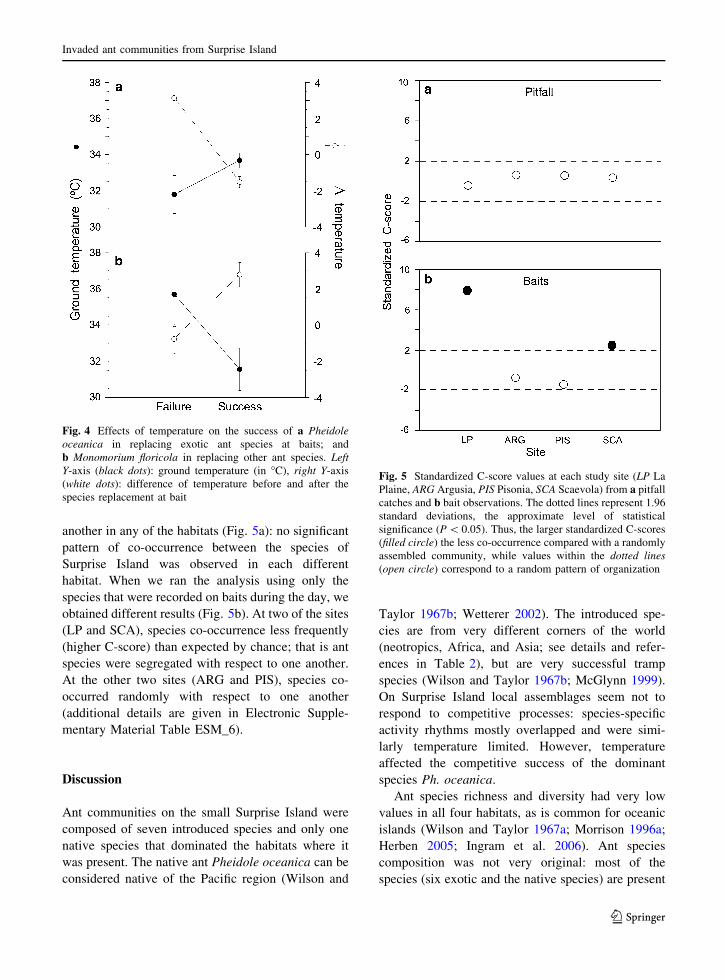
Generalised linear model of the success of the
native ant in replacing invasive ants on baits showed
that decreasing temperatures significantly benefitedthe success of the native ant Ph. oceanica, while the
temperature itself did not significantly affect its
success (Table 3). Ph. oceanica successfully replacedinvading ants when the temperature decreased and
was replaced on a bait when the temperature
increased (Fig. 4a). Indeed, the native ant succeededin replacing the invading ant species in the evening
(between 15.00 and 18.00 h. LST), while it was
replaced by invasive ants in the late morning(between 7.00 and 10.00 h LSD).
On the other hand, the success of the non-native
ants in replacing Surprise Island’s other species(native or otherwise) on baits was not affected by
temperature, except in the case of M. floricola, whosesuccess was significantly but negatively affected bytemperature (Table 3; Fig. 4b). It succeeded in
replacing the other ant species in the early morning
(between 6.00 and 9.00 h LST) when temperatureswere lower, while it was replaced by other ants in
the afternoon (between 14.00 and 17.00 h LST).
M. floricola was significantly more successful inreplacing its competitors when the temperature
Table 2 Ecological traits of the ant species from Surprise Island
Ant species Geographicalnative origin
Workerlength (mm)
N workersper bait(mean ± SE)
% of baitswith[50workers
Dominanceindex
CTM(8C)
MAT(8C)
CTM–MAT
Brachymyrmexobscurior
Neotropicsa 1.5–2.0 8.6 ± 1.4 1.1 0.480 44 26 18
Cardiocondylaemeryi
West Africab 1.8–2.1 – – – – – –
Monomoriumfloricola
Tropical Asiac 1.5–2.0 12.7 ± 1.3 0.9 0.517 44 37 7
Paratrechinalongicornis
SE Asiad 2.3–3.0 25.5 ± 1.5 7.7 0.476 44 24 20
Pheidole oceanica South Pacifice Major 3.5–4.2 mm
Minor 2.1–3.0 mm
40.0 ± 2.0 27.1 0.686 40
38
26 14
12
Tapinomamelanocephalum
Unknwonb,e 1.3–1.9 14.2 ± 2.1 3.4 0.235 42 30 12
Tetramoriumbicarinatum
SE Asiaf 3.4–4.5 10.4 ± 1.4 2.3 0.500 ? 32 –
Tetramoriumsimillimum
Tropical Africae 2.0–2.7 45.8 ± 5.6 28.9 0.333 42 28 14
Dominance index of each species is calculated as the ratio of won cases and total (won ? lost) cases for observed replacements onbaits in all habitats
CTM critical thermal maximum, MAT maximal activity temperaturea McGlynn (1999); b Seifert (2003); c Wetterer (2010); d Wetterer (2008); e Wilson and Taylor (1967a, b); f Bolton (1979)
Invaded ant communities from Surprise Island
123
increased (Fig. 4b), and a similarly significant effectwas observed for Brachymyrmex obscurior; but
Tetramorium simillimum was significantly more suc-
cessful in bait replacement when the temperaturedecreased (Table 3).
Species co-occurrence: testing null models
When we analyzed the set of species from catches in24 h-pitfall traps at each of the four sites studied,
species co-occurred randomly with respect to one
Table 3 Effects of temperature and of the increment of temperature on the success of each ant species in replacing other antcompetitors at baits
Effect Temperature Temperature increment
Ant species df |2 P Sign df |2 P Sign
Brachymyrmex obscurior 27 0.40 0.530 27 12.95 0.0003 ?
Monomorium floricola 28 4.80 0.028 - 28 10.39 0.001 ?
Paratrechina longicornis 17 1.47 0.226 17 0.29 0.593
Pheidole oceanica 29 3.31 0.068 29 41.05 <0.0001 -
Tapinoma melanocephalum 13 0.11 0.743 13 2.00 0.157
Tetramorium bicarinatum 5 2.47 0.116 5 1.36 0.243
Tetramorium simillimum 12 1.02 0.312 12 7.60 0.006 -
df, |2, and P are statistics for the Generalized Linear Models performed; in bold when the analysis was significant. The sign of therelationship is shown only for statistically significant models: ? means that replacement success increases when temperature is higheror when temperature is increasing; - means that success is negatively related with temperature, or that success increases whentemperature is decreasing
Fig. 3 Effect oftemperature on baitoccupation by the mostabundant species in eachsite: a La Plaine, b Argusia;c Pisonia; d Scaevola. Allfitted relationships arestatistically significant (see‘‘Results’’ section for fittedequations and statisticaldetails). Most abundantspecies abbreviations:TS—Tetramoriumsimillimum, PO—Pheidoleoceanica,PL—Paratrechinalongicornis,MF—Monomoriumfloricola, TM—Tapinomamelanocephalum,TB—Tetramoriumbicarinatum
X. Cerda et al.
123
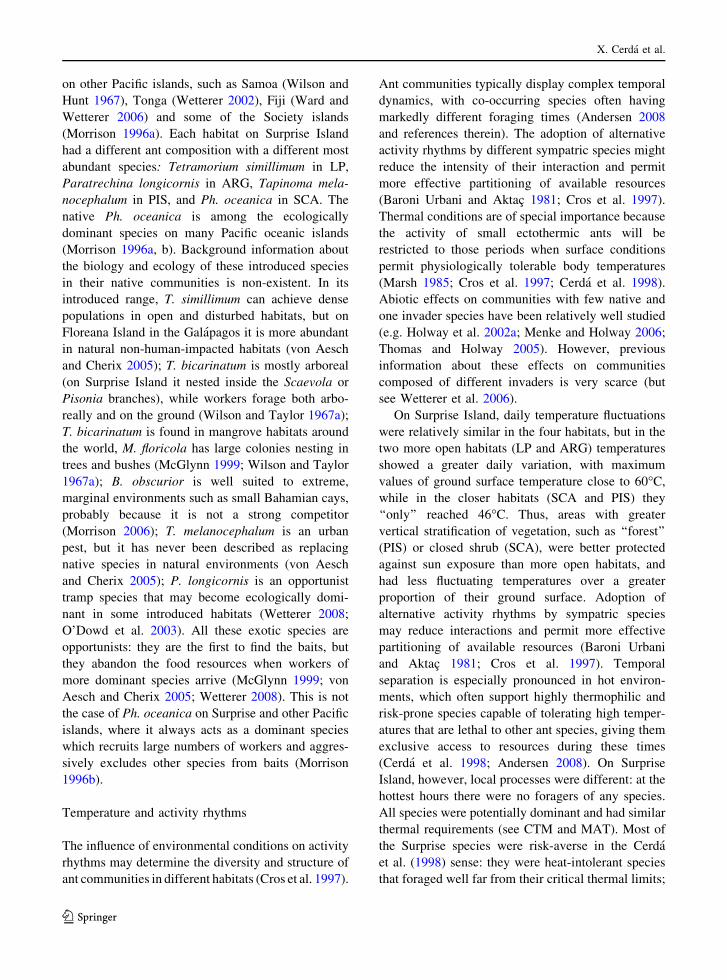
another in any of the habitats (Fig. 5a): no significant
pattern of co-occurrence between the species of
Surprise Island was observed in each differenthabitat. When we ran the analysis using only the
species that were recorded on baits during the day, we
obtained different results (Fig. 5b). At two of the sites(LP and SCA), species co-occurrence less frequently
(higher C-score) than expected by chance; that is ant
species were segregated with respect to one another.At the other two sites (ARG and PIS), species co-
occurred randomly with respect to one another
(additional details are given in Electronic Supple-mentary Material Table ESM_6).
Discussion
Ant communities on the small Surprise Island were
composed of seven introduced species and only one
native species that dominated the habitats where itwas present. The native ant Pheidole oceanica can be
considered native of the Pacific region (Wilson and
Taylor 1967b; Wetterer 2002). The introduced spe-
cies are from very different corners of the world(neotropics, Africa, and Asia; see details and refer-
ences in Table 2), but are very successful tramp
species (Wilson and Taylor 1967b; McGlynn 1999).On Surprise Island local assemblages seem not to
respond to competitive processes: species-specific
activity rhythms mostly overlapped and were simi-larly temperature limited. However, temperature
affected the competitive success of the dominant
species Ph. oceanica.Ant species richness and diversity had very low
values in all four habitats, as is common for oceanic
islands (Wilson and Taylor 1967a; Morrison 1996a;Herben 2005; Ingram et al. 2006). Ant species
composition was not very original: most of the
species (six exotic and the native species) are present
Fig. 4 Effects of temperature on the success of a Pheidoleoceanica in replacing exotic ant species at baits; andb Monomorium floricola in replacing other ant species. LeftY-axis (black dots): ground temperature (in "C), right Y-axis(white dots): difference of temperature before and after thespecies replacement at bait
Fig. 5 Standardized C-score values at each study site (LP LaPlaine, ARG Argusia, PIS Pisonia, SCA Scaevola) from a pitfallcatches and b bait observations. The dotted lines represent 1.96standard deviations, the approximate level of statisticalsignificance (P\ 0.05). Thus, the larger standardized C-scores(filled circle) the less co-occurrence compared with a randomlyassembled community, while values within the dotted lines(open circle) correspond to a random pattern of organization
Invaded ant communities from Surprise Island
123
on other Pacific islands, such as Samoa (Wilson andHunt 1967), Tonga (Wetterer 2002), Fiji (Ward and
Wetterer 2006) and some of the Society islands
(Morrison 1996a). Each habitat on Surprise Islandhad a different ant composition with a different most
abundant species: Tetramorium simillimum in LP,
Paratrechina longicornis in ARG, Tapinoma mela-nocephalum in PIS, and Ph. oceanica in SCA. The
native Ph. oceanica is among the ecologically
dominant species on many Pacific oceanic islands(Morrison 1996a, b). Background information about
the biology and ecology of these introduced species
in their native communities is non-existent. In itsintroduced range, T. simillimum can achieve dense
populations in open and disturbed habitats, but on
Floreana Island in the Galapagos it is more abundantin natural non-human-impacted habitats (von Aesch
and Cherix 2005); T. bicarinatum is mostly arboreal
(on Surprise Island it nested inside the Scaevola orPisonia branches), while workers forage both arbo-
really and on the ground (Wilson and Taylor 1967a);
T. bicarinatum is found in mangrove habitats aroundthe world, M. floricola has large colonies nesting in
trees and bushes (McGlynn 1999; Wilson and Taylor
1967a); B. obscurior is well suited to extreme,marginal environments such as small Bahamian cays,
probably because it is not a strong competitor
(Morrison 2006); T. melanocephalum is an urbanpest, but it has never been described as replacing
native species in natural environments (von Aesch
and Cherix 2005); P. longicornis is an opportunisttramp species that may become ecologically domi-
nant in some introduced habitats (Wetterer 2008;
O’Dowd et al. 2003). All these exotic species areopportunists: they are the first to find the baits, but
they abandon the food resources when workers of
more dominant species arrive (McGlynn 1999; vonAesch and Cherix 2005; Wetterer 2008). This is not
the case of Ph. oceanica on Surprise and other Pacific
islands, where it always acts as a dominant specieswhich recruits large numbers of workers and aggres-
sively excludes other species from baits (Morrison1996b).
Temperature and activity rhythms
The influence of environmental conditions on activity
rhythms may determine the diversity and structure ofant communities in different habitats (Cros et al. 1997).
Ant communities typically display complex temporaldynamics, with co-occurring species often having
markedly different foraging times (Andersen 2008
and references therein). The adoption of alternativeactivity rhythms by different sympatric species might
reduce the intensity of their interaction and permit
more effective partitioning of available resources(Baroni Urbani and Aktac 1981; Cros et al. 1997).
Thermal conditions are of special importance because
the activity of small ectothermic ants will berestricted to those periods when surface conditions
permit physiologically tolerable body temperatures
(Marsh 1985; Cros et al. 1997; Cerda et al. 1998).Abiotic effects on communities with few native and
one invader species have been relatively well studied
(e.g. Holway et al. 2002a; Menke and Holway 2006;Thomas and Holway 2005). However, previous
information about these effects on communities
composed of different invaders is very scarce (butsee Wetterer et al. 2006).
On Surprise Island, daily temperature fluctuations
were relatively similar in the four habitats, but in thetwo more open habitats (LP and ARG) temperatures
showed a greater daily variation, with maximum
values of ground surface temperature close to 60"C,while in the closer habitats (SCA and PIS) they
‘‘only’’ reached 46"C. Thus, areas with greater
vertical stratification of vegetation, such as ‘‘forest’’(PIS) or closed shrub (SCA), were better protected
against sun exposure than more open habitats, and
had less fluctuating temperatures over a greaterproportion of their ground surface. Adoption of
alternative activity rhythms by sympatric species
may reduce interactions and permit more effectivepartitioning of available resources (Baroni Urbani
and Aktac 1981; Cros et al. 1997). Temporal
separation is especially pronounced in hot environ-ments, which often support highly thermophilic and
risk-prone species capable of tolerating high temper-
atures that are lethal to other ant species, giving themexclusive access to resources during these times
(Cerda et al. 1998; Andersen 2008). On SurpriseIsland, however, local processes were different: at the
hottest hours there were no foragers of any species.
All species were potentially dominant and had similarthermal requirements (see CTM and MAT). Most of
the Surprise species were risk-averse in the Cerda
et al. (1998) sense: they were heat-intolerant speciesthat foraged well far from their critical thermal limits;
X. Cerda et al.
123
their MAT values were between 24 and 30"C (groundsurface temperatures), and differences CTM–MAT
varied between 12 and 20"C. The only exception was
Monomorium floricola, which had a higher MATvalue (37"C) and a lower CTM–MAT difference
(only 7"C). However, its relative thermophyly was
not sufficient to consider a temporal partitioning offood exploitation: 65% of values of activity rhythm
overlap between species pairs (PSI) were higher than
0.60, showing a high degree of similarity betweenSurprise species activity rhythms.
Temperature and competition: effectson dominance
Ant species have been grouped into competitivehierarchies based mainly on behavioural differences
in communication and aggressiveness (Savolainen
and Vepsalainen 1988; Savolainen et al. 1989; Cerdaet al. 1997; Bestelmeyer 2000): behaviourally dom-
inant species are highly aggressive and subordinates
are less aggressive. Each ant community fromSurprise Island had a different dominant species,
but the same species that was dominant in one habitat
(because it won on interspecific interactions at baits)was dominated (it lost at bait interactions) in another
habitat (we use the term dominated because it is only
locally or temporally subordinate). Many studiesfocus their attention on the role of dominant species
in communities (Savolainen and Vepsalainen 1988;
Gibb and Hochuli 2004; Parr 2008). However, anyspecies that is abundant and tends to win competitive
interactions with other species could be considered
locally dominant. In all Surprise Island habitats, thespecies most represented at baits was the most
abundant (abundance in pitfall catches). It could be
considered a mosaic-like pattern, but the mosaicconcept, according to Room (1971) is defined as the
distribution of dominant ant species in patches, with
mutually exclusive territories that do not overlap.This was not the case for the Surprise communities,
because there was no mutual exclusion betweenlocally dominant species.
The relationship between bait occupation and
temperature on Surprise Island was chiefly linearlynegative, although quadratic for some species. When
temperature was higher than 35"C, most baits (ca.
80%) were empty. The only exception was Paratre-china longicornis at ARG site, which at a ground
surface temperature of 45"C was present on 33% ofbaits, although it occupied baits in the shade or very
close to vegetation. Another case of relative thermo-
phyly was Monomorium floricola at SCA site: itspresence on baits increased linearly with temperature,
but it achieved no more than 22% occupation when
temperature reached 38"C. From SCA bait observa-tions, it seemed that M. floricola had a preference for
foraging in the morning and at midday. Other authors
have observed the same diurnal pattern of activity inthis species in the Galapagos islands (Meier 1994;
von Aesch and Cherix 2005) suggesting that it allows
the species to prevent or diminish interspecificcompetition.
In Mediterranean communities, where environ-
mental factors show important daily variations (sim-ilar to the observed daily pattern on Surprise Island),
the limited thermal tolerance of behaviourally dom-
inant species compared with that of subordinatesdisrupts the expected transitive hierarchies. This
thermal tolerance allows a far greater dominance in
the ecosystem by subordinate species than might beexpected from their relative abundance and fighting
abilities (Cerda et al. 1997). In Surprise Island
communities, where there were no marked differ-ences to classify the species as dominant or subor-
dinate (except Ph. oceanica, all are opportunists and
may behave as dominant or not), it is more difficult todisentangle the effect on different species. In a New
Zealand ant community, Stringer et al. (2007)
observed that the native Pheidole rugosula occupiedmore baits when temperatures were between 20 and
30"C, and the invasive Monomorium sydneyensewhen temperatures were between 30 and 40"C; itappears that Ph. rugosula dominates in all but the
highest temperature ranges. When we analyzed the
effect of temperature on the outcome of interspecificinteractions for the two highest dominance-ranked
species we observed the following pattern: the top
dominant and native Ph. oceanica was more suc-cessful when the temperature decreased (afternoon
and evening) and mean temperature value was ca.33"C; the second dominant, the invasive M. floricola,was more successful when the temperature increased
(morning and midday) and mean temperature valuewas ca. 31"C. On Floreana Island (Galapagos),
M. floricola had a lower dominance score, and von
Aesch and Cherix (2005) suggested that it is not agood competitor in direct interspecific interactions.
Invaded ant communities from Surprise Island
123
On Surprise Island it ranked second in dominancefrom bait interactions, but we had no observations at
night. This species produces a venomous substance
(2.5-dialkylpyrrolidines) in its poison gland which ituses to repel other ant species in competitive
interactions at food resources (Jones et al. 1982).
Our observations agree with those of Sarty et al.(2006) in Tokelau atoll, where M. floricola have
fighting abilities superior to Anoplolepis gracilipes(which sprays formic acid) and displaced other antspecies from baits. This may be a similar case to
Monomorium minimum in North America, which
persists on baits both through its use of chemicaldefensive compounds and its tolerance of warm
temperatures (Adams and Traniello 1981). According
to Wetterer (2010), although there is little informa-tion on the importance of M. floricola in natural
environments, it is probably often overlooked and
its abundance and ecological importance isunderestimated.
Ant community composition in each Surprise
Island habitat seems not to respond to competitionor other deterministic processes. Ribas and Schoere-
der (2002) suggested that in ant species distributed in
mosaics, species distribution may arise due tostochastic processes—biotic or abiotic processes—
that have not been taken into account. Von Aesch
(2006) attributed the lack of competition-derivedstructure in Floreana Island ant communities to the
dynamics of the system (temporal changes in species
abundance and composition). While it is an importantfactor in community organization on other Pacific
islands (Morrison 1996a, b), interspecific competition
does not seem to be intense enough to influence theactual distribution of species within or among islands.
This holds with the important exception of Pheidolefervens—Ph. oceanica—Solenopsis geminata inter-action (Morrison 1996a, b). Even if the distribution of
different species in each habitat of Surprise Island
seems to be random, we detected some degree ofstructure/co-occurrence in the ant community of two
habitats (LP and SCA) when foraging at baits.Differences between results from pitfall trap and bait
C-scores could be explained by the fact that pitfall
traps measured the presence of each species in eachhabitat along a day (that is, during 24 h), while baits
measured the presence of each species in a bait at a
specific moment of the day. Thus, although frompitfall data we obtained a random co-occurrence of
the presence of species in each habitat, segregationoccurred when foraging in LP and SCA habitats.
Nevertheless, segregation is not temporal but spatial
because foraging activity overlap in both habitats andis not significantly different from randomness. Both
habitats had the highest abundance of Ph. oceanicaand segregation could be the effect of its presence.
Native ant species holding out against invaders?
Probably the most salient result of our study is the
‘‘resistance’’ ability of the native species currently
confronted by the exotic tramp species on SurpriseIsland. In some New Caledonian ant communities, Le
Breton et al. (2007) observed an ‘‘inappropriate’’ or
non-adaptive response of native dominant Pheidolespecies (no Ph. oceanica) to the invading little fire
ant Wassmannia auropunctata, and, thus, the impor-
tance of enemy recognition in the organization of antcommunities. In this study, we have shown that Ph.oceanica has an adequate response to several exotic
species. The traditional view of biotic resistanceagainst invaders has been either black or white,
success or failure (Carlsson et al. 2010); in the case of
invasive ants, they are mostly successful (especiallyon oceanic islands or in disturbed habitats), but
studies showing cases of native ant biotic resistance
against invaders are increasing (Rao and Vinson2004; Wetterer et al. 2006; Blight et al. 2010;
Masciocchi et al. 2010).
As Feener et al. (2008) stated, invasive speciesincrease the global biota homogenization, which may
increase as interactions between invasive and native
species lead to local extirpation of native species.Alternatively, it may occur in the absence of such
interactions simply because invasive species have
broader environmental tolerances and can thus spreadmore widely than native species (Feener et al. 2008).
For example, climatic niche partitioning allows
coexistence between some invasive fruit flies on LaReunion Island, but the only endemic species lacks a
private climatic niche and it has become a very rarespecies (Duyck et al. 2006). We do not know the
previous history of ant communities on Surprise
Island, but the snapshot that we have obtained fromour data shows that the ‘indomitable’ native species
Pheidole oceanica is currently holding out against theinvaders. Two important life history traits of Ph.oceanica may provide it with an advantage to resist
X. Cerda et al.
123
invasion: its very efficient mass recruitment system(with a mean of 40 workers recruited for a bait, to
collect food or to defend the food resource) and the
existence of a big-headed soldier caste (it is the onlyspecies with ‘‘soldiers’’ or major workers on the
island), specialized in defending food resources and,
when necessary, attacking the workers of otherspecies. Invasion on islands could be seen as a
lottery: depending on the invaders and the native
ants’ life traits, invasion could have a low or a highsuccess rate. In ants, the outcome of interference
competition at the colony level depends on asymme-
tries in recruitment response or local density (oftenreflective on colony size) (Holway et al. 2002b); but
on Surprise Island these asymmetries are not met: Ph.oceanica is one of the most efficient species recruit-ing for food sources, and its colony size is similar to
the non-native species. The two most harmful tramp
species in New Caledonia, Wasmannia auropunctataand Pheidole megacephala (Le Breton 2003; Le
Breton et al. 2005) or Anoplolepis longipes on other
Pacific islands (O’Dowd et al. 2003; Sarty et al. 2006;Ward and Beggs, 2007), are absent from Surprise
Island. These species are ‘‘extirpators’’ or super-
dominants, monopolizing food resources and con-trolling territory. Their absence allowed communities
of Surprise Island to have a hierarchy of dominance
between invasive ants and a natural habitat where thetop dominant is the only native species. This study
constitutes a first approach, the absence of historical
records making it difficult to discuss the processes ina more general framework. Since 2003, a long-term
research project about Surprise Island ant communi-
ties has been underway which will, we hope, fill thecurrent gap. More in-depth studies to elucidate the
mechanisms of ecological dominance of Ph. oceanicaand comparison with ant communities of othersimilar islands (with the same or other native species)
could provide information conducive to a better
understanding of invasibility, one of the mostimportant threats to biodiversity.
Acknowledgments Wewould like to thank the FrenchNavy inNew Caledonia, especially the commander and crew of ‘‘LaMoqueuse’’, for transport onto the island; Isabelle Brun forlogistic assistance at the ‘‘Grande Terre’’; Francisco Carro(Paco), Jean-Louis Chapuis, Vincent Hulin and MathiasGerhardt helped in the daily routine on the island; and Pacoalso in the ant field work. We are very grateful to Herve Jourdan(IRD, Noumea) and Jacques H. Delabie (CEPEC-CEPLAC,
Itabuna) for ant identification. Funds were provided by theFrench Agence Nationale de la Recherche to FC. Thanks are duefor very helpful comments to Nate Sanders, to two anonymousreferees, to Stephen Gregory and Donna Harris during ESEcoffee meetings, and to EBD Ant Group members (RaphaelBoulay, Ana Carvajal, Michael Jowers, Jessica Pearce-Duvet,Camille Ruel and Louise van Oudenhove) during lab meeting.Thanks to Nick Gotelli for help with EcoSim; to Neus Mari-Mena for pitfall trap analysis of the first survey in 2003; and toJavi Retana and Dan Simberloff for accurate and constructivecomments on a previous draft and during Caut’s Ph.D. thesisdissertation, respectively. Jacqueline Minett Wilkinson andMichael J. Jowers revised the English. A first versionwas draftedduring a XC sabbatical stay in France supported by the SpanishMinistry of Education and Science (Sabbatical PR2004-0539,PR2006-0412). All experiments comply with current Spanishand French laws.
References
Adams ES, Traniello JFA (1981) Chemical interference com-petition by Monomorium minimum (Hymenoptera: Form-icidae). Oecologia 51:265–270. doi:10.1007/BF00540612
Andersen AN (1992) Regulation of ‘‘momentary’’ diversity bydominant species in exceptionally rich ant communities ofthe Australian seasonal tropics. Am Nat 140:401–420.doi:10.1086/285419
Andersen AN (2008) Not enough niches: non-equilibrial pro-cesses promoting species coexistence in diverse antcommunities. Austral Ecol 33:211–220. doi:10.1111/j.1442-9993.2007.01810.x
Bang A, Deshpande S, Sumana A, Gadagkar R (2010) Choosingand appropriate index to construct dominance hierarchiesin animal societies: a comparison of three indices. AnimBehav 79:631–636. doi:10.1016/j.anbehav.2009.12.009
Baroni Urbani C, Aktac N (1981) The competition for food andcircadian succession in the ant fauna of a representativeAnatolian semi-steppic environment. Mitt Schweiz Ento-mol Gess 54:33–56
Bestelmeyer BT (2000) The trade-off between thermal toler-ance and behavioural dominance in a subtropical SouthAmerican ant community. J Anim Ecol 69:998–1009. doi:10.1111/j.1365-2656.2000.00455.x
Blight O, Provost E, Renucci M, Tirard A, Orgeas J (2010) Anative ant armed to limit the spreadof theArgentine ant.BiolInvasions 12:3785–3793. doi:10.1007/s10530-010-9770-3
Bolton B (1979) The ant tribe Tetramoriini (Hymenoptera:Formicidae). The genus Tetramorium Mayr in the Mala-gasy region and in the New World. Bull Br Mus nat Hist(Ent) 38:129–181
Brandao CRF, Paiva RVS (1994) The Galapagos ant fauna andthe attributes of colonizing ant species. In: Williams DF(ed) Exotic ants: biology, impact, and control of intro-duced species. Westview Press, Boulder, pp 1–10
Carlsson NOL, Jeschke JM, Holmqvist N, Kindberg J (2010)Long-term data on invaders: when the fox is away, themink will play. Biol Invasions 12:633–641. doi:10.1007/s10530-009-9470-z
Invaded ant communities from Surprise Island
123
Caut S, Angulo E, Courchamp F (2009) Avoiding surpriseeffects on Surprise Island: control in a multitrophic levelperspective. Biol Invasions 11:1689–1703. doi:10.1007/s10530-008-9397-9
Cerda X, Retana J, Cros S (1997) Thermal disruption of tran-sitive hierarchies in Mediterranean ant communities.J Anim Ecol 66:363–374
Cerda X, Retana J, Cros S (1998) Critical thermal limits inMediterranean ant species: trade-off betwen mortality riskand foraging performance. Funct Ecol 12:45–55. doi:10.1046/j.1365-2435.1998.00160.x
Chesson P, Huntly N (1997) The roles of harsh and fluctuatingconditions in the dynamics of ecological communities.Am Nat 150:519–553. doi:10.1086/286080
Colwell RK (2006) EstimateS: statistical estimation of speciesrichness and shared species from samples. Version 8.0.User’s guide and application: http://viceroy.eeb.uconn.edu/EstimateS. Accessed 04 June 2007
Colwell RK, Futuyma DJ (1971) On the measurements ofniche breadth and overlap. Ecology 52:567–576. doi:10.2307/1934144
Cros S, Cerda X, Retana J (1997) Spatial and temporal varia-tions in the activity patterns of Mediterranean ant com-munities. Ecoscience 4:269–278
CTRDP (1987) Ecologie en Nouvelle Caledonie. Centre Ter-ritorial de Recherche et de Documentation, Noumea, NewCaledonia
de Vries H, Stevens JMG, Vervaecke H (2006) Measuring andtesting the steepness of dominance hierarchies. AnimBehav 71:585–592. doi:10.1016/j.anbehav.2005.05.015
Duyck PF, David P, Quilici S (2006) Climatic niche parti-tioning following successive invasions by fruit flies in LaReunion. J Anim Ecol 75:518–526. doi:10.1111/j.1365-2656.2006.01072.x
Dworschak K, Bluthgen N (2010) Networks and dominancehierarchies: does interspecific aggression explain flowerpartitioning among stingless bees? Ecol Entomol 35:216–225. doi:10.1111/j.1365-2311.2010.01174.x
Feener DH Jr, Orr MR, Wackford KM, Longo JM, BensonWW, Gilbert LE (2008) Geographic variation in resourcedominance-discovery in Brazilian ant communities.Ecology 89:1824–1836. doi:10.1890/07-0659.1
Fellers JH (1987) Interference and exploitation in a guild ofwoodland ants. Ecology 68:1466–1478. doi:10.2307/1939230
Gibb H, Hochuli DF (2004) Removal experiment revealslimited effects of a behaviorally dominant species onant assemblages. Ecology 85:648–657. doi:10.1890/03-0007
Gillespie RG, Roderick GK (2002) Arthropods on islands: col-onization, speciation, and conservation. AnnuRevEntomol47:595–632. doi:10.1146/annurev.ento.47.091201.145244
Gotelli NJ (2000) Null model analysis of species co-occurrencepatterns. Ecology 81:2606–2621. doi:10.1890/0012-9658(2000)081[2606:NMAOSC]2.0.CO;2
Gotelli NJ, Entsminger GL (2001) Swap and fill algorithms innull model analysis: rethinking the knight’s tour. Oeco-logia 129:281–291. doi:10.1007/s004420100717
Gotelli NJ, Entsminger GL (2010) EcoSim: null models soft-ware for ecology. Version 7. Acquired Intelligence Inc. aKesey-Bear. Jericho, VT 05465. http://garyentsminger.com/ecosim.htm. Last access on 24 Oct 2010
Herben T (2005) Species pool size and invasibility of islandcommunities: a null model of sampling effects. Ecol Lett8:909–917. doi:10.1111/j.1461-0248.2005.00790.x
Holway DA, Suarez AV, Case TJ (2002a) Role of abiotic factorsin governing susceptibility to invasion: a test with Argen-tine ants. Ecology 83:1610–1619. doi:10.1890/0012-9658(2002)083[1610:ROAFIG]2.0.CO;2
Holway DA, Lach L, Suarez AV, Tsustui ND, Case TJ (2002b)The causes and consequences of ant invasions. Annu RevEcol Syst 33:181–233. doi:10.1146/annurev.ecolsys.33.010802.150444
Ingram KK, Bernardello G, Cover S, Wilson EO (2006) Theants of Juan Fernandez Islands: genesis of an invasivefauna. Biol Invasions 8:383–387. doi:10.1007/s10530-004-3973-4
Jones TH, Blum MS, Howard RW, McDaniel CA, Fales HM,DuBois MB, Torres J (1982) Venom chemistry of ants inthe genus Monomorium. J Chem Ecol 8:285–300. doi:10.1007/BF00984024
Kenis M, Auger-Rozenberg MA, Roques A, Timms L, Pere C,Cock MJW, Settele J, Augustin S, Lopez-Vaamonde C(2009) Ecological effects of invasive alien insects. BiolInvasions 11:21–45. doi:10.1007/s10530-008-9318-y
Le Breton J (2003) Etude des interactions entre la fourmiWasmannia auropunctata et la myrmecofaune. Compar-aison d’une situation en zone d’introduction: la NouvelleCaledonie et d’une situation en zone d’origine: la GuyaneFrancaise. PhD dissertation, Universite Paul Sabatier,Toulouse
Le Breton J, Jourdan H, Chazeau J, Orivel J, Dejean A (2005)Niche opportunity and ant invasion: the case of Was-mannia auropunctata (Roger) in a New Caledonian rain-forest. J Trop Ecol 21:93–98. doi:10.1017/S0266467404002019
Le Breton J, Orivel J, Chazeau J, Dejean A (2007) Unadaptedbehaviour of native, dominant ant species during thecolonization of an aggressive, invasive ant. Ecol Res22:107–114. doi:10.1007/s11284-006-0014-z
Lester PJ, Abbott KL, Sarty M, Burns KC (2009) Competitiveassembly of South Pacific invasive ant communities.BMC Ecology 9:3. doi:10.1186/1472-6785-9-3
Lester PJ, Stringer LD, Haywood J (2010) The role of resourcedispersion in promoting the co-occurrence of dominantand subordinate ant species. Oikos 119:659–668. doi:10.111/j.1600-0706.2009.18012.x
MacArthur RH, Wilson EO (1967) The theory of island bio-geography. Princeton University Press, Princeton
Marsh AC (1985) Microclimatic factors influencing foragingpatterns and success of the themophilic desert ant, Ocy-myrmex barbiger. Insectes Soc 32:286–296. doi:10.1007/BF02224917
Masciocchi M, Farji-Brener AG, Sackmann P (2010) Compe-tition for food between the exotic wasp Vespula germa-nica and the native ant assemblage of NW Patagonia:evidence of biotic resistance? Biol Invasions 12:625–631.doi:10.1007/s10530-009-9469-5
McGlynn TP (1999) The worldwide transfer of ants: geo-graphical distribution and ecological invasions. J Bioge-ogr 26:535–548. doi:10.1046/j.1365-2699.1999.00310.x
Meier RE (1994) Coexisting patterns and foraging behavior ofintroduced and native ants (Hymenoptera, Formicidae) in
X. Cerda et al.
123
the Galapagos Islands (Ecuador). In: Williams DF (ed)Exotic ants: biology, impact, and control of introducedspecies. Westview Press, Boulder, pp 44–62
Menke SB, Holway DA (2006) Abiotic factors control invasionby Argentine ants at the community scale. J Anim Ecol75:368–376. doi:10.1111/j.1365-2656.2006.01056.x
Menke SB, Fisher RN, Jetz W, Holway DA (2007) Biotic andabiotic controls of Argentine ant invasion success at localand landscape scales. Ecology 88:3164–3173. doi:10.1890/07-0122.1
Morrison LW (1996a) The ants (Hymenoptera: Formicidae) ofPolynesia revisited: species numbers and the importanceof sampling intensity. Ecography 19:73–84. doi:10.1111/j.1600-0587.1996.tb00157.x
Morrison LW (1996b) Community organization in a recentlyassembled fauna: the case of Polynesian ants. Oecologia107:243–256. doi:10.1007/BF00327909
Morrison LW (2006) The ants of small Bahamian cays.Bahamas Nat J Sci 1:27–32
O’Dowd DJ, Green PT, Lake PS (2003) Invasional meltdownon an oceanic island. Ecol Lett 6:812–817. doi:10.1046/j.1461-0248.2003.00512.x
Parr CL (2008) Dominant ants can control assemblage speciesrichness in a South African savanna. J Anim Ecol 77:1191–1198. doi:10.1111/j.1365-2656.2008.01450.x
Passera L (1994) Characteristics of tramp species. In: WilliamsDF (ed) Exotic ants: biology, impact, and control ofintroduced species. Westview Press, Boulder, pp 23–43
Rao A, Vinson SB (2004) Ability of resident ants to destructsmall colonies of Solenopsis invicta (Hymenoptera:Formicidae). Environ Entomol 33:587–598
Ribas CR, Schoereder JH (2002) Are all ant mosaics caused bycompetition?Oecologia 131:606–611. doi:10.1007/s00442-002-0912-x
Rizali A, LohmanDJ,Buchori D, PrasetyoLB, TriwidodoH,BosMM, Yamane S, Schulze CH (2010) Ant communities onsmall tropical islands: effects of island size and isolation areobscured by habitat disturbance and ‘tramp’ species. J Bio-geogr 37:229–236. doi:10.1111/J.1365-2699.2009.02194.X
Room PM (1971) The relative distributions of ant species inGhana’s cocoa farms. J Anim Ecol 40:735–751
Sanders NJ, Gotelli NJ, Heller NE, Gordon DM (2003) Com-munity disassembly by an invasive species. PNAS100:2474–2477. doi:10.1073/pnas.0437913100
Sarty M, Abbott KL, Lester PJ (2006) Habitat complexityfacilitates coexistence in a tropical ant community. Oec-ologia 149:465–473. doi:10.1007/s00442-006-0453-9
SAS Institute Inc (2004) SAS, 9.1.3, help and documentation.Cary, NC, USA
Savolainen R, Vepsalainen K (1988) A competition hierarchyamong boreal ants: impact on resource partitioning andcommunity structure. Oikos 51:135–155
Savolainen R, Vepsalainen K, Wuorenrinne H (1989) Antassemblages in the taiga biome: testing the role of territorialwood ants.Oecologia 81:481–486. doi:10.1007/BF00378955
Seifert B (2003) The ant genus Cardiocondyla (Insecta:Hymenoptera: Formicidae)—a taxonomic revision of theC. elegans, C. bulgarica, C. batesii, C. nuda, C. shuc-kardi, C. stambuloffii, C. wroughtonii, C. emeryi, andC. minutior species groups. Ann Naturhist Mus Wien104B:203–338
Simberloff DS (1969) Experimental zoogeography of islands: amodel for insular colonization. Ecology 50:296–314. doi:10.2307/1934857
Simberloff D (1976) Experimental zoogeography of islands:effects of island size. Ecology 57:629–648. doi:10.2307/1936179
StatSoft Inc (2007). Electronic statistics textbook. StatSoft,Tulsa. WEB: http://www.statsoft.com/textbook/stathome.html
Stone L, Roberts A (1990) The checkerboard score and speciesdistributions. Oecologia 85:74–79. doi:10.1007/BF00317345
Stringer LD, Haywood J, Lester PJ (2007) The influence oftemperature andfine-scale resource distribution on resourcesharing and domination in an ant community. Ecol Entomol32:732–740. doi:10.1111/j.1365-2311.2007.00924.x
Suarez AV, Holway DA, Ward PS (2005) The role of oppor-tunity in the unintentional introduction of nonnative ants.PNAS 102:17032–17035. doi:10.1073/pnas.0506119102
ThomasML,HolwayDA (2005) Condition-specific competitionbetween invasive Argentine ants and Australian Iridomyr-mex. J Anim Ecol 74:532–542. doi:10.1111/j.1365-2656.2005.00952.x
von Aesch L (2006) Introduced ants in Galapagos (FloreanaIsland): importance of competition, coexistence andaggressive behaviors. PhD dissertation, Universite Lau-sanne, Lausanne, Switzerland
von Aesch L, Cherix D (2005) Introduced ant species andmechanisms of competition on Floreana island (Galapa-gos, Ecuador) (Hymenoptera: Formicidae). Sociobiology45:463–481
Ward D, Beggs J (2007) Coexistence, habitat patterns and theassembly of ant communities in the Yasawa Islands, Fiji.Acta Oecol 32:215–223. doi:10.1016/j.actao.2007.05.002
Ward DF, Wetterer JK (2006) Checklist of the ants of Fiji(Hymenoptera: Formicidae). In: Evenhuis NL, Bickel DJ(eds) Fiji Arthropods III. Bishop Museum OccasionalPapers 85:23–47
Wetterer JK (2002) Ants of Tonga. Pacific Sci 56:125–135.doi:10.1353/psc.2002.0019
Wetterer JK (2008) Worldwide spread of the longhorn crazyant, Paratrechina longicornis (Hymenoptera: Formici-dae). Myrmecol News 11:137–149
Wetterer JK (2010) Worldwide spread of the flower ant, Mo-nomorium floricola (Hymenoptera: Formicidae). Myrm-ecol News 13:19–27
Wetterer JK, Espadaler X, Wetterer AL, Aguin-Pombo D,Franquinho-Aguiar AM (2006) Long-term impact ofexotic ants on the native ants of Madeira. Ecol Entomol31:358–368. doi:10.1111/j.1365-2311.2006.00790.x
Wilson EO, Hunt GL Jr (1967) Ant fauna of Futuna and Wallisislands, stepping stones to Polynesia. Pacific Insects 9:563–584
Wilson EO, Taylor RW (1967a) The ants of Polynesia(Hymenoptera: Formicidae). Pacific Ins Monog 14:1–109
Wilson EO, Taylor RW (1967b) An estimate of the potentialevolutionary increase in species density in the Polynesianant fauna. Evolution 21:1–10
Wittman SE, Sanders NJ, Ellison AM, Jules ES, Ratchford JS,Gotelli NJ (2010) Species interactions and thermal con-straints on ant community structure. Oikos 119:551–559.doi:10.1111/j.1600-0706.2009.17792.x
Invaded ant communities from Surprise Island
123
Electronic Supplementary Material - Ant community structure on a small Pacific island: only one native
species living with the invaders. Cerdá, Angulo, Caut and Courchamp. Biological Invasions
Fig ESM_1 Ant study sites in Surprise island (New Caledonia). Sampling sites: a) La Plaine (with a researcher surveying a bait;
picture: JL Chapuis); b) Argusia and shoreline; c) Pisonia (with a box containing baits on the ground); d) Scaevola (transect with a
box containing baits on the ground)
Fig ESM_2 Sampling methods: a) pitfall and bait
distribution in each plot (30 x 30 m). b) Closed plastic
boxes with baits in the field. Boxes were closed to prevent
rats gaining access to the food. Ant access was from
lateral openings. c) Open box showing the two different
food resources offered: peanut butter and diluted honey
(with Paratrechina longicornis workers)
5 m bait
a
pitfall
b
c
a
c
b
d
Electronic Supplementary Material - Ant community structure on a small Pacific island: only one native
species living with the invaders. Cerdá, Angulo, Caut and Courchamp. Biological Invasions
Fig ESM_3 Sample-based rarefaction curves in each
study site: LP - La Plaine; ARG - Argusia; PIS -
Pisonia; SCA -Scaevola. Re-sampling procedure
(EstimateS; Colwell 2006) from ant abundance in pitfall
catches. Sample order was randomized 50 times. Values
are the expected richness function Mao Tau and their
95% CI. Observed richness from pitfall (S) is given for
each site
Table ESM_4 Observed rhythm activity overlap (PSI) at baits between each ant species pair in each habitat and all habitats
pooled. Overlap has been calculated from Colwell and Futuyma (1971) proportional overlap index; minimum value is 0 when the
two species do not overlap at all, and its maximum value is 1 when activity rhythms are the same. Abbreviations: BO-
Brachymyrmex obscurior; MF- Monomorium floricola; PL- Paratrechina longicornis; PO- Pheidole oceanica; TB- Tetramorium
bicarinatum; TM- Tapinoma melanocephalum; TS- Tetramorium simillimum. Shaded values are maximum PSI observed in each
habitat. * TS at Argusia site was not considered because the species was present in only one bait during only one census
La Plaine
Species PO TS
BO 0.345 0.457
PO 0.818
Argusia
Species PL TM TS *
MF 0.740 0.481 -
PL 0.694 -
Pisonia
Species PL PO TM TS
BO 0.750 0.536 0.774 0.758
PL 0.593 0.857 0.777
PO 0.634 0.705
TM 0.852
Scaevola
Species MF PL PO TB TM
BO 0.779 0.621 0.284 0.278 0.717
MF 0.651 0.310 0.340 0.608
PL 0.263 0.285 0.727
PO 0.835 0.173
TB 0.194
Surprise Island (all habitats)
Species MF PL PO TB TM TS
BO 0.802 0.704 0.499 0.598 0.761 0.582
MF 0.649 0.425 0.496 0.625 0.478
PL 0.760 0.781 0.820 0.788
PO 0.792 0.698 0.861
TB 0.722 0.847
TM 0.760
Electronic Supplementary Material - Ant community structure on a small Pacific island: only one
native species living with the invaders. Cerdá, Angulo, Caut and Courchamp. Biological Invasions
Table ESM_5 Mean values of PSI activity overlap observed (PSIOBS) and expected from randomized assemblages (PSIEXP)
for each study site and for all sites pooled. Communities were randomized 1000 times using randomization algorithm 2 (RA2)
(resource state equiprobable, niche breadth relaxed and zero states retained) of the niche overlap model in EcoSim v7 (Gotelli
and Entsminger 2010). P-values (in bold when significant) indicate the probabilities of the observed indices being larger (Obs >
exp) or smaller (Obs < exp) than the expected randomized matrices
Table ESM_6 C-score indices of the randomized and observed matrices based on pitfall traps and baits for each study site.
We present the minimum and maximum values of the indices calculated for 5000 randomized matrices per data set, the observed
index, and the p-value (in bold when significant) when the null hypothesis was rejected (two-tailed test) with the probabilities of
the observed indices being larger or smaller than the expected randomized matrices
Randomized matrix Observed P-values Method Site
Minimum Maximum index Obs > exp Obs < exp
PITFALL La Plaine 15.600 19.900 16.400 0.660 0.418
Argusia 5.476 8.524 6.428 0.263 0.776
Pisonia 11.133 13.733 12.267 0.297 0.740
Scaevola 20.905 24.143 22.000 0.344 0.696
BAITS La Plaine 132.000 145.333 147.667 0.000 1.000
Argusia 15.167 26.333 15.333 0.846 0.269
Pisonia 38.600 44.900 39.600 0.960 0.055
Scaevola 24.333 33.000 30.200 0.021 0.979
References
Colwell RK (2006) EstimateS: statistical estimation of species richness and shared species from samples. Version 8.0. User's
Guide and application: http://viceroy.eeb.uconn.edu/EstimateS. Accessed 04 June 2007
Colwell RK, Futuyma DJ (1971) On the measurements of niche breadth and overlap. Ecology 52:567-576
Gotelli NJ, Entsminger GL (2010) EcoSim: Null models software for ecology. Version 7. Acquired Intelligence Inc. & Kesey-
Bear. Jericho, VT 05465. http://garyentsminger.com/ecosim.htm
P-values SITE PSIOBS PSIEXP
Obs > exp Obs < exp
La Plaine 0.540 0.469 0.137 0.863
Argusia 0.638 0.502 0.002 0.998
Pisonia 0.724 0.549 0.000 1.000
Scaevola 0.471 0.467 0.447 0.553
All sites 0.688 0.584 0.000 1.000