Embed Size (px)
Citation preview

Page 1
ANSYS, INC. THIRD QUARTER 2018
EARNINGS ANNOUNCEMENT
PREPARED REMARKS
November 7, 2018
ANSYS is providing a copy of its prepared remarks in connection with its earnings announcement. These
remarks are offered to provide stockholders and research analysts with additional time and detail for
analyzing our Q3 2018 results in advance of our quarterly conference call. These prepared remarks will
not be read on the call.
Conference call details:
November 8, 2018
8:30 a.m. Eastern Time
• To access the live broadcast, please visit the Investor Relations section of ANSYS’ website at
https://investors.ansys.com and click on Events & Presentations, then Webcasts & Events.
• The call can also be heard by dialing (855) 239-2942 (US) or (412) 542-4124 (CAN & INT’L) at
least five minutes prior to the call and referencing conference code 10123501.
• A replay will be available within two hours of the call's completion at https://investors.ansys.com
or by dialing (877) 344-7529 (US), (855) 669-9658 (CAN) or (412) 317-0088 (INT’L) and
referencing the access code 10123501.
SUPPLEMENTAL INFORMATION
In addition to our GAAP information, ANSYS has historically provided non-GAAP supplemental
information. Our reasons for providing this information are described later in this document, as well as in
our Q3 earnings press release, which can be found on our website in the Press Releases section.
Reconciliations of GAAP to non-GAAP information are also provided. In line with our historical practice,
the financial information below is presented on a supplemental, non-GAAP basis unless otherwise
indicated.
Page 2
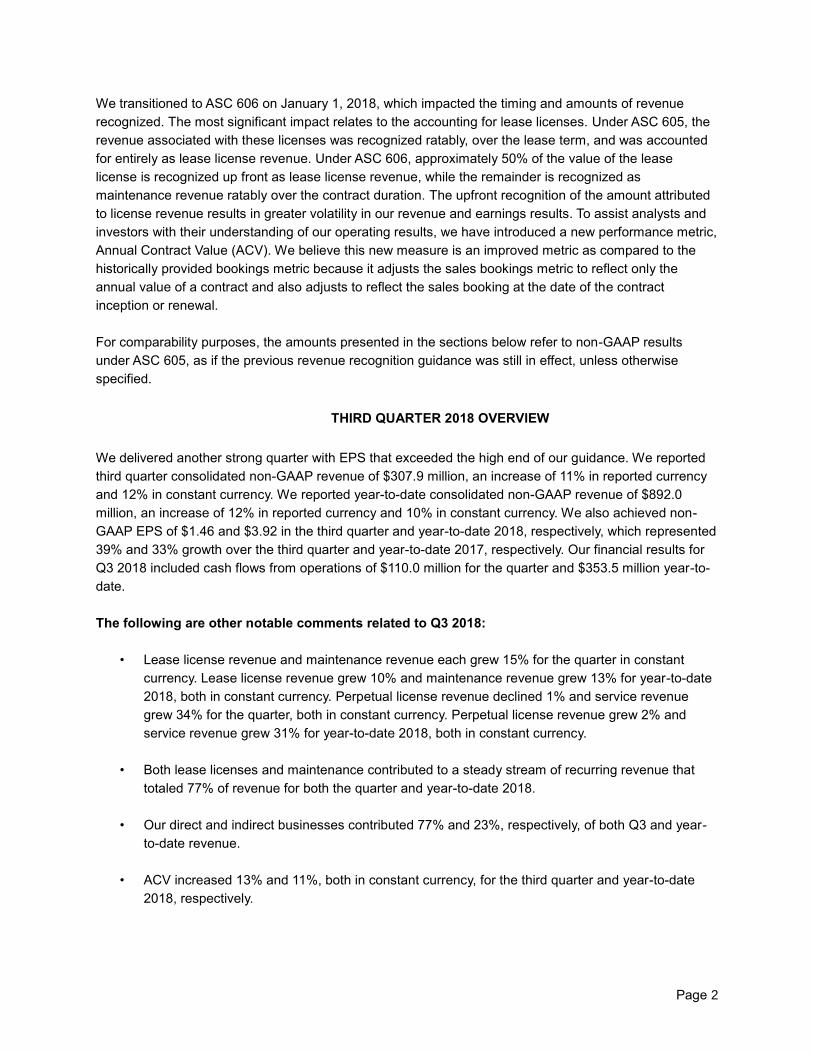
We transitioned to ASC 606 on January 1, 2018, which impacted the timing and amounts of revenue
recognized. The most significant impact relates to the accounting for lease licenses. Under ASC 605, the
revenue associated with these licenses was recognized ratably, over the lease term, and was accounted
for entirely as lease license revenue. Under ASC 606, approximately 50% of the value of the lease
license is recognized up front as lease license revenue, while the remainder is recognized as
maintenance revenue ratably over the contract duration. The upfront recognition of the amount attributed
to license revenue results in greater volatility in our revenue and earnings results. To assist analysts and
investors with their understanding of our operating results, we have introduced a new performance metric,
Annual Contract Value (ACV). We believe this new measure is an improved metric as compared to the
historically provided bookings metric because it adjusts the sales bookings metric to reflect only the
annual value of a contract and also adjusts to reflect the sales booking at the date of the contract
inception or renewal.
For comparability purposes, the amounts presented in the sections below refer to non-GAAP results
under ASC 605, as if the previous revenue recognition guidance was still in effect, unless otherwise
specified.
THIRD QUARTER 2018 OVERVIEW
We delivered another strong quarter with EPS that exceeded the high end of our guidance. We reported
third quarter consolidated non-GAAP revenue of $307.9 million, an increase of 11% in reported currency
and 12% in constant currency. We reported year-to-date consolidated non-GAAP revenue of $892.0
million, an increase of 12% in reported currency and 10% in constant currency. We also achieved non-
GAAP EPS of $1.46 and $3.92 in the third quarter and year-to-date 2018, respectively, which represented
39% and 33% growth over the third quarter and year-to-date 2017, respectively. Our financial results for
Q3 2018 included cash flows from operations of $110.0 million for the quarter and $353.5 million year-to-
date.
The following are other notable comments related to Q3 2018:
• Lease license revenue and maintenance revenue each grew 15% for the quarter in constant
currency. Lease license revenue grew 10% and maintenance revenue grew 13% for year-to-date
2018, both in constant currency. Perpetual license revenue declined 1% and service revenue
grew 34% for the quarter, both in constant currency. Perpetual license revenue grew 2% and
service revenue grew 31% for year-to-date 2018, both in constant currency.
• Both lease licenses and maintenance contributed to a steady stream of recurring revenue that
totaled 77% of revenue for both the quarter and year-to-date 2018.
• Our direct and indirect businesses contributed 77% and 23%, respectively, of both Q3 and year-
to-date revenue.
• ACV increased 13% and 11%, both in constant currency, for the third quarter and year-to-date
2018, respectively.

Page 3
• We continued to drive sales execution, which resulted in a deferred revenue and backlog balance
of $761.6 million, an increase of 14% over Q3 2017.
• For the third quarter, we had 30 customers with cumulative orders over $1 million, including one
customer with cumulative orders over $10 million. This compares to 25 customers with orders
over $1 million in the third quarter of 2017, including two customers with cumulative orders over
$10 million. For year-to-date 2018, we had 99 customers with cumulative orders over $1 million.
This compares to 98 customers with cumulative orders in excess of $1 million for year-to-date
2017.
As we have been communicating throughout the year, an important area of increased investment
in 2018 has been in the form of additional resources across our field engineering teams. This has
driven measurable business results as evidenced by the constant currency services revenue
growth of 34% for the quarter and 31% for year-to-date 2018. These investments have been
instrumental in supporting key customer initiatives that have enabled us to continue to expand our
relationships at both major and strategic accounts.
• During the third quarter, we repurchased 0.4 million shares at an average price of $176.58.
During the first nine months, we repurchased 1.2 million shares at an average price of $164.14.
As of September 30, 2018, the Company had 4.3 million shares remaining in its authorized share
repurchase program.
• The Company recognized a net $6.8 million income tax benefit associated with global legal entity
restructuring activities in the third quarter.
• Total headcount on September 30, 2018 was approximately 3,300 employees as compared to
approximately 2,900 employees at September 30, 2017.
Other Recent Highlights
• We released ANSYS® 19.2, which empowers more users to accelerate the design process. For
example, Fluent's new single window, efficient workflows and patent-pending advanced meshing
technology for computational fluid dynamics (CFD) were included in the release. Users will
greatly benefit from new processes for developing embedded software for safety-critical
applications, as well as dramatic computational speed and user experience improvements for
solving automotive radar scenarios, digital twins, 3D design exploration and structural modeling.
Highlights of ANSYS 19.2 include: accelerated and more accurate CFD models; increased speed
and performance for multiphysics designs; expanded capabilities to perform functional safety
analysis for automotive semiconductors; expanded systems simulation capabilities for
autonomous and electric vehicles; and expanded physics simulation capabilities for optics and
optoelectronics.
• In October 2018, Prith Banerjee joined the executive team as its chief technology officer (CTO).
Utilizing his extensive experience in both industry and academia, Mr. Banerjee will lead the
evolution of ANSYS' technology and will champion our next phase of innovation and growth.
Page 4
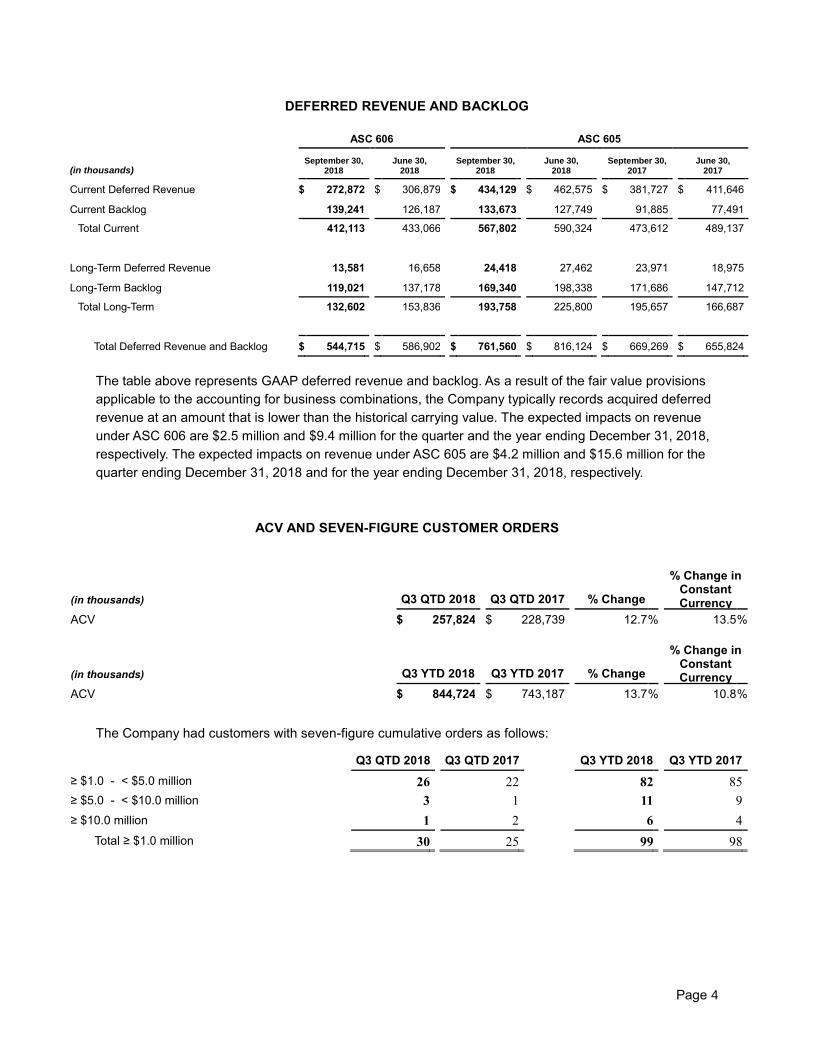
DEFERRED REVENUE AND BACKLOG
ASC 606 ASC 605
(in thousands) September 30,
2018 June 30,
2018 September 30,
2018 June 30,
2018 September 30,
2017 June 30,
2017
Current Deferred Revenue $ 272,872 $ 306,879 $ 434,129 $ 462,575 $ 381,727 $ 411,646
Current Backlog 139,241 126,187 133,673 127,749 91,885 77,491
Total Current 412,113 433,066 567,802 590,324 473,612 489,137
Long-Term Deferred Revenue 13,581 16,658 24,418 27,462 23,971 18,975
Long-Term Backlog 119,021 137,178 169,340 198,338 171,686 147,712
Total Long-Term 132,602 153,836 193,758 225,800 195,657 166,687
Total Deferred Revenue and Backlog $ 544,715 $ 586,902 $ 761,560 $ 816,124 $ 669,269 $ 655,824
The table above represents GAAP deferred revenue and backlog. As a result of the fair value provisions
applicable to the accounting for business combinations, the Company typically records acquired deferred
revenue at an amount that is lower than the historical carrying value. The expected impacts on revenue
under ASC 606 are $2.5 million and $9.4 million for the quarter and the year ending December 31, 2018,
respectively. The expected impacts on revenue under ASC 605 are $4.2 million and $15.6 million for the
quarter ending December 31, 2018 and for the year ending December 31, 2018, respectively.
ACV AND SEVEN-FIGURE CUSTOMER ORDERS
(in thousands) Q3 QTD 2018 Q3 QTD 2017 % Change
% Change in Constant Currency
ACV $ 257,824 $ 228,739 12.7 % 13.5 %
(in thousands) Q3 YTD 2018 Q3 YTD 2017 % Change
% Change in Constant Currency
ACV $ 844,724 $ 743,187 13.7 % 10.8 %
The Company had customers with seven-figure cumulative orders as follows:
Q3 QTD 2018 Q3 QTD 2017 Q3 YTD 2018 Q3 YTD 2017
≥ $1.0 - < $5.0 million 26 22 82 85
≥ $5.0 - < $10.0 million 3 1 11 9
≥ $10.0 million 1 2 6 4
Total ≥ $1.0 million 30 25 99 98

Page 5
REVENUE HIGHLIGHTS
ASC 606 ASC 605
(in thousands, except percentages)
Q3 QTD 2018
% of Total
Q3 QTD 2018
% of Total
Q3 QTD 2017
% of Total
% Change
% Change in Constant
Currency
Lease $ 43,202 14.7 % $ 108,718 35.3 % $ 94,676 34.2 % 14.8 % 15.3 %
Perpetual 65,901 22.5 % 61,353 19.9 % 62,624 22.6 % (2.0 )% (1.1 )%
Maintenance 175,011 59.7 % 128,942 41.9 % 112,761 40.7 % 14.3 % 15.0 %
Service 8,852 3.0 % 8,915 2.9 % 6,705 2.4 % 33.0 % 33.6 %
Total $ 292,966 $ 307,928 $ 276,766 11.3 % 11.9 %
ASC 606 ASC 605
(in thousands, except percentages)
Q3 YTD 2018
% of Total
Q3 YTD 2018
% of Total
Q3 YTD 2017
% of Total
% Change
% Change in Constant
Currency
Lease $ 148,837 16.8 % $ 313,249 35.1 % $ 281,142 35.4 % 11.4 % 9.6 %
Perpetual 201,501 22.8 % 176,154 19.7 % 168,513 21.2 % 4.5 % 2.3 %
Maintenance 507,817 57.4 % 375,535 42.1 % 324,799 40.9 % 15.6 % 12.6 %
Service 26,946 3.0 % 27,049 3.0 % 20,208 2.5 % 33.9 % 31.4 %
Total $ 885,101 $ 891,987 $ 794,662 12.2 % 9.8 %
As a result of the Company's application of the fair value provisions applicable to the accounting for
business combinations, there were impacts on GAAP revenue under ASC 606 of $3.5 million and $6.9
million for the third quarter and year-to-date 2018, respectively. The impacts on GAAP revenue under
ASC 605 were $6.0 million and $1.2 million for the third quarters of 2018 and 2017, respectively. The
impacts on GAAP revenue under ASC 605 were $11.4 million and $1.7 million for year-to-date 2018 and
2017, respectively.
GEOGRAPHIC REVENUE HIGHLIGHTS
ASC 606 ASC 605
(in thousands, except percentages)
Q3 QTD 2018
% of Total
Q3 QTD 2018
% of Total
Q3 QTD 2017
% of Total
% Change
% Change in Constant
Currency
Americas $ 113,646 38.8 % $ 128,380 41.7 % $ 112,398 40.6 % 14.2 % 14.3 %
Germany 28,291 9.7 % 31,445 10.2 % 28,467 10.3 % 10.5 % 11.8 %
United Kingdom 11,492 3.9 % 8,582 2.8 % 9,603 3.5 % (10.6 )% (10.1 )%
Other EMEA 49,018 16.7 % 51,195 16.6 % 44,844 16.2 % 14.2 % 15.4 %
EMEA 88,801 30.3 % 91,222 29.6 % 82,914 30.0 % 10.0 % 11.2 %
Japan 37,217 12.7 % 34,811 11.3 % 30,919 11.2 % 12.6 % 13.2 %
Other Asia-Pacific 53,302 18.2 % 53,515 17.4 % 50,535 18.3 % 5.9 % 7.1 %
Asia-Pacific 90,519 30.9 % 88,326 28.7 % 81,454 29.4 % 8.4 % 9.4 %
Total $ 292,966 $ 307,928 $ 276,766 11.3 % 11.9 %

Page 6
ASC 606 ASC 605
(in thousands, except percentages)
Q3 YTD 2018
% of Total
Q3 YTD 2018
% of Total
Q3 YTD 2017
% of Total
% Change
% Change in Constant
Currency
Americas $ 346,319 39.1 % $ 365,277 41.0 % $ 325,788 41.0 % 12.1 % 12.1 %
Germany 98,042 11.1 % 93,485 10.5 % 79,233 10.0 % 18.0 % 10.3 %
United Kingdom 28,463 3.2 % 27,615 3.1 % 24,197 3.0 % 14.1 % 8.1 %
Other EMEA 154,457 17.5 % 153,192 17.2 % 130,764 16.5 % 17.2 % 10.9 %
EMEA 280,962 31.7 % 274,292 30.8 % 234,194 29.5 % 17.1 % 10.4 %
Japan 110,835 12.5 % 104,631 11.7 % 94,753 11.9 % 10.4 % 8.2 %
Other Asia-Pacific 146,985 16.6 % 147,787 16.6 % 139,927 17.6 % 5.6 % 4.6 %
Asia-Pacific 257,820 29.1 % 252,418 28.3 % 234,680 29.5 % 7.6 % 6.1 %
Total $ 885,101 $ 891,987 $ 794,662 12.2 % 9.8 %
Regional Commentary
Americas
The Americas led the regions with 14% constant currency revenue growth, including double-digit growth in
lease, maintenance and service revenue. The region had nine customers with cumulative orders over $1
million during the quarter as compared to 14 customers during the third quarter of 2017. The decrease in
the number of these deals as compared to last year's third quarter is attributable to the timing of large deals,
in particular deals that have both elements of new and renewal business, that have a tendency to be aligned
around Q4 customer year-end budgeting and spending cycles.
EMEA
EMEA delivered constant currency revenue growth of 11%, including double-digit growth in lease,
maintenance and service revenue. The region had 10 customers with cumulative orders over $1 million
during the quarter as compared to seven customers during the third quarter of 2017. Germany, France and
Italy each experienced double-digit revenue growth in constant currency, partially offset by the United
Kingdom. The overall results in the region continue to demonstrate our strong sales execution and an
improved go-to-market strategy.
Asia-Pacific
Asia-Pacific experienced 9% constant currency revenue growth, including double-digit growth in lease,
maintenance and service revenue. The region experienced strong growth in Japan, our largest geography
in the region, and India, partially offset by South Korea and Taiwan. Asia-Pacific led the regions in large
deals with a total of 11 customers with cumulative orders over $1 million during the quarter as compared to
four customers during the third quarter of 2017.

Page 7
Industry Commentary
Consistent with the first half of 2018, the automotive industry remained strong due to continued investments
in autonomous vehicles and electrification. Investments in smart, connected products and 5G by companies
around the globe bolstered the high-tech industry in Q3. The industrial equipment industry saw growth as
companies continued to focus on the use of simulation in maintenance, repair and overhaul projects.
Aerospace and defense had strong performance due to an increase in defense spending in both the United
States and Europe.
INCOME STATEMENT HIGHLIGHTS
Q3 2018 MARGINS AND TAX RATE: The gross margins, operating margins and effective tax rates were
as follows:
ASC 606 ASC 605
Q3 QTD 2018 Q3 YTD 2018 Q3 QTD 2018 Q3 YTD 2018
Gross Margin 90.0 % 90.0 % 90.5 % 90.1 %
Operating Margin 44.0 % 45.5 % 46.7 % 45.9 %
Effective Tax Rate 13.9 % 18.6 % 14.1 % 18.7 %
BALANCE SHEET AND CASH FLOW HIGHLIGHTS
• Cash and short-term investments totaled $729.4 million as of September 30, 2018, of which 77%
was held domestically.
• Cash flows from operations were $110.0 million for the third quarter of 2018 as compared to
$88.9 million for the third quarter of 2017. Cash flows from operations were $353.5 million for
year-to-date 2018 as compared to $327.0 million for year-to-date 2017.
• Consolidated net DSO was 33 days under ASC 605. Consolidated net DSO was 77 days under
ASC 606, which significantly increased upon the adoption of ASC 606 on January 1, 2018.
• Capital expenditures totaled $6.3 million and $13.1 million for the third quarter and year-to-date
2018, respectively. We are currently planning total 2018 capital expenditures in the range of $20 -
$25 million.
SHARE COUNT AND SHARE REPURCHASES
We had 86.0 million fully diluted weighted average shares outstanding in Q3. In line with our commitment
to return capital to stockholders, we repurchased 0.4 million shares during Q3 at an average price of
$176.58 and repurchased 1.2 million shares YTD at an average price of $164.14. In February 2018, the
Company's Board of Directors increased the authorized share repurchase program to a total of 5.0 million
shares. As of September 30, 2018, the Company had 4.3 million shares remaining in its authorized share
repurchase program.

Page 8
STOCK-BASED COMPENSATION EXPENSE
Three Months Ended Nine Months Ended
(in thousands, except per share data) September 30,
2018 September 30,
2017 September 30,
2018 September 30,
2017
Cost of sales:
Software licenses $ 339 $ 140 $ 938 $ 711
Maintenance and service 1,099 739 2,942 1,894
Operating expenses:
Selling, general and administrative 13,484 8,782 33,288 23,310
Research and development 8,061 5,112 21,719 13,493
Stock-based compensation expense before taxes 22,983 14,773 58,887 39,408
Related income tax benefits (8,611 ) (6,080 ) (30,311 ) (23,980 )
Stock-based compensation expense, net of taxes $ 14,372 $ 8,693 $ 28,576 $ 15,428
Net impact on earnings per share:
Diluted earnings per share $ (0.17 ) $ (0.10 ) $ (0.33 ) $ (0.18 )
CURRENCY
CURRENCY IMPACTS: The third quarter and year-to-date 2018 revenue and operating income under
ASC 605 as compared to the third quarter and year-to-date 2017 were impacted by fluctuations in the
U.S. Dollar. The impacts on revenue and operating income are reflected in the table below. Amounts in
brackets indicate an adverse impact from currency fluctuations.
Three Months Ended Nine Months Ended
(in thousands) September 30, 2018 September 30, 2018
Revenue $ (1,843 ) $ 19,231
Operating income $ (485 ) $ 11,028
There were adverse foreign exchange impacts on deferred revenue and backlog of $3.6 million and $11.0
million for the third quarter and year-to-date 2018, respectively.
OUTLOOK
The Company continues to expect that the OPTIS non-GAAP impact on 2018 revenue is approximately
$25 million to $26 million under both ASC 606 and ASC 605. The expected impact on GAAP revenue is
approximately $16 million to $18 million under ASC 606 and $10 million to $12 million under ASC 605.
Q4 2018 OUTLOOK: We are currently forecasting the following for Q4 2018 under ASC 606:
(in millions, except percentages and per share data) GAAP non-GAAP
Revenue $349.5 - $369.5 $352.0 - $372.0
Operating margin 34.0% - 37.0% 43.0% - 45.0%
Effective tax rate 19.5% - 22.5% 21.5% - 22.5%
Diluted earnings per share $1.10 - $1.29 $1.39 - $1.55

Page 9
We are currently forecasting the following for Q4 2018 under ASC 605:
(in millions, except percentages and per share data) GAAP non-GAAP
Revenue $332.8 - $342.8 $337.0 - $347.0
Operating margin 30.0% - 33.0% 40.0% - 41.0%
Effective tax rate 19.0% - 22.0% 21.5% - 22.5%
Diluted earnings per share $0.95 - $1.05 $1.26 - $1.32
FY 2018 OUTLOOK: We are updating our FY 2018 forecast based on our current sales visibility and the
assumption of a continuation of a similar business climate to that we experienced in the third quarter. The
guidance also reflects a slight adverse impact on revenue related to currency exchange rate changes
since we last provided guidance in August 2018.
We are currently forecasting the following for FY 2018 under ASC 606:
(in millions, except percentages and per share data) GAAP non-GAAP
Revenue $1,227.6 - $1,247.6 $1,237.0 - $1,257.0
Operating margin 34.0% - 35.0% 44.5% - 45.5%
Effective tax rate 14.0% - 15.0% 19.0% - 20.0%
Diluted earnings per share $4.19 - $4.38 $5.25 - $5.41
We are also updating our forecast for FY 2018 under ASC 605 as follows:
(in millions, except percentages and per share data) GAAP non-GAAP
Revenue $1,213.4 - $1,223.4 $1,229.0 - $1,239.0
Operating margin 33.0% - 34.0% 44.0% - 45.0%
Effective tax rate 14.0% - 15.0% 19.0% - 20.0%
Diluted earnings per share $4.07 - $4.16 $5.18 - $5.24
We are updating our ACV and operating cash flow forecast for FY 2018. We are currently forecasting:
(in millions)
Other Financial Metrics
ACV $1,262.0 - $1,282.0
Operating cash flows* $455.0 - $480.0
*The Company's operating cash flow guidance reflects an adverse impact of approximately $12.0 - $15.0
million related to income tax payments associated with deferred revenue and backlog credited to retained
earnings and never recognized as revenue in the financial statements.
The Company's ACV metric for FY 2017 was approximately $1,124.0 million.
We are currently expecting approximately 86.0 million fully diluted shares outstanding for Q4 2018 and FY
2018.
Page 10
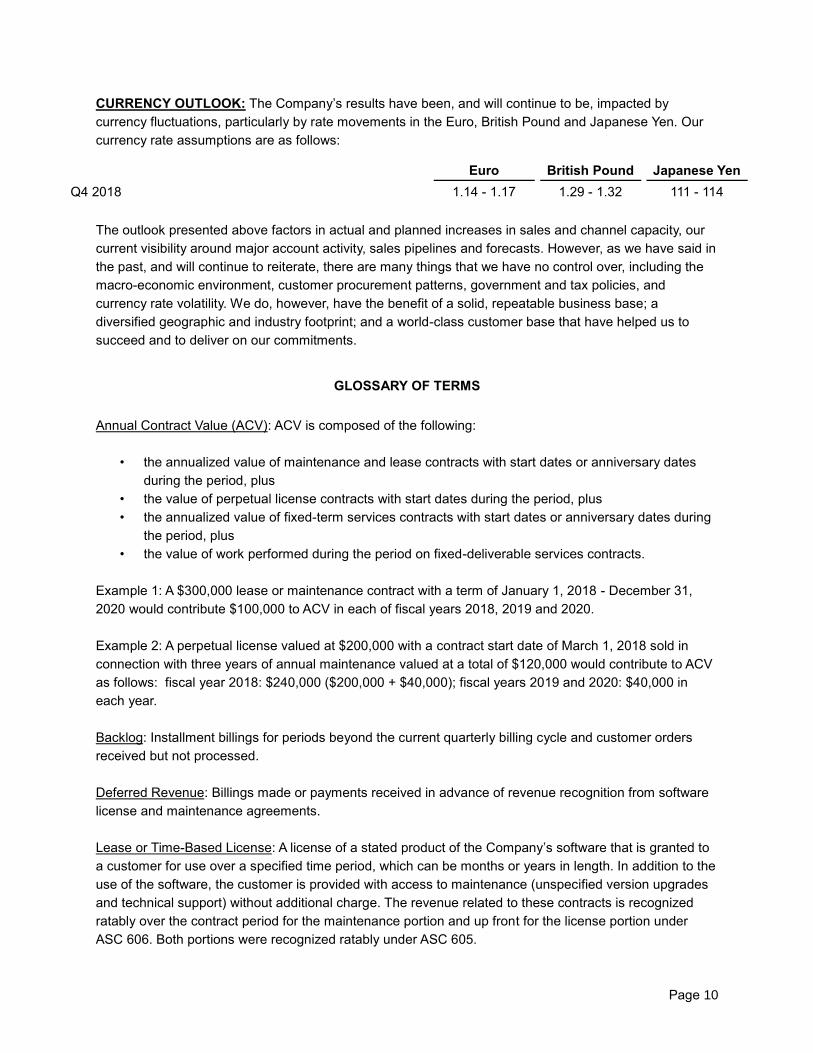
CURRENCY OUTLOOK: The Company’s results have been, and will continue to be, impacted by
currency fluctuations, particularly by rate movements in the Euro, British Pound and Japanese Yen. Our
currency rate assumptions are as follows:
Euro British Pound Japanese Yen
Q4 2018 1.14 - 1.17 1.29 - 1.32 111 - 114
The outlook presented above factors in actual and planned increases in sales and channel capacity, our
current visibility around major account activity, sales pipelines and forecasts. However, as we have said in
the past, and will continue to reiterate, there are many things that we have no control over, including the
macro-economic environment, customer procurement patterns, government and tax policies, and
currency rate volatility. We do, however, have the benefit of a solid, repeatable business base; a
diversified geographic and industry footprint; and a world-class customer base that have helped us to
succeed and to deliver on our commitments.
GLOSSARY OF TERMS
Annual Contract Value (ACV): ACV is composed of the following:
• the annualized value of maintenance and lease contracts with start dates or anniversary dates
during the period, plus
• the value of perpetual license contracts with start dates during the period, plus
• the annualized value of fixed-term services contracts with start dates or anniversary dates during
the period, plus
• the value of work performed during the period on fixed-deliverable services contracts.
Example 1: A $300,000 lease or maintenance contract with a term of January 1, 2018 - December 31,
2020 would contribute $100,000 to ACV in each of fiscal years 2018, 2019 and 2020.
Example 2: A perpetual license valued at $200,000 with a contract start date of March 1, 2018 sold in
connection with three years of annual maintenance valued at a total of $120,000 would contribute to ACV
as follows: fiscal year 2018: $240,000 ($200,000 + $40,000); fiscal years 2019 and 2020: $40,000 in
each year.
Backlog: Installment billings for periods beyond the current quarterly billing cycle and customer orders
received but not processed.
Deferred Revenue: Billings made or payments received in advance of revenue recognition from software
license and maintenance agreements.
Lease or Time-Based License: A license of a stated product of the Company’s software that is granted to
a customer for use over a specified time period, which can be months or years in length. In addition to the
use of the software, the customer is provided with access to maintenance (unspecified version upgrades
and technical support) without additional charge. The revenue related to these contracts is recognized
ratably over the contract period for the maintenance portion and up front for the license portion under
ASC 606. Both portions were recognized ratably under ASC 605.

Page 11
Perpetual / Paid-Up License: A license of a stated product and version of the Company’s software that is
granted to a customer for use in perpetuity. The revenue related to this type of license is typically
recognized up front.
Maintenance: A contract, typically one year in duration, that is purchased by the owner of a perpetual
license and that provides access to unspecified version upgrades and technical support during the
duration of the contract. The revenue from these contracts is recognized ratably over the contract period.
FORWARD-LOOKING STATEMENTS AND RISK FACTORS
Information provided by the Company or its spokespersons, including the above statements and
any others in this document that refer to plans and expectations for the fourth quarter of 2018, FY
2018 and the future are forward-looking statements. The Company cautions investors that its
performance (and, therefore, any forward-looking statement) is subject to risks and uncertainties.
A detailed discussion of these risks and other factors that could affect ANSYS’ results is included
in ANSYS’ SEC filings, including the Annual Report on Form 10-K for the year ended December 31,
2017, filed on February 22, 2018.

Page 12
RECONCILIATION OF GAAP TO NON-GAAP MEASURES
ANSYS, INC. AND SUBSIDIARIES
ASC 606 Reconciliation of Non-GAAP Measures
(Unaudited)
Three Months Ended
September 30, 2018
(in thousands, except percentages and per share data)
GAAP Results Adjustments
Non-GAAP Results
Total revenue $ 289,418 $ 3,548 (1) $ 292,966
Operating income 93,024 35,889 (2) 128,913
Operating profit margin 32.1 % 44.0 %
Net income $ 89,336 $ 23,557 (3) $ 112,893
Earnings per share – diluted:
Earnings per share $ 1.04 $ 1.31
Weighted average shares 86,043 86,043
(1) Amount represents the revenue not reported during the period as a result of the acquisition
accounting adjustment associated with the accounting for deferred revenue in business
combinations.
(2) Amount represents $23.0 million of stock-based compensation expense, $0.3 million of excess
payroll taxes related to stock-based awards, $9.0 million of amortization expense associated with
intangible assets acquired in business combinations and the $3.5 million adjustment to revenue as
reflected in (1) above.
(3) Amount represents the impact of the adjustments to operating income referred to in (2) above,
decreased for the related income tax impact of $11.7 million, a measurement-period adjustment
related to the Tax Cuts and Jobs Act of $0.5 million, and rabbi trust income of $0.1 million.
ANSYS, INC. AND SUBSIDIARIES
ASC 606 Reconciliation of Non-GAAP Measures
(Unaudited)
Nine Months Ended
September 30, 2018
(in thousands, except percentages and per share data)
GAAP Results Adjustments
Non-GAAP Results
Total revenue $ 878,204 $ 6,897 (1) $ 885,101
Operating income 296,638 105,796 (2) 402,434
Operating profit margin 33.8 % 45.5 %
Net income $ 266,212 $ 65,591 (3) $ 331,803
Earnings per share – diluted:
Earnings per share $ 3.09 $ 3.86
Weighted average shares 86,060 86,060
Page 13
(1) Amount represents the revenue not reported during the period as a result of the acquisition
accounting adjustment associated with the accounting for deferred revenue in business
combinations.
(2) Amount represents $58.9 million of stock-based compensation expense, $3.8 million of excess
payroll taxes related to stock-based awards, $33.8 million of amortization expense associated with
intangible assets acquired in business combinations, $2.4 million of transaction expenses related
to business combinations and the $6.9 million adjustment to revenue as reflected in (1) above.
(3) Amount represents the impact of the adjustments to operating income referred to in (2) above,
decreased for the related income tax impact of $41.0 million and rabbi trust income of $0.1 million,
and increased for a measurement-period adjustment related to the Tax Cuts and Jobs Act of $0.9
million.
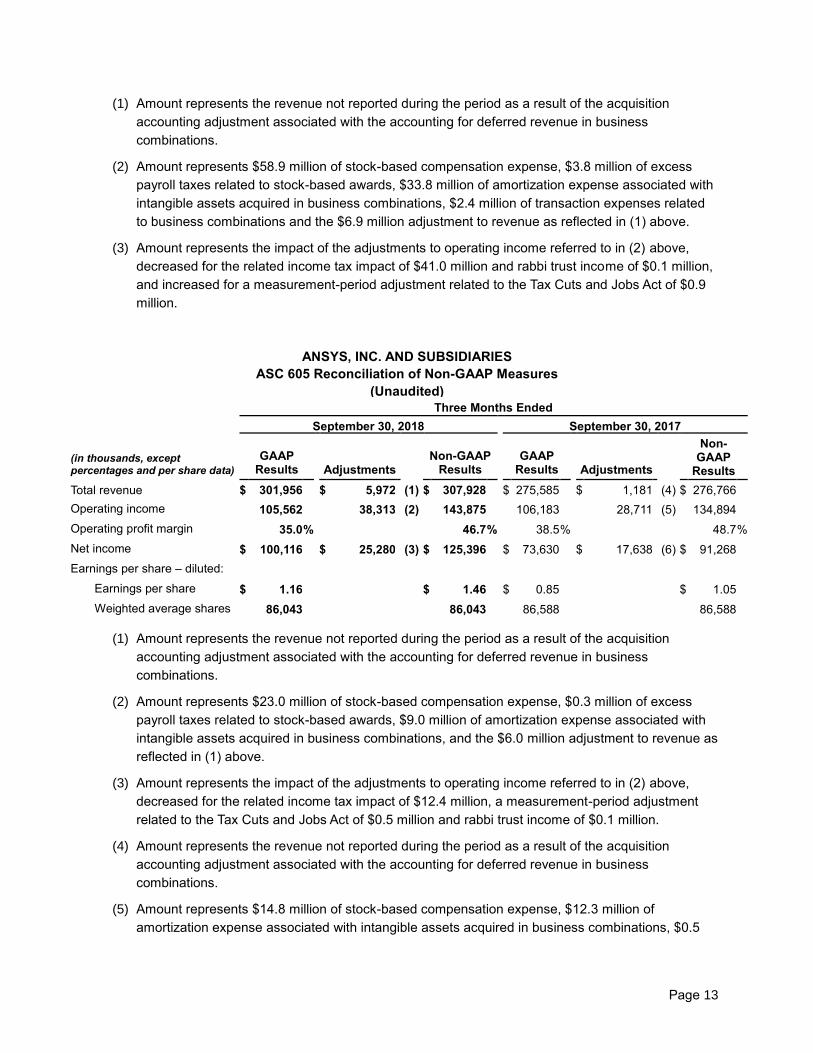
ANSYS, INC. AND SUBSIDIARIES
ASC 605 Reconciliation of Non-GAAP Measures
(Unaudited)
Three Months Ended
September 30, 2018 September 30, 2017
(in thousands, except percentages and per share data)
GAAP Results Adjustments
Non-GAAP Results
GAAP Results Adjustments
Non-GAAP
Results
Total revenue $ 301,956 $ 5,972 (1) $ 307,928 $ 275,585 $ 1,181 (4) $ 276,766
Operating income 105,562 38,313 (2) 143,875 106,183 28,711 (5) 134,894
Operating profit margin 35.0 % 46.7 % 38.5 % 48.7 %
Net income $ 100,116 $ 25,280 (3) $ 125,396 $ 73,630 $ 17,638 (6) $ 91,268
Earnings per share – diluted:
Earnings per share $ 1.16 $ 1.46 $ 0.85 $ 1.05
Weighted average shares 86,043 86,043 86,588 86,588
(1) Amount represents the revenue not reported during the period as a result of the acquisition
accounting adjustment associated with the accounting for deferred revenue in business
combinations.
(2) Amount represents $23.0 million of stock-based compensation expense, $0.3 million of excess
payroll taxes related to stock-based awards, $9.0 million of amortization expense associated with
intangible assets acquired in business combinations, and the $6.0 million adjustment to revenue as
reflected in (1) above.
(3) Amount represents the impact of the adjustments to operating income referred to in (2) above,
decreased for the related income tax impact of $12.4 million, a measurement-period adjustment
related to the Tax Cuts and Jobs Act of $0.5 million and rabbi trust income of $0.1 million.
(4) Amount represents the revenue not reported during the period as a result of the acquisition
accounting adjustment associated with the accounting for deferred revenue in business
combinations.
(5) Amount represents $14.8 million of stock-based compensation expense, $12.3 million of
amortization expense associated with intangible assets acquired in business combinations, $0.5

Page 14
million of restructuring charges, and the $1.2 million adjustment to revenue as reflected in (4)
above.
(6) Amount represents the impact of the adjustments to operating income referred to in (5) above,
adjusted for the related income tax impact of $11.0 million and rabbi trust income of $0.1 million.
ANSYS, INC. AND SUBSIDIARIES
ASC 605 Reconciliation of Non-GAAP Measures
(Unaudited)
Nine Months Ended
September 30, 2018 September 30, 2017
(in thousands, except percentages and per share data)
GAAP Results Adjustments
Non-GAAP Results
GAAP Results Adjustments
Non-GAAP
Results
Total revenue $ 880,551 $ 11,436 (1) $ 891,987 $ 792,914 $ 1,748 (4) $ 794,662
Operating income 298,985 110,335 (2) 409,320 290,049 89,985 (5) 380,034
Operating profit margin 34.0 % 45.9 % 36.6 % 47.8 %
Net income $ 268,281 $ 68,827 (3) $ 337,108 $ 206,666 $ 48,480 (6) $ 255,146
Earnings per share – diluted:
Earnings per share $ 3.12 $ 3.92 $ 2.38 $ 2.94
Weighted average shares 86,060 86,060 86,902 86,902
(1) Amount represents the revenue not reported during the period as a result of the acquisition
accounting adjustment associated with the accounting for deferred revenue in business
combinations.
(2) Amount represents $58.9 million of stock-based compensation expense, $3.8 million of excess
payroll taxes related to stock-based awards, $33.8 million of amortization expense associated with
intangible assets acquired in business combinations, $2.4 million of transaction expenses related
to business combinations and the $11.4 million adjustment to revenue as reflected in (1) above.
(3) Amount represents the impact of the adjustments to operating income referred to in (2) above,
decreased for the related income tax impact of $42.3 million and rabbi trust income of $0.1 million,
and increased for a measurement-period adjustment related to the Tax Cuts and Jobs Act of $0.9
million.
(4) Amount represents the revenue not reported during the period as a result of the acquisition
accounting adjustment associated with the accounting for deferred revenue in business
combinations.
(5) Amount represents $39.4 million of stock-based compensation expense, $36.4 million of
amortization expense associated with intangible assets acquired in business combinations, $11.7
million of restructuring charges, $0.7 million of transaction expenses related to business
combinations and the $1.7 million adjustment to revenue as reflected in (4) above.
(6) Amount represents the impact of the adjustments to operating income referred to in (5) above,
adjusted for the related income tax impact of $41.4 million and rabbi trust income of $0.1 million.
NON-GAAP MEASURES
Page 15
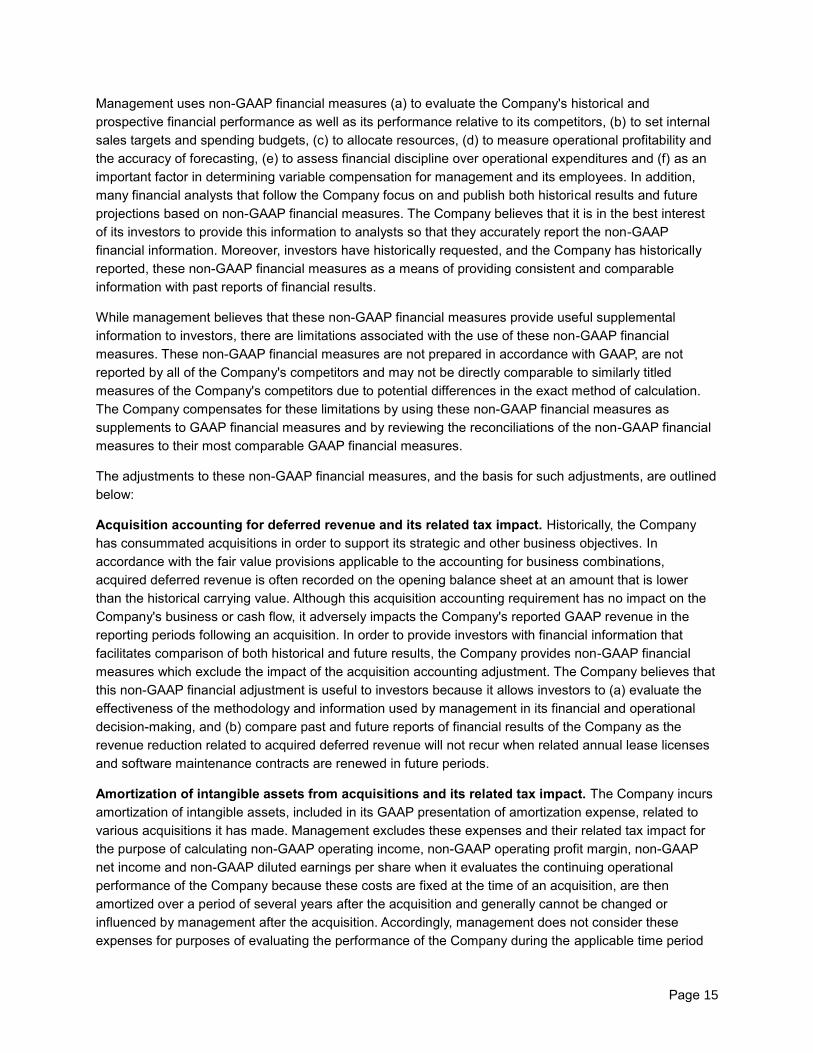
Management uses non-GAAP financial measures (a) to evaluate the Company's historical and
prospective financial performance as well as its performance relative to its competitors, (b) to set internal
sales targets and spending budgets, (c) to allocate resources, (d) to measure operational profitability and
the accuracy of forecasting, (e) to assess financial discipline over operational expenditures and (f) as an
important factor in determining variable compensation for management and its employees. In addition,
many financial analysts that follow the Company focus on and publish both historical results and future
projections based on non-GAAP financial measures. The Company believes that it is in the best interest
of its investors to provide this information to analysts so that they accurately report the non-GAAP
financial information. Moreover, investors have historically requested, and the Company has historically
reported, these non-GAAP financial measures as a means of providing consistent and comparable
information with past reports of financial results.
While management believes that these non-GAAP financial measures provide useful supplemental
information to investors, there are limitations associated with the use of these non-GAAP financial
measures. These non-GAAP financial measures are not prepared in accordance with GAAP, are not
reported by all of the Company's competitors and may not be directly comparable to similarly titled
measures of the Company's competitors due to potential differences in the exact method of calculation.
The Company compensates for these limitations by using these non-GAAP financial measures as
supplements to GAAP financial measures and by reviewing the reconciliations of the non-GAAP financial
measures to their most comparable GAAP financial measures.
The adjustments to these non-GAAP financial measures, and the basis for such adjustments, are outlined
below:
Acquisition accounting for deferred revenue and its related tax impact. Historically, the Company
has consummated acquisitions in order to support its strategic and other business objectives. In
accordance with the fair value provisions applicable to the accounting for business combinations,
acquired deferred revenue is often recorded on the opening balance sheet at an amount that is lower
than the historical carrying value. Although this acquisition accounting requirement has no impact on the
Company's business or cash flow, it adversely impacts the Company's reported GAAP revenue in the
reporting periods following an acquisition. In order to provide investors with financial information that
facilitates comparison of both historical and future results, the Company provides non-GAAP financial
measures which exclude the impact of the acquisition accounting adjustment. The Company believes that
this non-GAAP financial adjustment is useful to investors because it allows investors to (a) evaluate the
effectiveness of the methodology and information used by management in its financial and operational
decision-making, and (b) compare past and future reports of financial results of the Company as the
revenue reduction related to acquired deferred revenue will not recur when related annual lease licenses
and software maintenance contracts are renewed in future periods.
Amortization of intangible assets from acquisitions and its related tax impact. The Company incurs
amortization of intangible assets, included in its GAAP presentation of amortization expense, related to
various acquisitions it has made. Management excludes these expenses and their related tax impact for
the purpose of calculating non-GAAP operating income, non-GAAP operating profit margin, non-GAAP
net income and non-GAAP diluted earnings per share when it evaluates the continuing operational
performance of the Company because these costs are fixed at the time of an acquisition, are then
amortized over a period of several years after the acquisition and generally cannot be changed or
influenced by management after the acquisition. Accordingly, management does not consider these
expenses for purposes of evaluating the performance of the Company during the applicable time period

Page 16
after the acquisition, and it excludes such expenses when making decisions to allocate resources. The
Company believes that these non-GAAP financial measures are useful to investors because they allow
investors to (a) evaluate the effectiveness of the methodology and information used by management in its
financial and operational decision-making, and (b) compare past reports of financial results of the
Company as the Company has historically reported these non-GAAP financial measures.
Stock-based compensation expense and its related tax impact. The Company incurs expense related
to stock-based compensation included in its GAAP presentation of cost of software licenses; cost of
maintenance and service; research and development expense; and selling, general and administrative
expense. This non-GAAP adjustment also includes excess payroll tax expense related to stock-based
compensation. Stock-based compensation expense (benefit) incurred in connection with the Company's
deferred compensation plan held in a rabbi trust includes an offsetting benefit (charge) recorded in other
income (expense). Although stock-based compensation is an expense of the Company and viewed as a
form of compensation, management excludes these expenses for the purpose of calculating non-GAAP
operating income, non-GAAP operating profit margin, non-GAAP net income and non-GAAP diluted
earnings per share when it evaluates the continuing operational performance of the Company.
Management similarly excludes income (expense) related to assets held in a rabbi trust in connection
with the Company's deferred compensation plan. Specifically, the Company excludes stock-based
compensation and income (expense) related to assets held in the deferred compensation plan rabbi trust
during its annual budgeting process and its quarterly and annual assessments of the Company's and
management's performance. The annual budgeting process is the primary mechanism whereby the
Company allocates resources to various initiatives and operational requirements. Additionally, the annual
review by the board of directors during which it compares the Company's historical business model and
profitability to the planned business model and profitability for the forthcoming year excludes the impact of
stock-based compensation. In evaluating the performance of senior management and department
managers, charges related to stock-based compensation are excluded from expenditure and profitability
results. In fact, the Company records stock-based compensation expense into a stand-alone cost center
for which no single operational manager is responsible or accountable. In this way, management is able
to review, on a period-to-period basis, each manager's performance and assess financial discipline over
operational expenditures without the effect of stock-based compensation. The Company believes that
these non-GAAP financial measures are useful to investors because they allow investors to (a) evaluate
the Company's operating results and the effectiveness of the methodology used by management to
review the Company's operating results, and (b) review historical comparability in the Company's financial
reporting as well as comparability with competitors' operating results.
Restructuring charges and the related tax impact. The Company occasionally incurs expenses for
restructuring its workforce included in its GAAP presentation of cost of software licenses; cost of
maintenance and service; research and development expense; and selling, general and administrative
expense. Management excludes these expenses for the purpose of calculating non-GAAP operating
income, non-GAAP operating profit margin, non-GAAP net income and non-GAAP diluted earnings per
share when it evaluates the continuing operational performance of the Company, as it generally does not
incur these expenses as a part of its operations. The Company believes that these non-GAAP financial
measures are useful to investors because they allow investors to (a) evaluate the Company's operating
results and the effectiveness of the methodology used by management to review the Company's
operating results, and (b) review historical comparability in the Company's financial reporting as well as
comparability with competitors' operating results.

Page 17
Transaction costs related to business combinations. The Company incurs expenses for professional
services rendered in connection with business combinations, which are included in its GAAP presentation
of selling, general and administrative expense. These expenses are generally not tax-deductible.
Management excludes these acquisition-related transaction expenses, derived from announced
acquisitions, for the purpose of calculating non-GAAP operating income, non-GAAP operating profit
margin, non-GAAP net income and non-GAAP diluted earnings per share when it evaluates the
continuing operational performance of the Company, as it generally would not have otherwise incurred
these expenses in the periods presented as a part of its operations. The Company believes that these
non-GAAP financial measures are useful to investors because they allow investors to (a) evaluate the
Company's operating results and the effectiveness of the methodology used by management to review
the Company's operating results, and (b) review historical comparability in the Company's financial
reporting as well as comparability with competitors' operating results.
Tax Cuts and Jobs Act. The Company recorded charges in its income tax provision related to the
enactment of the Tax Cuts and Jobs Act, specifically for the transition tax related to unrepatriated cash.
Management excludes these charges for the purpose of calculating non-GAAP net income and non-GAAP
diluted earnings per share when it evaluates the continuing operational performance of the Company, as
(i) the charges are not expected to recur as part of its normal operations and (ii) the charges resulted from
the extremely infrequent event of major U.S. tax reform, the last such reform having occurred in 1986. The
Company believes that these non-GAAP financial measures are useful to investors because they allow
investors to (a) evaluate the Company's operating results and the effectiveness of the methodology used
by management to review the Company's operating results, and (b) review historical comparability in the
Company's financial reporting.
Non-GAAP financial measures are not in accordance with, or an alternative for, GAAP. The Company's
non-GAAP financial measures are not meant to be considered in isolation or as a substitute for
comparable GAAP financial measures and should be read only in conjunction with the Company's
consolidated financial statements prepared in accordance with GAAP.
The Company has provided a reconciliation of the non-GAAP financial measures to the most directly
comparable GAAP financial measures as listed below:
GAAP Reporting Measure Non-GAAP Reporting Measure
Revenue Non-GAAP Revenue
Operating Income Non-GAAP Operating Income
Operating Profit Margin Non-GAAP Operating Profit Margin
Net Income Non-GAAP Net Income
Diluted Earnings Per Share Non-GAAP Diluted Earnings Per Share
IR Contact:
Annette N. Arribas
(724) 820-3700