Embed Size (px)
Citation preview

Journals Library
DOI 10.3310/hta25030
Lansoprazole for persistent throat symptoms in secondary care: the TOPPITS RCT Janet A Wilson, Deborah D Stocken, Gillian C Watson, Tony Fouweather, Julian McGlashan, Kenneth MacKenzie, Paul Carding, Yakubu Karagama, Meredydd Harries, Stephen Ball, Sadie Khwaja, Declan Costello, Ruth Wood, Jan Lecouturier and James O’Hara
Health Technology AssessmentVolume 25 • Issue 3 • January 2021
ISSN 1366-5278


Lansoprazole for persistent throatsymptoms in secondary care:the TOPPITS RCT
Janet A Wilsono ,1,2* Deborah D Stockeno ,3
Gillian C Watsono ,4 Tony Fouweathero ,5
Julian McGlashano ,6 Kenneth MacKenzieo ,7
Paul Cardingo ,8 Yakubu Karagamao ,9
Meredydd Harrieso ,10 Stephen Ballo ,11
Sadie Khwajao ,12 Declan Costelloo ,13 Ruth Woodo ,4
Jan Lecouturiero 2 and James O’Harao1
1Ear, Nose and Throat Department, The Newcastle upon Tyne Hospitals NHSFoundation Trust, Newcastle upon Tyne, UK
2Institute of Health and Society, Newcastle University, Newcastle upon Tyne, UK3Leeds Institute of Clinical Trials Research, University of Leeds, Leeds, UK4Newcastle Clinical Trials Unit, Newcastle University, Newcastle upon Tyne, UK5Biostatistics Research Group, Institute of Health and Society, Newcastle University,Newcastle upon Tyne, UK
6Ear, Nose and Throat Department, Nottingham University Hospitals NHS Trust,Nottingham, UK
7Ear, Nose and Throat Department, NHS Greater Glasgow and Clyde, Glasgow, UK8Oxford Institute of Nursing, Midwifery and Allied Health Research, OxfordBrookes University, Oxford, UK
9Ear, Nose and Throat Department, Manchester University NHS Foundation Trust,Manchester, UK
10Ear, Nose and Throat Department, Brighton and Sussex University Hospitals NHSTrust, Brighton, UK
11Ear, Nose and Throat Department, City Hospitals Sunderland NHS Foundation Trust,Sunderland, UK
12Ear, Nose and Throat Department, Stockport NHS Foundation Trust, Stockport, UK13Ear, Nose and Throat Department, University Hospitals Birmingham NHSFoundation Trust, Birmingham, UK
*Corresponding author
Declared competing interests of authors: none
Published January 2021DOI: 10.3310/hta25030


This report should be referenced as follows:
Wilson JA, Stocken DD, Watson GC, Fouweather T, McGlashan J, MacKenzie K, et al.Lansoprazole for persistent throat symptoms in secondary care: the TOPPITS RCT. Health TechnolAssess 2021;25(3).
Health Technology Assessment is indexed and abstracted in Index Medicus/MEDLINE, ExcerptaMedica/EMBASE, Science Citation Index Expanded (SciSearch®) and Current Contents®/Clinical Medicine.

Health Technology Assessment HTA/HTA TAR
ISSN 1366-5278 (Print)
ISSN 2046-4924 (Online)
Impact factor: 3.370
Health Technology Assessment is indexed in MEDLINE, CINAHL, EMBASE, the Cochrane Library and Clarivate Analytics Science Citation Index.
This journal is a member of and subscribes to the principles of the Committee on Publication Ethics (COPE) (www.publicationethics.org/).
Editorial contact: [email protected]
The full HTA archive is freely available to view online at www.journalslibrary.nihr.ac.uk/hta. Print-on-demand copies can be purchased from thereport pages of the NIHR Journals Library website: www.journalslibrary.nihr.ac.uk
Criteria for inclusion in the Health Technology Assessment journalReports are published in Health Technology Assessment (HTA) if (1) they have resulted from work for the HTA programme, and (2) theyare of a sufficiently high scientific quality as assessed by the reviewers and editors.
Reviews in Health Technology Assessment are termed ‘systematic’ when the account of the search appraisal and synthesis methods(to minimise biases and random errors) would, in theory, permit the replication of the review by others.
HTA programmeHealth Technology Assessment (HTA) research is undertaken where some evidence already exists to show that a technology can be effectiveand this needs to be compared to the current standard intervention to see which works best. Research can evaluate any intervention used inthe treatment, prevention or diagnosis of disease, provided the study outcomes lead to findings that have the potential to be of direct benefitto NHS patients. Technologies in this context mean any method used to promote health; prevent and treat disease; and improve rehabilitationor long-term care. They are not confined to new drugs and include any intervention used in the treatment, prevention or diagnosis of disease.
The journal is indexed in NHS Evidence via its abstracts included in MEDLINE and its Technology Assessment Reports inform National Institutefor Health and Care Excellence (NICE) guidance. HTA research is also an important source of evidence for National Screening Committee (NSC)policy decisions.
This reportThe research reported in this issue of the journal was funded by the HTA programme as project number 12/01/04. The contractual start datewas in January 2014. The draft report began editorial review in September 2018 and was accepted for publication in June 2019. The authorshave been wholly responsible for all data collection, analysis and interpretation, and for writing up their work. The HTA editors and publisherhave tried to ensure the accuracy of the authors’ report and would like to thank the reviewers for their constructive comments on the draftdocument. However, they do not accept liability for damages or losses arising from material published in this report.
This report presents independent research funded by the National Institute for Health Research (NIHR). The views and opinions expressed byauthors in this publication are those of the authors and do not necessarily reflect those of the NHS, the NIHR, NETSCC, the HTA programmeor the Department of Health and Social Care. If there are verbatim quotations included in this publication the views and opinions expressedby the interviewees are those of the interviewees and do not necessarily reflect those of the authors, those of the NHS, the NIHR, NETSCC,the HTA programme or the Department of Health and Social Care.
© Queen’s Printer and Controller of HMSO 2021. This work was produced by Wilson et al. under the terms of a commissioningcontract issued by the Secretary of State for Health and Social Care. This issue may be freely reproduced for the purposes ofprivate research and study and extracts (or indeed, the full report) may be included in professional journals provided thatsuitable acknowledgement is made and the reproduction is not associated with any form of advertising. Applications forcommercial reproduction should be addressed to: NIHR Journals Library, National Institute for Health Research, Evaluation,Trials and Studies Coordinating Centre, Alpha House, University of Southampton Science Park, Southampton SO16 7NS, UK.
Published by the NIHR Journals Library (www.journalslibrary.nihr.ac.uk), produced by Prepress Projects Ltd, Perth, Scotland(www.prepress-projects.co.uk).

NIHR Journals Library Editor-in-Chief
Professor Ken Stein Professor of Public Health, University of Exeter Medical School, UK
NIHR Journals Library Editors
Professor John Powell Chair of HTA and EME Editorial Board and Editor-in-Chief of HTA and EME journals. Consultant Clinical Adviser, National Institute for Health and Care Excellence (NICE), UK, and Professor of Digital Health Care, Nuffield Department of Primary Care Health Sciences, University of Oxford, UK
Professor Andrée Le May Chair of NIHR Journals Library Editorial Group (HS&DR, PGfAR, PHR journals) and Editor-in-Chief of HS&DR, PGfAR, PHR journals
Professor Matthias Beck Professor of Management, Cork University Business School, Department of Management and Marketing, University College Cork, Ireland
Dr Tessa Crilly Director, Crystal Blue Consulting Ltd, UK
Dr Eugenia Cronin Senior Scientific Advisor, Wessex Institute, UK
Dr Peter Davidson Consultant Advisor, Wessex Institute, University of Southampton, UK
Ms Tara Lamont Senior Scientific Adviser (Evidence Use), Wessex Institute, University of Southampton, UK
Dr Catriona McDaid Senior Research Fellow, York Trials Unit, Department of Health Sciences, University of York, UK
Professor William McGuire Professor of Child Health, Hull York Medical School, University of York, UK
Professor Geoffrey Meads Emeritus Professor of Wellbeing Research, University of Winchester, UK
Professor James Raftery Professor of Health Technology Assessment, Wessex Institute, Faculty of Medicine, University of Southampton, UK
Dr Rob Riemsma Reviews Manager, Kleijnen Systematic Reviews Ltd, UK
Professor Helen Roberts Professor of Child Health Research, UCL Great Ormond Street Institute of Child Health, UK
Professor Jonathan Ross Professor of Sexual Health and HIV, University Hospital Birmingham, UK
Professor Helen Snooks Professor of Health Services Research, Institute of Life Science, College of Medicine, Swansea University, UK
Professor Ken Stein Professor of Public Health, University of Exeter Medical School, UK
Professor Jim Thornton Professor of Obstetrics and Gynaecology, Faculty of Medicine and Health Sciences, University of Nottingham, UK
Please visit the website for a list of editors: www.journalslibrary.nihr.ac.uk/about/editors
Editorial contact: [email protected]
NIHR Journals Library www.journalslibrary.nihr.ac.uk

Abstract
Lansoprazole for persistent throat symptoms in secondarycare: the TOPPITS RCT
Janet A Wilsono ,1,2* Deborah D Stockeno ,3 Gillian C Watsono ,4
Tony Fouweathero ,5 Julian McGlashano ,6 Kenneth MacKenzieo ,7
Paul Cardingo ,8 Yakubu Karagamao ,9 Meredydd Harrieso ,10
Stephen Ballo ,11 Sadie Khwajao ,12 Declan Costelloo ,13 Ruth Woodo ,4
Jan Lecouturiero 2 and James O’Harao 1
1Ear, Nose and Throat Department, The Newcastle upon Tyne Hospitals NHS Foundation Trust,Newcastle upon Tyne, UK
2Institute of Health and Society, Newcastle University, Newcastle upon Tyne, UK3Leeds Institute of Clinical Trials Research, University of Leeds, Leeds, UK4Newcastle Clinical Trials Unit, Newcastle University, Newcastle upon Tyne, UK5Biostatistics Research Group, Institute of Health and Society, Newcastle University, Newcastle uponTyne, UK
6Ear, Nose and Throat Department, Nottingham University Hospitals NHS Trust, Nottingham, UK7Ear, Nose and Throat Department, NHS Greater Glasgow and Clyde, Glasgow, UK8Oxford Institute of Nursing, Midwifery and Allied Health Research, Oxford Brookes University,Oxford, UK
9Ear, Nose and Throat Department, Manchester University NHS Foundation Trust, Manchester, UK10Ear, Nose and Throat Department, Brighton and Sussex University Hospitals NHS Trust, Brighton, UK11Ear, Nose and Throat Department, City Hospitals Sunderland NHS Foundation Trust, Sunderland, UK12Ear, Nose and Throat Department, Stockport NHS Foundation Trust, Stockport, UK13Ear, Nose and Throat Department, University Hospitals Birmingham NHS Foundation Trust,Birmingham, UK
*Corresponding author [email protected]
Background: Persistent throat symptoms are commonly attributed to ‘laryngopharyngeal reflux’.Despite a limited evidence base, these symptoms are increasingly being treated in primary care withproton pump inhibitors.
Objective: To assess the value of proton pump inhibitor therapy in patients with persistent throat symptoms.
Design: This was a double-blind, placebo-controlled, randomised Phase III trial.
Setting: This was a multicentre UK trial in eight UK ear, nose and throat departments.
Participants: A total of 346 participants aged ≥ 18 years with persistent throat symptoms and a RefluxSymptom Index score of ≥ 10, exclusive of the dyspepsia item, were recruited.
Intervention: Random allocation (1 : 1 ratio) to either 30 mg of lansoprazole twice daily or matchedplacebo for 16 weeks.
Main outcome measure: Symptomatic response (i.e. total Reflux Symptom Index score after 16 weeksof therapy).
DOI: 10.3310/hta25030 HEALTH TECHNOLOGY ASSESSMENT 2021 VOL. 25 NO. 3
© Queen’s Printer and Controller of HMSO 2021. This work was produced by Wilson et al. under the terms of a commissioning contract issued by the Secretary of State forHealth and Social Care. This issue may be freely reproduced for the purposes of private research and study and extracts (or indeed, the full report) may be included in professionaljournals provided that suitable acknowledgement is made and the reproduction is not associated with any form of advertising. Applications for commercial reproduction shouldbe addressed to: NIHR Journals Library, National Institute for Health Research, Evaluation, Trials and Studies Coordinating Centre, Alpha House, University of Southampton SciencePark, Southampton SO16 7NS, UK.
vii

Results: A total of 1427 patients were screened and 346 were randomised. The mean age was 52 years(standard deviation 13.7 years, range 20–84 years); 150 (43%) participants were male and 196 (57%)were female; 184 (53%) participants had a mild Reflux Symptom Index minus the heartburn/dyspepsiaitem and 162 (47%) had a severe Reflux Symptom Index minus the heartburn/dyspepsia item. A total of172 patients were randomised to lansoprazole and 174 were randomised to placebo.
Main outcomes: A total of 267 participants completed the primary end-point visit (lansoprazole, n = 127;placebo, n = 140), of whom 220 did so between 14 and 20 weeks post randomisation (‘compliant’ group);102 received lansoprazole and 118 received placebo. The mean Reflux Symptom Index scores at baselinewere similar [lansoprazole 22.0 (standard deviation 8.0), placebo 21.7 (standard deviation 7.1), overall 21.9(standard deviation 7.5)]. The mean Reflux Symptom Index scores at 16 weeks reduced from baseline inboth groups [overall 17.4 (standard deviation 9.9), lansoprazole 17.4 (standard deviation 9.9), placebo15.6 (standard deviation 9.8)]. Lansoprazole participants had estimated Reflux Symptom Index scores at16 weeks that were 1.9 points higher (worse) than those of placebo participants (95% confidence interval–0.3 to 4.2; padj = 0.096), adjusted for site and baseline severity.
Secondary outcomes: Ninety-five (43%) participants achieved a Reflux Symptom Index score in thenormal range (< 12) at 16 weeks: 42 (41%) in the lansoprazole group and 53 (45%) in the placebo group.A total of 226 participants completed the end-of-trial follow-up visit (lansoprazole, n = 109; placebo,n = 117), of whom 181 were ‘compliant’. The mean Reflux Symptom Index scores at 12 months reducedfrom baseline in both groups [lansoprazole 16.0 (standard deviation 10.8), placebo 13.6 (standard deviation9.6), overall 14.7 (standard deviation 10.2)]. A total of 87 (48%) participants achieved a Reflux SymptomIndex score in the normal range at 12 months: 33 (40%) in the lansoprazole group and 54 (55%) in theplacebo group. Likewise, the Comprehensive Reflux Symptom Score and Laryngopharyngeal Reflux –Health Related Quality of Life total scores and subscales all showed very similar changes in thelansoprazole and placebo cohorts at both 16 weeks and 12 months.
Limitations: Drop-out rate and compliance are issues in pragmatic clinical trials. The Trial Of Proton PumpInhibitors in Throat Symptoms (TOPPITS) aimed to detect clinically relevant difference with 90% power.The 346 randomised participants reduced to 283 at the primary end point; 267 completed the primaryoutcome measure, 220 within the protocol time scale. Despite this, the powers to detect the clinicallyrelevant difference in Reflux Symptom Index score at 16 weeks were 82% (compliant comparison) and89% (pragmatic comparison). The lack of difference between lansoprazole and placebo is generalisableacross NHS clinics.
Conclusions: Participants on lansoprazole did not report significantly better outcomes than participantson placebo on any of the three patient-reported outcome tools (Reflux Symptom Index, ComprehensiveReflux Symptom Score and Laryngopharyngeal Reflux – Health Related Quality of Life). This multicentre,pragmatic, powered, definitive Phase III trial found no evidence of benefit for patients by treatingpersistent throat symptoms with lansoprazole.
Trial registration: Current Controlled Trials ISRCTN38578686 and EudraCT number 2013-004249-17.
Funding: This project was funded by the National Institute for Health Research (NIHR) Health TechnologyAssessment programme and will be published in full in Health Technology Assessment; Vol. 25, No. 3.See the NIHR Journals Library website for further project information.
ABSTRACT
NIHR Journals Library www.journalslibrary.nihr.ac.uk
viii
Contents
List of tables xiii
List of figures xvii
List of supplementary material xix
List of abbreviations xxi
Plain English summary xxiii
Scientific summary xxv
Chapter 1 Introduction 1Background 1Rationale 1Measuring treatment responses in throat symptoms 2
Varying average baseline Reflux Symptom Index scores in different reported series 3Description of the Comprehensive Reflux Symptom Score questionnaire 4Quality-of-life impact of throat symptoms: the Laryngopharyngeal Reflux Health RelatedQuality of Life questionnaire 4
Laryngopharyngeal Reflux – Health Related Quality of Life questionnaire components 5Trial objectives 5
Primary objective 6Secondary objectives 6
Treatment choice in TOPPITS 6
Chapter 2 Methods 7Setting and conduct 7Patient and public involvement 7Planned patient and public involvement for the duration of the trial 8
Attempt to implement the TOPPITS User Forum 8Trial design 9Patients 9Inclusion criteria 10Exclusion criteria 10Recruitment 11
Screening 11Consent 11
Randomisation 11Allocation concealment mechanism 11Implementation 11
Medication 12Blinding 12Outcomes 12Secondary outcome measures 13
Laryngoscopy 13Sample size 13Statistical methods 14
DOI: 10.3310/hta25030 HEALTH TECHNOLOGY ASSESSMENT 2021 VOL. 25 NO. 3
© Queen’s Printer and Controller of HMSO 2021. This work was produced by Wilson et al. under the terms of a commissioning contract issued by the Secretary of State forHealth and Social Care. This issue may be freely reproduced for the purposes of private research and study and extracts (or indeed, the full report) may be included in professionaljournals provided that suitable acknowledgement is made and the reproduction is not associated with any form of advertising. Applications for commercial reproduction shouldbe addressed to: NIHR Journals Library, National Institute for Health Research, Evaluation, Trials and Studies Coordinating Centre, Alpha House, University of Southampton SciencePark, Southampton SO16 7NS, UK.
ix

Definition of ‘compliant intention-to-treat group’ 15Data management 16
Chapter 3 Results 17Screening and recruitment 18
Recruitment overview 18Randomisation 18Withdrawals 18Baseline data 18Data quality 21
Questionnaires and forms returned, by visit 21Laryngoscopy assessment 22
Treatment received 22Protocol treatment schedule 22Medication received 22Proton pump use and concomitant medication 22Awareness of treatment group by patients 24
Outcomes and estimation of treatment effects 24Primary outcome measure 24Baseline itemised severity scores: Reflux Symptom Index in all patients and thecompliant group 25Reflux Symptom Index score at baseline for the compliant analysis group (n = 220) 25Reflux Symptom Index score at 16 weeks (primary end point) for the compliantanalysis group 26Univariate analysis of unadjusted primary outcome measure for the compliantanalysis group 26Comparison of Reflux Symptom Index scores at baseline and 16 weeks with thepublished upper limit of normal range, for the compliant intention-to-treat analysis group 28
Multivariable analysis of primary outcome for the compliant intention-to-treat analysis group 28Statistical modelling of the primary outcome 29Sensitivity analysis of the primary outcome 32
Secondary analysis of the primary outcome measure using derived Reflux Symptom Indexminus the heartburn/dyspepsia item 33
Change in Reflux Symptom Index minus the heartburn/dyspepsia item score frombaseline to 16 weeks for the compliant intention-to-treat group 34
Secondary outcome measures 36Reflux Symptom Index at the 12-month follow-up for the compliant intention-to-treatgroup 36Reflux Symptom Index scores at the 12-month follow-up within the published normalrange (< 12) for the compliant intention-to-treat group 38
Multivariable analysis of Reflux Symptom Index at 12 months for the compliantintention-to-treat group 39Reflux Finding Score for the compliant intention-to-treat group 39Reflux Finding Score at baseline for the compliant intention-to-treat group 39The utility of the Reflux Finding Score as a response predictor for the compliantintention-to-treat group 40Comprehensive Reflux Symptom Score 40
Comprehensive Reflux Symptom Score total and subscale scores baseline descriptiveanalysis: compliant intention-to-treat analysis group 40Baseline itemised severity score: Comprehensive Reflux Symptom Score 40Comprehensive Reflux Symptom Score subscale scores as covariates for RefluxSymptom Index at 16 weeks 40
CONTENTS
NIHR Journals Library www.journalslibrary.nihr.ac.uk
x
Laryngopharyngeal Reflux – Health Related Quality of Life questionnaire 42Baseline Laryngopharyngeal Reflux – Health Related Quality of Life scores 42Laryngopharyngeal Reflux – Health Related Quality of Life at primary end point(16-week follow-up) 42Laryngopharyngeal Reflux – Health Related Quality of Life at 12-month follow-up(visit 3) 42Plots of laryngopharyngeal reflux health-related quality of life 45Standardised area under the curve for overall Laryngopharyngeal Reflux – HealthRelated Quality of Life 46Repeated-measures mixed model 46
Summary of Reflux Symptom Index, total Comprehensive Reflux Symptom Score andLaryngopharyngeal Reflux – Health Related Quality of Life scores for the compliantgroup at all three time points 47Patient satisfaction with TOPPITS 47Safety 47
Adverse events for the per-treatment analysis group 48Serious adverse events for the per-treatment analysis group 49
Chapter 4 Discussion 51Terminology 51Recent reports on epidemiology of persistent throat symptoms 52Perception of reflux causation of persistent throat symptoms in general practice 52What does TOPPITS tell us about the impact of proton pump inhibitor treatment onthroat symptoms? 53Awareness of treatment group by patients 54The recent TOPPITS context 54Proton pump inhibitor risk 55Alginate/alkaline water 56The Comprehensive Reflux Symptom Score 56The Reflux Finding Score is unreliable 56Update on pH-metry and manometry in throat symptoms 57Throat symptom patient-reported outcome tools 57Psychological aspects 58Psychophysiological mechanisms 59Potential methods to address the limitations encountered in TOPPITS patient and publicinvolvement 59
Generalisability 59Interpretation 59Potential bias 60
Chapter 5 Conclusions 61Health-care implications 61Pursuit of alternative treatments 61
Mucosal protection 61Lifestyle modification 61
Other pathways/future work 61
Acknowledgements 63
References 65
DOI: 10.3310/hta25030 HEALTH TECHNOLOGY ASSESSMENT 2021 VOL. 25 NO. 3
© Queen’s Printer and Controller of HMSO 2021. This work was produced by Wilson et al. under the terms of a commissioning contract issued by the Secretary of State forHealth and Social Care. This issue may be freely reproduced for the purposes of private research and study and extracts (or indeed, the full report) may be included in professionaljournals provided that suitable acknowledgement is made and the reproduction is not associated with any form of advertising. Applications for commercial reproduction shouldbe addressed to: NIHR Journals Library, National Institute for Health Research, Evaluation, Trials and Studies Coordinating Centre, Alpha House, University of Southampton SciencePark, Southampton SO16 7NS, UK.
xi

Appendix 1 Screening, recruitment and withdrawal data 75
Appendix 2 Details of patients in relation to per-treatment analysis andconcomitant medications 83
Appendix 3 Baseline data: itemised severity scores for Reflux Symptom Index;Reflux Finding Score scoring 87
Appendix 4 Multivariable analysis of Reflux Symptom Index minus the heartburn/dyspepsia item for the compliant intention-to-treat group 89
Appendix 5 Secondary analysis of the primary outcome measure (RefluxSymptom Index): pragmatic and per-protocol groups 93
Appendix 6 Secondary analysis of the primary outcome measure having excludedthe heartburn component of Reflux Symptom Index (Reflux Symptom Indexminus the heartburn/dyspepsia item): pragmatic group 97
Appendix 7 Analysis of covariance of Reflux Symptom Index at 12 months 99
Appendix 8 Consideration of the weight of baseline Reflux Finding Score inmodelling the primary outcome: Reflux Symptom Index at 16 weeks 103
Appendix 9 Comprehensive Reflux Symptom Score total and subscale 16-weekfollow-up scores descriptive analysis: compliant intention-to-treat analysis group(n= 220) 105
Appendix 10 Laryngopharyngeal Reflux – Health Related Quality of Lifetabulated thermometer and domain scores 115
CONTENTS
NIHR Journals Library www.journalslibrary.nihr.ac.uk
xii

List of tables
TABLE 1 Baseline demographic characteristics and stratification variables,by treatment group (all randomised patients and the pragmatic ITT group)(primary outcome provided at any time) 19
TABLE 2 Baseline demographic characteristics, by treatment group(compliant ITT group) 20
TABLE 3 Concomitant medication reported at baseline and follow-up visits(per-treatment group) 23
TABLE 4 Patient assessment of drug taken 24
TABLE 5 Primary outcome measure: RSI at baseline (visit 1) (compliant ITT group) 25
TABLE 6 Primary outcome measure: total RSI at the 16-week follow-up (visit 2)(compliant ITT group) 26
TABLE 7 Change in RSI (0 to 16 weeks) (compliant ITT group) 28
TABLE 8 Primary outcome measure as response, with adjustment for site andbaseline severity (compliant ITT group) 29
TABLE 9 Results of multilevel mixed-effect linear regression (model 1), adjustedfor stratification factors used at randomisation (site and baseline severity)(compliant ITT group) (n= 220) 29
TABLE 10 Results of multilevel mixed-effect linear regression (model 2), adjustedfor the stratification factor site used at randomisation and continuous baselineseverity (compliant ITT group) (n= 220) 31
TABLE 11 Univariate relationships including transformed continuous covariates 33
TABLE 12 Summary of model results for compliant and pragmatic ITT populations 33
TABLE 13 The RSI-HB at baseline (visit 1) (compliant ITT group) 34
TABLE 14 The RSI-HB at the 16-week follow-up (visit 2) (compliant ITT group) 34
TABLE 15 Change in RSI-HB (compliant ITT group) 35
TABLE 16 Descriptive analysis of RSI scores at 12 months (compliant ITT group) 36
TABLE 17 Median, IQR and range at baseline, 16 weeks and 12 months and theassociated median differences (compliant ITT group) 37
TABLE 18 The RFS total scores at baseline (visit 1) (compliant ITT group) 39
TABLE 19 The CReSS total and subscale scores at baseline (visit 1) (compliantITT group) 41
DOI: 10.3310/hta25030 HEALTH TECHNOLOGY ASSESSMENT 2021 VOL. 25 NO. 3
© Queen’s Printer and Controller of HMSO 2021. This work was produced by Wilson et al. under the terms of a commissioning contract issued by the Secretary of State forHealth and Social Care. This issue may be freely reproduced for the purposes of private research and study and extracts (or indeed, the full report) may be included in professionaljournals provided that suitable acknowledgement is made and the reproduction is not associated with any form of advertising. Applications for commercial reproduction shouldbe addressed to: NIHR Journals Library, National Institute for Health Research, Evaluation, Trials and Studies Coordinating Centre, Alpha House, University of Southampton SciencePark, Southampton SO16 7NS, UK.
xiii

TABLE 20 The LPR-HRQL baseline scores (compliant ITT group) (n= 220;lansoprazole= 102, placebo= 118) 43
TABLE 21 The LPR-HRQL scores at the 16-week follow-up (compliant ITT group)(n= 220) 44
TABLE 22 Mixed-effects multilevel regression (n= 220) 46
TABLE 23 Summary of total RSI/CReSS/LPR-HRQL (overall) scores at three timepoints (compliant group, n= 220) 47
TABLE 24 Adverse events that occurred while the patient was taking allocatedtreatment (per-treatment group) 48
TABLE 25 Reported AEs (per-treatment group) (three AEs with missing datesare excluded) 48
TABLE 26 Numbers of patients screened and recruited, by site 75
TABLE 27 Pattern of recruitment over time, by site 76
TABLE 28 Definitions of participant groups for analysis 78
TABLE 29 Proportion of participants in each treatment group, by stratificationfactor baseline severity (compliant ITT group) 79
TABLE 30 Stratification status, by baseline RSI-HB score 79
TABLE 31 Ineligible patients with reasons 79
TABLE 32 Withdrawals and loss to follow-up in terms of the primary end-pointvisit (visit 2) and outcome measure 80
TABLE 33 Time in weeks from randomisation to withdrawal (or loss to follow-up) 80
TABLE 34 Number of RSI items at baseline and 16-week follow-up, with follow-upcompleted at various times after randomisation 81
TABLE 35 Recent PPI use at randomisation 83
TABLE 36 The washout period 83
TABLE 37 Assessment of doses taken per protocol 84
TABLE 38 Itemised scores for RSI (item range: 0–5) for the trial population (n= 342) 87
TABLE 39 Differences in itemised baseline RSI scores in the compliant ITT group(n= 220) 87
TABLE 40 Scoring scheme for the RFS assessment (as originally published byBelafsky et al. 2001) 88
LIST OF TABLES
NIHR Journals Library www.journalslibrary.nihr.ac.uk
xiv

TABLE 41 The RSI-HB scores at the 16-week follow-up, as response with adjustmentfor site and baseline severity 89
TABLE 42 The RSI-HB results of multilevel mixed-effect linear regression (model 1)(compliant ITT group) (n= 220) 90
TABLE 43 The RSI-HB results of multilevel mixed-effect linear regression (model 2)(compliant ITT group) (n= 220) 90
TABLE 44 Univariate relationships including transformed continuous covariates(compliant ITT group) (n= 220) 91
TABLE 45 Univariate relationships for continuous and transformed RFSs withprimary outcome measure (RSI at 16 weeks) (compliant ITT group) (n= 167) 92
TABLE 46 Primary outcome measure (RSI) for the pragmatic ITT population 93
TABLE 47 Primary outcome measure as response with adjustment for site andbaseline severity for the pragmatic ITT analysis group 94
TABLE 48 Primary outcome measure as response with adjustment forstratification and other baseline factors (pragmatic ITT group) 94
TABLE 49 Primary outcome measure (RSI) at 16 weeks for the per-protocolpopulation 96
TABLE 50 The RSI-HB for the pragmatic ITT population 97
TABLE 51 The RSI at 12 months as response with adjustment for stratificationand other baseline factors 99
TABLE 52 Results of multilevel mixed-effect linear regression (model 1) at12 months post randomisation (compliant ITT group) (n= 181) 100
TABLE 53 Results of multilevel mixed-effect linear regression (model 2) at12 months post randomisation (compliant ITT group) (n= 181) 101
TABLE 54 Univariate demographic relationships including transformedcontinuous covariates for RSI response at 12 months (compliant ITT group)(n= 178) 101
TABLE 55 Univariate relationships for continuous and transformed RFS withprimary outcome measure (RSI at 16 weeks) (compliant ITT group) (n= 167) 103
TABLE 56 The CReSS total and subscale scores at the primary end point(16 weeks, visit 2) for the compliant ITT population 106
TABLE 57 Transformations of continuous CReSS total and subscale scorecovariates and relationship with RSI at 16 weeks (n= 215) 107
TABLE 58 The CReSS total and subscale scores at the 12-month follow-up (visit 3)for the compliant ITT population 112
DOI: 10.3310/hta25030 HEALTH TECHNOLOGY ASSESSMENT 2021 VOL. 25 NO. 3
© Queen’s Printer and Controller of HMSO 2021. This work was produced by Wilson et al. under the terms of a commissioning contract issued by the Secretary of State forHealth and Social Care. This issue may be freely reproduced for the purposes of private research and study and extracts (or indeed, the full report) may be included in professionaljournals provided that suitable acknowledgement is made and the reproduction is not associated with any form of advertising. Applications for commercial reproduction shouldbe addressed to: NIHR Journals Library, National Institute for Health Research, Evaluation, Trials and Studies Coordinating Centre, Alpha House, University of Southampton SciencePark, Southampton SO16 7NS, UK.
xv

TABLE 59 Univariate models for RSI at 16 weeks with baseline severityrepresented by baseline RSI-HB or any one of the baseline CReSS total/subscales(n= 215) 113
TABLE 60 Summary of multivariable models for RSI at 16 weeks and baselineCReSS domain predictors (n= 215) 113
TABLE 61 Multivariable models comparing the ability of baseline CReSS andcontinuous RSI-HB scores, adjusted by site, to predict RSI at 16 weeks (n= 215;model 5) 114
TABLE 62 Baseline thermometers of LPR-HRQL scales 115
TABLE 63 Primary end-point (16 weeks) thermometers for LPR-HRQL scales 115
TABLE 64 The LPR-HRQL scores at the 12-month follow-up (compliant ITT group) 116
TABLE 65 The 12-month follow-up thermometers of LPR-HRQL scales 117
LIST OF TABLES
NIHR Journals Library www.journalslibrary.nihr.ac.uk
xvi

List of figures
FIGURE 1 Histogram of time between randomisation and the 16-week follow-upvisit in 283 patients 15
FIGURE 2 The CONSORT flow diagram 17
FIGURE 3 Histogram of time between randomisation and the primary end-point16-week follow-up visit (overall) 24
FIGURE 4 Underlying distribution of RSI at baseline (compliant ITT group) 25
FIGURE 5 Underlying distribution of RSI at the primary end-point visit (compliantITT group) 26
FIGURE 6 Box plots showing medians, IQRs and overall ranges of RSI score atbaseline and primary end-point visit (compliant ITT group) 27
FIGURE 7 Box plots showing medians, IQRs and overall ranges for change in RSIscore from baseline to the 16-week follow-up (compliant ITT group) 28
FIGURE 8 Scatterplot of residuals for model 1 (both groups combined, n= 220)(compliant ITT group) 30
FIGURE 9 Histogram of residuals for model 1 (both groups combined, n= 220)(compliant ITT group) 31
FIGURE 10 Scatterplot of residuals for model 2 (both groups combined, n= 220)(compliant ITT group) 32
FIGURE 11 Histogram of residuals for model 2 (both groups combined, n= 220)(compliant ITT group) 32
FIGURE 12 Box plots showing medians, IQRs and overall ranges of the RSI-HBscore at baseline and 16-week follow-up (compliant ITT group) 35
FIGURE 13 Box plots showing medians, IQRs and overall ranges of change inRSI-HB score from baseline to the 16-week follow-up (compliant ITT group) 36
FIGURE 14 Box plots showing medians, IQRs and overall ranges of RSI score atbaseline, 16 weeks and 12 months (compliant ITT group) 38
FIGURE 15 Scatterplot of the relationship between the total CReSS and RSI atbaseline (compliant ITT group, n= 215) 42
FIGURE 16 The LPR-HRQL overall subscale scores aggregated at visits, bytreatment group 45
FIGURE 17 The CReSS total scores at baseline and follow-up visits for thecompliant ITT population (median, IQR and overall range) 108
DOI: 10.3310/hta25030 HEALTH TECHNOLOGY ASSESSMENT 2021 VOL. 25 NO. 3
© Queen’s Printer and Controller of HMSO 2021. This work was produced by Wilson et al. under the terms of a commissioning contract issued by the Secretary of State forHealth and Social Care. This issue may be freely reproduced for the purposes of private research and study and extracts (or indeed, the full report) may be included in professionaljournals provided that suitable acknowledgement is made and the reproduction is not associated with any form of advertising. Applications for commercial reproduction shouldbe addressed to: NIHR Journals Library, National Institute for Health Research, Evaluation, Trials and Studies Coordinating Centre, Alpha House, University of Southampton SciencePark, Southampton SO16 7NS, UK.
xvii

FIGURE 18 The CReSS oesophageal subscale scores at baseline and follow-up forthe compliant ITT population 109
FIGURE 19 The CReSS upper airway subscale scores at baseline and follow-upvisits for the compliant ITT population 110
FIGURE 20 The CReSS pharyngeal subscale scores at baseline and follow-up forthe compliant ITT population 111
LIST OF FIGURES
NIHR Journals Library www.journalslibrary.nihr.ac.uk
xviii
List of supplementary material
Report Supplementary Material 1 Supplementary tables and figures
Supplementary material can be found on the NIHR Journals Library report page(https://doi.org/10.3310/hta25030).
Supplementary material has been provided by the authors to support the report and any filesprovided at submission will have been seen by peer reviewers, but not extensively reviewed.Any supplementary material provided at a later stage in the process may not have beenpeer reviewed.
DOI: 10.3310/hta25030 HEALTH TECHNOLOGY ASSESSMENT 2021 VOL. 25 NO. 3
© Queen’s Printer and Controller of HMSO 2021. This work was produced by Wilson et al. under the terms of a commissioning contract issued by the Secretary of State forHealth and Social Care. This issue may be freely reproduced for the purposes of private research and study and extracts (or indeed, the full report) may be included in professionaljournals provided that suitable acknowledgement is made and the reproduction is not associated with any form of advertising. Applications for commercial reproduction shouldbe addressed to: NIHR Journals Library, National Institute for Health Research, Evaluation, Trials and Studies Coordinating Centre, Alpha House, University of Southampton SciencePark, Southampton SO16 7NS, UK.
xix


List of abbreviations
AE adverse event
AIC Akaike information criterion
ANCOVA analysis of covariance
BMI body mass index
CI confidence interval
CONSORT Consolidated Standards ofReporting Trials
CReSS Comprehensive Reflux SymptomScore
DMC Data Monitoring Committee
ENT ear, nose and throat
EOR extraesophageal reflux
GORD gastroesophageal reflux disease
GP general practitioner
HR hazard ratio
IMP investigational medicinal product
IQR interquartile range
ISF investigator site file
ITT intention to treat
LPR laryngopharyngeal reflux
LPR-HRQL Laryngopharyngeal Reflux – HealthRelated Quality of Life
MII-pH multichannel intraluminalimpedance and pH
NCTU Newcastle Clinical Trials Unit
OR odds ratio
PIS patient information sheet
PPI proton pump inhibitor
RCT randomised controlled trial
RFS Reflux Finding Score
RSI Reflux Symptom Index
RSI-HB Reflux Symptom Index minus theheartburn/dyspepsia item
SAE serious adverse event
SAUC standardised area under the curve
SD standard deviation
SMD standardised mean difference
TOPPITS Trial Of Proton Pump Inhibitors inThroat Symptoms
TSC Trial Steering Committee
TUF TOPPITS User Forum
UOS upper oesophageal sphincter
DOI: 10.3310/hta25030 HEALTH TECHNOLOGY ASSESSMENT 2021 VOL. 25 NO. 3
© Queen’s Printer and Controller of HMSO 2021. This work was produced by Wilson et al. under the terms of a commissioning contract issued by the Secretary of State forHealth and Social Care. This issue may be freely reproduced for the purposes of private research and study and extracts (or indeed, the full report) may be included in professionaljournals provided that suitable acknowledgement is made and the reproduction is not associated with any form of advertising. Applications for commercial reproduction shouldbe addressed to: NIHR Journals Library, National Institute for Health Research, Evaluation, Trials and Studies Coordinating Centre, Alpha House, University of Southampton SciencePark, Southampton SO16 7NS, UK.
xxi


Plain English summary
Background
One of the commonest reasons for patients attending hospital throat or voice clinics is persistent throatsymptoms, which include a feeling of a lump in the throat, a cough or a hoarse voice. Over time, moreof these patients are being treated with proton pump inhibitors to suppress stomach acid in the belief thatstomach acid entering the throat causes the symptoms, but there is little evidence that these medications work.
Study aim
The aim of this study is to explore whether or not having a 16-week course of proton pump inhibitorshas any impact on throat symptoms. We also tested the usefulness of three different questionnaires inmeasuring throat symptoms, explored side effects and whether or not patients adhere to treatment,and measured patients’ quality of life.
Methods
Patients with persistent (lasting for more than 6 weeks) throat symptoms who agreed to participate wererandomised to receive either the proton pump inhibitor lansoprazole or a placebo. Participants tooklansoprazole or placebo for 16 weeks. Symptoms and quality of life were measured before patients wererandomised and at 4 and 12 months after randomisation.
Results
The total number of participants was 346. The mean Reflux Symptom Index outcome score (higher scoresmeaning worse symptoms) was 22 before the 4-month course of capsules, 16 after 4 months and 15 after12 months. Participant-reported throat symptoms and quality of life in all participants improved over the12 months of the study. There was no difference in the symptom improvement experienced by protonpump inhibitor and placebo participants.
Conclusions
This study shows that proton pump inhibitors do not benefit patients with persistent throat symptoms.Future research should focus on other available therapies.
DOI: 10.3310/hta25030 HEALTH TECHNOLOGY ASSESSMENT 2021 VOL. 25 NO. 3
© Queen’s Printer and Controller of HMSO 2021. This work was produced by Wilson et al. under the terms of a commissioning contract issued by the Secretary of State forHealth and Social Care. This issue may be freely reproduced for the purposes of private research and study and extracts (or indeed, the full report) may be included in professionaljournals provided that suitable acknowledgement is made and the reproduction is not associated with any form of advertising. Applications for commercial reproduction shouldbe addressed to: NIHR Journals Library, National Institute for Health Research, Evaluation, Trials and Studies Coordinating Centre, Alpha House, University of Southampton SciencePark, Southampton SO16 7NS, UK.
xxiii


Scientific summary
Background
Persistent throat symptoms, such as globus pharyngeus, catarrh, throat clearing and recurrent hoarseness,are among the commonest reasons for attendance at secondary care throat or voice clinics. There is agrowing trend to treat throat symptom patients with proton pump inhibitors to suppress stomach acid, inthe belief that acid refluxing into the throat leads to the symptoms. However, most controlled studies failto demonstrate a significant benefit of proton pump inhibitors over placebo. In addition, patient views onproton pump inhibitor use vary widely.
Objectives
Primary objectiveTo compare the symptomatic response in patients with persistent throat symptoms at the end of 16 weeks’therapy with lansoprazole versus placebo.
Secondary objectives
l To explore recruitment feasibility using an internal pilot.l To compare the symptom response at 12 months with that at 16 weeks.l To assess potential outcome predictors, namely the Reflux Symptom Index, the Comprehensive Reflux
Symptom Score, the Reflux Finding Score laryngoscopic evaluation, age, sex, smoking and bodymass index.
l To assess side effects, treatment compliance and use of self-pay medications.l To compare changes in disease-specific quality of life as assessed by the Laryngopharyngeal Reflux –
Health Related Quality of Life.
Methods
Setting and conductThis multicentre trial was conducted at eight UK NHS sites, recruiting participants from 28 April 2014 to28 February 2017. The trial received a favourable ethics opinion from the National Research Ethics ServiceCommittee North East – Tyne and Wear South (reference: 13/NE/0336) on 2 December 2013 and a ClinicalTrial Authorisation from the Medicines and Healthcare products Regulatory Agency on 12 February 2014.A trial-specific website (www.TOPPITS.co.uk) was designed.
Trial designThis was a multicentre, Phase III, randomised, double-blind, placebo-controlled trial, with an internalfeasibility pilot, carried out in secondary care. Patients with persistent throat symptoms were identified andrecruited from NHS ear, nose and throat clinics. This was a pragmatic trial designed to mirror current NHSclinical practice. Participants were randomised in a double-blind fashion between two treatment groups ina 1 : 1 ratio, stratified by centre and baseline severity [on the basis of the Reflux Symptom Index scoreomitting item 9 (‘Heart burn, chest pain, indigestion, or stomach acid coming up’), hereinafter referred toas Reflux Symptom Index minus the heartburn/dyspepsia item (range 0–40)]. The ‘mild’ cohort had RefluxSymptom Index minus the heartburn/dyspepsia item scores of 10–20 (inclusive) and the ‘severe’ cohort hadscores of > 20.
DOI: 10.3310/hta25030 HEALTH TECHNOLOGY ASSESSMENT 2021 VOL. 25 NO. 3
© Queen’s Printer and Controller of HMSO 2021. This work was produced by Wilson et al. under the terms of a commissioning contract issued by the Secretary of State forHealth and Social Care. This issue may be freely reproduced for the purposes of private research and study and extracts (or indeed, the full report) may be included in professionaljournals provided that suitable acknowledgement is made and the reproduction is not associated with any form of advertising. Applications for commercial reproduction shouldbe addressed to: NIHR Journals Library, National Institute for Health Research, Evaluation, Trials and Studies Coordinating Centre, Alpha House, University of Southampton SciencePark, Southampton SO16 7NS, UK.
xxv

Inclusion criteria
l Referred with a history of throat symptoms (globus pharyngeus, hoarseness, throat clearing, throatdiscomfort, choking spasms, excess mucus/postnasal drip, otherwise unexplained night-time cough orchoking) that had been persistent for at least 6 weeks.
l Score of ≥ 10 on the non-heartburn items of the Reflux Symptom Index.
Exclusion criteria
l Reflux Symptom Index minus the heartburn/dyspepsia item score of < 10.l Unwilling to undergo flexible endoscopy.l Aged < 18 years.l Endoscopic evidence of specific laryngopharyngeal pathology that would ordinarily be treated by
surgical intervention or be investigated by specific investigations.l Performing voice users.l Pregnancy.l Currently on acid suppressants, acid neutralisers and alginates and unwilling to discontinue use for
(1) a 4-week pre-study washout period in the case of proton pump inhibitor usage or (2) a 24-hourperiod for alginate or acid neutraliser.
RandomisationA blocked allocation (permuted random blocks of variable length) system was used to allocate participants ina 1 : 1 ratio, stratified by centre and baseline severity (Reflux Symptom Index minus the heartburn/dyspepsiaitem score: group 1, ≤ 20; group 2, > 20).
InterventionsThe active intervention was a 16-week course of a 30-mg twice-daily dose of the proton pump inhibitorlansoprazole. The control group received a 16-week course of twice-daily matched placebo.
Outcomes
Primary outcomeThe primary outcome measure was the symptomatic response measured using the Reflux Symptom Indexin patients with persistent throat symptoms at the end of 16 weeks’ therapy with lansoprazole versusplacebo. The Reflux Symptom Index score is calculated from a nine-item, self-administered questionnairescored on a Likert scale with each item score ranging from 0 to 5, giving a total score range of 0–45.A higher score indicates more severe symptoms.
Secondary outcome measures
l Reflux Symptom Index changes at 12 months after randomisation.l Reflux Symptom Index minus the heartburn/dyspepsia item.l Comprehensive Reflux Symptom Score total and subscales (oesophageal, upper airway and pharyngeal).l Quality of life measured using the Laryngopharyngeal Reflux – Health Related Quality of Life total score
and subscales.l Laryngeal mucosal changes recorded by Reflux Finding Score total (range 0–29), scored by an
independent observer.l The ability of the Reflux Finding Score and patient characteristics (age, sex, smoking status and body
mass index) to predict any observed responses.l Side effects, adverse events and serious adverse events.l Use of over-the-counter medication.l Participant-reported satisfaction with the trial using a five-point overall satisfaction scale.l Participant accuracy in determining which treatment they had received.
SCIENTIFIC SUMMARY
NIHR Journals Library www.journalslibrary.nihr.ac.uk
xxvi

Sample sizeA mean difference of 3 points in the Reflux Symptom Index score at 16 weeks was agreed to be a clinicallyrelevant target. A mean difference of 3.1 points with an assumed standard deviation of 7.7 equates to astandardised mean effect size of 0.4 (upper bound of small effect, lower bound of medium effect). A totalof 332 participants (166 in each group of the study) were required, to provide 266 participants (133 ineach group) completing the trial intervention, to detect a standardised mean effect size of 0.4 with 90%power and a 5% significance level allowing for 20% loss to follow-up. There were no planned formalinterim analyses or stopping rules.
Statistical methods
Descriptive statistics were used to summarise patient characteristics, treatment compliance, Reflux SymptomIndex and other secondary measures. For the primary outcome measure, an unadjusted univariate analysisof the 16-week Reflux Symptom Index was carried out. The primary analysis was a multivariable analysisusing the analysis of covariance and multilevel mixed-effect linear regression to compare the RefluxSymptom Index at 16 weeks while adjusting for potential confounders, specifically stratification factors atrandomisation.
The primary hypothesis tested was H0: the mean Reflux Symptom Index at 16 weeks in the lansoprazolegroup is equal to the mean Reflux Symptom Index at 16 weeks in the placebo group after adjustment forbaseline stratification factors. Secondary analyses of the primary outcome measure considered adjustmentfor important clinical and demographic baseline factors, specifically sex, age, body mass index, smokingstatus, alcohol consumption, baseline laryngeal appearance scores by the Reflux Finding Score, ComprehensiveReflux Symptom Score total and subscales and categories of symptoms. Three models were derived foreach outcome:
l model 1 – adjusted for stratification factors at randomisation [recruiting centre (as a random effect) andbaseline severity as defined by the binary Reflux Symptom Index minus the heartburn/dyspepsia itemcut-off value of 20 (as a fixed effect)]
l model 2 – adjusted for baseline severity with Reflux Symptom Index minus the heartburn/dyspepsia itemutilised better as a continuous measure
l model 3 – adjusted for baseline severity (Reflux Symptom Index minus the heartburn/dyspepsia item asa continuous measure) and other important clinical and demographic baseline factors, specifically age,sex, smoking status and body mass index.
Continuous covariates were investigated for non-linear relationships with outcomes using first-orderfractional polynomial transformations, which were retained if they substantially improved the model fit basedon the Akaike information criterion. The optimal model was derived using a forward selection method withcomparison of –2log-likelihood for variable inclusion. Analyses were conducted at a two-sided 5% level ofsignificance throughout. The impact of removing any covariates from the final model was assessed in orderto derive the most parsimonious model.
The analysis of secondary outcomes followed a broadly similar strategy for questionnaire scores. Safetydata were not subject to statistical comparison. Analyses were carried out on a complete-case basis.Missing data were described. The use of multiple imputation techniques was considered for the primaryoutcome and covariate data if data were missing for participants completing the study to a sufficientextent (> 10%) and deemed missing at random. No formal interim analyses were planned. A statisticalanalysis plan was in place prior to any comparative analyses and was approved by the external oversightcommittees. Primary statistical analyses were based on a compliant intention-to-treat group of participantswho attended their 16-week follow-up visit between 14 and 20 weeks, with sensitivity analyses on apragmatic intention-to-treat group including all 16-week follow-up assessments. Data were analysed usingthe statistical software package Stata® version 14 (StataCorp LP, College Station, TX, USA).
DOI: 10.3310/hta25030 HEALTH TECHNOLOGY ASSESSMENT 2021 VOL. 25 NO. 3
© Queen’s Printer and Controller of HMSO 2021. This work was produced by Wilson et al. under the terms of a commissioning contract issued by the Secretary of State forHealth and Social Care. This issue may be freely reproduced for the purposes of private research and study and extracts (or indeed, the full report) may be included in professionaljournals provided that suitable acknowledgement is made and the reproduction is not associated with any form of advertising. Applications for commercial reproduction shouldbe addressed to: NIHR Journals Library, National Institute for Health Research, Evaluation, Trials and Studies Coordinating Centre, Alpha House, University of Southampton SciencePark, Southampton SO16 7NS, UK.
xxvii

Results
A total of 346 participants, out of 1427 initially screened for eligibility, were recruited and randomised;172 were randomised to the lansoprazole group and 174 were randomised to the placebo group. Ofthose randomised to lansoprazole, 101 were female (59%) and 71 were male (41%), with a mean age of53.5 (standard deviation 13.3) years. In the placebo group, there were 95 (55%) females and 79 (45%)males, with a mean age of 50.8 (standard deviation 13.9) years. The mean overall body mass index was28.1 kg/m2 (standard deviation 5.6 kg/m2, range 11.3–56.9 kg/m2). A total of 184 (53%) participants inboth groups had mild Reflux Symptom Index minus the heartburn/dyspepsia item scores at baseline, and162 (47%) reported severe scores. Overall, there were 125 participant withdrawals and losses to follow-up.A total of 267 (77%) participants completed the primary outcome measure at 16 weeks as the ‘pragmaticintention-to-treat group’ (127 in the lansoprazole group and 140 in the placebo group) according to thesample size; 220 participants completed the primary outcome measure within the 14- to 20-week window asthe ‘compliant intention-to-treat group’ (102 in the lansoprazole group and 118 in the placebo group).
Primary outcome measureFor the primary compliant intention-to-treat group, the mean Reflux Symptom Index in the lansoprazolegroup at baseline was 22.0 (95% confidence interval 20.4 to 23.6), reducing to 17.4 (95% confidenceinterval 15.5 to 19.4) after 16 weeks of treatment. The mean Reflux Symptom Index in the placebo groupat baseline was 21.7 (95% confidence interval 20.5 to 23.0), reducing to 15.6 (95% confidence interval13.8 to 17.3) after 16 weeks of treatment. The lansoprazole group had a mean 16-week score that was1.8 points higher than that in the placebo group (t-score = 1.402, p = 0.162).
There was no statistically significant difference between the randomised groups (lansoprazole vs. placebo)when adjusted for site and baseline binary Reflux Symptom Index minus the heartburn/dyspepsia item(p = 0.096). The estimated difference between randomised groups when accounting for site and baselineseverity indicated that participants receiving lansoprazole had Reflux Symptom Index scores at 16 weeksthat were 1.9 points higher (worse) than those of the placebo group (95% confidence interval –0.3 to 4.2;p = 0.096). Participants in the severe symptom stratum at baseline had Reflux Symptom Index scores at16 weeks that were 8 points higher (worse) than the mild stratum. Results were similar in the sensitivityanalysis conducted in the pragmatic intention-to-treat group.
Reflux Symptom Index score omitting item 9A secondary analysis of the primary outcome based on the Reflux Symptom Index minus the heartburn/dyspepsia item score showed that the lansoprazole group had a mean 16-week score that was 2.4 pointshigher than that of the placebo group: 16.3 (95% confidence interval 14.5 to 18.1) versus 13.9 (95%confidence interval 12.2 to 15.5), respectively (t = 1.945, p = 0.053). When adjusted for site and continuousbaseline severity Reflux Symptom Index minus the heartburn/dyspepsia item, the placebo group againshowed a greater reduction in symptoms, estimating that lansoprazole participants had Reflux SymptomIndex minus the heartburn/dyspepsia item scores at 16 weeks that were 2.0 points higher (worse) thanplacebo participants (95% confidence interval 0.0 to 4.0; p = 0.049).
Secondary outcome measures
Reflux Symptom Index changes at 12 months after randomisationThe mean Reflux Symptom Index in the lansoprazole group at 12 months was 16.0 (95% confidenceinterval 13.6 to 18.4); in the placebo group, it was 13.6 (95% confidence interval 11.7 to 15.5). Therewas no statistically significant difference between lansoprazole and placebo when adjusted for site andbaseline continuous Reflux Symptom Index minus the heartburn/dyspepsia item. The estimated differencebetween the groups is that lansoprazole participants have Reflux Symptom Index scores at 12 months1.7 points higher (worse) than placebo (95% confidence interval –0.7 to 4.1; p = 0.157). Results weresimilar in the sensitivity analysis conducted in the pragmatic intention-to-treat group.
SCIENTIFIC SUMMARY
NIHR Journals Library www.journalslibrary.nihr.ac.uk
xxviii

Comprehensive Reflux Symptom Score total and subscales (oesophageal, upper airwayand pharyngeal)The total Comprehensive Reflux Symptom Score was 50.3 (95% confidence interval 44.9 to 55.7) at baselinein the lansoprazole group, reducing to 38.9 (95% confidence interval 33.4 to 44.3) at 16 weeks and 36.6(95% confidence interval 29.8 to 43.5) at 12 months. In the placebo group, the total Comprehensive RefluxSymptom Score was 51.1 (95% confidence interval 46.4 to 55.8) at baseline, 34.7 (95% confidence interval29.6 to 39.9) at 16 weeks and 31.8 (95% confidence interval 26.6 to 36.9) at 12 months.
The relationship between the Reflux Symptom Index at baseline and total Comprehensive Reflux SymptomScore at baseline for the compliant intention-to-treat group demonstrates a linear relationship, suggestingthat an increased Comprehensive Reflux Symptom Score is associated with an increased Reflux SymptomIndex score. Baseline Comprehensive Reflux Symptom Score total and subscales appear to be significantpredictors of the primary outcome (Reflux Symptom Index at 16 weeks). The Comprehensive RefluxSymptom Score upper airway covariate explains more variability in the Reflux Symptom Index score at16 weeks than the total Comprehensive Reflux Symptom Score does but, nevertheless, performs less wellthan Reflux Symptom Index minus the heartburn/dyspepsia item.
Quality of life: change in Laryngopharyngeal Reflux – Health Related Quality of Lifetotal score and subscales at 16 weeks and 12 monthsThe overall Laryngopharyngeal Reflux – Health Related Quality of Life mean score (adjusted scale 0–100)was 28.9 (95% confidence interval 24.5 to 33.3) at baseline in the lansoprazole group, reducing to 20.5(95% confidence interval 16.1 to 25.0) at 16 weeks and 18.8 (95% confidence interval 13.7 to 23.8) at12 months. In the placebo group, the total Laryngopharyngeal Reflux – Health Related Quality of Lifemean score was 26.5 (95% confidence interval 22.5 to 30.5) at baseline, 17.1 (95% confidence interval13.3 to 21.0) at 16 weeks and 13.9 (95% confidence interval 10.0 to 17.8) at 12 months.
Laryngeal mucosal changes recorded by Reflux Finding Score total (range 0–29),scored by an independent observerReflux Finding Scores were available for 256 participants included in the trial. Within the compliantintention-to-treat group, 80% of participants in the lansoprazole group and 72% of participants in theplacebo group had Reflux Finding Scores at baseline. The mean Reflux Finding Scores were 9.7 (standarddeviation 4.1) in the lansoprazole group and 9.2 (standard deviation 3.8) in the placebo group. Thebaseline Reflux Finding Score was not significantly related to the Reflux Symptom Index score at 16 weeks.
The ability of Reflux Finding Score and patient characteristics (age, sex, smoking statusand body mass index) to predict any observed responsesNone of the patient baseline characteristics or the baseline Reflux Finding Score was found to be univariatepredictors of Reflux Symptom Index at 16 weeks (see Appendix 8, Tables 11 and 57, for baseline RefluxFinding Scores).
Side effects, adverse events and serious adverse eventsThere were 112 reported adverse events in 74 unique participants. Six were classed as ‘probably related’to the lansoprazole treatment (one severe event and five moderate events). There were no such events inthe placebo group.
Participant-reported satisfaction with the trial using a five-point overallsatisfaction scaleAt 12 months’ follow-up, 213 out of 346 (62%) participants answered the satisfaction question, of whom115 (54%) were very satisfied, 59 (28%) were satisfied, 29 (14%) were neither satisfied nor dissatisfied,five (2%) were dissatisfied and five (2%) were very dissatisfied.
DOI: 10.3310/hta25030 HEALTH TECHNOLOGY ASSESSMENT 2021 VOL. 25 NO. 3
© Queen’s Printer and Controller of HMSO 2021. This work was produced by Wilson et al. under the terms of a commissioning contract issued by the Secretary of State forHealth and Social Care. This issue may be freely reproduced for the purposes of private research and study and extracts (or indeed, the full report) may be included in professionaljournals provided that suitable acknowledgement is made and the reproduction is not associated with any form of advertising. Applications for commercial reproduction shouldbe addressed to: NIHR Journals Library, National Institute for Health Research, Evaluation, Trials and Studies Coordinating Centre, Alpha House, University of Southampton SciencePark, Southampton SO16 7NS, UK.
xxix

Participant accuracy in determining which treatment they had receivedForty-two per cent of the lansoprazole group and 56% of the placebo group correctly identified thetreatment they had received at the end of the study period.
Conclusions
Twice-daily lansoprazole was not shown to offer any symptomatic benefit over matched placebo to patientswith chronic throat symptoms. The severity of presenting symptoms dictated the level of symptomsfollowing treatment. Therefore, the evidence from this trial does not support the common practice ofprescribing proton pump inhibitors to this patient population.
Trial registration
This trial is registered as ISRCTN38578686 and EudraCT number 2013-004249-17.
Funding
This project was funded by the National Institute for Health Research (NIHR) Health TechnologyAssessment programme and will be published in full in Health Technology Assessment; Vol. 25, No. 3.See the NIHR Journals Library website for further project information.
SCIENTIFIC SUMMARY
NIHR Journals Library www.journalslibrary.nihr.ac.uk
xxx
Chapter 1 Introduction
Some parts of this chapter have been reproduced from the Trial Of Proton Pump Inhibitors in ThroatSymptoms (TOPPITS) study protocol (Watson et al.1). This is an Open Access article distributed in
accordance with the terms of the Creative Commons Attribution (CC BY 4.0) license, which permits othersto distribute, remix, adapt and build upon this work, for commercial use, provided the original work isproperly cited. See: http://creativecommons.org/licenses/by/4.0/. The text below includes minor additionsand formatting changes to the original text.
Background
TOPPITS addresses the problem of adults with persistent throat symptoms, such as globus pharyngeus(hereafter referred to as ‘globus’), catarrh, throat discomfort, clearing, recurring dysphonia or excessmucus. In one UK survey,2 6% of the middle-aged female population reported a persistent feeling ofsomething in the throat (globus) in the previous 3 months. Globus is also reported to account for up to4% of ear, nose and throat (ENT) referrals to secondary care.3 Throat clearing is the commonest singlesymptom in any voice clinic. Equally familiar are intermittent hoarse voice and postnasal drip.4 It is claimedthat 55% of patients referred to a voice clinic have symptoms of extraesophageal reflux (EOR), and anEnglish study of primary care attenders indicated that 25% had recent experience of persistent upperrespiratory symptoms.5 In the general population, the lifetime incidence of milder variants of globus is> 40%.6 There were 1,142,404 first ENT consultations in England in 2010–11.7 A conservative estimate isthat 5% of these patients were referred for very common throat symptoms, such as throat clearing,fluctuating voice change, catarrh and chronic throat discomfort, which equates to over 57,000 NHSpatients referred to secondary care that year in England alone.7 Some patients experience anxiety as theyfear that they may have throat cancer. Even if they have no features and no risk factors for cancer, theymay be referred in for urgent ENT clinic assessment, a process that prolongs the anxiety and, at times,the symptoms. In the absence of good-quality treatment algorithms, patients also undergo invasive andcostly assessments, such as rigid endoscopic examination of the upper aerodigestive tract under generalanaesthesia, which typically reveals no significant abnormality, and empiric trials of acid suppression,typically with proton pump inhibitors (PPIs).
Rationale
Upper airway symptoms are known to have a strong placebo response.8 Early evidence from animalexperiments gave rise to the term ‘acid laryngitis’ 40 years ago.9 Intracellular reactivation of acidifiedpepsin may explain pepsin activity at weakly acid pH levels.10,11 Despite a growing trend to treat throatsymptoms empirically with PPIs, controlled studies fail to demonstrate a significant benefit of PPI overplacebo.12–14 An evidence-based medicine EOR conference concluded that work assessing PPIs in throatsymptoms had variable study design and quality, small numbers and heavy selection bias, with inconsistenttreatment regimes, and that the small proportion of controlled studies demonstrating overall benefit ofPPI over placebo15 may reflect the prompt response of heartburn to antacid treatment.16,17 There was littleevidence on other pharmaceuticals, such as H2 antagonists.18,19 In the patient and public involvementbackground work for this proposal, individual interviews were conducted with several patients, encompassingboth young professionals and the retired. All fully supported the research proposal. It was also clear, evenfrom a small sample, that patient views on PPIs vary widely, but all had been treated at some point with PPIs,sometimes on more than one occasion.
Over half of UK otolaryngologists prescribe PPIs for persistent throat symptoms in the absence of structuralpathology.20 Our early systematic review12 of studies that used PPIs as an empiric treatment modality forsuspected laryngopharyngeal reflux (LPR) identified 14 uncontrolled studies, one unblinded, non-randomised
DOI: 10.3310/hta25030 HEALTH TECHNOLOGY ASSESSMENT 2021 VOL. 25 NO. 3
© Queen’s Printer and Controller of HMSO 2021. This work was produced by Wilson et al. under the terms of a commissioning contract issued by the Secretary of State forHealth and Social Care. This issue may be freely reproduced for the purposes of private research and study and extracts (or indeed, the full report) may be included in professionaljournals provided that suitable acknowledgement is made and the reproduction is not associated with any form of advertising. Applications for commercial reproduction shouldbe addressed to: NIHR Journals Library, National Institute for Health Research, Evaluation, Trials and Studies Coordinating Centre, Alpha House, University of Southampton SciencePark, Southampton SO16 7NS, UK.
1

study with a control group of healthy volunteers and six double-blind, placebo-controlled randomisedtrials from 1994 to 2004. A lack of common outcome measures, selection bias and inadequate blindingof the results were among the typical limitations. Although uncontrolled series reported positive results,randomised controlled trials (RCTs) demonstrated no statistically significant differences for changes inseverity or frequency of throat symptoms between PPIs and placebo. It appeared that empiric treatment ofsuspected LPR with PPIs, by far the most common ENT practice in the UK, is based on poor levels of evidencefrom uncontrolled studies. A later meta-analysis21 included further studies, notably that by Vaezi et al.,22
and concluded that PPI therapy ‘may offer a modest but non-significant clinical benefit’ over placebo.The authors also concluded that validated diagnostic guidelines may facilitate the recognition of likelyresponders. The 2007 meta-analysis13 included five RCTs, only two of which had more than 22 participants,and only one randomised over 100 participants. The conclusion was that there was no overall benefit oftherapy and that further work was needed to identify likely responders.13 Finally, the most recent meta-analysisincluded seven placebo-controlled trials totalling 396 participants with varying doses over 4 to 16 weeks,and again showed that PPI therapy lacked evidence of efficacy in those suspected to have LPR. Rather, highplacebo response levels suggested a more complex and multifactorial pathophysiology.23 Like previousauthors, the reviewers concluded that further studies are needed to characterise subgroups of patients withreflux-associated laryngeal symptoms who might benefit from treatment with PPI.
The perception in primary care is that PPIs are a reasonable ‘empirical’ treatment strategy for this group ofpatients. Almost since their introduction in the late 1990s, PPIs have constituted the largest part of theNHS community drugs bill: £238M in 1999 (5.6%).24 PPIs are highly efficient in reducing gastric acidsecretion. The annual NHS expenditure on PPIs is > £300M (generic omeprazole, lansoprazole andpantoprazole are the NHS Quality, Innovation, Productivity and Prevention-endorsed low-cost PPIs). Thepractice of giving ‘all comers’ with upper respiratory symptoms anti-reflux therapy misses the opportunityto explore other potentially beneficial approaches, such as speech therapy or management of fatigue.25
Measuring treatment responses in throat symptoms
The most frequently used primary outcome measure in the assessment of persistent, hard-to-explain throatsymptoms is the Reflux Symptom Index (RSI). This nine-item, self-administered questionnaire is scored on aLikert scale with a total score of 0–45.26 A higher score indicates more severe symptoms. The nine-item RSItotal score allows comparison with previous studies as it offers 10 years of comparative data in the literature.The RSI remains the ‘area standard’ and, despite well-rehearsed limitations, remained our chosen primaryoutcome measure. Some reported studies have a baseline RSI only just above the normal level and othershave a considerably higher baseline RSI. An observational study included 455 participants in South Korea, inwhom the mean RSI score fell from 15 at baseline to 5.6 after 12 weeks of the PPI rabeprazole.27 Baseline RSIscores in a much smaller but comparative study of 62 participants treated with esomeprazole were considerablyhigher (> 20).28 On the other hand, a rabeprazole RCT,15 like the Korean descriptive study, had baseline RSIscores around 14, closer to those of Lee et al.27 Despite these differences in baseline severity, both of thesemore recent trials showed a benefit from a 3-month trial of acid suppression, but Lam et al.15 continuedfollow-up for a further 6 weeks, when the effect disappeared, whereas Reichel et al.’s28 final measurementpoint was the end of therapy.
The RSI has a number of limitations, which we have addressed in derivation of our own participant-reportedoutcome measure: the Comprehensive Reflux Symptom Score (CReSS).29 The CReSS is a 34-item questionnaireof oesophageal and extraesophageal symptoms, which has been tested on groups of ‘throat’ patients,healthy controls and those attending for an upper gastrointestinal endoscopy. It has three statistically robustsymptom factors: (1) gastrointestinal; (2) an upper airway factor relating to cough, breathing, mucus andhoarseness; and (3) an obstruction/choking globus factor. The continuing use of the RSI alongside othervariables by ourselves and others has at least allowed the summation of studies in some of the priorattempted evidence synthesis exercises. One factor to be borne in mind in the application of any throat
INTRODUCTION
NIHR Journals Library www.journalslibrary.nihr.ac.uk
2

symptom questionnaire, however, is the baseline incidence of throat symptoms in the community. The upperlimit of normal in the RSI is said to be 12 in the general population. The first UK study to assess RSI scores ingeneral practice attenders identified 252 participants with a score of > 10.5 However, only 29% had a zerorating on the integral heartburn/dyspepsia item (which accounts for up to 5 of the 45 points), which is as onewould expect given that about 30% of the population have some symptoms of lower gastroesophageal reflux.
When this gastroesophageal item was excluded from the RSI analysis, 8% of general practice attendershad a RSI of > 10 owing to the remaining extraesophageal items. A more recent UK report of thepopulation distribution of RSI values sampled 2000 adults who were also questioned on their health andlifestyle.30 The mean RSI score was 8.3; 30% of participants had a RSI score of > 10, of whom 25% had azero score on the gastroesophageal reflux disease (GORD) item, thus giving a 7.5% overall prevalenceof suspected LPR, similar to that observed in general practice attenders.5 Over the past 5 years, we havecontinued to refine our improved participant report tool, the CReSS.29 We have demonstrated wideseparation of 103 volunteers, with a mean score of < 7, from 177 throat participants, with a mean scoreof 31 [95% confidence interval (CI) 28 to 35]. Factor analysis in a total of 422 participants shows theCReSS to have three subscales. The greater level of detail of the CReSS and the likely better discriminationof normal from abnormal scores at baseline make it an invaluable secondary outcome variable. Such anapproach addresses the research need identified in prior review work, namely that of better characterisingthe subgroup of suspected LPR patients who may benefit from acid suppression therapy.
Varying average baseline Reflux Symptom Index scores in different reported series
l A small trial (of fewer than 50 participants) showed some benefit from acid suppression in postnasaldrip, but only in individual symptom items, and the method of recruitment was not a pragmaticreflection of patients in normal day-to-day practice.4
l A large observational study of 455 participants in South Korea, most with globus sensation, throatclearing and dysphonia, was undertaken.27 In this cohort, the mean RSI score fell from 15 at baseline to5.6 after 12 weeks of the PPI rabeprazole.27 In 75% of this cohort, there was a reduction of > 50% inRSI, but the proportions in the abnormal range pre and post therapy are not clear. In comparison,Reichel et al.28 recruited 62 participants to an esomeprazole study randomised against placebo; thebaseline mean RSI levels in the two groups (23 and 21, respectively) were considerably higher thanthose in the Korean descriptive series,27 as were those for the cohort described in an early report by theauthors of the RSI, whose mean participant baseline RSI score was also 20.26
l In a RCT of 82 participants randomised to placebo versus rabeprazole,15 mean baseline RSI scores werecloser to those of Lee et al.27 (around 14). Understandably, therefore, as there is a baseline incidenceof throat symptoms in the general population, this study appears to show a floor effect with a muchsmaller decrement in RSI total scores than was observed in the Reichel et al.28 cohort, who had ‘furtherto fall’.
In other words, some reported studies have a baseline RSI score only just above the normal level andothers have a baseline RSI score that is considerably higher. Despite these differences in baseline severity,both of these most recent trials15,28 showed a benefit from a 3-month trial of acid suppression. Lam et al.15
continued follow-up for a further 6 weeks, when the effect disappeared, whereas the Reichel et al.28 finalmeasurement point was the end of therapy. The RSI remains the ‘area standard’ and, although othershave attempted to introduce other questionnaires, their uptake has been patchy and many studies havereverted to single-item visual analogue scales. As discussed previously, the RSI has been applied innumerous prior studies and, despite well-rehearsed limitations,29 remains our chosen primary outcome.
The nine-item RSI total score allows comparison with previous studies as it offers 10 years of comparativedata in the literature.
DOI: 10.3310/hta25030 HEALTH TECHNOLOGY ASSESSMENT 2021 VOL. 25 NO. 3
© Queen’s Printer and Controller of HMSO 2021. This work was produced by Wilson et al. under the terms of a commissioning contract issued by the Secretary of State forHealth and Social Care. This issue may be freely reproduced for the purposes of private research and study and extracts (or indeed, the full report) may be included in professionaljournals provided that suitable acknowledgement is made and the reproduction is not associated with any form of advertising. Applications for commercial reproduction shouldbe addressed to: NIHR Journals Library, National Institute for Health Research, Evaluation, Trials and Studies Coordinating Centre, Alpha House, University of Southampton SciencePark, Southampton SO16 7NS, UK.
3

Description of the Comprehensive Reflux Symptom Score questionnaire
The CReSS29,31 is a 34-item questionnaire of oesophageal and extraesophageal symptoms that has beentested on groups of ‘throat’ patients, healthy controls and those attending for an upper gastrointestinalendoscopy. It has three subscales [oesophageal (17 items), upper airway (nine items) and pharyngeal(five items)] on a large-scale factor analysis:
l The total score has 34 items, each scored from 0 to 5, so the range is 0–170. Higher values indicateworse symptoms.
l The oesophageal subscale has 17 items – heartburn, flatulence, regurgitation, acid/sour taste in mouth,gurgling, nausea, vomiting, bloating, belching, pressure in the chest, low appetite, feeling full too earlyin a meal, indigestion, stomach acid, back pain, headache and bad breath (each item is scored from0 to 5, so the total range for the subscale is 0–85).
l The upper airway subscale has nine items – throat clearing, excess mucus, mucous drip, coughingwhen upright, coughing after eating, coughing when lying down, wheezing, difficulty breathing andhoarseness (each item is scored from 0 to 5, so the total range for the subscale is 0–45).
l The pharyngeal subscale has five items – lump in the throat, swallowing food, swallowing liquid, throatpain and feeling of things stuck in throat (total score out of 0–25).
Quality-of-life impact of throat symptoms: the Laryngopharyngeal RefluxHealth Related Quality of Life questionnaire
Patient-reported generic health-related quality-of-life scores are abnormal in patients with throat symptoms,32
who show abnormalities of health-related quality of life in social functioning, pain and general healthperception,33 but there is a perceived need for a disease-specific instrument to assess the impact of reflux onhealth-related quality of life.34 This need led to the development of the Laryngopharyngeal Reflux – HealthRelated Quality of Life (LPR-HRQL),35 which has been validated in a Swedish population.36 Its 43 items aregrouped into four domains and an overall impact category (which includes general questions on relationships,sleep and lifestyle). The LPR-HRQL has been used in at least one prior RCT22 and shown to respond to change,and is a secondary outcome measure of TOPPITS.
The questionnaire contains questions about LPR (acid reflux into the upper throat and how it affectsthe patient).
Most questions are scored from 0 to 6, describing how often the patient experiences that symptom.The code for the scores is as follows:
0 = none of the time (never in the past month)1 = rarely (once in the past month)2 = a little of the time (2–3 days in the past month)3 = some of the time (about once a week)4 = a lot of the time (about 2–3 days a week)5 = most of the time (4–5 days a week)6 = nearly all of the time or always (6–7 days a week).
After a set of questions that relate to a particular symptom, there is a question rated on a scale from 1 to10 known as a ‘thermometer’, which asks the patient to summarise the overall impact of those symptomson their life, in which 1 represents ‘no effect’ and 10 represents ‘an enormous effect’ on their quality of life.
Finally, at the end of the questionnaire, there are a number of questions that use the 1–10 scale. Theseseek to quantify how much the symptoms effect energy levels, productivity at work, social relationships,marital relationships, sexual relationships, sleeping, ability to lie comfortably in bed, the way they feelabout themselves, lifestyle (such as exercising, eating and drinking) and ability to do the things they enjoy.
INTRODUCTION
NIHR Journals Library www.journalslibrary.nihr.ac.uk
4

A summary of how these component questions are combined to assess quality of life is given in thefollowing section.
Laryngopharyngeal Reflux – Health Related Quality of Life questionnaire componentsThe total for each domain is scored by taking the total score, subtracting the mean and dividing by thestandard deviation – to give the z-score for each domain. All ‘thermometer’ scales can be reported aloneor alongside the relevant scale.
VoiceThe voice scale consists of the first 12 questions in the LPR-HRQL questionnaire. They are all scored from0 to 6 on a Likert scale. Note that the second question (I feel satisfied with the way my voice sounds) mustbe reversed before adding up the total voice score.
If any patient is missing fewer than six items, impute the mean item scores based on the sample beinganalysed, then compute the voice scale for that patient. If any patient is missing six or more items (out ofthe 12), they should be treated as missing. The voice scale is calculated by adding the 12 items together,resulting in a score between 0 and 72. The 13th item in the ‘Voice’ section is the voice thermometer.
CoughingThe cough scale consist of questions 14–19 in the LPR-HRQL questionnaire. They are all scored from0 to 6 on a Likert scale. If any patient is missing fewer than three items, impute the mean item scoresbased on the sample being analysed, then compute the cough scale for that patient. If any patient ismissing three or more items (out of the six), they should be treated as missing. The cough scale iscalculated by adding the six items together, resulting in a score between 0 and 36. The 20th item is thecough thermometer.
Clear throatThe clear throat scale consist of questions 21–26 in the LPR-HRQL questionnaire. They are all scored from0 to 6 on a Likert scale. If any patient is missing fewer than three items, impute the mean item scoresbased on the sample being analysed, then compute the clear throat scale for that patient. If any patient ismissing three or more items (out of the six), they should be treated as missing. The clear throat scale iscalculated by adding the six items together, resulting in a score between 0 and 36. The 27th item is theclear throat thermometer.
GeneralThe general scale consist of questions 28–32 in the LPR-HRQL questionnaire. They are all scored from0 to 6 on a Likert scale. If any patient is missing fewer than three items, impute the mean item scoresbased on the sample being analysed, then compute the general scale for that patient. If any patient ismissing three or more items (out of the six), they should be treated as missing. The general scale iscalculated by adding the six items together, resulting in a score between 0 and 30. The 33rd item is thegeneral thermometer.
Overall scoreThe overall score is calculated by adding the four thermometer scores (questions 13, 20, 27 and 33) ANDthe domain scores (questions 34–43). They are all scored from 1 to 10 on a Likert scale. The overall score iscalculated by adding the 14 items together, resulting in a score between 14 and 140. To ease interpretation,this is rescaled to a score out of 100 by subtracting 14 and dividing by 126.
Trial objectives
TOPPITS aimed to quantify, and to characterise, the effect of PPI therapy compared with placebo. Ourcomprehensive package of patient-centred outcomes allows us to assess which specific throat symptoms
DOI: 10.3310/hta25030 HEALTH TECHNOLOGY ASSESSMENT 2021 VOL. 25 NO. 3
© Queen’s Printer and Controller of HMSO 2021. This work was produced by Wilson et al. under the terms of a commissioning contract issued by the Secretary of State forHealth and Social Care. This issue may be freely reproduced for the purposes of private research and study and extracts (or indeed, the full report) may be included in professionaljournals provided that suitable acknowledgement is made and the reproduction is not associated with any form of advertising. Applications for commercial reproduction shouldbe addressed to: NIHR Journals Library, National Institute for Health Research, Evaluation, Trials and Studies Coordinating Centre, Alpha House, University of Southampton SciencePark, Southampton SO16 7NS, UK.
5

respond, to assess whether or not any patient characteristics can predict any measured treatmentresponse, to derive improved estimates of impact on quality of life and to define the proportion of likelynon-responders for whom alternative therapeutic approaches may be more appropriate. Definitions in theRSI literature to characterise responders include 50% reduction and final score within the normal range.Here we use a normal-range end point for response.
Primary objectiveTo compare the symptomatic response as measured by the RSI in patients with persistent throat symptomsat the end of 16 weeks’ treatment with lansoprazole versus placebo.
Secondary objectives
l To explore recruitment feasibility using an internal pilot.l To evaluate the symptom response at 12 months in comparison with that at 16 weeks.l To determine the utility of the RSI questionnaire,26 the CReSS questionnaire31 items and subscales and
endolaryngeal examination findings as scored by the Reflux Finding Score (RFS)37 as well as the value ofpatient demographics including age, sex, smoking status and body mass index (BMI)38,39 as potentialbaseline determinants of treatment response.
l To assess side effects, treatment compliance and use of self-pay medications.l To compare changes in LPR-HRQL (i.e. disease-specific quality of life).
Treatment choice in TOPPITS
Proton pump inhibitors suppress gastric acid secretion by specific inhibition of the H+/K+-ATPase enzymepump at the secretory surface of the gastric parietal cell. There is now a wide range of available PPIs. Thebest-value PPIs, and the most prescribed in the UK, are omeprazole and lansoprazole. The class of drugsis generally well tolerated. The frequency of adverse effects associated with PPIs (5%) is similar to thatof placebo. The commonest complaints are headache, diarrhoea, abdominal pain and nausea. Except fordiarrhoea, whose incidence is < 5%, the adverse effects of PPIs seem to be independent of age, dosageor duration of treatment. The diarrhoea seems to be due to altered gut microbiome secondary to the lossof acid secretion.
The clinical side effects of PPI use include rebound hypersecretion after cessation of PPI therapy, making ithard to wean some patients off of PPIs, and, of course, reinforcing the notion that they were necessaryin the first place.40,41 Rarer side effects include pneumonia,42 Clostridium difficile, infections, acute renalinflammation43 and fractures of hip, wrist and spine.44
If a PPI is considered appropriate, there is no evidence that any one PPI is more effective than another,when used at therapeutically equivalent doses, but newer agents are considerably more costly:
l We used lansoprazole in TOPPITS as it is among those frequently recommended by commissioninggroups45 and formularies; the choice is justified through its inclusion in National Institute for Health andCare Excellence guidance.46
l In TOPPITS, as is typical of LPR studies, we used twice-daily treatment to minimise the risk of‘breakthrough’ gastroesophageal refluxes occurring at night.47
l Lansoprazole has a lower unit cost than omeprazole – NHS prescribing data (January to March 2010)indicate that omeprazole is the most commonly prescribed PPI (4.9 million items, unit cost £4.90,total cost £24.2M); lansoprazole totalled 3.8 million items, at a somewhat lower unit cost of £3.00(total cost £11.4M).48
INTRODUCTION
NIHR Journals Library www.journalslibrary.nihr.ac.uk
6

Chapter 2 Methods
Parts of this chapter are reproduced from Watson et al.1 This is an Open Access article distributed inaccordance with the terms of the Creative Commons Attribution (CC BY 4.0) license, which permits
others to distribute, remix, adapt and build upon this work, for commercial use, provided the original workis properly cited. See: http://creativecommons.org/licenses/by/4.0/. The text below includes minor additionsand formatting changes to the original text.
Setting and conduct
This multicentre RCT was conducted at eight UK NHS sites, recruiting patients from 28 April 2014 to28 February 2017. The final study visit was on 23 March 2018. The trial was conducted in accordance withthe principles of International Conference on Harmonisation good clinical practice, received a favourableethics opinion from the National Research Ethics Service Committee North East – Tyne and Wear South(reference 13/NE/0336) on 2 December 2013 and clinical trial authorisation from the Medicines andHealthcare products Regulatory Agency on 12 February 2014. The trial was managed by the NewcastleClinical Trials Unit (NCTU) with a Trial Management Group, together with an independent Trial SteeringCommittee (TSC) and Data Monitoring Committee (DMC). Site monitoring was undertaken by staff atNCTU and the trial was audited by the sponsor, The Newcastle upon Tyne Hospitals NHS Foundation Trust.The clinical trial protocol was published in 2016.1 A statistical analysis plan was in place prior to anycomparative analyses.49
Patient and public involvement
Several patients contributed to the design of the study and the development of the second-stage application.To canvass the views of a range of patients with different experiences of chronic throat symptoms andtreatments, the patient contributors were young professionals and retired patients. These patients wereidentified from clinics in Sunderland by James O’Hara. Individual consultations with four patients with LPRwere conducted by James O’Hara. Two of these four patients agreed to join the TSC.
There was full patient support for the research proposal; the length of time taken to treat this problemand the lack of knowledge of throat symptoms on the part of clinicians is a source of frustration. Whenasked about the collection of follow-up data, there was a preference for this to be conducted face to face.When discussing outcome measures, patients felt that the CReSS had greater symptom coverage than theRSI, which the team believed justified its inclusion as a secondary outcome measure. Other changes as aresult of patient and public involvement are listed below:
l Duration of therapy. This was originally planned to be 2 months; however, our patient panel felt thatthis was too short and that a longer period (16 weeks) would provide a more definitive result.
l Number of follow-up visits. The patient and public involvement group had a preference for more-frequentfollow-up visits but these were reduced to two in line with the Health Technology Assessment panelfeedback.
l Data collection – remote versus face to face. The patient and public involvement group believed that,rather than complete questionnaires in their homes, people would prefer – and would be willing – toattend a clinic to complete the questionnaires.
l Outcome questionnaires. Some members of the patient and public involvement group felt that therewas some ambiguity in the wording of the questionnaires. This was improved as far as possible, bearingin mind that the RSI in particular needed to be comparable to previously published studies.
DOI: 10.3310/hta25030 HEALTH TECHNOLOGY ASSESSMENT 2021 VOL. 25 NO. 3
© Queen’s Printer and Controller of HMSO 2021. This work was produced by Wilson et al. under the terms of a commissioning contract issued by the Secretary of State forHealth and Social Care. This issue may be freely reproduced for the purposes of private research and study and extracts (or indeed, the full report) may be included in professionaljournals provided that suitable acknowledgement is made and the reproduction is not associated with any form of advertising. Applications for commercial reproduction shouldbe addressed to: NIHR Journals Library, National Institute for Health Research, Evaluation, Trials and Studies Coordinating Centre, Alpha House, University of Southampton SciencePark, Southampton SO16 7NS, UK.
7

Planned patient and public involvement for the duration of the trial
The plan at the application stage for patient and public involvement throughout the trial was to build onthe individual consultations conducted and convene a trial user forum to obtain a group perspective.Once funding was confirmed, those involved in the consultations would be invited to join the TOPPITSUser Forum (TUF). It was considered that the forum would yield better outputs if it were user led. We hopedfor a group of six individuals, aimed to encourage a cross-section of views and experience and hopedto recruit representation from the voluntary sector (e.g. the British Voice Association and the BritishLaryngological Association).
This forum would be facilitated by the local network patient and public involvement lead. Although thefrequency of meetings would ultimately be decided by the forum members, it was initially thought thatthey should meet prior to the TSC meetings. This would enable a member of the forum to attend the TSC,to represent the group and raise any issues or queries. The intention was that the TUF would assist thetrial team to:
l develop the recruitment strategyl inform the adequacy and accessibility of patient informationl encourage the TSC to stay focused on the needs of patientsl disseminate the findings – users may be co-authors and participate in presentationsl link to the voluntary sector (as described previously).
In return, the TUF would be offered:
l a group and personal role specification, so that we could go through the implications of joiningwith patients
l a meeting venue with project secretary support, ideally in a community setting, approximately threetimes per annum
l meeting support from the project secretaryl examples of user group formats from similar groupsl encouragement to develop its own pages on the trial website (www.TOPPITS.co.uk) and a link from this
website to the INVOLVE website (www.invo.org.uk/)l a discussion of learning and development requirements with the trial team, and regular feedback.
Attempt to implement the TOPPITS User ForumAt the project launch in April 2015, the TUF was discussed in order to seek the views of attendees on recruitingpatients. The two patients who had taken part in the initial consultations during the development ofthe trial and funding application – who had also joined the TSC – were no longer able to be involved.James O’Hara, one of three head and neck otolaryngologists in the Sunderland site, was leading on patientand public liaison and it was agreed that another member of the team (JL) would provide support withpatient and public involvement. The following steps were suggested to identify and recruit TUF members:
1. Sunderland and Newcastle site staff to approach pilot trial patients at their final follow-up appointmentto ask if they would be willing to join the TUF.
2. Provide patient and public involvement information (overview and specification) and ask if JanLecouturier can contact them by telephone to discuss further.
3. If they are happy to be contacted further, site staff to pass name and telephone number toJan Lecouturier.
4. Jan Lecouturier to contact them after 1 week to discuss.5. Discuss terms of reference, availability and preferences for meeting.6. Set up first meeting.
METHODS
NIHR Journals Library www.journalslibrary.nihr.ac.uk
8

The first steps were for Jan Lecouturier to develop materials for the TUF and amend the patient and publicinvolvement specification and send it on to site staff. Local site staff (Sunderland and Newcastle) agreed toidentify and approach patients to ask if they would be willing to join the TUF. The relevant materials weresent to the Sunderland research nurses in the first instance. By early August 2015, it transpired that onlytwo patients had completed follow-up and neither had expressed an interest in the TUF. It was decidedto ask Newcastle research nurses to approach patients, again those attending for their final follow-upappointment. The Newcastle site team asked for packs to send out to patients (at that stage, there weresix patients who had completed the trial). Only one patient had expressed an interest in joining the TUF byOctober 2015. This patient was contacted to thank them and to indicate that the team would be in touchfurther when more members had been recruited to the TUF.
The problem in recruiting patients to the TUF was escalated to the Newcastle research team lead forotolaryngology. In January 2016, the research team lead – who thought that the problem with recruitingto TUF was due to the small number of patients who had completed the trial – agreed to send thematerials to any patients remaining who had completed the trial. Unfortunately, this strategy attracted nofurther interest in joining the TUF.
Our initial outline design included a qualitative study comprising in-depth face-to-face interviews with15 patients to explore compliance, use of other medication and symptoms experienced during the trial.These discussions might have additionally fostered higher levels of patient engagement with intervieweeswho might then have joined our TUF. However, that component of the study was not funded and thisinference is only speculative.
Trial design
This was a multicentre, Phase III, randomised, double-blind, placebo-controlled trial, with an internalfeasibility pilot, carried out in secondary care. Patients with persistent throat symptoms were identified andrecruited from NHS ENT clinics. This was a pragmatic trial designed to mirror current NHS clinical practice,and so patients were not subjected to the gamut of aerodigestive tract investigations that characterisemany studies but do not routinely inform the patient pathway outside a research context. Patients wererandomised in a double-blind fashion between two treatment groups in a 1 : 1 ratio, stratified by centreand baseline severity [on the basis of the RSI score omitting item 9: ‘Heart burn, chest pain, indigestion, orstomach acid coming up’ – hereinafter referred to as RSI-HB (Reflux Symptom Index minus the heartburn/dyspepsia item) (range 0–40)]. The ‘mild’ cohort had RSI-HB scores of 10–20 (inclusive) and the ‘severe’cohort had scores of > 20. The heartburn/dyspepsia item was omitted to focus on throat symptoms ratherthan gastrointestinal symptom burden, although the total RSI was used as the primary outcome. Followingsuccessful demonstration of recruitment in three sites in the internal pilot, the main component of the trialrecruitment was conducted over a total of 30 months (inclusive of the pilot phase).
Patients
Patients were adults who had been newly referred to secondary care otolaryngology clinics with persistent(> 6 weeks) unexplained throat symptoms, principally dysphonia, throat pain, globus sensation (feelingof something stuck in the throat), throat clearing, postnasal drip or mucus excess, and also night-timeunexplained cough or choking. The clinics were in the following trial site hospitals:
l Newcastle upon Tyne – Freeman Hospital (The Newcastle upon Tyne Hospitals NHS Foundation Trust)l Sunderland – Sunderland Royal Hospital (City Hospitals Sunderland NHS Foundation Trust)l Nottingham – Queen’s Medical Centre (Nottingham University Hospitals NHS Trust)l Brighton – Royal Sussex County Hospital (Brighton and Sussex University Hospitals NHS Trust)l Glasgow – Glasgow Royal Infirmary (NHS Greater Glasgow and Clyde)
DOI: 10.3310/hta25030 HEALTH TECHNOLOGY ASSESSMENT 2021 VOL. 25 NO. 3
© Queen’s Printer and Controller of HMSO 2021. This work was produced by Wilson et al. under the terms of a commissioning contract issued by the Secretary of State forHealth and Social Care. This issue may be freely reproduced for the purposes of private research and study and extracts (or indeed, the full report) may be included in professionaljournals provided that suitable acknowledgement is made and the reproduction is not associated with any form of advertising. Applications for commercial reproduction shouldbe addressed to: NIHR Journals Library, National Institute for Health Research, Evaluation, Trials and Studies Coordinating Centre, Alpha House, University of Southampton SciencePark, Southampton SO16 7NS, UK.
9

l Manchester – Manchester Royal Infirmary (Manchester University NHS Foundation Trust)l Birmingham – Queen Elizabeth Hospital (University Hospitals Birmingham NHS Foundation Trust)l Stockport – Stepping Hill Hospital (Stockport NHS Foundation Trust).
Inclusion criteria
l Referred with a persistent primary throat symptom: globus, hoarseness, throat clearing, throatdiscomfort, choking spasms, excess mucus/postnasal drip, otherwise unexplained night-time cough orchoking of ≥ 6 weeks’ duration.
l Those with a score of ≥ 10 on the non-heartburn items of the RSI.l Capacity to provide fully informed consent to participate in the study.
Exclusion criteria
l Patients whose RSI-HB score was < 10.l Those unable to complete the TOPPITS questionnaires.l Patients aged < 18 years.l Patients who were unwilling to undergo flexible endoscopy to establish the findings below.l Observed endoscopic laryngopharyngeal pathology that would typically require specific surgical
intervention or investigations (e.g. suspected neoplasia/dysplasia, prominent Reinke’s oedema orunilateral vocal fold polyp, vocal cord palsy or chronic inflammatory diseases).
l Confirmed or suspected current or prior malignancy of the head and neck or oesophagus.l Performing voice users: singers, actors, media workers.l Pregnant or lactating woman. Woman of childbearing potential must be using adequate contraception.l Currently on acid suppressants, acid neutralisers and alginates and unwilling to discontinue these for
(1) a 4-week pre-study washout period in the case of PPI usage or (2) a 24-hour period for alginate oracid neutraliser. For those discontinuing PPI, ad hoc alginate use was allowed until the final 24–48 hoursof the washout period prior to reassessment to confirm ongoing eligibility.
l Prior adverse reaction to PPIs.l Severe hepatic dysfunction.l Patients taking warfarin, phenytoin, digoxin, ciclosporin, methotrexate, erlotinib, lapatinib, tacrolimus,
sucralfate, citalopram, escitalopram, fluvoxamine, St John’s wort, clozapine, ulipristal acetate, cilostazolor systemic antifungals (itraconazole, ketoconazole, posaconazole or voriconazole).
l Human immunodeficiency virus-positive patients/patients taking antiviral medications (atazanavir,nelfinavir, raltegravir, saquinavir or tipranavir).
l Use of other investigational study drugs within the preceding 30 days.
Patients meeting the eligibility criteria were provided with a patient information sheet (PIS) and were giventime to consider participation and the opportunity to ask questions before agreeing to take part. Consentwas obtained by a member of the site trial team, delegated with that task on the delegation log andreasons for non-participation were recorded on a screening log at each trial site.
Some patients were identified from routine ENT, voice or 2-week wait cancer clinics. Any patient scoring≥ 10 on the RSI-HB, where this was in routine clinical use, and who was potentially interested inparticipating in TOPPITS was given a PIS. The potential participant was then invited to attend a dedicatedTOPPITS clinic after a cooling-off interval of ≥ 48 hours. Some potential participants were also identifiedthrough primary care referral letters. The principal investigators at each site were responsible for postingan invitation letter and PIS detailing the study along with a clinic appointment card.
A screening log was completed for all potential participants who were screened, including the reason forineligibility and/or refusal to participate.
METHODS
NIHR Journals Library www.journalslibrary.nihr.ac.uk
10

Recruitment
ScreeningAt the dedicated TOPPITS trial clinic, any outstanding queries were answered and there was an opportunityto review the randomisation video, if this had not already been accessed online from the TOPPITS website(www.TOPPITS.co.uk), with time to discuss the study further in this clinic. At the first trial clinic appointment,a more detailed confirmatory eligibility screen was completed by the investigator to document patients’fulfilment of the eligibility criteria for all patients considered for the study and subsequently included orexcluded. Owing to the small patient population, the PIS, consent form and questionnaires for the studywere available in the English language only.
Patients taking acid suppressants, acid neutralizers or alginates prior to involvement in/being approachedto take part in TOPPITS were required to undergo a 4-week washout period of PPIs, or 24 hours foralginates or acid neutralisers, before randomisation and commencement of TOPPITS trial medication (seeAppendix 2, Tables 36 and 37). Written consent was obtained prior to this washout period. The eligibilityof any patient undergoing a 4-week washout period was reconfirmed before prescribing trial medication.
ConsentInformed consent discussions were undertaken by appropriate site staff (as per the delegation log) involvedin the study, including medical staff and research nurses, with the opportunity for patients to ask any questions.Those wishing to take part gave informed consent by signing and dating the study consent form, which waswitnessed and dated by a member of the research team with documented, delegated responsibility to do so.Occasionally, a patient wishing to have further time to consider the trial also attended a subsequent clinic.The original signed consent form was retained in the investigator site file (ISF) with a copy in the clinical notes,and a copy was provided to the patient. Each patient specifically consented to their general practitioner (GP)being informed of their participation in the study. The right to refuse to participate without giving reasonswas respected.
Randomisation
A blocked allocation (permuted random blocks of variable length) system was used to allocate patients in a1 : 1 ratio stratified by centre and baseline severity (two groups, on the basis of the RSI-HB score: group 1,≤ 20; group 2, > 20). The overall RSI-HB range was 10–38.
Allocation concealment mechanismThe treatment allocation was kept blind from the patients and investigators. Randomisation was conductedvia the NCTU secure web-based randomisation service by a computer-generated allocation list utilisingrandom permuted blocks to ensure concealment of allocation. The blinded randomisation system generateda unique treatment number for each patient that linked to a corresponding allocated trial drug (blinded) inaccordance with block size and strata. The treatment number was clearly documented by the investigatoron the trial prescription to ensure that the pharmacist dispensed the correct medication.
ImplementationThe random computer-generated allocation sequence was produced by a statistician not furthermore involvedwith the trial in order to ensure concealment of allocation. Randomisation was administered centrally via theNCTU using a secure web-based system. The principal investigator or delegated personnel named on thedelegation log obtained a unique trial number via this system, which was available 24 hours a day. Detailsof a nominated NCTU contact for randomisation was provided to sites.
Patients were enrolled at trial sites by staff members who were delegated the task by inclusion on thedelegation log. These were generally the principal investigators (clinicians) and research nurses.
DOI: 10.3310/hta25030 HEALTH TECHNOLOGY ASSESSMENT 2021 VOL. 25 NO. 3
© Queen’s Printer and Controller of HMSO 2021. This work was produced by Wilson et al. under the terms of a commissioning contract issued by the Secretary of State forHealth and Social Care. This issue may be freely reproduced for the purposes of private research and study and extracts (or indeed, the full report) may be included in professionaljournals provided that suitable acknowledgement is made and the reproduction is not associated with any form of advertising. Applications for commercial reproduction shouldbe addressed to: NIHR Journals Library, National Institute for Health Research, Evaluation, Trials and Studies Coordinating Centre, Alpha House, University of Southampton SciencePark, Southampton SO16 7NS, UK.
11

Medication
The trial medication was manufactured by Piramal Pharma Solutions (Morpeth, UK); its provision wasadministered by MODEPHARMA Limited (Beckenham, UK). Three campaigns of trial medication, blindedand randomised at the point of manufacture, were used in the trial. Management and handling comprised:
l ensuring that sites had enough kits to ensure continuous provision to patients over three campaignsand 33 months
l co-ordination of requirements at sites with drug expiry datesl liaison with site pharmacy staff to ensure accurate drug accountability record keepingl organisation of the management of returns and their subsequent destruction at sitesl organisation of the destruction of the remaining kits at the end of the triall in-person monitoring of site pharmaciesl documentation of all stages of provision, dispensing, return and destruction of trial medication, at sites
and centrally.
Blinding
Both the patients and the investigators/assessors were blinded to assignment to either the lansoprazolegroup or the placebo group (double-blind). A set of sealed code-break envelopes was kept either in thepharmacy or in the ISF at participating hospitals; these envelopes were opened only in an emergency,with authorisation from the chief investigator. When the code was broken, details including the patientnumber, who broke the code, why and when were recorded and maintained in the ISF. Code breakswere not routinely carried out for patients who completed study treatment. There were no code breaksthroughout the duration of the trial.
At the second, end-of-therapy, visit, the integrity of the blind was assessed by a questionnaire item askingthe patient if they thought that they had been taking lansoprazole or placebo or if they did not know.
The blind was maintained until all trial data were collected and the database was locked. Patients wereoffered the opportunity at their final visit to be informed of their allocated group, once data analysiswas complete.
The active intervention was a 16-week course of a 30-mg twice-daily dose of the PPI lansoprazole. Thecontrol group received a 16-week course of twice-daily matched placebo. Patients received the interventionin capsule form and swallowed the capsules in the morning and in the evening. The allocation was blind topatients and research team staff and this was maintained throughout the trial.
Outcomes
The primary outcome measure was the raw total RSI score at 16 weeks after randomisation, which was collectedat the first follow-up ENT outpatient visit. The RSI score is calculated from a nine-item, self-administeredquestionnaire scored on a Likert scale, with each item score ranging from 0 to 5, giving a total score range of0–45. A higher score indicates more severe symptoms. Any missing component deems the total score missing.The nine-item RSI total score allows comparison with previous studies as it offers 10 years’worth of comparativedata in the literature. The RSI remains the ‘area standard’ and, despite well-rehearsed limitations, remained ourchosen primary outcome. The treatment period of 16 weeks was selected on the basis of evidence that after8 weeks there was very little further symptomatic improvement (as measured by RSI) in a validation sample of40 patients.50 A period of 8 weeks might, therefore, have seemed justified. However, owing to the fairly smalland highly selected sample (all pH-metry positive) of this early report, we opted for a 16-week period in our
METHODS
NIHR Journals Library www.journalslibrary.nihr.ac.uk
12

definitive, larger study, with a view to maximising the impact and uptake of the TOPPITS findings. In otherwords, we chose this longer period so that we would not be open to criticism for having discontinued therapytoo early.
Secondary outcome measures
l RSI changes at 12 months after randomisation.l RSI score omitting item 9 (heartburn, chest pain, indigestion or stomach acid coming up), as the inclusion
of dyspepsia symptoms has the potential to skew the results in favour of PPIs in past small trials.l CReSS total subscales: oesophageal (14 items), upper airway (eight items) and pharyngeal (seven items).l Quality of life: change in LPR-HRQL total score and subscales at 16 weeks and 12 months.l Laryngeal mucosal changes recorded by RFS (total range 0–29), scored by an independent observer,
outside any of the recruiting sites, who was blind to treatment group.l The ability of RFS and patient characteristics (age, sex, smoking status and BMI) to predict any
observed responses.l Side effects, adverse events (AEs) and serious adverse events (SAEs).l Use of over-the-counter medication.l Patient-reported satisfaction with the trial using a five-point overall satisfaction scale. This asked if the
patient was very dissatisfied, dissatisfied, neither dissatisfied nor satisfied, satisfied or very satisfied.Additional comments were invited.
l Patient accuracy in determining which treatment they had received.
LaryngoscopyLaryngoscopy assessment of the larynx and pharynx was undertaken at baseline by the recruiting clinicianusing a laryngoscope. The appearances contributed to the eligibility criteria. An image was captured toallow the independent clinician to score the appearances using the RFS reported for the analysis at theend of the trial. The scoring scheme for the RFS assessment (as originally published by Belafsky et al.37) isgiven in Appendix 3, Table 40. The images were anonymised, and stored and transferred securely. Whenpossible, all imaging was captured using a video endoscope (digital) instrument rather than the poorer-definition fibrescope. The RFS is not credited with much validity by scientific scrutiny in the diagnosis ofLPR.17,51–53 However, the findings are important because non-specific laryngeal redness is often used byless experienced practitioners and, at times, speech therapists to presume a diagnosis of reflux. Hence,commentary on the significance of the images and their scores is of interest and impact. Scores can rangefrom 0 to 26, with higher scores indicating more intense and/or widespread laryngeal inflammation.
Sample size
The primary outcome measure was the change in the RSI score between baseline and the 16-week assessment.A mean difference of 3 points in RSI score at 16 weeks was felt to be a clinically relevant target based on clinicaland co-applicant experience and prior LPR therapy studies. A mean difference of 3.1 points, with anassumed SD of 7.754 equates to a standardised mean effect size of 0.4. Furthermore, a 0.4 effect size isof smaller magnitude than the effect of phonomicrosurgery or speech therapy.55 A total of 332 patients(166 in each group of the study) were required, to provide 266 patients (133 in each group) completing thetrial intervention, to detect a standardised mean effect size of 0.4 with 90% power and 5% significancelevel allowing for 20% loss to follow-up. A 20% loss to follow-up rate was believed to be a realisticestimate. NHS experience of the investigators in TOPPITS suggested that this was overly optimistic for a trialof this kind.
There were no planned formal interim analyses or stopping rules.
DOI: 10.3310/hta25030 HEALTH TECHNOLOGY ASSESSMENT 2021 VOL. 25 NO. 3
© Queen’s Printer and Controller of HMSO 2021. This work was produced by Wilson et al. under the terms of a commissioning contract issued by the Secretary of State forHealth and Social Care. This issue may be freely reproduced for the purposes of private research and study and extracts (or indeed, the full report) may be included in professionaljournals provided that suitable acknowledgement is made and the reproduction is not associated with any form of advertising. Applications for commercial reproduction shouldbe addressed to: NIHR Journals Library, National Institute for Health Research, Evaluation, Trials and Studies Coordinating Centre, Alpha House, University of Southampton SciencePark, Southampton SO16 7NS, UK.
13

Statistical methods
Descriptive statistics are used to summarise patient characteristics, treatment compliance, RSI and othersecondary measures at randomisation and 16 weeks. The descriptive analysis is based on presenting:
l Underlying distribution of RSI reported graphically (histograms with normal curve overlaid).l RSI scores at baseline and 16 weeks summarised by randomised treatment group, and overall, using
descriptive statistics. Means, SDs, medians, interquartile ranges (IQRs) and ranges are reported, as thescore was treated as a continuous measure but is integer in nature.
l RSI scores inside versus outside the published normal range. The percentage of patients in and out ofnormal range. The upper limit of normal in the RSI is said to be 12 in the general population.26
The primary outcome measure was RSI score after 16 weeks. An unadjusted univariate analysis of 16-weekRSI is presented. The primary analysis is a multivariable analysis using analysis of covariance (ANCOVA)and multilevel mixed-effect linear regression to compare the RSI at 16 weeks while adjusting for potentialconfounders. Although ANCOVA is generally robust to departures from normality, transformation isinvestigated and, if applied, is retained in the analyses throughout. Primary analysis adjusts for effects ofstratification factors at randomisation [centre, as a random effect in the regression modelling, and baselineseverity (mild RSI-HB of ≤ 20, severe RSI-HB of > 20), as a fixed effect in the regression modelling].
Data were analysed using a statistical software package [Stata® version 14 (StataCorp LP, College Station,TX, USA)]. The primary hypothesis tested was H0: the mean RSI at 16 weeks in the lansoprazole group isequal to the mean RSI at 16 weeks in the placebo group after adjustment for baseline stratification factors.Secondary analyses of the primary outcome measure considered adjustment for important clinical anddemographic baseline factors, specifically sex, age, BMI, smoking status, alcohol consumption, baselinelaryngeal appearance scores using the RFS, CReSS total and subscales and categories of symptoms.Three models were derived:
l Model 1 – adjusted for stratification factors used at randomisation [recruiting centre (as a randomeffect) and baseline severity, as defined by the binary RSI-HB cut-off value of 20 (as a fixed effect)].
l Model 2 – adjusted for baseline severity with RSI-HB as a continuous measure.l Model 3 – adjusted for baseline severity (RSI-HB as a continuous measure) and other important clinical
and demographic baseline factors, specifically age, sex, smoking status and BMI.
Continuous covariates were investigated for non-linear relationships with outcome using first-orderfractional polynomial transformations, which were used if they substantially improved model fit based onthe Akaike information criterion (AIC). The optimal model was derived using a forward selection methodwith comparison of –2log-likelihood for variable inclusion. Analyses were conducted at a two-sided 5%level of significance throughout. The impact of removing any covariates from the final model was assessedin order to derive the most parsimonious model.
The analysis of secondary outcomes followed a broadly similar strategy for the questionnaire scores.Safety data were not subject to statistical comparison. Analyses were carried out on a complete-case basis.Missing data were described. The use of multiple imputation techniques was considered for the primaryoutcome and covariate data, should data be missing for patients completing the study to a sufficientextent (approximately > 10%) and deemed missing at random.
No formal interim analyses were planned. A statistical analysis plan was in place prior to anycomparative analyses.
METHODS
NIHR Journals Library www.journalslibrary.nihr.ac.uk
14

Definition of ‘compliant intention-to-treat group’
Primary statistical analyses were based on a compliant intention-to-treat (ITT) group. The DMC recommendedthat a distribution approach should be employed to determine a clinically relevant compliance window tomaximise inclusion of patients and exclude only significant outliers. Thus, the compliant ITT group was defined,prior to comparative analyses and documented in the statistical analysis plan, as those with all ineligibleand protocol violator patients included in the analysis in their randomised treatment group and attendingtheir 16-week follow-up visit between 14 and 20 weeks. The distribution of time from randomisation tocompletion of the follow-up visits is reported graphically in Figure 1 (see also Appendix 1, Table 29).
Sensitivity analyses are based on a pragmatic ITT group, with all ineligible and protocol violator patientsincluded in the analysis on an ITT basis with patients kept in their randomised treatment group. This includesoutcome measures completed at any time point.
On this basis, the power achieved was as follows:
l compliant ITT group – 82% power based on a minimum of 102 (lansoprazole) and 118 (placebo)participants
l pragmatic ITT group – 89% power based on a minimum of 127 (lansoprazole) and 140 (placebo)participants.
The per-treatment analysis of safety data reports the AEs that are related to the treatment. All randomisedpatients who start treatment were included in the analysis according to the treatment they received.
0
50
100
150
Freq
uen
cy
0 10 20 30 40 50Time from randomisation to 16-week follow-up visit (weeks)
FIGURE 1 Histogram of time between randomisation and the 16-week follow-up visit in 283 patients.
DOI: 10.3310/hta25030 HEALTH TECHNOLOGY ASSESSMENT 2021 VOL. 25 NO. 3
© Queen’s Printer and Controller of HMSO 2021. This work was produced by Wilson et al. under the terms of a commissioning contract issued by the Secretary of State forHealth and Social Care. This issue may be freely reproduced for the purposes of private research and study and extracts (or indeed, the full report) may be included in professionaljournals provided that suitable acknowledgement is made and the reproduction is not associated with any form of advertising. Applications for commercial reproduction shouldbe addressed to: NIHR Journals Library, National Institute for Health Research, Evaluation, Trials and Studies Coordinating Centre, Alpha House, University of Southampton SciencePark, Southampton SO16 7NS, UK.
15

Data management
A study-specific database was designed, built and tested using Elsevier’s MACRO Electronic Data Capture(InferMed, London, UK) electronic data collection system. MACRO uses a secure web-based interface fordata entry; no data are stored on computers at the site. Data for individual patients were entered by eachprincipal investigator, or his/her delegated nominee, into the electronic case report forms. Each MACRO useris assigned role-based permissions specific to their site and role. MACRO has an inbuilt back-up facility,through Elsevier’s hosting partner Rackspace’s (Rackspace Ltd, Hayes, UK) secure premises in London,which is managed and supported by the Rackspace team.
Data entry and quality were monitored regularly by the Trial Management Group and sites were encouragedto enter all data as soon as possible. Frequent checks were made for missing and contradictory data, as wellas ensuring that the data entered into the randomisation system matched those in MACRO. Data querieswere raised with the sites on an ongoing basis, as necessary.
METHODS
NIHR Journals Library www.journalslibrary.nihr.ac.uk
16

Chapter 3 Results
Recruitment to the trial is reported in a Consolidated Standards of Reporting Trials (CONSORT) flowdiagram (Figure 2).
Assessed for eligibility(n = 1427)
Excluded(n = 1081)
• Ineligible, n = 558• Declined to participate, n = 404• Other reasons, n = 119
• ITT analysis, n = 127• Compliant – 14–20 weeks, n = 102
Attended 16-week visit(n = 135)
• Withdrew, n = 31• Did not attend 16-week visit, n = 6• Primary outcome completed, n = 127
Allocated to lansoprazole(n = 172)
• Received allocated intervention, n = 172• Did not receive allocated intervention, n = 0
Attended 16-week visit(n = 148)
• Withdrew, n = 23• Did not attend 16-week visit, n = 3• Primary outcome completed, n = 140
Allocated to placebo(n = 174)
• Received allocated intervention, n = 172• Did not receive allocated intervention, n = 2
• Ineligible – no medication assigned and withdrew, n = 1• Did not collect medication and withdrew, n = 1
• ITT analysis, n = 140• Compliant – 14–20 weeks, n = 118
Allocation atbaseline visit (visit 1)
Primary analysis
Primary end-point visitat 16 weeks (visit 2)
Randomised(n = 346)
Enrolment
Attended 12-month follow-up visit(n = 109)
• Did not attend 12-month visit, n = 2• Withdrew, n = 63 (2 of 63 withdrew from IMP and attended visit) • Outcome data completed, n = 109• Compliant ITT group, n = 82
Attended 12-month follow-up visit(n = 117)
• Did not attend 12-month visit, n = 2• Withdrew, n = 62 (7 of 62 withdrew from IMP and attended visit)• Outcome data completed, n = 117• Compliant ITT group, n = 99
Final follow-up visitat 12 months (visit 3)
FIGURE 2 The CONSORT flow diagram. IMP, investigational medicinal product.
DOI: 10.3310/hta25030 HEALTH TECHNOLOGY ASSESSMENT 2021 VOL. 25 NO. 3
© Queen’s Printer and Controller of HMSO 2021. This work was produced by Wilson et al. under the terms of a commissioning contract issued by the Secretary of State forHealth and Social Care. This issue may be freely reproduced for the purposes of private research and study and extracts (or indeed, the full report) may be included in professionaljournals provided that suitable acknowledgement is made and the reproduction is not associated with any form of advertising. Applications for commercial reproduction shouldbe addressed to: NIHR Journals Library, National Institute for Health Research, Evaluation, Trials and Studies Coordinating Centre, Alpha House, University of Southampton SciencePark, Southampton SO16 7NS, UK.
17

Screening and recruitment
Screening and recruitment activity are summarised in Appendix 1, Tables 27 and 28.
The trial opened to recruitment on 28 April 2014, but owing to slower-than-expected recruitment a no-costextension was obtained; hence, the trial closed to recruitment on 28 February 2017. The original targetrecruitment figure was 332; this was revised following DMC recommendation on 29 January 2016 to allowrecruitment to continue to 28 February 2017, at which point the number recruited was 346. This ensuredthat the numbers of participants reaching the 4- and 12-month trial visits were sufficient to satisfy the trialprotocol (version 5.0, January 2017).
Recruitment overview
l Trial status: closed to recruitment (28 February 2017).l Grant awarded: 27 June 2013.l Ethics approval awarded: 2 December 2013.l Number of sites: eight.l Date first site opened: 28 April 2014 (site initiation date).l Date first patient randomised: 27 May 2014.l Date of data locks: 3 May 2018.l Total number of patients randomised before recruitment closed: 346.l Date last patient randomised: 24 February 2017.l Last follow-up: 23 March 2018.
Randomisation
A blocked allocation (permuted random blocks of variable length) system was used to allocate patients in a1 : 1 ratio, stratified by centre and baseline severity (RSI-HB mild, ≤ 20; RSI-HB severe, > 20).
Balance was confirmed by stratification factors. See Appendix 1, Table 30, for stratification by baselineseverity in terms of RSI-HB and stratification by site in Report Supplementary Material 1, Table 1. Appendix 1,Table 31, gives details of patients who were mis-stratified.
Four ineligible patients were reported (see Appendix 1, Table 32).
Withdrawals
There were 125 patients who were reported as withdrawals (including losses to follow-up) with specifieddates. Two patients did not complete the trial but did not have a withdrawal date and two patients didnot have trial completion status confirmed (i.e. no date for completion of or withdrawal from the trial).A summary of the timing of withdrawals from the trial, with respect to the primary end-point visit, is givenin Appendix 1, Table 33. Descriptive statistics for time to withdrawal from randomisation are given inAppendix 1, Table 34.
Baseline data
Demographic baseline characteristics (Table 1) show the two treatment groups to be balanced. The ageand sex statistics are consistent with the population of participants with chronic throat symptoms.
Scrutiny of Table 2 confirms that the compliant ITT group is a representative subsample of the totaltrial population.
RESULTS
NIHR Journals Library www.journalslibrary.nihr.ac.uk
18

TABLE 1 Baseline demographic characteristics and stratification variables, by treatment group (all randomisedpatients and the pragmatic ITT group) (primary outcome provided at any time)
Variable
All trial patients (N= 346) Pragmatic ITT group (N= 267)
Treatment group
Total
Treatment group
TotalLansoprazole Placebo Lansoprazole Placebo
Sex, n (%)
Male 71 (41) 79 (45) 150 (43) 49 (39) 65 (46) 114 (43)
Female 101 (59) 95 (55) 196 (57) 78 (61) 75 (54) 153 (57)
Age (years)
Mean (SD) 53.5 (13.3) 50.8 (13.9) 52.2 (13.7) 54.8 (12.8) 52.3 (13.7) 53.5 (13.3)
Range 21–84 20–80 20–84 23–84 21–80 21–84
Weight (kg)
n 169 170 339 125 140 265
Mean (SD) 79.4 (18.2) 79.3 (16.8) 79.4 (17.5) 78.0 (18.5) 79.3 (16.1) 78.7 (17.3)
Range 43.8–142.0 42.5–140.3 42.5–142.0 43.8–142.0 48.0–140.3 43.8–142.0
Height (m)
n 170 171 341 126 140 266
Mean (SD) 1.68 (0.12) 1.68 (0.10) 1.68 (0.11) 1.67 (0.1) 1.68 (0.1) 1.67 (0.1)
Range 1.43–2.50 1.45–1.92 1.43–2.50 1.43–2.50 1.45–1.91 1.43–2.50
BMI (kg/m2)
n 169 170 339 125 140 265
Mean (SD) 28.2 (5.9) 28.1 (5.3) 28.1 (5.6) 28.1 (6.3) 28.1 (5.3) 28.1 (5.8)
Range 11.3–56.9 18.3–49.1 11.3–56.9 11.3–56.9 18.3–49.1 11.3–56.9
Smoking (pack-years)
n 168 171 339 124 140 264
Median (IQR) 0 (0–5) 0 (0–0.5) 0 (0–3) 0 (0–3) 0 (0–0.75) 0 (0–2.5)
Mean (SD) 4.7 (9.7) 3.9 (10.4) 4.3 (10.0) 4.1 (8.7) 4.2 (11.1) 4.2 (10.0)
Range 0–51 0–76 0–76 0–51 0–76 0–76
Alcohol consumption (units per week)
n 169 167 336 125 138 263
Median (IQR) 4 (0–10) 3 (0–10) 4 (0–10) 4 (0–10) 3 (0–10) 3 (0–10)
Mean (SD) 8.7 (12.2) 6.6 (9.0) 7.7 (10.8) 8.3 (11.2) 6.8 (9.4) 7.5 (10.3)
Range 0–80 0–60 0–80 0–50 0–60 0–60
Baseline RSI-HB severity
n 171 171 342 127 140 267
Mean (SD) 20.0 (6.8) 20.1 (6.5) 20.1 (6.6) 20.0 (6.9) 20.0 (6.5) 20.0 (6.7)
Range 10–38 10–38 10–38 10–38 10–38 10–38
continued
DOI: 10.3310/hta25030 HEALTH TECHNOLOGY ASSESSMENT 2021 VOL. 25 NO. 3
© Queen’s Printer and Controller of HMSO 2021. This work was produced by Wilson et al. under the terms of a commissioning contract issued by the Secretary of State forHealth and Social Care. This issue may be freely reproduced for the purposes of private research and study and extracts (or indeed, the full report) may be included in professionaljournals provided that suitable acknowledgement is made and the reproduction is not associated with any form of advertising. Applications for commercial reproduction shouldbe addressed to: NIHR Journals Library, National Institute for Health Research, Evaluation, Trials and Studies Coordinating Centre, Alpha House, University of Southampton SciencePark, Southampton SO16 7NS, UK.
19

TABLE 2 Baseline demographic characteristics, by treatment group (compliant ITT group)
Variable
Treatment group
Total (N= 220)Lansoprazole (N= 102) Placebo (N= 118)
Sex, n (%)
Male 38 (37) 56 (47) 94 (43)
Female 64 (63) 62 (53) 126 (57)
Age (years)
Mean (SD) 55.3 (12.8) 53.8 (13.4) 54.5 (13.1)
Range 23–84 21–80 21–84
Weight (kg)
Mean (SD) 78.9 (19.6) 80.1 (16.2) 79.5 (17.8)
Range 43.8–142.0 50.6–140.3 43.8–142.0
Height (m)
Mean (SD) 1.67 (0.13) 1.68 (0.10) 1.67 (0.12)
Range 1.43–2.50 1.45–1.91 1.43–2.50
BMI (kg/m2)
Mean (SD) 28.5 (6.7) 28.4 (5.4) 28.5 (6.1)
Range 11.3–56.9 18.3–49.1 11.3–56.9
Smoking (pack-years)
n 101 118 219
Median (IQR) 0 (0–3) 0 (0–0) 0 (0–1)
Mean (SD) 4.3 (9.0) 4.3 (11.8) 4.3 (10.6)
Range 0–51 0–76 0–76
TABLE 1 Baseline demographic characteristics and stratification variables, by treatment group (all randomisedpatients and the pragmatic ITT group) (primary outcome provided at any time) (continued )
Variable
All trial patients (N= 346) Pragmatic ITT group (N= 267)
Treatment group
Total
Treatment group
TotalLansoprazole Placebo Lansoprazole Placebo
Site, n (%)
Birmingham 5 (3) 5 (3) 10 (3) 5 (4) 4 (3) 9 (3)
Brighton 5 (3) 4 (2) 9 (3) 5 (4) 2 (1) 7 (3)
Glasgow 18 (10) 21 (12) 39 (11) 7 (6) 18 (13) 25 (9)
Manchester 15 (9) 12 (7) 27 (8) 14 (11) 9 (6) 23 (9)
Newcastle 66 (38) 67 (39) 133 (38) 46 (36) 51 (36) 97 (36)
Nottingham 34 (20) 36 (21) 70 (20) 31 (24) 33 (24) 64 (24)
Stockport 5 (3) 6 (3) 11 (3) 5 (4) 6 (4) 11 (4)
Sunderland 24 (14) 23 (13) 47 (14) 14 (11) 17 (12) 31 (12)
Green shading denotes stratification variables.Two patients were randomised but never received medication and did not return baseline data (participant identifiers: 2106and 1062).
RESULTS
NIHR Journals Library www.journalslibrary.nihr.ac.uk
20

Data quality
Data were received for analysis from:
l MACRO – the trial datal the NCTU randomisation service – randomisation data including details of stratification (Microsoft Excel®,
Microsoft Corporation, Redmond, WA, USA)l RFS assessment – from an independent reviewer, validated by NCTU (using Microsoft Excel) (see Appendix 3,
Table 41, for the RFS scoring scheme).
Data sets were merged according to the unique identifier allocated at randomisation.
Questionnaires and forms returned, by visitData were collected using case report forms. Case report forms were completed and collated in thefollowing order:
1. registration and randomisation form – completed prior to treatment allocation (baseline anddemographic data for potential covariates collected)
2. questionnaires completed at baseline visit – RSI (primary), CReSS (secondary), LPR-HRQL (secondary)3. AEs and concomitant medication use recorded at baseline visit4. trial questionnaires again completed at visit 2 (16-week follow-up) as at the baseline visit5. returned medication – capsule count carried out at visit 26. electronic case report form completed at visit 2 showing which treatment (trial drug or placebo) the
patient believed they were randomised to7. AEs and concomitant medication use recorded at visit 28. questionnaires completed at visit 3 as at the baseline and 16-week follow-up visits9. AEs and concomitant medication use recorded at visit 3.
TABLE 2 Baseline demographic characteristics, by treatment group (compliant ITT group) (continued )
Variable
Treatment group
Total (N= 220)Lansoprazole (N= 102) Placebo (N= 118)
Alcohol consumption (units per week)
Median (IQR) 4 (0–10) 3 (0–10) 4 (0–10)
Mean (SD) 8.0 (10.5) 7.1 (9.7) 7.5 (10.0)
Range 0–45 0–60 0–60
Baseline RSI-HB severity
Mean (SD) 20.3 (7.4) 19.8 (6.6) 20.0 (7.0)
Range 10–38 10–38 10–38
Site, n (%)
Birmingham 5 (5) 4 (3) 9 (4)
Brighton 3 (3) 2 (2) 5 (2)
Glasgow 5 (5) 14 (12) 19 (9)
Manchester 9 (9) 6 (5) 15 (7)
Newcastle 30 (29) 39 (33) 69 (31)
Nottingham 31 (30) 32 (27) 63 (29)
Stockport 5 (5) 4 (3) 9 (4)
Sunderland 14 (14) 17 (14) 31 (14)
Green shading denotes stratification variables.
DOI: 10.3310/hta25030 HEALTH TECHNOLOGY ASSESSMENT 2021 VOL. 25 NO. 3
© Queen’s Printer and Controller of HMSO 2021. This work was produced by Wilson et al. under the terms of a commissioning contract issued by the Secretary of State forHealth and Social Care. This issue may be freely reproduced for the purposes of private research and study and extracts (or indeed, the full report) may be included in professionaljournals provided that suitable acknowledgement is made and the reproduction is not associated with any form of advertising. Applications for commercial reproduction shouldbe addressed to: NIHR Journals Library, National Institute for Health Research, Evaluation, Trials and Studies Coordinating Centre, Alpha House, University of Southampton SciencePark, Southampton SO16 7NS, UK.
21

The three trial questionnaires (RSI, CReSS and LPR-HRQL) were completed at all three visits:
l visit 1 – baseline visit (data locked: 3 May 2018)l visit 2 – primary end-point, 16-week follow-up visit (data locked: 3 May 2018)l visit 3 – 12-month follow-up visit (data locked: 3 May 2018).
Laryngoscopy assessmentThe RFS data were included in the analysis to explore whether or not laryngeal appearance predictsoutcome (i.e. response to lansoprazole). The image assessments were carried out (by PC) in four blocks:in December 2015, December 2016, June 2017 and December 2017.
Treatment received
The analysis set is the per-treatment analysis group defined in the statistical methods. Inclusion in theper-treatment set was based on capsule return at the 16-week primary end point. In total, 265 out of346 participants (77%) had information on returned medication (including returned empty packaging forthose who took the full course). Three patients did not take any trial medication and were removed fromthe per-treatment analysis group.
In total, 262 out of 346 trial participants (76%) are assumed to have taken at least one capsule of theirtrial medication and are included in the per-treatment analysis group [126 out of 172 (73%) in thelansoprazole group; 136 out of 174 (78%) in the placebo group]. Further details of dose taken are givenin Appendix 2, Table 38.
Protocol treatment scheduleTreatment was with either a 30-mg (twice-daily) dose of the PPI lansoprazole or placebo for 16 weeks.The kits contained 17 weeks’ supply so each patient received 238 capsules of either lansoprazole or placebo.The treatment was double blind; both patients and clinicians were blind to treatment.
Trial medication was prescribed by a clinician, and dispensed to the patient or clinical staff in accordancewith local pharmacy policy.
Patients who were still in possession of any medication returned all leftover trial supplies in theiroriginal packaging (even if empty) to the clinician or pharmacist at the 16-week follow-up visit(primary end point).
Medication receivedAt 16 weeks (± 2 weeks in protocol) following recruitment, the primary end-point clinic (visit 2) took placeat the TOPPITS clinic. A patient who completed the course of medication in exactly 16 weeks would havetaken 16 × 7 × 2 = 224 doses of lansoprazole or placebo. The dose supplied at randomisation comprised238 capsules, enough for 17 weeks, with two capsules per day as per the protocol. Forty-two per centof participants reported taking the full dose, balanced across randomised groups, and 70% patientsreported taking ≥ 90% of the dose, balanced across groups. The median percentage protocol dose is99% (IQR 86–100%).
Appendix 2 contains further details of doses taken.
Proton pump use and concomitant medicationRecent PPI usage at randomisation was collected at baseline and is presented in Appendix 2.
A total of 377 concomitant medication uses were reported during the trial among the per-treatmentanalysis group, in 143 unique patients (Table 3).
RESULTS
NIHR Journals Library www.journalslibrary.nihr.ac.uk
22

TABLE 3 Concomitant medication reported at baseline and follow-up visits (per-treatment group)
Participant concomitant medication use
Visit
1 (baseline) 2 (primary end point: 16 weeks) 3 (12-month follow-up)
Treatment group
Total
Treatment group
Total
Treatment group
TotalLansoprazole Placebo Lansoprazole Placebo Lansoprazole Placebo
Total number of participants reporting medications 108 73 181 38 40 78 57 56 113
Number of unique participants reporting medications 41 33 74 26 25 51 32 34 66
DOI:10.3310/hta25030
HEA
LTHTECH
NOLO
GYASSESSM
ENT2021
VOL.25
NO.3
©Queen
’sPrinter
andController
ofHMSO
2021.This
work
was
producedby
Wilson
etal.
underthe
termsof
acom
missioning
contractissued
bythe
Secretaryof
Statefor
Health
andSocialC
are.This
issuemay
befreely
reproducedfor
thepurposes
ofprivate
researchand
studyand
extracts(or
indeed,the
fullreport)may
beincluded
inprofessional
journalsprovided
thatsuitable
acknowledgem
entismade
andthe
reproductionisnot
associatedwith
anyform
ofadvertising.
Applications
forcom
mercialreproduction
shouldbe
addressedto:
NIHRJournals
Library,NationalInstitute
forHealth
Research,Evaluation,
Trialsand
StudiesCoordinating
Centre,
Alpha
House,
University
ofSoutham
ptonScience
Park,Southam
ptonSO
167N
S,UK.
23

Awareness of treatment group by patientsEach patient was asked which drug they believed that they had been taking at the 16-week follow-upvisit. Fourteen per cent were not able to identify (or attempt to identify) which treatment they had beenrandomised to and answered ‘Don’t know’ (Table 4).
Three assessments were missing: one for a participant randomised to lansoprazole and two for participantsrandomised to placebo.
Outcomes and estimation of treatment effects
Primary outcome measureCompliance was assessed in relation to the time frame of 14–20 weeks post randomisation. The distributionof time from randomisation to the primary end-point 16-week follow-up visits (visit 2) is reported graphicallyin Figure 3. The graph shows how much time has elapsed since randomisation to the 16-week follow-up visitfor all patients who attended the visit (n = 283). The dashed lines show patients included in the compliant ITTgroup (n = 220). Further information on compliance is given in Appendix 1, Tables 29 and 35. See Appendix 2,Tables 39 and 40, for details of individual RSI items.
0
50
100
150
0 10 20 30 40 50
Time from randomisation to 16-week follow-up visit (weeks)
Freq
uen
cy
FIGURE 3 Histogram of time between randomisation and the primary end-point 16-week follow-up visit (overall).The dashed lines show patients included in the compliant ITT group (n= 220).
TABLE 4 Patient assessment of drug taken
Participant opinion of drug taken
Actual randomised treatment, n (%)
Total (N= 262), n (%)Lansoprazole (N= 126) Placebo (N= 136)
Lansoprazole 53 (42) 43 (32) 96 (37)
Placebo 51 (40) 76 (56) 127 (48)
Don’t know 21 (17) 15 (11) 36 (14)
Total number assessed 125 (99) 134 (99) 259 (99)
Bold denotes correct opinion.
RESULTS
NIHR Journals Library www.journalslibrary.nihr.ac.uk
24
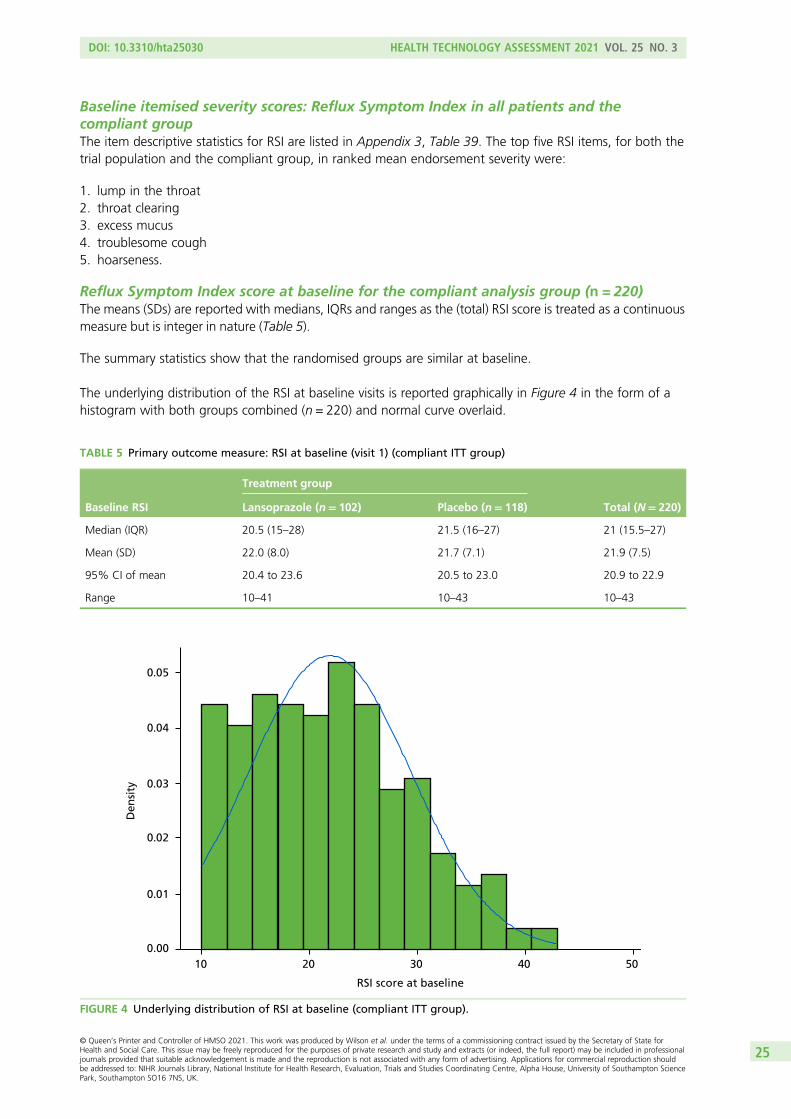
Baseline itemised severity scores: Reflux Symptom Index in all patients and thecompliant groupThe item descriptive statistics for RSI are listed in Appendix 3, Table 39. The top five RSI items, for both thetrial population and the compliant group, in ranked mean endorsement severity were:
1. lump in the throat2. throat clearing3. excess mucus4. troublesome cough5. hoarseness.
Reflux Symptom Index score at baseline for the compliant analysis group (n = 220)The means (SDs) are reported with medians, IQRs and ranges as the (total) RSI score is treated as a continuousmeasure but is integer in nature (Table 5).
The summary statistics show that the randomised groups are similar at baseline.
The underlying distribution of the RSI at baseline visits is reported graphically in Figure 4 in the form of ahistogram with both groups combined (n = 220) and normal curve overlaid.
TABLE 5 Primary outcome measure: RSI at baseline (visit 1) (compliant ITT group)
Baseline RSI
Treatment group
Total (N= 220)Lansoprazole (n= 102) Placebo (n= 118)
Median (IQR) 20.5 (15–28) 21.5 (16–27) 21 (15.5–27)
Mean (SD) 22.0 (8.0) 21.7 (7.1) 21.9 (7.5)
95% CI of mean 20.4 to 23.6 20.5 to 23.0 20.9 to 22.9
Range 10–41 10–43 10–43
0.00
0.01
0.02
Den
sity 0.03
0.04
0.05
10 20 30 40 50
RSI score at baseline
FIGURE 4 Underlying distribution of RSI at baseline (compliant ITT group).
DOI: 10.3310/hta25030 HEALTH TECHNOLOGY ASSESSMENT 2021 VOL. 25 NO. 3
© Queen’s Printer and Controller of HMSO 2021. This work was produced by Wilson et al. under the terms of a commissioning contract issued by the Secretary of State forHealth and Social Care. This issue may be freely reproduced for the purposes of private research and study and extracts (or indeed, the full report) may be included in professionaljournals provided that suitable acknowledgement is made and the reproduction is not associated with any form of advertising. Applications for commercial reproduction shouldbe addressed to: NIHR Journals Library, National Institute for Health Research, Evaluation, Trials and Studies Coordinating Centre, Alpha House, University of Southampton SciencePark, Southampton SO16 7NS, UK.
25
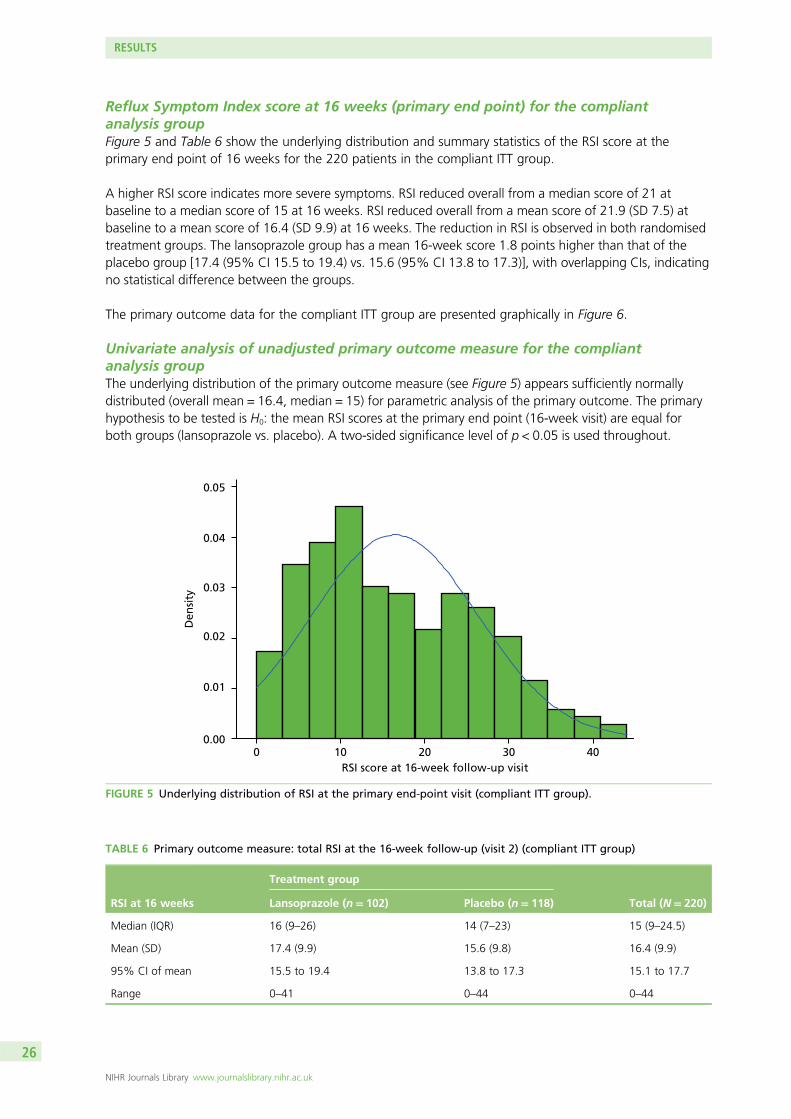
Reflux Symptom Index score at 16 weeks (primary end point) for the compliantanalysis groupFigure 5 and Table 6 show the underlying distribution and summary statistics of the RSI score at theprimary end point of 16 weeks for the 220 patients in the compliant ITT group.
A higher RSI score indicates more severe symptoms. RSI reduced overall from a median score of 21 atbaseline to a median score of 15 at 16 weeks. RSI reduced overall from a mean score of 21.9 (SD 7.5) atbaseline to a mean score of 16.4 (SD 9.9) at 16 weeks. The reduction in RSI is observed in both randomisedtreatment groups. The lansoprazole group has a mean 16-week score 1.8 points higher than that of theplacebo group [17.4 (95% CI 15.5 to 19.4) vs. 15.6 (95% CI 13.8 to 17.3)], with overlapping CIs, indicatingno statistical difference between the groups.
The primary outcome data for the compliant ITT group are presented graphically in Figure 6.
Univariate analysis of unadjusted primary outcome measure for the compliantanalysis groupThe underlying distribution of the primary outcome measure (see Figure 5) appears sufficiently normallydistributed (overall mean = 16.4, median = 15) for parametric analysis of the primary outcome. The primaryhypothesis to be tested is H0: the mean RSI scores at the primary end point (16-week visit) are equal forboth groups (lansoprazole vs. placebo). A two-sided significance level of p < 0.05 is used throughout.
0.00
0.01
0.02
0.03
0.04
0.05
0 10 20 30 40RSI score at 16-week follow-up visit
Den
sity
FIGURE 5 Underlying distribution of RSI at the primary end-point visit (compliant ITT group).
TABLE 6 Primary outcome measure: total RSI at the 16-week follow-up (visit 2) (compliant ITT group)
RSI at 16 weeks
Treatment group
Total (N= 220)Lansoprazole (n= 102) Placebo (n= 118)
Median (IQR) 16 (9–26) 14 (7–23) 15 (9–24.5)
Mean (SD) 17.4 (9.9) 15.6 (9.8) 16.4 (9.9)
95% CI of mean 15.5 to 19.4 13.8 to 17.3 15.1 to 17.7
Range 0–41 0–44 0–44
RESULTS
NIHR Journals Library www.journalslibrary.nihr.ac.uk
26

The null hypothesis is no difference between means for PPI (17.4, 95% CI 15.5 to 19.4) versus placebo(15.6, 95% CI 13.8 to 17.3). The test statistic was t = 1.402 and the two-sided p-value was 0.162, leading tothe conclusion that there was no statistically significant difference in the RSI score at 16 weeks betweenlansoprazole and placebo.
Table 7 and Figure 7 show the change in RSI score (change RSI = 16-week RSI – baseline RSI) to the primaryend-of-treatment end point.
The overall mean reduction in RSI score from baseline to 16 weeks is 5.4, which is observed across bothrandomised groups: lansoprazole group, 4.6-point reduction; placebo group, 6.2-point reduction (withoverlapping CIs indicating no statistical difference between the groups). The lansoprazole group had amean reduction of 1.6 points less than the mean reduction observed in the placebo group.
0
10
20
30
40
RSI
sco
re
BaselinePrimary end point
(a)
RSI score at
0
10
20
30
40
RSI
sco
re
(b)
BaselinePrimary end point
RSI score at
FIGURE 6 Box plots showing medians, IQRs and overall ranges of RSI score at baseline and primary end-point visit(compliant ITT group). (a) Lansoprazole group (n= 102); and (b) placebo group (n= 118).
DOI: 10.3310/hta25030 HEALTH TECHNOLOGY ASSESSMENT 2021 VOL. 25 NO. 3
© Queen’s Printer and Controller of HMSO 2021. This work was produced by Wilson et al. under the terms of a commissioning contract issued by the Secretary of State forHealth and Social Care. This issue may be freely reproduced for the purposes of private research and study and extracts (or indeed, the full report) may be included in professionaljournals provided that suitable acknowledgement is made and the reproduction is not associated with any form of advertising. Applications for commercial reproduction shouldbe addressed to: NIHR Journals Library, National Institute for Health Research, Evaluation, Trials and Studies Coordinating Centre, Alpha House, University of Southampton SciencePark, Southampton SO16 7NS, UK.
27

Comparison of Reflux Symptom Index scores at baseline and 16 weeks with the publishedupper limit of normal range, for the compliant intention-to-treat analysis groupThe upper limit of normal in the total nine-item RSI is said to be < 12 in the asymptomatic population.26
Overall, 10% of patients are within normal range at baseline, balanced across randomised groups (this figurereflects the inclusion severity criterion, i.e. the eight-item version RSI excluding the dyspepsia item 9, ‘RSI-HB’).At 16 weeks, 43% (95% CI 37% to 50%) of participants were within the normal range, balanced acrossrandomised groups: 41% (95% CI 31% to 51%) for the lansoprazole group versus 45% (95% CI 36% to54%) for the placebo group. The overlapping CIs indicate no statistical difference between the groups.
Multivariable analysis of primary outcome for the compliantintention-to-treat analysis group
The primary outcome measure was RSI score after 16 weeks and was initially analysed using ANCOVAmethods in order to compare the 16-week RSI scores between the treatment groups while adjusting forpotential confounders, as specified in the protocol (Table 8). Although ANCOVA was generally robust todepartures from normality, normality was assumed (see Figure 5).
There did not appear to be a statistically significant difference in RSI at 16 weeks between randomisedtreatment groups (p = 0.106). In ANCOVA, site is not a reliable estimate as the algorithm deals with thelocation numerals as if they were quantitative data. Site is more properly modelled as a random effect ina multilevel model.
TABLE 7 Change in RSI (0 to 16 weeks) (compliant ITT group)
Change in RSI scores(baseline to 16 weeks)
Treatment group
Total (N= 220)Lansoprazole (n= 102) Placebo (n= 118)
Median (IQR) –4 (–10 to 1) –5 (–13 to 1) –5 (–11 to 1)
Mean (SD) –4.6 (8.0) –6.2 (9.0) –5.4 (8.6)
95% CI of mean –6.2 to –3.0 –7.8 to –4.5 –6.6 to –4.3
Range –31 to 19 –29 to 11 –31 to 19
–30
–20
–10
0
10
20
(a)
Ch
ang
e in
RSI
sco
re b
etw
een
bas
elin
ean
d 1
6-w
eek
follo
w-u
p
–30
Ch
ang
e in
RSI
sco
re b
etw
een
bas
elin
ean
d 1
6-w
eek
follo
w-u
p
–20
–10
0
10
20
(b)
FIGURE 7 Box plots showing medians, IQRs and overall ranges for change in RSI score from baseline to the 16-weekfollow-up (compliant ITT group). (a) Lansoprazole group (n= 102); and (b) placebo group (n = 118).
RESULTS
NIHR Journals Library www.journalslibrary.nihr.ac.uk
28

Statistical modelling of the primary outcomeA multilevel mixed-effect linear regression was used to model the primary outcome measure – 16-weekRSI – on a complete-case basis. Three models were developed as specified in Statistical methods (seeTable 12 for a summary of the model results for both the compliant and the pragmatic ITT populations).
Model 1Model 1 adjusted for stratification factors used at randomisation as covariates in the analysis: (1) recruitingcentre (as a random effect) and (2) binary baseline severity as defined by the binary RSI-HB cut-off value of20 (as a fixed effect) (Table 9).
Modelling site as a random effect demonstrates no impact of site on RSI score at 16 weeks, as anticipated,and demonstrates the advantage of modelling these data more appropriately.
TABLE 8 Primary outcome measure as response, with adjustment for site and baseline severity (compliant ITT group)
Source Partial SS df Mean square F-ratio p-value
Model 5502.119 9 611.347 8.14 < 0.001
Arm 198.180 1 198.180 2.64 0.106
Site 1822.126 7 260.304 3.47 0.002
Baseline severity 3429.688 1 3429.688 45.68 < 0.001
Residual 15,765.859 210 75.076
Total 21,267.977 219 97.114
df, degrees of freedom; SS, sum of squares.Adjusted R2 = 0.227 (n = 220).
TABLE 9 Results of multilevel mixed-effect linear regression (model 1), adjusted for stratification factors used atrandomisation (site and baseline severity) (compliant ITT group) (n= 220)
Model Type Beta SETeststatistic p-value 95% CI (beta)
Group: lansoprazole (reference = placebo) Fixed 1.929 1.160 1.66 0.096 –0.345 to 4.203
Site (reference = Birmingham)
Brighton Random –6.010 4.727 –1.27 0.204 –15.275 to 3.254
Glasgow –0.973 3.478 –0.28 0.780 –7.789 to 5.843
Manchester 5.123 3.576 1.43 0.152 –1.886 to 12.131
Newcastle –1.871 3.047 –0.61 0.539 –7.843 to 4.101
Nottingham –5.937 3.028 –1.96 0.050 –11.871 to –0.003
Stockport –3.701 4.025 –0.92 0.358 –11.590 to 4.188
Sunderland –3.385 3.216 –1.05 0.293 –9.689 to 2.919
RSI-HB baseline severity: severe(reference = mild)
Fixed 8.173 1.181 6.92 < 0.001 5.858 to 10.489
Constant 14.349 3.044 4.71 < 0.001 8.383 to 20.315
SE, standard error.Log-likelihood = –782.084; Wald chi-squared test = 76.78; p-value > χ2 < 0.001.
DOI: 10.3310/hta25030 HEALTH TECHNOLOGY ASSESSMENT 2021 VOL. 25 NO. 3
© Queen’s Printer and Controller of HMSO 2021. This work was produced by Wilson et al. under the terms of a commissioning contract issued by the Secretary of State forHealth and Social Care. This issue may be freely reproduced for the purposes of private research and study and extracts (or indeed, the full report) may be included in professionaljournals provided that suitable acknowledgement is made and the reproduction is not associated with any form of advertising. Applications for commercial reproduction shouldbe addressed to: NIHR Journals Library, National Institute for Health Research, Evaluation, Trials and Studies Coordinating Centre, Alpha House, University of Southampton SciencePark, Southampton SO16 7NS, UK.
29

Binary RSI-HB at baseline is confirmed as being statistically significantly, related to 16-week RSI and justifiedas a stratification factor in the trial design. Patients in the severe severity stratum at baseline are estimated tohave a RSI score that is 8 points higher (worse) at 16 weeks.
There is no statistically significant difference between randomised groups [lansoprazole compared withplacebo (p = 0.096)] when adjusted for site and baseline binary RSI-HB. The difference between randomisedgroups, when accounting for site and baseline severity, indicates that lansoprazole patients are estimated tohave RSI scores at 16 weeks that are 1.9 points higher (worse) than the scores of placebo patients (95% CI–0.3 to 4.2; p = 0.096).
Random errors are assumed to produce residuals that are normally distributed, as is the case for model 1,in which the residuals fall in a symmetrical pattern and have a constant spread throughout the range(Figures 8 and 9).
Further information on model 1 at 12 months, for the compliant ITT group, is given in Appendix 7, Table 53,and similarly for model 2 in Appendix 7, Table 54.
Model 2Model 2 adjusted for the stratification factor recruiting centre (as a random effect) at randomisation andbaseline severity in terms of RSI-HB as a continuous measure (as a fixed effect).
The continuous covariate (RSI-HB) was explored to assess whether or not transformation of RSI-HB was abetter fit to the relationship with outcome than an untransformed continuous measure based on a reductionin AIC. There was no reduction in AIC, so to build the most parsimonious, clinically interpretable model,RSI-HB was retained as an untransformed continuous covariate, under the assumption of linearity withoutcome (Table 10).
The log-likelihood statistics show that continuous baseline severity substantially improves the model fit(reduction in –2log-likelihood) compared with model 1, which included severity as a binary stratificationfactor.
A 1-unit increase in baseline severity is associated with a 0.7-unit increase (95% CI 0.6 to 0.9) in 16-week RSI.
–20
–10
0
Res
idu
als
10
20
10 15 20 25 30
Linear prediction, fixed portion
FIGURE 8 Scatterplot of residuals for model 1 (both groups combined, n= 220) (compliant ITT group).
RESULTS
NIHR Journals Library www.journalslibrary.nihr.ac.uk
30

There is no statistically significant difference between randomised groups [lansoprazole compared withplacebo (p = 0.196)] when adjusted for site and baseline continuous RSI-HB. The estimated differencebetween randomised groups, when accounting for site and baseline severity, indicates that patientsreceiving lansoprazole are estimated to have RSI scores at 16 weeks that are 1.4 points higher (worse)than the scores of placebo patients (95% CI –0.7 to 3.5; p = 0.196).
Residual plots demonstrate the underlying assumptions of the model to not be substantially violated(Figures 10 and 11).
0.00
0.01
0.02
Den
sity 0.03
0.04
0.05
–20 –10 0 10 20Residuals
FIGURE 9 Histogram of residuals for model 1 (both groups combined, n= 220) (compliant ITT group).
TABLE 10 Results of multilevel mixed-effect linear regression (model 2), adjusted for the stratification factor siteused at randomisation and continuous baseline severity (compliant ITT group) (n= 220)
Model Type Beta SE Test statistic p-value 95% CI (beta)
Group: lansoprazole (reference = placebo) Fixed 1.410 1.091 1.29 0.196 –0.728 to 3.549
Site (reference = Birmingham)
Brighton Random –1.300 4.493 –0.29 0.772 –10.106 to 7.506
Glasgow –1.694 3.252 –0.52 0.602 –8.067 to 4.679
Manchester 3.003 3.359 0.89 0.371 –3.579 to 9.586
Newcastle –2.785 2.840 –0.98 0.327 –8.351 to 2.781
Nottingham –5.664 2.847 –1.99 0.047 –11.243 to –0.084
Stockport –3.085 3.783 –0.82 0.415 –10.499 to 4.329
Sunderland –2.759 3.027 –0.91 0.362 –8.693 to 3.174
RSI-HB continuous baseline severity Fixed 0.721 0.079 9.10 < 0.001 0.566 to 0.877
Constant 4.320 3.274 1.32 0.187 –2.098 to 10.738
SE, standard error.Log-likelihood = –768.621; Wald chi-squared test = 115.42; p-value > χ2 < 0.001.
DOI: 10.3310/hta25030 HEALTH TECHNOLOGY ASSESSMENT 2021 VOL. 25 NO. 3
© Queen’s Printer and Controller of HMSO 2021. This work was produced by Wilson et al. under the terms of a commissioning contract issued by the Secretary of State forHealth and Social Care. This issue may be freely reproduced for the purposes of private research and study and extracts (or indeed, the full report) may be included in professionaljournals provided that suitable acknowledgement is made and the reproduction is not associated with any form of advertising. Applications for commercial reproduction shouldbe addressed to: NIHR Journals Library, National Institute for Health Research, Evaluation, Trials and Studies Coordinating Centre, Alpha House, University of Southampton SciencePark, Southampton SO16 7NS, UK.
31

Model 3Model 3 adjusted for baseline severity (RSI-HB as a continuous measure) and the baseline factors age, sex,smoking status (binary), alcohol consumption (binary) and BMI. Non-linear continuous covariates wereexplored but continuous covariates were retained as untransformed (Table 11).
As none of the potential covariates appears to have a significant univariate relationship with the RSI scoreat the primary end point, model 2 remains optimum.
Sensitivity analysis of the primary outcomeA sensitivity analysis based on the pragmatic ITT group including all patients with the 16-week visit at anytime was also carried out. This did not change the conclusions of the trial (Table 12).
–20
–10
0R
esid
ual
s
10
20
0 10 20 30 40Linear prediction, fixed portion
FIGURE 10 Scatterplot of residuals for model 2 (both groups combined, n = 220) (compliant ITT group).
0.00
0.02
0.04
0.06
Den
sity
–20 –10 0 10 20
Residuals
FIGURE 11 Histogram of residuals for model 2 (both groups combined, n= 220) (compliant ITT group).
RESULTS
NIHR Journals Library www.journalslibrary.nihr.ac.uk
32

Appendix 5 provides further details of the secondary analyses of the primary outcome measure (thepragmatic ITT group). Appendix 5, Table 47, gives summary statistics for the primary outcome measure:RSI for the pragmatic ITT population at baseline and primary end point. Appendix 5, Table 48, shows theANCOVA results. Appendix 5, Table 49, shows results for model 1, primary outcome measure as responsewith adjustment for stratification and other baseline factors. In addition, during the DMC closed sessionheld on 9 March 2018, the DMC discussed the different analysis groups. The chairperson felt that asensitivity analysis looking at the per-protocol group would be useful to support the primary analysis.Details of this analysis are provided in Appendix 5. Appendix 5, Table 50, shows summary statistics at theprimary end point.
Secondary analysis of the primary outcome measure using derivedReflux Symptom Index minus the heartburn/dyspepsia item
A secondary analysis of the primary outcome based on the reduced RSI score (derived from eight itemsexcluding item 9, the dyspepsia and heartburn component – RSI-HB) was planned and undertaken. RSI-HB,scored out of 40, was calculated and analysed as was the primary outcome measure (complete nine-item RSI).
TABLE 11 Univariate relationships including transformed continuous covariates
Covariate n AIC Beta SE Test statistic p-value
BMI
Continuous 220 1634.002 0.017 0.110 0.15 0.878
Log-transformed 1634.017
Complex transformation (BMI–2) 1633.240
Age
Continuous 220 1633.977 –0.011 0.051 –0.22 0.826
Log-transformed 1633.791
Complex transformation (age–2) 1629.129
Smoking (binary) 219 1626.368 1.547 1.520 1.02 0.310
Sex (binary – male/female) 220 1632.896 1.423 1.343 1.06 0.291
Alcohol consumption (binary) 217 1611.289 –1.761 1.483 –1.19 0.236
SE, standard error.
TABLE 12 Summary of model results for compliant and pragmatic ITT populations
Model
ITT population
Complaint (n= 220) Pragmatic (n= 267)
Beta (95% CI) p-value Beta (95% CI) p-value
1 1.9 (–0.35 to 4.20) 0.096 1.5 (–0.60 to 3.53) 0.165
2 1.4 (–0.73 to 3.55) 0.196 1.1 (–0.83 to 3.05) 0.264
3 Model 2 optimum N/A Model 2 optimum N/A
N/A, not applicable.
DOI: 10.3310/hta25030 HEALTH TECHNOLOGY ASSESSMENT 2021 VOL. 25 NO. 3
© Queen’s Printer and Controller of HMSO 2021. This work was produced by Wilson et al. under the terms of a commissioning contract issued by the Secretary of State forHealth and Social Care. This issue may be freely reproduced for the purposes of private research and study and extracts (or indeed, the full report) may be included in professionaljournals provided that suitable acknowledgement is made and the reproduction is not associated with any form of advertising. Applications for commercial reproduction shouldbe addressed to: NIHR Journals Library, National Institute for Health Research, Evaluation, Trials and Studies Coordinating Centre, Alpha House, University of Southampton SciencePark, Southampton SO16 7NS, UK.
33

Means, SDs, medians, IQRs and ranges for RSI-HB are reported as the score is treated as a continuousmeasure but is integer in nature. The summary statistics show that the randomised groups are similar atbaseline (Table 13).
A higher RSI score indicates more severe symptoms. RSI-HB reduced overall from a median of 19 at baselineto a median of 13 at 16 weeks. RSI-HB reduced overall from a mean score of 20.0 (SD 7.0) at baseline to amean score of 15.0 (SD 9.2) at 16 weeks (Table 14 and Figure 12). The reduction in RSI-HB is observed inboth randomised treatment groups. The lansoprazole group has a mean 16-week score that is 2.4 pointshigher than the score for the placebo group [16.3 (95% CI 14.5 to 18.1) vs. 13.9 (95% CI 12.2 to 15.5),respectively], with overlapping CIs indicating no statistical difference between the groups. The nullhypothesis was that there was no difference between the means. The test statistic was t = 1.945 and thetwo-sided p-value was 0.0530.
There is no statistically significant difference in the RSI-HB score at 16 weeks between the lansoprazole andplacebo groups.
Change in Reflux Symptom Index minus the heartburn/dyspepsia item score frombaseline to 16 weeks for the compliant intention-to-treat groupTable 15 and Figure 13 show the change in RSI-HB score (change RSI-HB = 16 weeks’ RSI-HB – baselineRSI-HB). The reduction in RSI-HB score from baseline to 16 weeks is similar between randomised groups.
The overall mean reduction in RSI-HB score from baseline to 16 weeks is 5.0 (95% CI –6.1 to –3.9), areduction that is observed across both randomised groups [lansoprazole, 4.0-point reduction (95% CI –5.5to –2.5); placebo, 5.9-point reduction (95% CI –7.4 to –4.4)], with overlapping CIs indicating no statisticaldifference between the groups. The lansoprazole group had a mean reduction that is 1.9 points less thanthe mean reduction observed in the placebo group (see Figure 13).
TABLE 14 The RSI-HB at the 16-week follow-up (visit 2) (compliant ITT group)
RSI-HB
Treatment group
Total (N= 220)Lansoprazole (n= 102) Placebo (n= 118)
Median (IQR) 14 (9–25) 12 (7–19) 13 (8–22)
Mean (SD) 16.3 (9.4) 13.9 (9.0) 15.0 (9.2)
95% CI of mean 14.5 to 18.1 12.2 to 15.5 13.8 to 16.2
Range 0–39 0–39 0–39
TABLE 13 The RSI-HB at baseline (visit 1) (compliant ITT group)
RSI-HB
Treatment group
Total (N= 220)Lansoprazole (n= 102) Placebo (n= 118)
Median (IQR) 19 (14–25) 19.5 (14–24) 19 (14–24.5)
Mean (SD) 20.3 (7.4) 19.8 (6.6) 20.0 (7.0)
95% CI of mean 18.8 to 21.7 18.6 to 21.0 19.1 to 20.9
Range 10–38 10–38 10–38
RESULTS
NIHR Journals Library www.journalslibrary.nihr.ac.uk
34
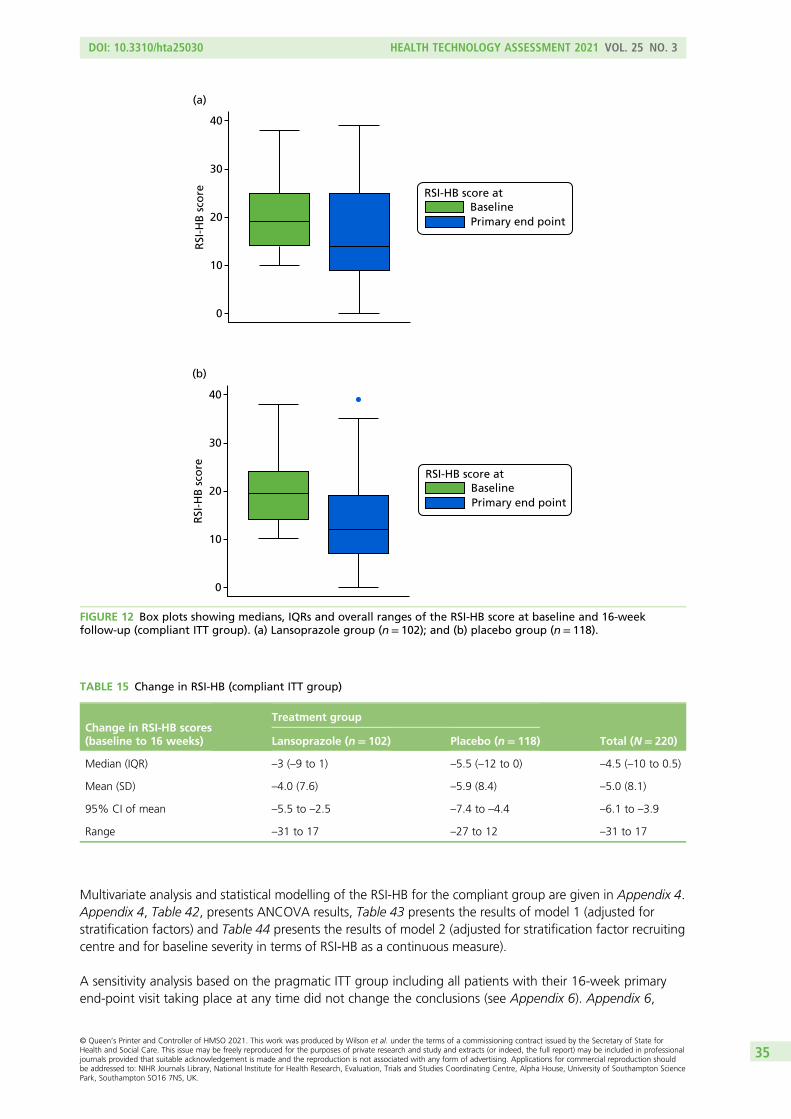
Multivariate analysis and statistical modelling of the RSI-HB for the compliant group are given in Appendix 4.Appendix 4, Table 42, presents ANCOVA results, Table 43 presents the results of model 1 (adjusted forstratification factors) and Table 44 presents the results of model 2 (adjusted for stratification factor recruitingcentre and for baseline severity in terms of RSI-HB as a continuous measure).
A sensitivity analysis based on the pragmatic ITT group including all patients with their 16-week primaryend-point visit taking place at any time did not change the conclusions (see Appendix 6). Appendix 6,
TABLE 15 Change in RSI-HB (compliant ITT group)
Change in RSI-HB scores(baseline to 16 weeks)
Treatment group
Total (N= 220)Lansoprazole (n= 102) Placebo (n= 118)
Median (IQR) –3 (–9 to 1) –5.5 (–12 to 0) –4.5 (–10 to 0.5)
Mean (SD) –4.0 (7.6) –5.9 (8.4) –5.0 (8.1)
95% CI of mean –5.5 to –2.5 –7.4 to –4.4 –6.1 to –3.9
Range –31 to 17 –27 to 12 –31 to 17
0
10
20
30
40
RSI
-HB
sco
re
(a)
BaselinePrimary end point
RSI-HB score at
0
10
20
30
40
RSI
-HB
sco
re
(b)
BaselinePrimary end point
RSI-HB score at
FIGURE 12 Box plots showing medians, IQRs and overall ranges of the RSI-HB score at baseline and 16-weekfollow-up (compliant ITT group). (a) Lansoprazole group (n= 102); and (b) placebo group (n= 118).
DOI: 10.3310/hta25030 HEALTH TECHNOLOGY ASSESSMENT 2021 VOL. 25 NO. 3
© Queen’s Printer and Controller of HMSO 2021. This work was produced by Wilson et al. under the terms of a commissioning contract issued by the Secretary of State forHealth and Social Care. This issue may be freely reproduced for the purposes of private research and study and extracts (or indeed, the full report) may be included in professionaljournals provided that suitable acknowledgement is made and the reproduction is not associated with any form of advertising. Applications for commercial reproduction shouldbe addressed to: NIHR Journals Library, National Institute for Health Research, Evaluation, Trials and Studies Coordinating Centre, Alpha House, University of Southampton SciencePark, Southampton SO16 7NS, UK.
35

Table 51, shows summary statistics for RSI-HB for the pragmatic ITT group at baseline and the primary endpoint. In Appendix 7, Table 53, RSI-HB at baseline is confirmed as being statistically significantly related to12-month RSI. Patients with greater severity at baseline are estimated to have RSI scores that are 8.2 pointshigher (worse) at 12 months.
Secondary outcome measures
Reflux Symptom Index at the 12-month follow-up for the compliant intention-to-treat groupThe 12-month RSI scores were secondary outcome measures, both the complete nine-item RSI and thereduced eight-item RSI-HB. These 12-month scores were assessed descriptively in unadjusted models andin multivariable models adjusted by stratification factors (Table 16).
The longitudinal changes in total RSI are summarised in Table 17 and Figure 14. Values show some furtherreduction in the post-treatment 8-month follow-up phase.
–30
–20
–10
0
10
20
(a)
Ch
ang
e in
RSI
-HB
sco
re b
etw
een
bas
elin
e an
d v
isit
2
(b)
–30
–20
–10
0
10
20
Ch
ang
e in
RSI
-HB
sco
re b
etw
een
bas
elin
e an
d v
isit
2
FIGURE 13 Box plots showing medians, IQRs and overall ranges of change in RSI-HB score from baseline to the16-week follow-up (compliant ITT group). (a) Lansoprazole group (n= 102); and (b) placebo group (n= 118).
TABLE 16 Descriptive analysis of RSI scores at 12 months (compliant ITT group)
RSI at 12 months
RSI 12-month follow-up (visit 3)
Treatment group
TotalLansoprazole Placebo
n 82 99 181
Median (IQR) 15 (6–24) 12 (6–19) 13 (6–21)
Mean (SD) 16.0 (10.8) 13.6 (9.6) 14.7 (10.2)
95% CI of mean 13.6 to 18.4 11.7 to 15.5 13.2 to 16.2
Range 0–43 0–41 0–43
RESULTS
NIHR Journals Library www.journalslibrary.nihr.ac.uk
36

TABLE 17 Median, IQR and range at baseline, 16 weeks and 12 months and the associated median differences (compliant ITT group)
RSI score
Time point Change
Baseline 16 weeks 12 months Baseline to 16 weeks Baseline to 12 months
Lansoprazolegroup
Placebogroup
Lansoprazolegroup
Placebogroup
Lansoprazolegroup
Placebogroup
Lansoprazolegroup
Placebogroup
Lansoprazolegroup
Placebogroup
n 102 118 102 118 82 99 102 118 82 99
Median (IQR) 20.5 (15 to 28) 21.5 (16 to 27) 16 (9 to 26) 14 (7 to 23) 15 (6 to 24) 12 (6 to 19) –4 (–10 to 1) –5 (–13 to 1) –6 (–13 to 0) –8 (–14 to –3)
Range 10 to 41 10 to 43 0 to 41 0 to 44 0 to 43 0 to 41 –31 to 19 –29 to 11 –34 to 15 –27 to 22
Green shading denotes the descriptive statistics for the change from baseline to follow-up points.
DOI:10.3310/hta25030
HEA
LTHTECH
NOLO
GYASSESSM
ENT2021
VOL.25
NO.3
©Queen
’sPrinter
andController
ofHMSO
2021.This
work
was
producedby
Wilson
etal.
underthe
termsof
acom
missioning
contractissued
bythe
Secretaryof
Statefor
Health
andSocialC
are.This
issuemay
befreely
reproducedfor
thepurposes
ofprivate
researchand
studyand
extracts(or
indeed,the
fullreport)may
beincluded
inprofessional
journalsprovided
thatsuitable
acknowledgem
entismade
andthe
reproductionisnot
associatedwith
anyform
ofadvertising.
Applications
forcom
mercialreproduction
shouldbe
addressedto:
NIHRJournals
Library,NationalInstitute
forHealth
Research,Evaluation,
Trialsand
StudiesCoordinating
Centre,
Alpha
House,
University
ofSoutham
ptonScience
Park,Southam
ptonSO
167N
S,UK.
37

Mean RSI reduces in both groups at 16 weeks and further reduces at 12 months.
Univariate analysis RSI scores were reported at 12 months for the compliant ITT group, in which the nullhypothesis is of no difference between means. The test statistic was t = 1.583 and the two-sided p-valuewas 0.115, concluding that there is no statistically significant difference in the RSI score at 12 monthsbetween the lansoprazole and placebo groups.
Reflux Symptom Index scores at the 12-month follow-up within the published normalrange (< 12) for the compliant intention-to-treat groupOverall, 10% of patients were within the normal range at baseline, balanced across randomised groups(the inclusion criterion being the eight-item version of the RSI excluding the dyspepsia item 9). At 16 weeks,43% (95% CI 37% to 50%) of participants are within the normal range. There is a slight increase at12 months to 48% (95% CI 41% to 55%) of participants being within the normal range, balanced acrossrandomised groups: lansoprazole 40% (95% CI 29% to 51%) versus placebo 55% (95% CI 45% to 65%).The overlapping CIs indicate no statistical difference between the groups.
0
10
20
30
40
RSI
sco
re
(a)
Baseline16 weeks12 months
RSI score at
0
10
20
30
40
RSI
sco
re
(b)
Baseline16 weeks12 months
RSI score at
FIGURE 14 Box plots showing medians, IQRs and overall ranges of RSI score at baseline, 16 weeks and 12 months(compliant ITT group). (a) Lansoprazole group (n= 82); and (b) placebo group (n= 99).
RESULTS
NIHR Journals Library www.journalslibrary.nihr.ac.uk
38

Multivariable analysis of Reflux Symptom Index at 12 months for thecompliant intention-to-treat group
Note that ANCOVA for RSI at 12 months (see Appendix 7) showed no statistically significant difference inRSI at 12 months between randomised treatment groups (p = 0.256), but site and baseline severity remainsignificantly related to 12-month RSI. Age and sex also appear to be significantly related to 12-month RSIwhen all are included in the ANCOVA analysis. The statistical modelling of the 12-month RSI for the compliantITT group is also included in Appendix 7 and was conducted similarly to the prior modelling exercises.
The difference between randomised groups, when accounting for site and binary baseline severity,indicates that lansoprazole participants are estimated to have RSI scores at 12 months that are 2.5 pointshigher (worse) than those of placebo participants (95% CI –0.1 to 5.0; p = 0.06).
The underlying assumptions of the model were not substantially violated. As none of the potentialcovariates appears to have a significant univariate relationship with the 12-month RSI score, model 2 withcontinuous baseline severity (RSI-HB) and site remains the optimum. There was no statistically significantdifference between the lansoprazole group and the placebo group when adjusted for site and baselinecontinuous RSI-HB. There is an estimated difference that lansoprazole participants have RSI scores at12 months that are 1.7 points higher (worse) than those of placebo participants (95% CI –0.7 to 4.1 points;p = 0.157). Further information is given in Appendix 7, Table 54.
Reflux Finding Score for the compliant intention-to-treat group
The RFS was independently scored by a single expert rater (PC) who was blind to patient treatment group.Images were scored (Table 18) from 0 to 26 and assessed as a potential predictor of RSI at 16 weeks. Therewere a total of 256 RFSs for unique participants (see Appendix 3), of which 167 were for participants in thecompliant ITT group.
Reflux Finding Score at baseline for the compliant intention-to-treat group
The means, SDs, medians, IQRs and ranges are reported as the score is treated as a continuous measurebut is integer in nature (see Table 18).
A higher RFS indicates more severe laryngeal inflammation. Overall, RFS at baseline is, on average, 9.4 points(95% CI 8.8 to 10.0 points). The summary statistics show the number and value of RFSs to be similar in bothtreatment groups at baseline. Usable RFS assessments were available for 76% of participants in the compliantITT analysis group.
TABLE 18 The RFS total scores at baseline (visit 1) (compliant ITT group)
RFSs of images
Treatment group
Total (N= 220)Lansoprazole (N= 102) Placebo (N= 118)
n (%) with RFSs 82 (80) 85 (72) 167 (76)
Median (IQR) 9 (7–12) 9 (7–11) 9 (7–12)
Mean (SD) 9.7 (4.1) 9.2 (3.8) 9.4 (3.9)
95% CI of mean 8.8 to 10.6 8.4 to 10.0 8.8 to 10.0
Range 0–20 0–18 0–20
DOI: 10.3310/hta25030 HEALTH TECHNOLOGY ASSESSMENT 2021 VOL. 25 NO. 3
© Queen’s Printer and Controller of HMSO 2021. This work was produced by Wilson et al. under the terms of a commissioning contract issued by the Secretary of State forHealth and Social Care. This issue may be freely reproduced for the purposes of private research and study and extracts (or indeed, the full report) may be included in professionaljournals provided that suitable acknowledgement is made and the reproduction is not associated with any form of advertising. Applications for commercial reproduction shouldbe addressed to: NIHR Journals Library, National Institute for Health Research, Evaluation, Trials and Studies Coordinating Centre, Alpha House, University of Southampton SciencePark, Southampton SO16 7NS, UK.
39

The utility of the Reflux Finding Score as a response predictor for thecompliant intention-to-treat group
The use of both first-order fractional polynomial transformations and a fourth model of primary outcomebaseline RFS failed to find any significant relationship of baseline RFS with the RSI score at the primary endpoint (see Appendix 8).
Comprehensive Reflux Symptom Score
Comprehensive Reflux Symptom Score total and subscale scores baseline descriptiveanalysis: compliant intention-to-treat analysis groupThe CReSS at baseline was assessed as a potential predictor of RSI at 16 weeks (Table 19). A higher CReSSindicates worse symptoms. There was a 98% completion rate for CReSS at baseline in the compliant ITTanalysis set. The score is treated as a continuous measure but is integer in nature. The summary statisticsand box plots for CReSS total (see Appendix 9, Figure 17) and subscale (see Appendix 9, Figures 18–20)scores, and information on missing data, are included in Appendix 9. Missing observations were few andso multiple imputation was not used.
Appendix 9 shows the similarity of 16-week and 12-month outcomes in total and subscale CReSSsbetween those treated with lansoprazole and those treated with placebo (see Appendix 9, Tables 58–62).
Baseline itemised severity score: Comprehensive Reflux Symptom ScoreThe item descriptive statistics for CReSS are listed in Report Supplementary Material 1, Table 12, for thewhole trial population and in Report Supplementary Material 1, Table 13, for the compliant group.
The top five CReSS items, for both the trial population and the compliant group, in ranked meanendorsement severity were:
1. throat clearing2. feeling things stuck in throat3. lump in throat4. excess mucus5. hoarseness.
The relationship between the RSI at baseline and total CReSS at baseline for the compliant ITT group isshown in Figure 15, which demonstrates a linear relationship (i.e. an increased CReSS is associated withincreased RSI score). (It should be remembered that the RSI symptom items were all purposively included inthe CReSS and so the two are not independent of each other.)
Comprehensive Reflux Symptom Score subscale scores as covariates for RefluxSymptom Index at 16 weeksThe reduction in AIC through simple log or complex (fractional polynomial) transformations was notsubstantial (see Appendix 9, Table 59). In order to build the most parsimonious, clinically interpretablemodel, the CReSS total and subscale scores were retained as untransformed continuous covariates,under the assumption of linearity with outcome. The optimum predictive model based on CReSSincorporated the upper airway subscale, but this performed less well than inclusion of RSI-HB in thepredictive model.
RESULTS
NIHR Journals Library www.journalslibrary.nihr.ac.uk
40

TABLE 19 The CReSS total and subscale scores at baseline (visit 1) (compliant ITT group)
Descriptivestatistic
CReSS total (range: 0–170) CReSS oesophageal subscale (range: 0–85)CReSS upper airway subscale(range: 0–45) CReSS pharyngeal subscale (range: 0–25)
Treatment group
Total(N= 220)
Treatment group
Total(N= 220)
Treatment group
Total(N= 220)
Treatment group
Total(N= 220)
Lansoprazole(N= 102)
Placebo(N= 118)
Lansoprazole(N= 102)
Placebo(N= 118)
Lansoprazole(N= 102)
Placebo(N= 118)
Lansoprazole(N= 102)
Placebo(N= 118)
n (% ofcompliant group)
100 (98) 115 (97) 215 (98) 101 (99) 115 (97) 216 (98) 101 (99) 116 (98) 217 (99) 102 (100) 116 (98) 218 (99)
Median (IQR) 47.5 (27.5–69) 50 (33–69) 49 (30–69) 20 (9–29) 19 (11–27) 19 (10–29) 16 (10–24) 17 (10–25.5) 17 (10–25) 9 (5–13) 9.5 (4.5–14) 9 (5–14)
Mean (SD) 50.3 (27.4) 51.1 (25.7) 50.7 (26.4) 20.7 (14.9) 21.2 (14.1) 21.0 (14.5) 17.3 (9.9) 17.9 (9.9) 17.6 (9.9) 9.4 (5.8) 9.4 (5.6) 9.4 (5.7)
95% CI of mean 44.9 to 55.7 46.4 to 55.8 47.2 to 54.3 17.8 to 23.7 18.6 to 23.8 19.0 to 22.9 15.4 to 19.3 16.1 to 19.7 16.3 to 19.0 8.2 to 10.5 8.4 to 10.4 8.6 to 10.2
Range 2–142 8–141 2–142 0–76 0–63 0–76 0–45 0–44 0–45 0–22 0–22 0–22
The summary statistics show the CReSS total and subscale scores are similar in both treatment groups at baseline.
DOI:10.3310/hta25030
HEA
LTHTECH
NOLO
GYASSESSM
ENT2021
VOL.25
NO.3
©Queen
’sPrinter
andController
ofHMSO
2021.This
work
was
producedby
Wilson
etal.
underthe
termsof
acom
missioning
contractissued
bythe
Secretaryof
Statefor
Health
andSocialC
are.This
issuemay
befreely
reproducedfor
thepurposes
ofprivate
researchand
studyand
extracts(or
indeed,the
fullreport)may
beincluded
inprofessional
journalsprovided
thatsuitable
acknowledgem
entismade
andthe
reproductionisnot
associatedwith
anyform
ofadvertising.
Applications
forcom
mercialreproduction
shouldbe
addressedto:
NIHRJournals
Library,NationalInstitute
forHealth
Research,Evaluation,
Trialsand
StudiesCoordinating
Centre,
Alpha
House,
University
ofSoutham
ptonScience
Park,Southam
ptonSO
167N
S,UK.
41

Laryngopharyngeal Reflux – Health Related Quality of Life questionnaire
Patient quality of life was assessed using the LPR-HRQL. Higher scores indicate worse LPR quality of life.The total LPR-HRQL score and subscales at baseline and 16-week and 12-month follow-ups are presentedfor the compliant ITT population. Missing item rules dictate that three questionnaires with missing itemscan be imputed [two at baseline and one at the primary end point (16 weeks)].
Baseline Laryngopharyngeal Reflux – Health Related Quality of Life scoresTable 20 shows baseline scores (raw and standardised) for overall score and the voice, cough, clear throatand general subscales. Each remaining item not included in the subscales is reported separately.
Higher scores indicate worse LPR quality of life.
Raw scores appear skewed. Each subscale is reported as a standardised ‘z-score’ calculated by subtractingthe means and dividing by SD, which appear less skewed. Each subscale section also has an extra questionlabelled ‘the thermometer’, reported individually and with the appropriate subscale (see Appendix 10,Tables 62 and 63).
Laryngopharyngeal Reflux – Health Related Quality of Life at primary end point(16-week follow-up)The results are shown in Table 21.
The raw scores again appear skewed, and the standardised scores less so. The 16-week scores (see Table 21)show a marked reduction from baseline across all domains and across both treatment groups. The equivalentthermometers are given in Appendix 10, Table 65.
The median overall LPR-HRQL scale at the 16-week primary end point reduced (improved) by around half,with almost identical reductions in the two treatment groups.
Laryngopharyngeal Reflux – Health Related Quality of Life at 12-month follow-up (visit 3)Corresponding data provided at 12-month follow-up are shown in Appendix 10, Table 64, withthermometer scores in Appendix 10, Table 65.
10
20
30
40
50
RSI
sco
re a
t b
asel
ine
0 50 100 150
CReSS total at baseline
RSI score atbaseline
Fitted values
FIGURE 15 Scatterplot of the relationship between the total CReSS and RSI at baseline (compliant ITT group, n= 215).
RESULTS
NIHR Journals Library www.journalslibrary.nihr.ac.uk
42

TABLE 20 The LPR-HRQL baseline scores (compliant ITT group) (n= 220; lansoprazole = 102, placebo = 118). All subscales were complete except for those of two placeboparticipants. Overall complete: lansoprazole, n= 99; placebo, n= 115
Scale and descriptive statistics
Scores
Raw Standardised
Treatment group
Total
Treatment group
TotalLansoprazole Placebo Lansoprazole Placebo
Voice (raw range: 0–72)
Median (IQR) 8 (6 to 22) 7.5 (6 to 15.5) 8 (6 to 19) –0.46 (–0.59 to 0.45) –0.40 (–0.52 to 0.19) –0.44 (–0.59 to 0.38)
Mean (SD) 15.1 (15.4) 12.9 (13.4) 13.9 (14.4) 0 (1) 0 (1) 0 (1)
95% CI 12.1 to 18.1 10.5 to 15.4 12.0 to 15.9 –0.2 to 0.2 –0.2 to 0.2 –0.1 to 0.1
Range 0 to 67 0 to 62 0 to 67 –0.98 to 3.37 –0.96 to 3.65 –0.98 to 3.65
Cough (raw range: 0–36)
Median (IQR) 6 (1 to 15) 5 (0 to 13) 5 (1 to 13) –0.35 (–0.87 to 0.59) –0.32 (–0.88 to 0.56) –0.34 (–0.87 to 0.56)
Mean (SD) 9.3 (9.5) 7.9 (9.0) 8.6 (9.3) 0 (1) 0 (1) 0 (1)
95% CI 7.5 to 11.2 6.2 to 9.6 7.3 to 9.8 –0.2 to 0.2 –0.2 to 0.2 –0.1 to 0.1
Range 0 to 34 0 to 35 0 to 35 –0.98 to 2.58 –0.88 to 3.00 –0.98 to 3.00
Clear (raw range: 0–36)
Median (IQR) 8 (3 to 14) 7 (2.5 to 13.5) 8 (3 to 14) –0.16 (–0.81 to 0.63) –0.23 (–0.83 to 0.65) –0.16 (–0.81 to 0.63)
Mean (SD) 9.2 (7.6) 8.7 (7.4) 8.9 (7.5) 0 (1) 0 (1) 0 (1)
95% CI 7.7 to 10.7 7.3 to 10.0 7.9 to 9.9 –0.2 to 0.2 –0.2 to 0.2 –0.1 to 0.1
Range 0 to 35 0 to 33 0 to 35 –1.21 to 3.39 –1.17 to 3.27 –1.21 to 3.39
General (raw range: 0–30)
Median (IQR) 5.5 (2 to 10) 5 (1 to 11) 5 (1 to 11) –0.22 (–0.77 to 0.48) –0.26 (–0.91 to 0.71) –0.26 (–0.91 to 0.64)
Mean (SD) 6.9 (6.4) 6.6 (6.2) 6.8 (6.3) 0 (1) 0 (1) 0 (1)
95% CI 5.7 to 8.2 5.5 to 7.8 5.9 to 7.6 –0.2 to 0.2 –0.2 to 0.2 –0.1 to 0.1
Range 0 to 27 0 to 26 0 to 27 –1.08 to 3.14 –1.08 to 3.14 –1.08 to 3.14
Overall (raw rescaled range: 0–100)
Median (IQR) 24 (10 to 45) 22 (8 to 41) 23 (9 to 42) –0.23 (–0.84 to 0.74) –0.20 (–0.86 to 0.68) –0.20 (–0.84 to 0.70)
Mean (SD) 28.9 (22.2) 26.5 (21.7) 27.6 (21.9) 0 (1) 0 (1) 0 (1)
95% CI 24.5 to 33.3 22.5 to 30.5 24.7 to 30.6 –0.2 to 0.2 –0.2 to 0.2 –0.1 to 0.1
Range 0 to 95 0 to 87 0 to 95 –1.30 to 2.99 –1.22 to 2.80 –1.30 to 2.99
DOI:10.3310/hta25030
HEA
LTHTECH
NOLO
GYASSESSM
ENT2021
VOL.25
NO.3
©Queen
’sPrinter
andController
ofHMSO
2021.This
work
was
producedby
Wilson
etal.
underthe
termsof
acom
missioning
contractissued
bythe
Secretaryof
Statefor
Health
andSocialC
are.This
issuemay
befreely
reproducedfor
thepurposes
ofprivate
researchand
studyand
extracts(or
indeed,the
fullreport)may
beincluded
inprofessional
journalsprovided
thatsuitable
acknowledgem
entismade
andthe
reproductionisnot
associatedwith
anyform
ofadvertising.
Applications
forcom
mercialreproduction
shouldbe
addressedto:
NIHRJournals
Library,NationalInstitute
forHealth
Research,Evaluation,
Trialsand
StudiesCoordinating
Centre,
Alpha
House,
University
ofSoutham
ptonScience
Park,Southam
ptonSO
167N
S,UK.
43

TABLE 21 The LPR-HRQL scores at the 16-week follow-up (compliant ITT group) (n= 220a)
Scale and descriptive statistics
Scores
Raw Standardised
Treatment group
Total
Treatment group
TotalLansoprazole Placebo Lansoprazole Placebo
Voice (raw range: 0–72)
Median (IQR) 7 (6 to 18) 6 (6 to 14) 6.3 (6 to 15) –0.47 (–0.54 to 0.35) –0.39 (–0.39 to 0.32) –0.39 (–0.54 to 0.32)
Mean (SD) 13.3 (13.4) 10.4 (11.2) 11.7 (12.4) 0 (1) 0 (1) 0 (1)
95% CI 10.6 to 16.0 8.3 to 12.4 10.1 to 13.4 –0.2 to 0.2 –0.2 to 0.2 –0.1 to 0.1
Range 0 to 59 0 to 67 0 to 67 –0.99 to 3.40 –0.92 to 5.04 –0.99 to 5.04
Cough (raw range: 0–36)
Median (IQR) 4 (0 to 12) 2 (0 to 7) 2 (0 to 10) –0.39 (–0.85 to 0.54) –0.41 (–0.69 to 0.28) –0.41 (–0.69 to 0.42)
Mean (SD) 7.4 (8.6) 5.0 (7.2) 6.1 (8.0) 0 (1) 0 (1) 0 (1)
95% CI 5.7 to 9.1 3.6 to 6.3 5.0 to 7.1 –0.2 to 0.2 –0.2 to 0.2 –0.1 to 0.1
Range 0 to 31 0 to 34 0 to 34 –0.85 to 2.74) –0.69 to 4.04 –0.85 to 4.04
Clear (raw range: 0–36)
Median (IQR) 5 (1 to 11) 3 (0 to 10) 4 (0 to 11) –0.31 (–0.84 to 0.49) –0.36 (–0.80 to 0.66) –0.31 (–0.80 to 0.52)
Mean (SD) 7.3 (7.6) 5.5 (6.8) 6.3 (7.2) 0 (1) 0 (1) 0 (1)
95% CI 5.8 to 8.8 4.2 to 6.7 5.4 to 7.3 –0.2 to 0.2 –0.2 to 0.2 –0.1 to 0.1
Range 0 to 30 0 to 34 0 to 34 –0.97 to 3.00 –0.80 to 4.18 –0.97 to 4.18
General (raw range: 0–30)
Median (IQR) 2.5 (0 to 6) 2 (0 to 7) 2 (0 to 7) –0.35 (–0.75 to 0.21) –0.45 (–0.80 to 0.41) –0.45 (–0.75 to 0.37)
Mean (SD) 4.7 (6.2) 4.6 (5.8) 4.6 (6.0) 0 (1) 0 (1) 0 (1)
95% CI 3.5 to 5.9 3.6 to 5.7 3.8 to 5.4 –0.2 to 0.2 –0.2 to 0.2 –0.1 to 0.1
Range 0 to 29 0 to 29 0 to 29 –0.75 to 3.92 –0.80 to 4.23 –0.80 to 4.23
Overall (raw rescaled range: 0–100)
Median (IQR) 11 (3 to 33) 10 (2 to 25) 10 (2 to 27) –0.42 (–0.79 to 0.57) –0.36 (–0.71 to 0.36) –0.42 (–0.74 to 0.47)
Mean (SD) 20.5 (22.4) 17.1 (20.9) 18.7 (21.6) 0 (1) 0 (1) 0 (1)
95% CI 16.1 to 25.0 13.3 to 21.0 15.8 to 21.6 –0.2 to 0.2 –0.2 to 0.2 –0.1 to 0.1
Range 0 to 83 0 to 96 0 to 96 –0.92 to 2.80 –0.82 to 3.77 –0.92 to 3.77
a Either 217/220 patients or 219/220 patients contributed data to the table.
RESULTS
NIHRJournals
Librarywww.journalslibrary.nihr.ac.uk
44
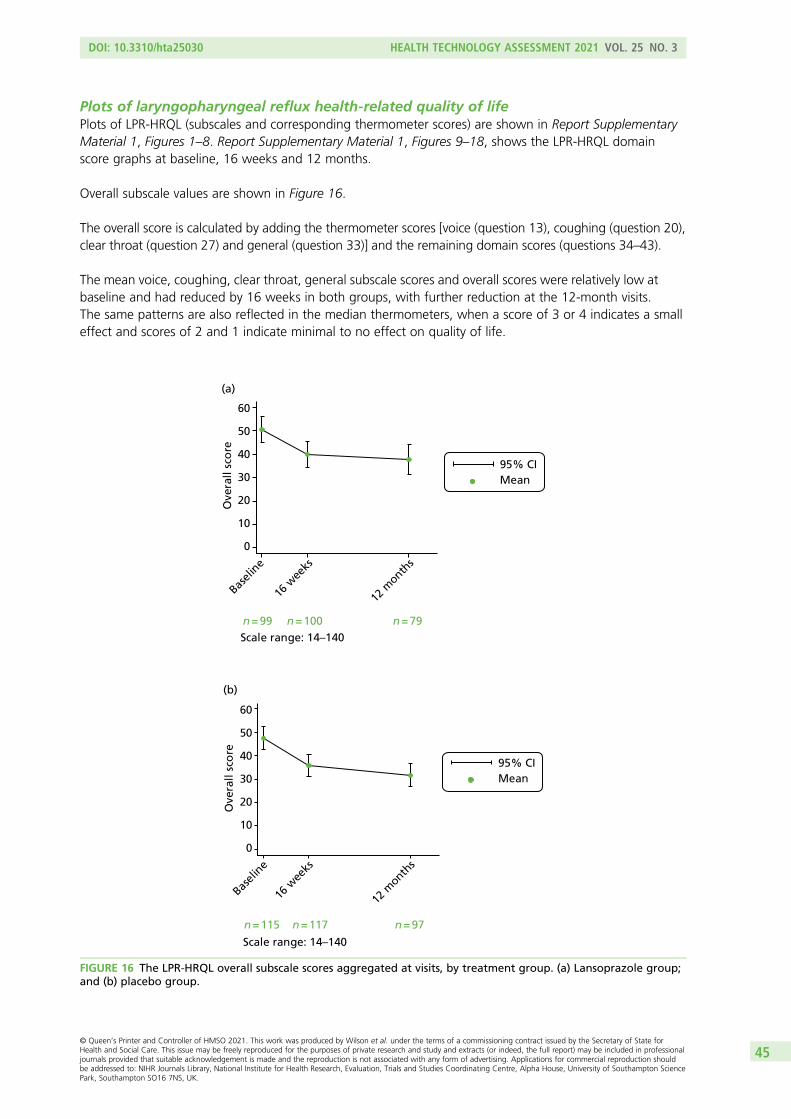
Plots of laryngopharyngeal reflux health-related quality of lifePlots of LPR-HRQL (subscales and corresponding thermometer scores) are shown in Report SupplementaryMaterial 1, Figures 1–8. Report Supplementary Material 1, Figures 9–18, shows the LPR-HRQL domainscore graphs at baseline, 16 weeks and 12 months.
Overall subscale values are shown in Figure 16.
The overall score is calculated by adding the thermometer scores [voice (question 13), coughing (question 20),clear throat (question 27) and general (question 33)] and the remaining domain scores (questions 34–43).
The mean voice, coughing, clear throat, general subscale scores and overall scores were relatively low atbaseline and had reduced by 16 weeks in both groups, with further reduction at the 12-month visits.The same patterns are also reflected in the median thermometers, when a score of 3 or 4 indicates a smalleffect and scores of 2 and 1 indicate minimal to no effect on quality of life.
0
10
20
30
40
50
60
Ove
rall
sco
re
Basel
ine
16 w
eeks
12 m
onths
(a)
Scale range: 14–140n = 79n = 99 n = 100
Mean95% CI
0
10
20
30
40
50
60
Ove
rall
sco
re
Basel
ine
16 w
eeks
12 m
onths
(b)
Mean95% CI
Scale range: 14–140
n = 115 n = 117 n = 97
FIGURE 16 The LPR-HRQL overall subscale scores aggregated at visits, by treatment group. (a) Lansoprazole group;and (b) placebo group.
DOI: 10.3310/hta25030 HEALTH TECHNOLOGY ASSESSMENT 2021 VOL. 25 NO. 3
© Queen’s Printer and Controller of HMSO 2021. This work was produced by Wilson et al. under the terms of a commissioning contract issued by the Secretary of State forHealth and Social Care. This issue may be freely reproduced for the purposes of private research and study and extracts (or indeed, the full report) may be included in professionaljournals provided that suitable acknowledgement is made and the reproduction is not associated with any form of advertising. Applications for commercial reproduction shouldbe addressed to: NIHR Journals Library, National Institute for Health Research, Evaluation, Trials and Studies Coordinating Centre, Alpha House, University of Southampton SciencePark, Southampton SO16 7NS, UK.
45

Each of the remaining domain scores used to calculate the overall score is also presented individually atbaseline and 16-week and 12-month follow-up visits in Report Supplementary Material 1, Figures 9–18.
There is only a small effect on overall quality of life relating to individual domain scores.
The IQRs of the domain scores generally decrease from baseline levels by 16 weeks in both treatment groups.
None of the baseline median LPR-HRQL domain scores reflects a large impact of symptoms on the individualdomains and the small reductions (improvements) by 16 weeks are similar across treatment groups.
Standardised area under the curve for overall Laryngopharyngeal Reflux – HealthRelated Quality of LifeA standardised area under the curve (SAUC) is calculated for each patient, defined as area under the curveas a proportion of time observed, and reported descriptively. A total of 213 out of the 220 participants inthe compliant ITT group are included in SAUC analysis (for lansoprazole, 75 participants have LPR-HRQLscores at all three time points, 22 participants have LPR-HRQL scores at visits 1 and 2 and one participanthas LPR-HRQL scores at visits 1 and 3; for placebo, 94 participants have LPR-HRQL scores at all three timepoints, 20 participants have LPR-HRQL scores at visits 1 and 2 and one participant has LPR-HRQL scores atvisits 1 and 3). The distribution is skewed.
Median SAUC over 12 months is 32.6 (IQR 22.5–53.1) for lansoprazole and 29.9 (IQR 19.9–50.4) forplacebo. In other words, patients reported approximately 30% of a maximum 100 LPR-HRQL score, similaracross groups over 12 months’ follow-up.
Repeated-measures mixed modelA repeated-measures mixed-effects multilevel model accounts for longitudinal data within patients overtime (Table 22).
There is a significant decrease (improvement in quality of life) from baseline to the 16-week and 12-monthfollow-up visits. The lansoprazole group had an overall LPR-HRQL score that was, on average, 2.9 pointshigher (worse) than that for the placebo group (95% CI –4.3 to 10.1; p = 0.427), increasing from 16 weeksto 12 months.
TABLE 22 Mixed-effects multilevel regression (n= 220)
Model Beta SE Test statistic p-value 95% CI (beta)
Group: lansoprazole (reference = placebo) 2.903 3.656 0.79 0.427 –4.262 to 10.069
Time
16 weeks –11.719 2.069 –5.66 < 0.001 –15.775 to –7.664
12 months –14.826 2.209 –6.71 < 0.001 –19.155 to –10.497
Interaction: group*time
Lansoprazole*16 weeks 1.302 3.048 0.43 0.669 –4.673 to 7.276
Lansoprazole*12 months 2.111 3.290 0.64 0.521 –4.338 to 8.560
Constant 47.209 2.489 18.97 < 0.001 42.331 to 52.087
SE, standard error.Group variable: study identifier, log-likelihood = –2734.185; Wald chi-squared test = 88.20; p-value > χ2 < 0.001.
RESULTS
NIHR Journals Library www.journalslibrary.nihr.ac.uk
46

Summary of Reflux Symptom Index, total Comprehensive Reflux SymptomScore and Laryngopharyngeal Reflux – Health Related Quality of Life scoresfor the compliant group at all three time points
Table 23 provides a summary of total RSI, CReSS and LPR-HRQL scores at three time points.
Patient satisfaction with TOPPITS
At the 12-month follow-up (visit 3), 213 out of 346 (62%) participants answered the satisfaction question,of whom 115 (54%) were very satisfied, 59 (28%) were satisfied, 29 (14%) were neither satisfied nordissatisfied, five (2%) were dissatisfied and five (2%) were very dissatisfied.
Safety
Information was gathered on AEs at all three TOPPITS clinic visits. We recorded any untoward medicaloccurrence in a patient to whom a medicinal product had been administered, including occurrences thatwere not necessarily caused by or related to that product. In the protocol,1 it was stated that causalitywould be graded on a five-point scale [unrelated, unlikely, possible, probable and definitely related to theinvestigational medicinal product (IMP)]. MACRO was set up for data collection on a three-point scale(not related, possibly related and probably related). A file note was added to the trial master file detailingthis change from the protocol.
Adverse event causality was reported on the three-point scale available from MACRO. The numbers ofpatients reporting any AE are reported, clarifying those deemed to be treatment related. SAEs andoccurrence of suspected unexpected serious adverse reactions are also recorded by group. The clinical sideeffects of PPI use include gastrointestinal disturbance and rebound hypersecretion after cessation of PPItherapy. Rarer side effects include pneumonia, C. difficile infections, acute renal inflammation andfractures of the hip, wrist and spine.
TABLE 23 Summary of total RSI/CReSS/LPR-HRQL (overall) scores at three time points (compliant group, n= 220)
Questionnaire
Scores, mean (95% CI)
Treatment group
Total (N= 220)Lansoprazole (n= 102) Placebo (n= 118)
Baseline
RSI 22.0 (20.4 to 23.6) 21.7 (20.5 to 23.0) 21.9 (20.9 to 22.9)
CReSS total 50.3 (44.9 to 55.7) 51.1 (46.4 to 55.8) 50.7 (47.2 to 54.3)
LPR-HRQL 28.9 (24.5 to 33.3) 26.5 (22.5 to 30.5) 27.6 (24.7 to 30.6)
16 weeks
RSI 17.4 (15.5 to 19.4) 15.6 (13.8 to 17.3) 16.4 (15.1 to 17.7)
CReSS total 38.9 (33.4 to 44.3) 34.7 (29.6 to 39.9) 36.6 (32.9 to 40.4)
LPR-HRQL 20.5 (16.1 to 25.0) 17.1 (13.3 to 21.0) 18.7 (15.8 to 21.6)
12 months
RSI 16.0 (13.6 to 18.4) 13.6 (11.7 to 15.5) 14.7 (13.2 to 16.2)
CReSS total 36.6 (29.8 to 43.5) 31.8 (26.6 to 36.9) 33.9 (29.8 to 38.1)
LPR-HRQL 18.8 (13.7 to 23.8) 13.9 (10.0 to 17.8) 16.0 (13.0 to 19.2)
LPR-HRQL raw scores rescaled so that range is 0–100.
DOI: 10.3310/hta25030 HEALTH TECHNOLOGY ASSESSMENT 2021 VOL. 25 NO. 3
© Queen’s Printer and Controller of HMSO 2021. This work was produced by Wilson et al. under the terms of a commissioning contract issued by the Secretary of State forHealth and Social Care. This issue may be freely reproduced for the purposes of private research and study and extracts (or indeed, the full report) may be included in professionaljournals provided that suitable acknowledgement is made and the reproduction is not associated with any form of advertising. Applications for commercial reproduction shouldbe addressed to: NIHR Journals Library, National Institute for Health Research, Evaluation, Trials and Studies Coordinating Centre, Alpha House, University of Southampton SciencePark, Southampton SO16 7NS, UK.
47

Adverse events for the per-treatment analysis groupThere were 112 reported AEs in the per-treatment group (Tables 24 and 25) in 74 unique patients.
Further information from the database manager indicates that two of the three AEs with missing datespre-date the start of the trial. One was marked ‘not available’ by the site in MACRO. More details areprovided in Report Supplementary Material 1.
TABLE 24 Adverse events that occurred while the patient was taking allocated treatment (per-treatment group)
Status
AEs, n (%)
Treatment group
Total (N= 112)Lansoprazole (N= 60) Placebo (N= 52)
Patient taking treatment? Yes 42 (70) 38 (73) 80 (71)
Patient taking treatmentwhen AE occurred? No
15 (25) 14 (27) 29 (26)
AE dates missing 3 (5) 0 (0) 3 (3)
TABLE 25 Reported AEs (per-treatment group) (three AEs with missing dates are excluded)
Related totreatment?
AEs, n (%)
Treatment group
TotalLansoprazole Placebo
Duringtreatment
Aftertreatment
Duringtreatment
Aftertreatment
Duringtreatment
Aftertreatment
Probably
Severe 1 (2) 0 (0) 0 (0) 0 (0) 1 (1) 0 (0)
Moderate 5 (12) 0 (0) 0 (0) 0 (0) 5 (6) 0 (0)
Mild 0 (0) 0 (0) 0 (0) 0 (0) 0 (0) 0 (0)
Possibly
Severe 0 (0) 0 (0) 0 (0) 0 (0) 0 (0) 0 (0)
Moderate 5 (12) 0 (0) 3 (8) 0 (0) 8 (10) 0 (0)
Mild 7 (17) 0 (0) 3 (8) 0 (0) 10 (13) 0 (0)
Not related
Severe 1 (2) 0 (0) 2 (5) 0 (0) 3 (4) 0 (0)
Moderate 11 (26) 4 (27) 10 (26) 2 (14) 21 (26) 6 (21)
1 (AE dates missing) 1 (AE dates missing)
Mild 12 (29) 10 (67) 20 (53) 12 (86) 32 (40) 22 (76)
2 (AE dates missing) 2 (AE dates missing)
Not reported 0 (0) 1 (7) 0 (0) 0 (0) 0 (0) 1 (3)
Total 42a (100) 15a (100) 38 (100) 14 (100) 80a (100) 29a (100)
a Totals and percentages omit the three AEs that cannot be categorised into during/after treatment owing to missingAE dates.
RESULTS
NIHR Journals Library www.journalslibrary.nihr.ac.uk
48

A check was carried out to see if any patients who attended the primary end-point visit but did notprovide information on returned medication reported any AEs. These could still be attributed to the trialmedication, but would not be included in the per-treatment group as no assumption on medication takenwas made. There were two such events: one unrelated (dental abscess) and one possibly related to themedication (details: Patient 6009, randomised to lansoprazole, reported a mild AE – ‘confusion, weaknesson left leg, chest pain after swallowing the trial drug’).
Report Supplementary Material 1 provides a line listing of the breakdown of AEs by treatment group, withcategorisation in terms of relationship to medication, severity and whether or not the participants weretaking the medication at the time when the AE occurred. Most of the AEs and adverse reactions wereexpected treatment-related toxicities.
Serious adverse events for the per-treatment analysis groupThere were two SAEs, both unrelated to the trial medication. One was unintentional bleach ingestionon an overseas holiday due to an error made by a hotel staff member (PPI group) and the other was anexacerbation of pre-existing asthma (placebo group).
DOI: 10.3310/hta25030 HEALTH TECHNOLOGY ASSESSMENT 2021 VOL. 25 NO. 3
© Queen’s Printer and Controller of HMSO 2021. This work was produced by Wilson et al. under the terms of a commissioning contract issued by the Secretary of State forHealth and Social Care. This issue may be freely reproduced for the purposes of private research and study and extracts (or indeed, the full report) may be included in professionaljournals provided that suitable acknowledgement is made and the reproduction is not associated with any form of advertising. Applications for commercial reproduction shouldbe addressed to: NIHR Journals Library, National Institute for Health Research, Evaluation, Trials and Studies Coordinating Centre, Alpha House, University of Southampton SciencePark, Southampton SO16 7NS, UK.
49


Chapter 4 Discussion
Terminology
Persistent throat symptoms include chronic throat clearing, hoarse voice (dysphonia), sensation of a lumpin the throat (globus) and increased mucus sensation (catarrh). The symptoms most commonly experiencedby the TOPPITS participants were, in order of frequency, as recorded by the RSI severity endorsement[see Report Supplementary Material 1, Tables 16 (whole population) and 17 (compliant group)]:
1. lump in the throat2. throat clearing3. excess mucus4. troublesome cough5. hoarseness.
Similar frequencies were, not surprisingly, seen with CReSS:
1. throat clearing2. feeling things stuck in throat3. lump in throat4. excess mucus5. hoarseness.
Laryngopharyngeal reflux was promoted as an umbrella term in the mid-1990s and has since grown inpopularity despite ongoing debate regarding pathophysiology, diagnosis and treatment. We aimed toquantify shifts in medical terminology for throat symptoms over time. Search terms included ‘throat clearing’,‘reflux laryngitis’, ‘acid laryngitis’, ‘globus pharyngeus’, ‘globus sensation’, ‘globus hystericus’, ‘catarrh’ or‘laryngopharyngeal reflux’ in the title or abstract. The total number of publications per decade was derivedalong with subtotals for clinical research and reviews. Catarrh (n = 473) and the various terms for globus(n = 468) featured prominently for the decades 1960s to 1980s, with fewer instances of acid/reflux laryngitis(n = 96). The 209 references to throat clearing date from 1980 (numerically the commonest symptom inmost detailed surveys). There has been an exponential rise in LPR from the 1990s (n = 810), although fewerthan one in five reports were classed as a ‘clinical study’. The predilection for LPR is no doubt supported bythe fact that > 50% of the US general population has heartburn.56 The use of anticholinergic medications,especially in combination, increases the odds of experiencing globus by a factor of 3.52.57 An investigationof the frequency of throat clearing and cough and how often each is associated with a positive symptomindex for reflux found a low probability of objective association. This is even less likely if both symptoms arepresent or if patients report an ‘excessive’ cough.58
The premise for TOPPITS was that without a robust UK trial we saw nothing to question the increasingpopularity of acid suppression medications as a prime therapy for upper respiratory symptoms. If allputative LPR patients referred to otolaryngologists were treated with PPIs, the costs are estimated at £4Mper annum. Although the link between LPR and upper respiratory symptoms is little more than speculative orintuitive when close enquiry of the evidence base is made, the level of acceptance in primary care isalso increasing. Many patients seen by non-TOPPITS otolaryngologists at participating centres might haveconsidered TOPPITS had they not already had substantial trials of PPIs in primary care and thus never evenreached the screening clinic.
DOI: 10.3310/hta25030 HEALTH TECHNOLOGY ASSESSMENT 2021 VOL. 25 NO. 3
© Queen’s Printer and Controller of HMSO 2021. This work was produced by Wilson et al. under the terms of a commissioning contract issued by the Secretary of State forHealth and Social Care. This issue may be freely reproduced for the purposes of private research and study and extracts (or indeed, the full report) may be included in professionaljournals provided that suitable acknowledgement is made and the reproduction is not associated with any form of advertising. Applications for commercial reproduction shouldbe addressed to: NIHR Journals Library, National Institute for Health Research, Evaluation, Trials and Studies Coordinating Centre, Alpha House, University of Southampton SciencePark, Southampton SO16 7NS, UK.
51

There is no agreed, standard, core patient self-report outcome even for lower oesophageal reflux; the onlyCOMET website reference to reflux is to a workshop that concluded that members strongly supported thedevelopment of validated patient-reported outcome instruments. This lack of a pre-eminent outcome toolled us to develop the CReSS.59 The CReSS covers all oesophageal and extraesophageal reflux symptoms byincorporating all items from the original Gastrointestinal Symptom Assessment Score,60 together with allcomponents of the RSI. CReSS totals are independent of age, and all items were endorsed by ≥ 17% ofthroat symptom patients.61
The inexorable rise in popularity of LPR as the default term for persistent throat symptoms appears to havefuelled huge popularity for PPI therapy despite a lack of evidence. Attempts to reverse this trend, in view ofrecent adverse PPI publicity, will be supported by the overall negative finding of the TOPPITS data. Globuspharyngeus was described as a ‘tainted term’ in a recent opinion article due to its connotation of ‘globushystericus’.62 The authors propose that a feeling of having a lump in the throat on dry swallow is a normalsensation, accentuated by circumstances. Their proposed contemporary term is ‘troublesome ThroatAwareness’ (tTA). However, this idiosyncratic acronym, although functionally useful, will not readilysupplant the classical term.
Recent reports on epidemiology of persistent throat symptoms
The 1982 ENT outpatient globus prevalence figure of 4.2%3 has fallen little in the ensuing decades, being3.8% in a recent report.63 Despite its name, there is little evidence linking the symptom items of the RSIwith any demonstrable oesophagopharyngeal reflux. Indeed, the very first attempt – almost 30 years ago –
to treat a similar list of symptoms with H2 antagonists yielded a negative result.19 The RSI has nonethelessbeen used to assess ‘LPR’ in a number of recent studies. A population prevalence study approached 2000UK-dwelling adults, who were sent the RSI and questions on their health and lifestyle. The mean RSI was8.3; 30% had a RSI score of > 10, of whom 75% had symptoms of GORD. Patients with depression andirritable bowel syndrome were more likely to have higher RSI scores. In other words, in this population survey,correlates of the RSI questionnaire score appear to be gastroesophageal reflux, depression and irritablebowel syndrome.30 In the general Greek population, the prevalence of ‘LPR’ was 18.8%, similar in bothsexes (p > 0.05), with a peak age of 50–64 years and with a positive association with tobacco smoking andalcohol consumption.64 A total of 3006 individuals surveyed in Guangdong Province, China,65 completedquestionnaires about their physical and psychological characteristics and globus symptomatology, and ourown, physician-generated Glasgow Edinburgh Throat Scale66 with questionnaires on quality of sleep andlife. In this survey, those with no history of GORD, dysphagia, odynophagia or alerting symptoms, such asweight loss and hoarseness, were diagnosed as having globus. The overall lifetime prevalence of globusso defined was 21.5%, with a peak age at disease onset of 35–54 years, commoner in urban dwellersand with no sex bias. Anxiety (40%), depression (31%) and sleep disorders (24%) in respondents withglobus were significantly commoner than in those without globus.65 A more informal enquiry made by ourgroup many years ago in a high street survey of UK shoppers indicated a (within the last 3 months) femalepopulation prevalence of globus in 6% of those questioned.2
Perception of reflux causation of persistent throat symptoms ingeneral practice
The risk of overattribution of throat symptoms to so-called LPR has been recognised in the specialist ENTliterature for some time. A retrospective chart review analysis identified 105 patients in a private laryngologyclinic setting with a previous diagnosis of LPR as the cause of hoarseness. After anti-reflux therapy, 82%had no improvement or felt worse, leading the authors to conclude that LPR was overdiagnosed, especiallywhen no other explanation was readily apparent.67 A similar reliance on a putative LPR diagnosis in theabsence of clear evidence has filtered into the wider, non-ENT, medical community. A US web-based surveyof 314 (13%) doctors (46% family practitioners) showed that 64% preferred to treat rather than immediately
DISCUSSION
NIHR Journals Library www.journalslibrary.nihr.ac.uk
52

refer a patient with chronic (> 6 weeks’) unexplained hoarseness, most often with anti-reflux medication(86%), even in the absence of GORD symptoms and antihistamines (54%).68 Pre-treatment appears tosignificantly delay diagnosis. A retrospective case review of 755 patients referred to a voice service in KansasCity69 reported that 244 patients (32%) received a diagnosis before attending, this being LPR in over half,and, of those, > 65% had no GORD symptoms. Over 80% of diagnoses changed following attendance at thevoice clinic and so those with prior treatment had a median duration of symptoms that was 6 weeks longerthan those without (p = 0.04).69
Similar trends seem to prevail in the UK. Although only 27% of TOPPITS recruits had taken PPIs in thepreceding 12 months (see Appendix 2, Table 36), many others who had previously had this treatment wereunderstandably reluctant either to discontinue it simply to enter a RCT of the same medication or to returnto it when it had previously failed, and so the figure of 27% under-represents the general laryngologyreferral population usage of PPIs.
Misuse of PPIs is also documented internationally in a wider context. Only 34% of Swiss GPs are reportedto attempt dose reduction in long-term users.70 An Italian primary care study found that almost 15% ofa sample of over 6300 patients were taking PPIs – over 30% potentially inappropriately.71 A Canadianstudy of over 870 patients presenting to the emergency department of a teaching hospital also found PPIprescription to be inappropriate in > 30% of participants.72 An observational study of the patients admittedto an acute hospital in Ireland in February 201873 identified that almost half of the sample of 1764 patientswere regular PPI users. Almost 55% had no documented indication. Polypharmacy in the elderly gaveparticular cause for concern.73 Pre-admission and discharge prescriptions were reviewed in a tertiaryteaching hospital in Singapore to determine continuation of pre-admission and new PPI prescriptions atdischarge.74 Of 150 patients, 53% received prescriptions for PPIs, of whom > 80% had no valid reason.74
What does TOPPITS tell us about the impact of proton pump inhibitortreatment on throat symptoms?
The key messages from the trial are:
l There was no statistically significant difference between randomised groups, lansoprazole comparedwith placebo, when adjusted for site and baseline binary RSI-HB. This difference indicates thatlansoprazole patients are estimated to have RSI scores at 16 weeks that are 1.9 points higher (worse)than placebo patients (95% CI –0.3 to 4.2; p = 0.096) (see Table 9).
l There is no statistically significant difference in the mean RSI score at 16 weeks between lansoprazole(17.4, 95% CI 15.5 to 19.4) and placebo (15.6, 95% CI 13.8 to 17.3) (p = 0.162). (See the t-test results inChapter 3, Univariate analysis of unadjusted primary outcome measure for the compliant analysis group.)
l At 16 weeks, 43% of participants had RSI scores within the normal range, with no significant differencebetween the lansoprazole (41%) and placebo (45%) groups (see Report Supplementary Material 1, Table 15).
l Patient demographics39,75 were explored as potential baseline determinants of treatment response butage, sex, smoking status, alcohol consumption and BMI did not improve the RSI 16-week prediction(model 3; see Table 11).
l At 12 months, there is a further minor drop in RSI scores (see Table 17 and box plots in Figure 14).l Baseline RFS does not predict PPI response (see Appendix 8, Table 56).
TOPPITS is a considerably larger trial than the majority of series included in recent meta-analyses. Pre TOPPITS,a trial in 146 selected patients, all with signs of posterior laryngitis,22 showed no symptom benefit from PPItherapy over placebo, but did not report RSI scores. Lee et al.76 noted less marked PPI responses in olderpatients (to a lower-dose PPI regimen than was used in TOPPITS). However, this may have reflected thefact that the oldest cohort had the highest baseline RSI levels and/or that the authors used a dichotomousdefinition of response (i.e. a 50% drop in RSI) rather than a continuous variable assessment. Baseline severitywas a major determinant of end-point severity in TOPPITS.
DOI: 10.3310/hta25030 HEALTH TECHNOLOGY ASSESSMENT 2021 VOL. 25 NO. 3
© Queen’s Printer and Controller of HMSO 2021. This work was produced by Wilson et al. under the terms of a commissioning contract issued by the Secretary of State forHealth and Social Care. This issue may be freely reproduced for the purposes of private research and study and extracts (or indeed, the full report) may be included in professionaljournals provided that suitable acknowledgement is made and the reproduction is not associated with any form of advertising. Applications for commercial reproduction shouldbe addressed to: NIHR Journals Library, National Institute for Health Research, Evaluation, Trials and Studies Coordinating Centre, Alpha House, University of Southampton SciencePark, Southampton SO16 7NS, UK.
53

Awareness of treatment group by patients
We were interested to explore patient perception of their treatment group as there was a concern thatthose with more severe heartburn might recognise a prompt heartburn response as implying that theywere in the PPI group. However, the awareness (true-positive opinion) of group was broadly equal in thecohorts (see Table 4). Of the PPI cohort, 42% correctly called their allocation, compared with 56% ofplacebo participants.
The recent TOPPITS context
The premise for TOPPITS was that, without a robust UK trial, we saw nothing to stop the increasing‘belief’ in LPR as a prime cause of upper respiratory symptoms, as the theory was supported by prominentlaryngological enthusiasts, some respiratory medicine experts and, of course, the pharmaceutical industry.If all putative LPR patients referred to otolaryngologists were treated with PPI, we would calculate the coststo be approximately £4M per annum. Although the link between LPR and upper respiratory symptoms is littlemore than speculative or intuitive when close enquiry of the evidence base is made, the level of acceptance inprimary care is also increasing. Many patients seen by non-TOPPITS otolaryngologists at participating centresmight have considered TOPPITS had they not already had substantial trials of PPI in primary care and thusnever even reached the screening clinic.
A 2016 review52 of the evidence linking reflux and voice changes concluded that the association lackedsupporting data from clinical trials. The authors describe using the Bradford Hill criteria to support theirconclusion that ‘the evidence toward causality between reflux and voice is insufficient’.52 Tantalisingly,however, the authors conclude by saying that a relationship ‘does exist which deserves carefulconsideration’ – despite having concluded that:
To date, neither clinical trials nor comparative observational studies have been able to demonstratea strong dose response between reflux and voice disorders, temporality (reflux precedes dysphonia),consistent treatment effects or strength of association between anti-reflux treatment and improvedvoice among patients with presumed LPR.
Schneider et al.52
Three meta-analyses have been reported since TOPPITS was designed. A 2014 meta-analysis of eightpapers comprising 370 patients found no statistical difference in effect between PPIs and placebo.77 Separateassessment of the impact on cough was also not statistically significant.77 This result was in disagreementwith two meta-analyses published in 2016.78,79 Both of these reports include a subset of studies with RSIas primary outcome. Wei78 examined pooled relative risks for the response rate and standardised meandifferences (SMDs) for RSI and RFS. Of 13 RCTs, five reported RSI (total n = 277, ranging from only 37 to 8215
participants per study). Pooled results are reported to demonstrate that the total RSI improved significantlymore for PPI therapy than for placebo (SMD 3.65, 95% CI 1.56 to 5.75), although no significant differencewas found in response rate (0.04, 95% CI –0.06 to 0.14) or RFS (SMD 0.91, 95% CI –0.53 to 2.35). Scrutinyof the tabulated and forest plot findings, however, indicates that, of the five trials in the RSI analysis, threefavour PPI, but with highly significant heterogeneity (i.e. variability in results across studies), questioning thepooling of the data in the first place. The smallest mean difference in RSI was 0.26. The greatest SMD totalRSI score (14.21 in 60 patients) is reported in Chinese with an English-language abstract. However, this wasnot a study comparing PPIs with placebo but of ‘golden voice capsule’ plus or minus PPI.80 This study wasomitted when Guo et al.79 carried out a similar RSI meta-analysis on the remaining four studies (totaln = 217). Despite dropping the outlying ineligible study, there remained highly significant heterogeneity(p < 0.00001), and the SMD had fallen to 1.65 (95% CI 0.15 to 3.14).
Reichel et al.81 carried out a RCT of PPI in patients with throat symptoms, although the citation in Wei’s78
bibliography is of their publication of 49 patients on the lack of correlation between the symptom change
DISCUSSION
NIHR Journals Library www.journalslibrary.nihr.ac.uk
54

after PPI with measurable 24-hour pH monitoring change. The actual RCT carried out by this group had RSIas the principal outcome in 58 patients.28 (Moreover, the reference numbering in the table of all 13 includedstudies is awry78). However, the representation of Reichel et al.’s81 data in the appropriate paper is accurate.Reichel et al.81 included only patients with a RFS of > 7 and their sample showed a RSI SMD of 3.85 at3 months. The TOPPITS median RFS was 9 at baseline (IQR 7–12) (see Table 18) (i.e. a majority of patientswould meet Reichel et al.’s81 qualifying criterion). The end of treatment mean change from baseline in thetotal RSI was 14.3 in the esomeprazole group, which was statistically greater than in the placebo group(7.8, SMD 3.85).28 The authors note the marked placebo response, which was indeed greater than thatin either group of the much larger TOPPITS cohort at 4 months (mean change from baseline in allpatients = 5.3).
Other authors have considered whether or not oropharyngeal pH monitoring (Restech, Respiratory TechnologyCorporation, Houston, TX, USA) may predict PPI response. RSI, laryngoscopy and 24-hour oropharyngeal pHmonitoring were undertaken in 22 patients who were given a 3-month course of 40 mg of pantoprazole twicea day.82 A symptom response was defined as a 5-point fall in the RSI score. Laryngoscopic findings did notcorrelate with response and only nine patients (40.9%) had abnormal pH-metry, all being responders. FourpH-metry negative patient were also responders. Thus, oropharyngeal pH monitoring showed a sensitivityof 69% and a specificity of 100%.82 In another report of 24-hour multichannel intraluminal oesophagealimpedance/pH-metry, GORD was confirmed in < 40% of patients previously labelled as having LPR, whichthe authors attribute to ‘the low specificity of the laryngoscopic findings’.83
Optimal administration of PPI usually takes place 30 minutes before food; > 30% of patients are suboptimalusers.84 (Esomeprazole seems not to lose efficacy when administered after meals.85) Fifty-one patients withthroat symptoms completed a face-to-face semistructured interview, a questionnaire and the RSI. Over62% of participants described an incorrect routine in taking their PPI (taking it with other pills, taking it withfood/drink and uncertainty about which pill is for reflux), although this did not have an impact on the RSI.RSI scores were moderately correlated with patient-reported reflux severity (r = 0.62, p < 0.0001, R2 = 0.34).Even when PPI compliance was adequate, symptoms such as globus, mucus, voice dysfunction and dysphagiapersisted. In addition to the dubious effect size of PPI therapy, there are now also increasing concerns aboutthe safety of PPIs.
Proton pump inhibitor risk
The US veterans study86 of the impact of PPI use on all-cause mortality in almost 350,000 individuals foundthat, over a median follow-up of 5.71 years, PPI use was associated with an increased risk of death comparedwith the use of H2 antagonist blockers [hazard ratio (HR) 1.25]. The risk of death was increased whenconsidering PPI use versus no PPI and no H2 blockers (HR 1.23). Among new PPI users, there was a gradedassociation between the duration of exposure and the risk of death. The authors concluded that limiting PPIuse and duration to instances when it is medically indicated may be warranted.86 A systematic review of PPIsand cardiovascular events analysed five studies that directly compared the effect of PPI use on mortalityand/or cardiovascular morbidity (including 22,427 patients in mortality data sets and 354,446 patients inmorbidity data sets). For patients taking PPIs, all-cause mortality [odds ratio (OR) 1.68] and rate of majorcardiovascular events (OR 1.54) were significantly higher, indicating a significant increase in morbidity dueto cardiovascular disease.87 Long-term PPI use has also been linked to acute interstitial nephritis, fractures,and C. difficile-associated diarrhoea, suggesting a need for cautious prescribing and regular monitoring,especially in older adults.88
Gastric cancer risk with PPIs was assessed in over 63,000 individuals in Hong Kong who were givenclarithromycin-based triple therapy for Helicobacter pylori.89 During a median follow-up of 7.6 years,153 people (0.24%) developed gastric cancer (HR 2.44); this was not observed with those taking H2
antagonists (HR 0.72). The risk increased with duration of PPI use: the HR was 5.04 at 1 year and
DOI: 10.3310/hta25030 HEALTH TECHNOLOGY ASSESSMENT 2021 VOL. 25 NO. 3
© Queen’s Printer and Controller of HMSO 2021. This work was produced by Wilson et al. under the terms of a commissioning contract issued by the Secretary of State forHealth and Social Care. This issue may be freely reproduced for the purposes of private research and study and extracts (or indeed, the full report) may be included in professionaljournals provided that suitable acknowledgement is made and the reproduction is not associated with any form of advertising. Applications for commercial reproduction shouldbe addressed to: NIHR Journals Library, National Institute for Health Research, Evaluation, Trials and Studies Coordinating Centre, Alpha House, University of Southampton SciencePark, Southampton SO16 7NS, UK.
55

8.34 after 3 years. The adjusted absolute risk difference for PPI use versus non-PPI use was a 4.29-foldexcess of gastric cancer per 10,000 person-years.89 Similar conclusions were reached in a contemporaneousmeta-analysis of almost 1 million individuals in west China.90
Using data from Danish nationwide registries and Cox models regressing for both propensity scores anddrug use, a Danish group91 explored the current practice of using PPIs as an adjunctive therapy in cancerpatients. Cancer-specific and non-cancer death among PPI users (two or fewer prescriptions within 6 monthsafter diagnosis, n = 36,066) were compared with non-users (fewer than two prescriptions, n = 311,853) orusers of histamine H2-receptor antagonists (n = 5152). Adjusted HRs for cancer-specific mortality amongpostdiagnostic PPI users as compared with non-users or H2-receptor antagonist users were 1.29 and 1.15,respectively, and the risk was greatest for ovarian cancer. Although the associations were stronger amongnew PPI users after cancer diagnosis, indicating potential confounding, and the impact of PPIs on mousetumour models was variable, the authors raise concerns about PPI safety among cancer patients.91
Alginate/alkaline water
The alginate preparation Gaviscon Advance [Reckitt Benckiser Healthcare (UK) Ltd] was assessed aloneversus co-prescription with a PPI in an open-label study of ‘100 consecutive LPR patients’ with a RSI of > 10attending a joint voice clinic.92 All were treated with Gaviscon Advance four times daily. If patients hadalready been started on a PPI, this was optimised to a twice-daily dosing regimen. Follow-up RSI scores in72 patients showed no significant RSI differences from the additional use of PPI.
At the cellular level, tissue-bound pepsin is fundamental to reflux pathophysiology. Human pepsin remainsstable at a pH level of 7.4 and may be reactivated by hydrogen ions from any source. Most tap and bottledwaters (typically with pH levels of 6.7–7.4) would not be expected to affect pepsin stability. Artesian wellwater containing natural bicarbonate (pH level of 8.8) irreversibly inactivated human pepsin (in vitro). Inaddition, it has good acid-buffering capacity. Thus, the consumption of alkaline water may have therapeuticbenefits for reflux patients.93 In vitro tests of the proprietary alginate Gaviscon Advance show that it canspecifically remove both pepsin and bile acids, limit their diffusion and affect enzymatic activity of pepsin,hence the potential for oesophageal protection.94 Gaviscon Advance, it should be noted, relies principallyon its alginate raft and not on an acid-buffering capacity.
The Comprehensive Reflux Symptom Score
The advantages of CReSS include standardised, comprehensive capture of patient experience; discriminantvalidity of ENT and GORD patients from volunteers; and discrete oesophageal, pharyngeal and upper airwaysubscales.31 The CReSS and RSI are correlated (see Figure 15) as they are not independent, the CReSSincorporating all RSI symptoms. However, the addition of the CReSS upper airway domain to RSI-HBimproved the ability to predict RSI at 16 weeks (see Appendix 9, Table 62).
The Reflux Finding Score is unreliable
We felt that it was important to include a report on the endolaryngeal examination findings as scored by theRFS because of its common use in clinical practice. This is despite limited evidence to suggest that laryngealmucosal changes – increased ‘Reflux Finding’ Scores – discriminate between ‘normals’ and general throatsymptom patients.95 Furthermore, the RFS has not been proven to be a valid tool to diagnose LPR.17,51–53 Inour study, the RFS was independently scored 0–26 and assessed as a potential response predictor (alongsidepatient characteristics of age, sex, smoking status and BMI), comparing it with the RSI at 16 weeks.The number and value of RFSs were similar in both treatment groups at baseline. Adjusted for importantbaseline factors and RFS baseline assessment, the RFS was not suitable for first-order fractional polynomial
DISCUSSION
NIHR Journals Library www.journalslibrary.nihr.ac.uk
56
transformations and not considered for inclusion in the multivariable model. Thus, the total RFS was notsubsequently considered as a predictive factor of treatment response. Several authors have suggested thatone feature in the RFS – presence of pseudosulcus – is the best predictor of EOR,96,97 but this level ofindividual items analysis was not possible. Pseudosulcus has been reported generally as a rare finding.97
Others have found that RFS raters are influenced by patient symptoms and so the reliability and objectivityof the RFS is questionable.98 The RFS is also insensitive to postfundoplication symptomatic benefit.99
In a selected series of 78 patients with chronic cough and/or suspected vocal cord dysfunction,100 87% hada RSI score of > 13 and 51% had a RFS of > 7. Salivary pepsin had a sensitivity of 78% and specificity of53% for predicting a high RFS. There were significant correlations between the RSI and RFS (r = 0.51)and between the severity of laryngeal inflammation and the concentration of pepsin (r = 0.28). All casesinvestigated with pH-impedance study had objective evidence of proximal reflux.100 However, thesefindings in selected patients do not mirror observations in the generality of those presenting to clinics withnon-specific throat symptoms, who are the focus of TOPPITS.
Update on pH-metry and manometry in throat symptoms
Up to 50% of the patients suspected of reflux laryngitis syndrome fail to respond to acid suppressiontherapy. This has led to measurement of acid exposure times in an attempt to improve the specificity ofthe diagnosis. Using distal and cervical oesophageal pH-metry in 46 ‘LPR’ patients and 58 healthy controlpatients, the percentage of time that the pH level is < 4 and the number of LPR episodes emerged asdiagnostic LPR criteria.101 Up to 50% of the patients suspected of reflux laryngitis syndrome fail to respondto acid suppression therapy. Laryngopharyngeal bolus exposure time during multichannel intraluminalimpedance and pH (MII-pH) testing was the best response predictor in one study.102 Of 109 patientsevaluated by MII-pH, 47% were classed as ‘positive’ for evidence of significant LPR, with an average of46 episodes of proximal reflux exposure (either acid or non-acid). RSI scores were significantly differentbetween positive and negative studies, whereas RFSs were not.103
High-resolution manometry metrics in 24 globus patients were compared with 24 age-matched andsex-matched subjects with non-obstructive dysphagia and 21 healthy control patients.104 In a multivariatemodel, receiver operating characteristic analysis identified a threshold of 0.4-mmHg upper oesophagealsphincter (UOS) residual pressure in globus patients (sensitivity 66.7%, specificity 71.5%, positive predictivevalue 55.2%, negative predictive value 80.0%).104 Those globus patients who also have GORD may alsohave a longer UOS zone.105 Repeated reactive dry swallowing and/or throat clearing might contribute tothese observations, which may have a historical correlate in the so-called ‘inferior constrictor strain swallow’
described by Gray.106
There is recent interest in ambulatory 24-hour oropharyngeal aerosol acid exposure assessment, which wasused in 101 patients with GORD symptoms and cough, hoarseness, asthma symptoms or globus sensationalongside concomitant oesophageal pH monitoring. Oesophageal 24-hour pH-metry was positive in66 patients (65%), of whom 39% also had evidence of aerosol oropharyngeal acid. Only eight of thosewith normal oesophageal pH-metry had oropharyngeal acid exposure.107 Our own prior work shows thataspiration of bile acids may induce airway fibrosis through the production of transforming growth factorbeta 1 and fibroblast proliferation. Early intervention to attenuate these processes may reduce fibrogenesisin various airway diseases associated with GORD.108
Throat symptom patient-reported outcome tools
Three patient-reported outcome measures were utilised in TOPPITS. The RSI was considered the ‘market-leader’ in terms of popularity and its seemingly ubiquitous association with ‘LPR’. There was concern fromthe research team that the ninth questionnaire item groups four traditional GORD symptoms (heartburn,
DOI: 10.3310/hta25030 HEALTH TECHNOLOGY ASSESSMENT 2021 VOL. 25 NO. 3
© Queen’s Printer and Controller of HMSO 2021. This work was produced by Wilson et al. under the terms of a commissioning contract issued by the Secretary of State forHealth and Social Care. This issue may be freely reproduced for the purposes of private research and study and extracts (or indeed, the full report) may be included in professionaljournals provided that suitable acknowledgement is made and the reproduction is not associated with any form of advertising. Applications for commercial reproduction shouldbe addressed to: NIHR Journals Library, National Institute for Health Research, Evaluation, Trials and Studies Coordinating Centre, Alpha House, University of Southampton SciencePark, Southampton SO16 7NS, UK.
57

indigestion, chest pain and stomach acid coming up). It was hypothesised that this item could lead tooverall PPI treatment response reporting given that these symptoms are commonly treated with PPIs, hencethe rationale to refine the RSI into a score including and excluding this item for the purposes of baselinestratification. The CReSS questionnaire unbundles this item into distinct questions and has additional itemscited as important by patients. The CReSS was included to assess whether or not the more comprehensivesymptom profiling would allow greater sensitivity to change than the RSI does. In a study of the quality-of-lifeimpact of throat symptoms in 80 patients, females experienced a greater impact on vitality and mentalhealth than males did.109 A South Korean study explored the added impact of throat symptoms (RSI) onquality of life in 300 GORD patients. Those with supra-oesophageal symptoms had lower quality-of-lifescores proportional to the symptom severity.110 The LPR-HRQL was included in recognition of the lack ofquality-of-life measures or published outcomes in the field of chronic throat symptoms.
All three outcome measures show significant improvement in both the treatment group and the placebogroup from baseline to 16 weeks and from baseline to 12 months. The ninth RSI item did not affecttreatment reporting between the two groups, as was considered by the research team. The quality-of-lifemeasure (LPR-HRQL) also demonstrated proportionate reductions at 16 weeks and 12 months. This againproves the significant throat symptom placebo effect (Reichel et al.28). Presumably, both the experience ofbeing in a trial and the additional clinical team contact contributed to the pharmacological component ofthe placebo response. Evidence suggests that a substantial proportion of patients with unexplained throatsymptoms are susceptible to additional, unrelated medically unexplained symptoms. This would accord withthe magnitude of the placebo effect in TOPPITS.23 A person’s locus of control is either internal (believes topersonally control his or her life) or external (believes to be controlled by others, by environmental factorsthat cannot be influenced or by chance). An external locus of control has been found to be related tohigher placebo response.111 Contrary to expectation, somatisation in a primary care study was found not tocorrelate with locus of control,112 and this whole territory in throat symptoms warrants further investment.Although antidepressants modulate oesophageal sensation and reduce functional chest pain,113 throatsymptom patients regularly discontinue therapy.114
Psychological aspects
In a study of US Vietnam War veterans,115 the prevalence of globus was 6.4%. Those men with globushad increased risks of being diagnosed with somatisation disorder, major depression, generalised anxietydisorder, post-traumatic stress disorder and drug abuse or dependence (OR 1.89), giving rise to thehypothesis that men may develop globus to ‘represent’ other, related and treatable psychopathology.115
More widely, evidence suggests that a substantial proportion of patients with unexplained throatsymptoms are susceptible to additional, unrelated medically unexplained symptoms. The propensity tomultiple unexplained physical symptoms can be quantified by completion of a Review Of Symptoms orsimilar checklist.116
In a recent therapy trial, 148 refractory globus patients were randomised to receive 6 weeks of paroxetine,amitriptyline or lansoprazole. Response (> 50% reduction on the Glasgow Edinburgh Throat Scale) wasachieved by 72% of paroxetine users, 46% of those on amitriptyline and only 14% of the lansoprazolegroup.117 In our own early study, 24 globus patients were assessed for current and past psychiatric illnessand then received amitriptyline or placebo using a double-blind design. Nine patients met the criteriafor psychiatric disorder in the past; six had suffered from panic disorder. Two further patients had beentroubled by classic panic attacks. Nine of the 12 patients treated with amitriptyline and two of theplacebo group discontinued treatment. Thus, the association of pathological anxiety with globus wasassociated with a high incidence of tricyclic antidepressant treatment failure.114 Antidepressants modulateoesophageal sensation and reduce functional chest pain113 but more research is required on their potentialin throat symptoms.
DISCUSSION
NIHR Journals Library www.journalslibrary.nihr.ac.uk
58

Psychophysiological mechanisms
Recent work from China118,119 suggested that serotonin transporter gene (SLC6A4) polymorphism may beassociated with both globus pharyngeus and its antidepressant action. Globus patients were randomisedinto paroxetine or amitriptyline groups for 6 weeks. Treatment response was defined as a > 50% reductionin the Glasgow Edinburgh Throat Scale scores. A significant association between the genotype and theresponse to antidepressant treatment was observed.118,119 A recent study of UOS and oesophageal bodysensitivity and compliance between globus patients and healthy control patients found that somatisation,panic disorder and post-traumatic stress severity were significantly associated with globus. UOS complianceand somatisation were also found to be independently associated with globus, implying that globus is acomplex disorder of the brain–gut axis rather than a ‘psychosomatic’ disorder or a peripheral oesophagealdisorder.120 Transnasal oesophagoscopy, high-resolution manometry and 24-hour MII-pH monitoring wereconducted on 30 globus referrals in Helsinki.121 There was no evidence of acid or non-acid GORD orelevated UOS pressure.121
Potential methods to address the limitations encountered in TOPPITSpatient and public involvement
The patient and public involvement strand of TOPPITS was drawn up with high hopes, and nurturedby the ongoing efforts of our qualitative researcher, Jan Lecouturier, yet proved relentlessly disappointing.The following proposals might have, on refection, mitigated the low patient and public involvement input:
l Enhanced budget to fund a team member to attend clinics alongside the research nurses to explorereasons for non-engagement.
l Much of the allocated patient and public involvement budget went towards developing the website.l Enhanced sampling strategy seeking participation – targeting TOPPITS pilot study patients was not
productive; we might have approached those who declined TOPPITS or patients with otherthroat problems.
l Enhanced buy-in from the site staff (i.e. research staff there lead on developing the materials?). Wouldthis have raised the profile of the patient and public involvement and/or resulted in greater commitment?
GeneralisabilityTOPPITS deserves a high profile as the results are generalisable for the following reasons:
l It had a large sample compared with prior single trials and even the total numbers in severalmeta-analyses.
l It was multicentre, UK-wide and pragmatic.l The spread of baseline RSI scores was similar to the range in other publications in the field.l The sex balance and age profile were typical of reports of persistent throat symptoms in the West.l Key patient symptoms (lump in the throat, throat clearing, excess mucus, troublesome cough,
hoarseness, feeling things stuck in throat) incorporate the majority of those seen in NHS ENT clinics.l The message for primary and secondary care resonates with other messages concerning overuse of PPIs
when evidence is weak or lacking.122
l This is a topical subject as some of the epidemiological adverse data on long-term PPI use includingimpact on life expectancy are only now emerging.
InterpretationGiven the lack of any trend in treatment response in TOPPITS presented in this report, there is a limit tothe conclusions that can be drawn regarding the utility and merit of the questionnaires employed. It couldbe argued that the inclusion of three patient-reported outcome measures was unnecessary and that theRSI alone would have sufficed, providing a rapid measure, with a published literature context, patients’acceptability and demonstrable sensitivity to change. However, the lack of any trend towards a treatment
DOI: 10.3310/hta25030 HEALTH TECHNOLOGY ASSESSMENT 2021 VOL. 25 NO. 3
© Queen’s Printer and Controller of HMSO 2021. This work was produced by Wilson et al. under the terms of a commissioning contract issued by the Secretary of State forHealth and Social Care. This issue may be freely reproduced for the purposes of private research and study and extracts (or indeed, the full report) may be included in professionaljournals provided that suitable acknowledgement is made and the reproduction is not associated with any form of advertising. Applications for commercial reproduction shouldbe addressed to: NIHR Journals Library, National Institute for Health Research, Evaluation, Trials and Studies Coordinating Centre, Alpha House, University of Southampton SciencePark, Southampton SO16 7NS, UK.
59

effect in TOPPITS is the very reason why it is so important that TOPPITS presents the most comprehensiveevidence base possible. The use of multiple tools also offers the opportunity for the research team to analysepatients’ symptoms in further detail in the near future. Many patients present with throat symptoms. TOPPITShas clearly demonstrated that the common practice of treating patients with PPIs is ineffective. Optimummanagement should focus on patients’ symptoms and concerns, and address how these should bemanaged. The TOPPITS patients provide a wealth of patient-reported symptom data that will facilitate futureresearch and clinical pathways.
The study was not powered for subgroup analysis, and, as a clinical trial of an investigational medicinalproduct, this TOPPITS main report rightly limits itself to the analysis presented to the DMC and TSC in theagreed statistical analysis plan. However, group data sets may contain identifiable subgroups of individualswho potentially stand to gain more from a trial therapy. We propose to explore the data distribution ingreater detail, looking for any potential clustering of symptoms, to see whether or not there may be meritin pursuing anti-reflux approaches (not necessarily PPIs for the safety reasons outlined previously) or indeedwhether or not future efforts would be more logically applied to different aetiological theories andtherapeutic pathways, including psychological treatments.
Potential biasDid patients guess whether or not they were taking the active drug? Apparently not, as the correctidentification rate was similar in both groups (see Table 4). We were fortunate that our mucosal rater (PC)was working in Australia at the time and so had no way of judging the future allocation of therapy for anyindividual. The outcomes were all patient self-reported. This may have had some minor impact on outcomesmeasurement overall but not in any systematic way so as to influence one therapy over another.
Bias is minimised through ITT analyses retaining ineligible and protocol-violator patients in the analysis accordingto their randomised treatment group. The trial assumed a level of drop-out owing to the primary outcomemeasure being patient reported, and the sample size was inflated accordingly to retain power. Observeddrop-out was as anticipated and was not differential across treatment groups. It was demonstrated that thepatient characteristics of the pragmatic and compliant ITT groups were representative of the trial population.Planned secondary sensitivity analyses, based on a pragmatic ITT group, confirmed the conclusions of theprimary analyses, based on the compliant ITT group.
DISCUSSION
NIHR Journals Library www.journalslibrary.nihr.ac.uk
60

Chapter 5 Conclusions
Health-care implications
TOPPITS is a robust clinical trial that confirms the findings of other work (which found no evidence tosupport PPI treatment benefit in cohort studies of those with persistent throat symptoms). De-prescribing,defined as lowering dosage, switching to as-needed use or complete discontinuation, should be consideredfor many PPI users.88 Current NHS guidance for the management of persistent throat symptoms is lacking.The TOPPITS outcome stands to contribute to future throat symptom guidance, particularly given thecurrent popularity for primary PPI treatment. The TOPPITS results provide evidence that patients andclinicians need to consider in making shared decisions about PPI use for persistent throat symptoms.
This is important as the substantial gamut of adverse consequences of PPI treatment is only now becomingapparent. A reversal of the terminology trend towards LPR as the terminology of choice for persistentthroat symptoms is also worthy of consideration.122
Pursuit of alternative treatments
Mucosal protectionSucralfate offers a safe, locally active treatment by protective adherence to denuded mucosal surfaces andalso has bile salt-binding properties, with GORD efficacy comparable to that of H2-receptor blockade.123
To date, no studies comparing sucralfate with PPIs have been reported in the medical literature.124 It couldbe argued that this is of little relevance in throat symptoms as we have shown that PPIs are irrelevant inany case. However, mucosal protection agents might play a part in the control of sensory symptoms,possibly even in the absence of pathological levels of acid exposure.
Lifestyle modificationThe most significant lifestyle modification for persistent throat symptoms is weight loss. Additional lifestyleinterventions include upright head-of-bed elevation, avoiding meals close to bedtime and avoiding high-fatmeals within 2–3 hours of reclining. These simple low-cost interventions have understandably had relativelylittle research investment. A systematic review of lifestyle interventions in GORD concluded that weight lossand tobacco smoking cessation should be recommended when relevant, and that avoiding late-eveningmeals and head-of-bed elevation were effective in nocturnal GORD.125
In a study of supra-oesophageal reflux prevalence, timing and response to head-of-bed elevation by6 inches,126 nasopharyngeal pH-metry detected acid in 113 (48%) participants, with over half being onlyin the supine position. Sequential overnight nasopharyngeal pH monitoring before and after head-of-bedelevation was obtained in only 13 of those with supine reflux. Ten subjects demonstrated significantimprovement, with complete resolution in most.126 However, some bed types, such as storage divans,do not lend themselves easily to elevation and so the use of a mattress-top wedge is becoming increasingpopular in the commercial sector (e.g. https://putnams.co.uk/products/memory-foam-bed-wedge; accessed30 October 2019). Such wedges allow the sufferer to elevate the chest on a gentle slope while notaffecting the sleep position of any bed partner.
Other pathways/future work
Primary care offers unique insights into an individual’s history of multiple prior somatisation episodes;however, the rarity of laryngoscopic facilities in primary care distorts the management pathway for persistent
DOI: 10.3310/hta25030 HEALTH TECHNOLOGY ASSESSMENT 2021 VOL. 25 NO. 3
© Queen’s Printer and Controller of HMSO 2021. This work was produced by Wilson et al. under the terms of a commissioning contract issued by the Secretary of State forHealth and Social Care. This issue may be freely reproduced for the purposes of private research and study and extracts (or indeed, the full report) may be included in professionaljournals provided that suitable acknowledgement is made and the reproduction is not associated with any form of advertising. Applications for commercial reproduction shouldbe addressed to: NIHR Journals Library, National Institute for Health Research, Evaluation, Trials and Studies Coordinating Centre, Alpha House, University of Southampton SciencePark, Southampton SO16 7NS, UK.
61

throat symptoms. There is reassurance from adequate explanation of the vicious behavioural cycles thatcan perpetuate throat symptoms (dry swallow, throat clearing), together with an indication to patients ofthe common occurrence of their problems. All are preferable to universal PPI prescription for undiagnosedthroat symptoms.
When there are atypical features, early referral for laryngopharyngoscopy may be unavoidable. Secondarycare offers a more straightforward locus for research owing to the concentration of patients seen in everygeneral ENT clinic. Psychological approaches may be offered by speech therapists or as primary therapy orpharmacological interventions in their own right. Cognitive–behavioural therapy could feasibly be part ofa package for treating functional dysphonia,25,127–129 but the efficacy of cognitive–behavioural therapy indysphonia and globus remains to be addressed in a substantive trial. The placebo phenomenon111 mightalso usefully be exploited by the use of traditional voice care measures: hydration, steam and honey.More work is needed on the role of antidepressants.113,114,117,118,130 Speech therapy delivered by specialistpractitioners can be a primary globus therapy,131 but needs to be explored in a wider range of practitioners.
CONCLUSIONS
NIHR Journals Library www.journalslibrary.nihr.ac.uk
62

Acknowledgements
This trial was sponsored by The Newcastle upon Tyne Hospitals NHS Foundation Trust (research anddevelopment reference number 6831).
Contributions of authors
Professor Janet A Wilson (https://orcid.org/0000-0002-6416-5870) was the chief investigator anddesigned and developed the trial protocol. She oversaw the running of the trial, the data analysis and thepreparation of the final report and subsequent outputs.
Professor Deborah D Stocken (https://orcid.org/0000-0001-8031-1738) was the senior clinical trialsstatistician and contributed to the design, analysis, interpretation and reporting of the trial.
Miss Gillian C Watson (https://orcid.org/0000-0003-2466-0268) managed the trial on a day-to-daybasis and contributed substantially to the preparation of the final report.
Mr Tony Fouweather (https://orcid.org/0000-0002-2292-0495) was the clinical trials statistician andcontributed to the design and analysis of the trial and the presentation of data for this paper.
Mr Julian McGlashan (https://orcid.org/0000-0001-6716-6089) was the principal investigator at theNottingham site and contributed to the trial design, interpretation and dissemination.
Mr Kenneth MacKenzie (https://orcid.org/0000-0002-2952-7717) was the principal investigator at theGlasgow site and contributed to the design, interpretation and dissemination of the trial.
Professor Paul Carding (https://orcid.org/0000-0002-4206-1827) provided the blinded assessment ofbaseline digital images and contributed to the design, interpretation and dissemination of the trial.
Mr Yakubu Karagama (https://orcid.org/0000-0002-6257-905X) was the principal investigator at theManchester site and contributed to the design, interpretation and dissemination of the trial.
Mr Meredydd Harries (https://orcid.org/0000-0002-3026-5662) was the principal investigator at theBrighton site and contributed to data interpretation.
Dr Stephen Ball (https://orcid.org/0000-0002-5804-4466) was the principal investigator at theSunderland site and contributed to data interpretation.
Ms Sadie Khwaja (https://orcid.org/0000-0001-7129-8789) was the principal investigator at theStockport site and contributed to data interpretation.
Mr Declan Costello (https://orcid.org/0000-0001-6063-3211) was the principal investigator at theBirmingham site and contributed to data interpretation.
Ms Ruth Wood (https://orcid.org/0000-0002-8296-1774) designed and managed the database.
Dr Jan Lecouturier (https://orcid.org/0000-0002-5191-5804) advised on the patient and publicinvolvement aspects of the trial.
Dr James O’Hara (https://orcid.org/0000-0002-4096-3296) assisted in the design and development ofthe protocol and was, for a time, the principal investigator at the Sunderland site.
DOI: 10.3310/hta25030 HEALTH TECHNOLOGY ASSESSMENT 2021 VOL. 25 NO. 3
© Queen’s Printer and Controller of HMSO 2021. This work was produced by Wilson et al. under the terms of a commissioning contract issued by the Secretary of State forHealth and Social Care. This issue may be freely reproduced for the purposes of private research and study and extracts (or indeed, the full report) may be included in professionaljournals provided that suitable acknowledgement is made and the reproduction is not associated with any form of advertising. Applications for commercial reproduction shouldbe addressed to: NIHR Journals Library, National Institute for Health Research, Evaluation, Trials and Studies Coordinating Centre, Alpha House, University of Southampton SciencePark, Southampton SO16 7NS, UK.
63

Publications
Watson G, O’Hara J, Carding P, Lecouturier J, Stocken D, Fouweather T, Wilson J. TOPPITS: Trial of ProtonPump Inhibitors in Throat Symptoms. Study protocol for a randomised controlled trial. Trials 2016;17:175–83.
O’Hara J, Stocken DD, Watson GC, Fouweather T, McGlashan J, MacKenzie K, et al. Use of proton pumpinhibitors to treat persistent throat symptoms: multicentre, double blind, randomised, placebo controlledtrial. BMJ 2021;372:m4903.
Data-sharing statement
Anonymised data from this study may be available to the scientific community subject to regulatory andethics approval. Requests for data should be directed to the corresponding author.
Patient data
This work uses data provided by patients and collected by the NHS as part of their care and support. Usingpatient data is vital to improve health and care for everyone. There is huge potential to make better use ofinformation from people’s patient records, to understand more about disease, develop new treatments,monitor safety, and plan NHS services. Patient data should be kept safe and secure, to protect everyone’sprivacy, and it’s important that there are safeguards to make sure that it is stored and used responsibly.Everyone should be able to find out about how patient data are used. #datasaveslives You can find outmore about the background to this citation here: https://understandingpatientdata.org.uk/data-citation.
ACKNOWLEDGEMENTS
NIHR Journals Library www.journalslibrary.nihr.ac.uk
64

References
1. Watson G, O’Hara J, Carding P, Lecouturier J, Stocken D, Fouweather T, Wilson J. TOPPITS: TrialOf Proton Pump Inhibitors in Throat Symptoms. Study protocol for a randomised controlled trial.Trials 2016;17:175. https://doi.org/10.1186/s13063-016-1267-7
2. Deary IJ, Wilson JA, Kelly SW. Globus pharyngis, personality, and psychological distress in thegeneral population. Psychosomatics 1995;36:570–7. https://doi.org/10.1016/S0033-3182(95)71614-0
3. Moloy PJ, Charter R. The globus symptom. Incidence, therapeutic response, and age and sexrelationships. Arch Otolaryngol 1982;108:740–4. https://doi.org/10.1001/archotol.1982.00790590062017
4. Pawar S, Lim HJ, Gill M, Smith TL, Merati A, Toohill RJ, Loehrl TA. Treatment of postnasal dripwith proton pump inhibitors: a prospective, randomized, placebo-controlled study. Am J Rhinol2007;21:695–701. https://doi.org/10.2500/ajr.2007.21.3098
5. Lowden M, McGlashan JA, Steel A, Strugala V, Dettmar PW. Prevalence of symptoms suggestiveof extra-oesophageal reflux in a general practice population in the UK. Logoped Phoniatr Vocol2009;34:32–5. https://doi.org/10.1080/14015430902735847
6. Thompson WG, Heaton KW. Heartburn and globus in apparently healthy people. Can Med Assoc J1982;126:46–8.
7. NHS Digital. Hospital Outpatient Activity – 2010–11. 2011. URL: https://digital.nhs.uk/data-and-information/publications/statistical/hospital-outpatient-activity/hospital-outpatient-activity-2010-11(accessed 22 November 2019).
8. Noordzij JP, Khidr A, Evans BA, Desper E, Mittal RK, Reibel JF, Levine PA. Evaluation of omeprazolein the treatment of reflux laryngitis: a prospective, placebo-controlled, randomized, double-blindstudy. Laryngoscope 2001;111:2147–51. https://doi.org/10.1097/00005537-200112000-00013
9. Delahunty JE. Acid laryngitis. J Laryngol Otol 1972;86:335–42. https://doi.org/10.1017/S0022215100075356
10. Franchi A, Brogelli B, Massi D, Santucci M, De Campora E, Gallo O. Dilation of intercellular spacesis associated with laryngo-pharyngeal reflux: an ultrastructural morphometric analysis of laryngealepithelium. Eur Arch Otorhinolaryngol 2007;264:907–11. https://doi.org/10.1007/s00405-007-0295-z
11. Johnston N. Review article: uptake of pepsin at pH 7 – in non-acid reflux – causes inflammatory,and perhaps even neoplastic, changes in the laryngopharynx. Aliment Pharmacol Ther 2011;33:13–20.
12. Karkos PD, Wilson JA. Empiric treatment of laryngopharyngeal reflux with proton pump inhibitors:a systematic review. Laryngoscope 2006;116:144–8. https://doi.org/10.1097/01.mlg.0000191463.67692.36
13. Gatta L, Vaira D, Sorrenti G, Zucchini S, Sama C, Vakil N. Meta-analysis: the efficacy of protonpump inhibitors for laryngeal symptoms attributed to gastro-oesophageal reflux disease. AlimentPharmacol Ther 2007;25:385–92. https://doi.org/10.1111/j.1365-2036.2006.03213.x
14. Sen P, Georgalas C, Bhattacharyya AK. A systematic review of the role of proton pump inhibitorsfor symptoms of laryngopharyngeal reflux. Clin Otolaryngol 2006;31:20–4. https://doi.org/10.1111/j.1749-4486.2006.01134.x
15. Lam PK, Ng ML, Cheung TK, Wong BY, Tan VP, Fong DY, et al. Rabeprazole is effective intreating laryngopharyngeal reflux in a randomized placebo-controlled trial. Clin GastroenterolHepatol 2010;8:770–6. https://doi.org/10.1016/j.cgh.2010.03.009
DOI: 10.3310/hta25030 HEALTH TECHNOLOGY ASSESSMENT 2021 VOL. 25 NO. 3
© Queen’s Printer and Controller of HMSO 2021. This work was produced by Wilson et al. under the terms of a commissioning contract issued by the Secretary of State forHealth and Social Care. This issue may be freely reproduced for the purposes of private research and study and extracts (or indeed, the full report) may be included in professionaljournals provided that suitable acknowledgement is made and the reproduction is not associated with any form of advertising. Applications for commercial reproduction shouldbe addressed to: NIHR Journals Library, National Institute for Health Research, Evaluation, Trials and Studies Coordinating Centre, Alpha House, University of Southampton SciencePark, Southampton SO16 7NS, UK.
65

16. Ah-See K, Wilson J. Extra-oesophageal reflux: state of the knowledge base. Clin Otolaryngol2012;37:9–16. https://doi.org/10.1111/j.1749-4486.2012.02443.x
17. Powell J, Cocks HC. Mucosal changes in laryngopharyngeal reflux-prevalence, sensitivity,specificity and assessment. Laryngoscope 2013;123:985–91. https://doi.org/10.1002/lary.23693
18. Hanson DG, Kamel PL, Kahrilas PJ. Outcomes of antireflux therapy for the treatment of chroniclaryngitis. Ann Otol Rhinol Laryngol 1995;104:550–5. https://doi.org/10.1177/000348949510400709
19. Kibblewhite DJ, Morrison MD. A double-blind controlled study of the efficacy of cimetidine in thetreatment of the cervical symptoms of gastroesophageal reflux. J Otolaryngol 1990;19:103–9.
20. Karkos PD, Benton J, Leong SC, Karkanevatos A, Badran K, Srinivasan VR, et al. Trends inlaryngopharyngeal reflux: a British ENT survey. Eur Arch Otorhinolaryngol 2007;264:513–17.https://doi.org/10.1007/s00405-006-0222-8
21. Qadeer MA, Phillips CO, Lopez AR, Steward DL, Noordzij JP, Wo JM, et al. Proton pump inhibitortherapy for suspected GERD-related chronic laryngitis: a meta-analysis of randomized controlledtrials. Am J Gastroenterol 2006;101:2646–54. https://doi.org/10.1111/j.1572-0241.2006.00844.x
22. Vaezi MF, Richter JE, Stasney CR, Spiegel JR, Iannuzzi RA, Crawley JA, et al. Treatment of chronicposterior laryngitis with esomeprazole. Laryngoscope 2006;116:254–60. https://doi.org/10.1097/01.mlg.0000192173.00498.ba
23. Reimer C, Bytzer P. Management of laryngopharyngeal reflux with proton pump inhibitors.Ther Clin Risk Manag 2008;4:225–33. https://doi.org/10.2147/TCRM.S6862
24. Hungin AP, Rubin GP, O’Flanagan H. Long-term prescribing of proton pump inhibitors in generalpractice. Br J Gen Pract 1999;49:451–3.
25. O’Hara J, Miller T, Carding P, Wilson J, Deary V. Relationship between fatigue, perfectionism,and functional dysphonia. Otolaryngol Head Neck Surg 2011;144:921–6. https://doi.org/10.1177/0194599811401236
26. Belafsky PC, Postma GN, Koufman JA. Validity and reliability of the reflux symptom index (RSI).J Voice 2002;16:274–7. https://doi.org/10.1016/S0892-1997(02)00097-8
27. Lee YS, Choi SH, Son YI, Park YH, Kim SY, Nam SY. Prospective, observational study usingrabeprazole in 455 patients with laryngopharyngeal reflux disease. Eur Arch Otorhinolaryngol2011;268:863–9. https://doi.org/10.1007/s00405-010-1475-9
28. Reichel O, Dressel H, Wiederänders K, Issing WJ. Double-blind, placebo-controlled trial withesomeprazole for symptoms and signs associated with laryngopharyngeal reflux. OtolaryngolHead Neck Surg 2008;139:414–20. https://doi.org/10.1016/j.otohns.2008.06.003
29. Papakonstantinou L, Leslie P, Gray J, Chadwick T, Hudson M, Wilson JA. Laryngopharyngealreflux: a prospective analysis of a 34 item symptom questionnaire. Clin Otolaryngol2009;34:455–9. https://doi.org/10.1111/j.1749-4486.2009.01998.x
30. Kamani T, Penney S, Mitra I, Pothula V. The prevalence of laryngopharyngeal reflux in the Englishpopulation. Eur Arch Otorhinolaryngol 2012;269:2219–25. https://doi.org/10.1007/s00405-012-2028-1
31. Drinnan M, Powell J, Nikkar-Esfahani A, Heading RC, Doyle J, Griffin SM, et al. Gastroesophagealand extraesophageal reflux symptoms: similarities and differences. Laryngoscope 2015;125:424–30.https://doi.org/10.1002/lary.24950
32. Siupsinskiene N, Adamonis K, Toohill RJ. Quality of life in laryngopharyngeal reflux patients.Laryngoscope 2007;117:480–4. https://doi.org/10.1097/MLG.0b013e31802d83cf
33. Cheung TK, Lam PK, Wei WI, Wong WM, Ng ML, Gu Q, et al. Quality of life in patients withlaryngopharyngeal reflux. Digestion 2009;79:52–7. https://doi.org/10.1159/000205267
REFERENCES
NIHR Journals Library www.journalslibrary.nihr.ac.uk
66

34. Lenderking WR, Hillson E, Crawley JA, Moore D, Berzon R, Pashos CL. The clinical characteristicsand impact of laryngopharyngeal reflux disease on health-related quality of life. Value Health2003;6:560–5. https://doi.org/10.1046/j.1524-4733.2003.65243.x
35. Carrau RL, Khidr A, Gold KF, Crawley JA, Hillson EM, Koufman JA, Pashos CL. Validation of aquality-of-life instrument for laryngopharyngeal reflux. Arch Otolaryngol Head Neck Surg2005;131:315–20. https://doi.org/10.1001/archotol.131.4.315
36. Andersson O, Ryden A, Ruth M, Ylitalo Moller R, Finizia C. Validation of the Swedish translationof LPR-HRQL. Med Sci Monit 2010;16:CR480–7.
37. Belafsky PC, Postma GN, Koufman JA. The validity and reliability of the reflux finding score (RFS).Laryngoscope 2001;111:1313–17. https://doi.org/10.1097/00005537-200108000-00001
38. Saruç M, Aksoy EA, Vardereli E, Karaslaan M, Ciçek B, Ince U, et al. Risk factors forlaryngopharyngeal reflux. Eur Arch Otorhinolaryngol 2012;269:1189–94. https://doi.org/10.1007/s00405-011-1905-3
39. Gao L, Weck MN, Rothenbacher D, Brenner H. Body mass index, chronic atrophic gastritis andheartburn: a population-based study among 8936 older adults from Germany. Aliment PharmacolTher 2010;32:296–302. https://doi.org/10.1111/j.1365-2036.2010.04334.x
40. Madanick RD. Proton pump inhibitor side effects and drug interactions: much ado aboutnothing? Cleve Clin J Med 2011;78:39–49. https://doi.org/10.3949/ccjm.77a.10087
41. Reimer C, Søndergaard B, Hilsted L, Bytzer P. Proton-pump inhibitor therapy induces acid-relatedsymptoms in healthy volunteers after withdrawal of therapy. Gastroenterology 2009;137:80–7, 87.e1.https://doi.org/10.1053/j.gastro.2009.03.058
42. Laheij RJ, Sturkenboom MC, Hassing RJ, Dieleman J, Stricker BH, Jansen JB. Risk of community-acquired pneumonia and use of gastric acid-suppressive drugs. JAMA 2004;292:1955–60.https://doi.org/10.1001/jama.292.16.1955
43. Heidelbaugh JJ, Goldberg KL, Inadomi JM. Overutilization of proton pump inhibitors: a review ofcost-effectiveness and risk [corrected]. Am J Gastroenterol 2009;104(Suppl. 2):27–32. https://doi.org/10.1038/ajg.2009.49
44. Gray SL, LaCroix AZ, Larson J, Robbins J, Cauley JA, Manson JE, Chen Z. Proton pump inhibitoruse, hip fracture, and change in bone mineral density in postmenopausal women: results fromthe Women’s Health Initiative. Arch Intern Med 2010;170:765–71. https://doi.org/10.1001/archinternmed.2010.94
45. NHS. Proton Pump Inhibitor (PPI) Guidance April 2017. URL: www.gwh.nhs.uk/media/295818/ppi-guidance-apr-17-post-gwh-comments.pdf (accessed 22 November 2019).
46. National Institute for Health and Care Excellence (NICE). Gastro-oesophageal Reflux Disease andDyspepsia in Adults: Investigation and Management. URL: www.nice.org.uk/guidance/cg184(accessed 22 November 2019).
47. Weigt J, Kandulski A, Busch F, Malfertheiner P. Nocturnal gastric acid breakthrough is notassociated with night-time gastroesophageal reflux in GERD patients. Dig Dis 2009;27:68–73.https://doi.org/10.1159/000210107
48. NHS Business Services Authority. Information Services. URL: www.nhsbsa.nhs.uk/Documents/Apr_-_Jun_10_Gastro-intestinal.pdf (accessed 30 October 2019).
49. Gamble C, Krishan A, Stocken D, Lewis S, Juszczak E, Doré C, et al. Guidelines for the contentof statistical analysis plans in clinical trials. JAMA 2017;318:2337–43. https://doi.org/10.1001/jama.2017.18556
DOI: 10.3310/hta25030 HEALTH TECHNOLOGY ASSESSMENT 2021 VOL. 25 NO. 3
© Queen’s Printer and Controller of HMSO 2021. This work was produced by Wilson et al. under the terms of a commissioning contract issued by the Secretary of State forHealth and Social Care. This issue may be freely reproduced for the purposes of private research and study and extracts (or indeed, the full report) may be included in professionaljournals provided that suitable acknowledgement is made and the reproduction is not associated with any form of advertising. Applications for commercial reproduction shouldbe addressed to: NIHR Journals Library, National Institute for Health Research, Evaluation, Trials and Studies Coordinating Centre, Alpha House, University of Southampton SciencePark, Southampton SO16 7NS, UK.
67

50. Belafsky PC, Postma GN, Koufman JA. Laryngopharyngeal reflux symptoms improve beforechanges in physical findings. Laryngoscope 2001;111:979–81. https://doi.org/10.1097/00005537-200106000-00009
51. Vaezi MF. Sensitivity and specificity of reflux-attributed laryngeal lesions: experimental and clinicalevidence. Am J Med 2003;115(Suppl. 3A):97–104. https://doi.org/10.1016/S0002-9343(03)00205-5
52. Schneider GT, Vaezi MF, Francis DO. Reflux and voice disorders: have we established causality?Curr Otorhinolaryngol Rep 2016;4:157–67. https://doi.org/10.1007/s40136-016-0121-5
53. Kelchner LN, Horne J, Lee L, Klaben B, Stemple JC, Adam S, et al. Reliability of speech-languagepathologist and otolaryngologist ratings of laryngeal signs of reflux in an asymptomaticpopulation using the reflux finding score. J Voice 2007;21:92–100. https://doi.org/10.1016/j.jvoice.2005.09.004
54. McGlashan JA, Johnstone LM, Sykes J, Strugala V, Dettmar PW. The value of a liquid alginatesuspension (Gaviscon Advance) in the management of laryngopharyngeal reflux. Eur ArchOtorhinolaryngol 2009;266:243–51. https://doi.org/10.1007/s00405-008-0708-7
55. Steen IN, MacKenzie K, Carding PN, Webb A, Deary IJ, Wilson JA. Optimising outcomeassessment of voice interventions, II: sensitivity to change of self-reported and observer-ratedmeasures. J Laryngol Otol 2008;122:46–51. https://doi.org/10.1017/S0022215107007839
56. Cohen E, Bolus R, Khanna D, Hays RD, Chang L, Melmed GY, et al. GERD symptoms in thegeneral population: prevalence and severity versus care-seeking patients. Dig Dis Sci2014;59:2488–96. https://doi.org/10.1007/s10620-014-3181-8
57. Haft S, Carey RM, Farquhar D, Mirza N. Anticholinergic medication use is associated with globuspharyngeus. J Laryngol Otol 2016;130:1125–9. https://doi.org/10.1017/S002221511600918X
58. Abdul-Hussein M, Freeman J, Castell DO. Cough and throat clearing: atypical GERD symptoms or notGERD at all? J Clin Gastroenterol 2016;50:e50–4. https://doi.org/10.1097/MCG.0000000000000384
59. Nikkar A, James P, Powell J, Millar I, Carding P, Leslie P, et al. Reflux symptomatology: towardsbetter definition of the patient experience. Clin Otolaryngol 2012;37(Suppl. 1):128–9.
60. Rothman M, Farup C, Stewart W, Helbers L, Zeldis J. Symptoms associated with gastroesophagealreflux disease: development of a questionnaire for use in clinical trials. Dig Dis Sci 2001;46:1540–9.https://doi.org/10.1023/A:1010660425522
61. Powell J, Nikkar A, Doyle J, Wilson J. Extraesophageal reflux: throat and gastrointestinal patients.Otolaryngol Head Neck Surg 2012;147:73. https://doi.org/10.1177/0194599812451438a116
62. Doody J, Fenton JE. Troublesome Throat Awareness (tTA) as a contemporary alternative to ‘globuspharyngeus’. Surgeon 2017;15:183–5. https://doi.org/10.1016/j.surge.2017.05.001
63. Rasmussen ER, Schnack DT, Ravn AT. A prospective cohort study of 122 adult patients presentingto an otolaryngologist’s office with globus pharyngeus. Clin Otolaryngol 2018;43 854–60.https://doi.org/10.1111/coa.13065
64. Spantideas N, Drosou E, Bougea A, Assimakopoulos D. Laryngopharyngeal reflux disease in theGreek general population, prevalence and risk factors. BMC Ear Nose Throat Disord 2015;15:7.https://doi.org/10.1186/s12901-015-0020-2
65. Tang B, Cai HD, Xie HL, Chen DY, Jiang SM, Jia L. Epidemiology of globus symptoms andassociated psychological factors in China. J Dig Dis 2016;17:319–24. https://doi.org/10.1111/1751-2980.12354
REFERENCES
NIHR Journals Library www.journalslibrary.nihr.ac.uk
68

66. Deary IJ, Wilson JA, Harris MB, MacDougall G. Globus pharyngis: development of a symptomassessment scale. J Psychosom Res 1995;39:203–13. https://doi.org/10.1016/0022-3999(94)00104-D
67. Thomas JP, Zubiaur FM. Over-diagnosis of laryngopharyngeal reflux as the cause of hoarseness.Eur Arch Otorhinolaryngol 2013;270:995–9. https://doi.org/10.1007/s00405-012-2244-8
68. Ruiz R, Jeswani S, Andrews K, Rafii B, Paul BC, Branski RC, Amin MR. Hoarseness andlaryngopharyngeal reflux: a survey of primary care physician practice patterns. JAMA OtolaryngolHead Neck Surg 2014;140:192–6. https://doi.org/10.1001/jamaoto.2013.6533
69. Holcomb AJ, Hamill CS, Irwin T, Sykes K, Garnett JD, Kraft S. Practice patterns of referringphysicians in management of the dysphonic patient. Otolaryngol Head Neck Surg2018;158:1072–8. https://doi.org/10.1177/0194599818758958
70. Selby K, Cornuz J, Cohidon C, Gaspoz JM, Senn N. How do Swiss general practitioners agreewith and report adhering to a top-five list of unnecessary tests and treatments? Results of across-sectional survey. Eur J Gen Pract 2018;24:32–8. https://doi.org/10.1080/13814788.2017.1395018
71. Tosetti C, Nanni I. Use of proton pump inhibitors in general practice. World J GastrointestPharmacol Ther 2017;8:180–5. https://doi.org/10.4292/wjgpt.v8.i3.180
72. Nguyen PV, Tamaz R. Inappropriate prescription of proton pump inhibitors in a communitysetting. Can J Hosp Pharm 2018;71:267–71. https://doi.org/10.4212/cjhp.v71i4.2828
73. Ali O, Poole R, Okon M, Maunick S, Troy E. Irrational use of proton pump inhibitors in generalpractise. Ir J Med Sci 2018;188:541–4. https://doi.org/10.1007/s11845-018-1891-1
74. Akram F, Huang Y, Lim V, Huggan PJ, Merchant RA. Proton pump inhibitors: are we stillprescribing them without valid indications? Australas Med J 2014;7:465–70. https://doi.org/10.4066/AMJ.2014.2093
75. Halum SL, Postma GN, Johnston C, Belafsky PC, Koufman JA. Patients with isolatedlaryngopharyngeal reflux are not obese. Laryngoscope 2005;115:1042–5. https://doi.org/10.1097/01.MLG.0000162656.05715.57
76. Lee YC, Lee JS, Kim SW, Kwon KH, Eun YG. Influence of age on treatment with proton pumpinhibitors in patients with laryngopharyngeal reflux disease: a prospective multicenter study. JAMAOtolaryngol Head Neck Surg 2013;139:1291–5. https://doi.org/10.1001/jamaoto.2013.5556
77. Liu C, Wang H, Liu K. Meta-analysis of the efficacy of proton pump inhibitors for the symptomsof laryngopharyngeal reflux. Braz J Med Biol Res 2016;49:S0100–879X2016000700704.https://doi.org/10.1590/1414-431X20165149
78. Wei C. A meta-analysis for the role of proton pump inhibitor therapy in patients withlaryngopharyngeal reflux. Eur Arch Otorhinolaryngol 2016;273:3795–801. https://doi.org/10.1007/s00405-016-4142-y
79. Guo H, Ma H, Wang J. Proton pump inhibitor therapy for the treatment of laryngopharyngealreflux: a meta-analysis of randomized controlled trials. J Clin Gastroenterol 2016;50:295–300.https://doi.org/10.1097/MCG.0000000000000324
80. Luo H, Ma S, Gao Y, Yan J, Hou J, Xu M. The therapeutic effect of proton pump inhibitor onalleviation of hoarseness symptoms in patients with laryngopharyngeal reflux. Lin Chuang Er BiYan Hou Tou Jing Wai Ke Za Zhi 2015;29:997–1001.
81. Reichel O, Keller J, Rasp G, Hagedorn H, Berghaus A. Efficacy of once-daily esomeprazoletreatment in patients with laryngopharyngeal reflux evaluated by 24-hour pH monitoring.Otolaryngol Head Neck Surg 2007;136:205–10. https://doi.org/10.1016/j.otohns.2006.10.011
DOI: 10.3310/hta25030 HEALTH TECHNOLOGY ASSESSMENT 2021 VOL. 25 NO. 3
© Queen’s Printer and Controller of HMSO 2021. This work was produced by Wilson et al. under the terms of a commissioning contract issued by the Secretary of State forHealth and Social Care. This issue may be freely reproduced for the purposes of private research and study and extracts (or indeed, the full report) may be included in professionaljournals provided that suitable acknowledgement is made and the reproduction is not associated with any form of advertising. Applications for commercial reproduction shouldbe addressed to: NIHR Journals Library, National Institute for Health Research, Evaluation, Trials and Studies Coordinating Centre, Alpha House, University of Southampton SciencePark, Southampton SO16 7NS, UK.
69

82. Vailati C, Mazzoleni G, Bondi S, Bussi M, Testoni PA, Passaretti S. Oropharyngeal pH monitoringfor laryngopharyngeal reflux: is it a reliable test before therapy? J Voice 2013;27:84–9.https://doi.org/10.1016/j.jvoice.2012.08.006
83. de Bortoli N, Nacci A, Savarino E, Martinucci I, Bellini M, Fattori B, et al. How many cases oflaryngopharyngeal reflux suspected by laryngoscopy are gastroesophageal reflux disease-related?World J Gastroenterol 2012;18:4363–70. https://doi.org/10.3748/wjg.v18.i32.4363
84. Sheikh I, Waghray A, Waghray N, Dong C, Wolfe MM. Consumer use of over-the-counter protonpump inhibitors in patients with gastroesophageal reflux disease. Am J Gastroenterol2014;109:789–94. https://doi.org/10.1038/ajg.2013.421
85. Boltin D, Zvidi I, Raskin M, Kayless H, Schmilovitz-Weiss H, Gingold-Belfer R, et al. Effect ofpostprandial administration of esomeprazole on reflux symptoms in gastroesophageal refluxdisease: a randomized, controlled trial. Dig Dis 2018;36:257–63. https://doi.org/10.1159/000489557
86. Xie Y, Bowe B, Li T, Xian H, Yan Y, Al-Aly Z. Risk of death among users of proton pump inhibitors:a longitudinal observational cohort study of United States veterans. BMJ Open 2017;7:e015735.https://doi.org/10.1136/bmjopen-2016-015735
87. Shiraev TP, Bullen A. Proton pump inhibitors and cardiovascular events: a systematic review.Heart Lung Circ 2018;27:443–50. https://doi.org/10.1016/j.hlc.2017.10.020
88. Pezeshkian S, Conway SE. Proton pump inhibitor use in older adults: long-term risks and steps fordeprescribing. Consult Pharm 2018;33:497–503. https://doi.org/10.4140/TCP.n.2018.497
89. Cheung KS, Chan EW, Wong AYS, Chen L, Wong ICK, Leung WK. Long-term proton pumpinhibitors and risk of gastric cancer development after treatment for Helicobacter pylori: apopulation-based study. Gut 2018;67:28–35. https://doi.org/10.1136/gutjnl-2017-314605
90. Wan Q-Y, Wu X-T, Li N, Du L, Zhou Y. Long-term proton pump inhibitors use and risk of gastriccancer: a meta-analysis of 926 386 participants. Gut 2018;68:762–4. https://doi.org/10.1136/gutjnl-2018-316416
91. Tvingsholm SA, Dehlendorff C, Østerlind K, Friis S, Jäättelä M. Proton pump inhibitor use andcancer mortality. Int J Cancer 2018;143:1315–26. https://doi.org/10.1002/ijc.31529
92. Wilkie MD, Fraser HM, Raja H. Gaviscon Advance alone versus co-prescription of GavisconAdvance and proton pump inhibitors in the treatment of laryngopharyngeal reflux. Eur ArchOtorhinolaryngol 2018;275:2515–21. https://doi.org/10.1007/s00405-018-5079-0
93. Koufman JA, Johnston N. Potential benefits of pH 8.8 alkaline drinking water as an adjunct in thetreatment of reflux disease. Ann Otol Rhinol Laryngol 2012;121:431–4. https://doi.org/10.1177/000348941212100702
94. Strugala V, Avis J, Jolliffe IG, Johnstone LM, Dettmar PW. The role of an alginate suspension onpepsin and bile acids – key aggressors in the gastric refluxate. Does this have implications forthe treatment of gastro-oesophageal reflux disease? J Pharm Pharmacol 2009;61:1021–8.https://doi.org/10.1211/jpp/61.08.0005
95. Milstein CF, Charbel S, Hicks DM, Abelson TI, Richter JE, Vaezi MF. Prevalence of laryngealirritation signs associated with reflux in asymptomatic volunteers: impact of endoscopic technique(rigid vs. flexible laryngoscope). Laryngoscope 2005;115:2256–61. https://doi.org/10.1097/01.mlg.0000184325.44968.b1
96. Ylitalo R, Lindestad PA, Hertegard S. Is pseudosulcus alone a reliable sign of gastroesophago-pharyngeal reflux? Clin Otolaryngol Allied Sci 2004;29:47–50. https://doi.org/10.1111/j.1365-2273.2004.00778.x
REFERENCES
NIHR Journals Library www.journalslibrary.nihr.ac.uk
70

97. Belafsky PC, Postma GN, Koufman JA. The association between laryngeal pseudosulcus andlaryngopharyngeal reflux. Otolaryngol Head Neck Surg 2002;126:649–52. https://doi.org/10.1067/mhn.2002.125603
98. Chang BA, MacNeil SD, Morrison MD, Lee PK. The reliability of the Reflux Finding Score amonggeneral otolaryngologists. J Voice 2015;29:572–7. https://doi.org/10.1016/j.jvoice.2014.10.009
99. Weber B, Portnoy JE, Castellanos A, Hawkshaw MJ, Lurie D, Katz PO, Sataloff RT. Efficacy ofanti-reflux surgery on refractory laryngopharyngeal reflux disease in professional voice users:a pilot study. J Voice 2014;28:492–500. https://doi.org/10.1016/j.jvoice.2013.12.009
100. Spyridoulias A, Lillie S, Vyas A, Fowler SJ. Detecting laryngopharyngeal reflux in patients withupper airways symptoms: symptoms, signs or salivary pepsin? Respir Med 2015;109:963–9.https://doi.org/10.1016/j.rmed.2015.05.019
101. Fusconi M, De Virgilio A, Conte M, Colicchio MG, Gallo A, Greco A, et al. The importance of thenumber of reflux episodes in the diagnosis of laryngopharyngeal reflux disease. Otolaryngol HeadNeck Surg 2013;148:261–6. https://doi.org/10.1177/0194599812466534
102. Wang AJ, Liang MJ, Jiang AY, Lin JK, Xiao YL, Peng S, et al. Predictors of acid suppression successin patients with chronic laryngitis. Neurogastroenterol Motil 2012;24:432–7. https://doi.org/10.1111/j.1365-2982.2011.01873.x
103. Cumpston EC, Blumin JH, Bock JM. Dual pH with multichannel intraluminal impedance testingin the evaluation of subjective laryngopharyngeal reflux symptoms. Otolaryngol Head Neck Surg2016;155:1014–20. https://doi.org/10.1177/0194599816665819
104. Peng L, Patel A, Kushnir V, Gyawali CP. Assessment of upper esophageal sphincter function onhigh-resolution manometry: identification of predictors of globus symptoms. J Clin Gastroenterol2015;49:95–100. https://doi.org/10.1097/MCG.0000000000000078
105. Tang Y, Huang J, Zhu Y, Qian A, Xu B, Yao W. Comparison of esophageal motility in gastroesophagealreflux disease with and without globus sensation. Rev Esp Enferm Dig 2017;109:850–5. https://doi.org/10.17235/reed.2017.4449/2016
106. Gray LP. The relationship of the ‘inferior constrictor swallow’ and ‘globus hystericus’ or thehypopharyngeal syndrome. J Laryngol Otol 1983;97:607–18. https://doi.org/10.1017/S0022215100094688
107. Fuchs HF, Müller DT, Berlth F, Maus MK, Fuchs C, Dübbers M, et al. Simultaneous laryngopharyngealpH monitoring (Restech) and conventional esophageal pH monitoring-correlation using a largepatient cohort of more than 100 patients with suspected gastroesophageal reflux disease.Dis Esophagus 2018;31. https://doi.org/10.1093/dote/doy018
108. Perng DW, Chang KT, Su KC, Wu YC, Wu MT, Hsu WH, et al. Exposure of airway epithelium tobile acids associated with gastroesophageal reflux symptoms: a relation to transforming growthfactor-beta1 production and fibroblast proliferation. Chest 2007;132:1548–56. https://doi.org/10.1378/chest.07-1373
109. Lechien JR, Huet K, Khalife M, Fourneau AF, Finck C, Delvaux V, et al. Gender differences in thepresentation of dysphonia related to laryngopharyngeal reflux disease: a case-control study.Eur Arch Otorhinolaryngol 2018;275:1513–24. https://doi.org/10.1007/s00405-018-4951-2
110. Gong EJ, Choi KD, Jung HK, Youn YH, Min BH, Song KH, Huh KC. Quality of life, patientsatisfaction, and disease burden in patients with gastroesophageal reflux disease with or withoutlaryngopharyngeal reflux symptoms. J Gastroenterol Hepatol 2017;32:1336–40. https://doi.org/10.1111/jgh.13716
111. Elsenbruch S, Enck P. Placebo effects and their determinants in gastrointestinal disorders. Nat RevGastroenterol Hepatol 2015;12:472–85. https://doi.org/10.1038/nrgastro.2015.117
DOI: 10.3310/hta25030 HEALTH TECHNOLOGY ASSESSMENT 2021 VOL. 25 NO. 3
© Queen’s Printer and Controller of HMSO 2021. This work was produced by Wilson et al. under the terms of a commissioning contract issued by the Secretary of State forHealth and Social Care. This issue may be freely reproduced for the purposes of private research and study and extracts (or indeed, the full report) may be included in professionaljournals provided that suitable acknowledgement is made and the reproduction is not associated with any form of advertising. Applications for commercial reproduction shouldbe addressed to: NIHR Journals Library, National Institute for Health Research, Evaluation, Trials and Studies Coordinating Centre, Alpha House, University of Southampton SciencePark, Southampton SO16 7NS, UK.
71

112. Garcia-Campayo J, Sanz-Carrillo C. A review of the differences between somatizing andpsychologizing patients in primary care. Int J Psychiatry Med 1999;29:337–45. https://doi.org/10.2190/FMJ2-UK3Y-FKB8-DCGN
113. Weijenborg PW, de Schepper HS, Smout AJPM, Bredenoord AJ. Effects of antidepressants inpatients with functional esophageal disorders or gastroesophageal reflux disease: asystematicreview. Clin Gastroenterol Hepatol 2015;13:251–9.e1. https://doi.org/10.1016/j.cgh.2014.06.025
114. Deary IJ, Wilson JA. Problems in treating globus pharyngis. Clin Otolaryngol Allied Sci1994;19:55–60. https://doi.org/10.1111/j.1365-2273.1994.tb01148.x
115. Gale CR, Wilson JA, Deary IJ. Globus sensation and psychopathology in men: the Vietnamexperience study. Psychosom Med 2009;71:1026–31. https://doi.org/10.1097/PSY.0b013e3181bc7739
116. Okland TS, Gonzalez JR, Ferber AT, Mann SE. Association between patient review of systemsscore and somatization. JAMA Otolaryngol Head Neck Surg 2017;143:870–5. https://doi.org/10.1001/jamaoto.2017.0671
117. Chen D-Y, Jia L, Gu X, Jiang S-M, Xie H-L, Xu J. Comparison of paroxetine and amitriptyline inthe treatment of refractory globus pharyngeus. Dig Liver Dis 2016;48:1012–7. https://doi.org/10.1016/j.dld.2016.05.025
118. Liu Y, Jia L, Jiang SM, Chen DY, Song JS, Xu J. Serotonin Transporter Gene (SLC6A4) polymorphismmay be associated with Chinese globus pharyngeus and its antidepressant effects. Digestion2018;97:146–53. https://doi.org/10.1159/000484202
119. Zhou W-C, Jia L, Chen D-Y, Liu Y, Liu J, Jiang SM, et al. The effects of paroxetine andamitriptyline on the upper esophageal sphincter (UES) pressure and its natural history in globuspharyngeus. Dig Liver Dis 2017;49:757–63. https://doi.org/10.1016/j.dld.2017.02.008
120. Rommel N, Van Oudenhove L, Arts J, Caenepeel P, Tack J, Pauwels A. Esophageal sensorimotorfunction and psychological factors each contribute to symptom severity in globus patients. Am JGastroenterol 2016;111:1382–8. https://doi.org/10.1038/ajg.2016.302
121. Nevalainen P, Walamies M, Kruuna O, Arkkila P, Aaltonen LM. Supragastric belch may be relatedto globus symptom – a prospective clinical study. Neurogastroenterol Motil 2016;28:680–6.https://doi.org/10.1111/nmo.12764
122. Zerbib F, Dulery C. Facts and fantasies on extraesophageal reflux: a gastroenterologist perspective.J Clin Gastroenterol 2017;51:769–76. https://doi.org/10.1097/MCG.0000000000000918
123. Tytgat GN. Clinical efficacy of sucralfate in reflux oesophagitis. Scand J Gastroenterol Suppl1987;140:29–31.
124. Savarino E, Zentilin P, Marabotto E, Pellegatta G, Coppo C, Brunacci M, et al. Drugs for improvingesophageal mucosa defense: where are we now and where are we going? Ann Gastroenterol2017;30:585–91. https://doi.org/10.20524/aog.2017.0187
125. Ness-Jensen E, Hveem K, El-Serag H, Lagergren J. Lifestyle intervention in gastroesophageal refluxdisease. Clin Gastroenterol Hepatol 2016;14:175–82.e1-3. https://doi.org/10.1016/j.cgh.2015.04.176
126. Scott DR, Simon RA. Supraesophageal reflux: correlation of position and occurrence of acidreflux-effect of head-of-bed elevation on supine reflux. J Allergy Clin Immunol Pract2015;3:356–61. https://doi.org/10.1016/j.jaip.2014.11.019
127. Daniilidou P, Carding P, Wilson J, Drinnan M, Deary V. Cognitive behavioral therapy for functionaldysphonia: a pilot study. Ann Otol Rhinol Laryngol 2007;116:717–22. https://doi.org/10.1177/000348940711601002
REFERENCES
NIHR Journals Library www.journalslibrary.nihr.ac.uk
72

128. Deary V, Miller T. Reconsidering the role of psychosocial factors in functional dysphonia.Curr Opin Otolaryngol Head Neck Surg 2011;19:150–4. https://doi.org/10.1097/MOO.0b013e328346494d
129. Deary V, McColl E, Carding P, Miller T, Wilson J. A psychosocial intervention for the managementof functional dysphonia: complex intervention development and pilot randomised trial. PilotFeasibility Stud 2018;4:46. https://doi.org/10.1186/s40814-018-0240-5
130. Martín-Merino E, Ruigómez A, García Rodríguez LA, Wallander MA, Johansson S. Depression andtreatment with antidepressants are associated with the development of gastro-oesophageal refluxdisease. Aliment Pharmacol Ther 2010;31:1132–40. https://doi.org/10.1111/j.1365-2036.2010.04280.x
131. Khalil HS, Reddy VM, Bos-Clark M, Dowley A, Pierce M, Morris C, Jones A. Speech therapy in thetreatment of globus pharyngeus: how we do it. Clin Otolaryngol 2011;36:388–92. https://doi.org/10.1111/j.1749-4486.2011.02326.x
DOI: 10.3310/hta25030 HEALTH TECHNOLOGY ASSESSMENT 2021 VOL. 25 NO. 3
© Queen’s Printer and Controller of HMSO 2021. This work was produced by Wilson et al. under the terms of a commissioning contract issued by the Secretary of State forHealth and Social Care. This issue may be freely reproduced for the purposes of private research and study and extracts (or indeed, the full report) may be included in professionaljournals provided that suitable acknowledgement is made and the reproduction is not associated with any form of advertising. Applications for commercial reproduction shouldbe addressed to: NIHR Journals Library, National Institute for Health Research, Evaluation, Trials and Studies Coordinating Centre, Alpha House, University of Southampton SciencePark, Southampton SO16 7NS, UK.
73


Appendix 1 Screening, recruitment andwithdrawal data
The site and time course of screening and recruitment are summarised in Tables 26 and 27.
Numbers analysed
Those participants included in each of the analysis sets are summarised in Table 28.
The stratified subgroups are summarised in Table 29. Table 29 shows the balance over treatment groups interms of the baseline severity measured by RSI-HB, with a cut-off score of 20.
During the course of the trial, during analysis of recruitment data for DMC meetings, it was discoveredthat some patients were mis-stratified in terms of baseline severity, defined by their RSI-HB scores. Thisaffected approximately 10% of patients, as outlined in Table 30.
Ineligible patients
Despite treatment withdrawal, patients were followed up in the trial whenever possible. All primarystatistical analyses were carried out on an ITT basis, retaining patients in their randomised treatmentgroups and including protocol-violator and ineligible patients. Ineligible patients were classed as thoserandomised patients who were subsequently found not to have adhered to the eligibility criteria of thetrial. Four ineligible patients were reported (Table 31).
A sensitivity analysis was not carried out as the ineligibility rate was not excessive (1%).
TABLE 26 Numbers of patients screened and recruited, by site
Site
Number of patients
Screened Recruited (based on MACRO)
Birmingham 31 10
Brighton 50 9
Glasgow 462 39
Manchester 116 27
Newcastle 399 133
Nottingham 178 70
Stockport 17 11
Sunderland 174 47
Total 1427 346
DOI: 10.3310/hta25030 HEALTH TECHNOLOGY ASSESSMENT 2021 VOL. 25 NO. 3
© Queen’s Printer and Controller of HMSO 2021. This work was produced by Wilson et al. under the terms of a commissioning contract issued by the Secretary of State forHealth and Social Care. This issue may be freely reproduced for the purposes of private research and study and extracts (or indeed, the full report) may be included in professionaljournals provided that suitable acknowledgement is made and the reproduction is not associated with any form of advertising. Applications for commercial reproduction shouldbe addressed to: NIHR Journals Library, National Institute for Health Research, Evaluation, Trials and Studies Coordinating Centre, Alpha House, University of Southampton SciencePark, Southampton SO16 7NS, UK.
75

TABLE 27 Pattern of recruitment over time, by site
Site
Year
2014 2015
May June July August September October November December January February March April May June July August September October
Newcastle 1 3 2 3 4 5 4 5 4 3 1 7 7 6 6 3 4 6
Sunderland 3 2 2 2 2 1 0 0 4 0 0 0 0 0 0 0
Nottingham 1 3 7 4 3 4 2 2 0 6 0 1 3 4 1
Brighton 2 3 2 0 0 0 1
Manchester 1 1 0 1 2 0 3
Glasgow 2 0 3
Birmingham
Stockport
Month total 1 3 5 6 9 14 10 9 8 5 7 10 17 8 8 10 8 14
Green shading shows when sites were open and recruiting.
APPEN
DIX
1
NIHRJournals
Librarywww.journalslibrary.nihr.ac.uk
76

Site
Year
2015 2016 2017
TotalNovember December January February March April May June July August September October November December January February
Newcastle 1 7 4 6 2 3 7 0 4 5 6 2 6 1 5 0 133
Sunderland 0 0 1 1 5 2 4 8 0 1 0 5 2 0 1 1 47
Nottingham 4 2 4 3 1 2 0 1 2 2 1 2 0 2 1 2 70
Brighton 1 0 0 0 0 0 0 0 0 0 0 0 0 0 0 0 9
Manchester 0 0 0 2 2 3 1 1 3 0 1 1 0 1 1 3 27
Glasgow 3 4 3 1 2 4 2 0 1 5 2 1 0 2 3 1 39
Birmingham 2 0 1 0 0 2 1 0 1 2 1 0 0 0 10
Stockport 1 1 0 1 1 1 1 2 1 0 2 0 11
Month total 9 13 14 13 14 15 14 13 12 14 12 15 10 6 13 7 346
Green shading shows when sites were open and recruiting.
TABLE 27 Pattern of recruitment over time, by site (continued )
DOI:10.3310/hta25030
HEA
LTHTECH
NOLO
GYASSESSM
ENT2021
VOL.25
NO.3
©Queen
’sPrinter
andController
ofHMSO
2021.This
work
was
producedby
Wilson
etal.
underthe
termsof
acom
missioning
contractissued
bythe
Secretaryof
Statefor
Health
andSocialC
are.This
issuemay
befreely
reproducedfor
thepurposes
ofprivate
researchand
studyand
extracts(or
indeed,the
fullreport)may
beincluded
inprofessional
journalsprovided
thatsuitable
acknowledgem
entismade
andthe
reproductionisnot
associatedwith
anyform
ofadvertising.
Applications
forcom
mercialreproduction
shouldbe
addressedto:
NIHRJournals
Library,NationalInstitute
forHealth
Research,Evaluation,
Trialsand
StudiesCoordinating
Centre,
Alpha
House,
University
ofSoutham
ptonScience
Park,Southam
ptonSO
167N
S,UK.
77

TABLE 28 Definitions of participant groups for analysis
Time from randomisation to primary end-point visit (visit 2)
Overall
Treatment group
Lansoprazole Placebo
Number ofparticipants
Number withRSI at visit 2
Number ofparticipants
Number withRSI at visit 2
Number ofparticipants
Number withRSI at visit 2
< 10 weeks 6 3 2 1 4 2
Between 10 and 14 weeks 5 5 2 2 3 3
Between 14 and 18 weeks (protocol compliance) 185 178 87 82 98 96
Between 18 and 20 weeks 44 42 21 20 23 22
Compliant ITT group (14 to 20 weeks) 229 220 108 102 121 118
Between 20 and 25 weeks 25 25 14 14 11 11
Between 25 and 30 weeks 8 8 3 3 5 5
> 30 weeks 10 6 6 5 4 1
Pragmatic ITT group (all visit 2 at any time) 283 267 135 127 148 140
Missing (16-week visit, RSI visit 2 = RSI at 16 weeks) 63 79 37 45 26 34
Total number randomised 346 346 172 172 174 174
APPEN
DIX
1
NIHRJournals
Librarywww.journalslibrary.nihr.ac.uk
78
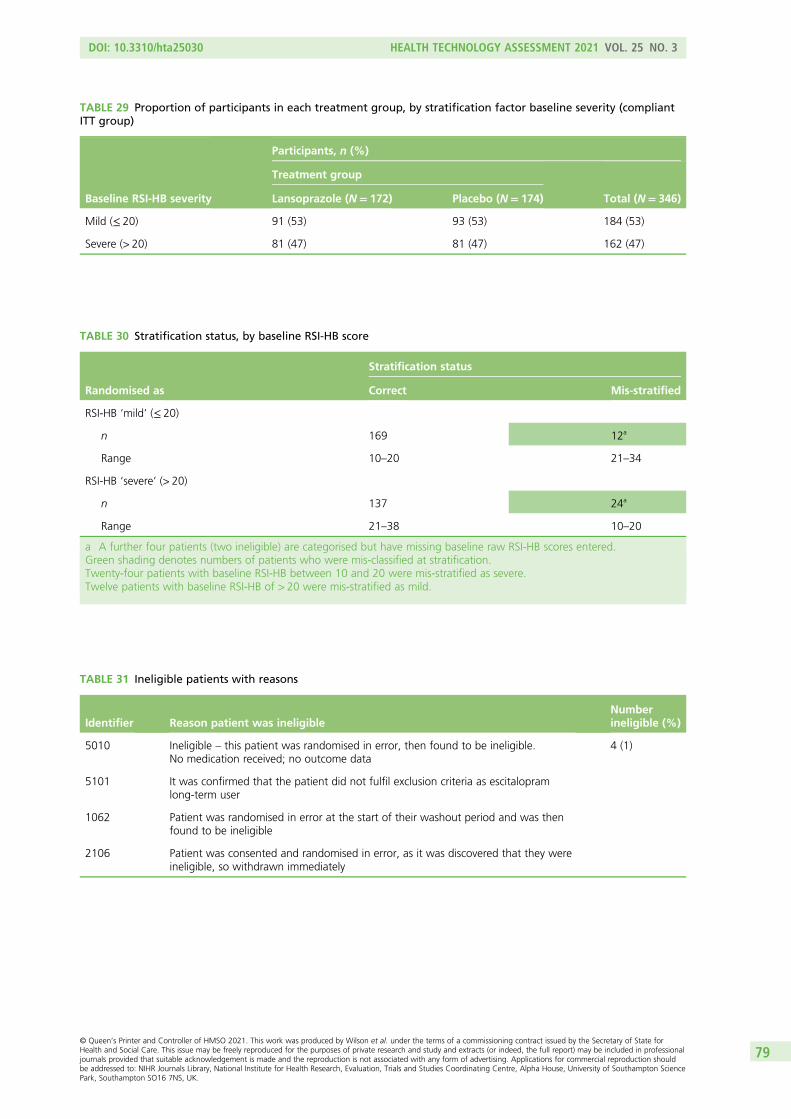
TABLE 30 Stratification status, by baseline RSI-HB score
Randomised as
Stratification status
Correct Mis-stratified
RSI-HB ‘mild’ (≤ 20)
n 169 12a
Range 10–20 21–34
RSI-HB ‘severe’ (> 20)
n 137 24a
Range 21–38 10–20
a A further four patients (two ineligible) are categorised but have missing baseline raw RSI-HB scores entered.Green shading denotes numbers of patients who were mis-classified at stratification.Twenty-four patients with baseline RSI-HB between 10 and 20 were mis-stratified as severe.Twelve patients with baseline RSI-HB of > 20 were mis-stratified as mild.
TABLE 31 Ineligible patients with reasons
Identifier Reason patient was ineligibleNumberineligible (%)
5010 Ineligible – this patient was randomised in error, then found to be ineligible.No medication received; no outcome data
4 (1)
5101 It was confirmed that the patient did not fulfil exclusion criteria as escitalopramlong-term user
1062 Patient was randomised in error at the start of their washout period and was thenfound to be ineligible
2106 Patient was consented and randomised in error, as it was discovered that they wereineligible, so withdrawn immediately
TABLE 29 Proportion of participants in each treatment group, by stratification factor baseline severity (compliantITT group)
Baseline RSI-HB severity
Participants, n (%)
Treatment group
Total (N= 346)Lansoprazole (N= 172) Placebo (N= 174)
Mild (≤ 20) 91 (53) 93 (53) 184 (53)
Severe (> 20) 81 (47) 81 (47) 162 (47)
DOI: 10.3310/hta25030 HEALTH TECHNOLOGY ASSESSMENT 2021 VOL. 25 NO. 3
© Queen’s Printer and Controller of HMSO 2021. This work was produced by Wilson et al. under the terms of a commissioning contract issued by the Secretary of State forHealth and Social Care. This issue may be freely reproduced for the purposes of private research and study and extracts (or indeed, the full report) may be included in professionaljournals provided that suitable acknowledgement is made and the reproduction is not associated with any form of advertising. Applications for commercial reproduction shouldbe addressed to: NIHR Journals Library, National Institute for Health Research, Evaluation, Trials and Studies Coordinating Centre, Alpha House, University of Southampton SciencePark, Southampton SO16 7NS, UK.
79
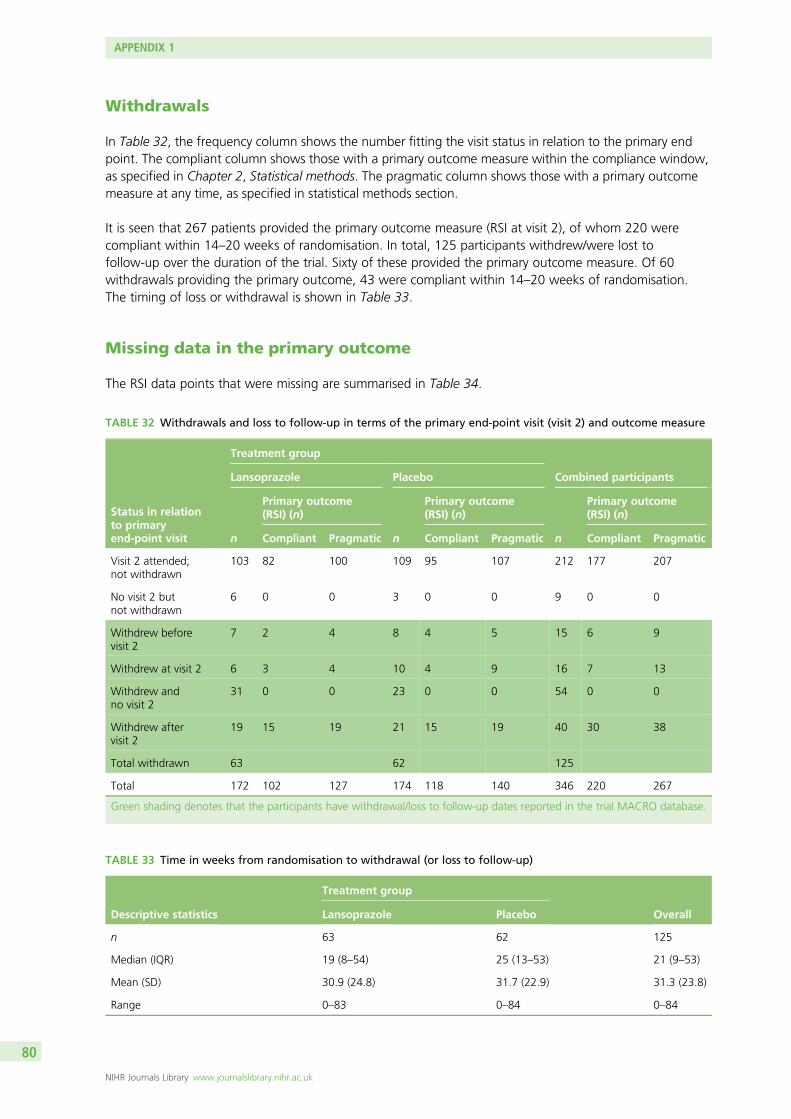
Withdrawals
In Table 32, the frequency column shows the number fitting the visit status in relation to the primary endpoint. The compliant column shows those with a primary outcome measure within the compliance window,as specified in Chapter 2, Statistical methods. The pragmatic column shows those with a primary outcomemeasure at any time, as specified in statistical methods section.
It is seen that 267 patients provided the primary outcome measure (RSI at visit 2), of whom 220 werecompliant within 14–20 weeks of randomisation. In total, 125 participants withdrew/were lost tofollow-up over the duration of the trial. Sixty of these provided the primary outcome measure. Of 60withdrawals providing the primary outcome, 43 were compliant within 14–20 weeks of randomisation.The timing of loss or withdrawal is shown in Table 33.
Missing data in the primary outcome
The RSI data points that were missing are summarised in Table 34.
TABLE 32 Withdrawals and loss to follow-up in terms of the primary end-point visit (visit 2) and outcome measure
Status in relationto primaryend-point visit
Treatment group
Combined participantsLansoprazole Placebo
n
Primary outcome(RSI) (n)
n
Primary outcome(RSI) (n)
n
Primary outcome(RSI) (n)
Compliant Pragmatic Compliant Pragmatic Compliant Pragmatic
Visit 2 attended;not withdrawn
103 82 100 109 95 107 212 177 207
No visit 2 butnot withdrawn
6 0 0 3 0 0 9 0 0
Withdrew beforevisit 2
7 2 4 8 4 5 15 6 9
Withdrew at visit 2 6 3 4 10 4 9 16 7 13
Withdrew andno visit 2
31 0 0 23 0 0 54 0 0
Withdrew aftervisit 2
19 15 19 21 15 19 40 30 38
Total withdrawn 63 62 125
Total 172 102 127 174 118 140 346 220 267
Green shading denotes that the participants have withdrawal/loss to follow-up dates reported in the trial MACRO database.
TABLE 33 Time in weeks from randomisation to withdrawal (or loss to follow-up)
Descriptive statistics
Treatment group
OverallLansoprazole Placebo
n 63 62 125
Median (IQR) 19 (8–54) 25 (13–53) 21 (9–53)
Mean (SD) 30.9 (24.8) 31.7 (22.9) 31.3 (23.8)
Range 0–83 0–84 0–84
APPENDIX 1
NIHR Journals Library www.journalslibrary.nihr.ac.uk
80

TABLE 34 Number of RSI items at baseline and 16-week follow-up, with follow-up completed at various times afterrandomisation
VisitRSI completeness(total= nine items)
Participants, n (%)
Treatment group
Total(N= 346)
Lansoprazole(N= 172)
Placebo(N= 174)
Baseline (visit 1) 9 items 171 (99) 171 (98) 342 (99)
1–8 items 0 (0) 2 (1) 2 (< 1)
Missing 1 (< 1) 1 (< 1) 2 (< 1)
16-week visit (visit 2) (per protocol),14–18 weeks post randomisation
9 items 82 (48) 96 (55) 178 (51)
Missinga 5 (3) 2 (1) 7 (2)
16-week visit (visit 2) (compliant ITT),14–20 weeks post randomisation
9 items 102 (59) 118 (68) 220 (64)
Missinga 6 (3) 3 (2) 9 (3)
16-week visit (visit 2) (pragmatic ITT group),any time
9 items 127 (74) 140 (80) 267 (77)
Missinga 8 (5) 8 (5) 16 (5)
No visit 2 at 16 weeks Missingb 37 (22) 26 (15) 63 (18)
a Those denoted as missing at visit 2 have a visit date recorded but no RSI at that visit.b No visit 2 date or corresponding RSI recorded.
DOI: 10.3310/hta25030 HEALTH TECHNOLOGY ASSESSMENT 2021 VOL. 25 NO. 3
© Queen’s Printer and Controller of HMSO 2021. This work was produced by Wilson et al. under the terms of a commissioning contract issued by the Secretary of State forHealth and Social Care. This issue may be freely reproduced for the purposes of private research and study and extracts (or indeed, the full report) may be included in professionaljournals provided that suitable acknowledgement is made and the reproduction is not associated with any form of advertising. Applications for commercial reproduction shouldbe addressed to: NIHR Journals Library, National Institute for Health Research, Evaluation, Trials and Studies Coordinating Centre, Alpha House, University of Southampton SciencePark, Southampton SO16 7NS, UK.
81


Appendix 2 Details of patients in relation toper-treatment analysis and concomitant medications
Per-treatment analysis
IssueIn most cases in the per-treatment analysis group, medication was dispensed on the same day asrandomisation. Four patients did not receive their trial medication at the baseline visit and in a further sixthere was no note of IMP being issued. However, details of returned medication at the primary end pointshow that all 10 did receive IMP and they are included in the per-treatment set.
Washout period for prior anti-reflux medicationRecent PPI use is summarised in Table 35.
Full washout data were available for 64 out of 68 participants who reported discontinuing PPI use in theprevious 12 months (Table 36).
The median washout period was 6 weeks. In total, five participants started the trial treatment < 4 weeksafter stopping using another PPI. Two were excluded from per-treatment analysis; the other three hadbetween 1 day and 1 week of washout and were included.
TABLE 35 Recent PPI use at randomisation
PPI use
Participants, n (%)
Treatment group
Total (N= 262)Lansoprazole (N= 126) Placebo (N= 136)
PPI used in last 12 months?
Yes 31 (25) 39 (29) 70a (27)
No 95 (75) 97 (71) 192 (73)
a 68 out of 70 who said they had been using PPI in the previous 12 months had stopped using it; two were still using itwhen screened.
TABLE 36 The washout period
Washout period (weeks)
Treatment group
Total (N= 64)Lansoprazole (N= 30) Placebo (N= 34)
Washout period, n 30 34 64
Median (IQR) 5.9 (4.6–8.6) 6.9 (5.0–11.1) 6.1 (4.9–9.8)
Mean (SD) 8.5 (8.5) 9.6 (7.1) 9.1 (7.8)
Range 0.1–44.4 0.6–27.6 0.1–44.4
DOI: 10.3310/hta25030 HEALTH TECHNOLOGY ASSESSMENT 2021 VOL. 25 NO. 3
© Queen’s Printer and Controller of HMSO 2021. This work was produced by Wilson et al. under the terms of a commissioning contract issued by the Secretary of State forHealth and Social Care. This issue may be freely reproduced for the purposes of private research and study and extracts (or indeed, the full report) may be included in professionaljournals provided that suitable acknowledgement is made and the reproduction is not associated with any form of advertising. Applications for commercial reproduction shouldbe addressed to: NIHR Journals Library, National Institute for Health Research, Evaluation, Trials and Studies Coordinating Centre, Alpha House, University of Southampton SciencePark, Southampton SO16 7NS, UK.
83

Compliance with dosage of investigational medicinal productThe time (number of days) on the treatment (T) was calculated as the date of the 16-week follow-up clinicvisit minus the date of randomisation, when the trial drug was dispended. The assumed dose is time onthe treatment (T) multiplied by 2 to establish the number of capsules expected to have been taken fromcommencement of treatment (nE). The number of capsules received by patients (nP) after randomisation(238 in each kit) was not explicitly recorded in MACRO and was therefore imputed for each patient.The number of capsules returned (nR) at the 16-week follow-up visit was recorded in MACRO. The observeddose is the number of capsules taken during the course of treatment (nO) is calculated as (nP) – (nR). Thepercentage of the protocol dose taken is calculated as (nO)/(nE) × 100.
Note that it is possible to have an assumed percentage dose of ≥ 100% if time on treatment × 2 is greaterthan the number of capsules provided in the kit. This is truncated to be 100% in Table 37, which showsassumed doses taken based on time between dispensing and primary end-point visit, when unusedcapsules were returned.
Forty-two per cent of patients reported taking the full dose, balanced across randomised groups, and 70%of patients reported taking ≥ 90% of the dose, balanced across groups. The median percentage taking theprotocol dose is 99% (IQR 86–100%).
The maximum time on treatment is 17 weeks, as per IMP supplied. There were 81 participants, 45 in thelansoprazole group, who did not have any information for the number of capsules returned so wereomitted from the per-treatment analysis group. The 81 participants comprised:
l 57 who consented to the trial but did not attend primary end-point visit 2l 13 who attended the primary end-point visit, some with primary outcome measure, but had no
information on returned capsulesl six who did not attend the primary end-point visit, had no primary outcome measure or any information
on returned capsulesl five others, of whom three stopped owing to requirement for other medications; one had only a 2-day
suspension of treatment; one was lost.
There were five participants with reasons for stopping taking trial medication but no indication as to howmany capsules had been taken, or were returned. Three patients took no medication.
TABLE 37 Assessment of doses taken per protocol
Dose
Treatment group
Total (N= 262)Lansoprazole (N= 126) Placebo (N= 136)
n (%) of patients assumed to have taken full or partial dose
100% 50 (40) 61 (45) 111 (42)
90–99% 35 (28) 38 (28) 73 (28)
< 90% 41 (33) 37 (27) 78 (30)
Assumed doses used
Median (IQR) 222 (190–238) 228 (206–238) 224 (198–238)
% protocol dose
Median (IQR) 97 (83–100) 99 (89–100) 99 (86–100)
APPENDIX 2
NIHR Journals Library www.journalslibrary.nihr.ac.uk
84

Reasons for discontinuing medicationCommon reasons for discontinuing or interrupting IMP were as follows:
l lansoprazole, n = 33 (some multiple)
¢ rash, n = 3¢ upper gastrointestinal symptoms, n = 8¢ lower gastrointestinal symptoms, n = 6¢ holidays, n = 5 (mostly interruptions)¢ headaches; unrelated new medical event – miscarriage/diagnosis polyarthritis; erratic eating
patterns; concern about medication load; lack of benefit; 1 week’s antibiotics, GP prescribedanother PPI, belief that symptoms were endocrine in origin.
l placebo, n = 30
¢ upper gastrointestinal symptoms, n = 3¢ lower gastrointestinal symptoms, n = 2¢ holidays, n = 9 (mostly interruptions)¢ headaches (n = 3); breathing difficulty; erratic eating pattern; concern about medication load; lack of
benefit; unrelated new medical events (n = 2); antibiotics or other temporary therapy needed (n = 3),prescribed another PPI.
Concomitant medication
Some form of antacid medication was taken by five participants out of the total cohort at baseline (four inthe lansoprazole group). At the end of therapy, six of the lansoprazole group and seven of the placebogroup were taking antacid remedies of one sort or another. This had changed to 30 and 25, respectively,at 12 months – a notable rise bearing in mind the smaller total sample at this later time point.
DOI: 10.3310/hta25030 HEALTH TECHNOLOGY ASSESSMENT 2021 VOL. 25 NO. 3
© Queen’s Printer and Controller of HMSO 2021. This work was produced by Wilson et al. under the terms of a commissioning contract issued by the Secretary of State forHealth and Social Care. This issue may be freely reproduced for the purposes of private research and study and extracts (or indeed, the full report) may be included in professionaljournals provided that suitable acknowledgement is made and the reproduction is not associated with any form of advertising. Applications for commercial reproduction shouldbe addressed to: NIHR Journals Library, National Institute for Health Research, Evaluation, Trials and Studies Coordinating Centre, Alpha House, University of Southampton SciencePark, Southampton SO16 7NS, UK.
85


Appendix 3 Baseline data: itemised severityscores for Reflux Symptom Index; Reflux FindingScore scoring
T able 38 gives the itemised scores for the total population at baseline.
There were a few very minor differences when considering the compliant population baseline RSI scores(Table 39).
Reflux Finding Score scoring schema and data recording
The RFS total values range between 0 and 26, including items for different subsites of the larynx, indicatinglevel of abnormality. An outline of these areas and the range of scores for each item are shown in Table 40.37
The ranking for each subsite is seen to be inconsistent. Some items have dichotomous scoring, others a5-point score. The maximum score per feature is not uniform.
TABLE 38 Itemised scores for RSI (item range: 0–5) for the trial population (n = 342a)
RSI item Mean SD Median IQR
1 – hoarseness 2.4 1.6 3 1–4
2 – throat clearing 3.4 1.3 4 3–4
3 – excess throat mucus 2.9 1.6 3 2–4
4 – difficulty swallowing 1.7 1.6 2 0–3
5 – coughing after eating or lying down 2.1 1.6 2 0–3
6 – breathing difficulties 1.6 1.6 1 0–3
7 – troublesome cough 2.5 1.7 3 1–4
8 – lump in throat 3.5 1.4 4 3–5
9 – heartburn 1.8 1.6 1.5 0–3
a Note that four patients did not have RSI baseline scores.
TABLE 39 Differences in itemised baseline RSI scores in the compliant ITT group (n= 220)
RSI item Mean SD Median IQR
3 – excess throat mucus 1.5
4 – difficulty swallowing 1.6 2
5 – coughing after eating or lying down 2.2 1.7 2 1–3.5
8 – lump in throat 1.5
9 – heartburn 1.9 2
DOI: 10.3310/hta25030 HEALTH TECHNOLOGY ASSESSMENT 2021 VOL. 25 NO. 3
© Queen’s Printer and Controller of HMSO 2021. This work was produced by Wilson et al. under the terms of a commissioning contract issued by the Secretary of State forHealth and Social Care. This issue may be freely reproduced for the purposes of private research and study and extracts (or indeed, the full report) may be included in professionaljournals provided that suitable acknowledgement is made and the reproduction is not associated with any form of advertising. Applications for commercial reproduction shouldbe addressed to: NIHR Journals Library, National Institute for Health Research, Evaluation, Trials and Studies Coordinating Centre, Alpha House, University of Southampton SciencePark, Southampton SO16 7NS, UK.
87

Not all laryngeal images were rated using the RFS. Some images were unusable owing to poor quality,particularly from one of the sites where equipment was of a lower grade. In the early stages of the trial,there was a problem with matching the TOPPITS trial identifier to patients’ names and this created potentialtranscription errors before independent assessment. This issue was addressed in the early phase of the trial.Any rating with uncertainty of the identified subject was excluded from the analysis of the trial. Some imageswere submitted to the secure server twice and were consequently rated twice. When there were two ratingsand confidence in the identified trial number, the chronologically first rating was used throughout.
In all, 363 assessments had both a validated identifier and a RFS. Of these, 107 were duplicates, leaving256 unique identifiable RFS assessments.
In summary, the patient identifier attributable to a small number of images was not certain. There were alsosome unusable images owing to poor image quality, particularly from one of the sites where equipmentwas of a lower grade.
TABLE 40 Scoring scheme for the RFS assessment (as originally published by Belafsky et al.37)
Assessment item Scoring options
Subglottic oedema 0 absent, 2 present
Ventricular obliteration 0 absent, 2 partial, 4 complete
Erythema/hyperaemia 0 absent, 2 arytenoids involved, 4 diffuse
Vocal fold oedema 0 absent, 1 mild, 2 moderate, 3 severe, 4 polypoid
Diffuse laryngeal oedema 0 absent, 1 mild, 2 moderate, 3 severe, 4 obstructing
Posterior commissure hypertrophy 0 absent, 1 mild, 2 moderate, 3 severe, 4 obstructing
Granuloma/granulation 0 absent, 2 present
Thick mucus 0 absent, 2 present
APPENDIX 3
NIHR Journals Library www.journalslibrary.nihr.ac.uk
88

Appendix 4 Multivariable analysis of RefluxSymptom Index minus the heartburn/dyspepsia itemfor the compliant intention-to-treat group
Analysis of covariance for secondary analysis Reflux Symptom Indexminus the heartburn/dyspepsia item: compliant intention-to-treat group
The outcome measure RSI-HB score after 16 weeks was initially analysed using ANCOVA methods in orderto compare the 16-week RSI-HB scores between the treatment groups while adjusting for potentialconfounders. The ANCOVA results are shown in Table 41.
Adjusted for the effects of site and baseline severity, there is evidence of statistically significant differencein RSI-HB at 16 weeks between randomised treatment groups (p = 0.026) but not in favour of activeintervention. There is evidence of dependence on baseline severity (p < 0.001). The randomised treatmentgroup is not statistically significant when adjusted for other baseline factors. ANCOVA adjusted forstratification variables and other important baseline factors of RSI-HB for the compliant ITT group showedthat the average RSI-HB score at 16 weeks in the lansoprazole and placebo groups remained no differentonce taking into account age, sex, smoking status, alcohol consumption and BMI.
Modelling was then undertaken as with the total RSI score.
Model 1Model 1 adjusted for stratification factors used at randomisation [recruiting centre (as a random effect) andbaseline severity as defined by the binary RSI-HB cut-off value of 20 (as a fixed effect) as covariates in theanalysis] (Table 42).
There is no statistically significant benefit of lansoprazole, although there is an apparent difference betweenrandomised treatment groups when adjusted for site and baseline binary RSI-HB score. The estimateddifference between randomised groups, when accounting for site and baseline severity, estimates thatlansoprazole patients have RSI-HB scores at 16 weeks that are 2.5 points higher (worse) than those ofplacebo patients (95% CI 0.4 to 4.6; p = 0.02). RSI-HB at baseline is confirmed as being statisticallysignificantly related to 16-week RSI-HB score and is justified as a stratification factor in the trial design.Patients with severe RSI-HB at baseline are estimated to have RSI-HB scores that are 7.5 points higher (worse)at 16 weeks. The underlying assumptions of the model were not substantially violated.
TABLE 41 The RSI-HB scores at the 16-week follow-up, as response with adjustment for site and baseline severity
Source Partial SS df Mean square F-ratio p-value
Model 4854.794 9 539.422 8.20 < 0.001
Arm 329.700 1 329.700 5.01 0.026
Site 1646.931 7 235.276 3.58 0.001a
Baseline severity 2880.361 1 2880.361 43.80 < 0.001
Residual 13,809.206 210 65.758
Total 18,664.000 219 85.224
df, degrees of freedom; SS, sum of squares.a Site is not a reliable estimate as it cannot be modelled properly in ANCOVA.Adjusted R2 = 0.228, n = 220.
DOI: 10.3310/hta25030 HEALTH TECHNOLOGY ASSESSMENT 2021 VOL. 25 NO. 3
© Queen’s Printer and Controller of HMSO 2021. This work was produced by Wilson et al. under the terms of a commissioning contract issued by the Secretary of State forHealth and Social Care. This issue may be freely reproduced for the purposes of private research and study and extracts (or indeed, the full report) may be included in professionaljournals provided that suitable acknowledgement is made and the reproduction is not associated with any form of advertising. Applications for commercial reproduction shouldbe addressed to: NIHR Journals Library, National Institute for Health Research, Evaluation, Trials and Studies Coordinating Centre, Alpha House, University of Southampton SciencePark, Southampton SO16 7NS, UK.
89

Model 2Model 2 adjusted for the stratification factor recruiting centre (as a random effect) at randomisation andfor baseline severity in terms of RSI-HB as a continuous measure (as a fixed effect) (Table 43).
When adjusted for site and continuous baseline severity RSI-HB, the placebo group again shows a greaterreduction in symptoms. The estimated difference between randomised groups, when accounting for siteand baseline severity, indicates that lansoprazole patients have RSI-HB scores at 16 weeks that are 2.0 points
TABLE 42 The RSI-HB results of multilevel mixed-effect linear regression (model 1) (compliant ITT group) (n= 220)
Model Type Beta SE Test statistic p-value 95% CI (beta)
Group: lansoprazole(reference = placebo)
Fixed 2.489 1.086 2.29 0.022 0.360 to 4.617
Site (reference = Birmingham)
Brighton Random –4.468 4.424 –1.01 0.312 –13.138 to 4.202
Glasgow 0.273 3.255 0.08 0.933 –6.106 to 6.653
Manchester 6.265 3.347 1.87 0.061 –0.294 to 12.825
Newcastle –0.542 2.852 –0.19 0.849 –6.131 to 5.047
Nottingham –4.423 2.833 –1.56 0.118 –9.977 to 1.130
Stockport –2.671 3.767 –0.71 0.478 –10.054 to 4.712
Sunderland –1.992 3.010 –0.66 0.508 –7.892 to 3.907
RSI-HB baselineseverity: severe(reference = mild)
Fixed 7.490 1.106 6.77 < 0.001 5.323 to 9.657
Constant 11.681 2.849 4.10 < 0.001 6.097 to 17.264
SE, standard error.Log-likelihood = –767.507; Wald chi-squared test = 77.34; p-value > χ2 < 0.001. Site statistics are spurious.
TABLE 43 The RSI-HB results of multilevel mixed-effect linear regression (model 2) (compliant ITT group) (n= 220)
Model Type Beta SE Test statistic p-value 95% CI (beta)
Group: lansoprazole(reference = placebo)
Fixed 2.011 1.020 1.97 0.049 0.012 to 4.010
Site (reference = Birmingham)
Brighton Random –0.094 4.201 –0.02 0.982 –8.327 to 8.139
Glasgow –0.363 3.040 –0.12 0.905 –6.321 to 5.596
Manchester 4.317 3.140 1.37 0.169 –1.838 to 10.472
Newcastle –1.355 2.655 –0.51 0.610 –6.559 to 3.849
Nottingham –4.155 2.662 –1.56 0.119 –9.371 to 1.062
Stockport –2.067 3.537 –0.58 0.559 –8.999 to 4.865
Sunderland –1.398 2.831 –0.49 0.621 –6.946 to 4.150
RSI-HB continuousbaseline severity
Fixed 0.668 0.074 9.01 < 0.001 0.523 to 0.813
Constant 2.337 3.061 0.76 0.445 –3.664 to 8.337
SE, standard error.Log-likelihood = –753.829; Wald chi-squared test = 116.72; p-value > χ2 < 0.001.
APPENDIX 4
NIHR Journals Library www.journalslibrary.nihr.ac.uk
90

higher (worse) than those of placebo patients (95% CI 0.0 to 4.0; p = 0.05). A 1-unit increase in baselineseverity is associated with a 0.67 increase (95% CI 0.5 to 0.8) in 16-week RSI-HB. As before, it is baselineRSI-HB score that remains the most important (positive) correlate of 16-week RSI-HB. The underlyingassumptions of the model were not substantially violated.
Model 3Model 3 adjusted for baseline severity (RSI-HB as a continuous measure) and age, sex, smoking status(binary), alcohol consumption (binary) and BMI (Table 44).
The reduction in AIC through simple log or complex (fractional polynomial) transformation was notsubstantial. In order to build the most parsimonious, clinically interpretable model, age and BMI wereretained as untransformed continuous covariates, under the assumption of linearity with outcome. As noneof the potential covariates appears to have a significant univariate relationship, model 2 with continuousbaseline severity (RSI-HB) and site as covariates remains the optimal model. A sensitivity analysis based onthe pragmatic ITT group including all patients with their 16-week primary end-point visit taking place atany time did not change the conclusions.
Reflux Finding Score was not included in the multivariable model as it added no further beneficial fit tothe data.
The results of the multilevel mixed-effect linear regression (model 2) for RSI-HB (see Table 44) was extendedto include RFS baseline assessment scores and report the change in –2log-likelihood and significance of RFSas a covariate in the model.
Model 4Model 4 is adjusted for baseline RSI-HB (continuous measure), other important baseline factors and RFSbaseline assessment. RFS was explored for suitable first-order fractional polynomial transformations (Table 45).
TABLE 44 Univariate relationships including transformed continuous covariates (compliant ITT group) (n= 220)
Covariate AIC Beta SE Test statistic p-value
Age
Continuous 1605.288 –0.003 0.048 –0.06 0.949
Log-transformed 1605.177
Complex transformation (age–2) 1604.592
BMI
Continuous 1605.208 0.030 0.103 0.29 0.773
Log-transformed 1605.292
Complex transformation (BMI–2) 1604.590
Sex (binary – male/female) 1604.122 1.356 1.258 1.08 0.282
Binary smoking (n = 219) 1597.239 1.831 1.422 1.29 0.199
Binary alcohol consumption (n = 217) 1582.310 –1.803 1.387 –1.30 0.195
SE, standard error.
DOI: 10.3310/hta25030 HEALTH TECHNOLOGY ASSESSMENT 2021 VOL. 25 NO. 3
© Queen’s Printer and Controller of HMSO 2021. This work was produced by Wilson et al. under the terms of a commissioning contract issued by the Secretary of State forHealth and Social Care. This issue may be freely reproduced for the purposes of private research and study and extracts (or indeed, the full report) may be included in professionaljournals provided that suitable acknowledgement is made and the reproduction is not associated with any form of advertising. Applications for commercial reproduction shouldbe addressed to: NIHR Journals Library, National Institute for Health Research, Evaluation, Trials and Studies Coordinating Centre, Alpha House, University of Southampton SciencePark, Southampton SO16 7NS, UK.
91

As the reduction in AIC through transformation was not substantial, the RFS was retained as an untransformedcontinuous covariate, under the assumption of linearity with outcome.
Building the optimal model was based on a forward selection method; –2log-likelihood was comparedwith a chi-squared distribution to assess variable inclusion. As the relationship is not significantly related tothe RSI score at the primary end point, RFS was not included in the multivariable model because it addedno further beneficial fit to the data.
TABLE 45 Univariate relationships for continuous and transformed RFSs with primary outcome measure(RSI at 16 weeks) (compliant ITT group) (n= 167)
Covariate AIC Beta SE Test statistic p-valuea
RFS
Continuous 1237.800 0.195 0.193 1.01 0.314
Log-transformed (RFS + 0.0001) 1236.033
Complex transformation (RFS0) 1236.830
SE, standard error.a Significance for untransformed covariate.
APPENDIX 4
NIHR Journals Library www.journalslibrary.nihr.ac.uk
92
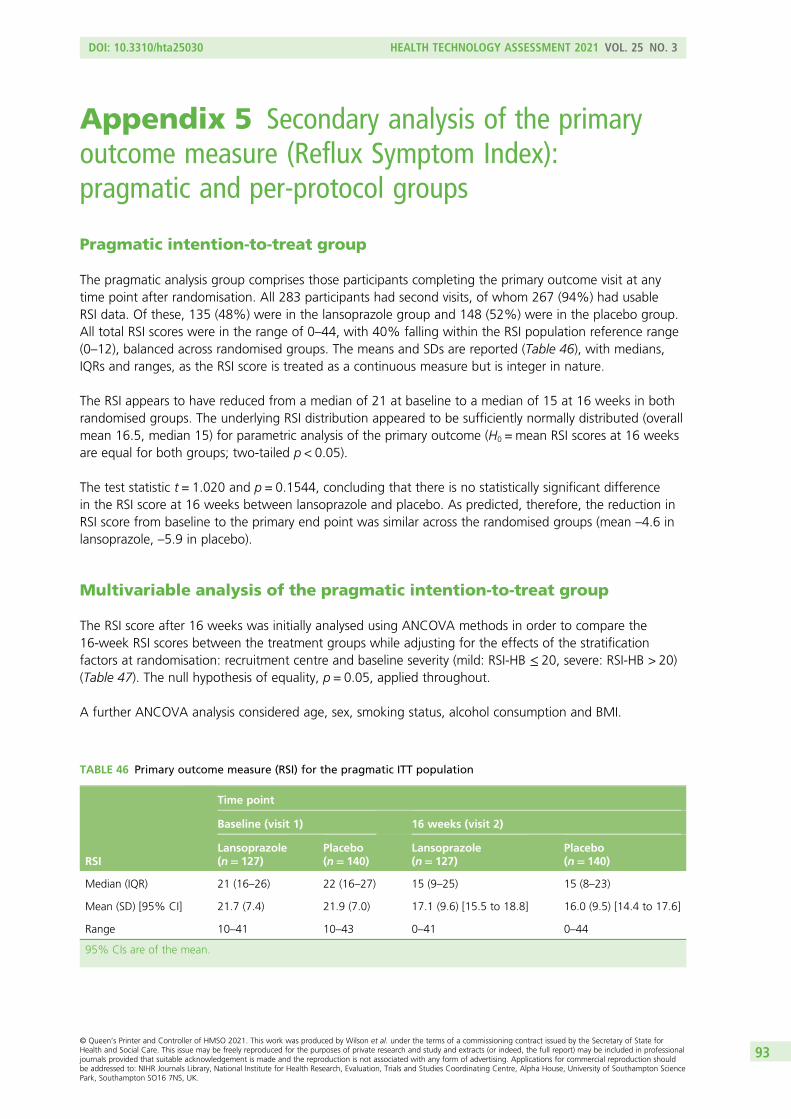
Appendix 5 Secondary analysis of the primaryoutcome measure (Reflux Symptom Index):pragmatic and per-protocol groups
Pragmatic intention-to-treat group
The pragmatic analysis group comprises those participants completing the primary outcome visit at anytime point after randomisation. All 283 participants had second visits, of whom 267 (94%) had usableRSI data. Of these, 135 (48%) were in the lansoprazole group and 148 (52%) were in the placebo group.All total RSI scores were in the range of 0–44, with 40% falling within the RSI population reference range(0–12), balanced across randomised groups. The means and SDs are reported (Table 46), with medians,IQRs and ranges, as the RSI score is treated as a continuous measure but is integer in nature.
The RSI appears to have reduced from a median of 21 at baseline to a median of 15 at 16 weeks in bothrandomised groups. The underlying RSI distribution appeared to be sufficiently normally distributed (overallmean 16.5, median 15) for parametric analysis of the primary outcome (H0 = mean RSI scores at 16 weeksare equal for both groups; two-tailed p < 0.05).
The test statistic t = 1.020 and p = 0.1544, concluding that there is no statistically significant differencein the RSI score at 16 weeks between lansoprazole and placebo. As predicted, therefore, the reduction inRSI score from baseline to the primary end point was similar across the randomised groups (mean –4.6 inlansoprazole, –5.9 in placebo).
Multivariable analysis of the pragmatic intention-to-treat group
The RSI score after 16 weeks was initially analysed using ANCOVA methods in order to compare the16-week RSI scores between the treatment groups while adjusting for the effects of the stratificationfactors at randomisation: recruitment centre and baseline severity (mild: RSI-HB ≤ 20, severe: RSI-HB > 20)(Table 47). The null hypothesis of equality, p = 0.05, applied throughout.
A further ANCOVA analysis considered age, sex, smoking status, alcohol consumption and BMI.
TABLE 46 Primary outcome measure (RSI) for the pragmatic ITT population
RSI
Time point
Baseline (visit 1) 16 weeks (visit 2)
Lansoprazole(n= 127)
Placebo(n= 140)
Lansoprazole(n= 127)
Placebo(n= 140)
Median (IQR) 21 (16–26) 22 (16–27) 15 (9–25) 15 (8–23)
Mean (SD) [95% CI] 21.7 (7.4) 21.9 (7.0) 17.1 (9.6) [15.5 to 18.8] 16.0 (9.5) [14.4 to 17.6]
Range 10–41 10–43 0–41 0–44
95% CIs are of the mean.
DOI: 10.3310/hta25030 HEALTH TECHNOLOGY ASSESSMENT 2021 VOL. 25 NO. 3
© Queen’s Printer and Controller of HMSO 2021. This work was produced by Wilson et al. under the terms of a commissioning contract issued by the Secretary of State forHealth and Social Care. This issue may be freely reproduced for the purposes of private research and study and extracts (or indeed, the full report) may be included in professionaljournals provided that suitable acknowledgement is made and the reproduction is not associated with any form of advertising. Applications for commercial reproduction shouldbe addressed to: NIHR Journals Library, National Institute for Health Research, Evaluation, Trials and Studies Coordinating Centre, Alpha House, University of Southampton SciencePark, Southampton SO16 7NS, UK.
93

The hypothesis to be tested is H0: the average RSI scores at 16 weeks are equal for both groups(lansoprazole vs. placebo) with adjustment for baseline stratification variables and also other clinical anddemographic baseline factors. A two-sided significance level of p < 0.05 is used throughout. Age and BMIwere sufficiently normal to include as untransformed data. Alcohol consumption and smoking status hadexcessive zero scores, thus skewed to the left and so binary alcohol and smoking variables were createdwith response ‘yes’ or ‘no’ (Table 48).
TABLE 47 Primary outcome measure as response with adjustment for site and baseline severity for the pragmaticITT analysis group
Source Partial SS df Mean square F-ratio p-value
Model 5021.445 9 557.938 7.46 < 0.001
Arm 138.600 1 138.600 1.85 0.175
Site 1726.855 7 246.694 3.30 0.002a
Baseline severity 3475.861 1 3475.861 46.50 < 0.001
Residual 19,211.146 257 74.752
Total 24,232.592 266 91.100
df, degrees of freedom; SS, sum of squares.a The apparent site effect (p = 0.002) is spurious – TOPPITS sites were numbered 1 to 8 for the analysis and ANCOVA
treats these numbers as numerical rather than indicative of location. Adjusted for the effects of site and baseline severity,there is no statistically significant difference in RSI at 16 weeks between randomised treatment groups (p = 0.175).
Adjusted R2 = 0.180; n = 267. There was evidence of dependence on baseline severity (p < 0.001), justifying its role as astratification factors in the trial design.
TABLE 48 Primary outcome measure as response with adjustment for stratification and other baseline factors(pragmatic ITT group)
Source Partial SS df Mean square F-ratio p-value
Model 5184.009 14 370.286 4.86 < 0.001
Arm 82.303 1 82.303 1.08 0.300
Site 1605.675 7 229.382 3.01 0.005a
Baseline severity 3298.724 1 3298.724 43.32 < 0.001
Age 21.802 1 21.802 0.29 0.593
Sex 166.950 1 166.950 2.19 0.140
Binary smoking 14.841 1 14.841 0.19 0.659
Binary alcohol 36.450 1 36.450 0.48 0.490
BMI 11.665 1 11.665 0.15 0.696
Residual 18,809.583 247 76.152
Total 23,993.592 261 91.929
df, degrees of freedom; SS, sum of squares.a Site not a reliable estimate as it cannot be modelled properly in ANCOVA.Adjusted R2 = 0.172; n = 262.The conclusion is not affected: site and baseline severity remain significantly related to 16-week RSI. Adjusted for theeffects of stratification variable and other baseline factors, there is no statistically significant difference in 16-week RSIbetween randomised treatment groups (p = 0.300).
APPENDIX 5
NIHR Journals Library www.journalslibrary.nihr.ac.uk
94
Statistical modelling of the pragmatic intention-to-treat groupThe analysis set is the pragmatic ITT group (n = 267). Analysis is carried out on a complete-case basis(analysing only those cases with complete information on all variables). Missing observations wereexamined to determine both the extent of and the reason for such omissions. Any missing data aredescribed for each model. The use of multiple imputation techniques was considered for the secondaryoutcome data and covariate data. The rationale was that missing data to a sufficient extent of > 10%would necessitate imputation. Data were not missing to this extent for the pragmatic ITT group so multipleimputation was not used.
Multilevel mixed-effect linear regression was used to model the 16-week RSI outcome measure for thepragmatic group. Three models were developed.
Model 1Model 1 adjusted for stratification factors used at randomisation: recruiting centre (as a random effect) andbinary baseline severity as defined by the binary RSI-HB cut-off value of 20 (as a fixed effect) as covariatesin the analysis. Modelling site as a random effect demonstrates no impact of site on RSI score at 16 weeks,as anticipated, and demonstrates the advantage of modelling these data more appropriately.
The RSI-HB score at baseline is confirmed as being statistically significantly related to 16-week RSI scores, andjustified as a stratification factor in the trial design. Patients with ‘severe’ RSI scores at baseline are estimated tohave RSI scores that are 7 points higher (worse) than patients with mild severity scores at baseline at 16 weeks.
There is no statistically significant difference between randomised groups, lansoprazole compared withplacebo (p = 0.165), when adjusted for site and baseline binary RSI-HB.
Model 2Model 2 adjusted for the stratification factor recruiting centre (as a random effect) at randomisation and forbaseline severity in terms of RSI-HB as a continuous measure (as a fixed effect). A 1-unit increase in baselineRSI-HB severity was associated with a 0.7-unit increase (95% CI 0.6 to 0.9) in 16-week RSI. There was nostatistically significant difference between randomised groups, lansoprazole compared with placebo(p = 0.264), when adjusted for site and baseline continuous RSI-HB.
Model 3Model 3 adjusted for baseline severity (RSI-HB as a continuous measure) and other important clinical anddemographic baseline factors, specifically age, sex, smoking status, alcohol consumption and BMI. (Alcoholand smoking were treated as binary variables; see above.)
ConclusionAs none of the potential covariates appears to have a significant univariate relationship with the RSI scoreat the primary end point (p > 0.1 for all), model 2 with continuous baseline severity (RSI-HB) and siteremains the optimal model.
Per-protocol population
During the DMC closed session held on 9 March 2018, the DMC discussed the different analysis groups.The chairperson felt that a sensitivity analysis including only patients who complied with the protocol(16 weeks ± 2 weeks) could be useful to support the primary analysis. The numbers available for thisanalysis are 178 out of 346 (51% of the trial population), with 82 out of 172 (48%) in the lansoprazoletreatment group and 96 out of 174 (55%) in the placebo group.
The summary statistics showed the randomised groups to be similar at baseline and for the RSI score toreduce similarly in both randomised groups at 16 weeks (the primary outcome) (Table 49).
DOI: 10.3310/hta25030 HEALTH TECHNOLOGY ASSESSMENT 2021 VOL. 25 NO. 3
© Queen’s Printer and Controller of HMSO 2021. This work was produced by Wilson et al. under the terms of a commissioning contract issued by the Secretary of State forHealth and Social Care. This issue may be freely reproduced for the purposes of private research and study and extracts (or indeed, the full report) may be included in professionaljournals provided that suitable acknowledgement is made and the reproduction is not associated with any form of advertising. Applications for commercial reproduction shouldbe addressed to: NIHR Journals Library, National Institute for Health Research, Evaluation, Trials and Studies Coordinating Centre, Alpha House, University of Southampton SciencePark, Southampton SO16 7NS, UK.
95

Overall, 47% of participants were within the normal range at the primary end point for the per-protocolpopulation, balanced across randomised treatment groups. Proceeding to the previously employedmultivariate strategies, the conclusion is not affected: site and baseline severity remain significantly relatedto 16-week RSI. Adjusted for the effects of stratification variables and other baseline factors, there was nostatistically significant difference in 16-week RSI between randomised treatment groups (p = 0.586).
Statistical modelling of the per-protocol groupIn the statistical modelling, as before, model 2 adjusted for the stratification factor recruiting site (as a randomeffect) at randomisation and for baseline severity in terms of RSI-HB as a continuous measure (as a fixedeffect). The log-likelihood statistics show that the continuous baseline severity substantially improves themodel fit (reduction in –2log-likelihood) compared with the previous model with binary severity stratificationfactor above. A 1-unit increase in baseline severity is associated with a 0.7-unit increase (95% CI 0.5 to 0.9)in 16-week RSI. There is no statistically significant difference between randomised groups, lansoprazolecompared with placebo (p = 0.522), when adjusted for site and baseline continuous RSI-HB. The estimateddifference between randomised groups, when accounting for site and baseline severity, indicates thatlansoprazole patients are estimated to have RSI scores at 16 weeks that are 0.81 points higher (worse) thanplacebo (95% CI –1.7 to 3.3; p = 0.52). As none of the potential covariates appeared to have a significantunivariate relationship with the RSI score at the primary end point (p > 0.1 for all), model 2 with continuousbaseline severity (RSI-HB) and site remains the optimal model.
TABLE 49 Primary outcome measure (RSI) at 16 weeks for the per-protocol population
RSI
Primary outcome measure: RSI 16-week follow-up (visit 2)
Treatment group
TotalLansoprazole Placebo
n 82 96 178
Median (IQR) 15 (9–26) 13 (7–23) 13.5 (8–24)
Mean (SD) 16.9 (10.0) 15.4 (10.1) 16.1 (10.1)
95% CI of mean 14.7 to 19.1 13.4 to 17.5 14.6 to 17.6
Range 0–41 0–44 0–44
APPENDIX 5
NIHR Journals Library www.journalslibrary.nihr.ac.uk
96

Appendix 6 Secondary analysis of the primaryoutcome measure having excluded the heartburncomponent of Reflux Symptom Index (RefluxSymptom Index minus the heartburn/dyspepsia item):pragmatic group
Means, SDs, medians, IQRs and ranges are reported (Table 50) as the score is treated as a continuousmeasure but is integer in nature.
The randomised groups are similar in both treatment groups at baseline. A comparison of differences ofunadjusted 16-week RSI-HB scores for pragmatic ITT group tested H0: the mean RSI-HB scores at 16 weeksare equal for both groups (lansoprazole vs. placebo; two-sided p < 0.05). The test statistic, t = 1.518,p = 0.130, concludes that there is no statistically significant difference in the RSI-HB scores at 16 weeksbetween lansoprazole and placebo.
As before, ANCOVA multivariate analysis was followed by statistical modelling. Model 2 adjusted for thestratification factor recruiting centre (as a random effect) at randomisation and for baseline severity interms of RSI-HB as a continuous measure (as a fixed effect). As none of the potential covariates appearsto have a significant univariate relationship with the RSI-HB score at the primary end point (p > 0.1 for all),model 2 with continuous baseline severity (RSI-HB) and site remains the optimal model.
TABLE 50 The RSI-HB for the pragmatic ITT population
RSI-HB
Time point
Baseline (visit 1) 16 weeks (visit 2)
Lansoprazolegroup (n= 127)
Placebo group(n= 140)
Lansoprazolegroup (n= 127)
Placebo group(n= 140)
Median (IQR) 19 (15–24) 20 (15–24) 14 (9–23) 13 (7.5–19.5)
Mean (SD) 20.0 (6.9) 20.0 (6.5) 16.0 (9.0) 14.3 (8.8)
95% CI of mean 18.8 to 21.2 18.9 to 21.1 14.4 to 17.5 12.8 to 15.8
Range 10–38 10–38 0–39 0–39
DOI: 10.3310/hta25030 HEALTH TECHNOLOGY ASSESSMENT 2021 VOL. 25 NO. 3
© Queen’s Printer and Controller of HMSO 2021. This work was produced by Wilson et al. under the terms of a commissioning contract issued by the Secretary of State forHealth and Social Care. This issue may be freely reproduced for the purposes of private research and study and extracts (or indeed, the full report) may be included in professionaljournals provided that suitable acknowledgement is made and the reproduction is not associated with any form of advertising. Applications for commercial reproduction shouldbe addressed to: NIHR Journals Library, National Institute for Health Research, Evaluation, Trials and Studies Coordinating Centre, Alpha House, University of Southampton SciencePark, Southampton SO16 7NS, UK.
97


Appendix 7 Analysis of covariance of RefluxSymptom Index at 12 months
The outcome measure is RSI score after 12 months and it was initially analysed using ANCOVA methods,as detailed previously, in order to compare the 12-month RSI scores between the treatment groups
while adjusting for potential confounders. Adjusted for the stratification effects of site and baseline severity,there was no statistically significant difference in RSI at 12 months between randomised treatment groups(p = 0.069). A secondary ANCOVA analysis considered age, sex, smoking status, alcohol consumption andBMI (Table 51).
There was no statistically significant difference in RSI at 12 months between randomised treatment groupson ANCOVA (p = 0.256), but site and baseline severity remain significantly related to 12-month RSI. Ageand sex also appear to be significantly related to 12-month RSI when all stratification and baselinecharacteristics are included in the model.
Model 1
Model 1 adjusted for stratification factors used at randomisation [recruiting centre (as a random effect) andbinary baseline severity as defined by the binary RSI-HB cut-off value of 20 (as a fixed effect)] as covariatesin the analysis (Table 52).
There is no statistically significant difference between randomised groups, lansoprazole compared withplacebo, when adjusted for site and baseline binary RSI-HB. The difference between randomised groups,when accounting for site and binary baseline severity, indicates that lansoprazole patients are estimated tohave RSI scores at 12 months that are 2.5 points higher (worse) than those of placebo patients (95% CI–0.1 to 5.0; p = 0.06). The underlying assumptions of the model were not substantially violated.
TABLE 51 The RSI at 12 months as response with adjustment for stratification and other baseline factors
Source Partial SS df Mean square F-ratio p-value
Model 6034.890 14 431.064 5.66 < 0.001
Arm 99.122 1 99.122 1.30 0.256
Site 2660.900 7 380.129 4.99 < 0.001a
Baseline severity 3019.474 1 3019.474 39.62 < 0.001
Age 444.648 1 444.648 5.83 0.017
Sex 298.691 1 298.691 3.92 0.049
Binary smoking 4.754 1 4.754 0.06 0.803
Binary alcohol 58.667 1 58.667 0.77 0.382
BMI 123.473 1 123.473 1.62 0.205
Residual 12,422.082 163 76.209
Total 18,459.972 177 104.277
df, degrees of freedom; SS, sum of squares.a Site is not a reliable estimate as it cannot be modelled properly in ANCOVA.Adjusted R2 = 0.269; n = 178.
DOI: 10.3310/hta25030 HEALTH TECHNOLOGY ASSESSMENT 2021 VOL. 25 NO. 3
© Queen’s Printer and Controller of HMSO 2021. This work was produced by Wilson et al. under the terms of a commissioning contract issued by the Secretary of State forHealth and Social Care. This issue may be freely reproduced for the purposes of private research and study and extracts (or indeed, the full report) may be included in professionaljournals provided that suitable acknowledgement is made and the reproduction is not associated with any form of advertising. Applications for commercial reproduction shouldbe addressed to: NIHR Journals Library, National Institute for Health Research, Evaluation, Trials and Studies Coordinating Centre, Alpha House, University of Southampton SciencePark, Southampton SO16 7NS, UK.
99

Model 2
Model 2 adjusted for the stratification factor recruiting centre (as a random effect) at randomisation andfor baseline severity in terms of RSI-HB as a continuous measure (as a fixed effect) (Table 53).
A 1-unit increase in baseline severity of RSI-HB is associated with a 0.7-unit increase in 12-month RSI score(95% CI 0.6 to 0.9). There is no statistically significant difference between randomised groups, lansoprazolecompared with placebo, when adjusted for site and baseline continuous RSI-HB. The difference betweenrandomised groups, when accounting for site and baseline severity, indicates that lansoprazole patients areestimated to have RSI scores at 12 months that are 1.7 points higher (worse) than those of placebo patients(95% CI –0.7 to 4.1; p = 0.157). The underlying assumptions of the model were not substantially violated.
Model 3
Model 3 adjusted for baseline severity (RSI-HB as a continuous measure) and other important clinical anddemographic baseline factors, specifically age, sex, smoking status, alcohol consumption and BMI(Table 54).
The reduction in AIC through simple log or complex (fractional polynomial) transformation was notsubstantial and continuous covariates were therefore retained as untransformed. As none of the potentialcovariates appears to have a significant univariate relationship with the 12-month RSI score, model 2 withcontinuous baseline severity (RSI-HB) and site remains the optimum model.
TABLE 52 Results of multilevel mixed-effect linear regression (model 1) at 12 months post randomisation(compliant ITT group) (n= 181)
Model Type Beta SETeststatistic p-value 95% CI (beta)
Group: lansoprazole (reference = placebo) Fixed 2.469 1.311 1.88 0.060 –0.100 to 5.038
Site (reference = Birmingham)
Brighton Random –19.058 6.094 –3.13 0.002 –31.003 to –7.113
Glasgow –8.713 4.942 –1.76 0.078 –18.400 to 0.973
Manchester –0.717 4.923 –0.15 0.884 –10.367 to 8.933
Newcastle –8.616 4.453 –1.93 0.053 –17.344 to 0.112
Nottingham –13.138 4.461 –2.95 0.003 –21.881 to –4.395
Stockport –10.709 5.177 –2.07 0.039 –20.856 to –0.563
Sunderland –9.029 4.626 –1.95 0.051 –18.096 to 0.037
RSI-HB baseline severity: severe(reference = mild)
Fixed 8.233 1.314 6.27 < 0.001 5.658 to 10.808
Constant 19.149 4.405 4.35 < 0.001 10.515 to 27.784
SE, standard error.n = 181; log-likelihood = –646.428; Wald chi-squared test = 73.49; p-value > χ2 < 0.001.
APPENDIX 7
NIHR Journals Library www.journalslibrary.nihr.ac.uk
100

TABLE 54 Univariate demographic relationships including transformed continuous covariates for RSI response at12 months (compliant ITT group) (n= 178)
Covariate AIC Beta SE Test statistic p-value
Age
Continuous 1330.032 0.013 0.05 0.22 0.828
Log-transformed 1330.079
Complex transformation (age3) 1329.639
BMI
Continuous 1329.971 0.042 0.128 0.33 0.743
Log-transformed 1330.079
Complex transformation (BMI–2) 1329.417
Sex (binary – male/female) 1330.058 0.224 1.527 0.15 0.884
Binary alcohol consumption (n = 176) 1315.883 –1.781 1.690 –1.05 0.293
Binary smoking (n = 177) 1321.686 2.307 1.737 1.33 0.186
SE, standard error.
TABLE 53 Results of multilevel mixed-effect linear regression (model 2) at 12 months post randomisation(compliant ITT group) (n = 181)
Model Type Beta SETeststatistic p-value 95% CI (beta)
Group: lansoprazole (reference = placebo) Fixed 1.730 1.222 1.42 0.157 –0.666 to 4.126
Site (reference = Birmingham)
Brighton Random –12.195 5.701 –2.14 0.032 –23.369 to –1.022
Glasgow –7.452 4.611 –1.62 0.106 –16.489 to 1.585
Manchester –1.609 4.592 –0.35 0.726 –10.608 to 7.391
Newcastle –7.999 4.153 –1.93 0.054 –16.139 to 0.141
Nottingham –11.125 4.161 –2.67 0.007 –19.280 to –2.970
Stockport –8.324 4.842 –1.72 0.086 –17.813 to 1.165
Sunderland –6.729 4.313 –1.56 0.119 –15.182 to 1.724
RSI-HB continuous baseline severity Fixed 0.739 0.087 8.51 < 0.001 0.569 to 0.909
Constant 7.188 4.483 1.60 0.109 –1.598 to 15.974
SE, standard error.Log-likelihood = –633.722; Wald chi-squared test = 111.85; p-value > χ2 = 0.000.
DOI: 10.3310/hta25030 HEALTH TECHNOLOGY ASSESSMENT 2021 VOL. 25 NO. 3
© Queen’s Printer and Controller of HMSO 2021. This work was produced by Wilson et al. under the terms of a commissioning contract issued by the Secretary of State forHealth and Social Care. This issue may be freely reproduced for the purposes of private research and study and extracts (or indeed, the full report) may be included in professionaljournals provided that suitable acknowledgement is made and the reproduction is not associated with any form of advertising. Applications for commercial reproduction shouldbe addressed to: NIHR Journals Library, National Institute for Health Research, Evaluation, Trials and Studies Coordinating Centre, Alpha House, University of Southampton SciencePark, Southampton SO16 7NS, UK.
101


Appendix 8 Consideration of the weight ofbaseline Reflux Finding Score in modelling theprimary outcome: Reflux Symptom Index at 16 weeks
Reflux Symptom Index was not included in the multivariable model because it added no furtherbeneficial fit to the data.
The multilevel mixed-effect linear regression (model 2) for RSI-HB (see Table 53) was extended to includeRFS baseline assessment scores and report the change in –2log-likelihood and significance of RFS as acovariate in the model.
Model 4 is adjusted for baseline RSI-HB (continuous measure), other important baseline factors and RFSbaseline assessment. RFS was explored for suitable first-order fractional polynomial transformations (Table 55).
As the reduction in AIC through transformation was not substantial, RFS was retained as an untransformedcontinuous covariate, under an assumption of linearity with outcome.
Building the optimal model was based on a forward selection method; –2log-likelihood was comparedagainst a chi-squared distribution to assess variable inclusion. As the relationship is not significantly relatedto the RSI score at the primary end point, RFS was not included in the multivariable model because it addedno further beneficial fit to the data.
TABLE 55 Univariate relationships for continuous and transformed RFS with primary outcome measure (RSI at16 weeks) (compliant ITT group) (n= 167)
Covariate AIC Beta SE Test statistic p-valuea
RFS
Continuous 1237.800 0.195 0.193 1.01 0.314
Log-transformed (RFS+ 0.0001) 1236.033
Complex transformation (RFS0) 1236.830
SE, standard error.a Significance for untransformed covariate.
DOI: 10.3310/hta25030 HEALTH TECHNOLOGY ASSESSMENT 2021 VOL. 25 NO. 3
© Queen’s Printer and Controller of HMSO 2021. This work was produced by Wilson et al. under the terms of a commissioning contract issued by the Secretary of State forHealth and Social Care. This issue may be freely reproduced for the purposes of private research and study and extracts (or indeed, the full report) may be included in professionaljournals provided that suitable acknowledgement is made and the reproduction is not associated with any form of advertising. Applications for commercial reproduction shouldbe addressed to: NIHR Journals Library, National Institute for Health Research, Evaluation, Trials and Studies Coordinating Centre, Alpha House, University of Southampton SciencePark, Southampton SO16 7NS, UK.
103


Appendix 9 Comprehensive Reflux SymptomScore total and subscale 16-week follow-up scoresdescriptive analysis: compliant intention-to-treatanalysis group (n = 220)
The CReSS total and subscale scores at the primary end point (16 weeks) are summarised by randomisedtreatment group and overall using descriptive statistics in Table 56 and at the 12-month follow-up in
Table 57. The means, SDs, medians, IQRs and ranges are reported as the score is treated as a continuousmeasure but is integer in nature. Box plots showing CReSS total and subscales at the three time points areshown in Figures 17–20.
A higher CReSS indicates more severe symptoms. The CIs for lansoprazole and placebo overlap for allscales, showing that the differences are not significant. Summary statistics show CReSS total and subscalescores to reduce in both randomised groups at 16 weeks. Summary statistics also show CReSS total andsubscale scores to continue to reduce in both randomised groups by 12 months (Table 58).
The 16-week and 12-month total CReSS is lower than at baseline in both groups. The three subscaleCReSSs are shown in Figures 18–20. All box plots show medians, IQRs and overall ranges.
There were two participants in the compliant ITT group with CReSS total scores completely missing atbaseline. A further three participants had partially missing data. Two participants had CReSS oesophagealscores completely missing at baseline. Two participants had partially missing data. Two participants hadCReSS upper airway scores completely missing at baseline. Another participant had partially missing data.Two participants in the compliant ITT group had CReSS pharyngeal scores completely missing at baseline.
The box plots show how the CReSS total and subscales change over the course of the trial visits, shownseparately for the treatment groups. For all CReSS scales, a similar larger drop is seen between baselineand 16 weeks for both treatment groups.
Relationship of Comprehensive Reflux Symptom Score and RefluxSymptom Index (primary outcome)
Simple log and fractional polynomial transformations were considered for CReSS total and subscale scoresto investigate better fit than under the assumption of linearity with RSI at 16 weeks (see Table 57), whenthe best-fitting transformation is selected based on a reduction in AIC. The reduction in AIC throughsimple log or complex (fractional polynomial) transformations was not substantial. In order to build themost parsimonious, clinically interpretable model, the CReSS total and subscale scores were retained asuntransformed continuous covariates, under the assumption of linearity with outcome.
Comprehensive Reflux Symptom Score univariate analysis
The univariate analysis is based on fitting a univariate model of each baseline CReSS domain score as apotential predictor of RSI at 16 weeks (Table 59).
DOI: 10.3310/hta25030 HEALTH TECHNOLOGY ASSESSMENT 2021 VOL. 25 NO. 3
© Queen’s Printer and Controller of HMSO 2021. This work was produced by Wilson et al. under the terms of a commissioning contract issued by the Secretary of State forHealth and Social Care. This issue may be freely reproduced for the purposes of private research and study and extracts (or indeed, the full report) may be included in professionaljournals provided that suitable acknowledgement is made and the reproduction is not associated with any form of advertising. Applications for commercial reproduction shouldbe addressed to: NIHR Journals Library, National Institute for Health Research, Evaluation, Trials and Studies Coordinating Centre, Alpha House, University of Southampton SciencePark, Southampton SO16 7NS, UK.
105

TABLE 56 The CReSS total and subscale scores at the primary end point (16 weeks, visit 2) for the compliant ITT population
CReSS
Total (range: 0–170) Oesophageal subscale (range: 0–85) Upper airway subscale (range: 0–85) Pharyngeal subscale (range: 0–25)
Lansoprazolegroup
Placebogroup
Lansoprazolegroup
Placebogroup
Lansoprazolegroup
Placebogroup
Lansoprazolegroup
Placebogroup
n 102 118 102 118 102 118 102 118
Median (IQR) 36 (15 to 55) 27.5 (14 to 48) 12 (4 to 26) 11.5 (5 to 22) 12 (5 to 21) 8 (4 to 18) 6 (2 to 10) 4 (2 to 8)
Mean (SD) 38.9 (27.7) 34.7 (28.3) 16.4 (14.7) 16.2 (14.9) 13.6 (9.8) 11.3 (10.0) 7.0 (5.6) 5.7 (5.2)
95% CI 33.4 to 44.3 29.6 to 39.9 13.5 to 19.3 13.5 to 18.9 11.6 to 15.5 9.5 to 13.2 5.9 to 8.1 4.7 to 6.6
Range 2–140 0–158 0–75 0–76 0–38 0–45 0–21 0–23
APPEN
DIX
9
NIHRJournals
Librarywww.journalslibrary.nihr.ac.uk
106
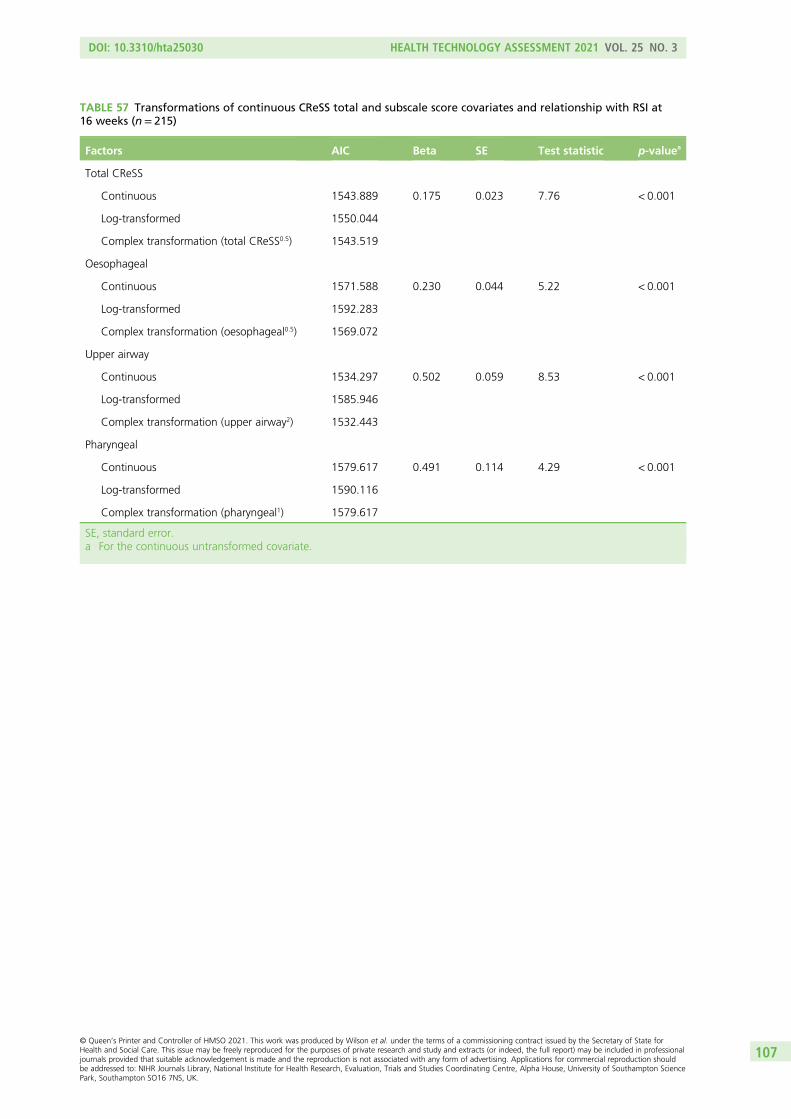
TABLE 57 Transformations of continuous CReSS total and subscale score covariates and relationship with RSI at16 weeks (n= 215)
Factors AIC Beta SE Test statistic p-valuea
Total CReSS
Continuous 1543.889 0.175 0.023 7.76 < 0.001
Log-transformed 1550.044
Complex transformation (total CReSS0.5) 1543.519
Oesophageal
Continuous 1571.588 0.230 0.044 5.22 < 0.001
Log-transformed 1592.283
Complex transformation (oesophageal0.5) 1569.072
Upper airway
Continuous 1534.297 0.502 0.059 8.53 < 0.001
Log-transformed 1585.946
Complex transformation (upper airway2) 1532.443
Pharyngeal
Continuous 1579.617 0.491 0.114 4.29 < 0.001
Log-transformed 1590.116
Complex transformation (pharyngeal1) 1579.617
SE, standard error.a For the continuous untransformed covariate.
DOI: 10.3310/hta25030 HEALTH TECHNOLOGY ASSESSMENT 2021 VOL. 25 NO. 3
© Queen’s Printer and Controller of HMSO 2021. This work was produced by Wilson et al. under the terms of a commissioning contract issued by the Secretary of State forHealth and Social Care. This issue may be freely reproduced for the purposes of private research and study and extracts (or indeed, the full report) may be included in professionaljournals provided that suitable acknowledgement is made and the reproduction is not associated with any form of advertising. Applications for commercial reproduction shouldbe addressed to: NIHR Journals Library, National Institute for Health Research, Evaluation, Trials and Studies Coordinating Centre, Alpha House, University of Southampton SciencePark, Southampton SO16 7NS, UK.
107

0
50
100
150
Tota
l CR
eSS
(a)
n = 80n = 100 n = 102
Baseline16 weeks
12 months
CReSS total at
0
50
100
150
Tota
l CR
eSS
(b)
Baseline16 weeks
12 months
n = 98n = 115 n = 118
CReSS total at
FIGURE 17 The CReSS total scores at baseline and follow-up visits for the compliant ITT population (median,IQR and overall range). (a) Lansoprazole; and (b) placebo.
APPENDIX 9
NIHR Journals Library www.journalslibrary.nihr.ac.uk
108

0
20
40
60
80
CR
eSS
oes
op
agea
l sco
re
(a)
n = 80n = 101 n = 102
Baseline16 weeks
12 months
CReSS oesophageal at
0
20
40
60
80
CR
eSS
oes
op
agea
l sco
re
(b)
Baseline16 weeks
2 months
n = 98n = 115 n = 118
CReSS oesophageal at
FIGURE 18 The CReSS oesophageal subscale scores at baseline and follow-up for the compliant ITT population.(a) Lansoprazole; and (b) placebo. The 16-week and 12-month CReSS oesophageal subscale score is lower than atbaseline in both treatment groups.
DOI: 10.3310/hta25030 HEALTH TECHNOLOGY ASSESSMENT 2021 VOL. 25 NO. 3
© Queen’s Printer and Controller of HMSO 2021. This work was produced by Wilson et al. under the terms of a commissioning contract issued by the Secretary of State forHealth and Social Care. This issue may be freely reproduced for the purposes of private research and study and extracts (or indeed, the full report) may be included in professionaljournals provided that suitable acknowledgement is made and the reproduction is not associated with any form of advertising. Applications for commercial reproduction shouldbe addressed to: NIHR Journals Library, National Institute for Health Research, Evaluation, Trials and Studies Coordinating Centre, Alpha House, University of Southampton SciencePark, Southampton SO16 7NS, UK.
109

0
10
20
30
40
50
CR
eSS
up
per
air
way
sco
re
(a)
n = 82n = 101 n = 102
Baseline
16 weeks
12 months
CReSS upper airway at
Baseline16 weeks
12 months
0
10
20
30
40
50
CR
eSS
up
per
air
way
sco
re
(b)
n = 98n = 116 n = 118
CReSS upper airway at
FIGURE 19 The CReSS upper airway subscale scores at baseline and follow-up visits for the compliant ITT population.(a) Lansoprazole; and (b) placebo. The 16-week and 12-month CReSS upper airway score is lower than at baseline inboth treatment groups.
APPENDIX 9
NIHR Journals Library www.journalslibrary.nihr.ac.uk
110

0
5
10
15
20
25
CR
eSS
ph
aryn
gae
l sco
re
(a)
n = 82n = 102 n = 102
Baseline16 weeks12 months
CReSS pharyngael at
Baseline16 weeks12 months
(b)
n = 116 n = 118 n = 98
0
5
10
15
20
25
CR
eSS
ph
aryn
gae
l sco
re CReSS pharyngael at
FIGURE 20 The CReSS pharyngeal subscale scores at baseline and follow-up for the compliant ITT population.(a) Lansoprazole; and (b) placebo. The 16-week and 12-month CReSS pharyngeal subscale score is lower than atbaseline in both treatment groups.
DOI: 10.3310/hta25030 HEALTH TECHNOLOGY ASSESSMENT 2021 VOL. 25 NO. 3
© Queen’s Printer and Controller of HMSO 2021. This work was produced by Wilson et al. under the terms of a commissioning contract issued by the Secretary of State forHealth and Social Care. This issue may be freely reproduced for the purposes of private research and study and extracts (or indeed, the full report) may be included in professionaljournals provided that suitable acknowledgement is made and the reproduction is not associated with any form of advertising. Applications for commercial reproduction shouldbe addressed to: NIHR Journals Library, National Institute for Health Research, Evaluation, Trials and Studies Coordinating Centre, Alpha House, University of Southampton SciencePark, Southampton SO16 7NS, UK.
111

TABLE 58 The CReSS total and subscale scores at the 12-month follow-up (visit 3) for the compliant ITT population
CReSS
12-month follow-up (visit 3)
Total (range: 0–170) Oesophageal subscale (range: 0–85) Upper airway subscale (range: 0–45) Pharyngeal subscale (range: 0–25)
Lansoprazolegroup
Placebogroup
Lansoprazolegroup
Placebogroup
Lansoprazolegroup
Placebogroup
Lansoprazolegroup
Placebogroup
n (%) 80 (78) 98 (83) 80 (78) 98 (83) 82 (80) 98 (83) 82 (80) 98 (83)
Median (IQR) 28 (15–53) 23 (11–51) 9.5 (3–20.5) 10 (5–22) 11 (4–20) 7 (4–16) 5 (2–10) 3 (1–8)
Mean (SD) 36.6 (30.7) 31.8 (25.9) 15.4 (16.0) 15.3 (13.5) 12.9 (11.0) 10.3 (10.0) 6.3 (5.8) 4.6 (4.7)
95% CI 29.8 to 43.5 26.6 to 36.9 11.8 to 18.9 12.6 to 18.0 10.5 to 15.3 8.3 to 12.3 5.0 to 7.6 3.7 to 5.6
Range 0–153 0–110 0–75 0–55 0–42 0–44 0–23 0–22
APPEN
DIX
9
NIHRJournals
Librarywww.journalslibrary.nihr.ac.uk
112

Baseline CReSS total and subscales appear to be significant predictors of the primary outcome (RSI) at16 weeks. All increases in CReSS domain scores result in an increase in RSI. A 1-unit increase in (1) baselineCReSS total results in a 0.18-unit increase in RSI at 16 weeks, (2) baseline CReSS oesophageal subscaleresults in a 0.23-unit increase, (3) baseline CReSS upper airway subscale results in a 0.50-unit increase and(4) baseline CReSS pharyngeal results in a 0.49-unit increase. It appears that baseline RSI-HB remains thesingle most important predictor of the primary outcome – a 1-unit increase results in a 0.75-unit increasein 16-week RSI.
Comprehensive Reflux Symptom Score multivariable analysis
Table 60 summarises each of the baseline CReSS domains’ individual significance (presented with RSI-HB)when included individually in a multivariable model for RSI at 16 weeks, adjusted by site and baseline RSI-HB.
Baseline CReSS total and subscales, with the exception of the pharyngeal subscale, are significantpredictors of RSI at 16 weeks, independent of and in addition to RSI-HB. A 1-unit increase in all baselineCReSS domains results in an increase in RSI at 16 weeks (total score, 0.06 increase; oesophageal subscale,0.09 increase; upper airway, 0.2 increase).
TABLE 59 Univariate models for RSI at 16 weeks with baseline severity represented by baseline RSI-HB or any oneof the baseline CReSS total/subscales (n= 215)
Baseline severity measure AIC Beta SE Test statistic p-value
Total CReSS 1543.889 0.175 0.023 7.76 < 0.001
CReSS oesophageal 1571.588 0.230 0.044 5.22 < 0.001
CReSS upper airway 1534.297 0.502 0.059 8.53 < 0.001
CReSS pharyngeal 1579.617 0.491 0.114 4.29 < 0.001
RSI-HB 1524.924 0.754 0.082 9.24 < 0.001
SE, standard error.
TABLE 60 Summary of multivariable modelsa for RSI at 16 weeks and baseline CReSS domain predictors (n= 215)
CReSS domains in modela AIC Beta SE Test statistic p-value 95% CI (beta)
None 1525.460
RSI-HB 0.723 0.080 9.02 < 0.001 0.565 to 0.879
Total CReSS 1522.308 0.064 0.028 2.28 0.022 0.009 to 0.119
RSI-HB 0.568 0.104 5.47 < 0.001 0.365 to 0.772
Oesophageal 1523.397 0.085 0.042 2.03 0.043 0.003 to 0.168
RSI-HB 0.654 0.086 7.60 < 0.001 0.485 to 0.822
Upper airway 1521.063 0.206 0.081 2.55 0.011 0.047 to 0.364
RSI-HB 0.518 0.112 4.62 < 0.001 0.299 to 0.738
Pharyngeal 1527.460 0.001 0.113 0.01 0.995 –0.220 to 0.221
RSI-HB 0.721 0.093 7.79 < 0.001 0.540 to 0.903
SE, standard error.a Model adjusted by site (not presented) and baseline RSI-HB (continuous measure).
DOI: 10.3310/hta25030 HEALTH TECHNOLOGY ASSESSMENT 2021 VOL. 25 NO. 3
© Queen’s Printer and Controller of HMSO 2021. This work was produced by Wilson et al. under the terms of a commissioning contract issued by the Secretary of State forHealth and Social Care. This issue may be freely reproduced for the purposes of private research and study and extracts (or indeed, the full report) may be included in professionaljournals provided that suitable acknowledgement is made and the reproduction is not associated with any form of advertising. Applications for commercial reproduction shouldbe addressed to: NIHR Journals Library, National Institute for Health Research, Evaluation, Trials and Studies Coordinating Centre, Alpha House, University of Southampton SciencePark, Southampton SO16 7NS, UK.
113

Comparison of Comprehensive Reflux Symptom Score total and subscales and RefluxSymptom Index minus the heartburn/dyspepsia item as baseline severity measuresThe baseline severity as provided by the baseline CReSS total and subscale scores were investigated to see ifthey explained variability in the data better than baseline RSI-HB. The modelling process for the compliantITT group was repeated including CReSS baseline severity as an alternative to RSI-HB (Table 61).
The results in Table 61 show that all baseline CReSS total and subscales are significant predictors of theprimary outcome when adjusted by site.
The model with a substantially better fit to the data lowest AIC is that including baseline RSI-HB severitymeasure with an AIC of 1525.4. The best-fitting model based on only baseline CReSS severity measuresis the model including CReSS upper airway with an AIC of 1539.4. This covariate explains more variabilityin the RSI score at 16 weeks than the total CReSS but nevertheless performs less well than RSI-HB. Theaddition of CReSS upper airway score to RSI-HB, in a model adjusted by site, results in a better-fittingmodel with the lowest AIC of 1521.1 (see Table 60).
TABLE 61 Multivariable models comparing the ability of baseline CReSS and continuous RSI-HB scores, adjusted bysite, to predict RSI at 16 weeks (n= 215; model 5)
Multivariable modela baseline severity measure AIC Beta SE Test statistic p-value
Total CReSS 1548.332 0.164 0.023 7.18 < 0.001
CReSS oesophageal 1572.542 0.210 0.044 4.81 < 0.001
CReSS upper airway 1539.431 0.471 0.059 7.92 < 0.001
CReSS pharyngeal 1578.926 0.444 0.110 4.02 < 0.001
RSI-HB 1525.460 0.723 0.080 9.02 < 0.001
SE, standard error.a Adjusted by site.
APPENDIX 9
NIHR Journals Library www.journalslibrary.nihr.ac.uk
114

Appendix 10 Laryngopharyngeal Reflux – HealthRelated Quality of Life tabulated thermometer anddomain scores
The groups are seen to be balanced, with similar scores across treatment groups and quality-of-lifedomains at baseline in the ‘thermometers’, which are part of the scoring system; a score of 3 or 4
indicates a small effect and scores of 2 and 1 indicate minimal to no effect on quality of life (Table 62).
At the end of treatment (primary end point) (Table 63), mean voice, coughing, clear throat, generalsubscale scores and overall scores were reduced in both groups.
There is a further reduction in the 12-month visits for scale and thermometer scores (Tables 64 and 65).
TABLE 62 Baseline thermometers of LPR-HRQL scales
Scale
Treatment group
OverallLansoprazole Placebo
n Median (IQR) Range n Median (IQR) Range n Median (IQR) Range
Voice 101 2 (1–5) 1–10 116 2 (1–5) 1–10 217 2 (1–5) 1–10
Cough 99 3 (1–6) 1–10 116 2.5 (1–5) 1–10 215 3 (1–5) 1–10
Clear 101 4 (2–6) 1–10 116 3 (1–6) 1–10 217 4 (2–6) 1–10
General 102 4 (2–7) 1–10 116 3 (2–6) 1–10 218 3.5 (2–6) 1–10
TABLE 63 Primary end-point (16 weeks) thermometers for LPR-HRQL scales
Scale
Treatment group
OverallLansoprazole Placebo
n Median (IQR) Range n Median (IQR) Range n Median (IQR) Range
Voice 100 2 (1–4) 1–10 117 1 (1–3) 1–10 217 1 (1–3) 1–10
Cough 102 2 (1–4) 1–10 117 1 (1–3) 1–10 219 2 (1–4) 1–10
Clear 102 2 (1–5) 1–10 117 2 (1–5) 1–10 219 2 (1–5) 1–10
General 102 2 (1–5) 1–10 117 2 (1–5) 1–10 219 2 (1–5) 1–10
DOI: 10.3310/hta25030 HEALTH TECHNOLOGY ASSESSMENT 2021 VOL. 25 NO. 3
© Queen’s Printer and Controller of HMSO 2021. This work was produced by Wilson et al. under the terms of a commissioning contract issued by the Secretary of State forHealth and Social Care. This issue may be freely reproduced for the purposes of private research and study and extracts (or indeed, the full report) may be included in professionaljournals provided that suitable acknowledgement is made and the reproduction is not associated with any form of advertising. Applications for commercial reproduction shouldbe addressed to: NIHR Journals Library, National Institute for Health Research, Evaluation, Trials and Studies Coordinating Centre, Alpha House, University of Southampton SciencePark, Southampton SO16 7NS, UK.
115

TABLE 64 The LPR-HRQL scores at the 12-month follow-up (compliant ITT group)
ScaleDescriptivestatistics
Scores
Raw Standardised
Treatment group
Total (n= 220)
Treatment group
TotalLansoprazole Placebo Lansoprazole Placebo
Voice (raw range: 0–72) Number complete 82 99 181 82 99 181
Median (IQR) 6 (6 to 11) 6 (3 to 12) 6 (6 to 11) –0.42 (–0.42 to –0.11) –0.32 (–0.68 to 0.41) –0.32 (–0.42 to 0.05)
Mean (SD) 12.8 (16.0) 8.6 (8.3) 10.5 (12.5) 0 (1) 0 (1) 0 (1)
95% CI 9.3 to 16.3 7.0 to 10.3 8.7 to 12.3 –0.2 to 0.2 –0.2 to 0.2 –0.1 to 0.1
Range 0 to 68 0 to 39 0 to 68 –0.80 to 3.46 –1.04 to 3.67 –1.04 to 3.67
Cough (raw range: 0–36) Number complete 82 99 181 82 99 181
Median (IQR) 3 (0 to 11) 1 (0 to 6) 2 (0 to 9) –0.44 (–0.76 to 0.44) –0.50 (–0.64 to 0.19) –0.50 (–0.64 to 0.44)
Mean (SD) 7.0 (9.2) 4.6 (7.2) 5.7 (8.2) 0 (1) 0 (1) 0 (1)
95% CI 5.0 to 9.0 3.2 to 6.0 4.5 to 6.9 –0.2 to 0.2 –0.2 to 0.2 –0.1 to 0.1
Range 0 to 36 0 to 36 0 to 36 –0.76 to 3.17 –0.64 to 4.37 –0.76 to 4.37
Clear (raw range: 0–36) Number complete 82 99 181 82 99 181
Median (IQR) 4.5 (0 to 10) 2 (0 to 6) 3 (0 to 9) –0.32 (–0.87 to 0.35) –0.39 (–0.70 to 0.25) –0.39 (–0.70 to 0.25)
Mean (SD) 7.1 (8.2) 4.4 (6.3) 5.7 (7.3) 0 (1) 0 (1) 0 (1)
95% CI 5.3 to 8.9 3.2 to 5.7 4.5 to 6.7 –0.2 to 0.2 –0.2 to 0.2 –0.1 to 0.1
Range 0 to 30 0 to 26 0 to 30 –0.87 to 2.80 –0.70 to 3.41 –0.87 to 3.41
General (raw range: 0–30) Number complete 81 99 180 81 99 180
Median (IQR) 3 (0 to 6) 2 (0 to 6) 2 (0 to 6) –0.30 (–0.78 to 0.19) –0.30 (–0.69 to 0.48) –0.30 (–0.69 to 0.32)
Mean (SD) 4.8 (6.2) 3.6 (5.1) 4.1 (5.6) 0 (1) 0 (1) 0 (1)
95% CI 3.5 to 6.2 2.5 to 4.6 3.3 to 5.0 –0.2 to 0.2 –0.2 to 0.2 –0.1 to 0.1
Range 0 to 28 0 to 28 0 to 28 –0.78 to 3.76 –0.69 to 4.77 –0.78 to 4.77
Overall (raw rescaled range: 0–100) Number complete 79 97 176 79 97 176
Median (IQR) 12 (2 to 22) 7 (1 to 18) 8 (2 to 20) –0.30 (–0.73 to 0.15) –0.35 (–0.68 to 0.23) –0.35 (–0.69 to 0.23)
Mean (SD) 18.8 (22.5) 13.9 (19.2) 16.0 (20.8) 0 (1) 0 (1) 0 (1)
95% CI 13.7 to 23.8 10.0 to 17.8 13.0 to 19.2 –0.2 to 0.2 –0.2 to 0.2 –0.1 to 0.1
Range 0 to 91 0 to 94 0 to 94 –0.83 to 3.23 –0.72 to 4.15 –0.83 to 4.15
APPEN
DIX
10
NIHRJournals
Librarywww.journalslibrary.nihr.ac.uk
116

TABLE 65 The 12-month follow-up thermometers of LPR-HRQL scales
Scale
Treatment group
OverallLansoprazole Placebo
n Median (IQR) Range n Median (IQR) Range n Median (IQR) Range
Voice 80 1 (1–3) 1–10 98 1 (1–2) 1–10 178 1 (1–3) 1–10
Cough 81 2 (1–4) 1–10 98 1 (1–2) 1–10 179 1 (1–3) 1–10
Clear 81 2 (1–5) 1–10 99 1 (1–3) 1–10 180 2 (1–4) 1–10
General 81 2 (1–4) 1–10 99 2 (1–3) 1–9 180 2 (1–4) 1–10
DOI: 10.3310/hta25030 HEALTH TECHNOLOGY ASSESSMENT 2021 VOL. 25 NO. 3
© Queen’s Printer and Controller of HMSO 2021. This work was produced by Wilson et al. under the terms of a commissioning contract issued by the Secretary of State forHealth and Social Care. This issue may be freely reproduced for the purposes of private research and study and extracts (or indeed, the full report) may be included in professionaljournals provided that suitable acknowledgement is made and the reproduction is not associated with any form of advertising. Applications for commercial reproduction shouldbe addressed to: NIHR Journals Library, National Institute for Health Research, Evaluation, Trials and Studies Coordinating Centre, Alpha House, University of Southampton SciencePark, Southampton SO16 7NS, UK.
117


EMEHS&DRHTAPGfARPHRPart of the NIHR Journals Librarywww.journalslibrary.nihr.ac.uk
This report presents independent research funded by the National Institute for Health Research (NIHR). The views expressed are those of the author(s) and not necessarily those of the NHS, the NIHR or the Department of Health and Social Care
Published by the NIHR Journals Library