Embed Size (px)
Citation preview

Ansell Limited Half Year Results to Dec 2013
Magnus Nicolin - Chief Executive Officer
Neil Salmon - Chief Financial Officer
For
per
sona
l use
onl
y

2
Disclaimer
The following presentation has been prepared by Ansell Limited for information purposes only. The presentation may contain forward looking statements or statements of opinion.
No representation or warranty is made regarding the accuracy, completeness or reliability of the forward looking statements or opinion or the assumptions on which either are based. All such information is, by its nature, subject to significant uncertainties outside of the control of the company.
To the maximum extent permitted by law, the company and its officers do not accept any liability for any loss arising from the use of the information contained in this presentation.
The information included in this presentation is not investment or financial product advice. Before making any investment decision, you should seek appropriate financial advice, which may take into account your particular investment needs, objectives and financial circumstances. Past performance is no guarantee of future performance.
For
per
sona
l use
onl
y

3
F’14 H1 – Agenda
Business Overview - Magnus Nicolin
Financial Report - Neil Salmon
Full Year Outlook - Magnus Nicolin
US dollars used in all slides unless otherwise specified.
For
per
sona
l use
onl
y
4
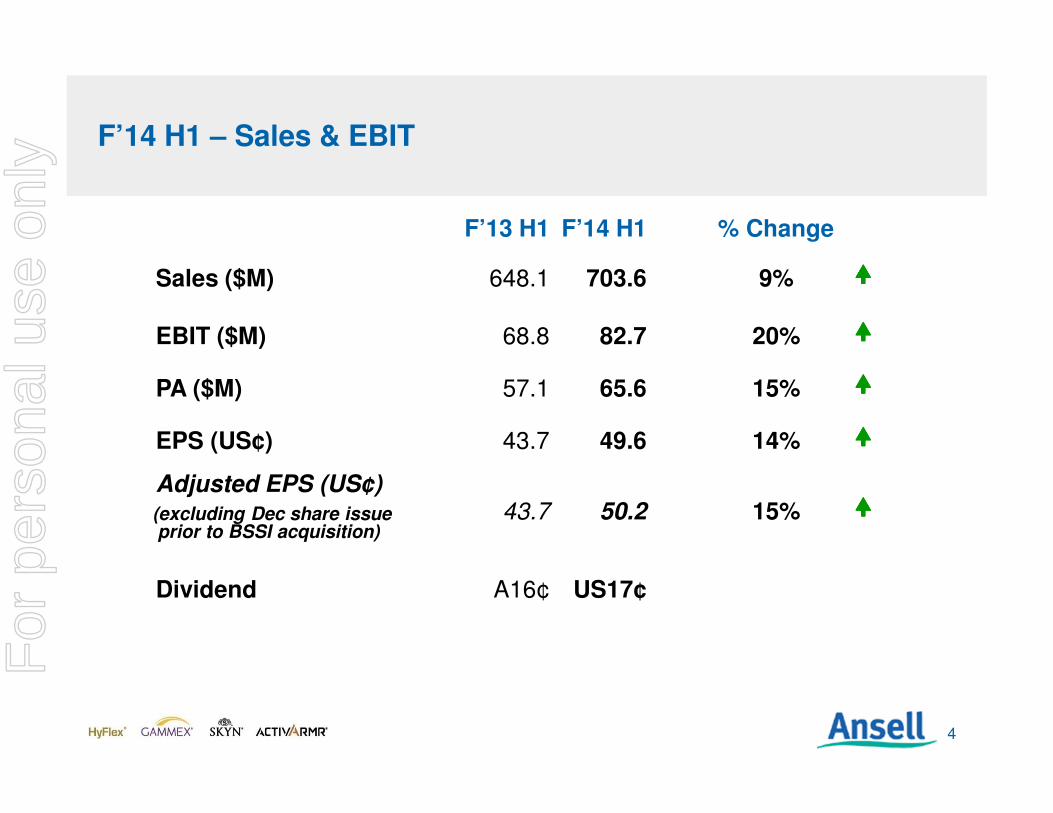
F’14 H1 – Sales & EBIT
F’13 H1 F’14 H1 % Change
Sales ($M) 648.1 703.6 9% ����
EBIT ($M) 68.8 82.7 20% ����
PA ($M) 57.1 65.6 15% ����
EPS (US¢) 43.7 49.6 14% ����
Adjusted EPS (US¢) (excluding Dec share issueprior to BSSI acquisition)
43.7 50.2 15% ����
Dividend A16¢ US17¢
For
per
sona
l use
onl
y

5
F’14 H1 – Global Recovery Mixed: US leads the way
PMI Covers: Production Levels, New Orders, Speed of Supplier, Deliveries and Employment Levels. Below 50 signals contraction.
35
40
45
50
55
60
Dec-12 Mar-13 Jun-13 Sep-13 Dec-13
Purchasing Managers Indices (PMI)
Exp
an
din
g
US
Germany
Eurozone
Co
ntra
ctin
g
Brazil
RussiaFrance, Australia
For
per
sona
l use
onl
y

6
F’14 H1 – The half in brief- a very solid half for Ansell overall with strong EBIT growth
Key Positives
• B2B organic growth rates improving driven by a 20% growth in NPD sales
• Strong performance in Medical
• Improving momentum in Industrial, particularly in North America
• Two acquisitions of significant strategic value concluded with upside to business cases
• Commodity prices remain low
• Emerging Markets up 16% (5% excluding acquisitions) in constant currencies
Head Winds
• Australia, Russia, Turkey and Brazil weaker
• Sexual Wellness sales dip on FX, lower tenders, EMEA destocking
• Refinements needed to “go to market” model on NPDs to increase sell through
• One off cost for acquisitions and severance
• Hercules down primarily on share loss by largest customer, business now integrated and successfully broadening customer baseF
or p
erso
nal u
se o
nly

7
F’14 H1 – Growth trends improving in NA and strong in LAC. APAC down on ANZ decline, good growth in Asia.
Sales $703.6 M Segment EBIT $82.0 M
Med Ind SM SW Total Med Ind SM SW Total
Asia Pac*
EMEA
Nth Am
LAC
Total
> +5% From 0% to +5% < 0%
* Asia Pac significantly affected by Australian economic weakness and FXFor
per
sona
l use
onl
y

8
F’14 H1 – Acquisition Strategy guided by Three Priorities. Recent Acquisitions collectively on Target and Expected to Exceed Return Hurdles
1. ECONOMIES OF SCALE BENEFITS DELIVERED
• Comasec synergies realised ahead of business case
• Acquired Portuguese manufacturing facility, now fully utilised in integrated supply chain
• BSSI integration to leverage high market shares in new channels, Outstanding customer intimacy
2. NEW TECHNOLOGIES AND CAPABILITIES ACHIEVED
• US$75m specialist clothing business created through APS and Hercules acquisitions, now with good growth potential
• Sandel and PSP acquisitions have built US$30m Heathcare Safety Segment positioned for long term growth
• Comasec & Midas enable insourcing of key technologies and enhanced R&Dcapability
3. GEOGRAPHIC GROWTH
• Hercules significantly increases Ansell's presence in Brazil.
• Midas brings South Korean market growth opportunity
• BSSI builds stronger US presence
ECONOMIES OF SCALE
GEOGRAPHICEXPANSION
NEW TECHNOLOGY OR CAPABILITY
1
2 3APS
For
per
sona
l use
onl
y

9
F’14 H1 – Acquisitions Integration
Update on Prior Acquisitions• Comasec, Trelleborg (APS) and Hercules integration activities are far advanced with
many aspects of acquired businesses now fully absorbed within the core organization
• They collectively are meeting our business case projections and are strongly contributing to Ansell’s results and improving capabilities
Midas, BSSI Acquisitions• Integration of Midas and BSSI is progressing well
• Midas is adding many new capabilities and will contribute to improving our cost position on Hyflex® as well as in securing control of strategic differentiators
• Cross functional teams are now working on BSSI integration. Early feedback is very positive, with teams highly motivated to deliver upside vs business case
• BSSI and Midas integration processes are benefiting from the good practices established and refined on earlier acquisitions
• We are making progress on defining organization structure post BSSI integration with our objective continuing to be to build on the best of both BSSI and Ansell in a cost effective manner with excellent customer focusF
or p
erso
nal u
se o
nly
10
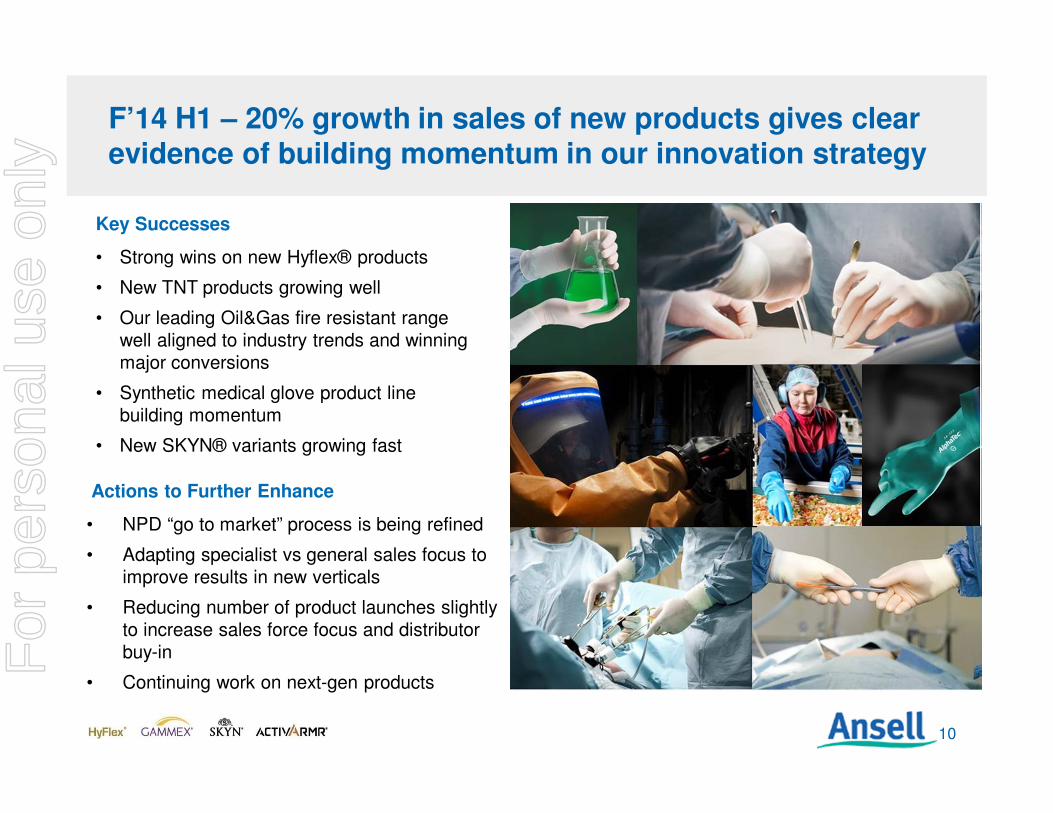
F’14 H1 – 20% growth in sales of new products gives clear evidence of building momentum in our innovation strategy
Key Successes
• Strong wins on new Hyflex® products
• New TNT products growing well
• Our leading Oil&Gas fire resistant range well aligned to industry trends and winning major conversions
• Synthetic medical glove product line building momentum
• New SKYN® variants growing fast
Actions to Further Enhance
• NPD “go to market” process is being refined
• Adapting specialist vs general sales focus to improve results in new verticals
• Reducing number of product launches slightly to increase sales force focus and distributor buy-in
• Continuing work on next-gen products
For
per
sona
l use
onl
y

11
F’14 H1 – Industrial Overview :42% of Revenue and 51% of Segment EBIT
$M F’13 H1 F’14 H1
General Purpose/ Mechanical- HyFlex® 97.0 100.0 3%
- Other GP/M 70.7 76.0 7%
Chemical/Liquid Handling- AlphaTec® 5.4 6.5 20%
- Other Chemical /LH 37.5 41.2 10%
Single Use- Touch N Tuff® (TNT) 38.1 45.1 19%
- Other 11.8 19.0 61%
Other/Midas 4.9 8.5
Sales 265.4 296.3 12%
Segment EBIT 38.1 42.1 10%
EBIT/Sales 14.4% 14.2%
Comments
� HyFlex® – strong performance and traction for new products such as 11-518, 11-644, newly launched 11-840,partially mitigated by slowdown for some mature products
� TNT – strong growth fuelled by lab and utility nitrile products, building momentum in sterile environments
� AlphaTec® – traction on differentiated products with performance/grip/sweat management
� Increases across all non core brand categories driven mainly by Comasec products
Note: Comasec sales post acquisition included in “other” within relevant category
For
per
sona
l use
onl
y
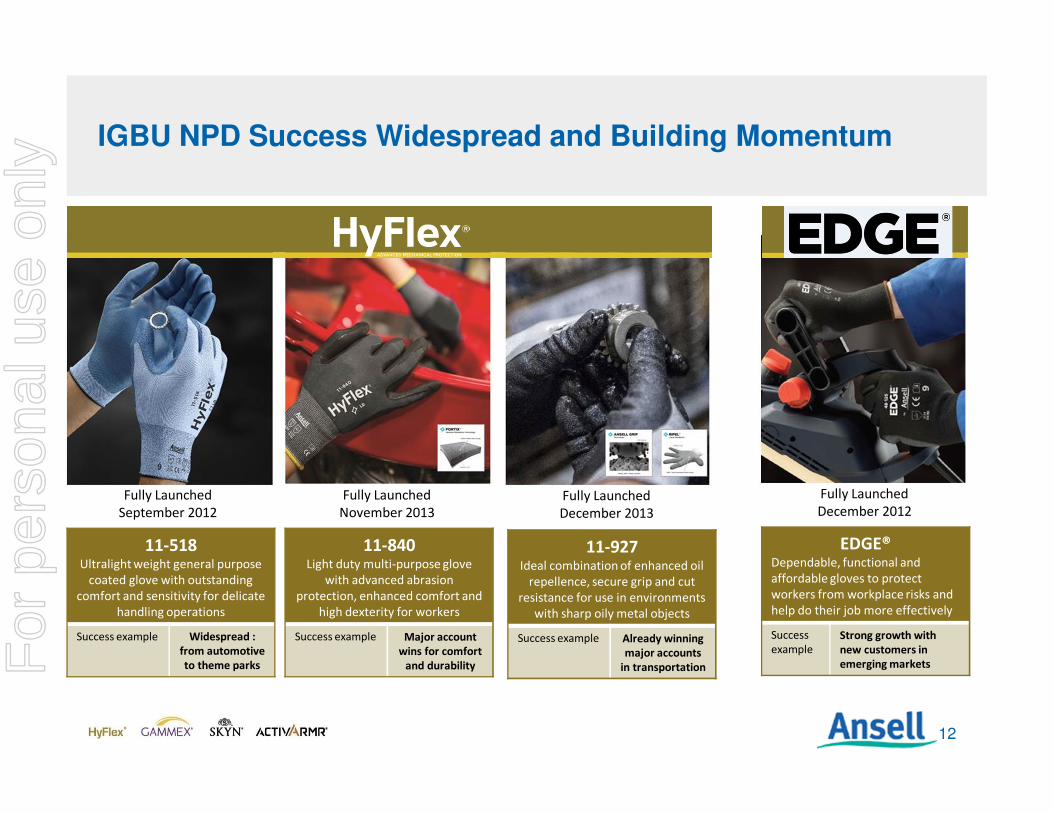
12
Fully Launched
November 2013
Fully Launched
December 2012
11-518Ultralight weight general purpose
coated glove with outstanding
comfort and sensitivity for delicate
handling operations
Success example Widespread :
from automotive
to theme parks
EDGE®Dependable, functional and
affordable gloves to protect
workers from workplace risks and
help do their job more effectively
Success
example
Strong growth with
new customers in
emerging markets
11-840Light duty multi-purpose glove
with advanced abrasion
protection, enhanced comfort and
high dexterity for workers
Success example Major account
wins for comfort
and durability
11-927Ideal combination of enhanced oil
repellence, secure grip and cut
resistance for use in environments
with sharp oily metal objects
Success example Already winning
major accounts
in transportation
Fully Launched
September 2012
Fully Launched
December 2013
IGBU NPD Success Widespread and Building Momentum
For
per
sona
l use
onl
y
13
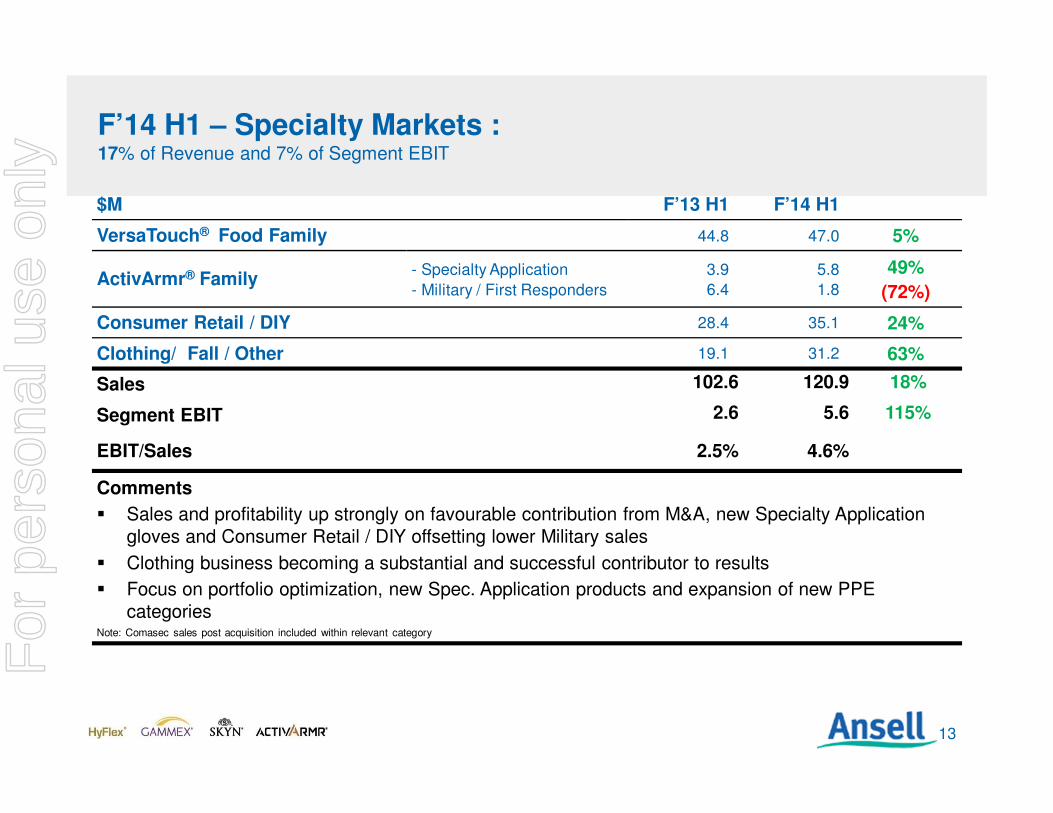
F’14 H1 – Specialty Markets :17% of Revenue and 7% of Segment EBIT
$M F’13 H1 F’14 H1
VersaTouch® Food Family 44.8 47.0 5%
ActivArmr® Family- Specialty Application
- Military / First Responders
3.9
6.4
5.8
1.8
49%
(72%)
Consumer Retail / DIY 28.4 35.1 24%
Clothing/ Fall / Other 19.1 31.2 63%
Sales 102.6 120.9 18%
Segment EBIT 2.6 5.6 115%
EBIT/Sales 2.5% 4.6%
Comments
� Sales and profitability up strongly on favourable contribution from M&A, new Specialty Application gloves and Consumer Retail / DIY offsetting lower Military sales
� Clothing business becoming a substantial and successful contributor to results
� Focus on portfolio optimization, new Spec. Application products and expansion of new PPE categories
Note: Comasec sales post acquisition included within relevant category
For
per
sona
l use
onl
y

14
FLAME RESISTANCE IMPACT HI-VISIBILITY / GRIP THERMAL
97-200 / 97-201
80-813 / 46-111First-to-market Flame Resistant
Impact protection designed for O&G
97-210 / 97-321Best in Class Impact protection w/Grip
& Oil Impermeability to protect &
keep hands clean
97-100 / 97-012 /97-013Second skin cut protection with high
visibility, dexterity and impermeability
that the oil field demands
97-011General purpose cold weather with
superior grip and impermeability while
preserving dexterity
Portfolio & MarketExpansion
• Portfolio expansion from single offering to broad purpose-built range for specific applications in the oil field• Actively engaged with the largest multinational integrated Oil & Gas companies across the spectrum of
exploration & drilling, production & services and construction support
Growing GlobalPipeline
• ~3x year-on-year sales growth driven both by existing products and new products launched in F13 and F14
Success Stories• Several major account wins in 1H’14 with market feedback indicating strong interest in importance of FR and
impact features in wide variety of upstream oil & gas applications
Industry Leading Oil & Gas Range Is Gaining Traction within Specialty Markets
For
per
sona
l use
onl
y

15
F’14 H1 - Medical GBU Overview : 26% of Revenue and 27% of Segment EBIT
$M F’13 H1 F’14 H1
Surgical- NRL 89.1 92.9 4%
- Synthetic 23.6 29.1 23%
Examination- NRL 18.6 14.2 (24%)
- Synthetic 24.3 29.8 23%
Healthcare Safety Solutions 9.7 12.4 28%
Sales 165.3 178.4 8%
Segment EBIT 17.2 22.2 29%
EBIT/Sales 10.4% 12.4%
Comments:� Surgical growth fueled by Synthetic conversions in Developed Markets, continued Emerging Markets
growth and New Product sales traction (specifically Sensoprene®, MediGrip® and AMT™).� After 6 years of managed exits/sales decline, Exam gloves growing globally (mainly in NA). Growth fueled
by shift to Synthetics in line with market dynamics and customer preferences.� Healthcare Safety Solutions growth due to PSP acquisition and continued Sandel expansion.F
or p
erso
nal u
se o
nly

16
F’14 H1 – Medical GBU – New Product Traction
GAMMEX® Non-Latex Accelerator Free
with SENSOPRENE formulation
GAMMEX® Latex Powder-Free Antimicrobial with
AMT technology
Accolades & Awards• In the US, won silver in the Excellence in
Surgical Products award, as voted on by the editor and readers of Surgical Products Magazine.
• In Japan, Sensoprene® is leading the non-latex conversion
• Burn glove launched. First orders taken in the US
Recent Publications:• New Antimicrobial gloves could prevent SSIs;
Canadian Healthcare Network• “In-vitro Experimental evaluation of skin-to-surface
recovery of four bacterial species by antibacterial and non-antibacterial medical examination gloves” Antimicrobial Resistance & Infection Control
• “Suppression of Surgeon’s Bacteria Hand Flora during Surgical Procedures with a new Antimicrobial Surgical Glove” Surgical Infections
ONGOING INITIATIVES / CAMPAIGNS
For
per
sona
l use
onl
y

17
F’14 H1 – Sexual Wellness Overview :15% of Revenue and 15% of Segment EBIT
$M F’13 H1 F’14 H1
Condoms Branded 87.8 83.1 (5%)
Tenders/Private Label 14.9 12.7 (15%)
Lube/Devices/Other 12.1 12.2 1%
Sales 114.8 108.0 (6%)
Segment EBIT 14.5 12.1 (17%)
EBIT/Sales 12.6% 11.2%
Comments� Overall sales growth impacted by currency devaluation of ~2% mainly INR, AUD, BRL, ARS
� Condoms Branded –SKYN® continues to provide strong growth. Whilst EMEA market share has been maintained, sales were adversely impacted by prior year pre campaign stock build and distributor change in Italy.
� Tenders - exit lower margin business and delayed shipments into H2.
� EBIT - mainly shortfall in branded business and FX, with manufacturing improvements offset by one off restructure costs.
For
per
sona
l use
onl
y

18
SKYN® Performance
� SKYN® sales grew by 17% vs LY
� SKYN® became the number one condom brand for Ansell in sales value
� SKYN® Intense Feel launched – world first PI textured condom. Delivers truly natural feeling for him and intense stimulation for her.
SKYN® launched in India and South Africa, building its presence in 27 countries today
During H1 SKYN® media investment was undertaken in our top 9 markets.F
or p
erso
nal u
se o
nly
19
Neil SalmonChief Financial Officer
Financial Results
For
per
sona
l use
onl
y

20
F’14 H1 – Organic Growth and Acquisitions Supporting Results
$M F’13 H1 F’14 H1
Sales 648.1 703.6 ���� Up 9%, organic growth up 1%
GPADE 238.8 267.2 Margin up 1% YOY
SG&A (170.0) (184.5) Includes $9.4m from acquisitions
EBIT 68.8 82.7 ���� EBIT margin up 120bps
Net Interest (4.3) (6.9) Acquisition interest costs
Taxes (5.7) (8.7) DTA/NOTI $3.5m, LY $5.8m
Minority Interests (1.7) (1.5)
Profit Attributable 57.1 65.6 ����
EBIT:Sales 10.6% 11.8%
EPS (US¢) 43.7 49.6 ����
� FX Impact to F’14 H1, negative $2.1m
� Results include a one off write back of an unused earn out provision relating to the Hercules acquisition of $8.4m off set by M&A transaction costs of $1.9m, severances of $2.6m and gain on sale of properties of $0.2m.F
or p
erso
nal u
se o
nly

21
F’14 H1 – Organic Sales Growth Supported by Acquisitions up 9%. EBIT up 20% on Acquisitions and Improved GPADE
EBIT$M
Sales $M
*MISM = Medical, Industrial, Specialty Markets
68.8
82.712.2 0.3 0.5 7.3(6.4)
F'13 GPADE S&M R&D G&A M&A F'14
648.1 703.649.0 14.0
(2.4)
(5.1)
H1 F'13
Sales
FX Acquisitions MISM* Organic
Growth
SW Destocking H1 F'14
Sales
For
per
sona
l use
onl
y

22
F’14 H1 – Balance Sheet – Remains Strong and Liquid
� Cash was $905.7m (F’13 H1 $338.0m), $615m of which was used for the BarrierSafe acquisition on 2 January.
� Gross Debt of $830.3m (F’13 H1 $540.2m) includes a $240m drawn facility as part of the BarrierSafe acquisition.
� Shareholder Funds increased by $359.7m due to share issue in December 2013 related to the BarrierSafe acquisition.
� ROE lower on equity issued prior to BSSI acquisition, expected to improve with consolidation of BSSI profit in H2.
$M F’13 H1 F’13 F’14 H1
Fixed Assets 182.1 186.7 195.6
Intangibles 481.3 541.4 545.8
Other Assets/Liabilities 11.7 (33.6) (6.9)
Working Capital 305.8 314.5 327.2
Net Operating Assets 980.9 1,009.0 1,061.7
Net Interest Bearing Debt 202.2 235.5 (75.4)
Shareholders’ Funds 778.7 773.5 1,137.1
Gearing % (NIBD:NIBD & Equity) 20.6% 23.3% (7.1%)
ROA% 15.6% 19.1% 16.0%
ROE% 15.7% 19.1% 14.1%
For
per
sona
l use
onl
y
23
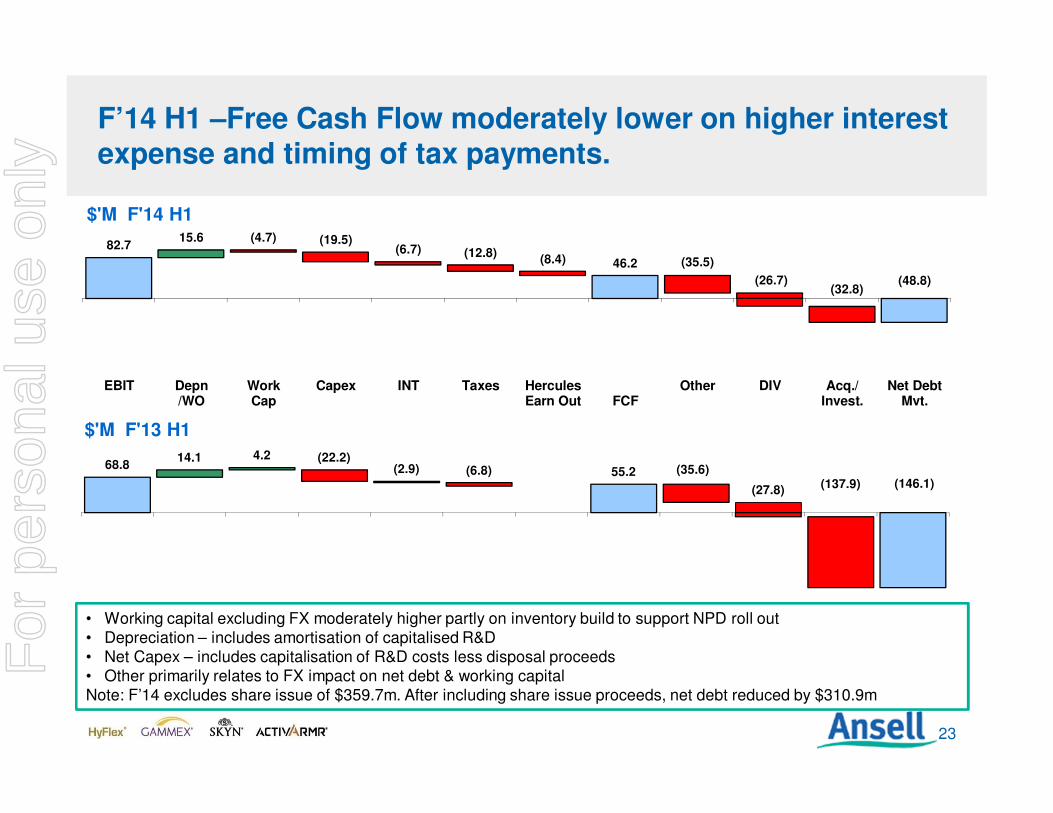
F’14 H1 –Free Cash Flow moderately lower on higher interest expense and timing of tax payments.
• Working capital excluding FX moderately higher partly on inventory build to support NPD roll out• Depreciation – includes amortisation of capitalised R&D• Net Capex – includes capitalisation of R&D costs less disposal proceeds• Other primarily relates to FX impact on net debt & working capitalNote: F’14 excludes share issue of $359.7m. After including share issue proceeds, net debt reduced by $310.9m
82.715.6
46.2
(4.7) (19.5)(6.7) (12.8)
(8.4) (35.5)
(26.7)(32.8)
(48.8)
EBIT Depn/WO
WorkCap
Capex INT Taxes HerculesEarn Out FCF
Other DIV Acq./Invest.
Net DebtMvt.
$'M F'14 H1
68.814.1 4.2
55.2(22.2)
(2.9) (6.8)(137.9) (146.1)
(35.6)
(27.8)
$'M F'13 H1
For
per
sona
l use
onl
y

24
F’14 H1 – Dividend Reinvestment Plan
Dividend Reinvestment Plan (DRP)
� As a way of providing shareholders with a cost effective and convenient
mechanism to acquire shares where they prefer to do so instead of receiving a
dividend cash payment, Ansell has decided to implement a dividend
reinvestment plan. The company will retain the option to offset the dilutive
effect of this program by repurchasing shares on the open market. For the F’14
interim dividend, new shares will be issued to satisfy any DRP requirements.
For
per
sona
l use
onl
y

25
F’14 H1 – Financial Wrap-up
Achievements� Midas Acquisition bringing technology and manufacturing competency� BarrierSafe acquisition on 2 Jan 2014 – transformational to NA region� Strong EBIT growth of 20%� EMEA SAP live on Feb 3rd. Early in go-live operation, but good progress so far
Challenges� Variable and uncertain economic environment� Continuing to grow in a more challenging emerging market conditions� Balancing demands of continued SAP/Oracle implementation programme while
remaining focused on delivering our growth strategy
The Future� Leveraging Acquisitions to Reposition Ansell� Realisation of Synergy Benefits� Integrating BSSI and realising cash flow potential of combined business and
generating improving returns on investmentsFor
per
sona
l use
onl
y

26
Magnus NicolinChief Executive Officer
Full Year Outlook
For
per
sona
l use
onl
y

27
F’14 – Keys to H2 Success
Our expectation for H2 performance is based upon:
� Continued modest improvement in US and Eurozone economies
� Emerging markets mixed. Softness continuing (Russia, Turkey, Brazil, Argentina)
� Acceleration in NPD sales, based on strong pipelines
� Turn around in Sexual Wellness including strong H2 phasing for tender business
� Medical continuing to grow but at more modest rate vs strong F’13 H2 and F’14 H1
� Raw material environment remaining favourable
� Marigold divestment to FHP
BSSI Acquisition Update:
� Our guidance assumes moderate EPS dilution in the 1st 6 months, after including acquisition costs. The integration process is off to a good start with quick win opportunities already identified
For
per
sona
l use
onl
y
28
F’14 H1 – F’14 Guidance
As previously guided when announcing the BarrierSafe acquisition, Ansell reconfirms:
– Reported F’14 EPS expected to be in the range of US$1.10 to US$1.16
– including a positive impact of Net Deferred Tax Asset/Non Operational Tax (DTAs/NOTIs) adjustments of US3¢ - US5¢
For
per
sona
l use
onl
y