Embed Size (px)
Citation preview
ORIGINAL RESEARCHSPINE
A Novel MRI Biomarker of Spinal Cord White Matter Injury:T2*-Weighted White Matter to Gray Matter Signal
Intensity RatioX A.R. Martin, X B. De Leener, X J. Cohen-Adad, X D.W. Cadotte, X S. Kalsi-Ryan, X S.F. Lange, X L. Tetreault, X A. Nouri,
X A. Crawley, X D.J. Mikulis, X H. Ginsberg, and X M.G. Fehlings
ABSTRACT
BACKGROUND AND PURPOSE: T2*-weighted imaging provides sharp contrast between spinal cord GM and WM, allowing their segmen-tation and cross-sectional area measurement. Injured WM demonstrates T2*WI hyperintensity but requires normalization for quantitativeuse. We introduce T2*WI WM/GM signal-intensity ratio and compare it against cross-sectional area, the DTI metric fractional anisotropy,and magnetization transfer ratio in degenerative cervical myelopathy.
MATERIALS AND METHODS: Fifty-eight patients with degenerative cervical myelopathy and 40 healthy subjects underwent 3T MRimaging, covering C1–C7. Metrics were automatically extracted at maximally compressed and uncompressed rostral/caudal levels. Nor-malized metrics were compared with t tests, area under the curve, and logistic regression. Relationships with clinical measures wereanalyzed by using Pearson correlation and multiple linear regression.
RESULTS: The maximally compressed level cross-sectional area demonstrated superior differences (P � 1 � 10�13), diagnostic accuracy(area under the curve � 0.890), and univariate correlation with the modified Japanese Orthopedic Association score (0.66). T2*WI WM/GMshowed strong differences (rostral: P � 8 � 10�7; maximally compressed level: P � 1 � 10�11; caudal: P � 1 � 10�4), correlations (modifiedJapanese Orthopedic Association score; rostral: �0.52; maximally compressed level: �0.59; caudal: �0.36), and diagnostic accuracy(rostral: 0.775; maximally compressed level: 0.860; caudal: 0.721), outperforming fractional anisotropy and magnetization transfer ratio inmost comparisons and cross-sectional area at rostral/caudal levels. Rostral T2*WI WM/GM showed the strongest correlations with focalmotor (�0.45) and sensory (�0.49) deficits and was the strongest independent predictor of the modified Japanese Orthopedic Associationscore (P � .01) and diagnosis (P � .02) in multivariate models (R2 � 0.59, P � 8 � 10�13; area under the curve � 0.954, respectively).
CONCLUSIONS: T2*WI WM/GM shows promise as a novel biomarker of WM injury. It detects damage in compressed and uncom-pressed regions and contributes substantially to multivariate models for diagnosis and correlation with impairment. Our multipa-rametric approach overcomes limitations of individual measures, having the potential to improve diagnostics, monitor progression,and predict outcomes.
ABBREVIATIONS: AUC � area under the curve; CSA � cross-sectional area; DCM � degenerative cervical myelopathy; FA � fractional anisotropy; MCL �maximally compressed level; mJOA � modified Japanese Orthopedic Association; MT � magnetization transfer; MTR � magnetization transfer ratio; qMRI �quantitative MRI; SC � spinal cord; SCI � spinal cord injury; UE � upper extremity
Quantitative MR imaging (qMRI) techniques have the poten-
tial to provide in vivo measurement of specific tissue prop-
erties, including characterizing aspects of spinal cord (SC) micro-
structure and tissue injury.1,2 However, efforts to apply qMRI in
clinical studies have thus far achieved only modest success.3 The
strongest results include cross-sectional area (CSA) as a measure
of spinal cord atrophy, the DTI metric fractional anisotropy (FA)
to evaluate axonal integrity, and the magnetization transfer ratio
(MTR) as a measure of demyelination.3 Spinal cord CSA has
shown moderate-to-strong correlation with disability in MS4-6
but is a nonspecific measure of tissue injury and shows high in-
tersubject variability in healthy subjects,7,8 somewhat limiting itsReceived October 20, 2016; accepted after revision January 29, 2017.
From the Division of Neurosurgery, Department of Surgery (A.R.M., D.W.C., S.K.-R.,L.T., A.N., H.G., M.G.F.), and Department of Medical Imaging (A.C., D.J.M.), Universityof Toronto and the University Health Network, Toronto, Ontario, Canada; Poly-technique Montreal (B.D.L., J.C.-A.), Montreal, Quebec, Canada; Functional Neuro-imaging Unit (J.C.-A.), Centre de recherche de l’Institut universitaire de geriatrie deMontreal, Universite de Montreal, Montreal, Quebec, Canada; and University ofGroningen (S.F.L.), Groningen, the Netherlands.
Please address correspondence to Michael G. Fehlings, MD, SCI-CRU, 11th Floor,Toronto Western Hospital, 399 Bathurst St, Toronto, M5T 2S8, ON, Canada; e-mail:[email protected], [email protected]; @DrFehlings
Indicates open access to non-subscribers at www.ajnr.org
http://dx.doi.org/10.3174/ajnr.A5162
1266 Martin Jun 2017 www.ajnr.org
utility. FA has demonstrated moderate correlation with global
and focal disability in dozens of studies involving various pathol-
ogies3,9-14 but has yet to achieve clinical uptake due to a lack of
standardized/portable acquisition methods and cumbersome
analysis techniques. MTR has also shown correlation with impair-
ment in MS and spinal cord injury (SCI) studies,15-17 but results
have been inconsistent, in part due to T1 and frequency offset
dependencies, and thus insufficient to drive clinical adoption.3
At 3T or higher field strengths, T2*-weighted imaging of the
SC provides high resolution and strong contrast between GM and
WM, allowing segmentation between these structures and calcu-
lation of their CSA.18 It has also been established that T2*WI
shows hyperintensity in injured SC WM in various pathologic
conditions.19,20 We hypothesized that T2*WI hyperintensity is a
general phenomenon in WM injury, leading to decreased gray-
white contrast that can be quantified by normalizing the WM
signal intensity within each axial section by that of the GM as a
T2*WI WM/GM signal-intensity ratio. Our investigation in 40
healthy subjects established that T2*WI WM/GM has lower
intersubject variability compared with CSA, FA, and MTR and
superior reliability compared with FA and MTR,7 though the
latter metrics showed acceptable results, in keeping with prior
reports.11,21-25
These encouraging findings prompted the current study in
degenerative cervical myelopathy (DCM), a common condition
involving degeneration of the discs, ligaments, and vertebrae, re-
sulting in cervical spinal cord compression and functional im-
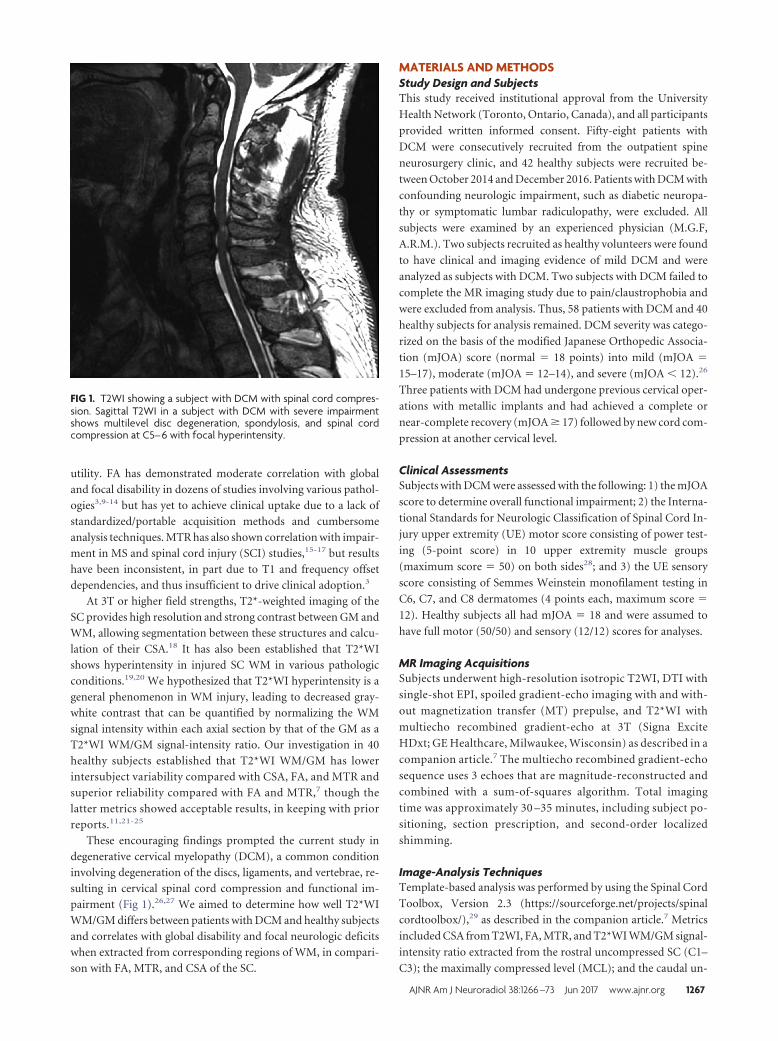
pairment (Fig 1).26,27 We aimed to determine how well T2*WI
WM/GM differs between patients with DCM and healthy subjects
and correlates with global disability and focal neurologic deficits
when extracted from corresponding regions of WM, in compari-
son with FA, MTR, and CSA of the SC.
MATERIALS AND METHODSStudy Design and SubjectsThis study received institutional approval from the University
Health Network (Toronto, Ontario, Canada), and all participants
provided written informed consent. Fifty-eight patients with
DCM were consecutively recruited from the outpatient spine
neurosurgery clinic, and 42 healthy subjects were recruited be-
tween October 2014 and December 2016. Patients with DCM with
confounding neurologic impairment, such as diabetic neuropa-
thy or symptomatic lumbar radiculopathy, were excluded. All
subjects were examined by an experienced physician (M.G.F,
A.R.M.). Two subjects recruited as healthy volunteers were found
to have clinical and imaging evidence of mild DCM and were
analyzed as subjects with DCM. Two subjects with DCM failed to
complete the MR imaging study due to pain/claustrophobia and
were excluded from analysis. Thus, 58 patients with DCM and 40
healthy subjects for analysis remained. DCM severity was catego-
rized on the basis of the modified Japanese Orthopedic Associa-
tion (mJOA) score (normal � 18 points) into mild (mJOA �
15–17), moderate (mJOA � 12–14), and severe (mJOA � 12).26
Three patients with DCM had undergone previous cervical oper-
ations with metallic implants and had achieved a complete or
near-complete recovery (mJOA � 17) followed by new cord com-
pression at another cervical level.
Clinical AssessmentsSubjects with DCM were assessed with the following: 1) the mJOA
score to determine overall functional impairment; 2) the Interna-
tional Standards for Neurologic Classification of Spinal Cord In-
jury upper extremity (UE) motor score consisting of power test-
ing (5-point score) in 10 upper extremity muscle groups
(maximum score � 50) on both sides28; and 3) the UE sensory
score consisting of Semmes Weinstein monofilament testing in
C6, C7, and C8 dermatomes (4 points each, maximum score �
12). Healthy subjects all had mJOA � 18 and were assumed to
have full motor (50/50) and sensory (12/12) scores for analyses.
MR Imaging AcquisitionsSubjects underwent high-resolution isotropic T2WI, DTI with
single-shot EPI, spoiled gradient-echo imaging with and with-
out magnetization transfer (MT) prepulse, and T2*WI with
multiecho recombined gradient-echo at 3T (Signa Excite
HDxt; GE Healthcare, Milwaukee, Wisconsin) as described in a
companion article.7 The multiecho recombined gradient-echo
sequence uses 3 echoes that are magnitude-reconstructed and
combined with a sum-of-squares algorithm. Total imaging
time was approximately 30 –35 minutes, including subject po-
sitioning, section prescription, and second-order localized
shimming.
Image-Analysis TechniquesTemplate-based analysis was performed by using the Spinal Cord
Toolbox, Version 2.3 (https://sourceforge.net/projects/spinal
cordtoolbox/),29 as described in the companion article.7 Metrics
included CSA from T2WI, FA, MTR, and T2*WI WM/GM signal-
intensity ratio extracted from the rostral uncompressed SC (C1–
C3); the maximally compressed level (MCL); and the caudal un-
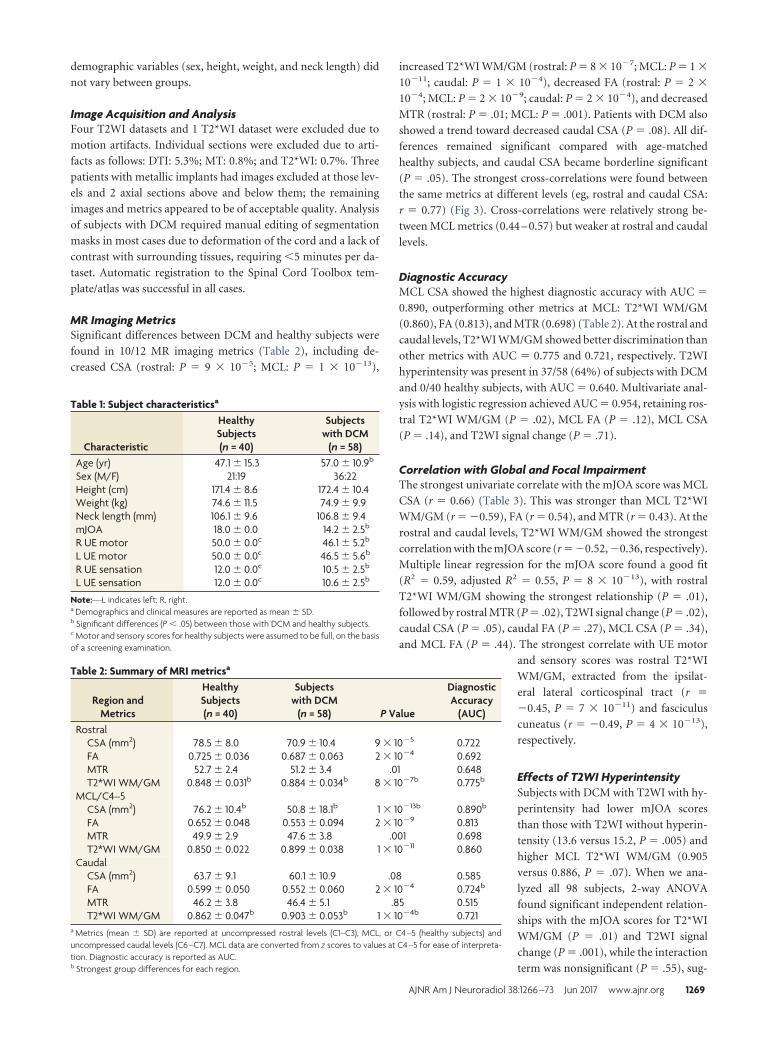
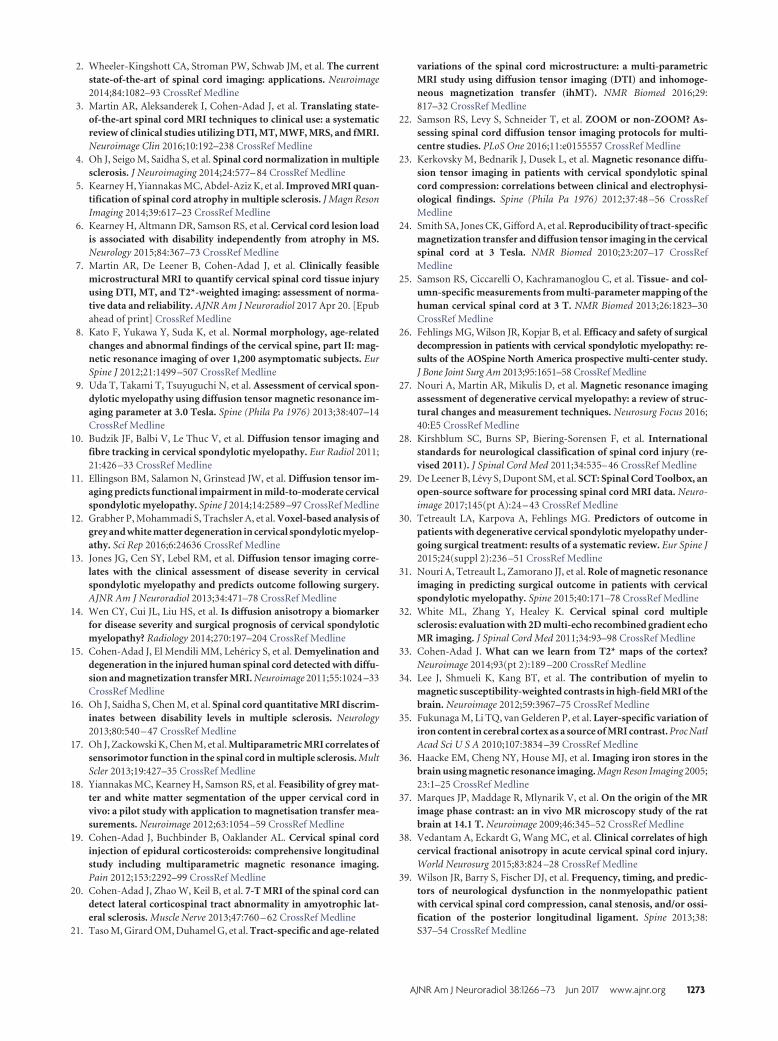
FIG 1. T2WI showing a subject with DCM with spinal cord compres-sion. Sagittal T2WI in a subject with DCM with severe impairmentshows multilevel disc degeneration, spondylosis, and spinal cordcompression at C5– 6 with focal hyperintensity.
AJNR Am J Neuroradiol 38:1266 –73 Jun 2017 www.ajnr.org 1267
compressed cord (C6 –C7). For MCL metrics, CSA was extracted
from a single section, whereas FA, MTR, and T2*WI WM/GM
were averaged over 3 sections centered at the compressed level. In
subjects with motion artifacts on the T2WI, T2*WI was used to
calculate the CSA with correction for the oblique angle. For FA,
MTR, and T2*WI, ROIs included total WM, GM (T2*WI only),
and the left/right fasciculus cuneatus and lateral corticospinal
tract (Fig 2). Sagittal and reformatted axial T2WI were visually
assessed for SC hyperintensity by 2 raters (A.R.M., A.N.), with
disagreements resolved by discussion.
Statistical AnalysisStatistical analysis was performed with R statistical and comput-
ing software, Version 3.3 (http://www.r-project.org). Metrics are
reported as mean � SD. Comparisons between characteristics of
healthy subjects and those with DCM were made by using 2-
sample t tests and �2 tests. MR imaging metrics were normalized
to correct for confounding relationships
according to the following linear equa-
tions, developed from data in 40 healthy
subjects7:
1) CSAcorrected � CSAraw � 5.3690
� (Cervical Cord Length � 10.6),
2) FAcorrected � FAraw � 0.0012053
� (Age � 47.1),
3) MTRcorrected � MTRraw � 0.17410
� (Height � 171.6) � 0.074131
� (Age � 47.1).
In Equation 1, CSA is in square mil-
limeters and cervical cord length is in
centimeters; in Equation 2, age is in
years; and in Equation 3, MTR is ex-
pressed as a percentage, height is in cen-
timeters, and age is in years. Metrics
were then converted to z scores to nor-
malize across rostrocaudal levels (eg, for
comparisons at the MCL). Comparisons
of normalized MR imaging metrics be-
tween DCM and healthy subjects were
made by using Welch t tests. These tests
were also repeated against an age-
matched group (by excluding healthy
subjects younger than 40 years of age) to
confirm the findings. Diagnostic accu-
racy was assessed with the area under the
curve (AUC) and logistic regression,
with backward stepwise variable selec-
tion. Relationships between normalized
MR imaging metrics and clinical mea-
sures were assessed by using Pearson
correlation coefficients and backward
stepwise multiple linear regression. CSA
of the SC and other metrics extracted
from the total WM were analyzed against the mJOA score, while
metrics from each lateral corticospinal tract and fasciculus cunea-
tus were analyzed against ipsilateral UE motor and sensory scores,
respectively. Two-way ANOVA with an interaction term was used
to assess how T2*WI WM/GM and T2WI hyperintensity relate to
the mJOA score. Results were considered statistically significant at
P � .05, due to the exploratory nature of this study.
RESULTSSubject CharacteristicsSubjects with DCM showed the following distribution of severity:
33 mild, 15 moderate, and 10 severe. Age differed significantly
between healthy subjects and those with DCM (mean, 47.1 � 15.3
versus 57.0 � 10.9 years, P � 3 � 10�4; Table 1). When healthy
subjects younger than 40 years of age were excluded, age became
equivalent (n � 26; mean age, 56.3 � 9.8 years, P � .76). Other
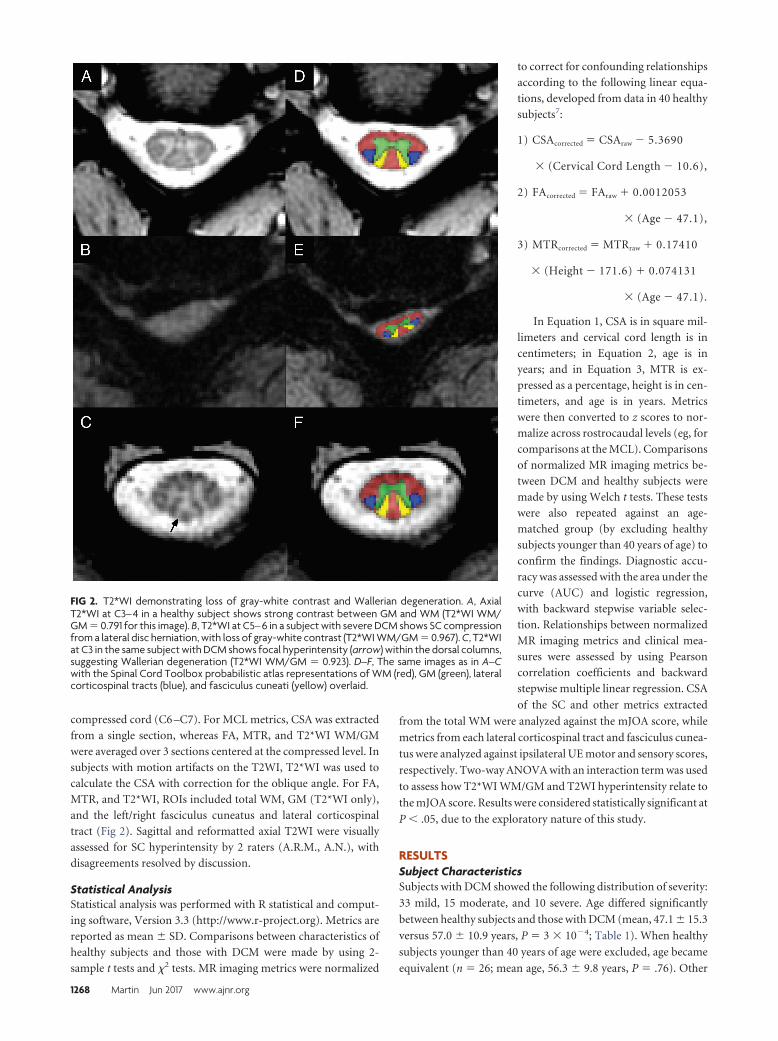
FIG 2. T2*WI demonstrating loss of gray-white contrast and Wallerian degeneration. A, AxialT2*WI at C3– 4 in a healthy subject shows strong contrast between GM and WM (T2*WI WM/GM � 0.791 for this image). B, T2*WI at C5– 6 in a subject with severe DCM shows SC compressionfrom a lateral disc herniation, with loss of gray-white contrast (T2*WI WM/GM � 0.967). C, T2*WIat C3 in the same subject with DCM shows focal hyperintensity (arrow) within the dorsal columns,suggesting Wallerian degeneration (T2*WI WM/GM � 0.923). D–F, The same images as in A–Cwith the Spinal Cord Toolbox probabilistic atlas representations of WM (red), GM (green), lateralcorticospinal tracts (blue), and fasciculus cuneati (yellow) overlaid.
1268 Martin Jun 2017 www.ajnr.org
demographic variables (sex, height, weight, and neck length) did
not vary between groups.
Image Acquisition and AnalysisFour T2WI datasets and 1 T2*WI dataset were excluded due to
motion artifacts. Individual sections were excluded due to arti-
facts as follows: DTI: 5.3%; MT: 0.8%; and T2*WI: 0.7%. Three
patients with metallic implants had images excluded at those lev-
els and 2 axial sections above and below them; the remaining
images and metrics appeared to be of acceptable quality. Analysis
of subjects with DCM required manual editing of segmentation
masks in most cases due to deformation of the cord and a lack of
contrast with surrounding tissues, requiring �5 minutes per da-
taset. Automatic registration to the Spinal Cord Toolbox tem-
plate/atlas was successful in all cases.
MR Imaging MetricsSignificant differences between DCM and healthy subjects were
found in 10/12 MR imaging metrics (Table 2), including de-
creased CSA (rostral: P � 9 � 10�5; MCL: P � 1 � 10�13),
increased T2*WI WM/GM (rostral: P � 8 � 10�7; MCL: P � 1 �
10�11; caudal: P � 1 � 10�4), decreased FA (rostral: P � 2 �
10�4; MCL: P � 2 � 10�9; caudal: P � 2 � 10�4), and decreased
MTR (rostral: P � .01; MCL: P � .001). Patients with DCM also
showed a trend toward decreased caudal CSA (P � .08). All dif-
ferences remained significant compared with age-matched
healthy subjects, and caudal CSA became borderline significant
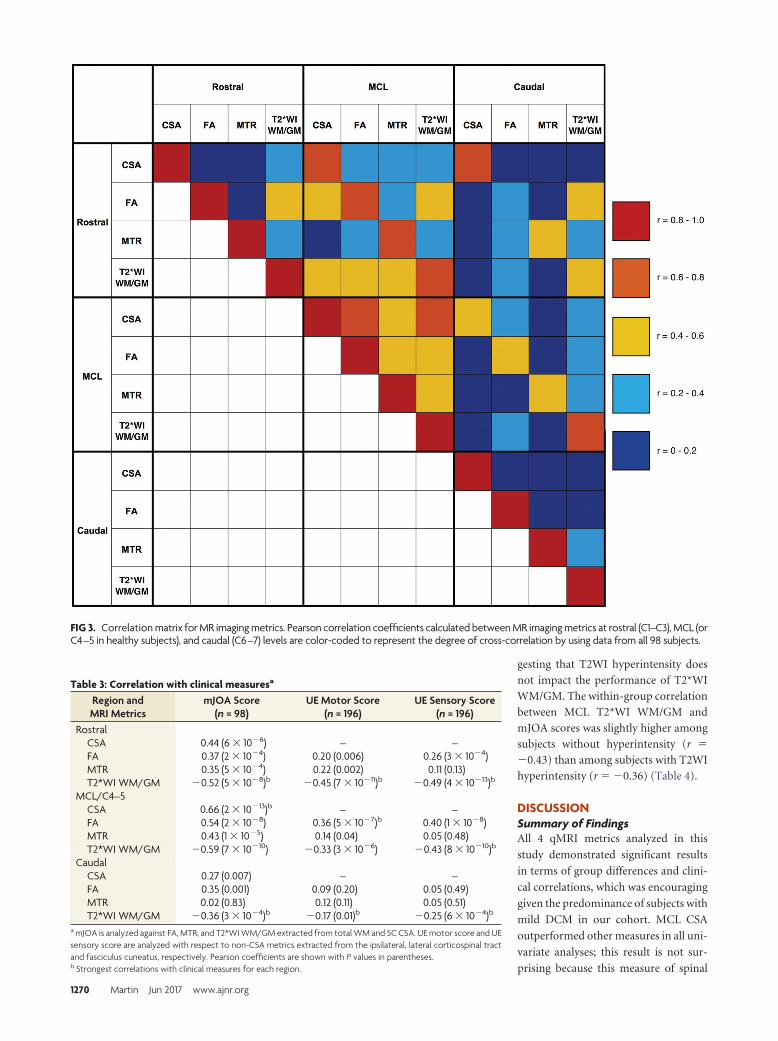
(P � .05). The strongest cross-correlations were found between
the same metrics at different levels (eg, rostral and caudal CSA:
r � 0.77) (Fig 3). Cross-correlations were relatively strong be-
tween MCL metrics (0.44 – 0.57) but weaker at rostral and caudal
levels.
Diagnostic AccuracyMCL CSA showed the highest diagnostic accuracy with AUC �
0.890, outperforming other metrics at MCL: T2*WI WM/GM
(0.860), FA (0.813), and MTR (0.698) (Table 2). At the rostral and
caudal levels, T2*WI WM/GM showed better discrimination than
other metrics with AUC � 0.775 and 0.721, respectively. T2WI
hyperintensity was present in 37/58 (64%) of subjects with DCM
and 0/40 healthy subjects, with AUC � 0.640. Multivariate anal-
ysis with logistic regression achieved AUC � 0.954, retaining ros-
tral T2*WI WM/GM (P � .02), MCL FA (P � .12), MCL CSA
(P � .14), and T2WI signal change (P � .71).
Correlation with Global and Focal ImpairmentThe strongest univariate correlate with the mJOA score was MCL
CSA (r � 0.66) (Table 3). This was stronger than MCL T2*WI
WM/GM (r � �0.59), FA (r � 0.54), and MTR (r � 0.43). At the
rostral and caudal levels, T2*WI WM/GM showed the strongest
correlation with the mJOA score (r � �0.52, �0.36, respectively).
Multiple linear regression for the mJOA score found a good fit
(R2 � 0.59, adjusted R2 � 0.55, P � 8 � 10�13), with rostral
T2*WI WM/GM showing the strongest relationship (P � .01),
followed by rostral MTR (P � .02), T2WI signal change (P � .02),
caudal CSA (P � .05), caudal FA (P � .27), MCL CSA (P � .34),
and MCL FA (P � .44). The strongest correlate with UE motor
and sensory scores was rostral T2*WI
WM/GM, extracted from the ipsilat-
eral lateral corticospinal tract (r �
�0.45, P � 7 � 10�11) and fasciculus
cuneatus (r � �0.49, P � 4 � 10�13),
respectively.
Effects of T2WI HyperintensitySubjects with DCM with T2WI with hy-
perintensity had lower mJOA scores
than those with T2WI without hyperin-
tensity (13.6 versus 15.2, P � .005) and
higher MCL T2*WI WM/GM (0.905
versus 0.886, P � .07). When we ana-
lyzed all 98 subjects, 2-way ANOVA
found significant independent relation-
ships with the mJOA scores for T2*WI
WM/GM (P � .01) and T2WI signal
change (P � .001), while the interaction
term was nonsignificant (P � .55), sug-
Table 1: Subject characteristicsa
Characteristic
HealthySubjects(n = 40)
Subjectswith DCM
(n = 58)Age (yr) 47.1 � 15.3 57.0 � 10.9b
Sex (M/F) 21:19 36:22Height (cm) 171.4 � 8.6 172.4 � 10.4Weight (kg) 74.6 � 11.5 74.9 � 9.9Neck length (mm) 106.1 � 9.6 106.8 � 9.4mJOA 18.0 � 0.0 14.2 � 2.5b
R UE motor 50.0 � 0.0c 46.1 � 5.2b
L UE motor 50.0 � 0.0c 46.5 � 5.6b
R UE sensation 12.0 � 0.0c 10.5 � 2.5b
L UE sensation 12.0 � 0.0c 10.6 � 2.5b
Note:—L indicates left; R, right.a Demographics and clinical measures are reported as mean � SD.b Significant differences (P � .05) between those with DCM and healthy subjects.c Motor and sensory scores for healthy subjects were assumed to be full, on the basisof a screening examination.
Table 2: Summary of MRI metricsa
Region andMetrics
HealthySubjects(n = 40)
Subjectswith DCM
(n = 58) P Value
DiagnosticAccuracy
(AUC)Rostral
CSA (mm2) 78.5 � 8.0 70.9 � 10.4 9 � 10�5 0.722FA 0.725 � 0.036 0.687 � 0.063 2 � 10�4 0.692MTR 52.7 � 2.4 51.2 � 3.4 .01 0.648T2*WI WM/GM 0.848 � 0.031b 0.884 � 0.034b 8 � 10�7b 0.775b
MCL/C4–5CSA (mm2) 76.2 � 10.4b 50.8 � 18.1b 1 � 10�13b 0.890b
FA 0.652 � 0.048 0.553 � 0.094 2 � 10�9 0.813MTR 49.9 � 2.9 47.6 � 3.8 .001 0.698T2*WI WM/GM 0.850 � 0.022 0.899 � 0.038 1 � 10�11 0.860
CaudalCSA (mm2) 63.7 � 9.1 60.1 � 10.9 .08 0.585FA 0.599 � 0.050 0.552 � 0.060 2 � 10�4 0.724b
MTR 46.2 � 3.8 46.4 � 5.1 .85 0.515T2*WI WM/GM 0.862 � 0.047b 0.903 � 0.053b 1 � 10�4b 0.721
a Metrics (mean � SD) are reported at uncompressed rostral levels (C1–C3), MCL, or C4 –5 (healthy subjects) anduncompressed caudal levels (C6 –C7). MCL data are converted from z scores to values at C4 –5 for ease of interpreta-tion. Diagnostic accuracy is reported as AUC.b Strongest group differences for each region.
AJNR Am J Neuroradiol 38:1266 –73 Jun 2017 www.ajnr.org 1269
gesting that T2WI hyperintensity does
not impact the performance of T2*WI
WM/GM. The within-group correlation
between MCL T2*WI WM/GM and
mJOA scores was slightly higher among
subjects without hyperintensity (r �
�0.43) than among subjects with T2WI
hyperintensity (r � �0.36) (Table 4).
DISCUSSIONSummary of FindingsAll 4 qMRI metrics analyzed in this
study demonstrated significant results
in terms of group differences and clini-
cal correlations, which was encouraging
given the predominance of subjects with
mild DCM in our cohort. MCL CSA
outperformed other measures in all uni-
variate analyses; this result is not sur-
prising because this measure of spinal
FIG 3. Correlation matrix for MR imaging metrics. Pearson correlation coefficients calculated between MR imaging metrics at rostral (C1–C3), MCL (orC4–5 in healthy subjects), and caudal (C6–7) levels are color-coded to represent the degree of cross-correlation by using data from all 98 subjects.
Table 3: Correlation with clinical measuresa
Region andMRI Metrics
mJOA Score(n = 98)
UE Motor Score(n = 196)
UE Sensory Score(n = 196)
RostralCSA 0.44 (6 � 10�6) – –FA 0.37 (2 � 10�4) 0.20 (0.006) 0.26 (3 � 10�4)MTR 0.35 (5 � 10�4) 0.22 (0.002) 0.11 (0.13)T2*WI WM/GM �0.52 (5 � 10�8)b �0.45 (7 � 10�11)b �0.49 (4 � 10�13)b
MCL/C4–5CSA 0.66 (2 � 10�13)b – –FA 0.54 (2 � 10�8) 0.36 (5 � 10�7)b 0.40 (1 � 10�8)MTR 0.43 (1 � 10�5) 0.14 (0.04) 0.05 (0.48)T2*WI WM/GM �0.59 (7 � 10�10) �0.33 (3 � 10�6) �0.43 (8 � 10�10)b
CaudalCSA 0.27 (0.007) – –FA 0.35 (0.001) 0.09 (0.20) 0.05 (0.49)MTR 0.02 (0.83) 0.12 (0.11) 0.05 (0.51)T2*WI WM/GM �0.36 (3 � 10�4)b �0.17 (0.01)b �0.25 (6 � 10�4)b
a mJOA is analyzed against FA, MTR, and T2*WI WM/GM extracted from total WM and SC CSA. UE motor score and UEsensory score are analyzed with respect to non-CSA metrics extracted from the ipsilateral, lateral corticospinal tractand fasciculus cuneatus, respectively. Pearson coefficients are shown with P values in parentheses.b Strongest correlations with clinical measures for each region.
1270 Martin Jun 2017 www.ajnr.org
cord compression reflects the primary mechanism of tissue in-
jury in DCM. Cord compression causes ischemia that often
represents partially reversible neurologic impairment,30
whereas atrophy of the SC (rostral or caudal compression)
suggests axonal loss or demyelination, which is more likely to
be permanent.12 MCL CSA has been previously demonstrated
to correlate well with severity in DCM,31 and atrophy measure-
ment has also proved useful in DCM12 and MS.4-6 However,
MCL CSA does not account for motion-related dynamic in-
jury, which is also believed to be an important mechanism of
tissue injury in DCM,31 suggesting that this metric may be
better used in conjunction with other measures that directly
interrogate microstructural changes. FA showed strong group
differences and moderate correlations with impairment, but
diagnostic accuracy was modest. These findings are all consis-
tent with those in the previous literature.3,9-14 MTR results
were relatively weak, which is consistent with findings in prior
studies in MS,16,17 but differ from results seen in chronic
SCI.15
We are not aware of published reports using MTR in patients
with DCM. The T2*WI WM/GM signal ratio showed the stron-
gest results at the rostral and caudal levels, and rostral T2*WI
WM/GM was the strongest independent variable in multivariate
models for diagnosis and correlation with the mJOA score.
T2*WI WM/GM also demonstrated superior performance over
FA and MTR in almost every comparison. The encouraging find-
ings for T2*WI WM/GM indicate that this novel biomarker is a
relatively accurate measure of WM injury, with particularly
strong results in multivariate models. T2*WI WM/GM also shows
better reliability, compared with FA and MTR, with our tech-
niques.7 In comparison with DTI and MT techniques, T2*WI had
fewer excluded sections, required less imaging time, and involved
less postprocessing, suggesting that this biomarker is well-suited
for clinical use.
Unfortunately, all qMRI metrics failed to show diagnostic ac-
curacy (AUC) of �90% and provided only moderate clinical cor-
relations, indicating somewhat limited utility when used individ-
ually. However, our protocol produced 10 measures of tissue
injury that are relatively independent, enabling multivariate use
to strengthen their accuracy. This was evident in the logistic re-
gression model that achieved �95% diagnostic accuracy, and the
linear regression model for the mJOA score that had much higher
adjusted R2 than univariate measures. Overall, our results dem-
onstrate that T2*WI WM/GM performs well in comparison with
established biomarkers, and our multiparametric approach has
the potential to overcome the limitations of individual qMRI
measures.
T2*WI WM/GM: A Novel Biomarkerof WM InjuryT2*WI is available from all major MRimaging vendors, including the GEHealthcare multiecho recombined gra-dient-echo, Siemens multiecho data im-age combination, Philips Healthcaremultiecho fast-field gradient echo, andHitachi ADAGE (Additive ArrangementGradient Echo) sequences, though dif-
ferences may exist between implementations, and cross-vendorvalidation is needed.32 Our investigation of the T2*WI WM/GM
signal intensity ratio follows from previous findings that T2*WI
detects WM injury by exhibiting hyperintensity. In one study, a
pattern consistent with Wallerian degeneration of the fasciculus
gracilis could be visualized rostrally following a cervical SC needle
injury.19 Another study found hyperintensity in the bilateral lat-
eral corticospinal tracts in a patient with amyotrophic lateral scle-
rosis, related to the degeneration of descending upper motor neu-
rons.20 In our data, a small number of subjects with DCM also
exhibited focal T2*WI hyperintensity of the dorsal columns ex-
tending through all images rostral to compression, consistent
with Wallerian degeneration (Fig 2). However, most patients with
DCM showed only loss of gray-white contrast, which is somewhat
akin to the diagnosis of acute ischemic stroke on brain CT. How-
ever, T2*WI signal intensity is a relative value that varies consid-
erably between subjects, requiring normalization. Although GM
may also experience injury in DCM, we found that using GM
signal intensity as a reference produced more consistent results
than CSF due to variable CSF signal (A.R.M. et al, unpublished
data, 2017). Furthermore, T2*WI WM/GM appears to be stable in
the context of T2WI hyperintensity; this feature is commonly en-
countered in DCM, showing no significant interaction (effect
modification) and minimal impact on clinical correlations.
The calculation of the WM/GM signal-intensity ratio is easily
and accurately performed by using automated template-based
analysis.29 The pathophysiologic processes that underlie T2*WI
hyperintensity include demyelination, gliosis, increased calcium
concentration, and nonheme iron stored in ferritin, but signal
intensity also depends on water content and local concentration
of deoxyhemoglobin (used in blood oxygen level– dependent
fMRI).33-37 Thus, T2*WI WM/GM is somewhat nonspecific, re-
flecting several microstructural features. The moderate cross-
correlations observed between T2*WI WM/GM and other met-
rics did not reveal a clear pattern because these findings may
simply be explained by multiple pathologic processes occurring
simultaneously. Histopathologic studies are necessary to fully un-
derstand exactly what SC microstructural changes are detected by
T2*WI WM/GM compared with other measures, and further re-
search is needed to determine its performance in other patholo-
gies. However, its simplicity, sensitivity, and excellent reliability
suggest that it could be a very useful imaging biomarker.
ROIsThe strongest results for each metric were found at the MCL in
this study, with the exception of rostral T2*WI WM/GM for mul-
tivariate analyses and tract-specific correlations. This finding
highlights a major challenge to using quantitative MR imaging in
Table 4: Analysis of T2*WI WM/GM and T2WI signal changea
Measure T2WI− (n = 61) T2WI+ (n = 37) P ValuemJOA 17.0 � 1.6 13.6 � 2.8 7 � 10�9
MCL T2*WI WM/GM 0.862 � 0.033 0.905 � 0.037 2 � 10�7
MCL T2*WI WM/GM � mJOA �0.43 (9 � 10�4) �0.36 (0.03)a The entire cohort (including subjects with DCM and healthy subjects) is divided into subjects with and without T2WIhyperintensity, denoted T2WI and T2WI�, respectively. Mean � SD are reported. T2*WI WM/GM is extracted fromthe MCL (subjects with DCM) or C4 –5 (healthy subjects), and Pearson correlation coefficients between mJOA andT2*WI WM/GM within each signal change group are shown (P values in parentheses).
AJNR Am J Neuroradiol 38:1266 –73 Jun 2017 www.ajnr.org 1271
DCM because the compressed region has potential bias related to
distorted anatomy (leading to inaccurate registration to the tem-
plate) and increased susceptibility artifacts. This challenge was
partially mitigated by averaging MCL metrics over 3 sections, with
sections above and below MCL often showing no compression.
However, results from our reliability study showed a trend toward
diminished reliability for FA, MTR, and T2*WI WM/GM at the
MCL.7 It was encouraging to also find strong results rostrally for
T2*WI WM/GM, which has been previously reported for FA.14,38
This finding has important clinical implications because this re-
gion avoids the aforementioned issues and can be used for post-
operative assessment rostral to metallic implants in most patients
with DCM. This region is also potentially useful for the prediction
of outcomes in acute SCI, with a postoperative scan in the days to
weeks following early surgical decompression.38 The caudal re-
gion consistently showed the weakest results, likely due to respi-
ratory motion, susceptibility artifacts from the lungs, and in-
creased partial volume effects due to the angle between sections
and the SC (in subjects with irreducible cervical lordosis). Despite
these issues, T2*WI WM/GM and FA showed some utility in this
region. Metrics extracted from individual WM tracts showed sig-
nificant correlations with focal neurologic deficits, particularly at
the rostral and MCL levels, indicating that our quantitative anal-
ysis identifies focal tissue injury. However, correlations with mo-
tor/sensory scores were modest, potentially because of the small
number of voxels included in metric calculations but also because
clinical impairment can also result from GM injury, nerve root
compression (radiculopathy), and pain.
Future Directions: Clinical Translation of QuantitativeSpinal Cord MR ImagingAt present, SC qMRI has yet to achieve clinical adoption due to
challenges with the portability of acquisitions, cumbersome anal-
ysis, and modest results in diagnostic accuracy and clinical corre-
lations. However, our multiparametric approach with simple
methods and automated analysis is designed to address each of
these issues and be suitable for clinical use. We anticipate that the
first clinical application of these techniques could be the develop-
ment of more sensitive diagnostic tools. A diagnostic tool that can
directly detect tissue injury could have a major impact in DCM, in
which patients sometimes show minimal symptoms that cannot
be definitely attributed to the SC by clinical and electrophysiolog-
ical examinations. Furthermore, many older individuals have spi-
nal cord compression without neurologic dysfunction,39 indicat-
ing that anatomic imaging alone is insufficient. Our approach
may also prove useful for monitoring patients with DCM for pro-
gression of tissue injury by using serial qMRI examinations. Pa-
tients with mild DCM are often managed nonoperatively with
periodic clinical assessments, but symptoms are highly subjective
and mechanisms of behavioral adaptation and neuroplasticity
may mask subtle deterioration. Finally, effort has been made to
predict outcomes by using qMRI in DCM and other clinical pop-
ulations,3,14 but this effort has yet to show great success, possibly
because outcomes depend on factors that extend beyond the cur-
rent state of tissue injury. However, if qMRI techniques can dif-
ferentiate between reversible and permanent injury by quantify-
ing specific microstructural changes (eg, demyelination versus
axonal loss), enhanced outcome prediction may also be possible.
Future studies should be directed at investigating each of these
exciting potential applications.
LimitationsClinical assessments used in this study are somewhat coarse
(mJOA score, sensory score) and subjective (mJOA score, motor
score), potentially limiting the strength of correlations. T1-
weighted imaging was not performed in this study, and the effect
of T1WI hypointensity on T2*WI WM/GM has not been charac-
terized. We aimed to minimize bias by using automated analysis,
but almost all DCM datasets required manual correction of seg-
mentation. Other DTI metrics were not analyzed due to an a
priori decision to focus on FA, due to its consistent results in
previous studies.3 The validity of MR imaging metrics for 3 pa-
tients with metallic implants is unknown, but quantitative results
distant from the hardware appeared to be consistent with those in
other subjects.
CONCLUSIONST2*WI WM/GM is a novel biomarker of SC WM degeneration
that shows good diagnostic accuracy and correlation with clinical
features of DCM, warranting further investigation. This bio-
marker has strong potential for clinical translation, particularly in
multivariate approaches that combine quantitative measures of
SC injury. Such measures have the potential to provide more sen-
sitive diagnosis of mild cord injury, monitoring of disease pro-
gression or recovery, and prediction of outcomes in DCM and
other spinal pathologies.
ACKNOWLEDGMENTSThis research received funding support from Rick Hansen Insti-
tute, as part of the Riluzole in Spinal Cord Injury Study (RISCIS),
which is also supported by AOSpine North America, AOSpine
International SCI Knowledge Forum, and the North American
Clinical Trials Network (NACTN) of the Christopher and Dana
Reeve Foundation. This research also received support from the
Dezwirek Foundation, the Sherman Clinical Research Unit, and
the Gerald and Tootsie Halbert Chair in Spinal Cord Research.
Dr. Martin received post-doctoral fellowship support from Cana-
dian Institutes of Health Research. We would also like to thank all
subjects for their participation and acknowledge MRI Technolo-
gists Keith Ta and Eugen Hlasny for their key contributions, and
several students, research coordinators, and administrators that
assisted with this research.
Disclosures: Allan R. Martin—RELATED: Grant: Rick Hansen Institute, AOSpine NorthAmerica, AOSpine International SCI Knowledge Forum, the North American ClinicalTrials Network of the Christopher and Dana Reeve Foundation, the DeZwirek Foun-dation, the Sherman Clinical Research Unit, and the Gerald and Tootsie Halbert Chairin Spinal Cord Research*; Dr. Martin received post-doctoral Fellowship funding fromCanadian Institutes of Health Research (CIHR) that included $50,000 (CDN) annualsalary support and $5,000 annual research allowance that enabled this research.Sukhvinder Kalsi-Ryan—UNRELATED: Consultancy: Neural Outcomes; Royalties:GRASSP, Version 1.0. *Money paid to the institution.
REFERENCES1. Stroman PW, Wheeler-Kingshott C, Bacon M, et al. The current
state-of-the-art of spinal cord imaging: methods. Neuroimage 2014;84:1070 – 81 CrossRef Medline
1272 Martin Jun 2017 www.ajnr.org
2. Wheeler-Kingshott CA, Stroman PW, Schwab JM, et al. The currentstate-of-the-art of spinal cord imaging: applications. Neuroimage2014;84:1082–93 CrossRef Medline
3. Martin AR, Aleksanderek I, Cohen-Adad J, et al. Translating state-of-the-art spinal cord MRI techniques to clinical use: a systematicreview of clinical studies utilizing DTI, MT, MWF, MRS, and fMRI.Neuroimage Clin 2016;10:192–238 CrossRef Medline
4. Oh J, Seigo M, Saidha S, et al. Spinal cord normalization in multiplesclerosis. J Neuroimaging 2014;24:577– 84 CrossRef Medline
5. Kearney H, Yiannakas MC, Abdel-Aziz K, et al. Improved MRI quan-tification of spinal cord atrophy in multiple sclerosis. J Magn ResonImaging 2014;39:617–23 CrossRef Medline
6. Kearney H, Altmann DR, Samson RS, et al. Cervical cord lesion loadis associated with disability independently from atrophy in MS.Neurology 2015;84:367–73 CrossRef Medline
7. Martin AR, De Leener B, Cohen-Adad J, et al. Clinically feasiblemicrostructural MRI to quantify cervical spinal cord tissue injuryusing DTI, MT, and T2*-weighted imaging: assessment of norma-tive data and reliability. AJNR Am J Neuroradiol 2017 Apr 20. [Epubahead of print] CrossRef Medline
8. Kato F, Yukawa Y, Suda K, et al. Normal morphology, age-relatedchanges and abnormal findings of the cervical spine, part II: mag-netic resonance imaging of over 1,200 asymptomatic subjects. EurSpine J 2012;21:1499 –507 CrossRef Medline
9. Uda T, Takami T, Tsuyuguchi N, et al. Assessment of cervical spon-dylotic myelopathy using diffusion tensor magnetic resonance im-aging parameter at 3.0 Tesla. Spine (Phila Pa 1976) 2013;38:407–14CrossRef Medline
10. Budzik JF, Balbi V, Le Thuc V, et al. Diffusion tensor imaging andfibre tracking in cervical spondylotic myelopathy. Eur Radiol 2011;21:426 –33 CrossRef Medline
11. Ellingson BM, Salamon N, Grinstead JW, et al. Diffusion tensor im-aging predicts functional impairment in mild-to-moderate cervicalspondylotic myelopathy. Spine J 2014;14:2589 –97 CrossRef Medline
12. Grabher P, Mohammadi S, Trachsler A, et al. Voxel-based analysis ofgrey and white matter degeneration in cervical spondylotic myelop-athy. Sci Rep 2016;6:24636 CrossRef Medline
13. Jones JG, Cen SY, Lebel RM, et al. Diffusion tensor imaging corre-lates with the clinical assessment of disease severity in cervicalspondylotic myelopathy and predicts outcome following surgery.AJNR Am J Neuroradiol 2013;34:471–78 CrossRef Medline
14. Wen CY, Cui JL, Liu HS, et al. Is diffusion anisotropy a biomarkerfor disease severity and surgical prognosis of cervical spondyloticmyelopathy? Radiology 2014;270:197–204 CrossRef Medline
15. Cohen-Adad J, El Mendili MM, Lehericy S, et al. Demyelination anddegeneration in the injured human spinal cord detected with diffu-sion and magnetization transfer MRI. Neuroimage 2011;55:1024 –33CrossRef Medline
16. Oh J, Saidha S, Chen M, et al. Spinal cord quantitative MRI discrim-inates between disability levels in multiple sclerosis. Neurology2013;80:540 – 47 CrossRef Medline
17. Oh J, Zackowski K, Chen M, et al. Multiparametric MRI correlates ofsensorimotor function in the spinal cord in multiple sclerosis. MultScler 2013;19:427–35 CrossRef Medline
18. Yiannakas MC, Kearney H, Samson RS, et al. Feasibility of grey mat-ter and white matter segmentation of the upper cervical cord invivo: a pilot study with application to magnetisation transfer mea-surements. Neuroimage 2012;63:1054 –59 CrossRef Medline
19. Cohen-Adad J, Buchbinder B, Oaklander AL. Cervical spinal cordinjection of epidural corticosteroids: comprehensive longitudinalstudy including multiparametric magnetic resonance imaging.Pain 2012;153:2292–99 CrossRef Medline
20. Cohen-Adad J, Zhao W, Keil B, et al. 7-T MRI of the spinal cord candetect lateral corticospinal tract abnormality in amyotrophic lat-eral sclerosis. Muscle Nerve 2013;47:760 – 62 CrossRef Medline
21. Taso M, Girard OM, Duhamel G, et al. Tract-specific and age-related
variations of the spinal cord microstructure: a multi-parametricMRI study using diffusion tensor imaging (DTI) and inhomoge-neous magnetization transfer (ihMT). NMR Biomed 2016;29:817–32 CrossRef Medline
22. Samson RS, Levy S, Schneider T, et al. ZOOM or non-ZOOM? As-sessing spinal cord diffusion tensor imaging protocols for multi-centre studies. PLoS One 2016;11:e0155557 CrossRef Medline
23. Kerkovsky M, Bednarik J, Dusek L, et al. Magnetic resonance diffu-sion tensor imaging in patients with cervical spondylotic spinalcord compression: correlations between clinical and electrophysi-ological findings. Spine (Phila Pa 1976) 2012;37:48 –56 CrossRefMedline
24. Smith SA, Jones CK, Gifford A, et al. Reproducibility of tract-specificmagnetization transfer and diffusion tensor imaging in the cervicalspinal cord at 3 Tesla. NMR Biomed 2010;23:207–17 CrossRefMedline
25. Samson RS, Ciccarelli O, Kachramanoglou C, et al. Tissue- and col-umn-specific measurements from multi-parameter mapping of thehuman cervical spinal cord at 3 T. NMR Biomed 2013;26:1823–30CrossRef Medline
26. Fehlings MG, Wilson JR, Kopjar B, et al. Efficacy and safety of surgicaldecompression in patients with cervical spondylotic myelopathy: re-sults of the AOSpine North America prospective multi-center study.J Bone Joint Surg Am 2013;95:1651–58 CrossRef Medline
27. Nouri A, Martin AR, Mikulis D, et al. Magnetic resonance imagingassessment of degenerative cervical myelopathy: a review of struc-tural changes and measurement techniques. Neurosurg Focus 2016;40:E5 CrossRef Medline
28. Kirshblum SC, Burns SP, Biering-Sorensen F, et al. Internationalstandards for neurological classification of spinal cord injury (re-vised 2011). J Spinal Cord Med 2011;34:535– 46 CrossRef Medline
29. De Leener B, Levy S, Dupont SM, et al. SCT: Spinal Cord Toolbox, anopen-source software for processing spinal cord MRI data. Neuro-image 2017;145(pt A):24 – 43 CrossRef Medline
30. Tetreault LA, Karpova A, Fehlings MG. Predictors of outcome inpatients with degenerative cervical spondylotic myelopathy under-going surgical treatment: results of a systematic review. Eur Spine J2015;24(suppl 2):236 –51 CrossRef Medline
31. Nouri A, Tetreault L, Zamorano JJ, et al. Role of magnetic resonanceimaging in predicting surgical outcome in patients with cervicalspondylotic myelopathy. Spine 2015;40:171–78 CrossRef Medline
32. White ML, Zhang Y, Healey K. Cervical spinal cord multiplesclerosis: evaluation with 2D multi-echo recombined gradient echoMR imaging. J Spinal Cord Med 2011;34:93–98 CrossRef Medline
33. Cohen-Adad J. What can we learn from T2* maps of the cortex?Neuroimage 2014;93(pt 2):189 –200 CrossRef Medline
34. Lee J, Shmueli K, Kang BT, et al. The contribution of myelin tomagnetic susceptibility-weighted contrasts in high-field MRI of thebrain. Neuroimage 2012;59:3967–75 CrossRef Medline
35. Fukunaga M, Li TQ, van Gelderen P, et al. Layer-specific variation ofiron content in cerebral cortex as a source of MRI contrast. Proc NatlAcad Sci U S A 2010;107:3834 –39 CrossRef Medline
36. Haacke EM, Cheng NY, House MJ, et al. Imaging iron stores in thebrain using magnetic resonance imaging. Magn Reson Imaging 2005;23:1–25 CrossRef Medline
37. Marques JP, Maddage R, Mlynarik V, et al. On the origin of the MRimage phase contrast: an in vivo MR microscopy study of the ratbrain at 14.1 T. Neuroimage 2009;46:345–52 CrossRef Medline
38. Vedantam A, Eckardt G, Wang MC, et al. Clinical correlates of highcervical fractional anisotropy in acute cervical spinal cord injury.World Neurosurg 2015;83:824 –28 CrossRef Medline
39. Wilson JR, Barry S, Fischer DJ, et al. Frequency, timing, and predic-tors of neurological dysfunction in the nonmyelopathic patientwith cervical spinal cord compression, canal stenosis, and/or ossi-fication of the posterior longitudinal ligament. Spine 2013;38:S37–54 CrossRef Medline
AJNR Am J Neuroradiol 38:1266 –73 Jun 2017 www.ajnr.org 1273


![Motor unit MTR-DCI€¦ · Description MTR-DCI-...IO Description 539616 en 1209d [763197] Motor unit MTR-DCI](https://img.pdfslide.us/doc/110x75/5f50cafd0ff31e4afa1c4f9b/motor-unit-mtr-dci-description-mtr-dci-io-description-539616-en-1209d-763197.jpg)